Article

The Use of Coherence Functions of Acoustic Emission Signals as a Method for Diagnosing Wind Turbine Blades

by
Artur Bejger
1,*,
Jan Bohdan Drzewieniecki
1,*,
Przemysław Bartoszko
1,* and
Ewelina Frank
2
1
Faculty of Marine Engineering, Maritime University of Szczecin, 71-650 Szczecin, Poland
2
Windhunter Academy, Windhunter Group, 75-221 Koszalin, Poland
*
Authors to whom correspondence should be addressed.
Energies 2023, 16(22), 7474; https://doi.org/10.3390/en16227474
Submission received: 27 September 2023 / Revised: 29 October 2023 / Accepted: 3 November 2023 / Published: 7 November 2023

Abstract

:
Acoustic emission (AE) is one of the methods of non-destructive evaluation (NDE), and functions by means of detecting elastic waves caused by dynamic movements in AE sources, such as cracking in various material structures. In the case of offshore wind turbines, the most vulnerable components are their blades. Therefore, the authors proposed a method using AE to diagnose wind turbine blades. In the identification of their condition during monitoring, it was noted that the changes characterising blade damage involve non-linear phenomena; hence, wave phenomena do not occur in the principal components of the amplitudes or their harmonics. When the authors used the inverse transformation in the signal analysis process, which essentially leads to finding a signal measure, it allowed them to distinguish the wave spectrum of an undamaged system from one in which the material structure of the blade was damaged. The characteristic frequencies of individual phenomena interacting with the blade of a working turbine provide the basis for the introduction of filters (or narrowband sensors) that will increase the quality of the diagnosis itself. Considering the above, the use of the coherence function was proposed as an important measure of a diagnostic signal, reflecting a given condition of the blade.

1. Introduction

Causes of damage to rotating components include long-term exposure to a load, i.e., fatigue wear of the material, but also tribological wear, and the formation of position errors, such as misalignment of the mating mechanisms. As for blades, there are additional factors caused by collisions with objects and lightning strikes. Offshore wind turbines are additionally affected by the aggressive marine environment, as well as the irregularity of the wind impacts and resonances generated by wave action.
According to Carrol et al. [1,2], the average failure rate of an offshore wind turbine is 8.3 failures per turbine per year. That includes 6.2 minor repairs (costs below EUR 1000), 1.1 major repairs (EUR 103–104), 0.43 major replacements, and 0.7 failures where no cost data can be categorized. The blades are the fifth biggest contributor to overall failure, with 6.2% (after the pitch and hydraulic system, auxiliary components, generator, and gearbox).
Analysing the most frequent failures of wind turbines, it can be concluded that four main components of a wind turbine account for almost 70% of all of the failures that are significant from an operational point of view (Table 1). At the same time, failures generate downtime, significantly affecting the associated operating costs [3].
References [1,2,4] provide a basis for demonstrating that wind turbine blades are the most vulnerable components, next to the gearbox and the generator. For onshore turbines, the complete replacement of a damaged blade with a new one can cost up to USD 200,000 [4]. The use of a crane involves an additional cost of approximately USD 350,000 per week [4]. The costs associated with repairing or replacing offshore turbine blades are many times higher. Additionally, offshore wind turbines require more complicated and more expensive service to assess the condition or possible repair of the blades.
When analysing the possible means to solve this problem, a review of related publications was carried out. In addition, future trends and challenges related to structural health monitoring systems in wind turbine blades were analysed. For example, Fausto Pedro, García Márquez et al., in their paper [5], overviewed the most important and up-to-date (according to the authors) condition-monitoring techniques based on non-destructive testing applied to wind turbine blades. Next, reference [6] overviews methods related to the investigation of turbine blades by means of vibration measurements, deformation, acoustic emission signals, ultrasonic methods, or thermography. Another study [7] presents an interesting approach to the recognition of external features of blade damage, based, among others, on a statistical method using object detection with Haar features or the AdaBoost algorithm. The importance of the problem related to repairs and the early detection of blade damage is addressed in [4]. It states that relatively minor damage in the form of surface erosion contributes to unplanned repairs or turbine downtime—several times more often than, say, damage to the structure itself. Downtime can be reduced when turbines are periodically diagnosed. Dhanraj and Sugumaran [8] proposed a method based on pattern recognition, which consists of three phases, namely feature extraction, feature selection, and feature classification. They presented statistical features that were extracted from vibration signals; feature selection was performed using a decision tree algorithm and feature classification was performed using a random tree algorithm. These authors propose the use of acoustic emission signals and coherence functions as a method for diagnosing wind turbine blade failures. The diagnostics of a wind turbine blade require inducing a comparable force (or more precisely, stress), generating the formation of elastic waves. Kaewniam et al., in their article [9], provided an overview based on five research areas: signal response, features, sensors, NDT techniques, and testing methods. The research was concerned with the testing of wind turbine blades (WTBs), which are the main components of wind turbines but at the same time are susceptible to different types of damage due to various environmental effects, fatigue loads, etc. Summarizing the studies in the literature review, acoustic emission as a phenomenon is used by many researchers who propose the use and comparison of source signals or classical methods using energy meters or AE events, but a separate descriptor proposed by the authors of this article, the coherence function, has not been used to diagnose blades so far. The method proposed by the authors of this article is included in the chapters Assumptions of the Proposed Diagnostic Method and Results.
Most modern wind turbine blades are made of fibreglass reinforced with polyester or epoxy resin, or polymers reinforced with glass, carbon, aramid, and basalt fibres. Carbon or Kevlar fibre is also used as reinforcement (but this solution is very expensive, especially for larger blades). Designing a blade is an extremely complex task (Figure 1). The blade must have the following characteristics [10]:
  • Sufficient rigidity (so that blades do not collide with the tower in stronger gusts);
  • Low mass, durability (it should last the entire life cycle of the power plant and, therefore, a minimum of 0 years for onshore power plants and 30 years for offshore turbines);
  • Low noise generation (the blade tip shape is vital, as it moves fastest);
  • Resistance to soiling and icing (the blades are designed to withstand any additional weight resulting from these factors or an anti-icing system is added);
  • Shape to ensure adequate aerodynamic properties;
  • Resistance to lightning.
The authors’ analysis, included in the chapter Downtime Case Analysis of Wind Turbines Installed in Poland, also showed that the current time is particularly important due to the fact that many wind turbines have been installed in Europe and have been operating for a long time, so it has become important to determine the conditions of the blades, which may be subject to microcracks or other forms of damage.

2. Materials and Methods

2.1. Downtime Case Analysis of Wind Turbines Installed in Poland

To confirm the significance of the wind turbine blade damage problem, the authors have analysed 38 wind turbines installed in Poland. The examined turbines were of the same type, made by the same manufacturer, and in their 3rd and 4th year of operation. Downtime periods and associated causes were analysed (Table 2). In addition to turbine outages related to damage, those caused by, for example, scheduled periodic maintenance and warranty repairs, but also indirect external factors influencing the outage of the turbine, such as the electricity consumption network, were also included. It is shown here that, despite the relatively short service life of the turbines, blades are still a significant and important component associated with turbine damage.
Notably, the largest number of downtime hours was due to repairs and warranty inspections, as well as periodic inspections required by Polish law (mainly equipment under the supervision of the Office of Technical Inspection) and power grid failures. These factors account for as much as 45% of downtime in the operation of the wind farm under study. From the point of view of the wind farm/plant owner, grid failures are the most problematic, as they shut down the entire wind park. Elimination of such failures is beyond control of the maintenance team. From the point of view of the wind turbine operator, these are failures/shutdowns that are not even remotely predictable. Other troublesome units are the nacelle yaw system and turbine blades.
The top six failures ranking in Table 2, account for 53% of wind turbine downtime. Therefore, the authors proposed an analysis of one of the most important components in terms of service-cost intensity, i.e., turbine blades.
Despite the installation of a lightning protection system in newer wind power plants, lightning-related phenomena cannot be ruled out. When lightning hits an unprotected blade which does not contain any metallic, conducting parts, it can discharge in one of three locations. Energy dissipation can occur on the outside blade surface or in the inner structure of the blade laminations. Lightning hitting the windmill blade usually creates a type of damage that can be described as stitching. This phenomenon is well known and some visual inspection can identify the problem, but there is no chance to help such a situation without a proper protective system. This can cause damage to turbine blades (blade tips are particularly vulnerable here).
An additional blade-related problem is servicing measurements related to the “quality” of the lightning protection system. Service technicians face the practical difficulty of assessing the lightning protection system or fully identifying the technical condition of the lightning protection system. There are no unambiguous and simple methods by which a service technician carrying out a periodic inspection can assess the condition of lightning conductors. In addition, the authors stated in a previous publication [11] that lightning can be one of the causes of stray currents, which in turn can be a major cause of damage to one of the most expensive components in terms of replacement costs, namely turbine gearboxes. As indicated before, lightning might be a cause of significant damage to rotor blades, despite appropriate safeguards.
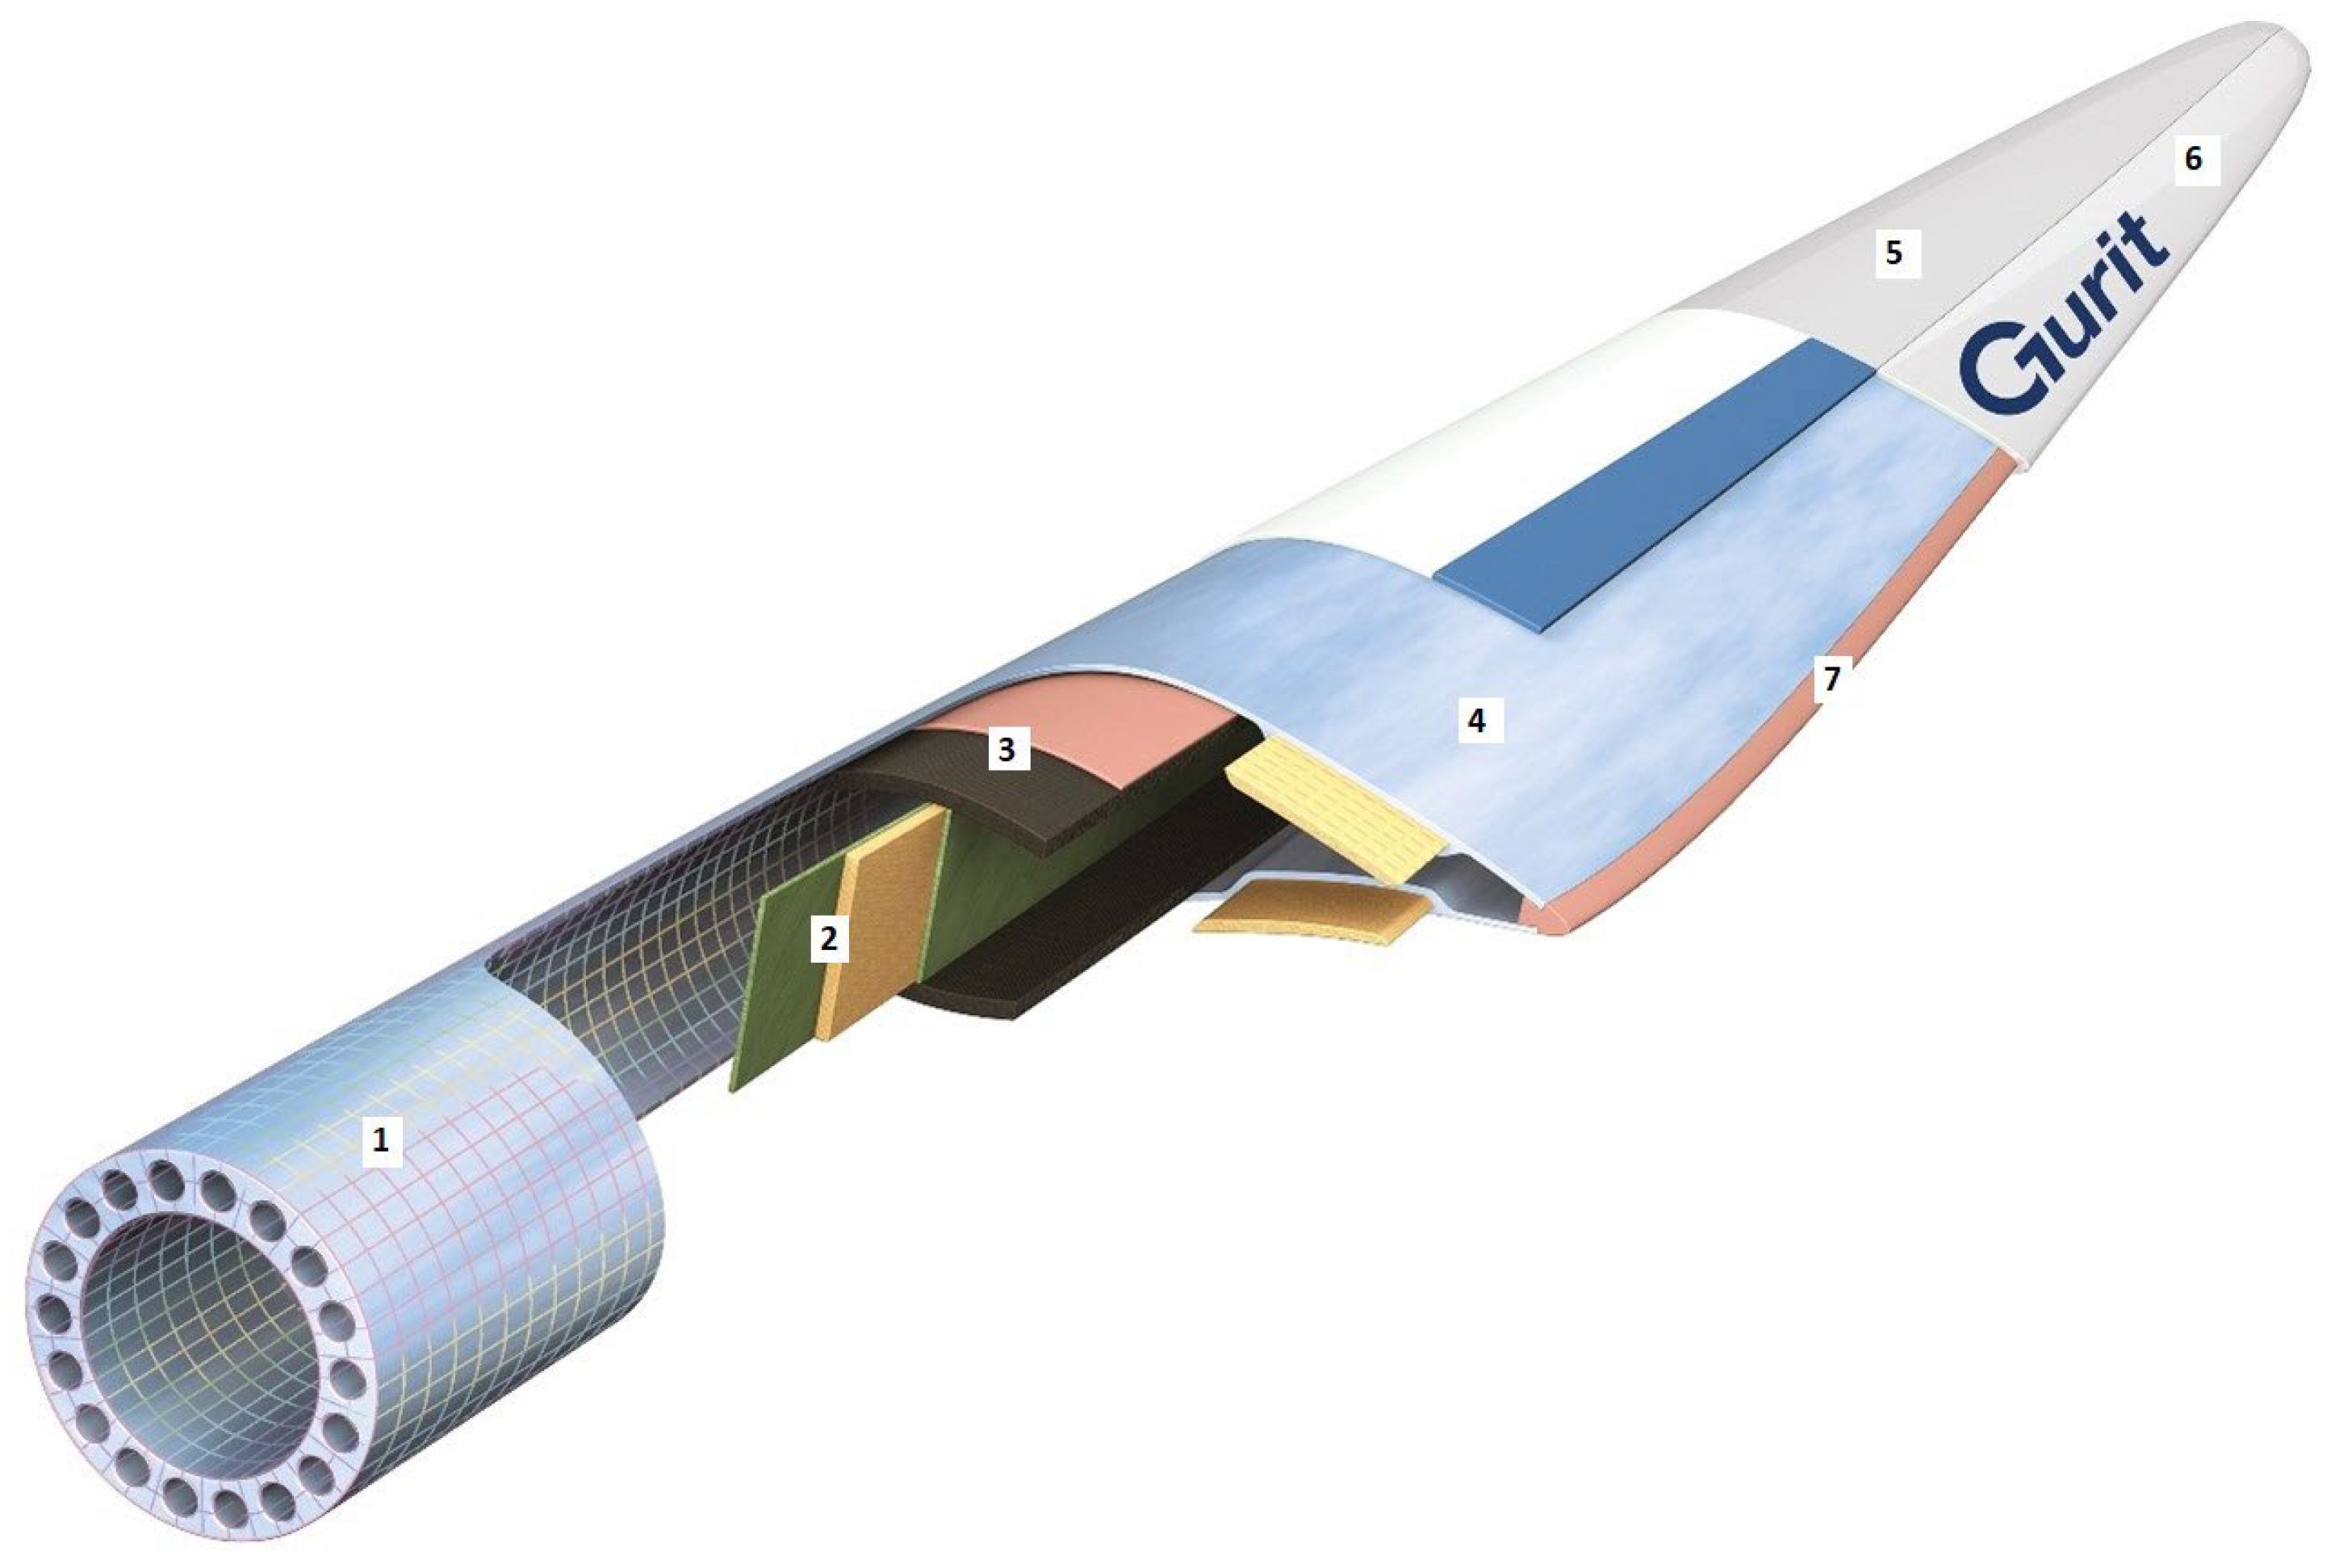
The construction of a classic wind turbine blade is shown in Figure 1.
Figure 1. Structure of a wind turbine blade (with permission from [12]): 1—root, 2—shear web, 3—spar cap, 4—shell, 5—blade coating, 6—over-lamination, 7—bonding.
Energies 16 07474 g001
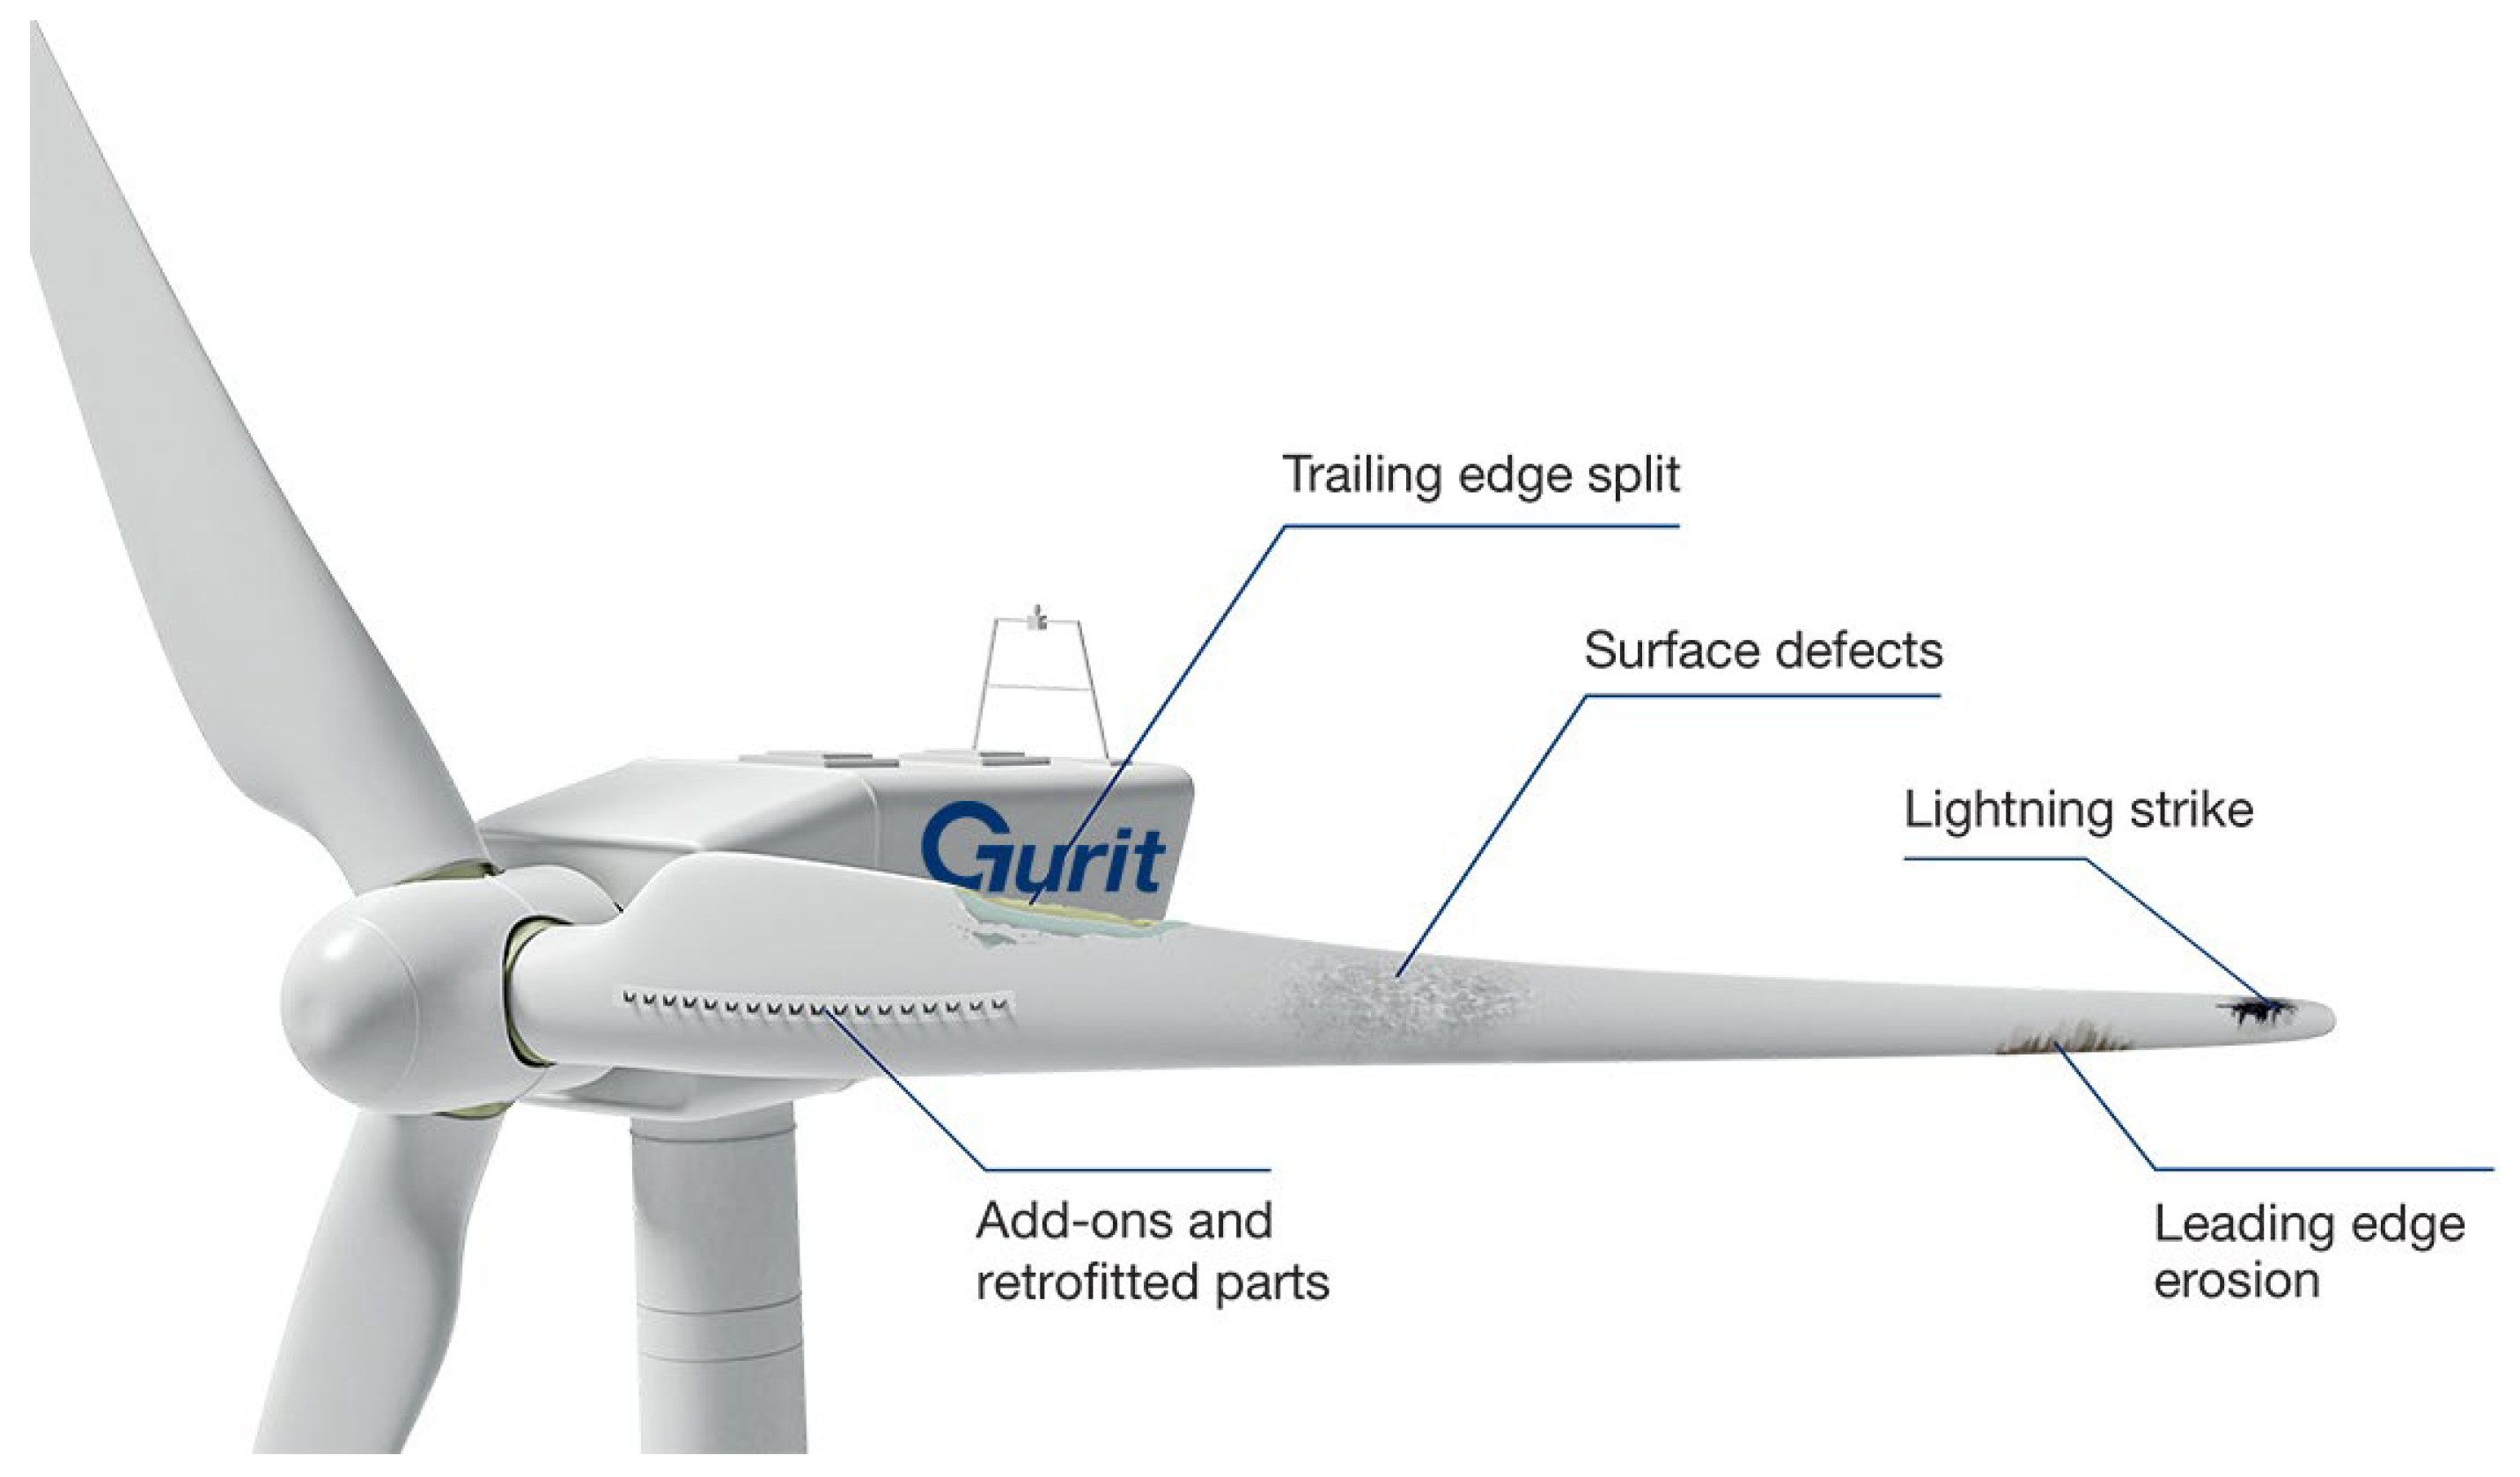
An analysis of the literature [4,6] confirms that the typical yet most common of turbine blades presented in Figure 2 are caused by:
Lightning strike;
Erosion of the trailing edge (in most cases) [13,14];
Damage caused by microcracks and fatigue [13,14];
Icing (particularly significant in certain areas of turbine installation).
Individual damage failures are often dependent on each other. For instance, damage caused by microcracks can occur due to icing of the turbine blade. The splitting action of ice particles, in fact, causes delamination and subsequent cracking of the surface layer. In reference [15], an algorithm for diagnosing wind turbine blade icing using hybrid features and the Stacked-XGBoost algorithm was proposed.
When considering the use of vibration signals in the diagnosis of important components of a wind turbine, it is necessary to take into account the vibrations generated by the blade bearings (also called angular contact/ pitch bearings), which are responsible for rotating the blade at the desired angles in order to optimize electricity production. The method called empirical wavelet thresholding, used to extract weak signals of failure occurrence, is described in [16].
Figure 2. Typical wind turbine blade damage (upon permission) [12].
Energies 16 07474 g002
During operation on land, and especially offshore in a marine environment, localized structures may appear in the tower column and blades. If the boundary values are exceeded, the component may be damaged. The varying wind and wave impacts are a major cause of failures. These, in turn, significantly affect the safety of operation and operating costs associated with the elimination of damage. The authors of [17] also indicate an inverse relationship. They show that turbine blade damage significantly affects the generated vibration diagnostic signals received in the tower.
A view showing the blade from the inside is presented in Figure 3a,b. These drawings reveal possibilities of placing suitable measuring sensors for diagnosing (online mode) possible damage, e.g., microcracks.
Each time a wind turbine is taken out of service, whether due to a failure or a planned inspection and maintenance shutdown, unproductive costs are generated. Wind-turbine condition monitoring along with machine learning tools has itself undergone many developments and improvements over the decades. However, an analysis [7] has shown that there is no standardized, certified, and accredited method of using a non-invasive measurement technique to detect spots of potential damage in wind turbine blades. The use of non-invasive methods in the wind power industry is primarily based on the wind turbine operators’ own guidelines. The initial method of non-invasive damage detection was visual inspection and measurement by technical personnel. Typically, the sensitivity threshold here is quite low: damage is generally only seen (or heard) when it is at an advanced stage of development. The elastic waves of acoustic emission for machine and system diagnostics are used in the broadest sense [3,11,18]. Thus, the use of wave relationships, or putting it more precisely, disturbances of the propagating elastic waves, was proposed and preliminarily tested for diagnosing wind turbine blade damage.
Acoustic emission, by definition, is the phenomenon of spontaneous or stress-induced elastic wave generation acting through plastic deformation, crack propagation, corrosion, collision, erosion, or leakage. It belongs to the group of passive methods, i.e., the AE device does not emit signals and does not affect the physical state of the object under test, but only records the physical effects that arise spontaneously in the monitored object. The sources of the acoustic emission elastic wave signal are, therefore, the formation and propagation of micro-cracks, corrosion processes, and material cracking in prestressed structures, but also internal material displacements. The elastic waves generated in the source propagate from the source in all directions in the volume of the object to be monitored. The elastic waves reach the sensor AE and are then transmitted to the analyser in the form of electrical voltage changes. The measuring apparatus consists of an AE sensor that converts the signal into a varying electrical voltage, an analyser that amplifies this voltage and eliminates signals not originating from the monitored source (acoustic background), and a device that records the AE wave signal. The acoustic emission frequency ranges from a fraction of a hertz to the order of a megahertz. Wang et al. [19] described methods for diagnosing wind turbine blades using acoustic emissions. The results indicated that the best method for the detection of defect source growth caused by fatigue damage was using the triangle method to analyse the relative arrival time of the wave to the sensor with determination of the location of the defect growth. Another approach to acoustical damage detection of the WTB is presented by Chen et al. [20], who applied the improved incremental support vector data description (SVDD) model. The physical method in combination with the filter and sliding window is able to detect sound pulses of the WTB from among strong background noise. The issue of using EA in the diagnosis of WTBs is most comprehensively described by Liu in reference [21], while the list of strengths and weaknesses of the main methods based on acoustic emission testing in WTB was formulated by Marquez and Chacon [5].

2.2. Assumptions of the Proposed Diagnostic Method

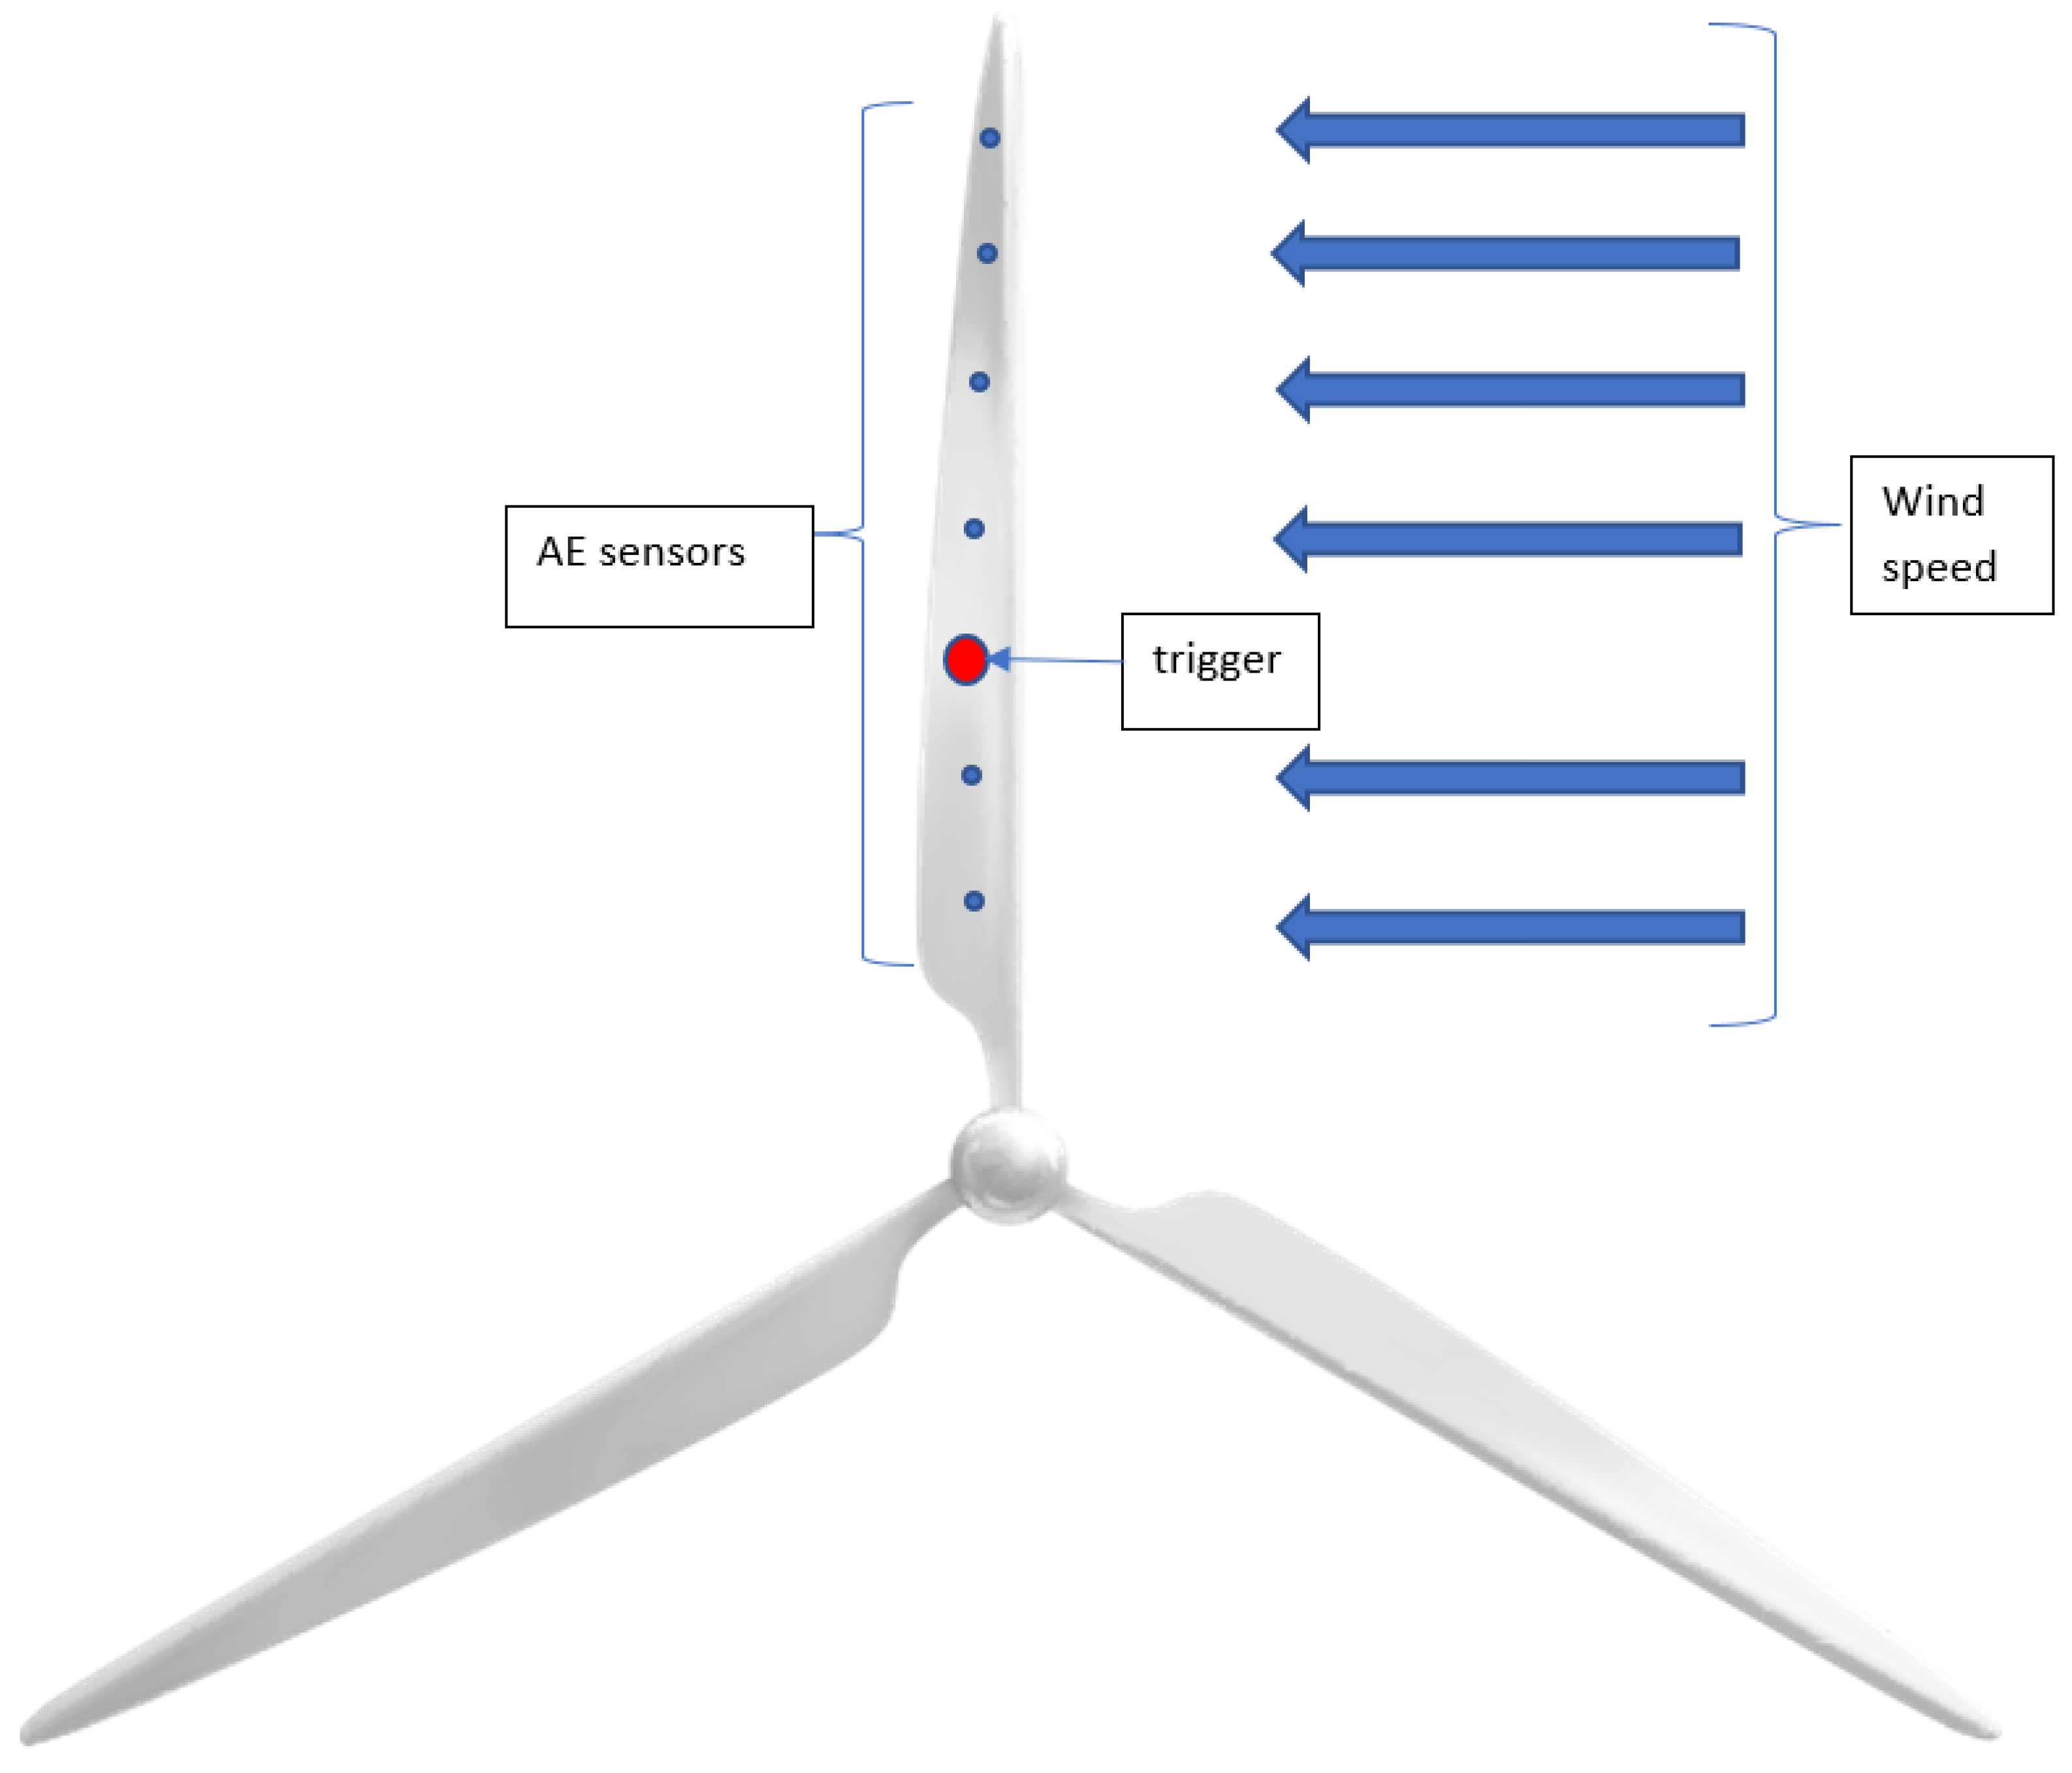
The method proposed by the authors of this article consists of placing a ‘line’ of interconnected acoustic emission sensors, triggering a measurement when a certain wind force is exceeded. An additional sensor (trigger) is connected to a stress sensor whose output signal depends on the force applied to the turbine blade and which, after obtaining the appropriate tension in the blade, starts the AE wave measurement process. This ensures the measurement repeatability of the tested and obtained signals. In this way, the signal triggers an acoustic emission measurement (Figure 4). This arrangement ensures reproducible (comparable) conditions of the recorded elastic wave and allows for accurate comparison (using the coherence function) of individual “sections” of the blade of the diagnosed turbine. This makes it possible to precisely determine the place (location) of damage or discontinuity in the material. In tests using elastic acoustic emission waves, most measuring instruments have the possibility to set a so-called threshold value for the signal. In this case, the threshold value would be adjusted (set by the service technician) depending on where the turbine is installed—onshore or offshore, but could also be dependent on the probability of damage, e.g., depending on the operating time of the blades. The waveform recorded by such sensors at specified intervals is compared and analysed using a consistency function. Wind energy, by definition, is the energy content of air flow due to its motion. This type of energy is called kinetic energy and is a function of mass and velocity. The fundamental equation in wind power analysis is [22,23]:
P = 0.5 cp ρ π r2 v3
where cp—the coefficient of performance (efficiency factor, in percent), ρ—air density (in kg/m3), r—the blade length (in meters), and v—the wind speed (in m/s).
A power curve is made for each turbine, for which the output power is shown as a function of wind speed, where the rated (optimum) wind speed is highlighted. In the case of the scheme described in this article, the rated value is assumed (for the turbine under consideration), thus ensuring a constant and, therefore, repeatable internal tension of the turbine blade. In the simplest case, it is proposed to use a strain gauge sensor, which, when a specific blade stress value is exceeded, triggers the measurement of acoustic emission wave signals. In any case, it is possible to move the threshold of the stress value, which can depend on the design of a particular blade. Acoustic emission is generated by the corresponding state of stress acting on the internal structure. Disturbance of the signal changes the extracted dynamic system similarly to the application of modal analysis. By comparing the different ranges of emitted characteristic frequencies, we are able, using the coherence function, to determine the type of wave disturbance, and, thus, the type of damage to the structure.
The number of acoustic emission sensors installed depends on the length of the wind turbine blade. In the future, as technology develops, it may be possible to use a system of acoustic emission sensors installed every few tens of centimeters in a suitable composite fibre mounted in the turbine blade, similar to Fiber Bragg grating (FBG) sensors, which are commonly used for strain detection [24]. Once the sensor is subjected to stress or temperature changes, the grating pitch changes, which affects the wavelength of the reflected light to meet the detection requirements.
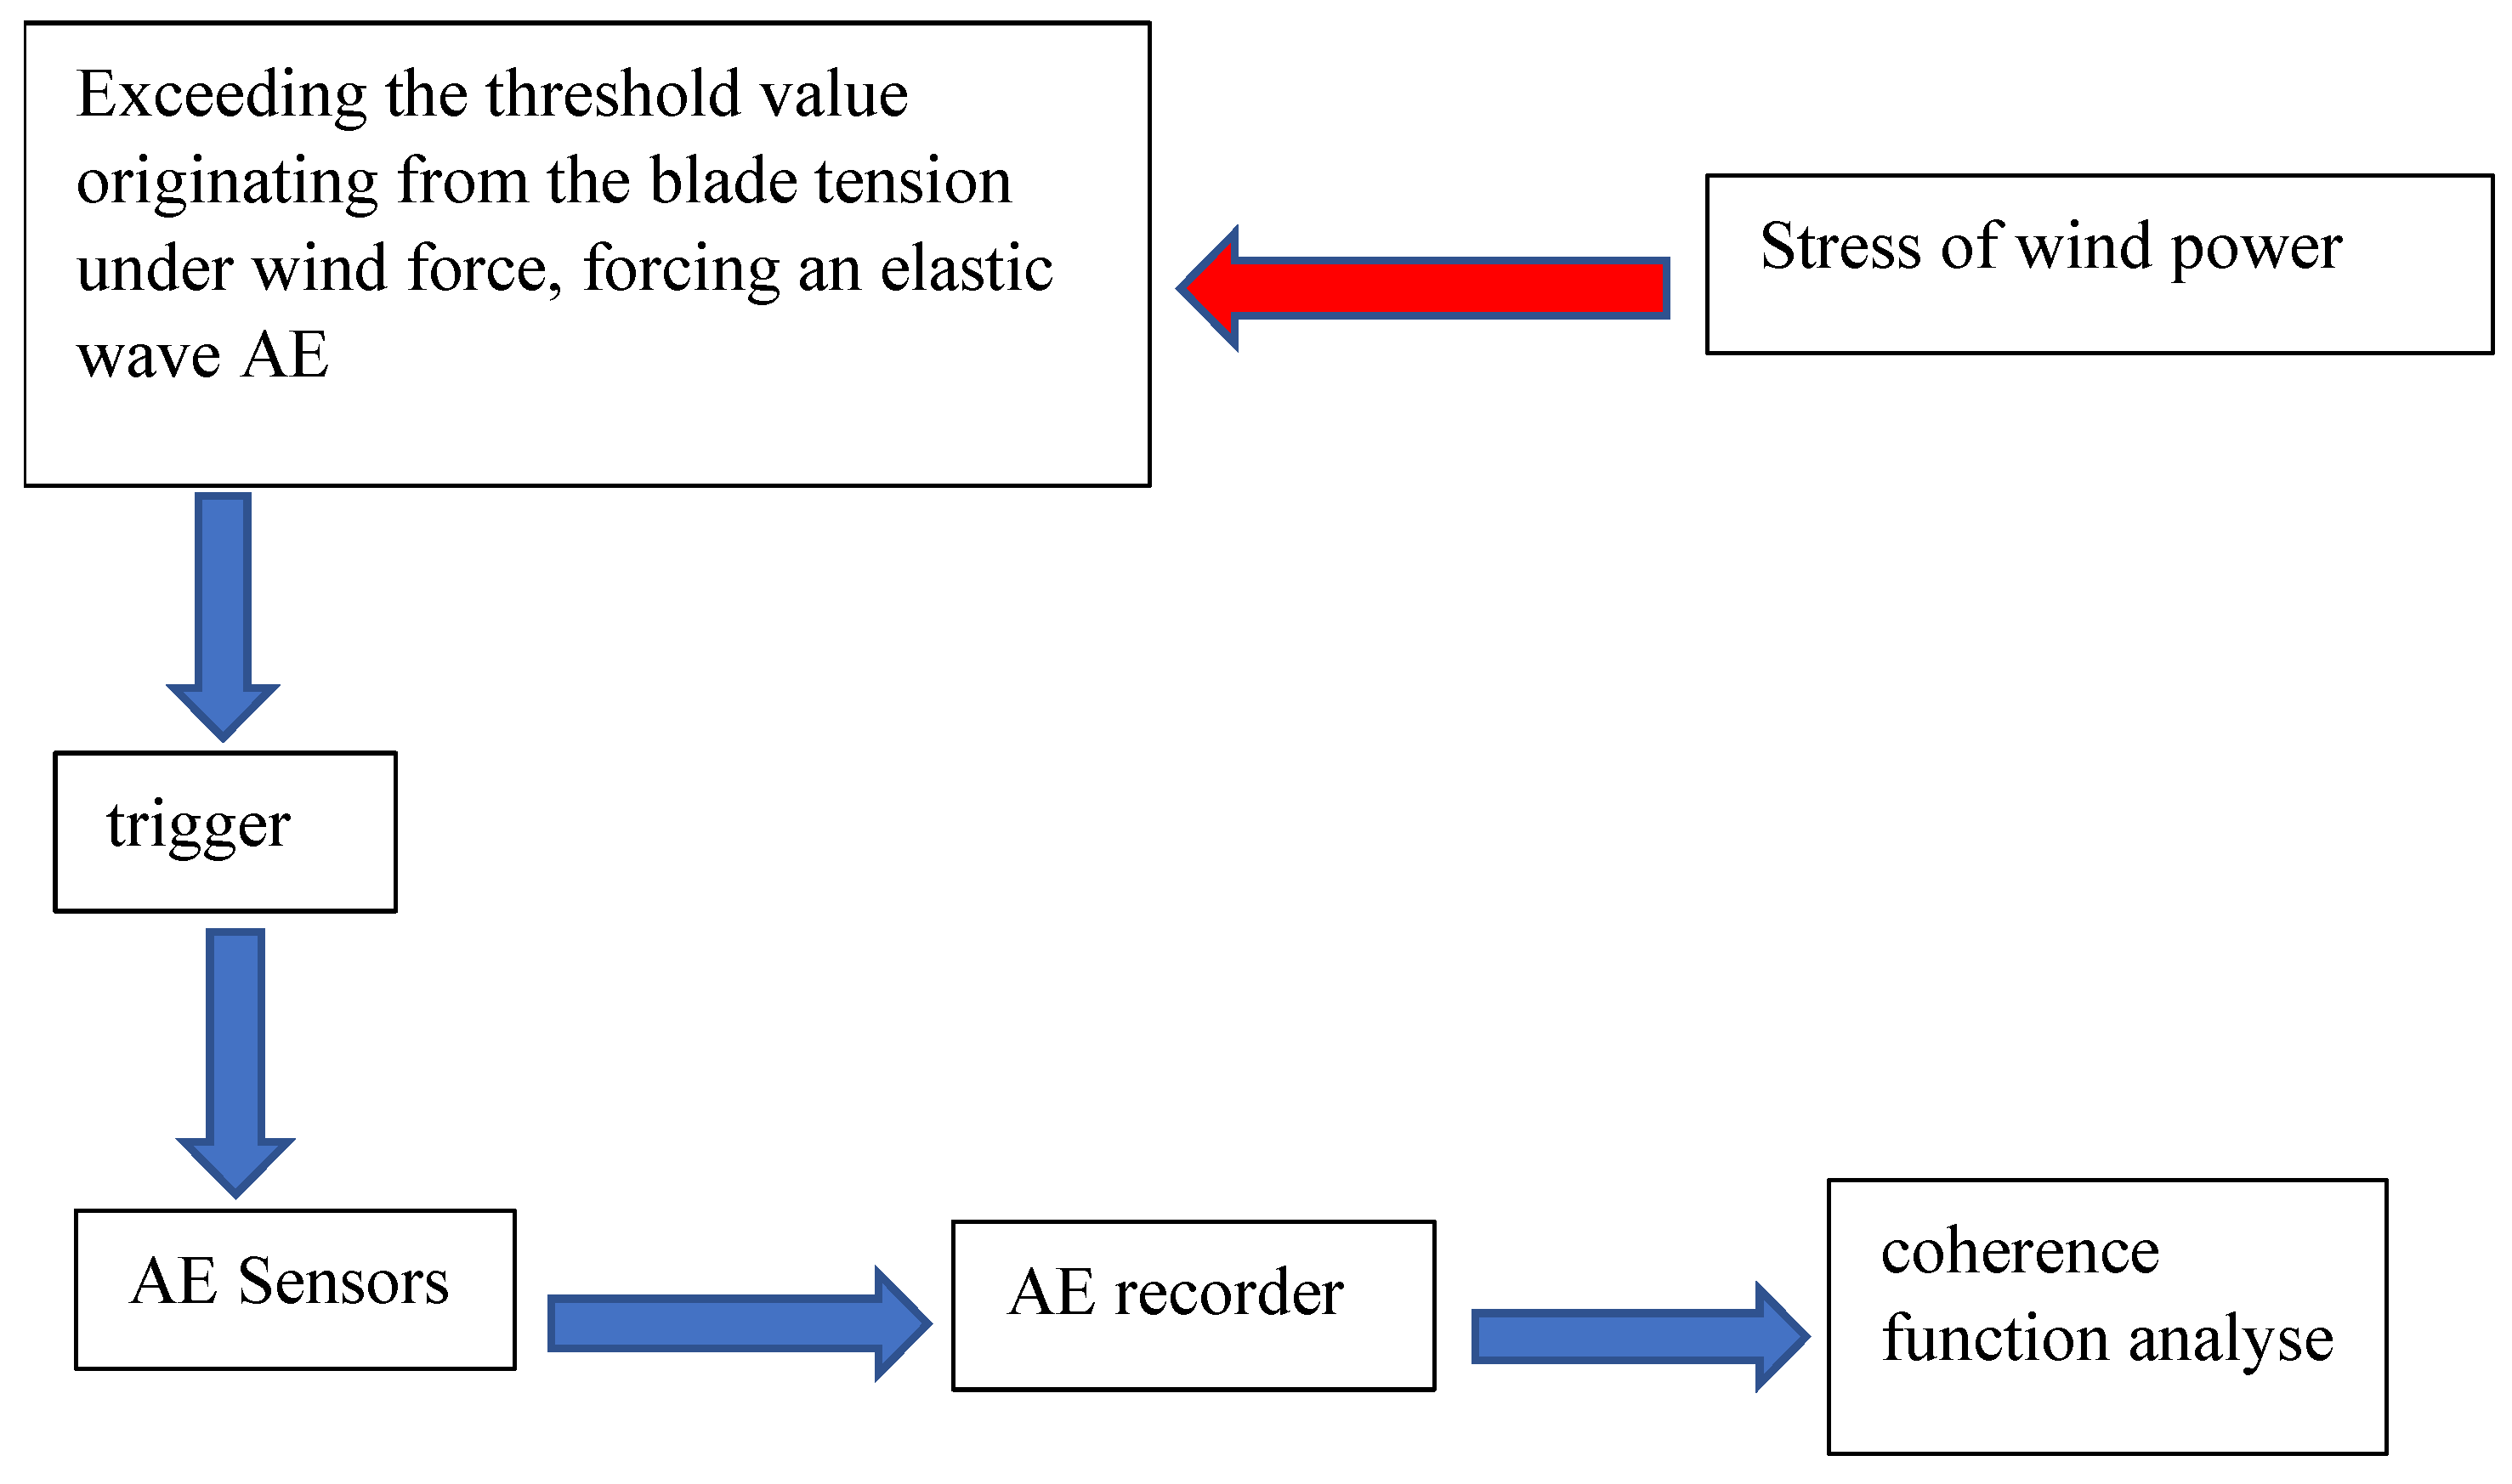
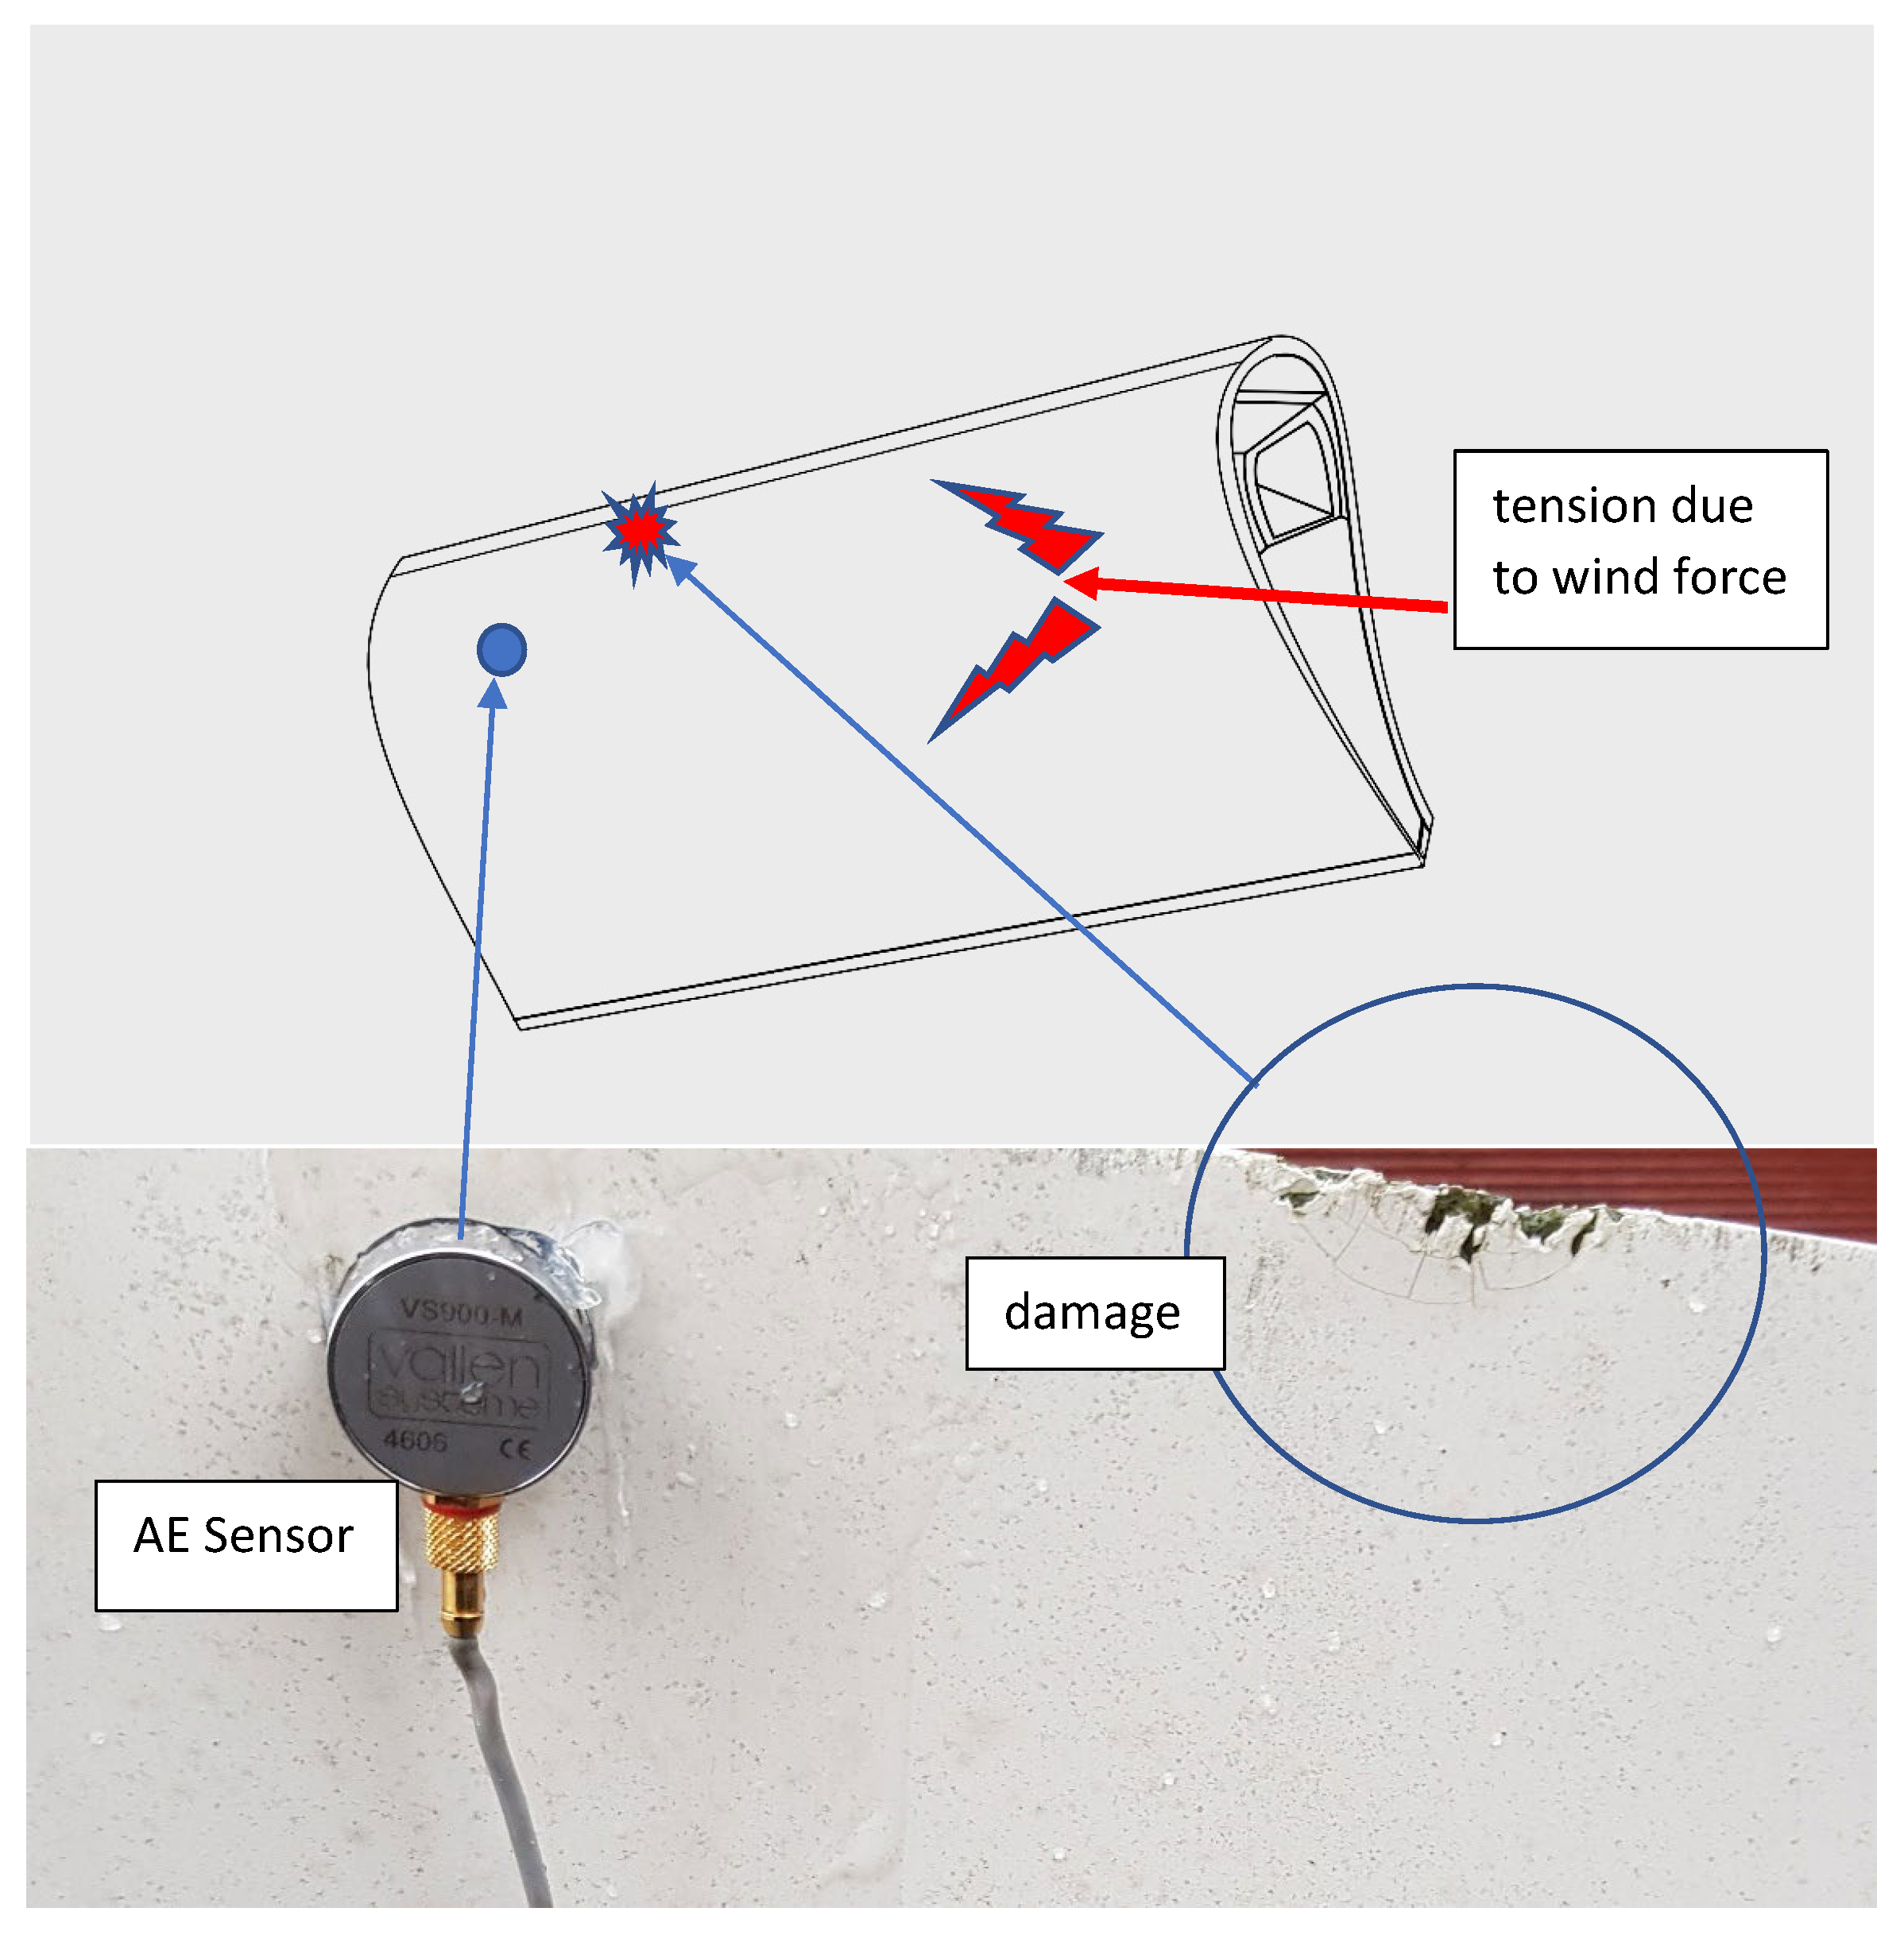
The actual tests addressed the most typical blade damage, i.e., blade leading-edge spalling and general surface defects. The essence of turbine blade diagnostics is shown in Figure 5. An acoustic emission recorder designed and manufactured at the Maritime University of Szczecin was used for the tests. In addition, to verify the correctness of the device’s operation, tests were carried out using a Pocket AE—Portable AE System type recorder from MISTRAS and a Wave 1002 measurement system from Vallen.
The elastic wave generated in the blade arrives at a trigger which, when it exceeds a preset threshold value, triggers a measurement with the AE sensors. The signals from the individual sensors reach the recorder, where they are, by means of a coherence function, compared with a reference wave (defect-free material). Its low value (not exceeding an average value of 0.8) in the band above 25 kHz indicates a high probability of damage to the wind turbine blade. The summed value of the coherence function is indicative of blade damage, while its detailed location is related to the identification of the specific AE sensor giving the highest deviation in the described descriptor. Figure 6 presents the measurement method and the location of the single AE sensor during the survey.
Vallen acoustic emission sensors were used in this study. However, similar results have been obtained using other sensors (with a similar frequency band), such as those from Physical Acoustics Corp. At present, there is no ready-made measurement system. To the authors’ knowledge, systems of interconnected AE microsensors spaced every few tens of centimeters in a fibre-optic element are already in laboratory testing. However, this is an element of the measurement path that can be modified in the future. The essence here is the method itself and the possibility of using it in damage analysis. The method described is a proposal that represents a possibility for identifying the condition of the blade under test. The use of a specific type of sensor is a separate area of research. In their work, the authors wanted to test and verify the essence of the proposed method for identifying the state of the blade and the effect of obtaining a correct diagnosis.
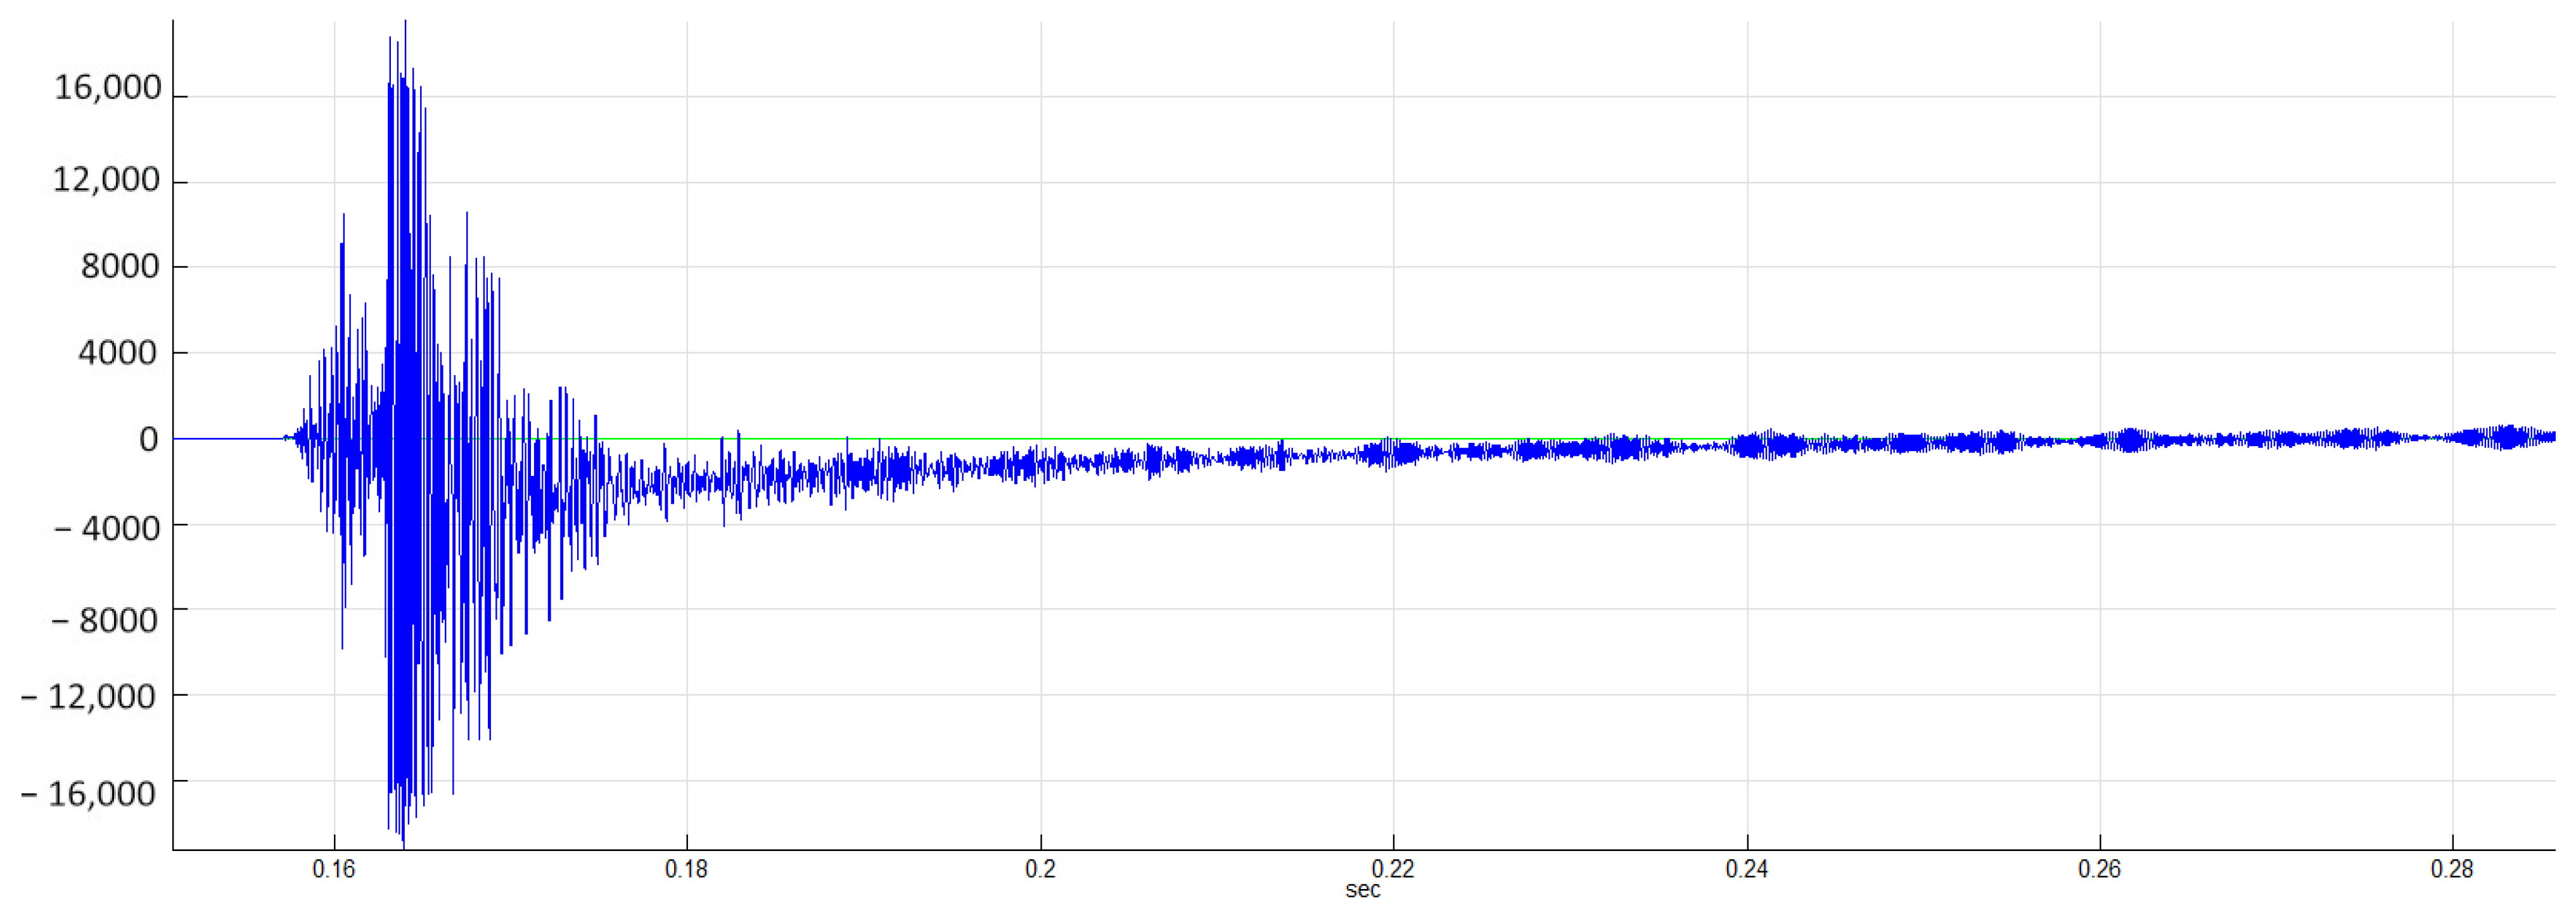
The acoustic emission signal, in the form of an elastic wave, was generated by means of a repetitive pulse generated on the surface of the blade. Figure 7 shows the source signal—the pulse generated in an intact part. A clear difference in the time signal was recorded for an identical excitation in a blade with a defective leading edge (Figure 8).
This provided grounds to suppose that a noticeable change in the generated (reaching the sensor) energy value of the recorded waveform could also be expected. The RMS (root mean square) value of the two signals was therefore compared [25].
R M S = 1 T 0 T x 2 t d t
where x(t) is the value of the signal over a specific time interval.
In the simplest interpretation, RMS (as a measure of the periodically changing voltage signal generated at the AE sensor) determines the energy parameters of a signal. In the experiment, for the signal from the damaged part of the blade, the RMS value was 2469, while, for the same pulse in the part without defects, the RMS value was 2764. This difference can be explained in a relatively simple way. In the blade under test, at the point of damage to the leading edge, there is a change in the elastic characteristics, part of the energy of the wave reaching the sensor is scattered and reflected. The arriving AE source wave in the damaged area will, therefore, be disturbed and scattered and, consequently, its RMS value will decrease.
In order to determine the type of damage (for the application of online diagnosis) in an operating turbine, a more sophisticated method of signal analysis is, therefore, proposed. From a theoretical point of view, components made of high-strength composites tend to have strongly non-linear dynamic characteristics and their material constants e.g., equivalent Young’s modulus, are dependent on the magnitude and rate of the strain in a different manner than in commonly used rheological models (Voigt model) [25]:
E a l t = f x , x ˙   f = ?
where E a l t defines some replacement energy value; f(x) is a function of the solution vector of the system of differential equations (assuming that these equations exist). In the given equation, it is a non-linear function of the variable concerning displacements x and velocity .
If we assume that a system such as a wind turbine blade can be described by a mathematical function, even slight damage to the structure will change the elastic characteristics of this system. Consequently, there may be a change in the non-linear part of this characteristic for at least one generalised coordinate. Even if the damage does not generate any external symptoms (because only an internal crack will occur), there should be a change in the elastic characteristics of the system under test. In the course of this research, the authors’ basic guideline was to look for a measure of the signal propagating through the turbine blade structure, which would be defined on the non-linear part of the spectrum. Particularly in the case of an offshore power plant, it is possible to determine (find) stable (for comparable reference conditions) blade stresses under the influence of the acting wind.
The coherence function defines a linear relationship between two signals, a(t) and b(t), for a given frequency. Thus, it determines the degree of relationship between two signals by means of a linear function. The ordinary coherence function specified as part of the output signal is shaped by a linear transformation of the input signal. The coherence function is used to verify whether a linear relationship between two waveforms applies in a particular case. High coherence for a given frequency indicates that the two signals for that frequency have a high power concentration. The two functions are only equal to each other for an undistorted linear system. In any other case, the coherence function is less than unity. This function between two continuous waveforms, a(t) and b(t), is expressed by the equation [25]:
γ a b ω = S a b ( ω ) S a ( ω ) S b ( ω )
where   S a ( ω ) is a power spectrum of the signal a(t), S b ( ω ) is a power spectrum of the signal b(t), and S a b ( ω ) is a spectrum of the reciprocal power of the signals a(t) and b(t).
A high coherence for a given frequency indicates that the two signals for that frequency have a high power concentration. The coherence varies between 0 and 1. If γab (ω) is equal to 0 for all frequencies, it means that the functions a(t) and b(t) are uncorrelated for all frequencies. If γab (ω) is equal to 1 for all frequencies, the functions are fully correlated [25,26]. Coherence is proportional to the ratio of the level of the useful signal to the sum of the levels of the useful signal and the interfering signal (interference, wave dispersion). In other words, coherence is an indicator of the ratio of the useful signal to the noise (or more precisely to the total signal, i.e., useful signal plus noise), as a function of frequency. It can be assumed that coherence informs us about the ‘quality’ of the useful signal, i.e., the level of interference from unwanted signals. Unwanted or otherwise destructive interference results in the extinction or weakening of the useful signal.
In a classical frequency analysis, using the coherence function, we can isolate disturbances at the input or output of a system in a relatively simple way, provided that we know beforehand which type of disturbance is present. The problem, however, is how to interpret low values of the coherence function when the system is non-linear. If the coherence function is greater than zero but less than unity, it follows that:
The system binding the signals together is non-linear;
There are other unknown signals at the input of the system besides the observed input signal.
The appearance of a ‘new fault’ signal violates the coherence of the previous ones, which causes the coherence function to decrease.
3. Results

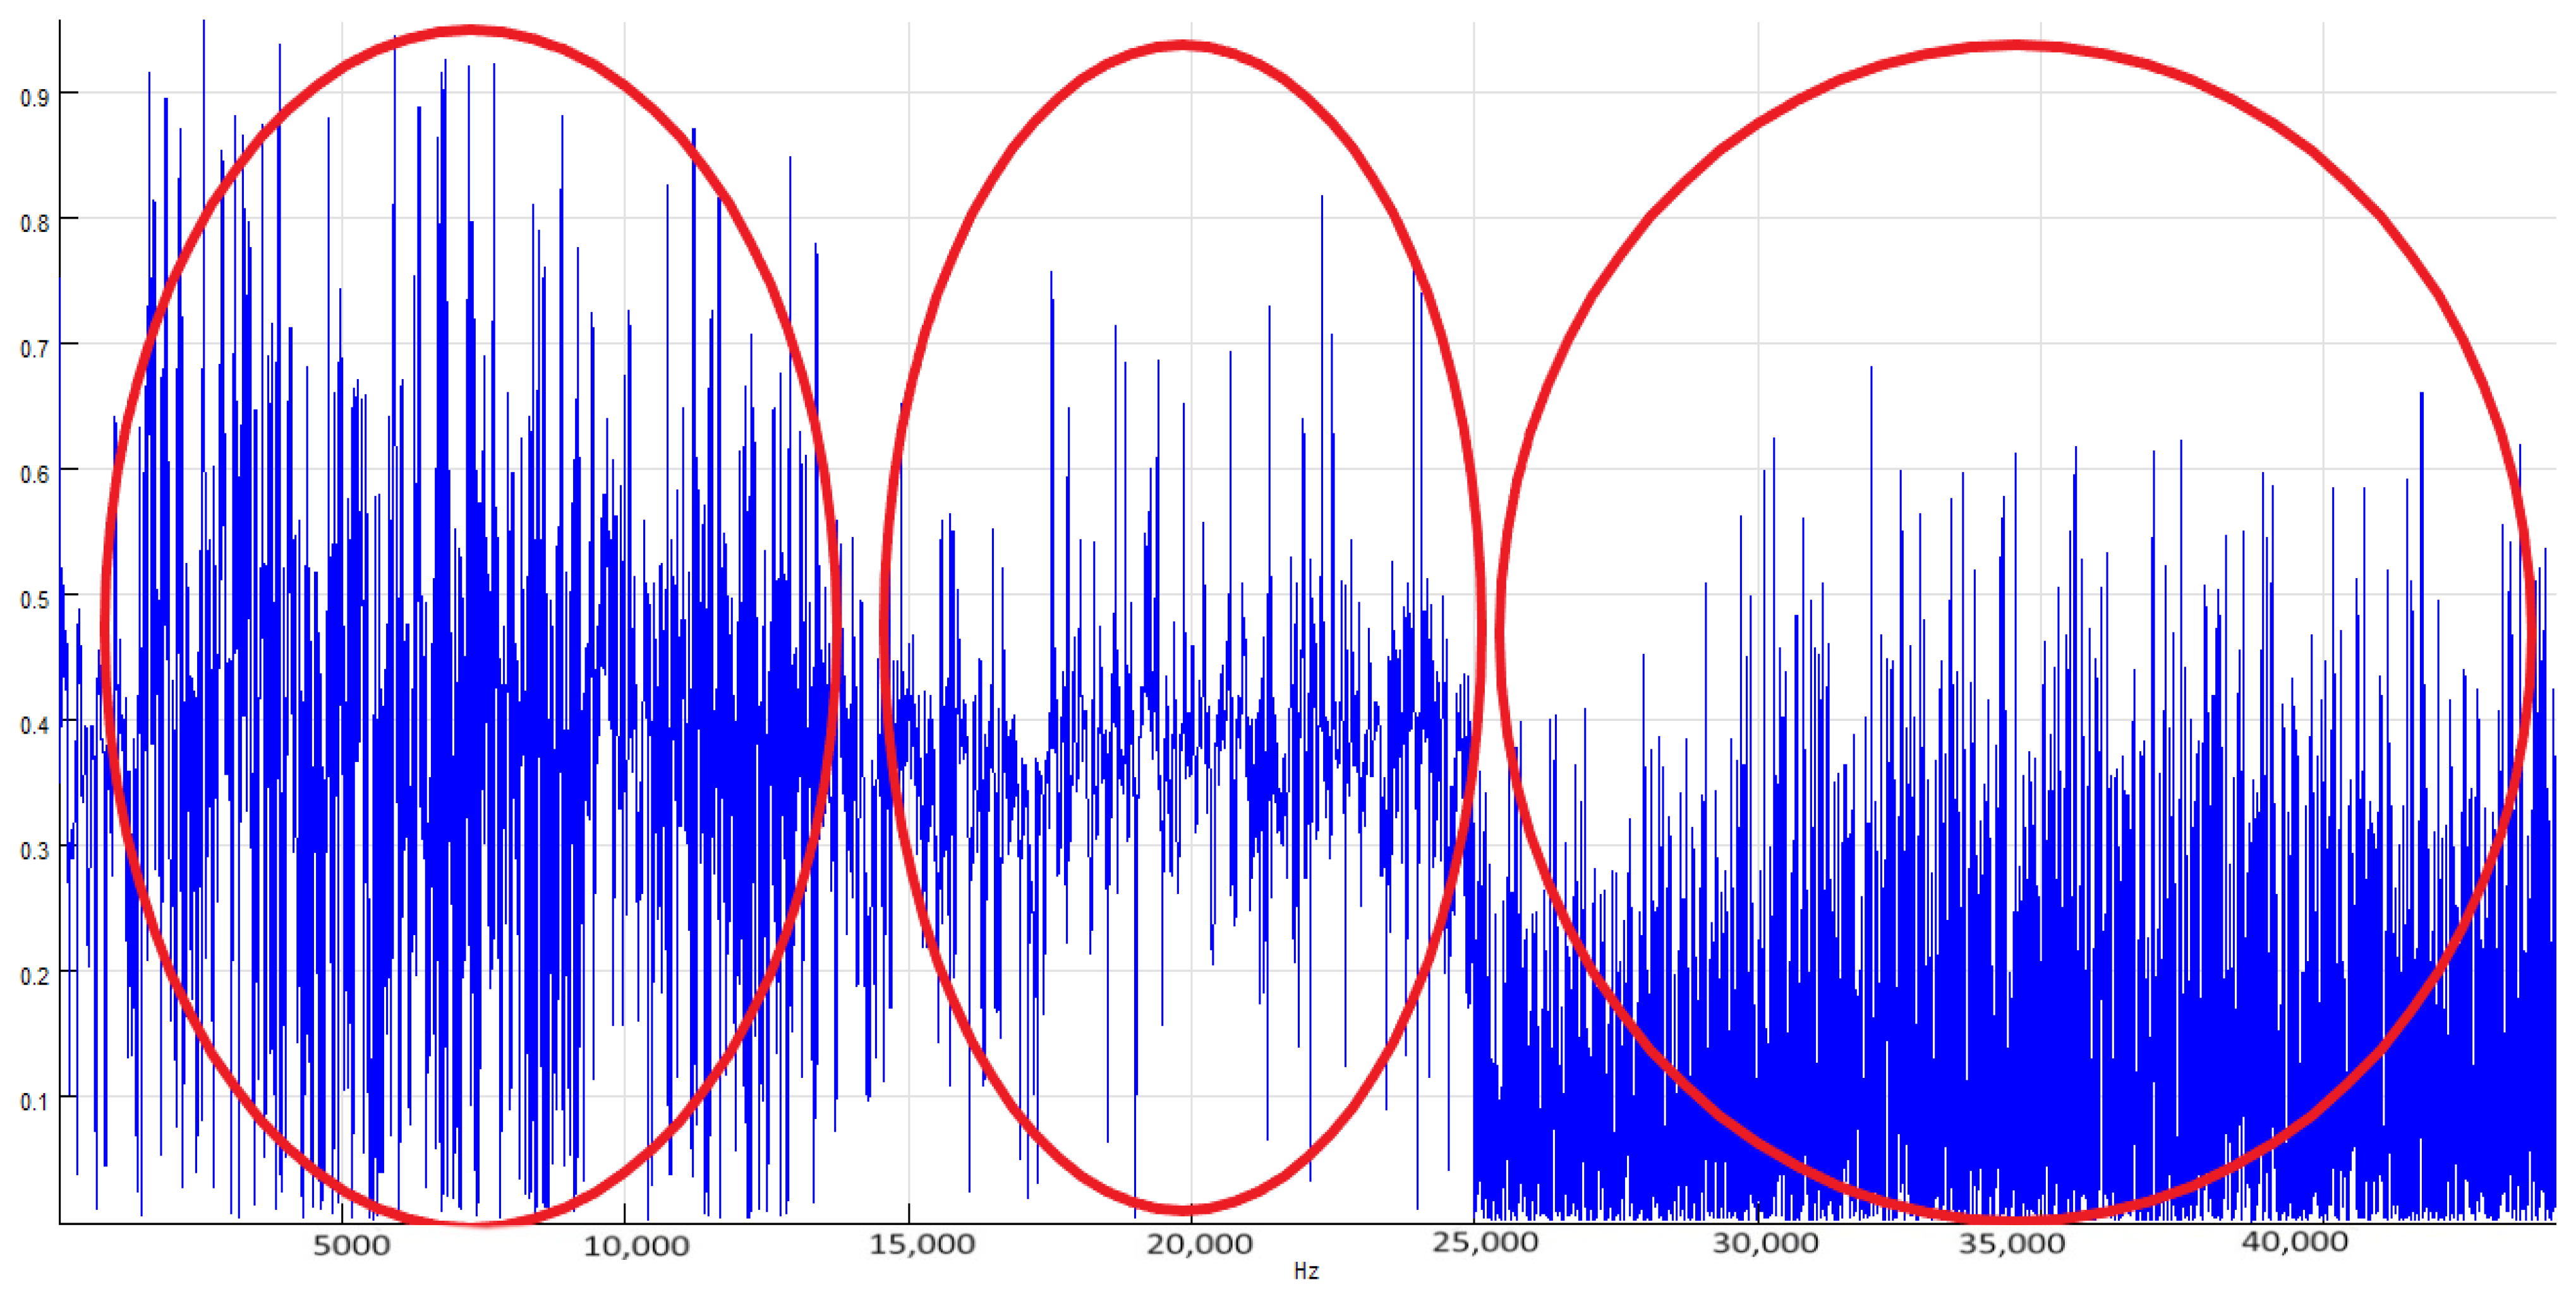
In the practical search for a diagnostic symptom, it is possible to find a measure indicating that some damage exists on the basis of a comparative analysis of the elastic waves of acoustic emission for a blade with and without damage. Analyzing the studied characteristics of the waveforms presented in Figure 7 and Figure 8, using the coherence function, three clearly distinguished zones can be noticed in the obtained spectrum of the elastic wave signal of acoustic emission (Figure 9). The first one concerns the lowest harmonics, which can be described by continuous linear equations. In this zone, the influence of the wind force acting on the blade is significant. The second one is the zone of non-linear interactions associated with the turbulence of the turbine column and the vibrations of the blade itself, and the third zone relates mainly to surface, longitudinal, and transverse waves. The impacts in the non-linear zones are repeatable for specific boundary conditions and should be sensitive to different types of structural disturbance. They will, therefore, be related to the measurable value of the wave and wind impact cycle. If we define the wave signal for an undamaged blade as Ym and the signal with the looked for damage as Yn, the search for the difference can be written as [25]:
Y ω , Θ m = P k ω · H k q i , z i + Φ * Θ m + Ψ
Y ω , Θ n = P k ω · H k q i , z i + Φ * Θ n + Ψ
where Φ—function vector identifying the initial state of the system, P(ω) is an excitation spectrum or power spectral density, H is the spectral transmittance, and Ψ is a measurement of the noise.
Hence, the difference in the two signals is [25]:
Δ m n Y ω = Φ * Θ m + Φ * q i , Θ n + Ψ = Δ Φ * ( q i , Θ m , Θ n , Ψ )
Therefore [25]:
q i = ( Δ Φ * ) 1 Δ m n X ( Θ m , Θ n , Ψ )
where qi is the damage parameter, and X represents the combined transformations of the output and input signals.
However, it becomes important to determine the inverse transformation (ΔΦ)−1 which, in fact, leads to the finding of a signal measure (descriptor) that allows the wave spectra of a system to be distinguished: for one without damage and for one in which a structural disturbance has occurred.
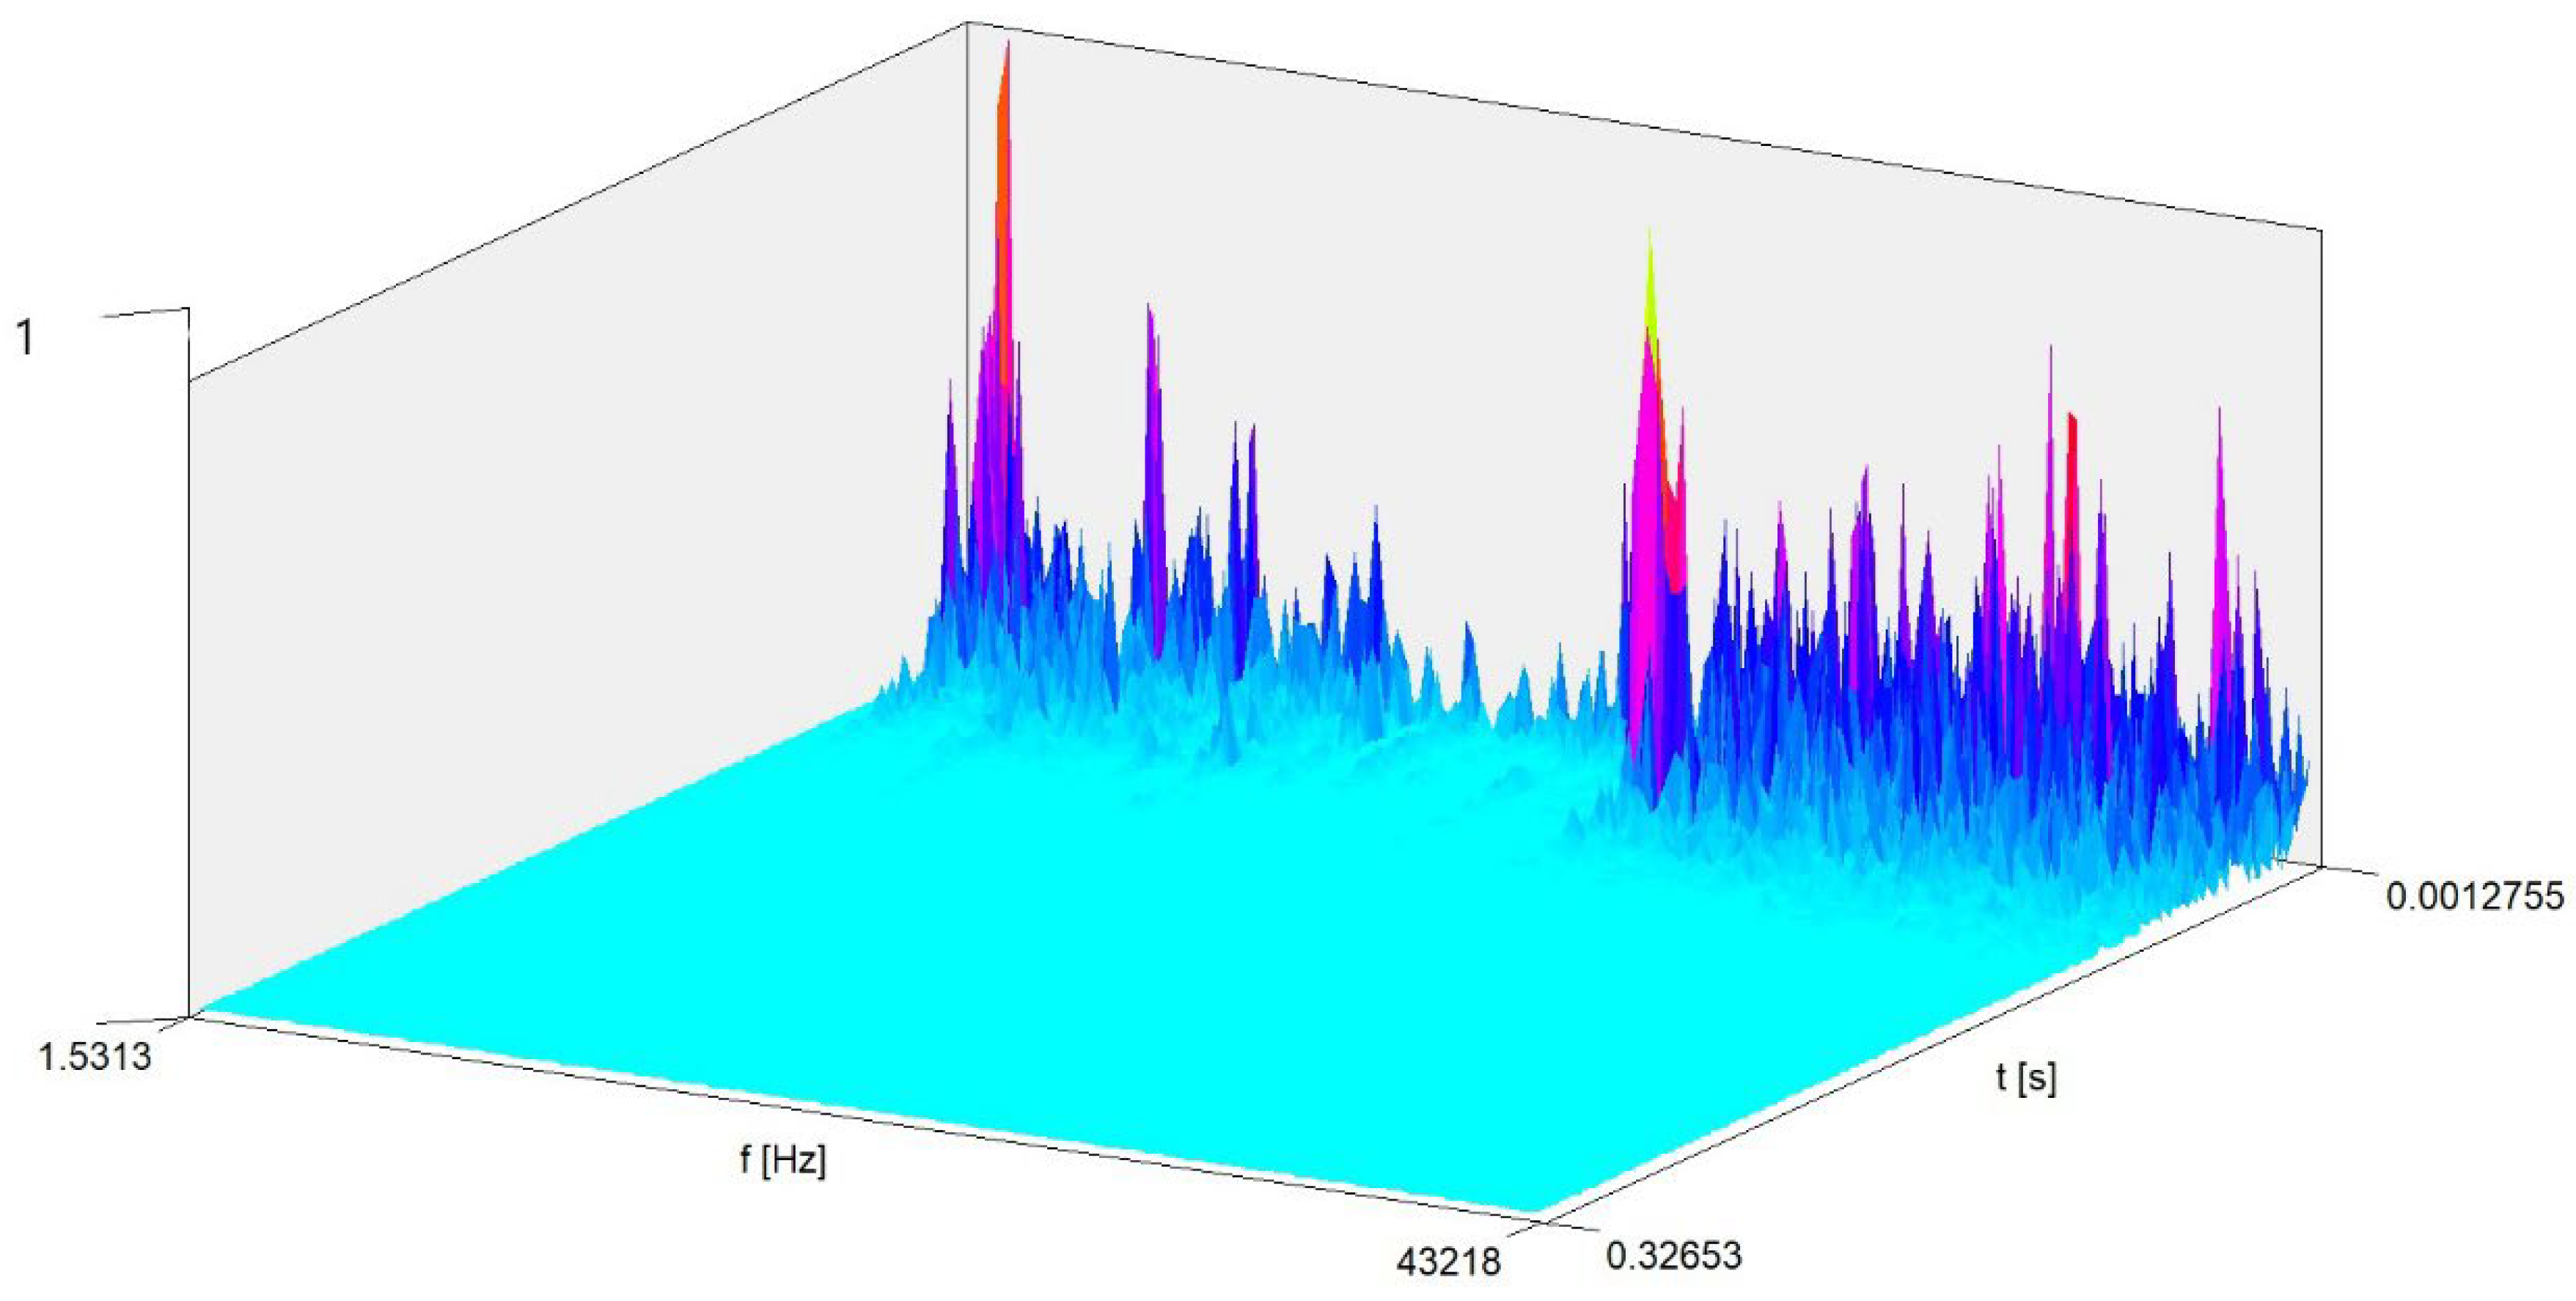
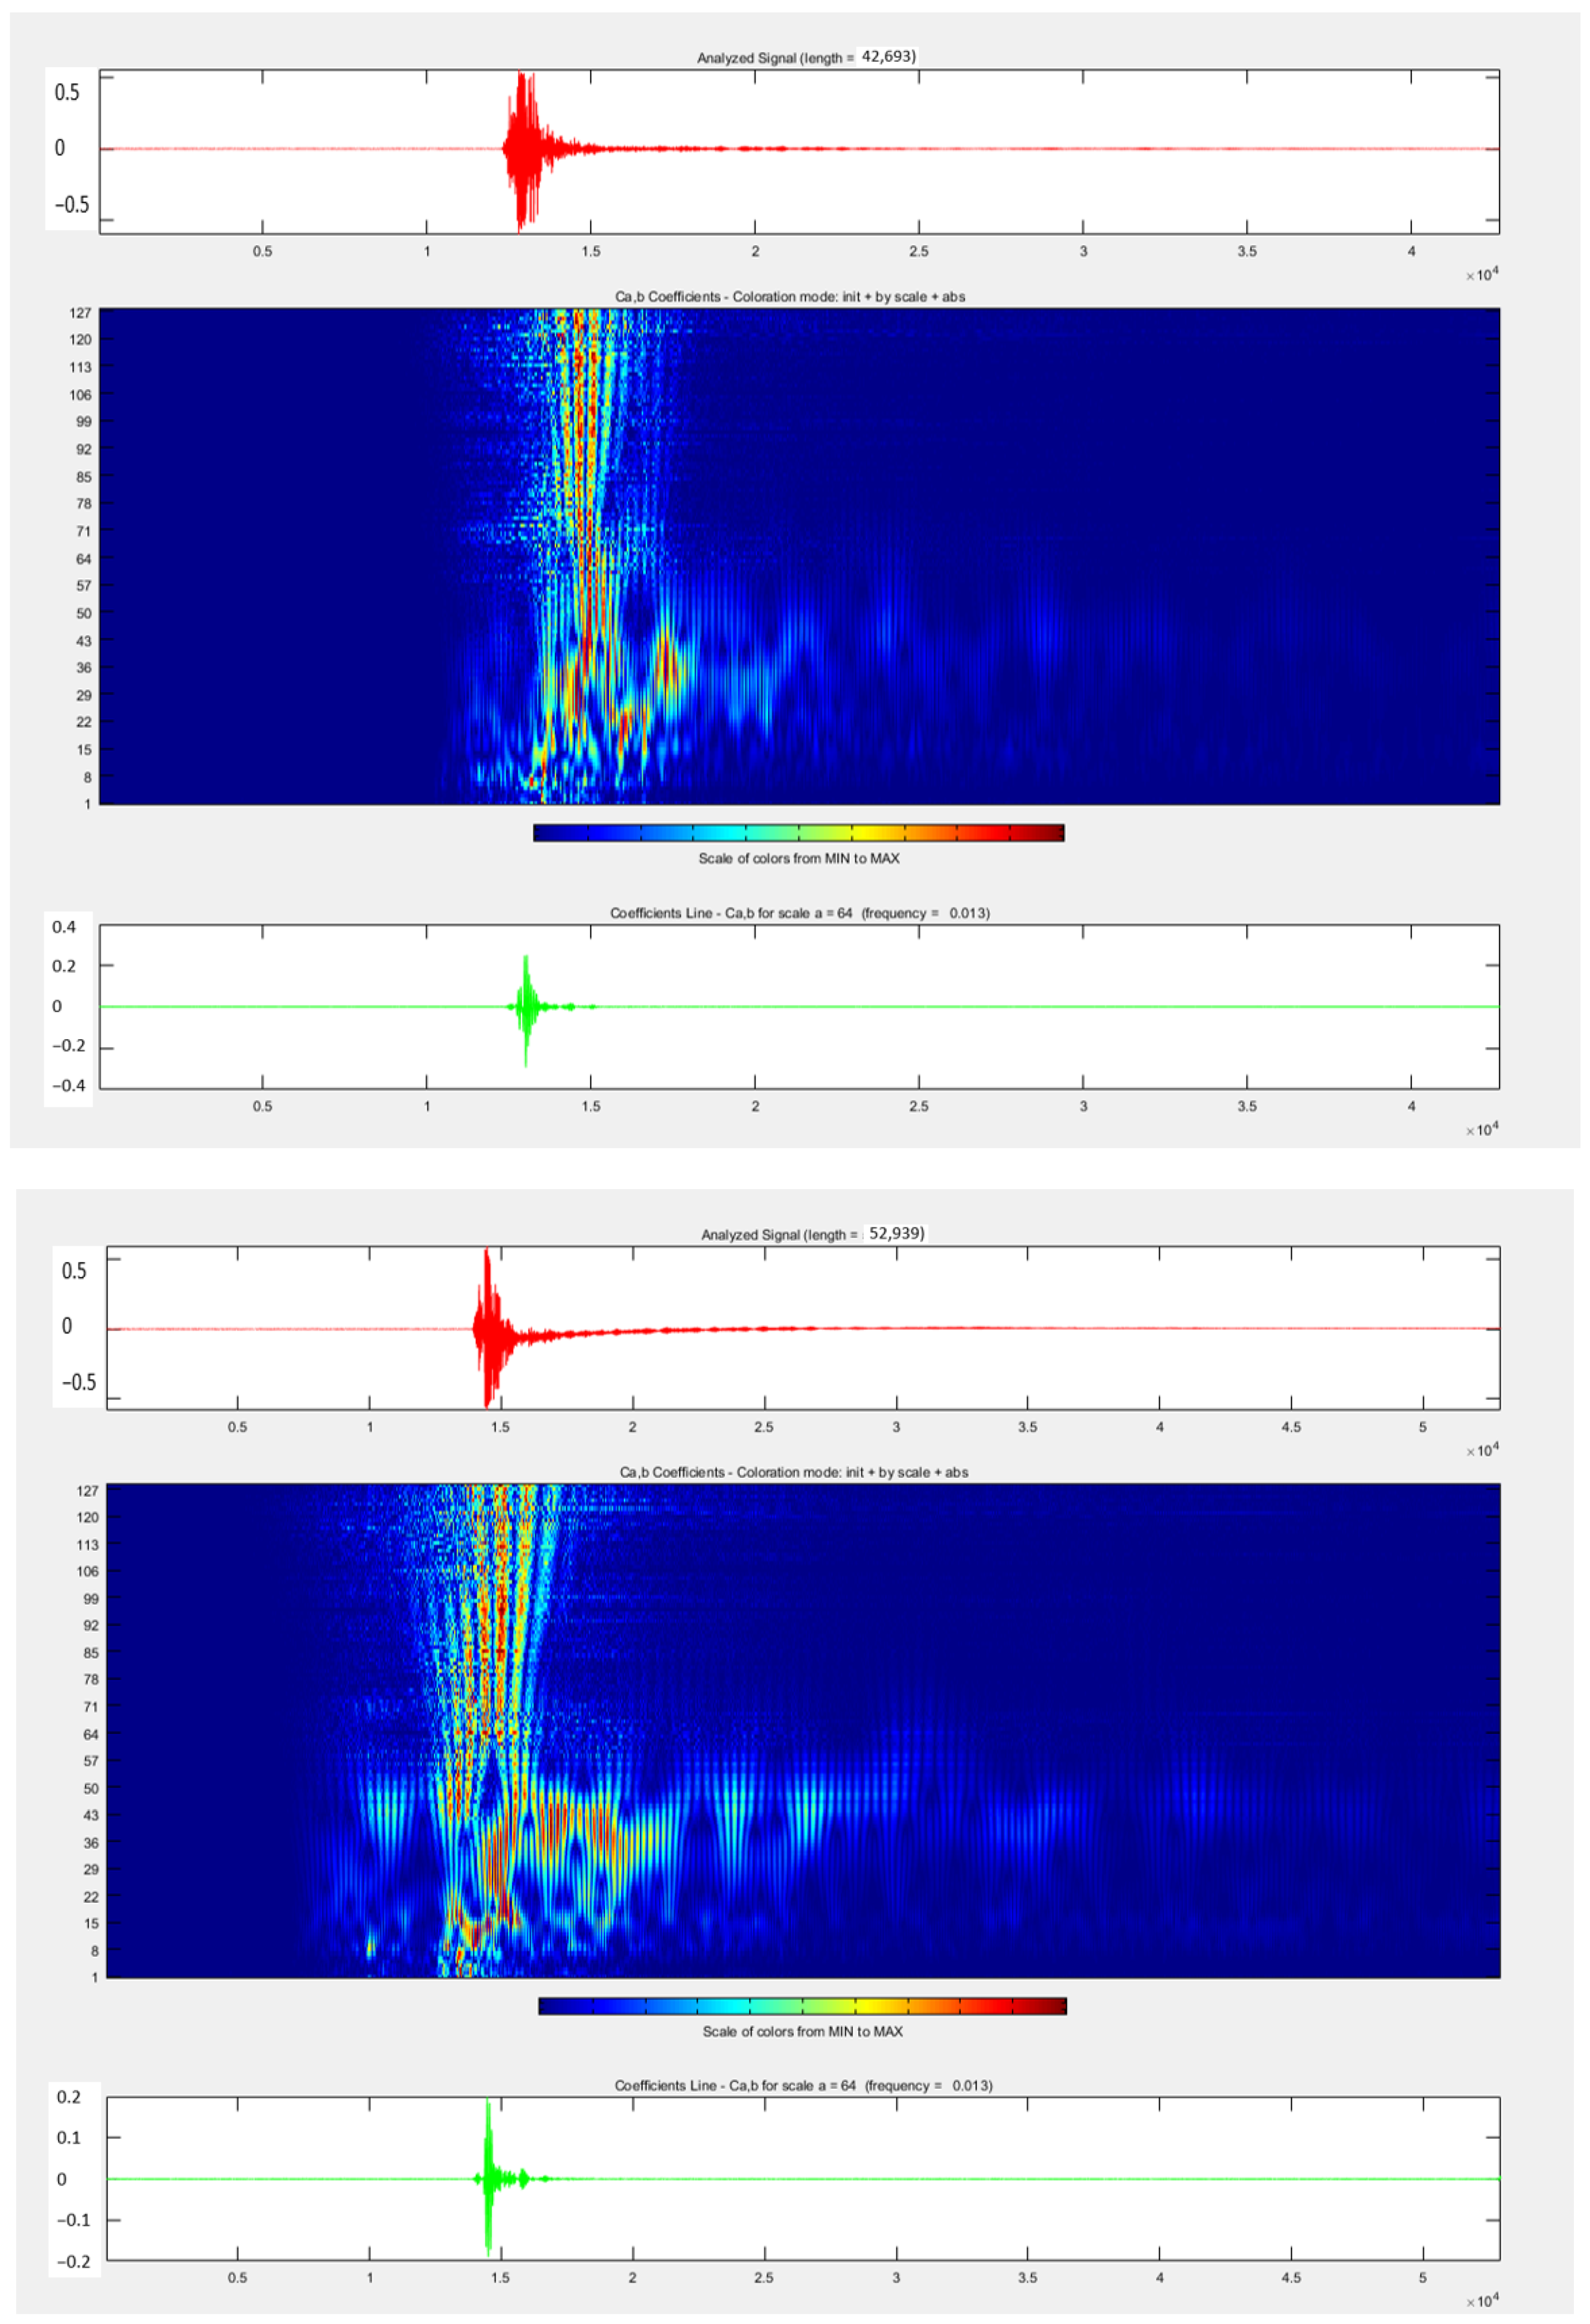
The expected changes concern non-linear phenomena. Hence, we can expect that the observed changes are unlikely to occur in the principal components of the amplitudes or harmonics. As previously stated, the coherence function for the tested blade clearly indicates the existence of three distinct spectra. The tested acoustic emission signal is perceived as surface, longitudinal, and transverse wave components. A careful analysis of the characteristic frequencies clearly distinguishes the band associated with the discontinuity of the blade material. It can, therefore, be concluded that, in this case, the band above 25 kHz is characteristic of the disturbance created by the damage to the leading edge of the turbine blade. To make the characteristic bands more visible, Figure 9 shows the spectrum of the coherence function with the individual phenomena clearly separated. The lower frequency values (up to approximately 15 kHz) are, therefore, the zone associated with vibrations of the column or possible damage related to devices located in the nacelle, the second zone (between 15 kHz and 25 kHz) entails phenomena characteristic of the non-stationarity of the wind force, while the highest frequencies (above 25 kHz) indicate damage to the wind turbine blade. In order to analyze, especially, the first zone (up to 15 kHz) and locate the cause of the disruption/damage, it would be necessary to compare the data to those read from the vibration sensors located on the column, or to perform full diagnostics of the equipment systems or, in general, devices located in the nacelle. Using wavelet analysis of the considered AE signals, the existence of characteristic frequencies associated with the damage was confirmed—Figure 10.
To verify the test results, the authors performed a comparative wavelet analysis of the blade without defects and the section with the previously described damage. The wavelet analysis (Figure 11) also confirms the existence of clearly defined bands associated with the damage.
In the band for 25–45 kHz, the influence of blade faults can be observed. This type of spectrum in the indicated frequency band results from the formation of additional signal sources associated with wave reflections. The fault (material discontinuity) generates a component of acoustic emission energy that is visible as wavelet coefficients (which are a function of scale and position) with an extended duration. This is mainly due to internal reflections of the elastic wave, which generates additional (visible in the figure) frequency bands of the AE signal.

4. Conclusions

Damage to wind turbine blades significantly contributes to downtime of the entire power plant. The acoustic emission signal in the blade, loaded with wind force, is examined, which in turn is perceived as the surface, longitudinal, and transverse components of the wave. Research shows that, in selected frequency bands (usually at high or very high frequencies—above 25 kHz), the coherence function is sensitive to even minor damage to the blade surface structure. The entire band associated with severe blade damage occurs in the 25–45 kHz range. It is shown that there is a clear spectral characteristic of the damaged blade, and the coherence function of the tested blade clearly indicates the existence of three distinct bands. The first band concerns the lowest harmonics (i.e., related to the transmission of low-frequency vibrations, e.g., through a wind turbine tower or the failure of gears or other devices in the nacelle), the second band is the zone of non-linear interactions (related, among others, to the non-stationarity of wave or wind action), and the third band is associated with the clearly visible elastic wave spectrum in the acoustic emission associated with the blade failure.
These characteristic frequencies of individual phenomena interacting with the blade of a working turbine provide the basis for the introduction of filters (or narrowband sensors) that will increase the quality of the diagnosis itself. Further research by the authors leading to determining the type of damage will consist of narrowing down and detecting frequency bands that are characteristic of various (specific) discontinuities. Although the method has been verified for a specific type of damage to the leading edge, development of the analysis will allow for the precise extraction and identification of the frequencies responsible for the comprehensive and detailed identification of a given type of damage in the verified and described characteristic band. Moreover, the proposed diagnostic method, in addition to identifying blade damage in the form of “with or without defects”, allows for finding the frequencies responsible for the operation of devices installed in the nacelle. This, in turn, generates a process of accurate diagnosis (separating overlapping phenomena) using known methods, e.g., vibration, or possibly stopping the turbine when it is determined that the permissible values have been exceeded.
The above conclusions indicate that the proposed coherence function is capable of being suitable for the requirement of the online crack detection of WTBs in the field with instant results. The outcomes of this research provide a potential tool for service engineers equipped with portable HD PC to analyze measured AE signals during monitoring to detect damages that may occur in wind turbine blades at each stage of operation, including quality control after production.
The accuracy and reliability of acoustic emission technology for wind turbine blade inspection is a matter of using appropriate AE signal recorder filters. Moreover, by using appropriate sensors, it is possible to non-invasively and remotely determine the precise location of the blade damage. It is likely that the development of interconnected microsensors will significantly improve the application of the diagnostic method proposed by the authors. Using a matrix of interconnected sensors placed over the entire blade would be an ideal solution. This would be a measurement similar to those currently used in diagnosis which use acoustic emission, e.g., of pressure vessels. However, the use of the coherence function itself expands the possibilities by quickly recognizing the frequency bands associated with the relevant damage and excluding possible "parasitic" signals coming from sources other than the blade.

Author Contributions

Conceptualization, A.B.; methodology, A.B.; validation, A.B. and J.B.D.; formal analysis, A.B., J.B.D., P.B. and E.F.; investigation, A.B. and J.B.D.; resources, A.B., J.B.D., P.B. and E.F.; data curation, A.B., J.B.D. P.B. and E.F.; writing—original draft preparation, A.B. and J.B.D.; writing—review and editing, A.B., J.B.D., E.F.; supervision, A.B. All authors have read and agreed to the published version of the manuscript.

Funding

This research received no external funding.

Data Availability Statement

The data presented in this study are available on request from the corresponding author. These data have not been the subject of any publication yet.

Conflicts of Interest

The authors declare no conflict of interest.

References

  1. Carroll, J.; McDonald, A.; McMillan, D. Failure rate, repair time and unscheduled O&M cost analysis of offshore wind turbines. Wind Energy 2016, 19, 1107–1119. [Google Scholar] [CrossRef]
  2. Mishnaevsky, L., Jr.; Thomsen, K. Costs of repair of wind turbine blades: Influence of technology aspects. Wind Energy 2020, 23, 2247–2255. [Google Scholar] [CrossRef]
  3. McMillan, D.; Ault, G.W. Quantification of Condition Monitoring Benefit for Offshore Wind Turbines. Wind Energy 2007, 31, 267–285. [Google Scholar] [CrossRef]
  4. Katsaprakakis, D.A.; Papadakis, N.; Ntintakis, I. A Comprehensive Analysis of Wind Turbine Blade Damage. Energies 2021, 14, 5974. [Google Scholar] [CrossRef]
  5. Márquez, F.P.G.; Chacón, A.M.P. A review of non-destructive testing on wind turbines blades. Renew. Energy 2020, 161, 998–1010. [Google Scholar] [CrossRef]
  6. Du, Y.; Zhou, S.; Jing, X.; Peng, Y.; Wu, H.; Kwok, N. Damage detection techniques for wind turbine blades: A review. Mech. Syst. Signal Process. 2020, 141, 106445. [Google Scholar] [CrossRef]
  7. Guo, J.; Liu, C.; Cao, J.; Jiang, D. Damage identification of wind turbine blades with deep convolutional neural networks. Renew. Energy 2021, 174, 122–133. [Google Scholar] [CrossRef]
  8. Dhanraj, J.; Sugumaran, V. Fault Diagnosis for Wind Turbine Blade through Vibration Signals Using Statistical Features and Random Forest Algorithm. Int. J. Pharm. Technol. 2017, 9, 28684–28696. [Google Scholar]
  9. Kaewniam, P.; Cao, M.; Alkayem, N.F.; Li, D.; Manoach, E. Recent advances in damage detection of wind turbine blades: A state-of-the-art review. Renew. Sustain. Energy Rev. 2022, 167, 112723. [Google Scholar] [CrossRef]
  10. Available online: https://elektrownie-tanio.net/lopaty.html,%20Łopaty%20wirnika (accessed on 25 November 2022). (In Polish).
  11. Bejger, A.; Frank, E.; Bartoszko, P. Failure Analysis of Wind Turbine Planetary Gear. Energies 2021, 14, 6768. [Google Scholar] [CrossRef]
  12. Wind Turbine Blade Repair and Structural Profiles. Available online: https://www.gurit.com/en/our-business/industries--markets/wind (accessed on 11 April 2022).
  13. Zhang, R.G.; Wang, B.J.; Wang, J.B.; Lei, H.; Xia, S.C. Wind turbine blade failure case analysis and control measures. J. Phys. Conf. Ser. 2021, 2047, 012014. [Google Scholar] [CrossRef]
  14. Dimitrova, M.; Aminzadeh, A.; Meiabadi, M.S.; Karganroudi, S.S.; Taheri, H.; Ibrahim, H. A Survey on Non-Destructive Smart Inspection of Wind Turbine Blades Based on Industry 4.0 Strategy. Appl. Mech. 2022, 3, 1299–1326. [Google Scholar] [CrossRef]
  15. Tao, T.; Liu, Y.; Qiao, Y.; Gao, L.; Lu, J.; Zhang, C.; Wang, Y. Wind turbine blade icing diagnosis using hybrid features and Stacked-XGBoost algorithm. Renew. Energy 2021, 180, 1004–1013. [Google Scholar] [CrossRef]
  16. Liu, Z.; Zhang, L.; Carrasco, J. Vibration analysis for large-scale wind turbine blade bearing fault detection with an empirical wavelet thresholding method. Renew. Energy 2020, 146, 99–110. [Google Scholar] [CrossRef]
  17. Khazaee, M.; Derian, P.; Mouraud, A. A comprehensive study on Structural Health Monitoring (SHM) of wind turbine blades by instrumenting tower using machine learning methods. Renew. Energy 2022, 199, 1568–1579. [Google Scholar] [CrossRef]
  18. Bejger, A.; Drzewieniecki, J.B. A New Method of Identifying the Limit Condition of Injection Pump Wear in Self-Ignition Engines. Energies 2020, 13, 1601. [Google Scholar] [CrossRef]
  19. Wang, W.; Xue, Y.; He, C.; Zhao, Y. Review of the Typical Damage and Damage-Detection Methods of Large Wind Turbine Blades. Energies 2022, 15, 5672. [Google Scholar] [CrossRef]
  20. Chen, B.; Yu, S.; Yu, Y.; Zhou, Y. Acoustical damage detection of wind turbine blade using the improved incremental support vector data description. Renew. Energy 2020, 156, 548–557. [Google Scholar] [CrossRef]
  21. Liu, P. Acoustic Emission Signal Analysis and Damage Mode Identification of Composite Wind Turbine Blades; Elsevier: Amsterdam, The Netherlands, 2023; ISBN 978-0-323-88652-9. [Google Scholar]
  22. Manwell, J.F.; McGowan, J.G.; Rogers, A.L. Wind Energy Explained: Theory, Design and Application; John Wiley & Sons: Hoboken, NJ, USA, 2010; ISBN 9780470015001. [Google Scholar]
  23. Kalmikov, A. Wind Power Fundamentals. In Wind Energy Engineering; Academic Press: Cambridge, MA, USA, 2017; pp. 17–24. [Google Scholar] [CrossRef]
  24. Ding, S.; Yang, C.; Zhang, S. Acoustic-Signal-Based Damage Detection of Wind Turbine Blades—A Review. Sensors 2023, 23, 4987. [Google Scholar] [CrossRef] [PubMed]
  25. Batko, W.; Dąbrowski, Z.; Kiciński, J. Nonlinear Effects in Technical Diagnostics; Publishing and Printing—Polish Academy of Sciences PAN & Institute for Sustainable Technologies: Warsaw, Poland, 2008; ISBN 13 978-8372047489. [Google Scholar]
  26. Coherence Function. Available online: https://ccrma.stanford.edu/~jos/st/Coherence_Function.html (accessed on 11 April 2022).
Figure 3. Inside view of a wind turbine blade divided by shear web (a,b), (1) revealing possibilities of placing suitable measuring sensors for diagnosis on lower (2) and upper (3) surface sandwich shell. Root section visible at the end of blade (4).
Energies 16 07474 g003
Figure 4. Scheme of design of the proposed diagnostic method targeting wind turbine blade damage.
Energies 16 07474 g004
Figure 5. Algorithm for wind-turbine blade diagnostics using elastic waves.
Energies 16 07474 g005
Figure 6. Damage to the leading edge of a wind turbine blade and a diagram of the acoustic emission signal measurement.
Energies 16 07474 g006
Figure 7. Time signal, EA amplitude—voltage value [μV]—blade without damage.
Energies 16 07474 g007
Figure 8. Time signal, EA amplitude—voltage value [μV]—blade with a damaged leading edge.
Energies 16 07474 g008
Figure 9. AE wave spectrum of the coherence function for signals from a wind turbine: left section up to approximately 15 kHz—zone associated with vibrations of the column or nacelle, middle zone between 15 kHz and 25 kHz—phenomena characteristic of the non-stationarity of the wind force, right section above 25 kHz—indicates damage to the wind turbine blade. (Y-axis—dimensionless unit, equal to 1 when dealing with two identical signals).
Energies 16 07474 g009
Figure 10. Amplitude–time–frequency spectrum of the coherence function with clearly separated characteristic bands (Z-axis—dimensionless unit, equal to 1 when dealing with two identical signals).
Energies 16 07474 g010
Figure 11. Wavelet analysis of elastic wave acoustic emission measurements for a blade. Upper: without defects and lower: with a defect.
Energies 16 07474 g011
Table 1. Major component outage, typical downtimes [3].
Component OutageDays Downtime OnshoreDays Downtime Offshore
Gearbox3041
Generator2132
Blade3041
Electronic unit12
Table 2. The most frequent causes of downtime of wind turbines in Poland in third and fourth year of their operation in [h].
UnitDowntime [h]Percentage of Damage
Warranty repairs and periodic inspections1647,0325%
Grid1440,1022%
Yaw system1221,7018%
Blades912,0914%
Generator787,9912%
Gearbox486,187%
Air brake94,031%
Hydraulic systems72,721%
Disclaimer/Publisher’s Note: The statements, opinions and data contained in all publications are solely those of the individual author(s) and contributor(s) and not of MDPI and/or the editor(s). MDPI and/or the editor(s) disclaim responsibility for any injury to people or property resulting from any ideas, methods, instructions or products referred to in the content.