Article

Exhaust Emissions from Euro 6 Vehicles in WLTC and RDE—Part 1: Methodology and Similarity Conditions Studies

Faculty of Civil and Transport Engineering, Poznan University of Technology, pl. M. Sklodowskiej-Curie 5, 60-965 Poznan, Poland
*
Author to whom correspondence should be addressed.
Energies 2023, 16(22), 7465; https://doi.org/10.3390/en16227465
Submission received: 18 October 2023 / Revised: 4 November 2023 / Accepted: 6 November 2023 / Published: 7 November 2023

Abstract

:
The article is an attempt to perform an ecological assessment of passenger cars with various types of engines in road emission tests. The main research problem and, at the same time, the goal was to develop a method for determining the exhaust emissions from motor vehicles in real traffic conditions based on results obtained in homologation tests. The tests were carried out on vehicles equipped with gasoline, diesel, and hybrid engines, and the obtained results were analyzed. All of the selected vehicles were of the same class—passenger cars, with a similar curb weight, similar maximum engine power, and in the same emission class (Euro 6d). The authors compared the dynamic parameters of vehicle motion in established emission tests: Worldwide harmonized Light vehicles Test Cycles and Real Driving Emissions. Four procedures were used to analyze and compare the operating conditions of the vehicles in the WLTC and RDE tests, differing in how the phases in the tests were divided as well as having a different methodology for determining the road emissions in the tests. The procedures were as follows: WLTC (where the test was divided and the determination of the road emission of exhaust gases was carried out according to the standard WLTP procedure), RDE (the road test was divided into sections and the exhaust emission was determined according to the standard RDE procedure), WLTC1+2 (the test was divided into phases: 1 + 2, 3, and 4; a combination of phases 1 and 2 corresponding to the urban section of the RDE test), WLTCRDE (where drive phases were divided and emissions determined in the same way as in the RDE procedure, which assumes the division of the test into sections based on vehicle speed). The implementation of the research task in the form of an algorithm procedure when comparing the dynamic parameters of the movement in the WLTC and RDE tests is the leading goal presented in this article. The division of the WLTC test into sections (urban, rural, and motorway) according to the RDE procedure and also the calculation of the total emissions in the test according to this procedure resulted in obtaining similar road emission values in the test.

1. Introduction

The rapid acceleration of urbanization is noticeable all over the world. Such intensification of economic development can be determined using the metric of mobility, i.e., freedom in the movement of people and transport of goods. Of all modes of transport, road transport gives the greatest sense of flexibility and independence. However, this form of transport is also burdened with many disadvantages. The main one is the structure of the automotive market, which mainly consists of vehicles powered by internal combustion engines. This is associated with excessive exhaust emissions and, consequently, a negative impact on air quality, which in turn leads to increased risks not only to the environment, but also to human health.
According to data from the European Environment Agency (EEA) [1], the transport sector is responsible for approximately 25% of the total greenhouse gas emissions in the European Union. Moreover, about 70% of this value comes from road transport [2]. Data recorded in 2020 shows that in the case of road and non-road transport, it is necessary to intensify actions aimed at reducing the emissions of nitrogen oxides, carbon monoxide and particulate matter (PM10 and PM2.5). Undoubtedly, reducing the excessive emissions of these pollutants poses another challenge in the pursuit of climate neutrality.
In order to reduce the negative impact of the transport sector on the environment, legislators have been introducing increasingly restrictive regulations for nearly 30 years. One of the most important legislative changes was regulating the methods of monitoring and controlling exhaust emissions from vehicles. As a result, two measurement tests have been used in Europe since 2019: laboratory (on a chassis dynamometer) and road tests (in real operating conditions). According to the legislative intent, these tests are to complement each other, thanks to which the result of exhaust emissions is to be more reliable.

2. Research Problem

The article authors approached the issues regarding the measurement procedures for distance-specific emission (further referred to as road emission) tests (WLTC and RDE) for passenger cars with various powertrains. The existing legal provisions, research, and results published in the literature and in the official documents and interpretations of the European Commission focus mainly on the analysis of emission tests as separate and independent procedures. However, correlating these procedures may reduce the number of tests performed. This could be possible by using the results obtained in the laboratory test to estimate the results that would be obtained in the road test. The main goal of the article is to create and propose a new research tool based on the results of the analysis of the ecological parameters of vehicles according to the applicable procedures for measuring exhaust emissions. The goal of the article is in line with the current trend of seeking pro-ecological solutions to reduce air pollution by improving and unifying procedures for monitoring and controlling exhaust emissions from road transport. This approach should make it possible to reduce the number of tests that need to be performed, which would directly reduce the time and costs of testing vehicles. The first stage (chassis dynamometer, WLTC tests) concerned the measurement of the driving parameters of three vehicles (gasoline, diesel, hybrid). In the second stage (the RDE tests), the driving parameters of vehicles in real driving conditions were determined. In the third stage, the static and dynamic conditions of motion in different configurations were compared.

3. Literature Review

The implementation of these changes has visibly accelerated with the introduction of the Euro 6 standard and its components (6c, 6d-temp, 6d). This was also the time when the most notable modifications were made to the measurement method, i.e., tests for measuring exhaust emissions. Not only has the NEDC laboratory test been changed (to WLTC), but a new emission test has also been introduced which is carried out in real driving conditions (RDE). The above activities were the result of many years of research on the reliability of the emission results obtained using the older test methods, but they also hinged on the fast development of exhaust aftertreatment technologies used in motor vehicles. Thanks to them, it was possible to introduce increasingly restrictive limits. The most important events in recent years include the Paris Agreement (December 2015). It was the first legally binding climate agreement [3]. In line with its provisions, the European Commission committed to presenting its long-term emissions reduction strategy and updating its climate plans before the end of 2020, which lead to committing to reduce emissions by 55% by 2030 (compared to 1990 levels). Regulation EU 2019/631 of the European Parliament and of the Council [4] also sets a new level of CO2 emissions of up to 95 g/km for the entire European Union vehicle fleet. To achieve this task, the transformation of the entire transport sector towards zero emissions had to be accelerated. This means that by 2030, it will be necessary to significantly increase the share of zero- and low-emission vehicles in the automotive market. This regulation also defines the role of the European Union in the automotive market. It was noted that competition was increasing and for the European Union countries to maintain their position, it was necessary to transform the automotive sector. Such a task can be accomplished, among others, by incorporating new technologies in the field of electric drive mechanisms and the mobility of collaborative, connected and automated vehicles [4]. Lawmakers expect that incentives for the automotive industry to invest in new technologies will also contribute to achieving this goal. The effects that the specified actions had will be assessed in 2024.
The WLTC test is part of the WLTP procedure. It is performed under laboratory conditions using a chassis dynamometer, with varying test requirements depending on the vehicle type. The article discusses only one type—class 3b vehicles, i.e., those with a vehicle power to weight ratio in the ready-to-drive condition of >34 W/kg and capable of moving at a maximum speed equal to or greater than 120 km/h. The division of test values into individual test phases (low, medium, high and very high) was as specified in Regulation 2019/631 [4]. The test duration was 30 min and the total distance travelled was 23.27 km. The low speed phase accounts for 13.3% of the total distance, the medium speed phase for 20.4%, the high speed phase for 30.8%, and the highest speed phase for 35.5%. The WLTC test is the successor and replacement of the NEDC test. The main difference is the increased driving dynamics of the vehicle in the laboratory test. This also means that more data needs to be monitored and checked. The general guidelines for the test (Table 1) include the percentage share of stops, average speed (excluding stops), and the maximum values of speed and acceleration in individual test phases.
The WLTC laboratory test is complemented by the RDE road test [6,7,8,9]. One of the key factors that prompted lawmakers to develop the RDE test was the discrepancies observed between the exhaust emission results obtained in the laboratory (using the NEDC test) and during real driving when measured with mobile measurement equipment. The new procedures for passenger cars were introduced in two stages. In the first stage (from 1 September 2017), the RDE road test was used only for monitoring, while in the second stage (from 1 September 2019) it became part of the approval procedure. The use of this test was intended to enable the quantitative determination of vehicle emissions using PEMS (portable emissions measurement systems) in various vehicle operating conditions. The RDE test needs to meet a number of requirements for the drive test to be considered correctly performed (valid). Regulation 2018/1832 [9] precisely specifies not only the test duration, which ranges from 90 to 120 min, but also the minimum distance of each section and its share in the total duration of the test.
There are a few main test guidelines for how a passenger car should meet the Euro 6d emission standard (Table 2). The RDE procedure requirements apply not only to the drive itself, but also to the measuring equipment that is used. The test procedure indicates that the installation of the instrumentation should be carried out in such a way as to minimize its impact on exhaust emissions and the operation of the vehicle, including weight and aerodynamics. Therefore, the research equipment is powered from an external power source.
One of the most important requirements of laboratory tests is the best possible representation of real driving conditions while ensuring the reliability of the obtained results. The WLTC laboratory test cycle assumes a drive cycle under specific measurement conditions. However, during vehicle operation in the real world, changes in temperature and air pressure, driving style, and the characteristics of the test route may result in significantly different values of fuel consumption and exhaust emissions. For a manufacturer to demonstrate compliance with all the terms of the RDE procedure, it becomes necessary to test multiple prototype vehicles and powertrains. This ultimately becomes a costly solution and extends the development timeframe. As mentioned previously, this procedure often requires multiple tests, both in the laboratory and on the road, which in turn involves increased financial costs and time commitments. Therefore, it becomes increasingly necessary to develop an alternative test method that would provide a better representation of real driving conditions and would enable the individualization of the test, e.g., depending on the type of vehicle or type of drive [10,11,12]. The authors of [13] also attempted to correlate the WLTC test with the RDE, in which they defined the basic steps for conducting the RDE test cycle under laboratory conditions. They analyzed measurement uncertainties and the repeatability of the results obtained in subsequent test trials carried out in the same conditions. In the case of the road emissions of nitrogen oxides from vehicles equipped with a diesel engine, the authors obtained measurement uncertainties of 3.13% (in the RDE test) and 3.9% (in the WLTC test). Due to RDE test procedure requirements, the test must be preceded by careful route planning in order to reduce the chance of the test becoming invalid and thus reduce test potential costs of repeated testing. In [14], the authors presented a procedure for creating a test cycle for measuring emissions in real driving conditions, which minimizes the test distance while meeting the legal regulations regarding road conditions. Based on [14], the feasibility of the cycle was verified by performing several tests on the same test route, but under different vehicle operating parameters. The authors found that the impact of driving conditions can be assessed in detail using traffic simulation software, e.g., SUMO 1.18.0 (Simulation of Urban Mobility), created by the German Transport Institute (DLR—Deutsches Zentrum für Luft- und Raumfahrt). Thanks to this, the authors of [14] developed a route that meets the requirements of Regulation 2016/646 [7], but most importantly, allows for reducing the costs of conducting the test by keeping the total test distance to a minimum. Lee et al. [15] proposed a method for NOx emissions assessment in road tests using an artificial neural network. Road tests and other parameters related to driving conditions, weather conditions, and vehicle parameters (in particular, the types of exhaust aftertreatment systems) were used as input data. The proposed model was used to predict the concentration of nitrogen oxides emitted by the vehicle in real driving conditions in regular traffic. Previti et al. [16] created a hybrid vehicle model that reflected the performance of the WLTC test with high accuracy. The error between the values obtained from the experiment and the simulation was 3.89% for fuel consumption and 6.8% for vehicle energy consumption. A similar simulation was performed by Maddumage et al. [17] for a three-wheeled hybrid vehicle. The results obtained in the UDC test differed by 4% for fuel consumption, by 3% for HC emissions, by 10% for CO emissions, and by 8% for NOx emissions. However, the differences in the experimental and simulation results in the road test were 10% for fuel consumption, 9% for HC emissions, 24% for CO emissions, and 6% for NOx emissions. Krysmon et al. [18] created software that, together with a hardware-in-the-loop (HiL) station, made it possible to simulate RDE tests, mainly of hybrid drive systems. The test results outlined in the paper showed that the calibration process was shortened by 20% and, at the same time, 98% compliance was achieved in exhaust emissions and fuel consumption. Zanelli et al. [19] used auto-adaptive energy management strategies for the predictive assessment of CO2 road emissions in hybrid PHEV vehicles. Using NEDC and WLTC test data, they determined the road emission values in the RDE test with a ±1% accuracy. Such accuracy was achieved thanks to the appropriate management of the vehicle’s SoC indicator. The aspect of energy management in vehicles was also the research subject of Hegde et al. [20], which reduced fuel consumption (by approximately 1%) in the WLTC test exclusively through vehicle energy management. Molina Campoverde [21] used artificial neural networks to predict fuel consumption in the RDE test using WLTC test data. Using the created algorithm, the author obtained a vehicle fuel consumption error of 1.4% compared to the actual value obtained in real tests. Tomanik et al. [22] used artificial neural networks to assess vehicle fuel consumption using data drawn from the OBD system (vehicle speed, rpm, torque, fuel consumption rate, acceleration). For several of the conducted tests, the results obtained using the model and in the experiment were 98.8% similar. To evaluate road tests, Pulvirenti et al. [23] used software from autonomous vehicles and achieved an approximately 10-fold time reduction in RDE vehicle tests. They created a speed range within which the speed variable of a moving vehicle can change and based on this, they estimated various scenarios with this variable change. Knowing the geometry of the route, they determined the vehicle’s energy demand. Gebisa et al. [24], after analyzing several dozen RDE test results, formulated the basic factors determining the divergence of results between stationary and road tests. The emission results of RDE tests using PEMS were greater than in stationary laboratory tests; the gap between RDE and WLTC was caused by cold temperatures, road grade, route types, drivers’ dynamics, and analysis tools. Research published by Pielecha et al. [25] and Kurtyka [26,27] confirms that the ecological assessment of vehicles does not only apply to vehicles powered by traditional fuels, but also to vehicles powered by fuel cells. The evolution of these drives is also heading towards reducing energy consumption, as evidenced by the reduction in the energy demand of current generation fuel cell vehicles by approximately 10% compared to their previous generations. The results obtained by Dollinger et al. [28] suggested that for electric cars, to determine the energy consumption of these vehicles, the results of the WLTP test will also be used. Currently, BEVs have energy consumption values in the range of 20–30 kWh/100 km, and FCEVs at the level of 25–40 kWh/100 km. However, such vehicles are also expected to be tested in road tests, where the dynamic parameters could be borrowed from RDE tests.
For engine or aftertreatment device development, it is very useful to reduce testing and define one or more laboratory cycles that can substitute on-road tests. However, for vehicle type-approval, the RDE tests are very important. The introduction of RDE is related to the fact that vehicles used to have different behavior in the laboratory and on the road (Dieselgate). Comparing WLTC and RDE dynamic parameters is a very useful tool for emissions comparison, since higher RDE emissions for similar trips can be considered suspicious. Another advantage of RDE tests is that they give a much higher degree of freedom for testing. For example, a test at the edge of dynamicity is much different than a low dynamicity test. Another example is ambient temperature and its effect on emissions. Thus, RDE has a much higher potential, at least for the few pollutants that are regulated (NOx, PN). Thus, it is still necessary to fill the gap by proposing a method for estimating exhaust emissions in the RDE test based on the results obtained under laboratory conditions. The first element will be the comparison of vehicle driving conditions in the tests and, based on this data, drawing conclusions about the possibility of comparing exhaust emissions.

4. Research Method

4.1. Test Objects

Three vehicles (passenger cars) with different power supply types and drive systems were tested as part of the conducted research, these were:
  • A conventional vehicle equipped with a gasoline engine with direct injection and a displacement of 1.6 dm3;
  • A conventional vehicle equipped with a diesel engine with common rail direct injection, boosted with a turbocharger, having a displacement of 2.0 dm3;
  • A hybrid vehicle equipped with two engines: a gasoline internal combustion engine with direct gasoline injection and a displacement of 1.8 dm3 along with an electric motor.
The detailed characteristics of the tested vehicles are provided in Table 3. A common feature of the selected vehicles (Figure 1) was the vehicle class—vehicles of the M1 category (passenger cars), with a similar curb weight (range 1350–1584 kg) and a similar maximum power of the internal combustion engine (73–81 kW). The vehicles also represented the same emission class (Euro 6d). The mileage of the vehicles was similar (approximately 30,000 km), and they were mostly operated in urban areas.

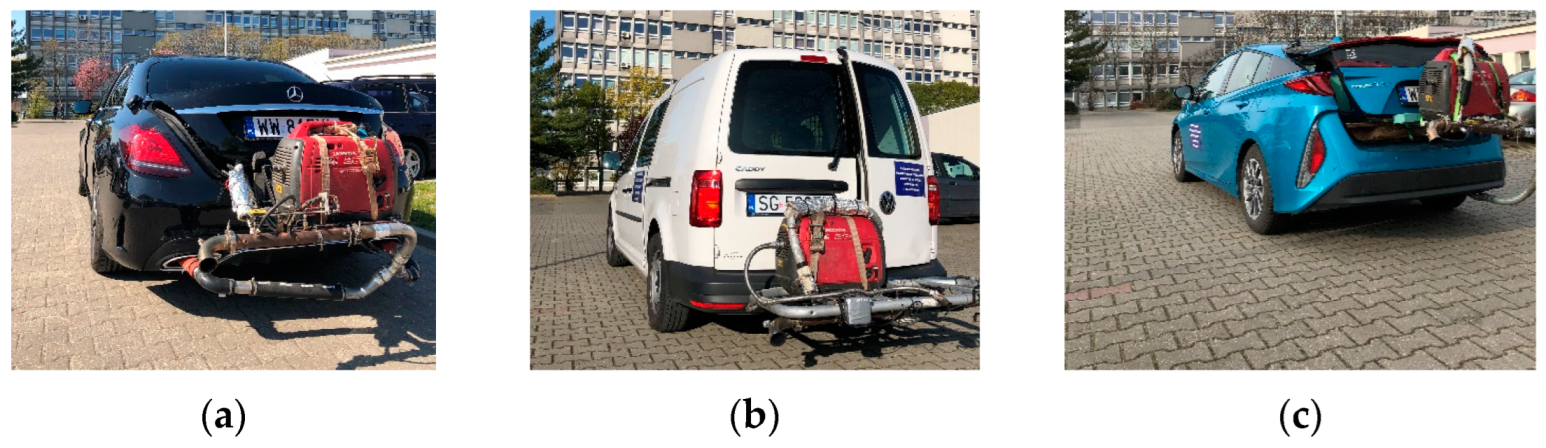
4.2. Research Equipment Used

The tests were carried out on a chassis dynamometer. The laboratory was equipped with a climate chamber, which was used to achieve an air temperature in the range of −35 °C to 60 °C (with an accuracy of ±1.2 °C). The absolute humidity during exhaust emission measurement was monitored in the range of 5.5 to 15.0 g of water per 1 kg of dry air (for temperature values between 20 °C and 35 °C). During the tests, an AVL 4WD chassis dynamometer was used, which was designed for testing passenger cars with both front and rear drive. A fan with a 31.4 kW engine was placed in front of the chassis dynamometer, which simulated air flow from 0 to 125 km/h (proportional to the car’s speed on the chassis dynamometer).
The speed curves in the WLTC test for each tested vehicle (Figure 2) were provided along with the characteristics of the most important parameters. When comparing the data, it should be noted that the values change within a quite narrow range, which results from the type approval requirements. Small changes result from different vehicle mass values, which were associated with the adoption of different inertial parameters for the chassis dynamometer.
The WLTC test is identical for all vehicles tested in this study, but there may be small (almost negligible) differences due to vehicle mass as well as due to driver error (there is a defined limit for driver errors).

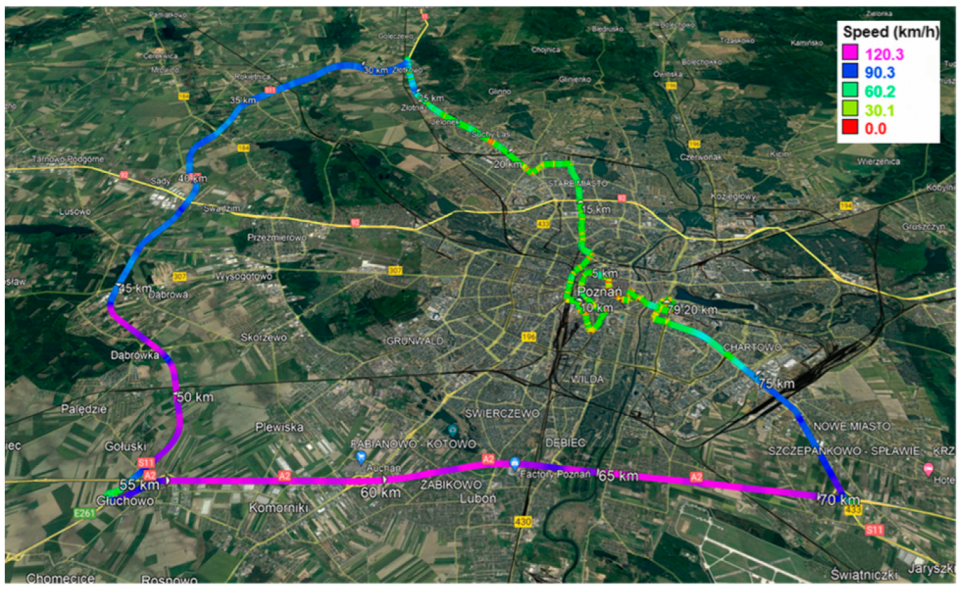
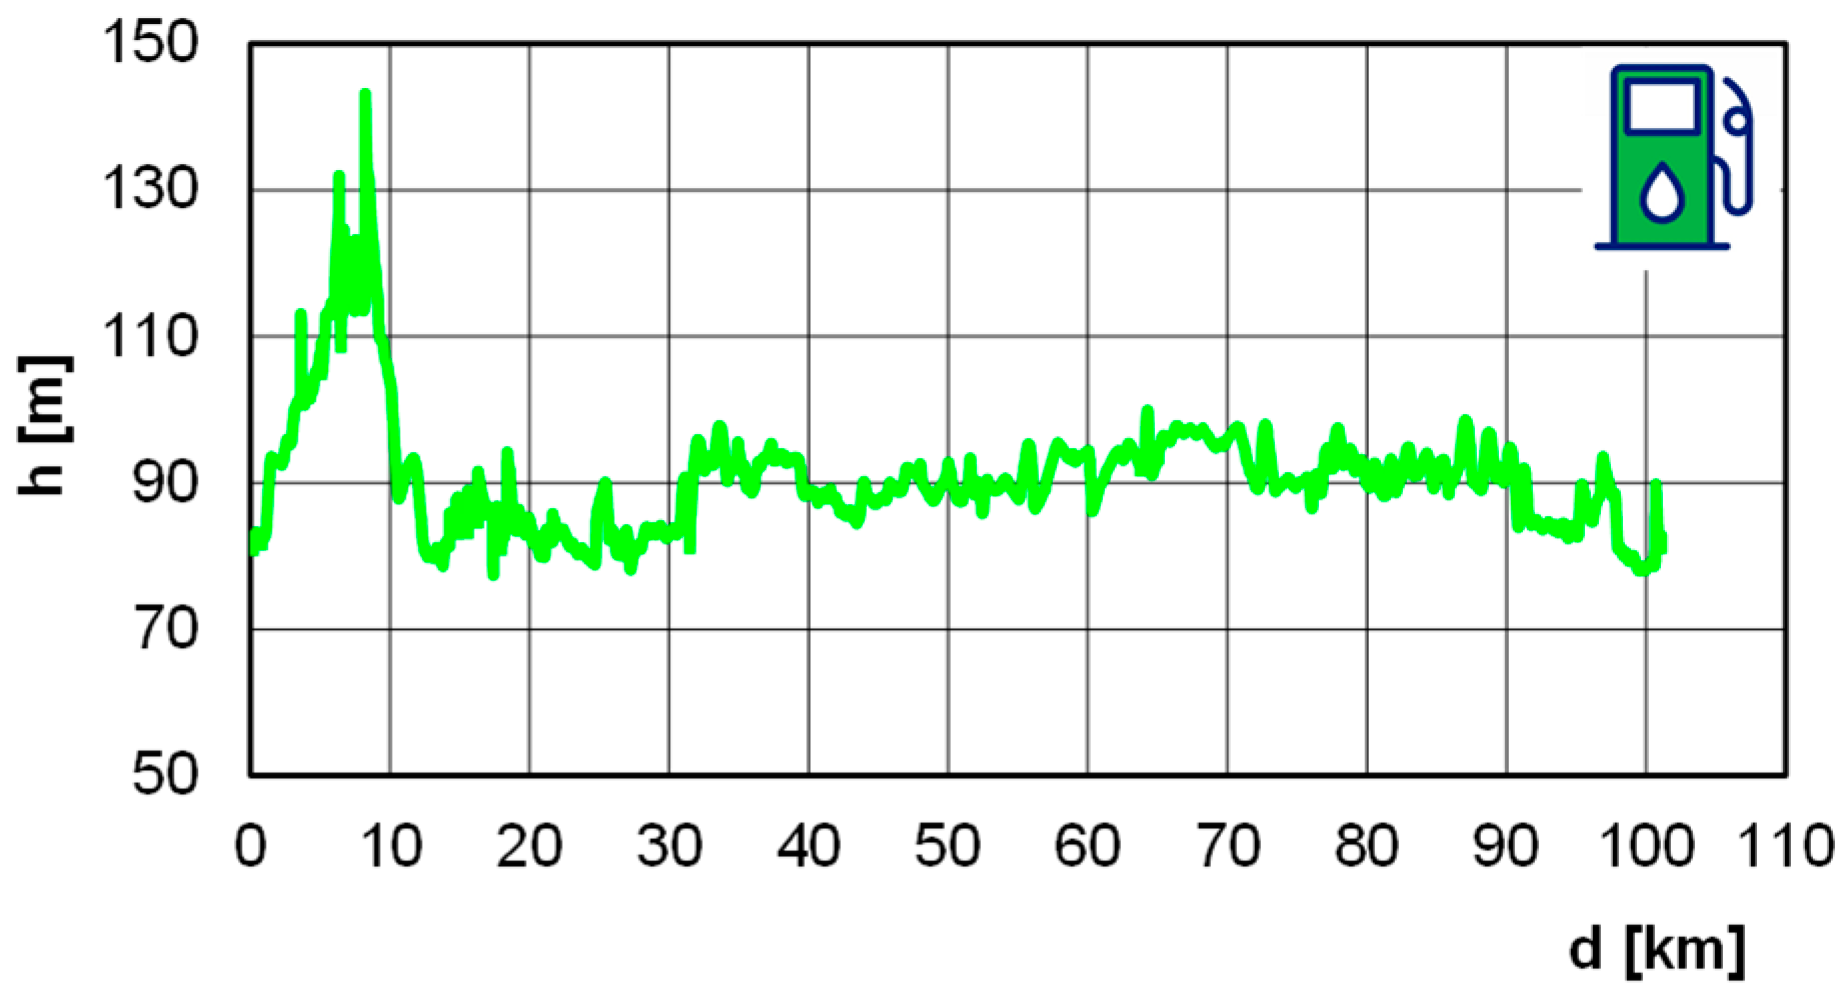
4.3. Test Route—Road Tests

The test route was selected to meet the requirements of the European Commission characterized in regulations [4,5,6,7,8,9], with particular emphasis on its topography. All vehicles used in the RDE road tests travelled on the same route (Figure 3).
For each vehicle specified in Table 4, parameters were provided, such as: the speed curve of the vehicle (Figure 4), the altitude variations on the test route (Figure 5), and the travel characteristics. The change in altitude along the route in the RDE test is shown for one vehicle because all tests took place on the same route, therefore, the altitude characteristics are the same (as a function of the distance).
The concentrations of carbon monoxide and dioxide, nitrogen oxides, and particulate matter number were measured in the conducted road tests. Location data from the GPS system and momentary data determining the vehicle’s condition based on the signal from the vehicle’s diagnostic system were recorded during the trips in order to precisely analyze the obtained test results.
Despite visible differences in test duration and slight differences in driving speed (Figure 4), all tests were valid in terms of static parameters. The RDE tests with each vehicle were performed three times with the same driver. The values presented below are averages. The presented characteristics of the individual tests (Table 4), in particular, small differences between the parameters for individual vehicles, confirmed that the tests were performed correctly. Taking into account the validity of the road tests, further ecological analysis was possible based on the data obtained in real road driving conditions.
The emission tests considered in this work—both those performed on a chassis dynamometer and those performed in real driving conditions—were not consistent in terms of their functional division. The approval test performed on a chassis dynamometer was divided into four phases:
  • phase 1, in which the vehicle moved at different speeds in the 0–55 km/h range;
  • phase 2, in which the vehicle travelled at a speed in the 0–76 km/h range;
  • phase 3, in which the vehicle travelled at a speed in the 0–98 km/h range;
  • phase 4, in which the vehicle moved at a momentarily maximum speed of approximately 130 km/h.
The road test according to the RDE test procedure performed in real driving conditions should consist of three driving sections:
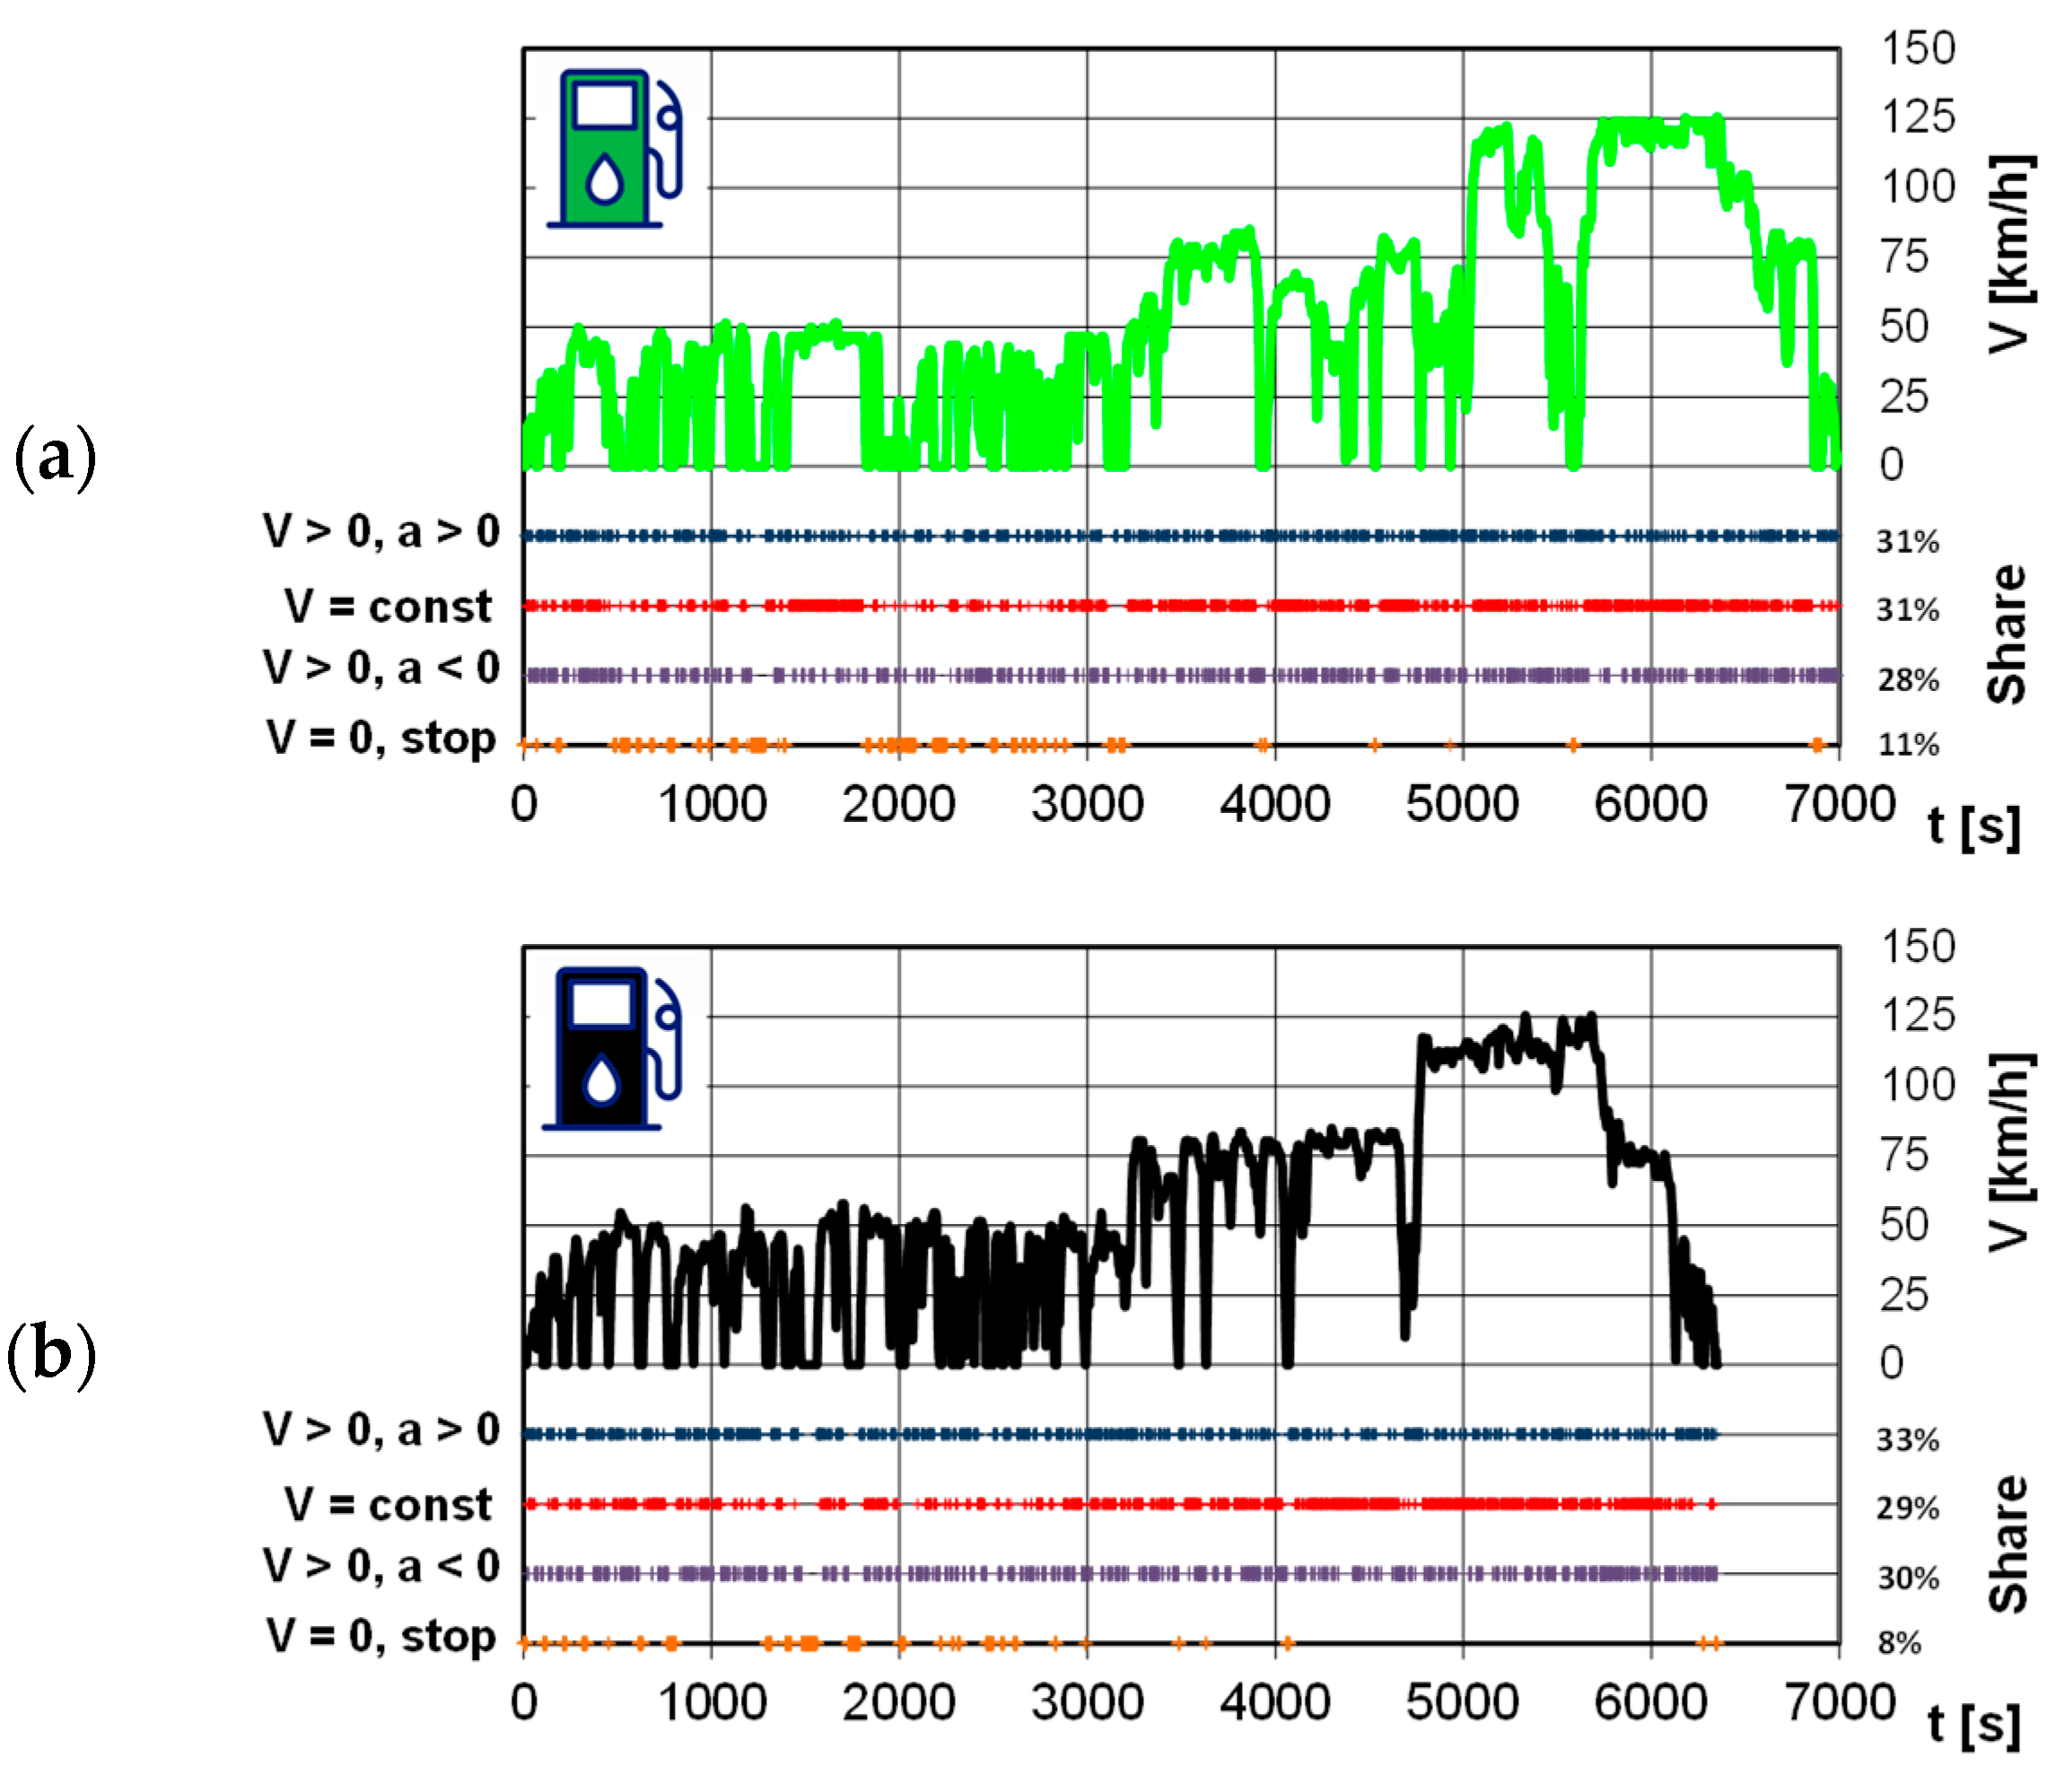
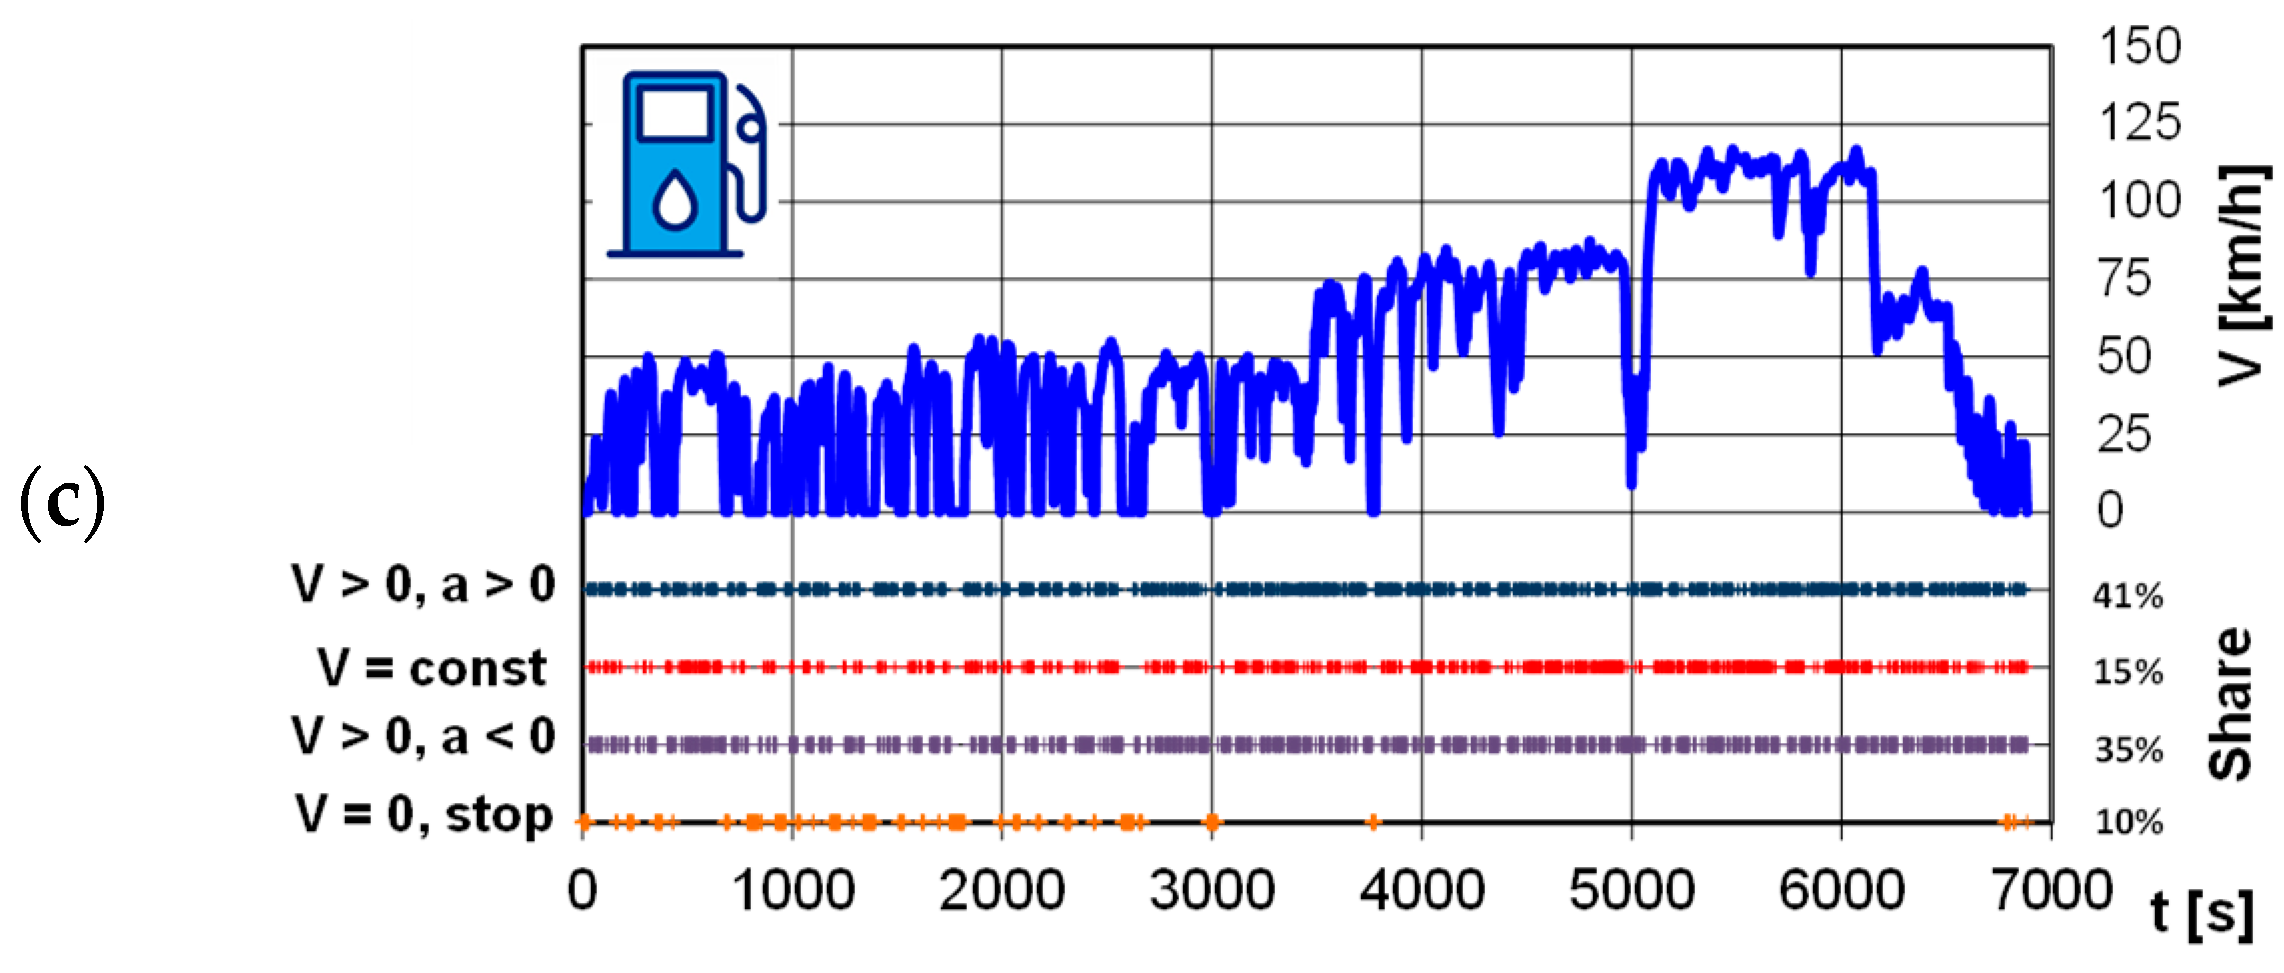
  • urban section, in which the vehicle travels at different speeds from 0 to 60 km/h;
  • rural section, in which the vehicle travels at speeds from 60 km/h to 90 km/h;
  • highway section in which the vehicle travels at a speed exceeding 90 km/h,
although situations in which the vehicle was temporarily moving at a slower speed are possible (e.g., due to traffic conditions, traffic lights or toll booths on the highway).
Due to this situation, the comparison of the final values in the WLTC and RDE tests is beyond doubt, but in order to compare specific phases of the WLTC test with the corresponding section of the RDE test, assumptions had to be made about the similarity of these individual test parts. The first step in the data analysis was to calculate the share of each speed interval in relation to the total number of all speed intervals in the WLTC and RDE tests in relation to the relative test time. Comparing the relative shares instead of total ones in this case was helpful due to the different lengths of the tests and their different durations. The relationships (Figure 6) show that the first and second phases of the WLTC test correspond in driving speed shares to the urban section of the RDE test, and the remaining phases can also be compared with the other test sections, respectively. Therefore, it was assumed that it is possible to compare the urban section of the RDE test with the combined phases 1 and 2 of the WLTC test (while maintaining appropriate proportionality in relation to time or distance).
Another aspect of equating phases 1 and 2 of the WLTC test with the urban section of the RDE test was the comparison of the vehicle operating time share as a function of the vehicle speed–acceleration. Such a comparison (Figure 6) shows that for all the tested vehicles, the speed and acceleration intervals were consistent for the appropriate intervals. In phases 1 and 2 of the WLTC test, designated in Figure 7 as a new designation with an asterisk (‘urban section’), the colors denoting the operating time share were very similar to the colors (and the corresponding shares) in the urban part of the RDE test. Of course, this is not an equivalent with a very high degree of correlation, but a comparison of the respective shares of the vehicle operating times in the urban parts of the WLTC and RDE tests (Figure 8) showed that the coefficient of determination for conventional vehicles (i.e., those powered by gasoline and diesel) was the same at (0.43–0.44), while for a hybrid vehicle, this coefficient was 0.62. Hence the assumption that phases 1 and 2 of the WLTC test can be combined as one section that corresponds to the urban section of the RDE test was valid.
Then, the remaining phases of the WLTC and RDE tests were also compared. The comparison of phase 3 of the WLTC test and the rural section of the RDE test (Figure 9) showed the best representation for a hybrid vehicle, where the coefficient of determination was 0.81, and the subsequent values of 0.71 and 0.72 refer to the gasoline and diesel fueled conventional vehicles, respectively.
Comparing phase 4 of the WLTC test with the highway section of the RDE test (Figure 10), the obtained determination coefficient values were 0.67, 0.59, and 0.73 for gasoline, diesel, and hybrid vehicles, respectively. The much lower values of the determination coefficients also resulted from a smaller number of data points used in this comparison. In the urban part, about 90 data points were compared (depending on the vehicle), while in the rural and highway sections, this was reduced to only about 35 data points for each.
Comparing the data of the entire WLTC and RDE tests showed the determination coefficients as having the lower values of 0.37, 0.32, and 0.55, respectively, for petrol, diesel, and a hybrid vehicles (Figure 11). This relationship was observed because the share of vehicle operating time related to the speed–acceleration coordinates was uneven. Considering not only the speed, but also taking acceleration into account, showed that homologation tests and road tests were not the same in this respect. Hence it could be derived that determining the RDE test results using the values obtained in the homologation test is a complex issue.
Another important point in the analysis and comparison of the approval tests and road tests was the difference in the final road emission values of any of the emission components measured in the tests. In addition to combining phases 1 and 2 of the WLTC test (marked as WLTC1+2), the authors proposed another change regarding how the road emissions were determined in the WLTC test to align it with the RDE procedure. The algorithm for determining the exhaust emissions was not used in the subsequent phases of the WLTC test, but instead the phases were named similar to those in the RDE test, and the classification of the results of the test sections into individual parts was performed on the basis of the speed ranges. This meant that the urban part of the WLTC test was one in which the speed was less than 60 km/h. In accordance with the RDE test procedure requirements, the rural and motorway sections of the WLTC test were also determined. Each time in this paper, such a procedure will be marked in accordance with the test that was performed, with the index referring to the method of determining the exhaust emissions (such as WLTCRDE).
To sum up: four calculation procedures were used to analyze the operating conditions in the WLTC and RDE tests:
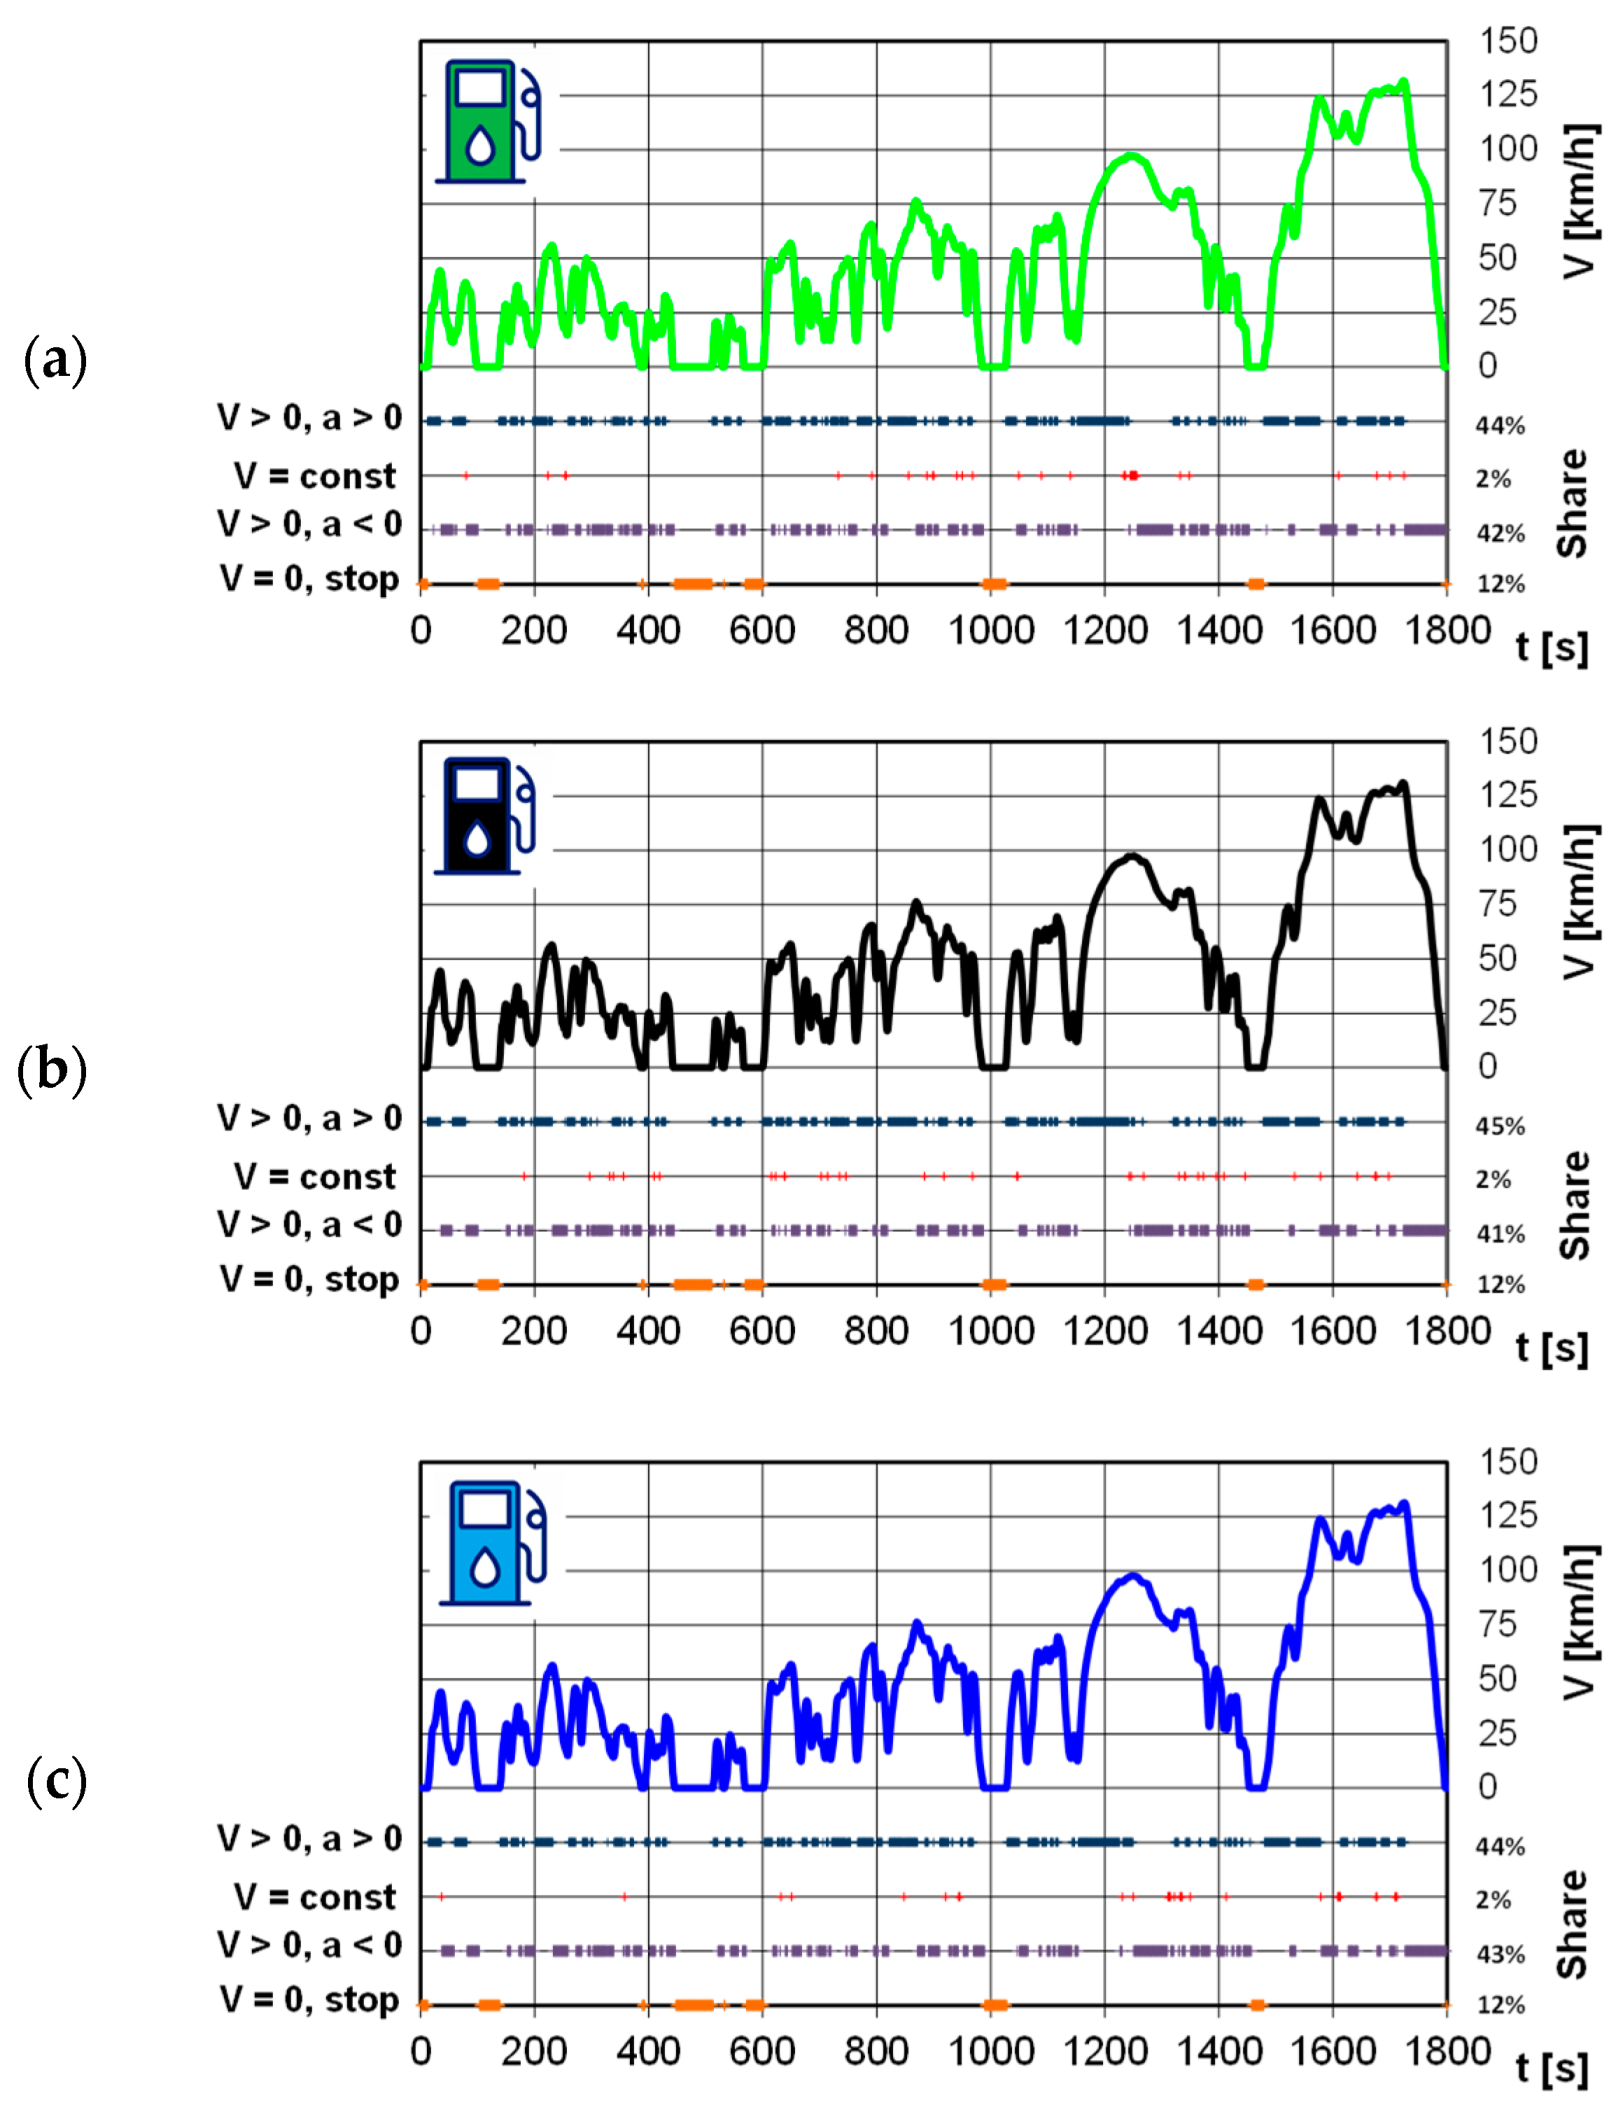
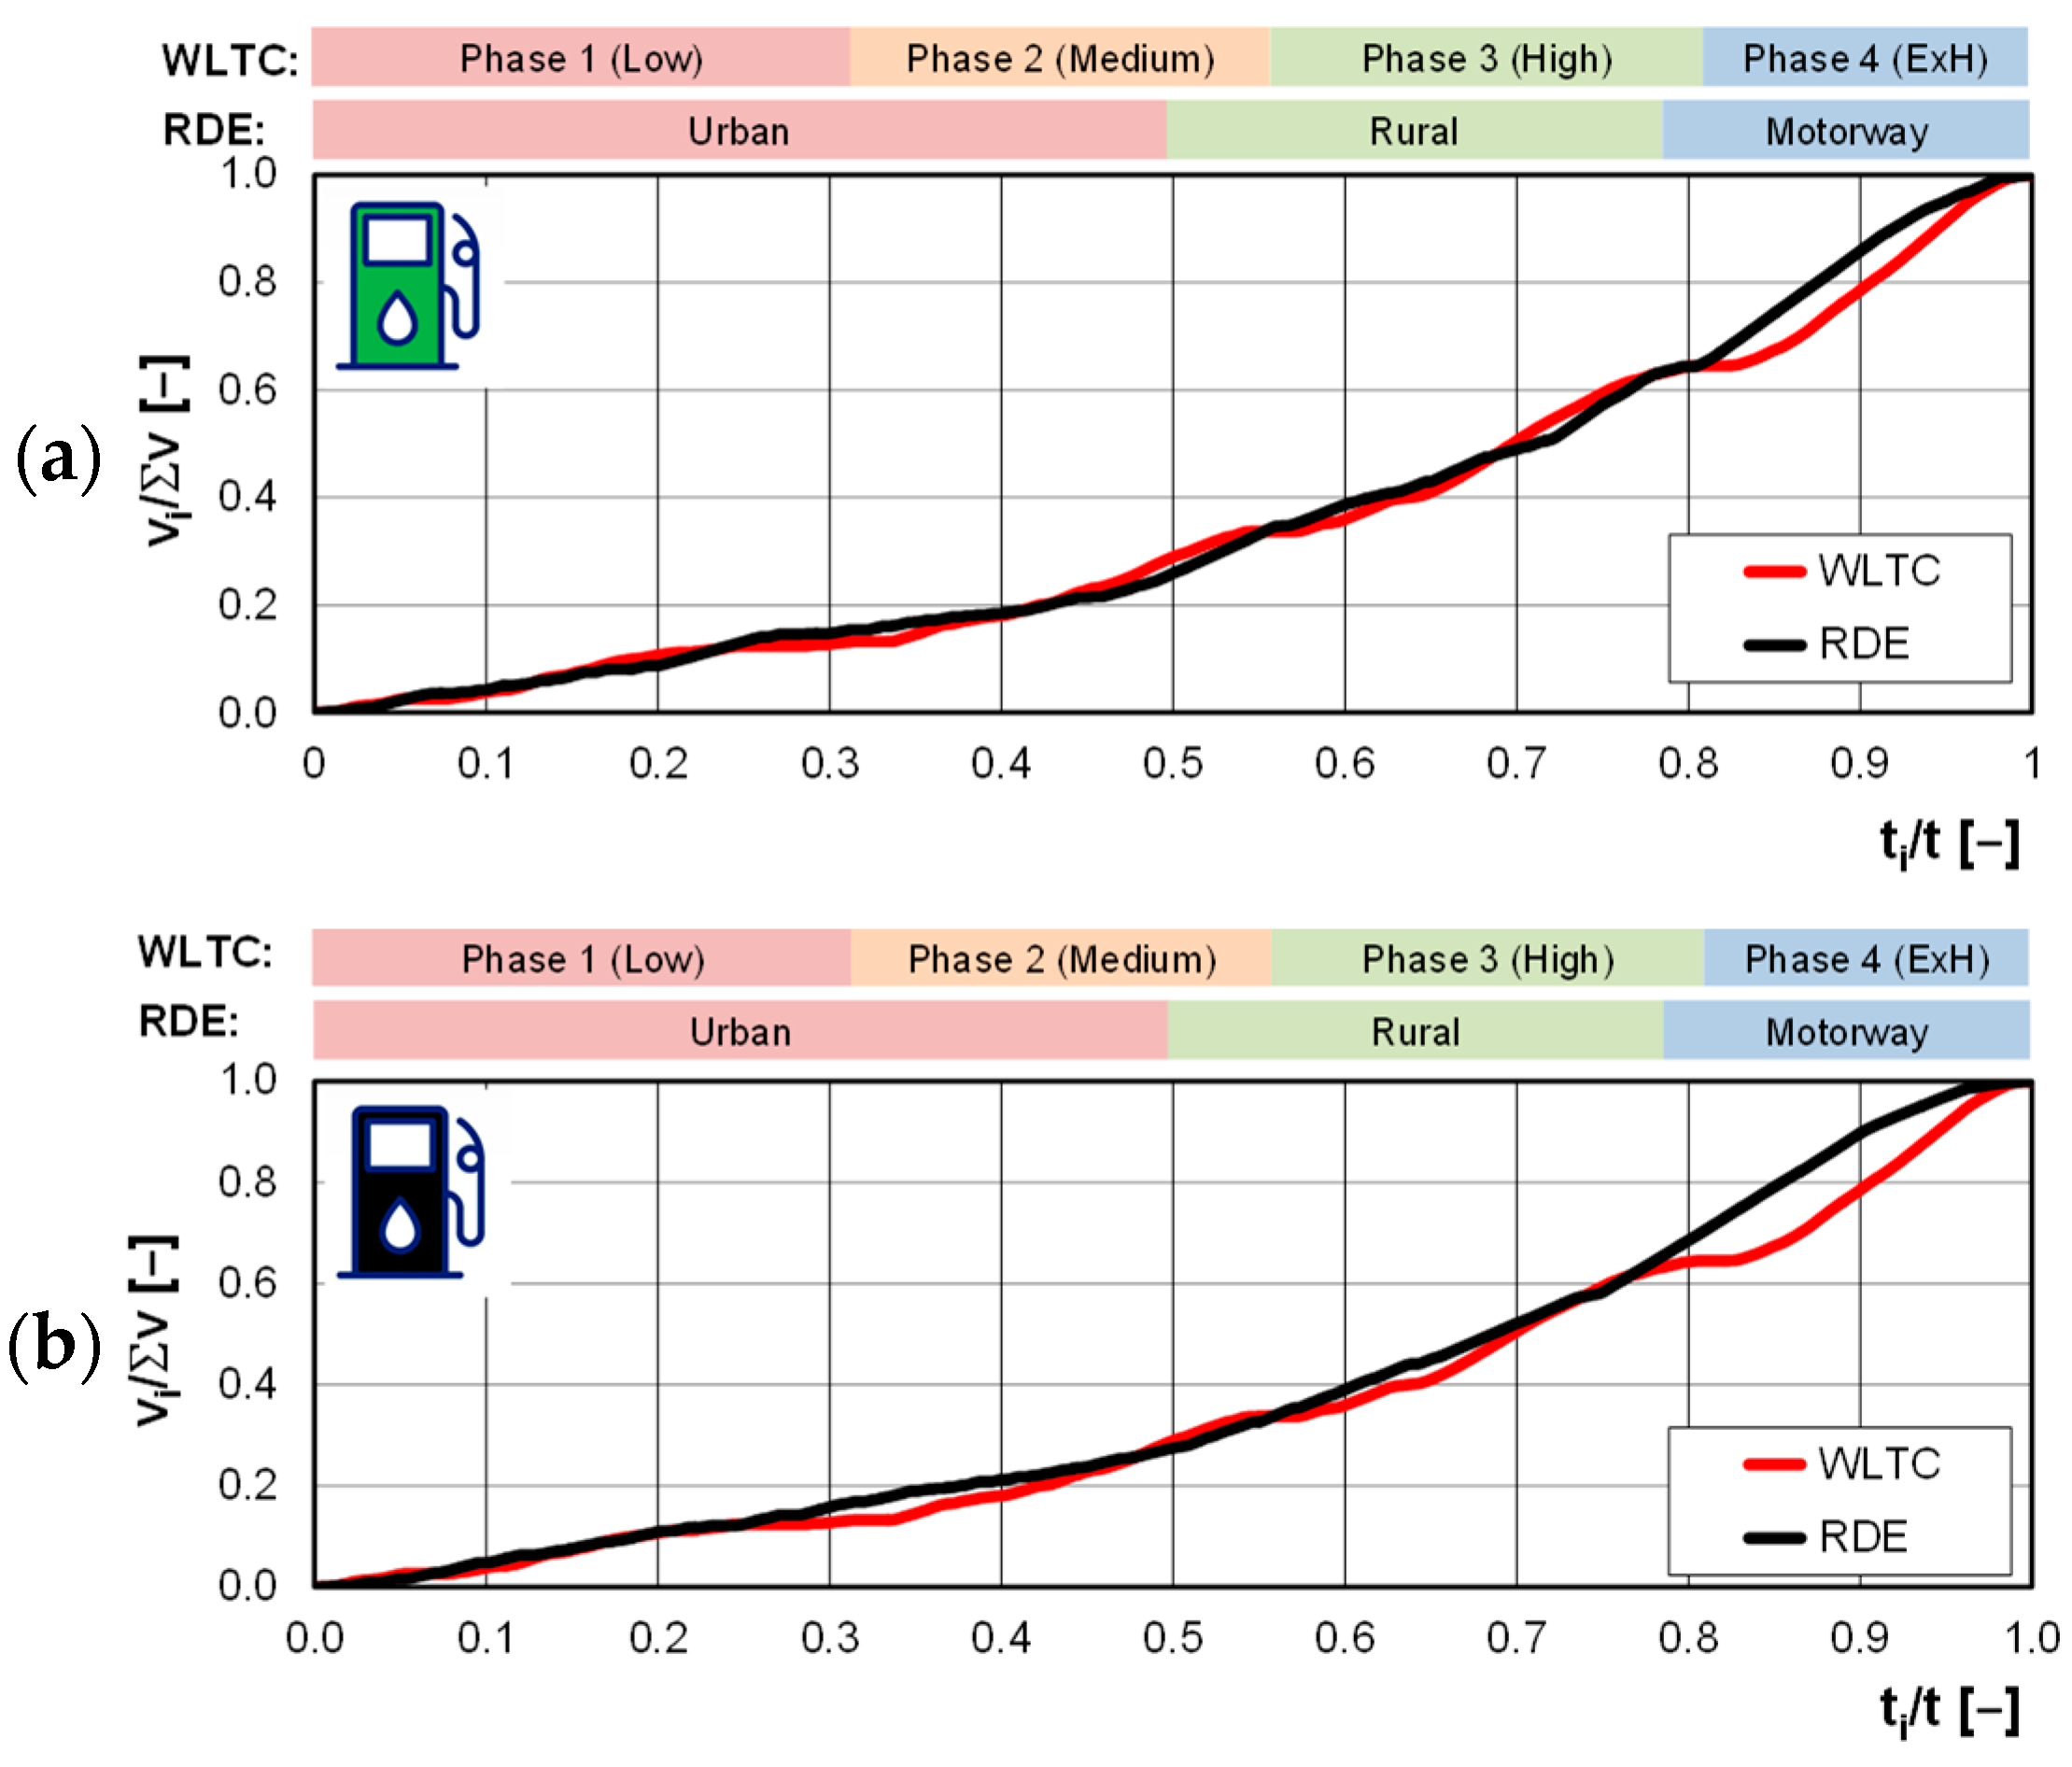
  • procedure 1 (labelled WLTC)—division of the driving test in accordance with the WLTP;
  • procedure 2 (labelled RDE)—division of the driving test on sections in accordance with the regular RDE test procedure;
  • procedure 3 (labelled WLTC1+2)—tests divided into four phases: 1 + 2, 3, and 4; where the combined phases 1 and 2 correspond to the urban driving section of the RDE test;
  • procedure 4 (labelled WLTCRDE)—the test phases are divided in accordance with the RDE test procedure, which assumed dividing the phases based on the vehicle travel speed.

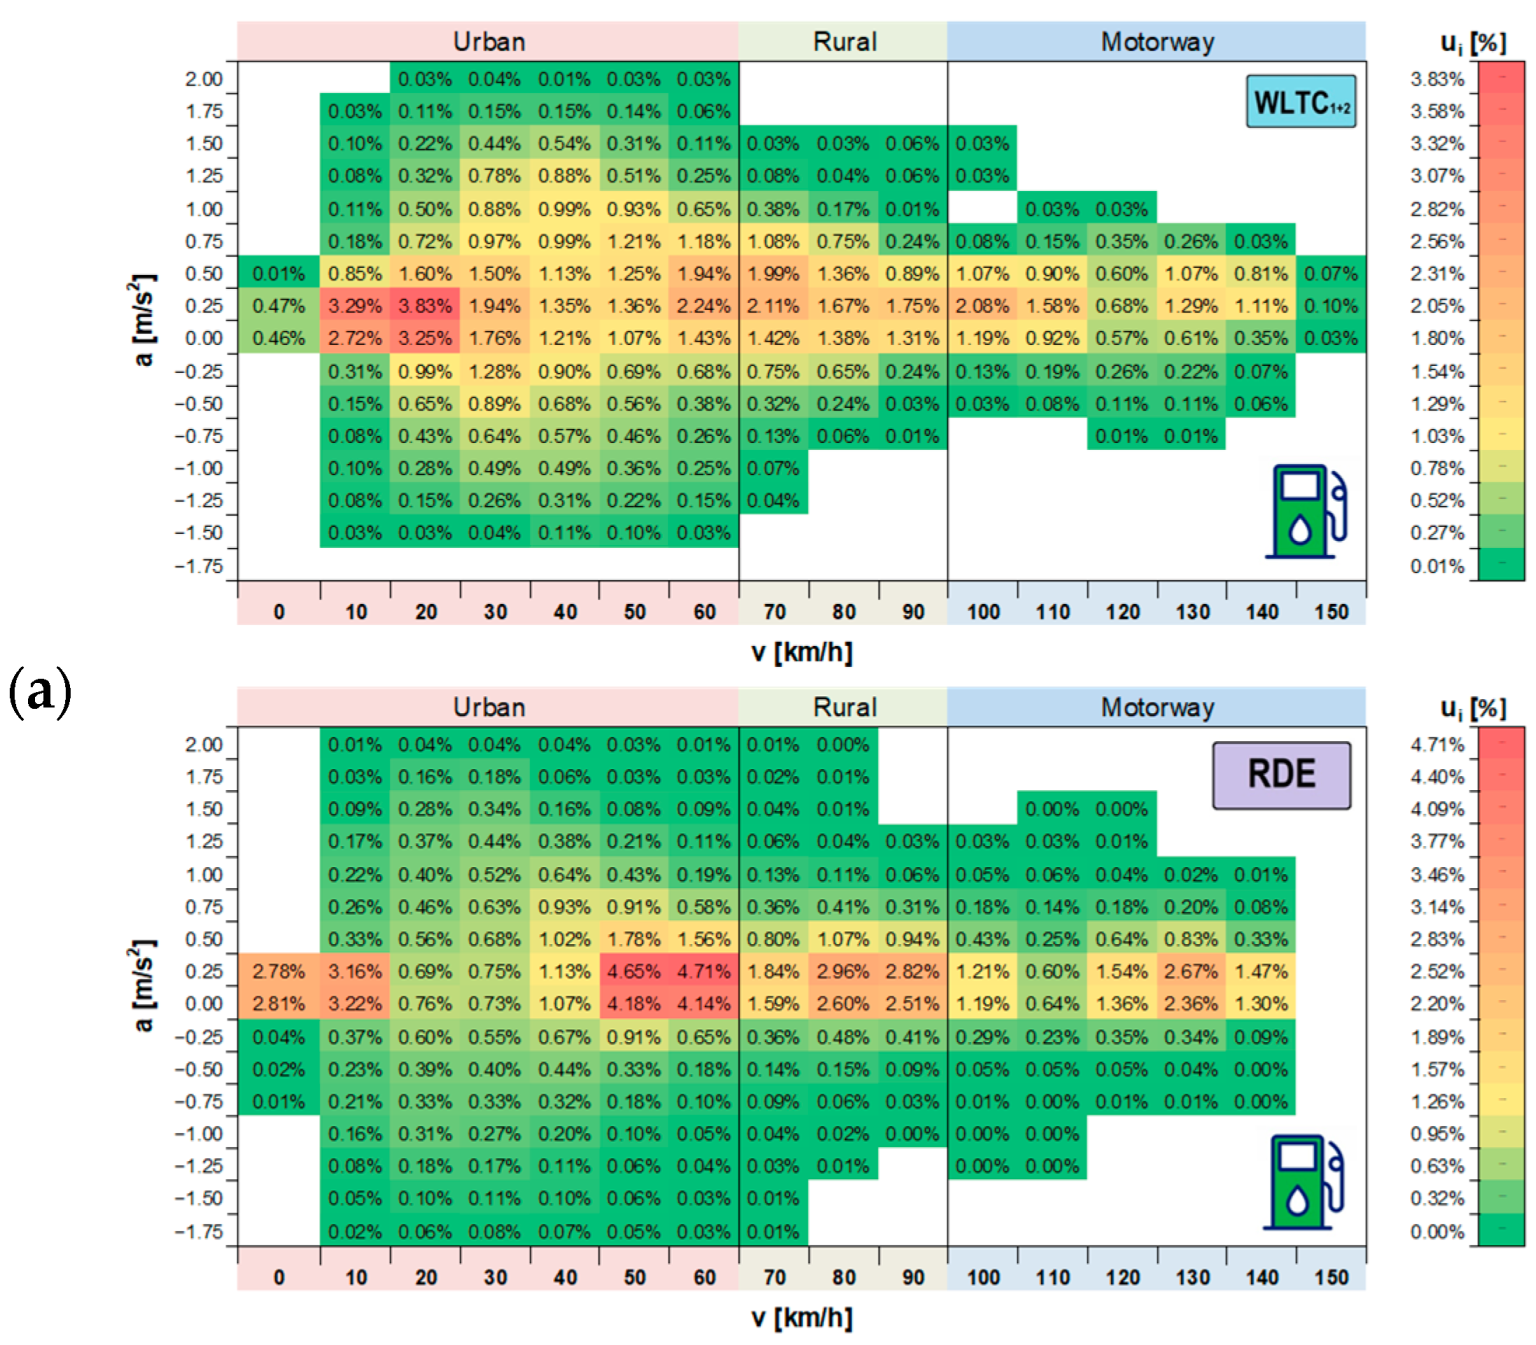
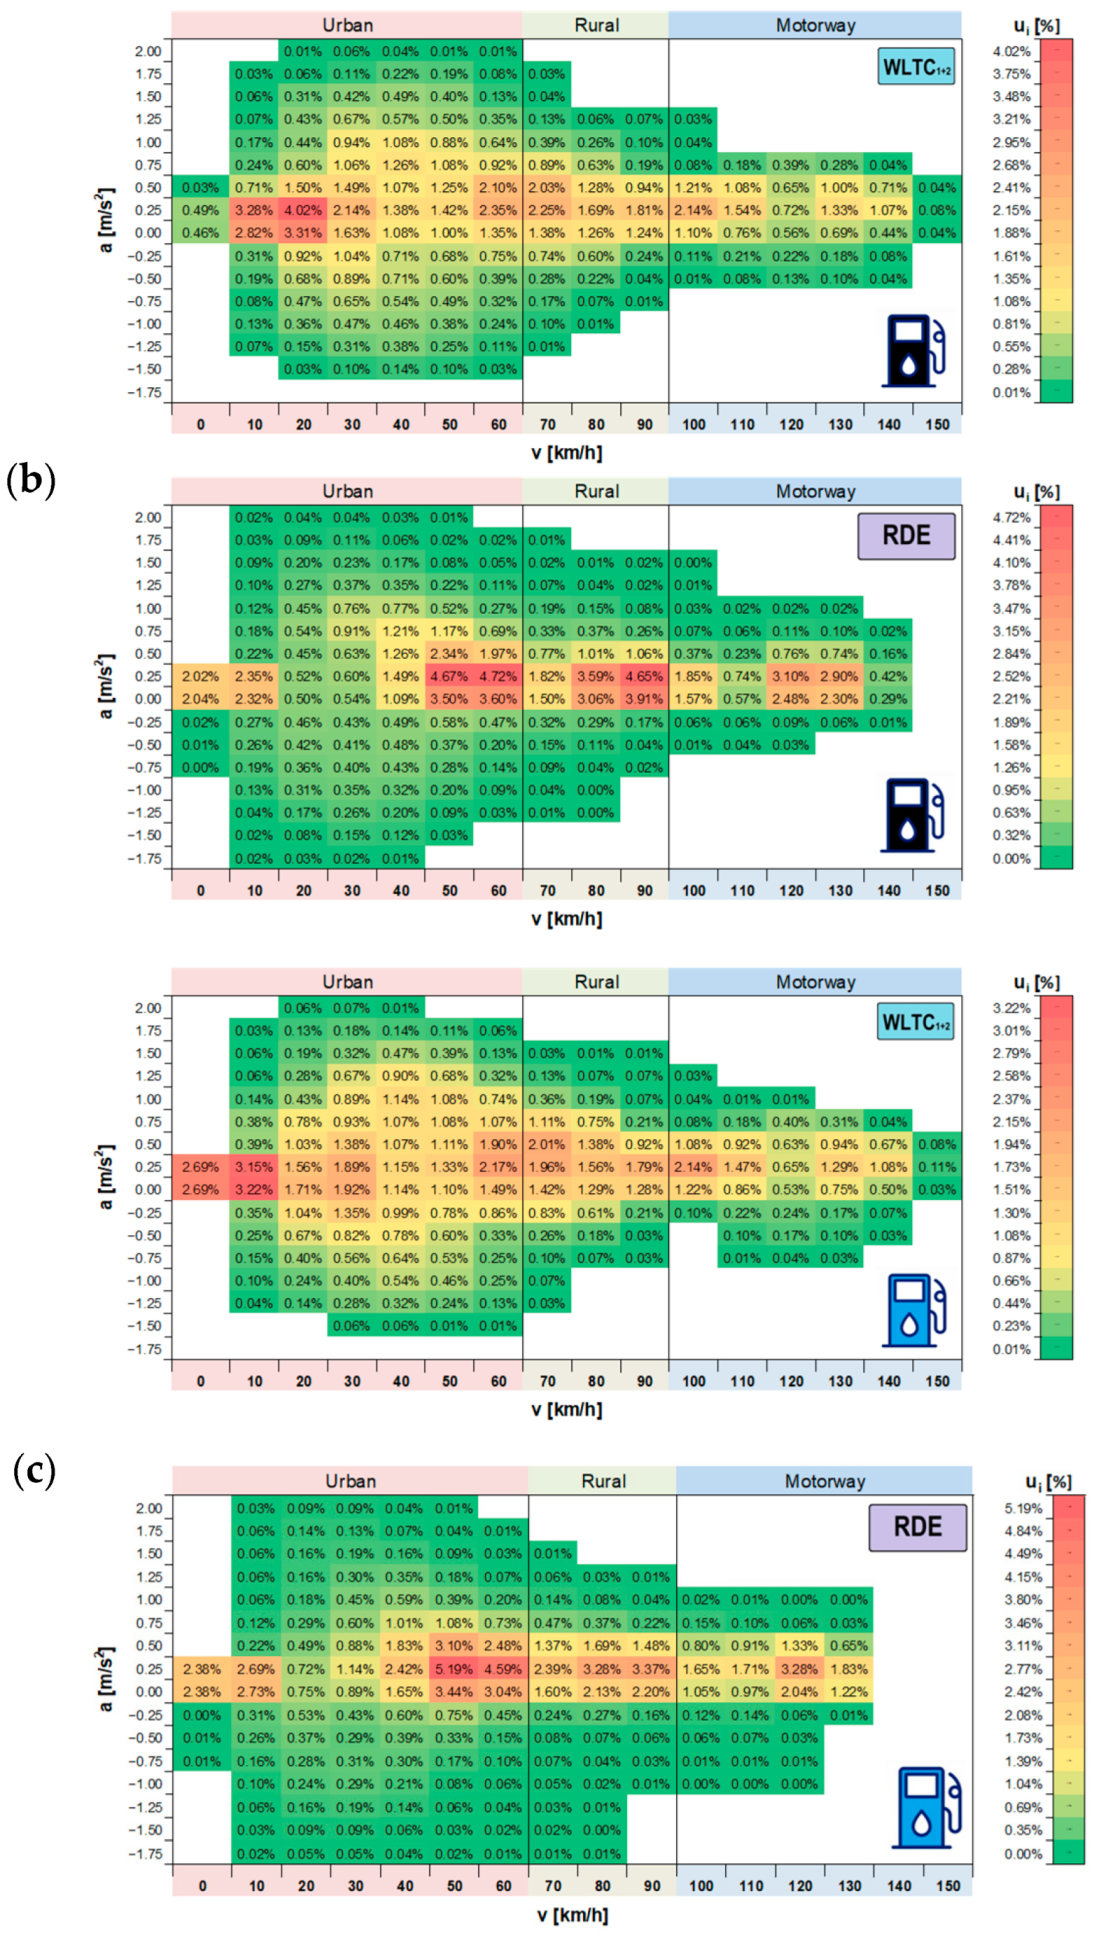
5. Analysis of Driving Parameters in Exhaust Emission Tests

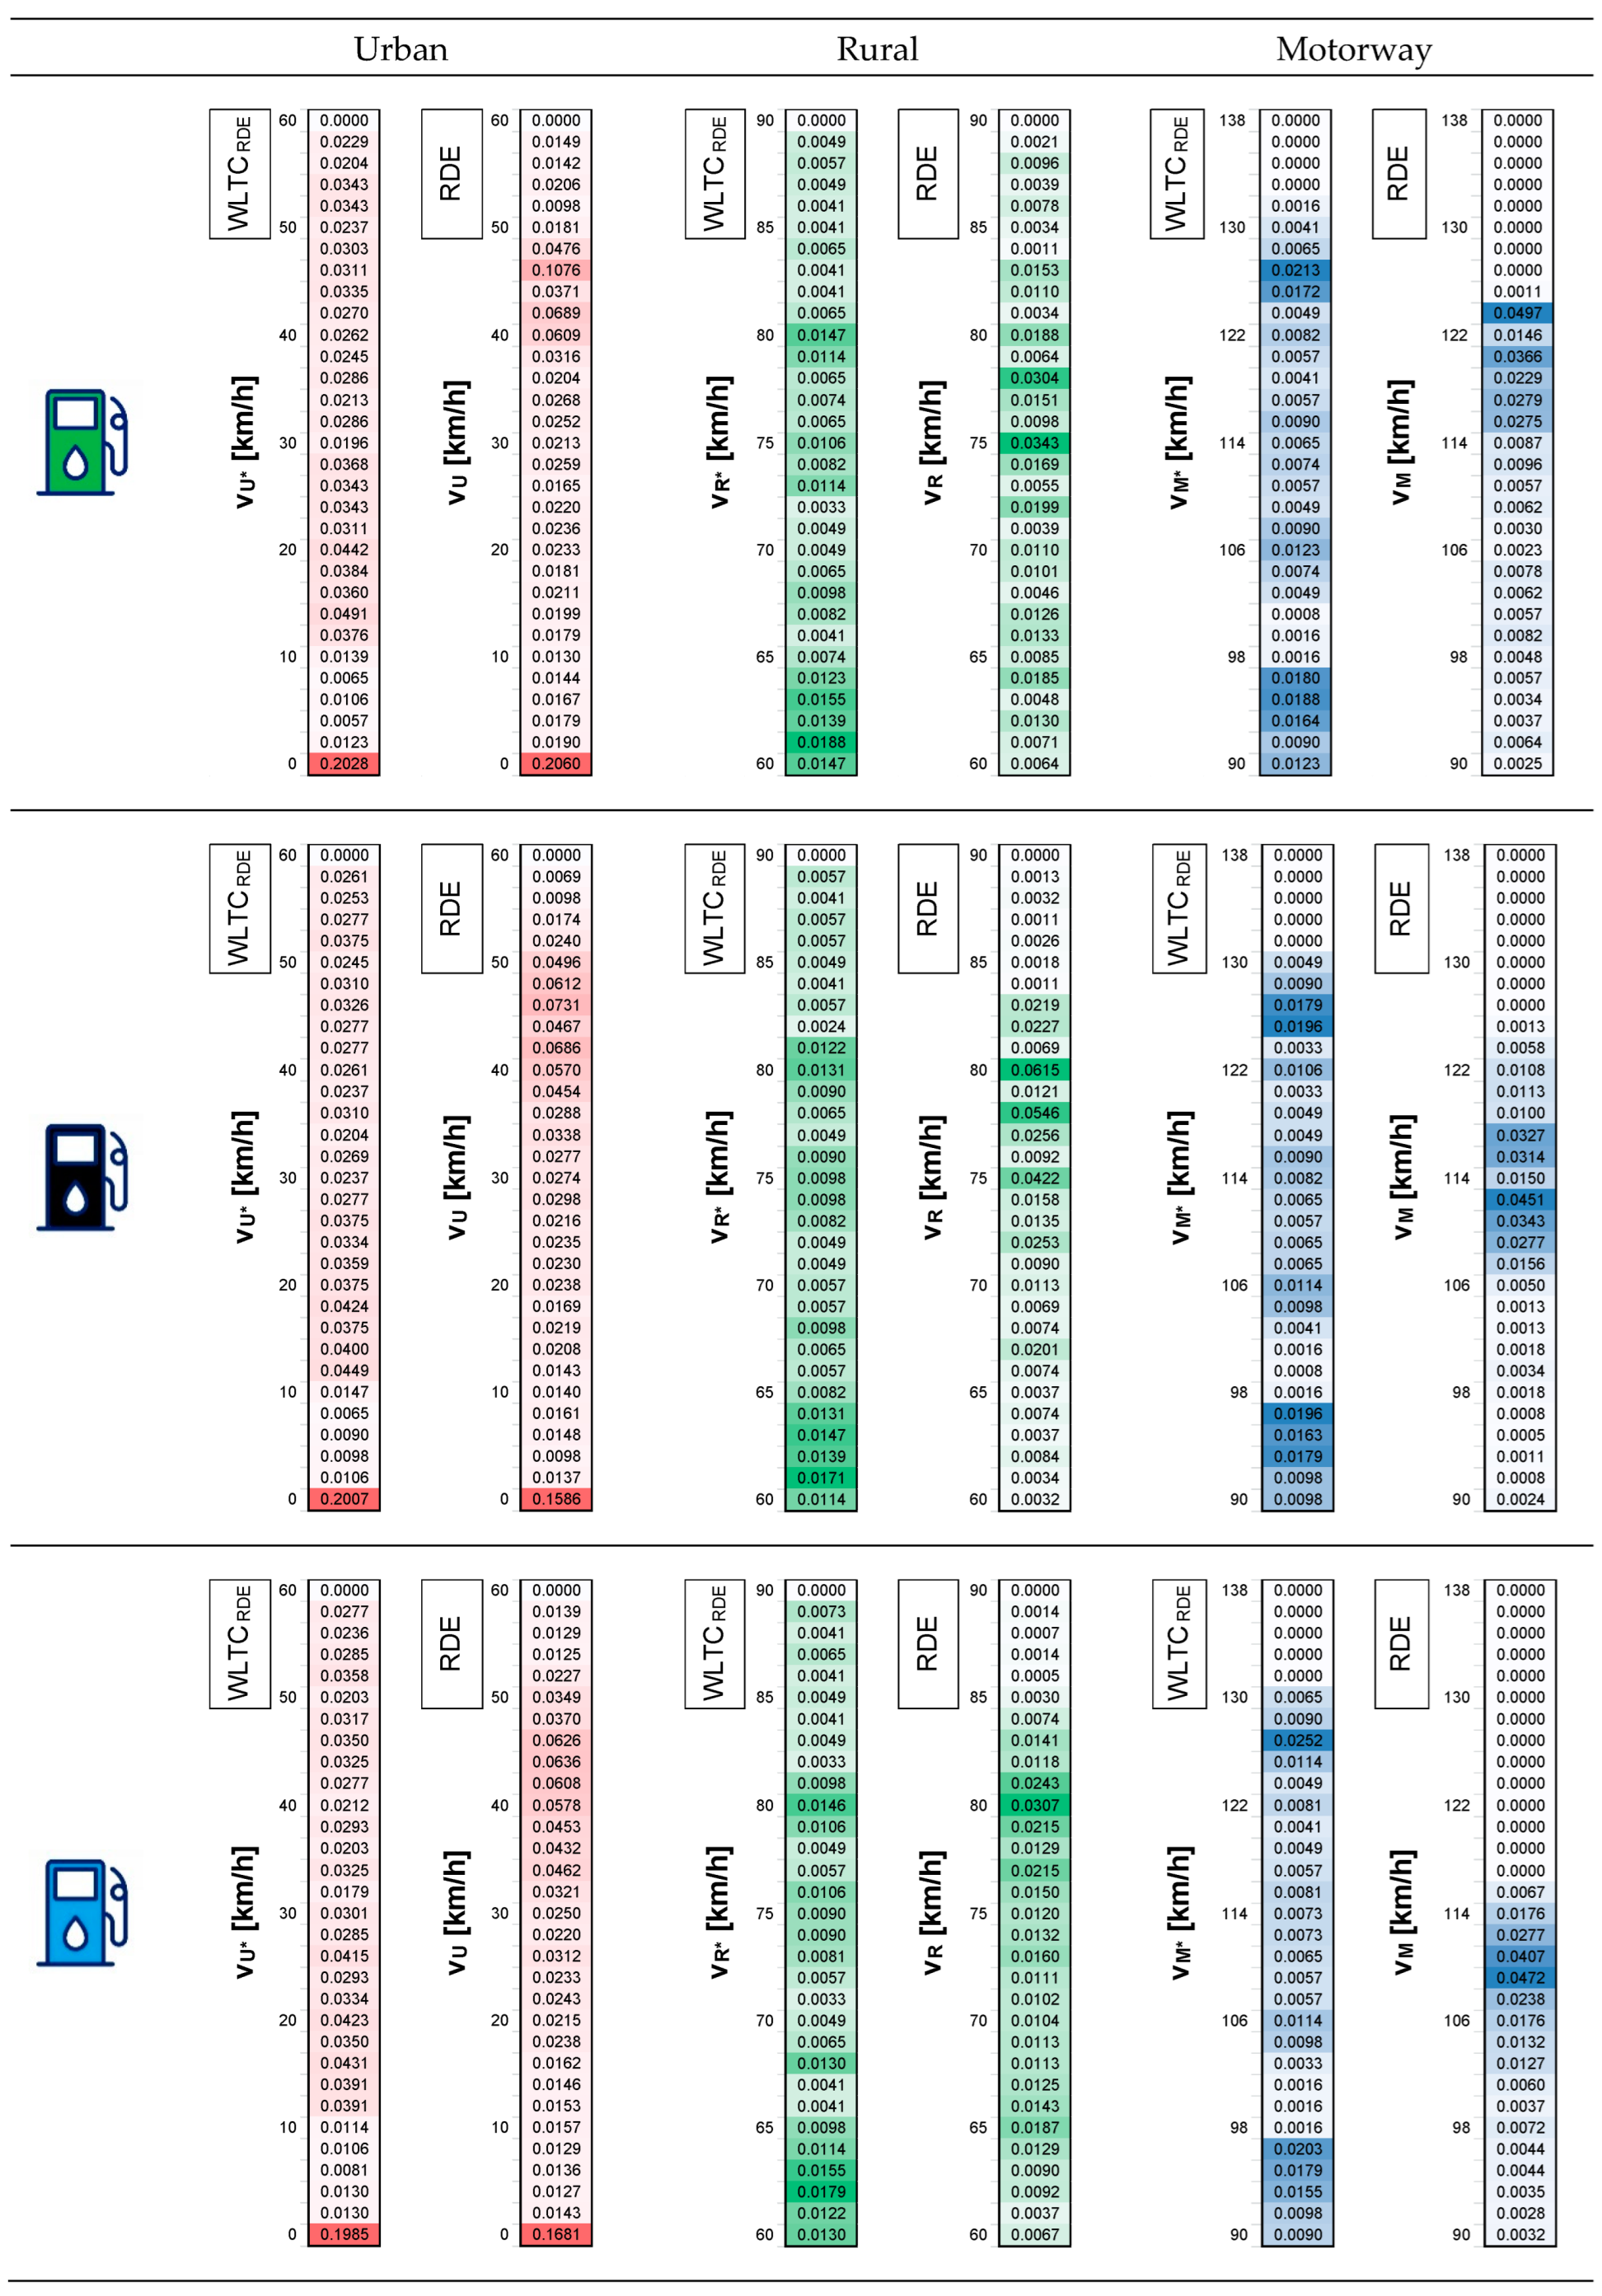
5.1. Comparison of Vehicle Speed Shares in Emission Tests

The speed curves of the tested vehicles from the WLTC test and the characteristic parameters from the RDE test were used to compare the WLTC and RDE tests for vehicles powered by gasoline engines, diesel engines, and hybrid drives. The recorded driving parameters both in tests on the chassis dynamometer and in real driving conditions were characterized by similar values. The variation in the instantaneous speed values between subsequent WLTC tests and the average value from the three tests did not exceed 2 km/h (Figure 12). The dynamic conditions (speed and acceleration other than zero) had the greatest share in all WLTC tests; the average values were 47% (WLTC) and 33% (RDE). However, the shares of accelerations and decelerations were much greater in the WLTC test (over 45%). Moreover, the driving speed in the WLTC test was characterized by the negligible share of driving at a constant speed (2%) for all tested vehicles, while in the RDE test these shares reached over 30%. Each WLTC test run performed in this research was more dynamic than the RDE test runs.
The speed shares were compared as the respective phases that the tests (WLTC and RDE) were divided into: urban, rural, and highway sections. Therefore, the procedure of assigning data to its phase, marked as WLTCRDE, was used. This meant that the tests were performed according to the WLTC test requirements, however, the adopted division of phases was in line with the RDE test procedure. The vehicle speed shares were divided into three sections (urban, rural and highway), analyzed according to the WLTCRDE and RDE procedures, and obtained for three different types of drive systems in the vehicles (Figure 13). The highest share of vehicle speed in the urban section was recorded for the stationary speed interval (v = 0 km/h). This was true for every type of vehicle drive in the urban section, regardless of the procedure used.
The shares of vehicle speed obtained according to the WLTCRDE procedure in the urban section (for all types of vehicle drives in the speed range of 0 to 60 km/h) were comparable. This was similar for the RDE procedure. However, the data indicated that a direct comparison of the vehicle speed shares obtained according to the different procedures (in this case WLTCRDE and RDE) was not possible. The distribution of shares was not consistent. Similar situations occurred for the rural and motorway sections of the WLTCRDE and RDE procedures. In all phases of the test, results obtained according to different procedures should be analyzed separately.
The next dynamic parameter analyzed was the comparison of positive acceleration shares (Figure 14). The similarity of the results obtained when using the WLTCRDE procedure for all types of vehicle drives was observed. This applied to the entire range of the urban section (0.1–0.9 m/s2), however, the greatest similarity was found in the smaller values range of 0–0.2 m/s2. The color visualization (of the share of time spent at a given acceleration value) shows the scale of similarity, which for the WLTC test (determined according to the WLTCRDE procedure) was more evenly distributed than for the RDE test itself (a large share of operating time for a fairly narrow range of positive acceleration values). In the case of the rural section, the similarity in the distribution of positive acceleration shares when using the WLTCRDE procedure was especially pronounced for the gasoline and hybrid drive vehicles. For the diesel vehicle, the most common values of positive acceleration were located in a fairly narrow range (for WLTC—from 0.1 m/s2 to 0.2 m/s2, for the RDE test—between 0.18 m/s2 and 0.20 m/s2). In the highway section, the similarity of the results was noticeable in the range from 0.1 m/s2 to 0.5 m/s2 for all vehicle types, while a high similarity was found for the gasoline and hybrid drive vehicles. For a diesel engine vehicle, this similarity was particularly clear for the positive acceleration range from 0.16 to 0.20 m/s2.
The analysis of Figure 14 in terms of the tests in real driving conditions highlighted the similarity of vehicle trips in urban conditions, while in the remaining phases, the similarity occurred between gasoline vehicles (including the hybrid vehicle).

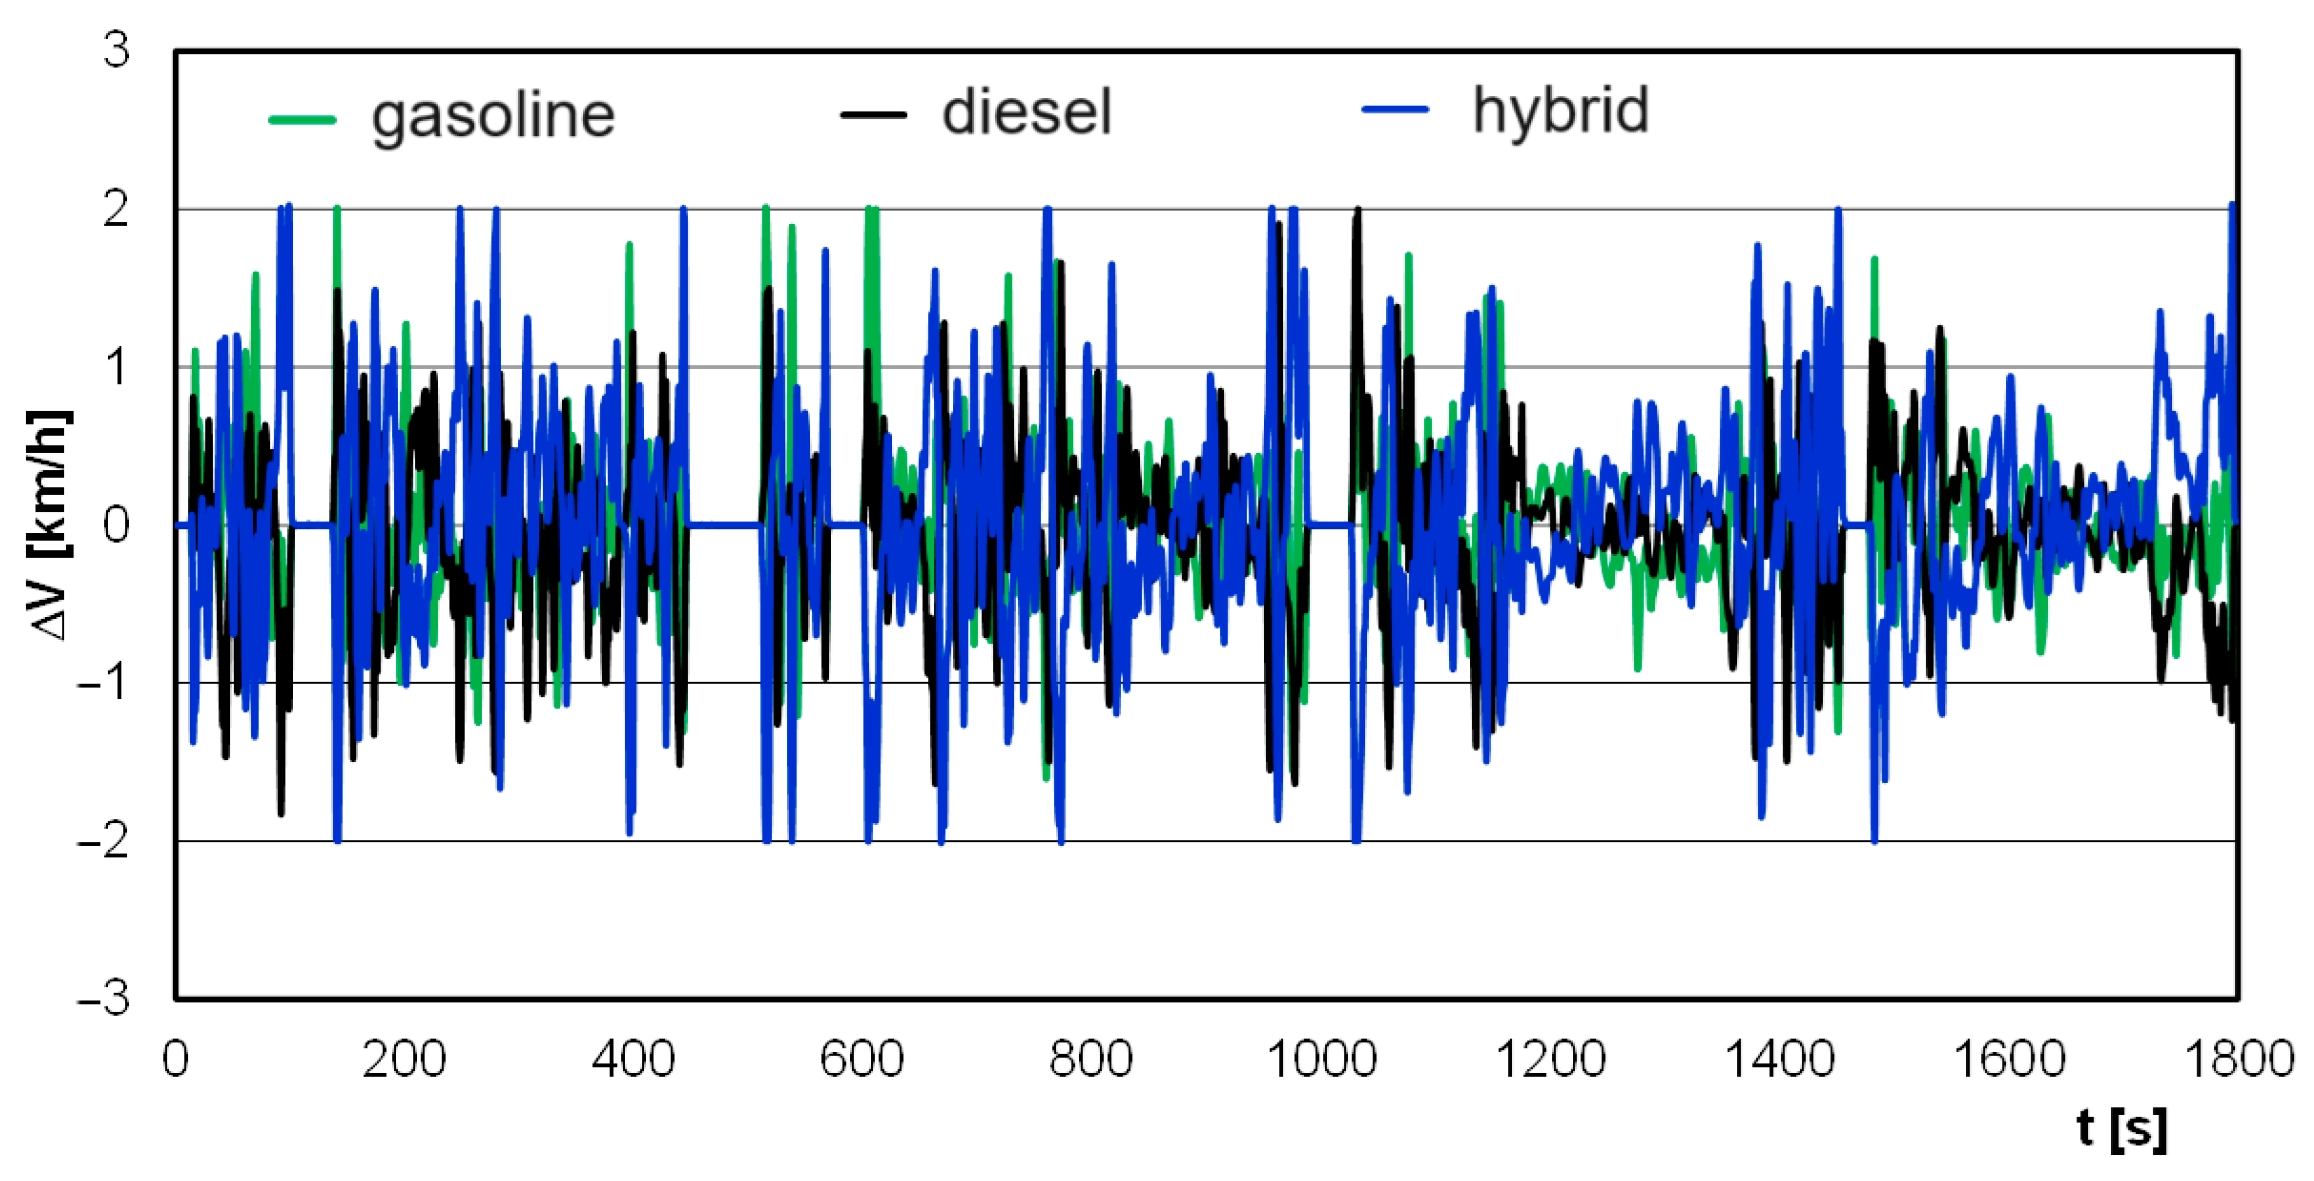
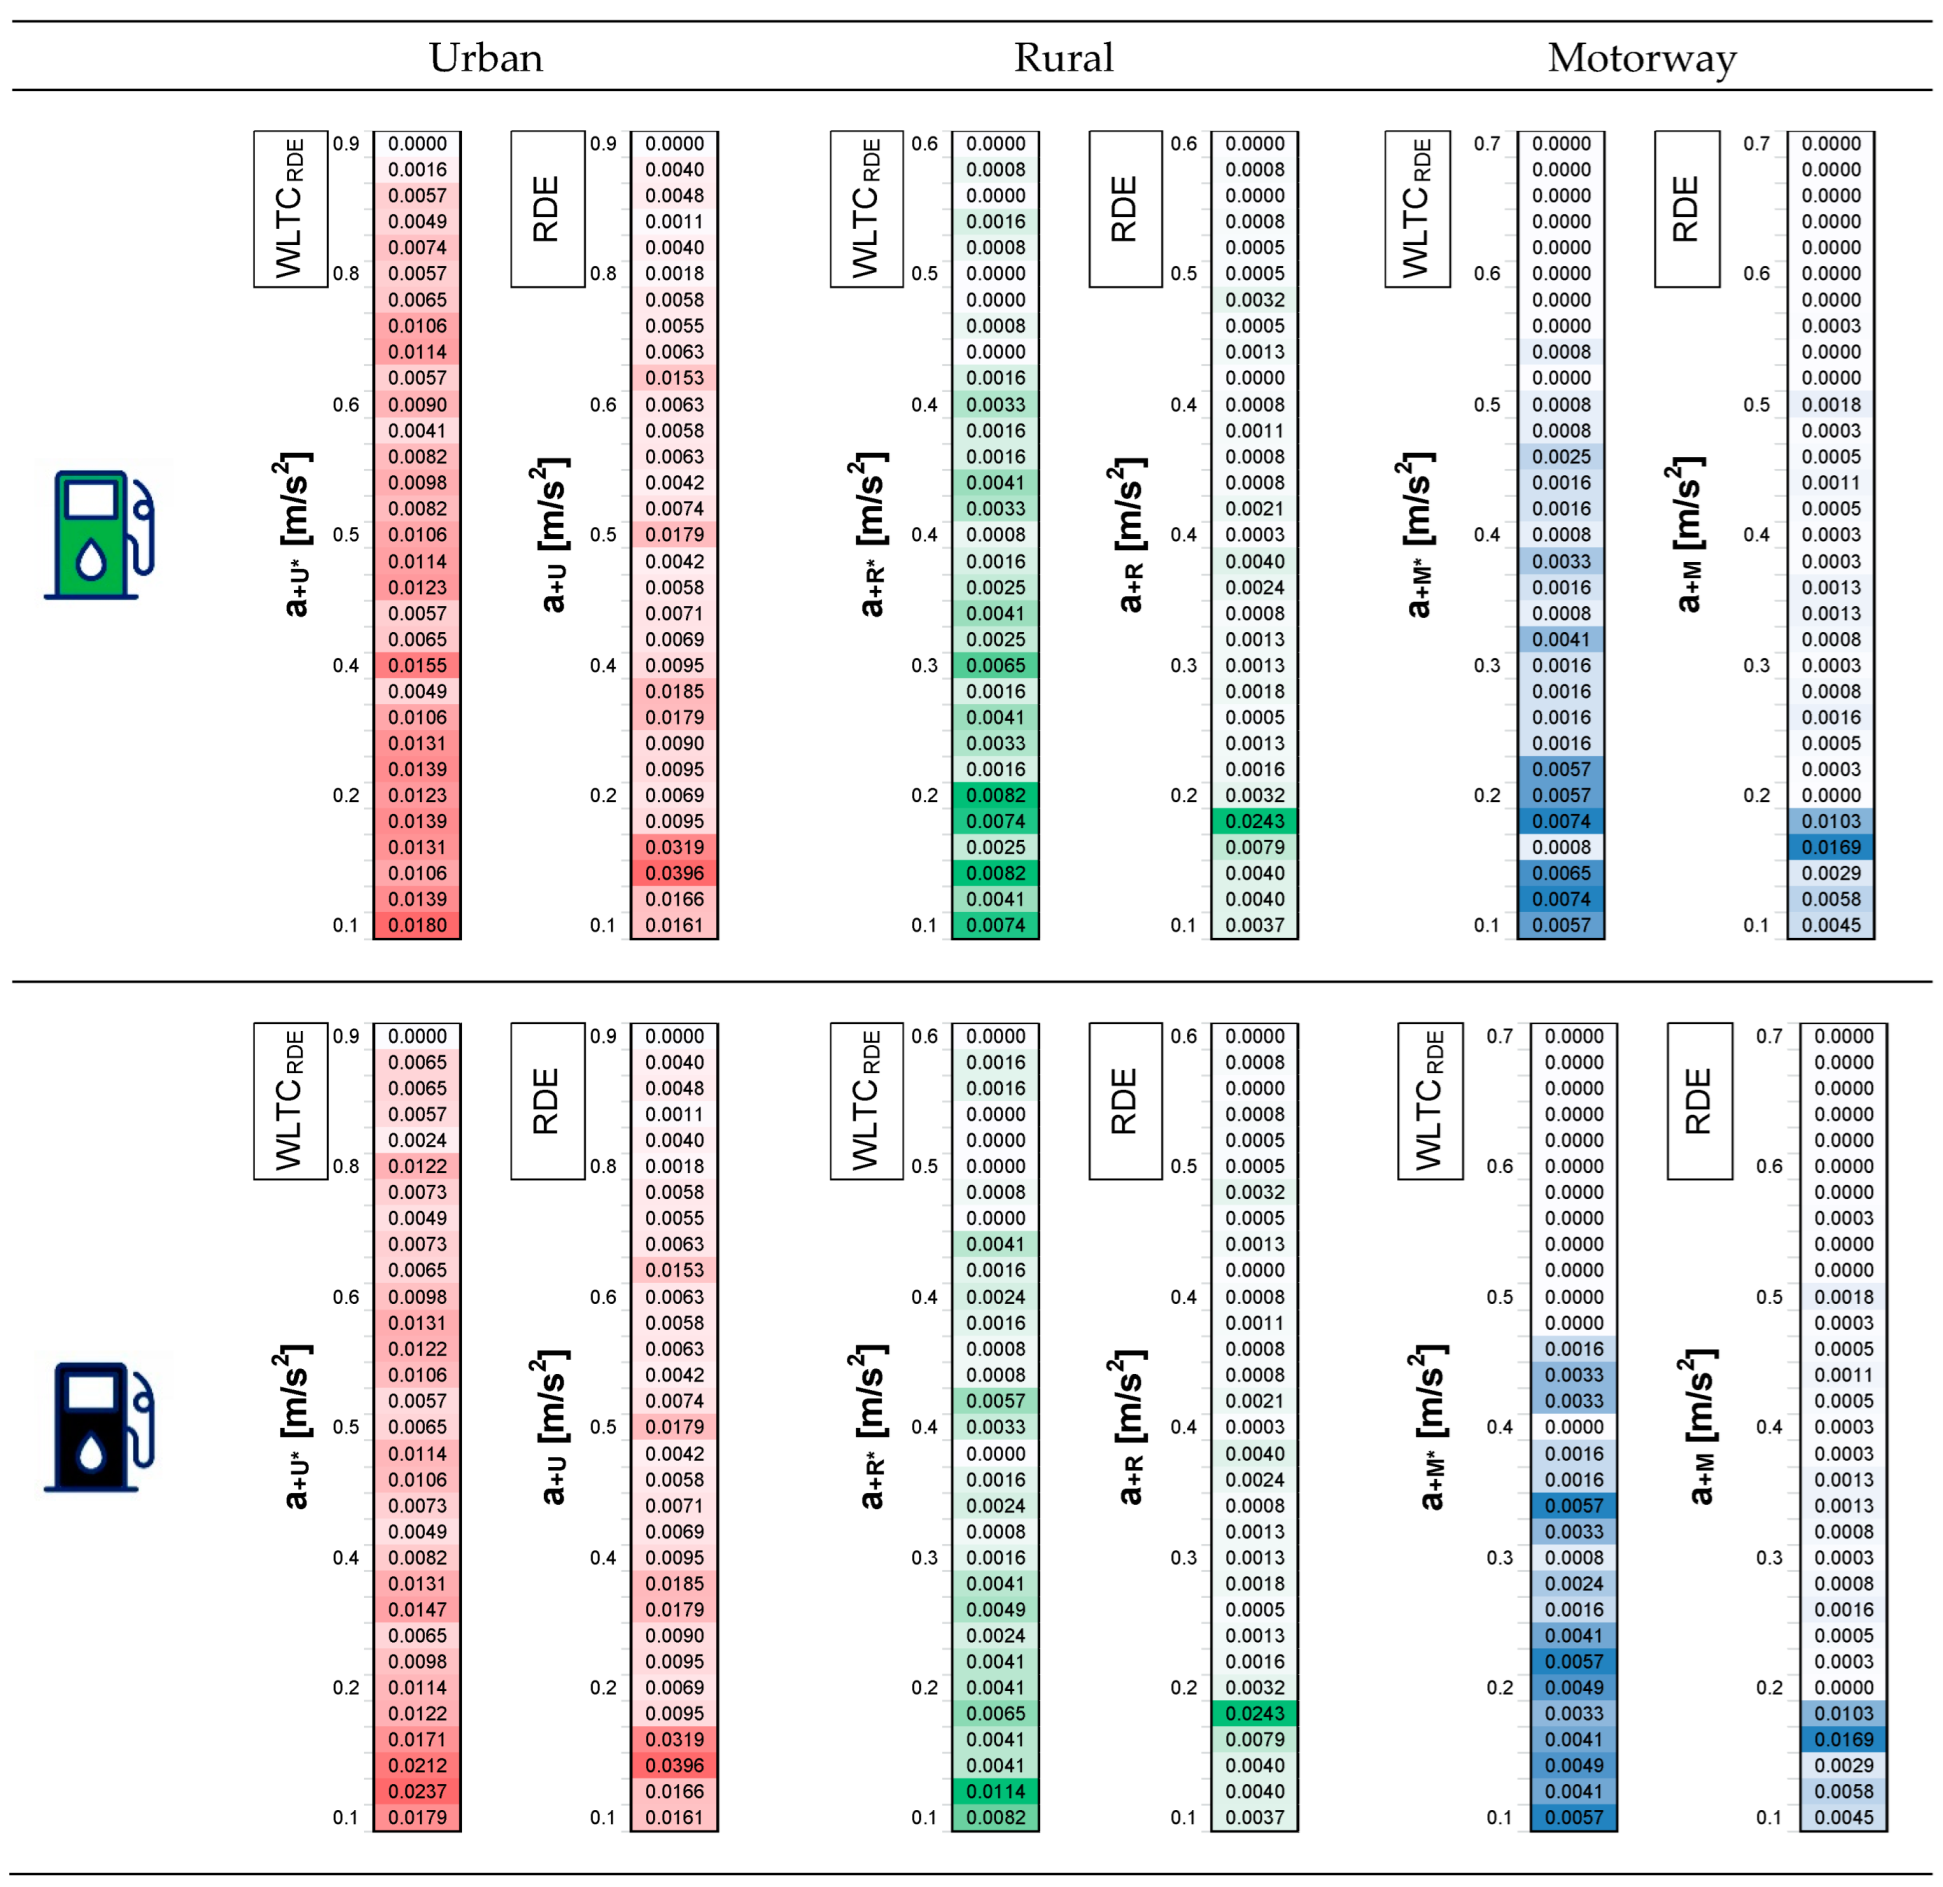
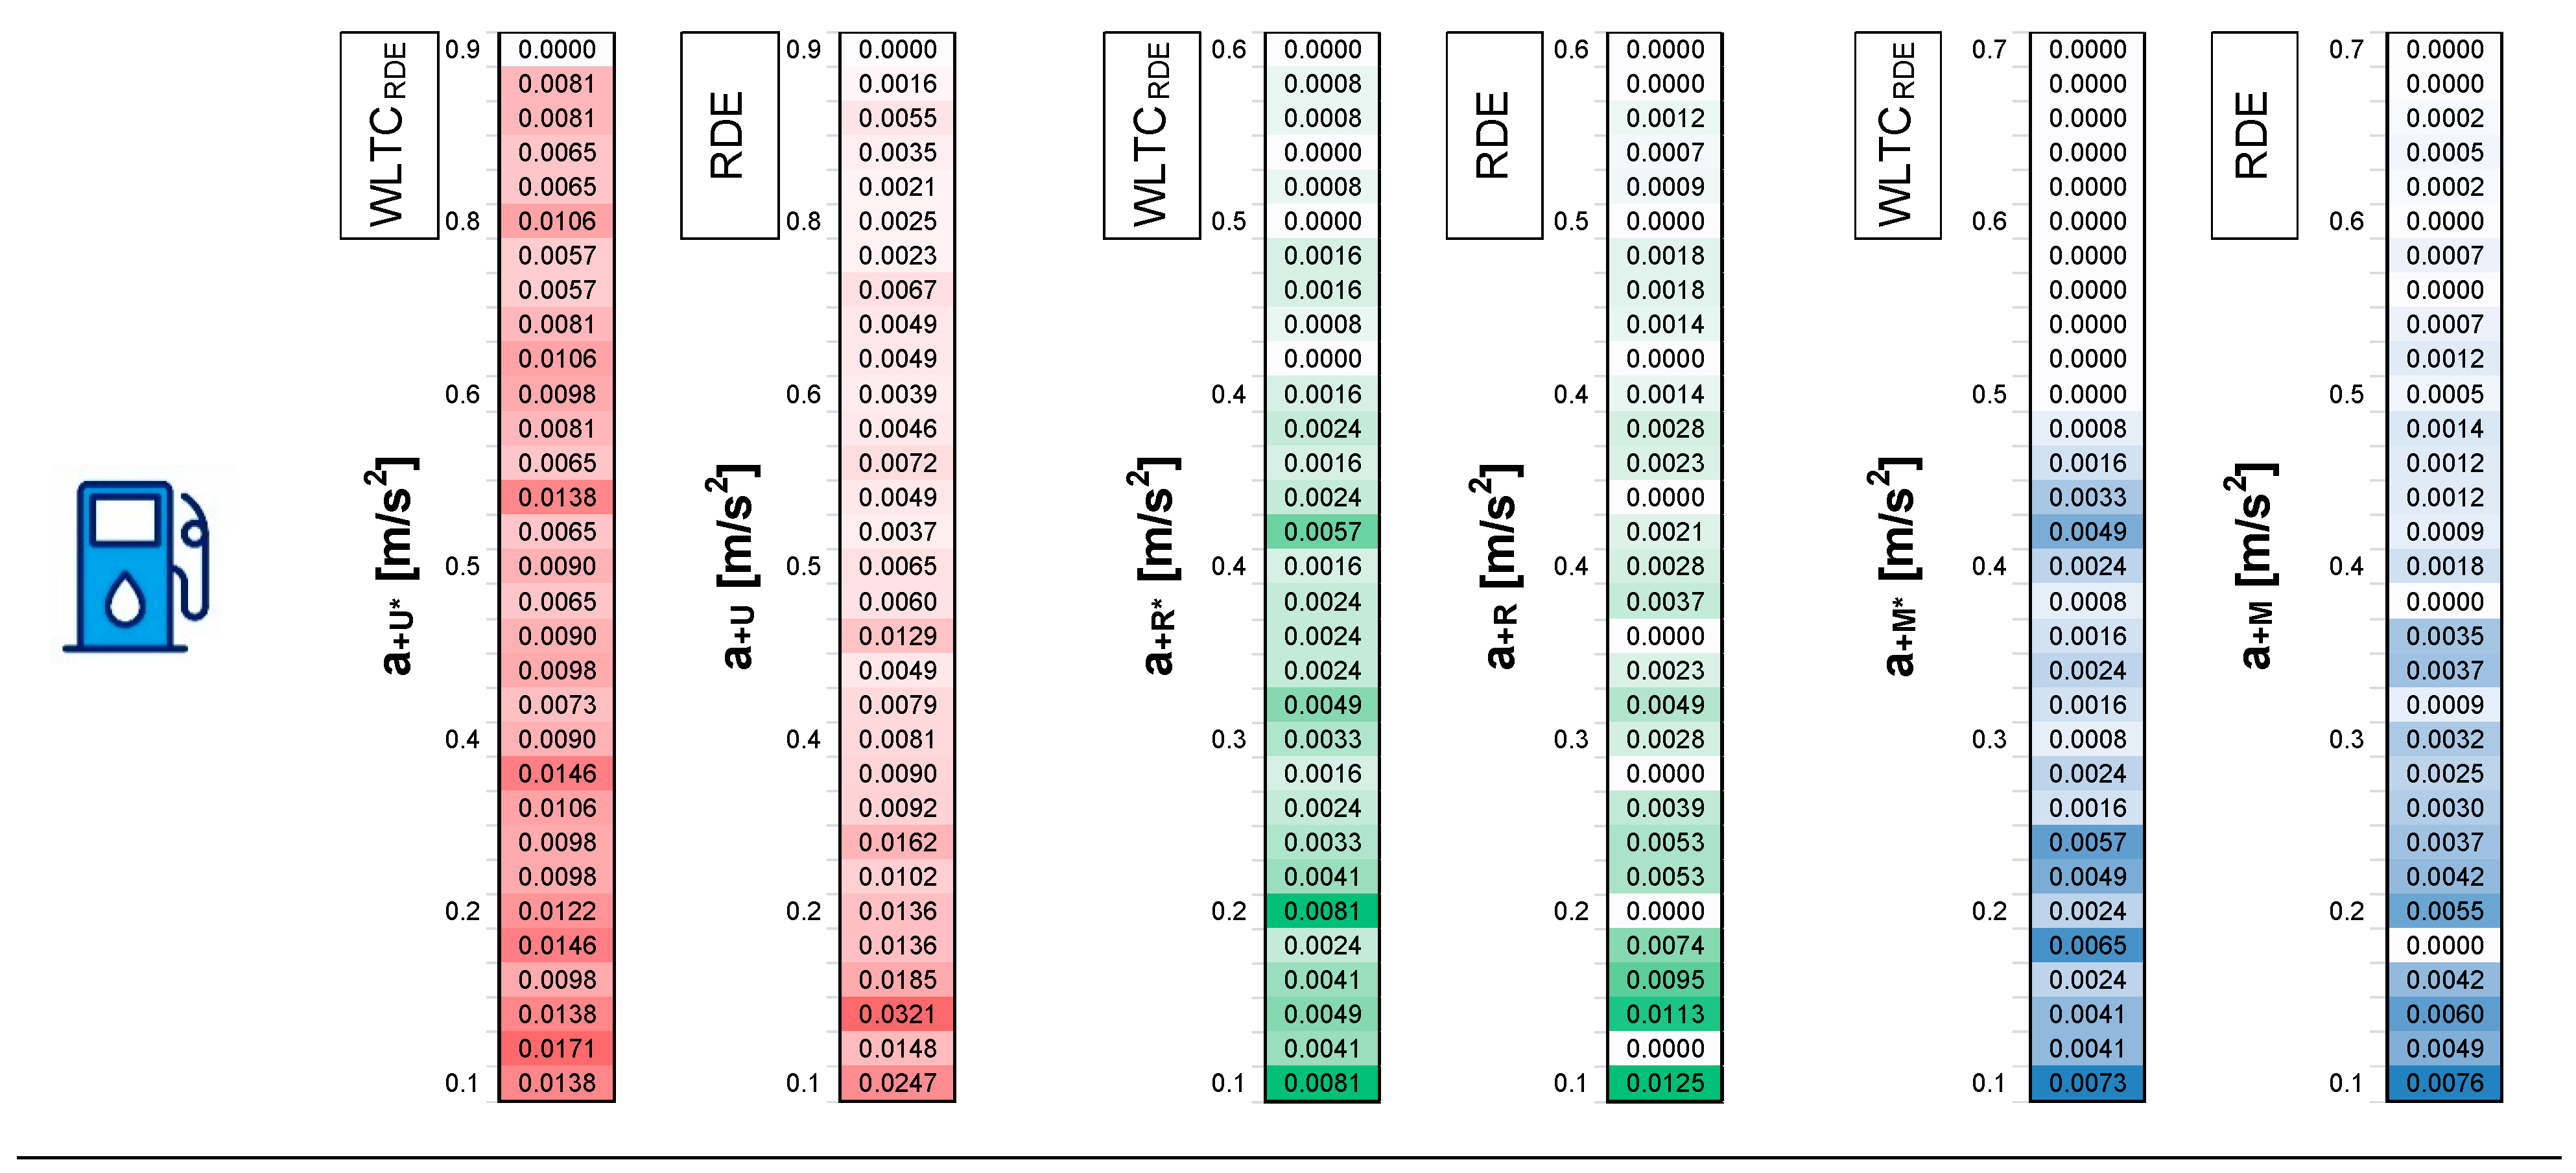
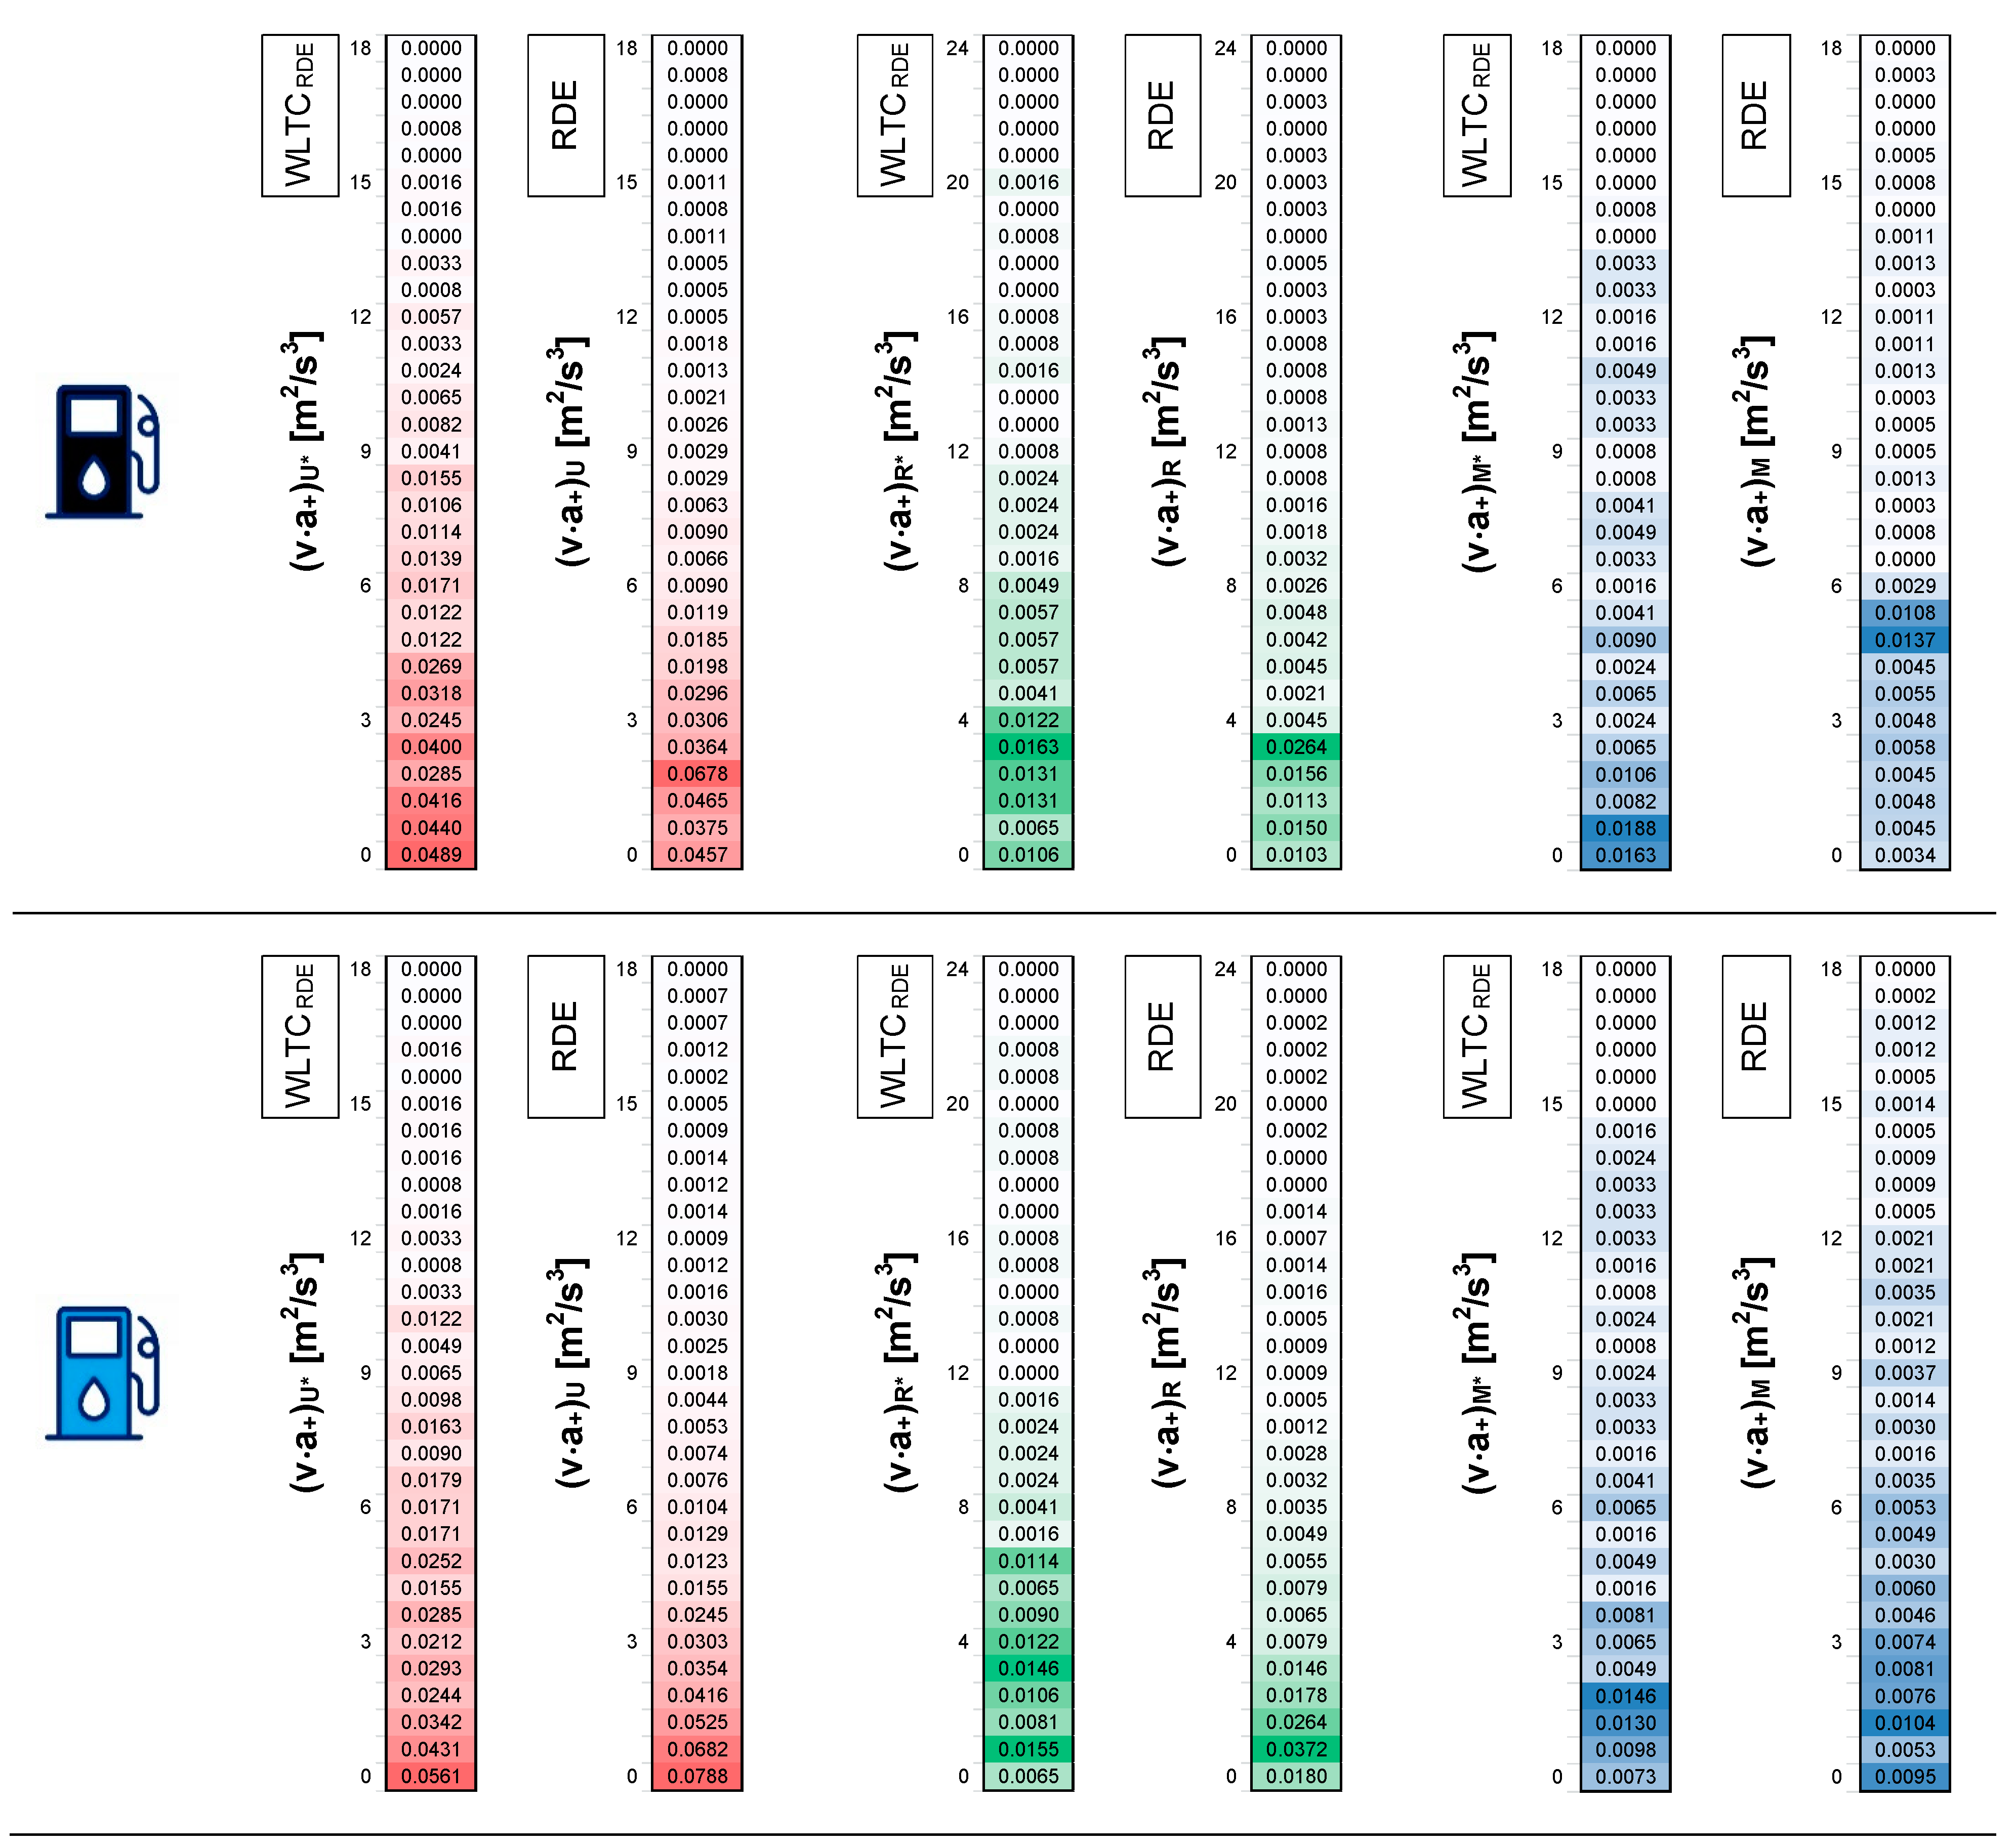
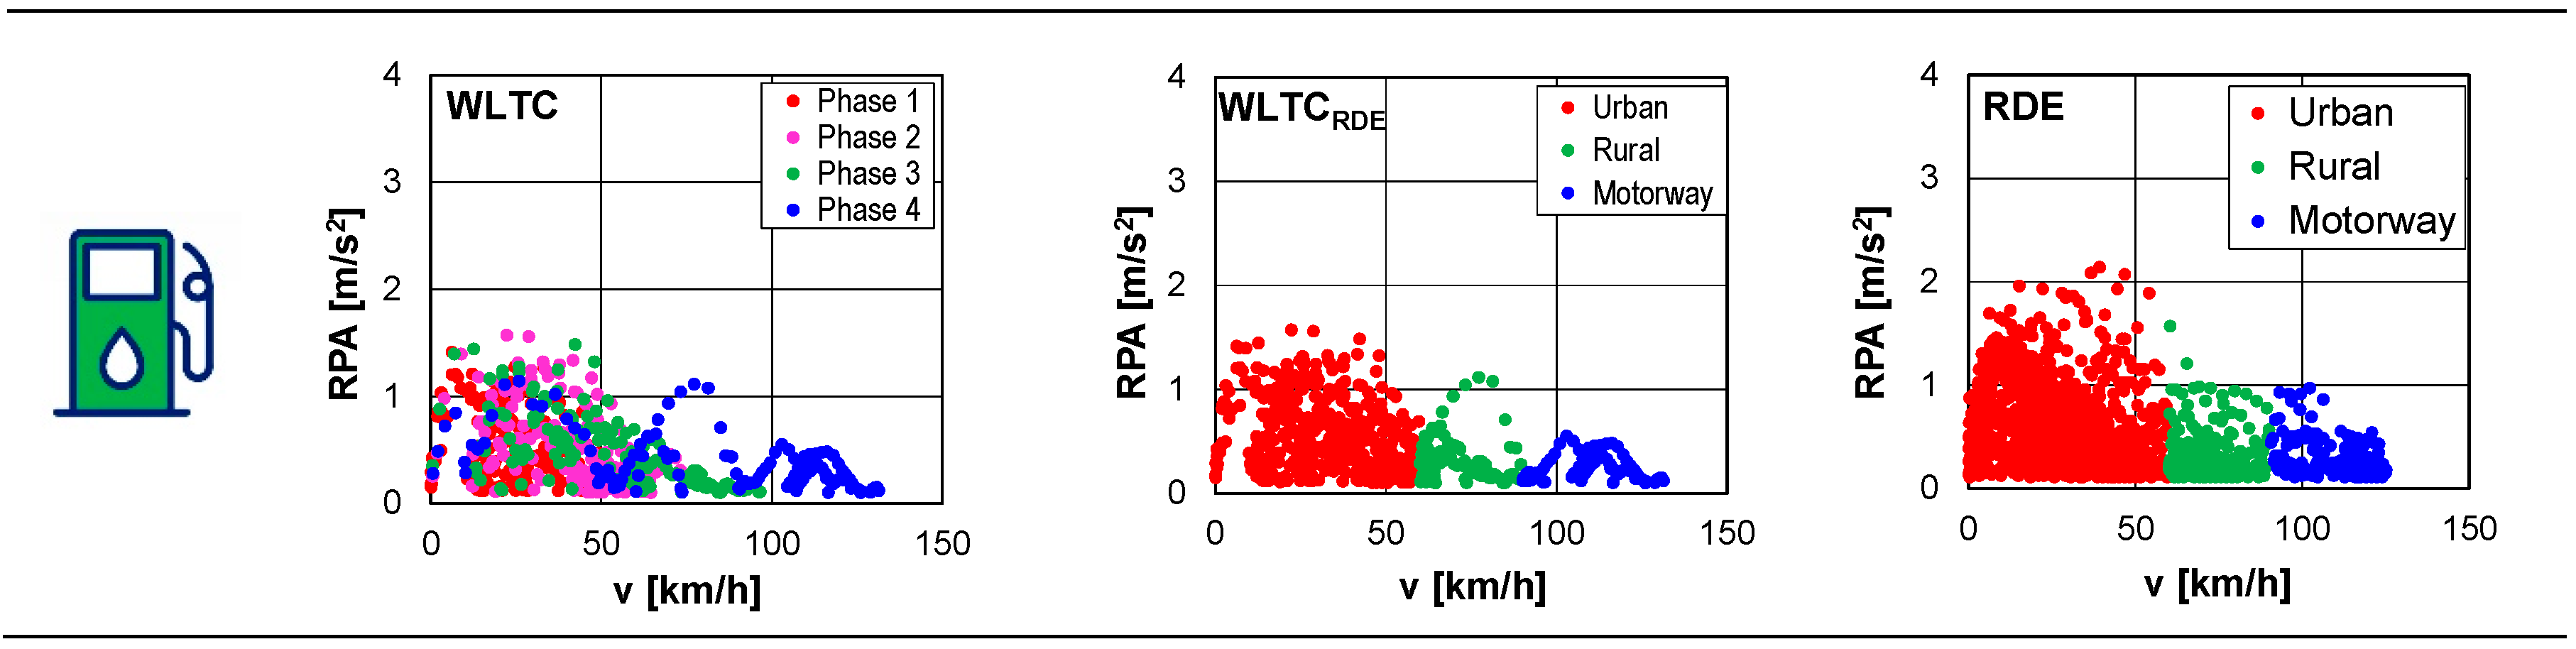
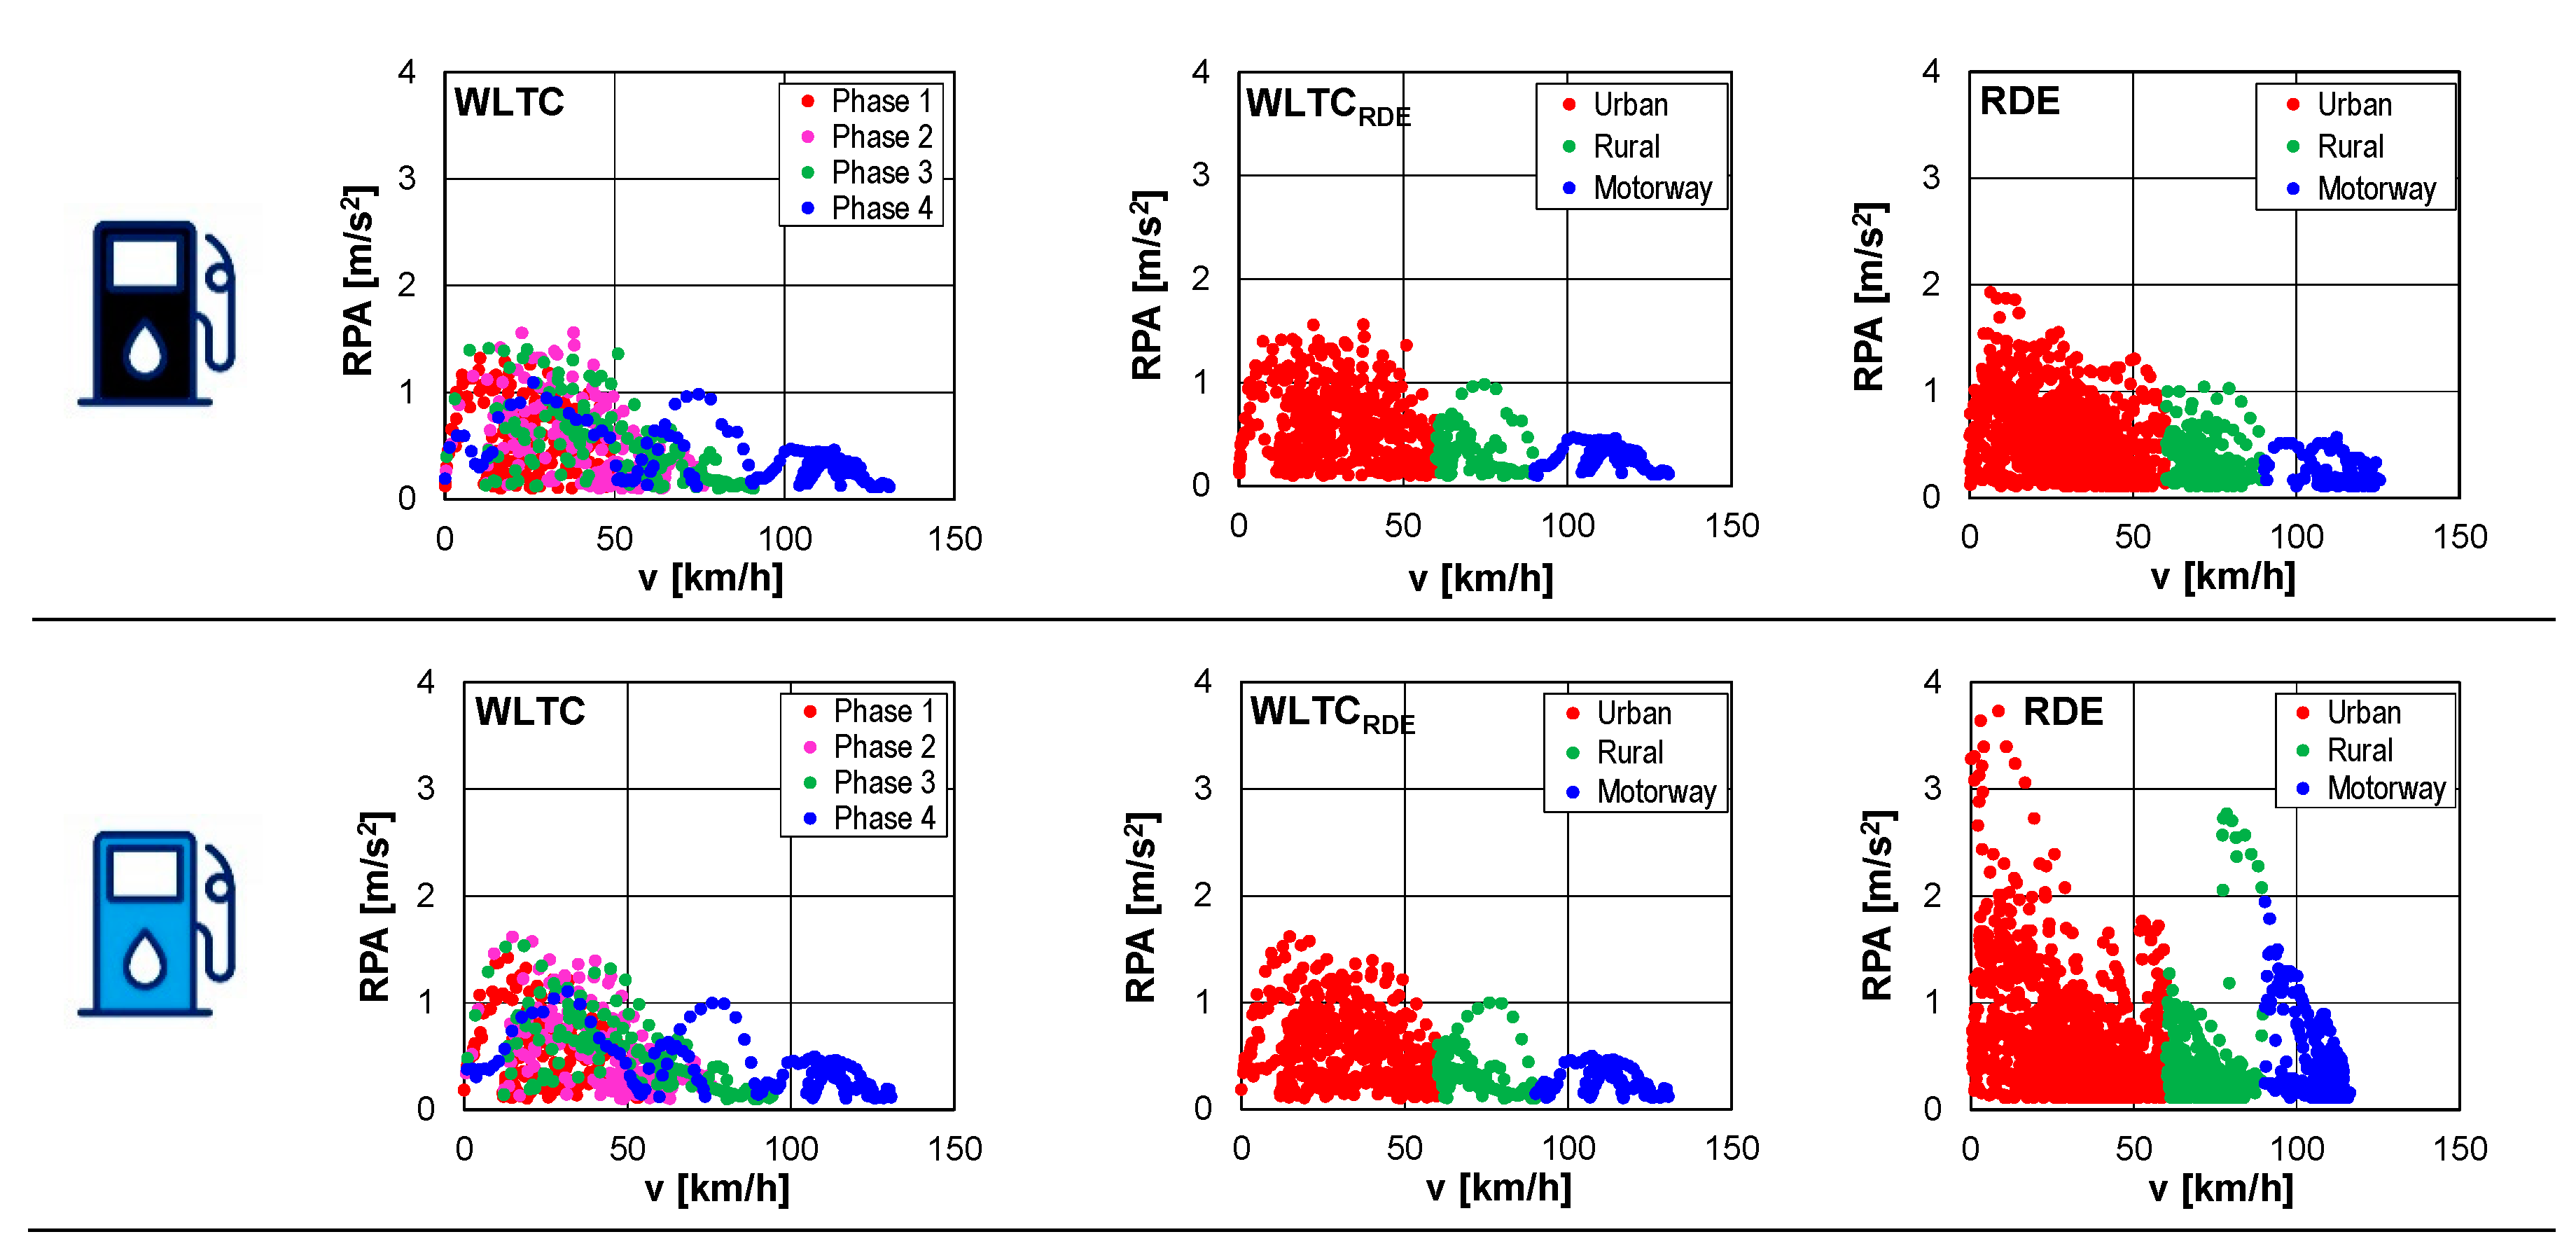
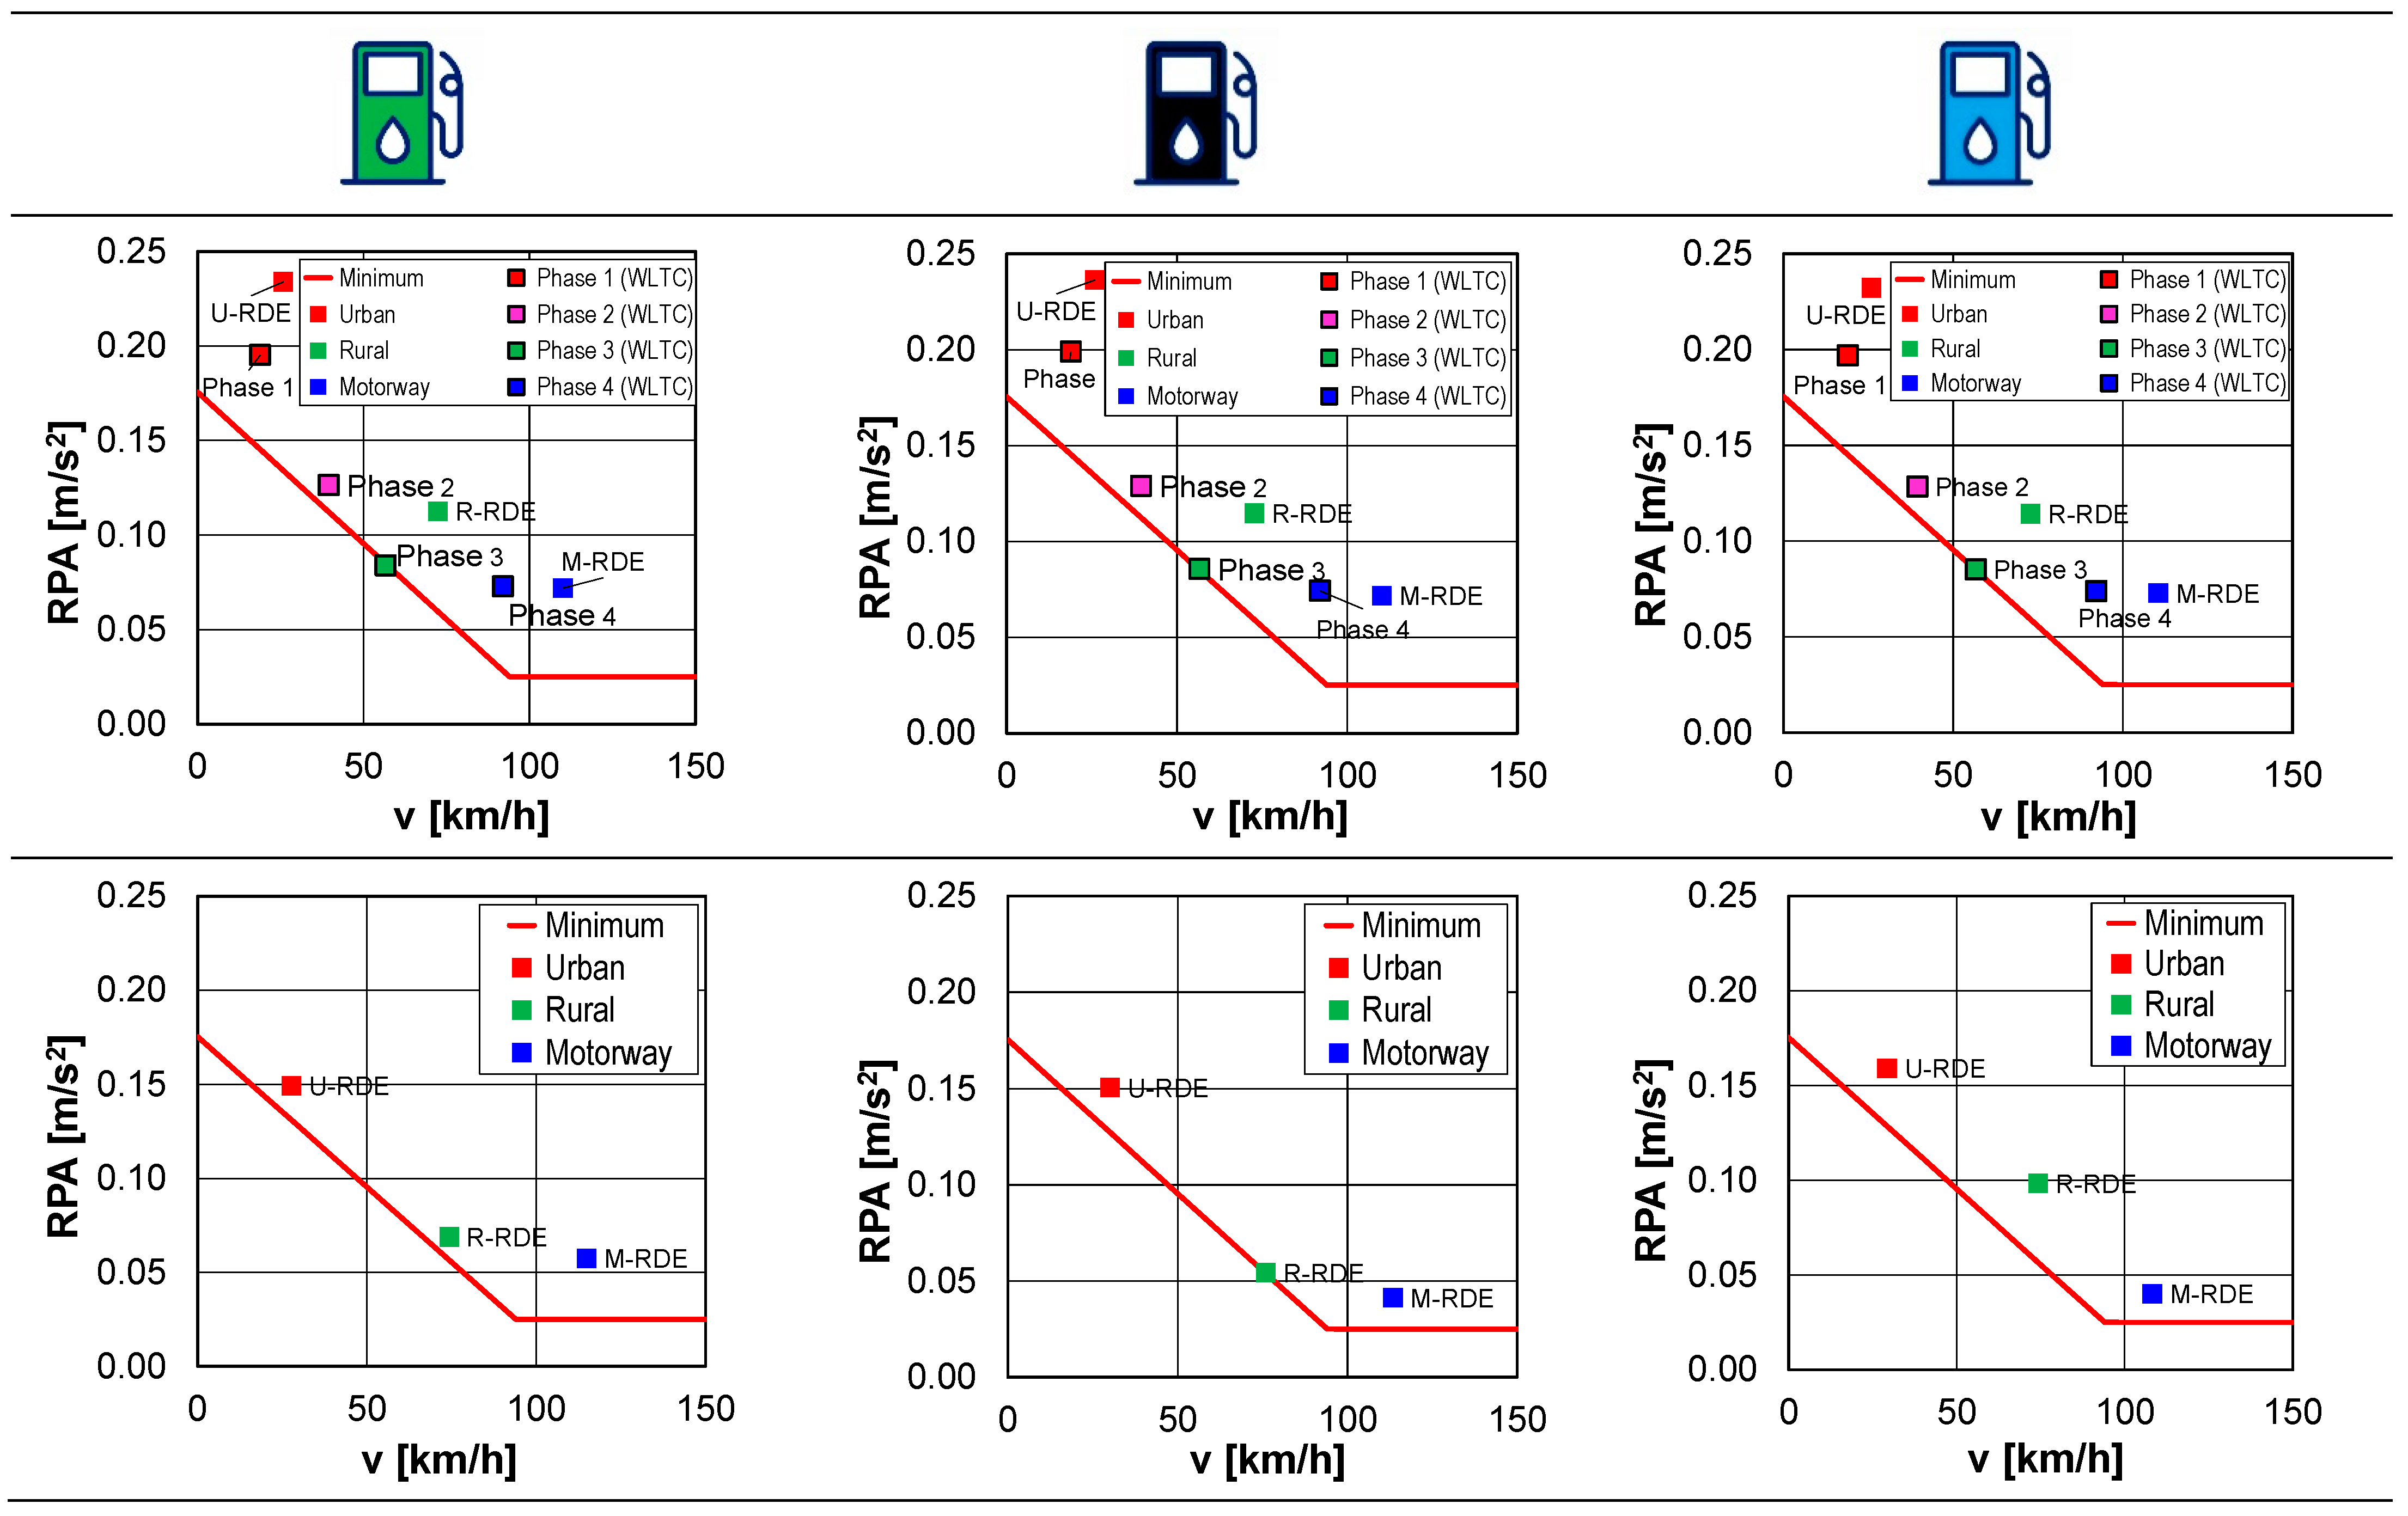
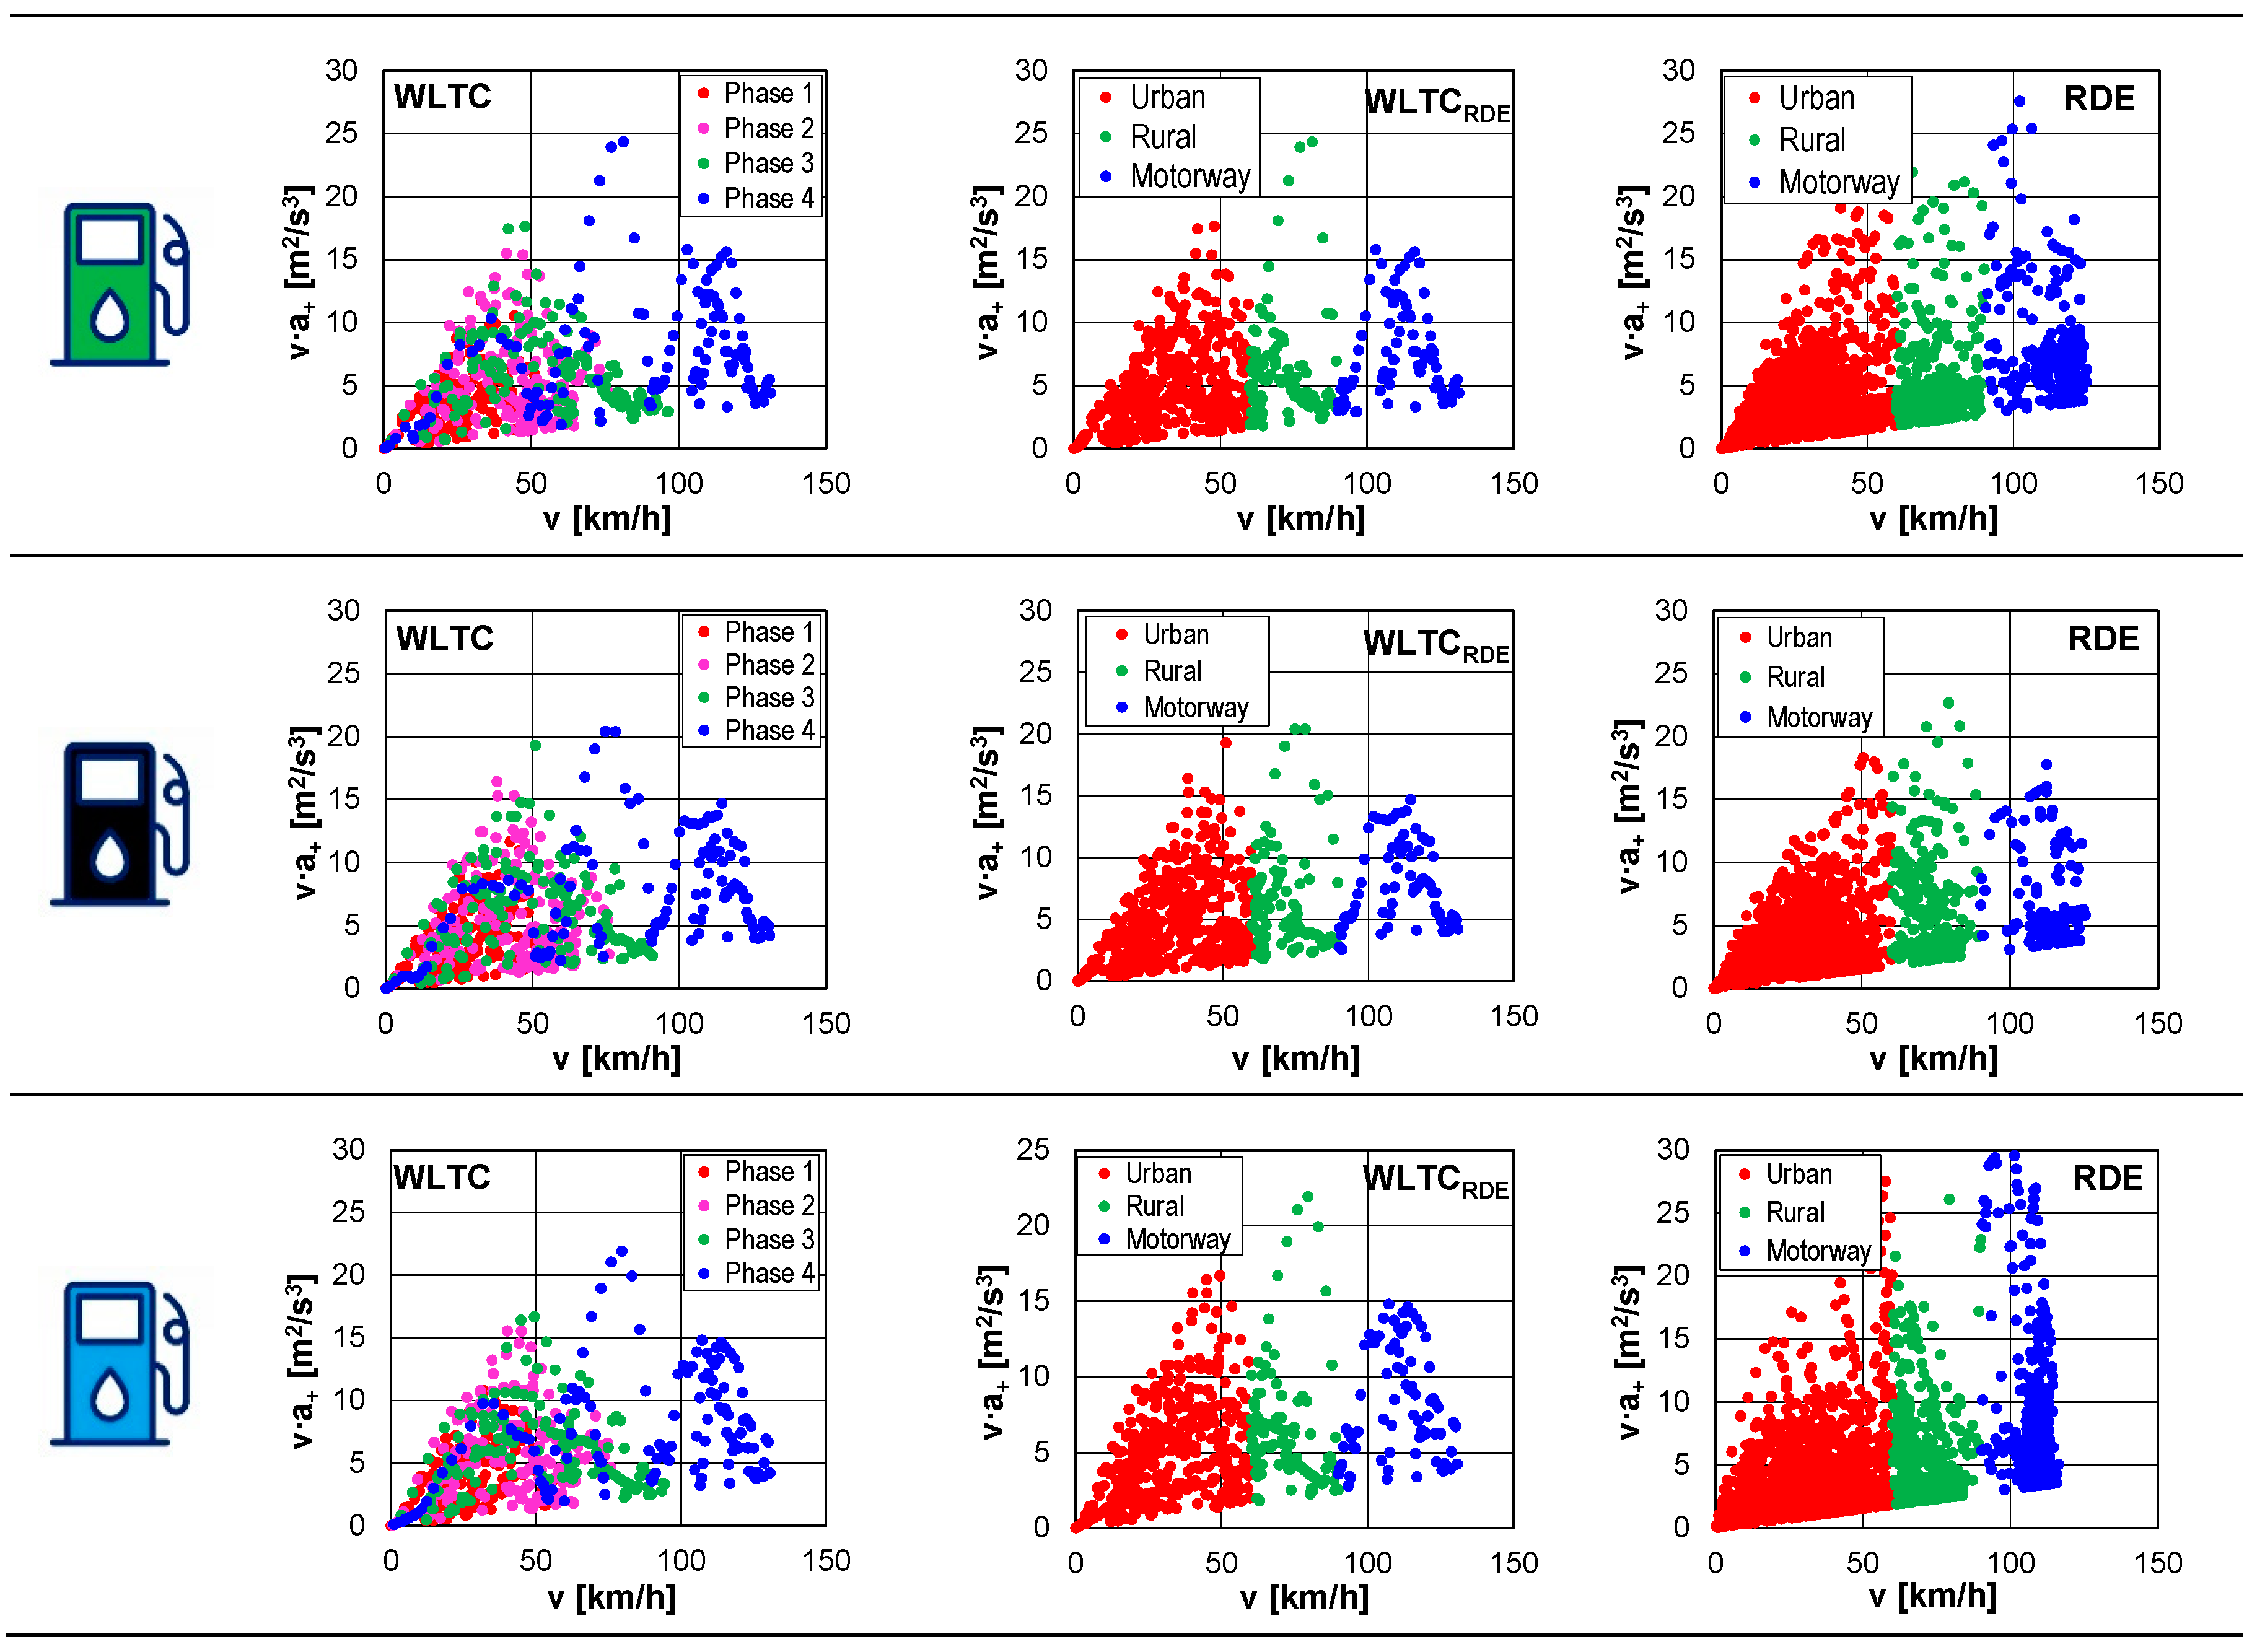
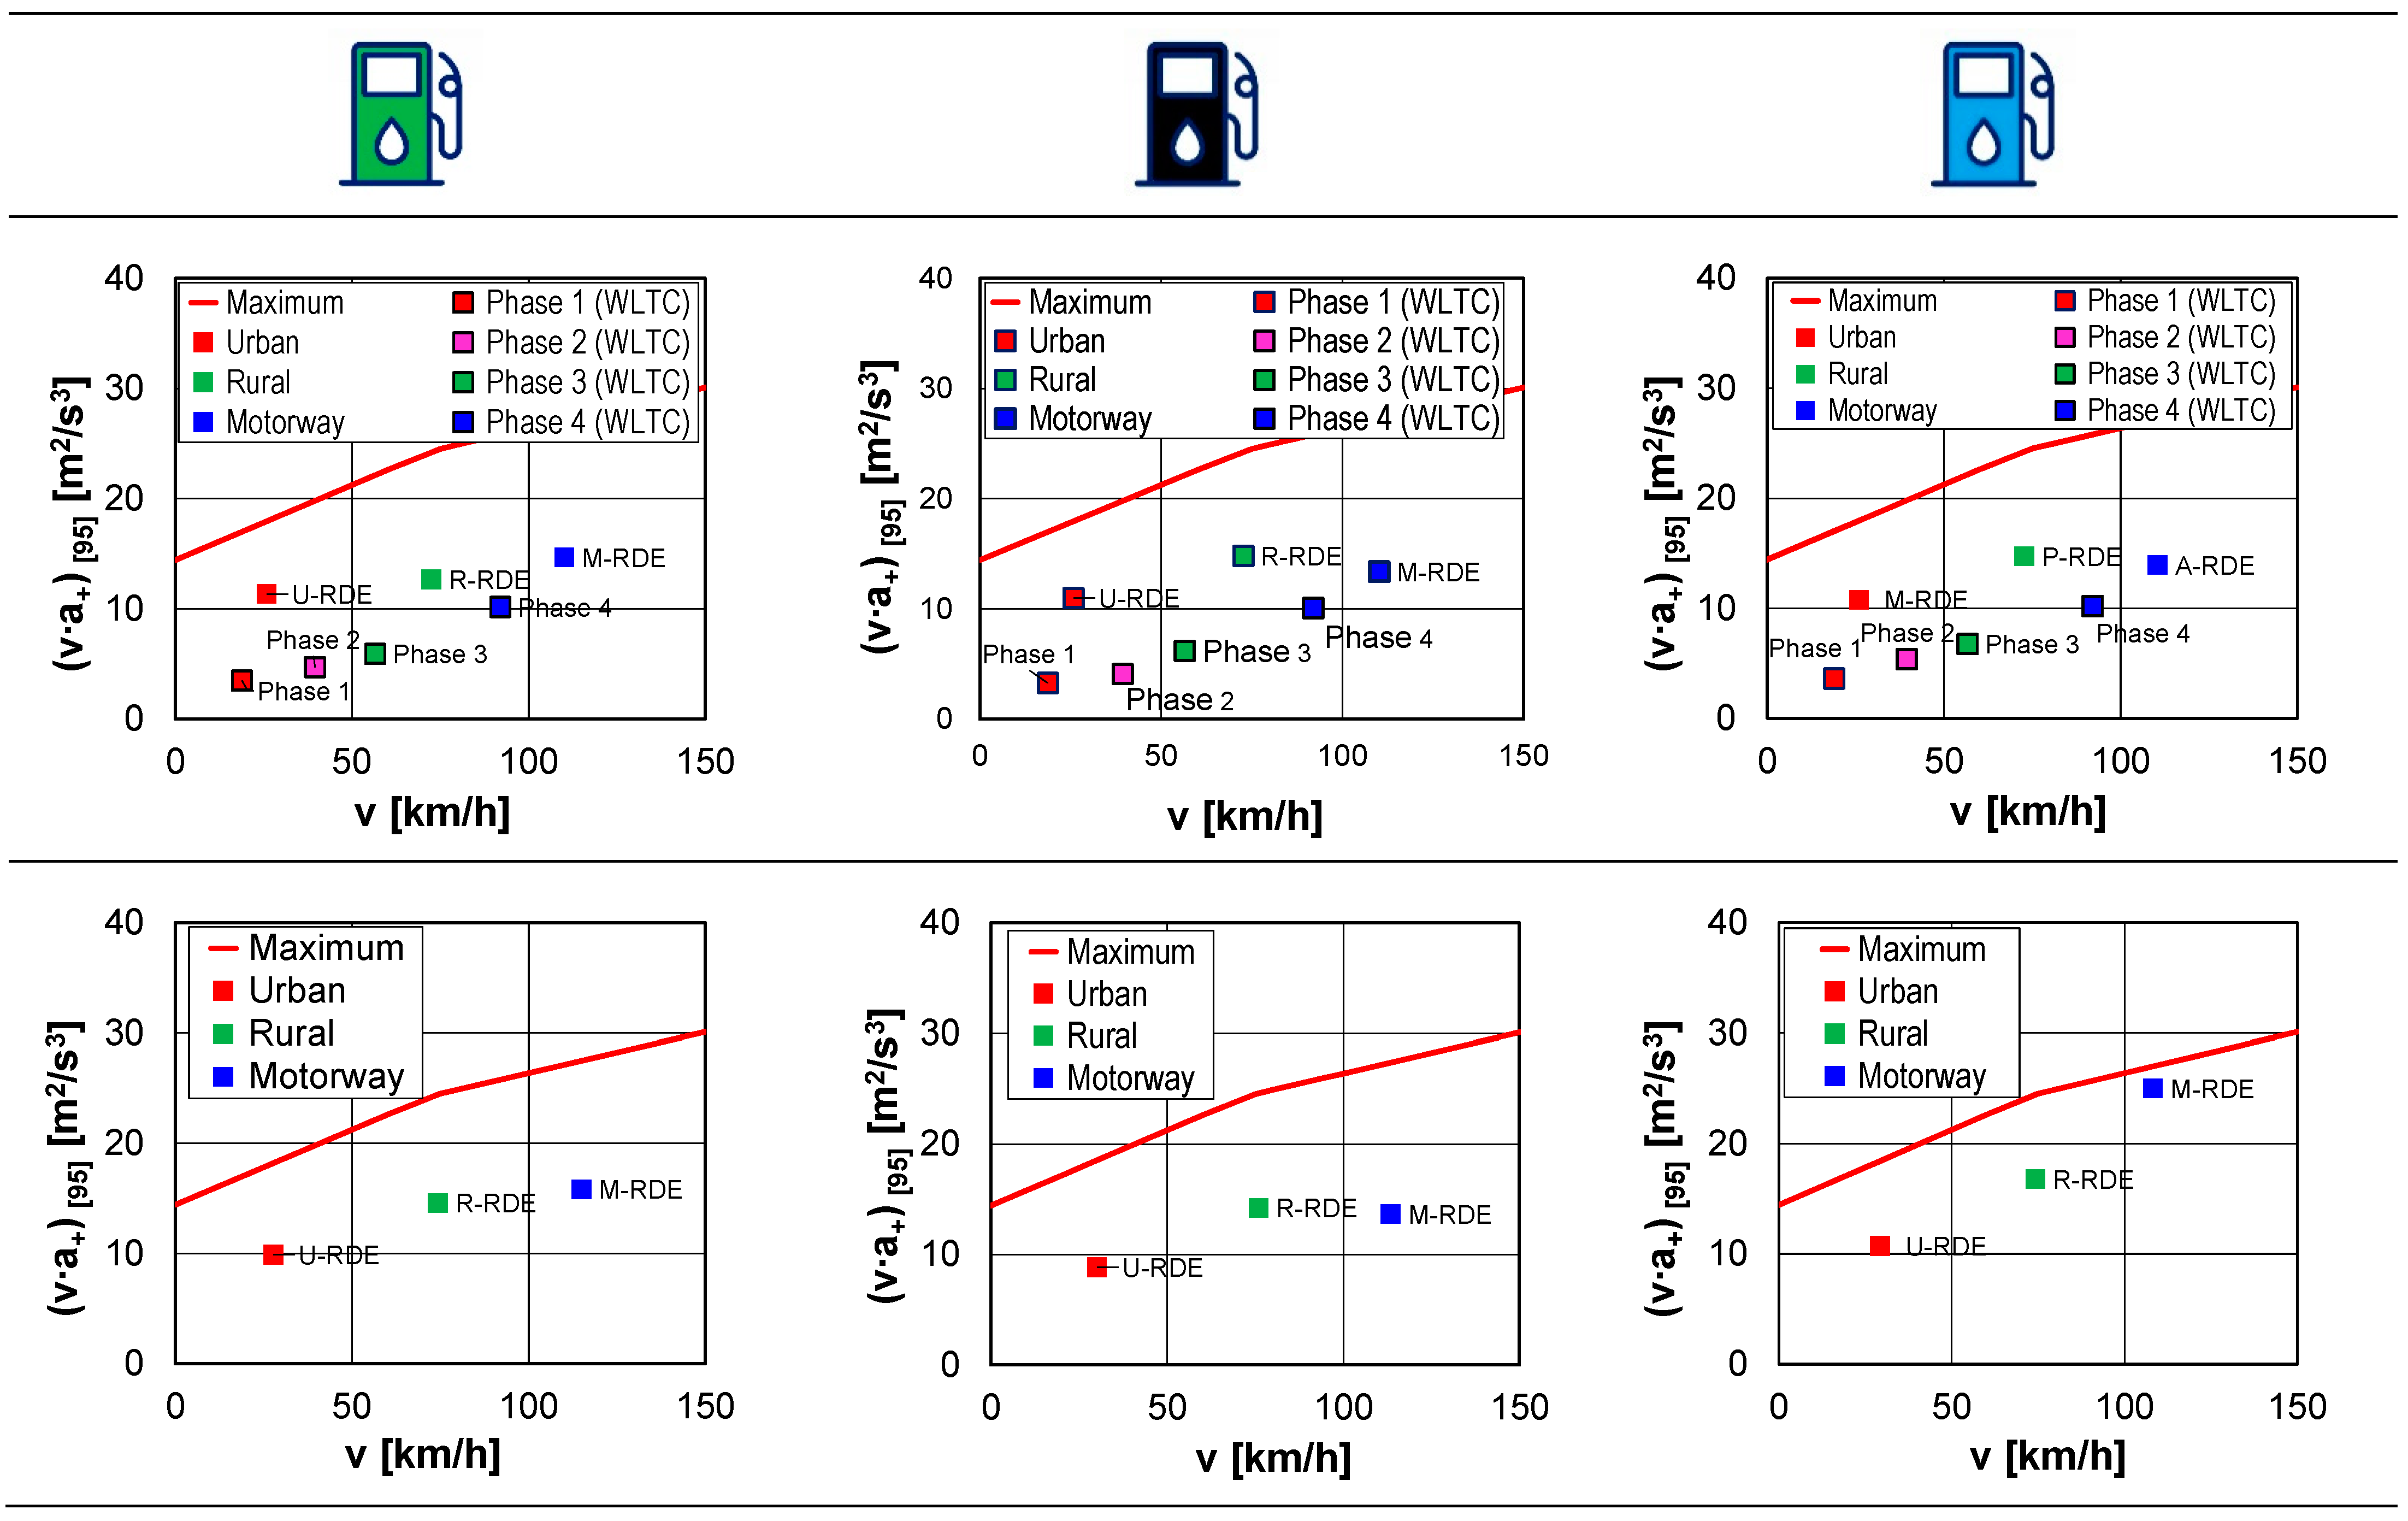
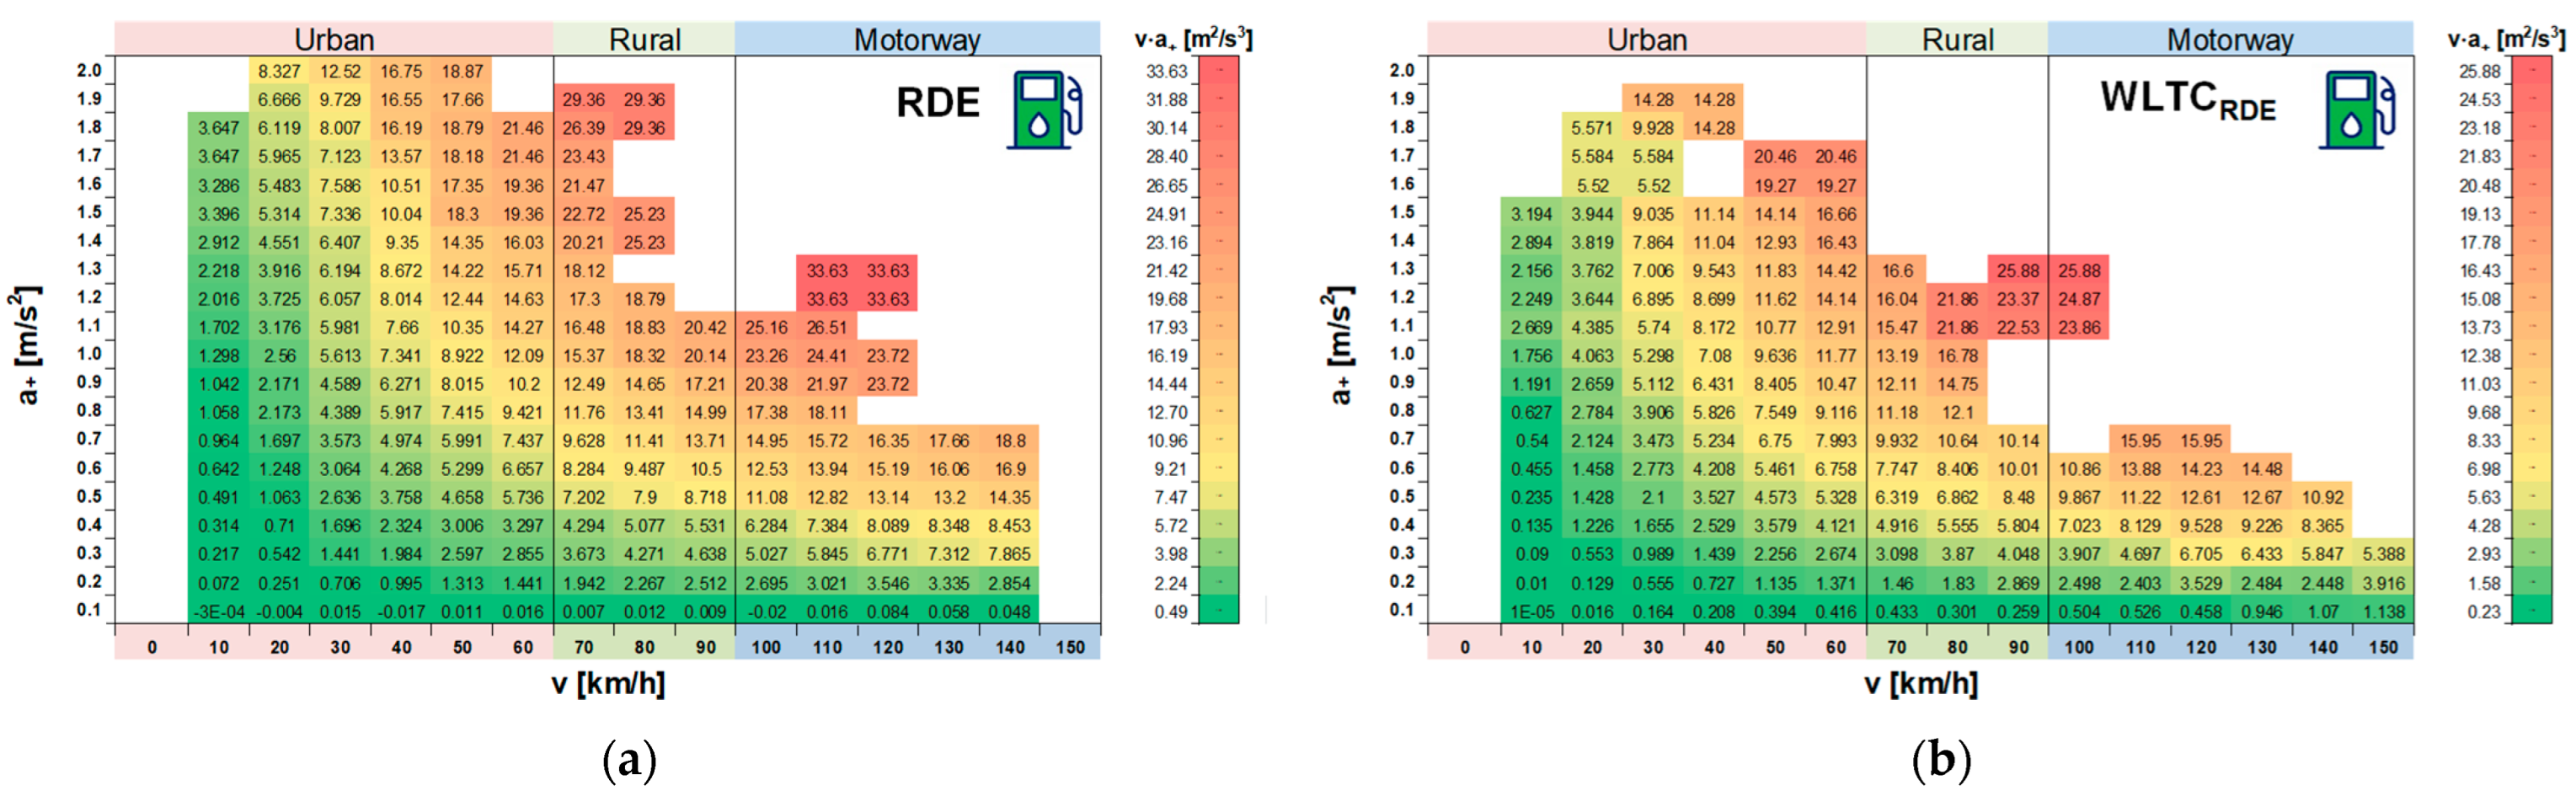
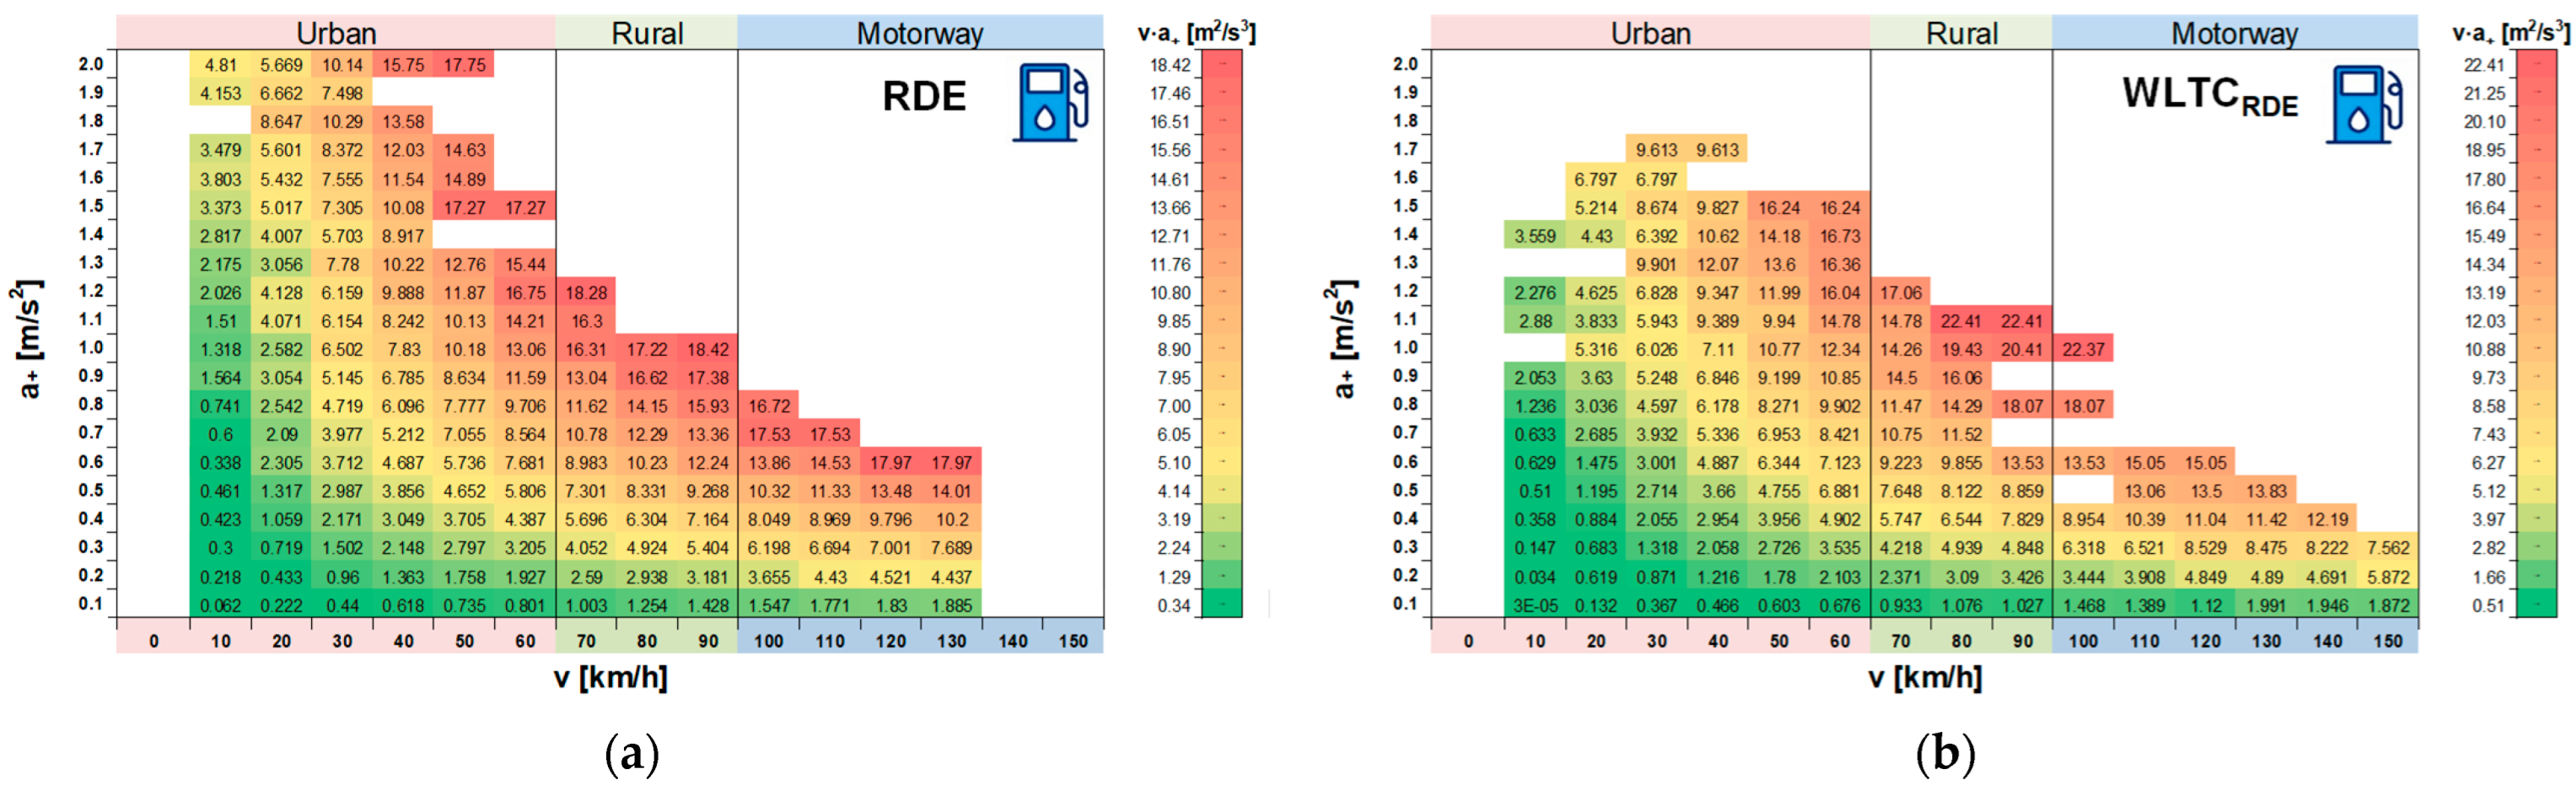
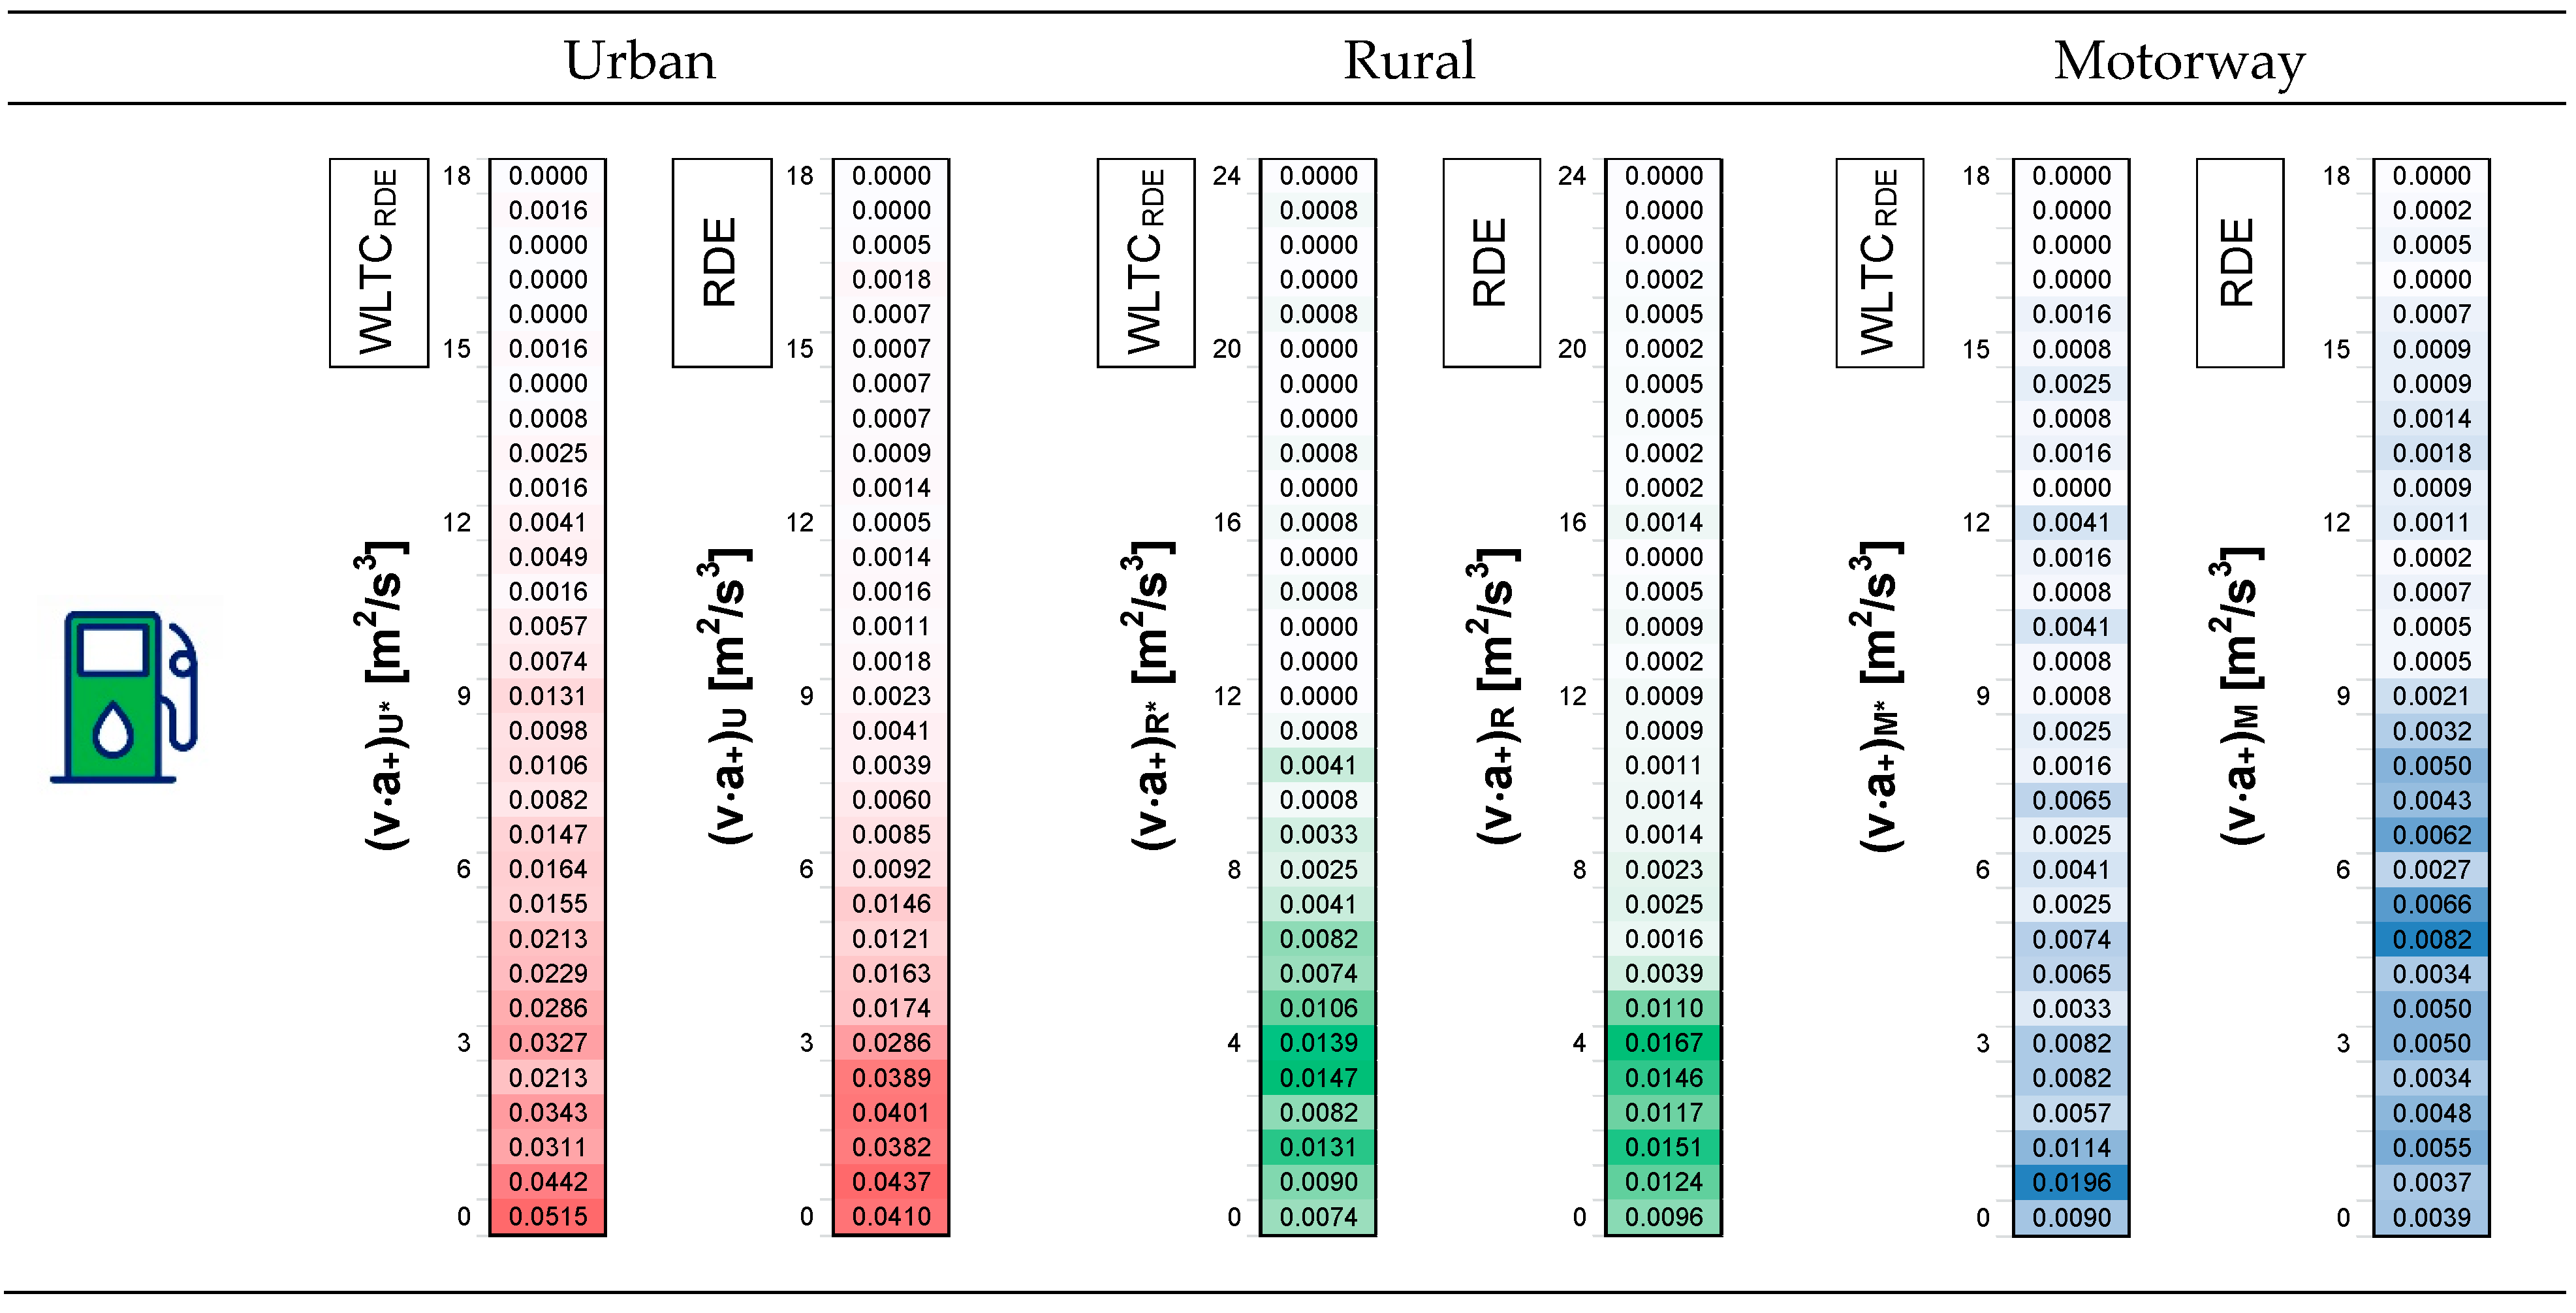
5.2. Comparing the Dynamic Tests Parameters

Another analyzed parameter was the product of velocity and positive acceleration (Figure 15). The results obtained according to the WLTCRDE and RDE procedures for a vehicle equipped with a gasoline engine were similar in the range from 0 m2/s3 to 6 m2/s3 (in the urban section). There were also similarities in similar proportions (ranges) for a vehicle equipped with a diesel engine and for a vehicle with a hybrid drive. In the rural section, there was a notable similarity for vehicles equipped with gasoline and diesel engines (a large share of the parameter in the lower range of 0–84 m2/s3). However, in the highway section, there was no clear similarity between the chassis dynamometer test and real driving conditions. However, when considering the traffic conditions for the same measurement tests (WLTC and RDE separately), it could be assumed that they were very similar to each other, which was not surprising for the dynamometer tests, but confirms the repeatability of road tests.
The assessment of dynamic parameters, defined as relative positive acceleration and the 95th percentile of velocity and positive acceleration is a requirement for testing in real driving conditions. This procedure was used in the WLTC test (divided into 4 phases) performed on the chassis dynamometer, in the WLTC test divided into 3 phases matching the RDE procedure in the test designated as WLTCRDE, and in the RDE road test. The results for relative positive acceleration were shown for all measurement points and collectively for each considered drive phase.
The data on the driving dynamics, which depended on vehicle speed for all analyzed cases (WLTC, WLTCRDE, and RDE research procedures) for the three tested vehicles (equipped with a gasoline engine, a diesel engine, and a hybrid drive), were compiled (Figure 16). The following characteristics indicated the distribution similarity of the obtained results, and the values of the RPA travel dynamics parameter did not exceed 2.0 m/s2. The data obtained in real road driving conditions was an exception to this, especially for the hybrid vehicle. In that case, the RPA reached momentary values of up to 4 m/s2, and their distribution differed from the other values.
The division of the chassis dynamometer tests performed in accordance with the requirements of the WLTP procedure highlighted the use of minimum speeds in each test phase, which made it impossible to directly compare them with the sections occurring in road tests. However, the initial comparison of the WLTCRDE procedure and the RDE procedure allowed the data to be compared with each other, which is shown further in this article. The average driving dynamics values were determined (for the WLTC, WLTCRDE—presented together, and RDE test sections), using the instantaneous values of the relative positive acceleration calculated in this research. Additionally, in order to verify test correctness, a red line was placed on the graphs which was used to indicate the minimum value of the RPA parameter (Figure 17) (in accordance with the RDE procedure). The obtained data showed that in all cases, the values were not lower than the minimum value. This means that the driving tests were carried out in accordance with the legislative requirements (in terms of test dynamics). The charts could also be used to compare the values obtained according to both the WLTC and WLTCRDE tests. The obtained characteristics indicated that the averaged values from each of the phases were not the same for the different measurement procedures. In the case of a vehicle equipped with a petrol engine, the RPA parameter values were similar for both the WLTCRDE and RDE procedures, but only in the motorway section. In other cases, the dynamics determined in the WLTC test were not consistent with the RDE test. However, a relationship can be noticed which proves that combining phases 1 and 2 of the WLTC test brought the driving dynamics calculated for these phases closer to the urban section of the RDE test.
Determining the final values of the 95th percentile of the product of speed and positive acceleration, results in a notable similarity in the WLTC test (done according to the RDE procedure—Figure 18) and in the RDE test (Figure 19). Additionally, in order to verify test correctness, a red line was placed on the graphs, which indicates the maximum value of the 95th percentile of speed and positive acceleration (in accordance with the RDE procedure). It was found that in all cases the obtained values did not exceed the maximum value. This means that the test drives carried out met the legislative requirements (in terms of test dynamics). The obtained characteristics indicated that the mean values of the parameter in question from the test phases marked as WLTCRDE corresponded to the values determined in the RDE test to a much better extent.

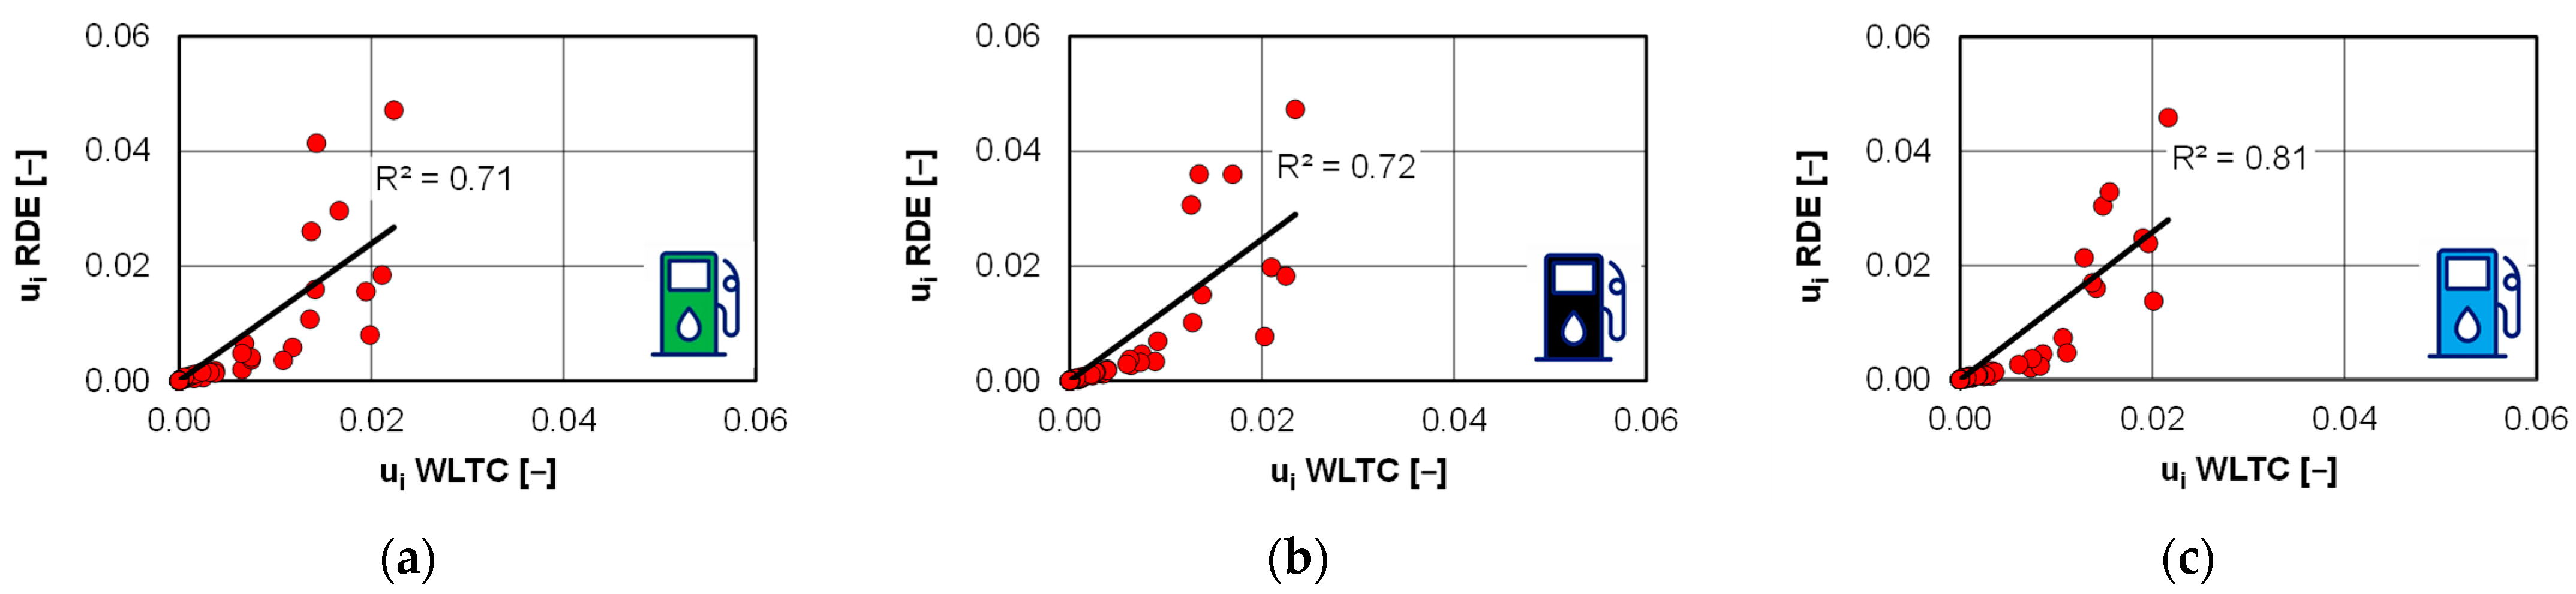
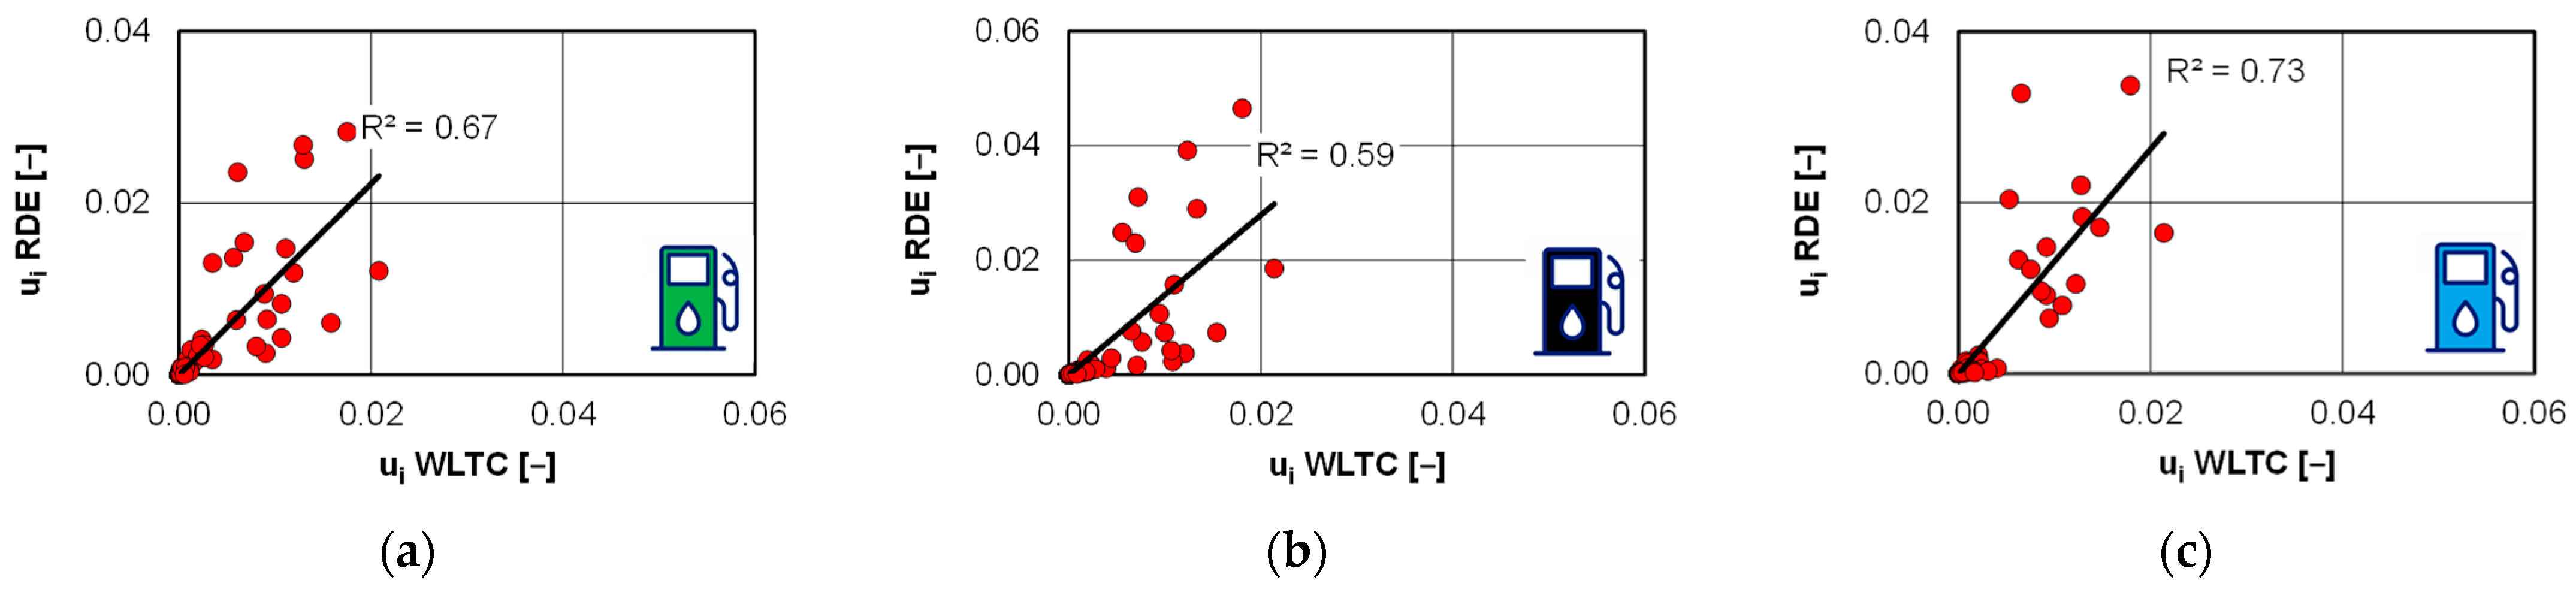
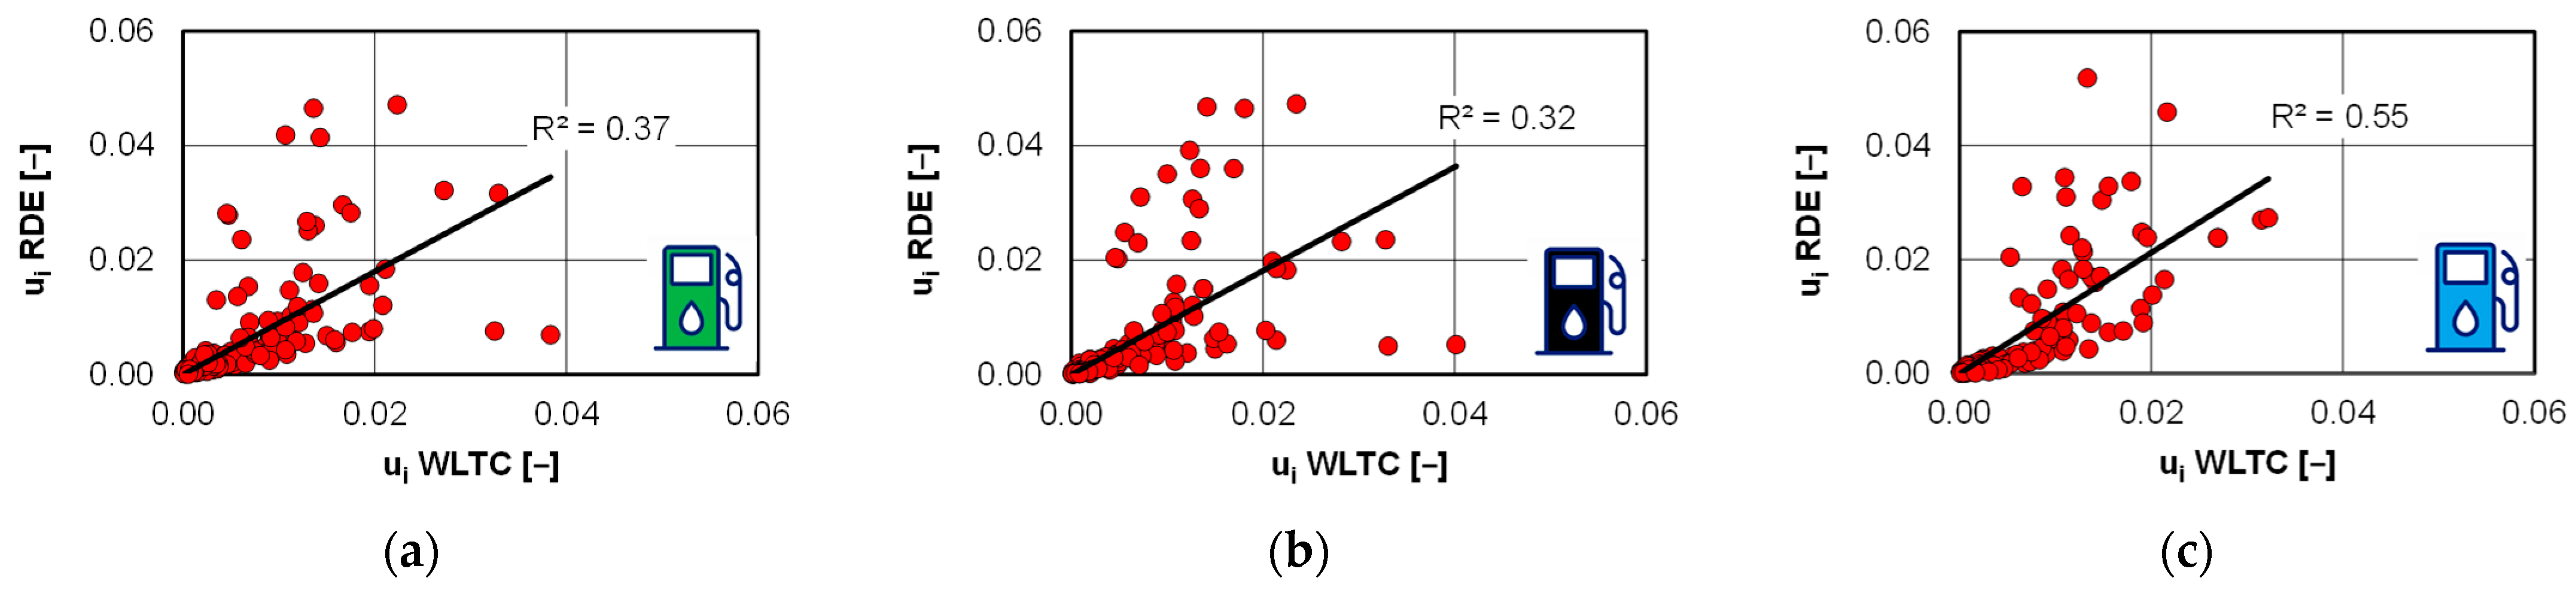
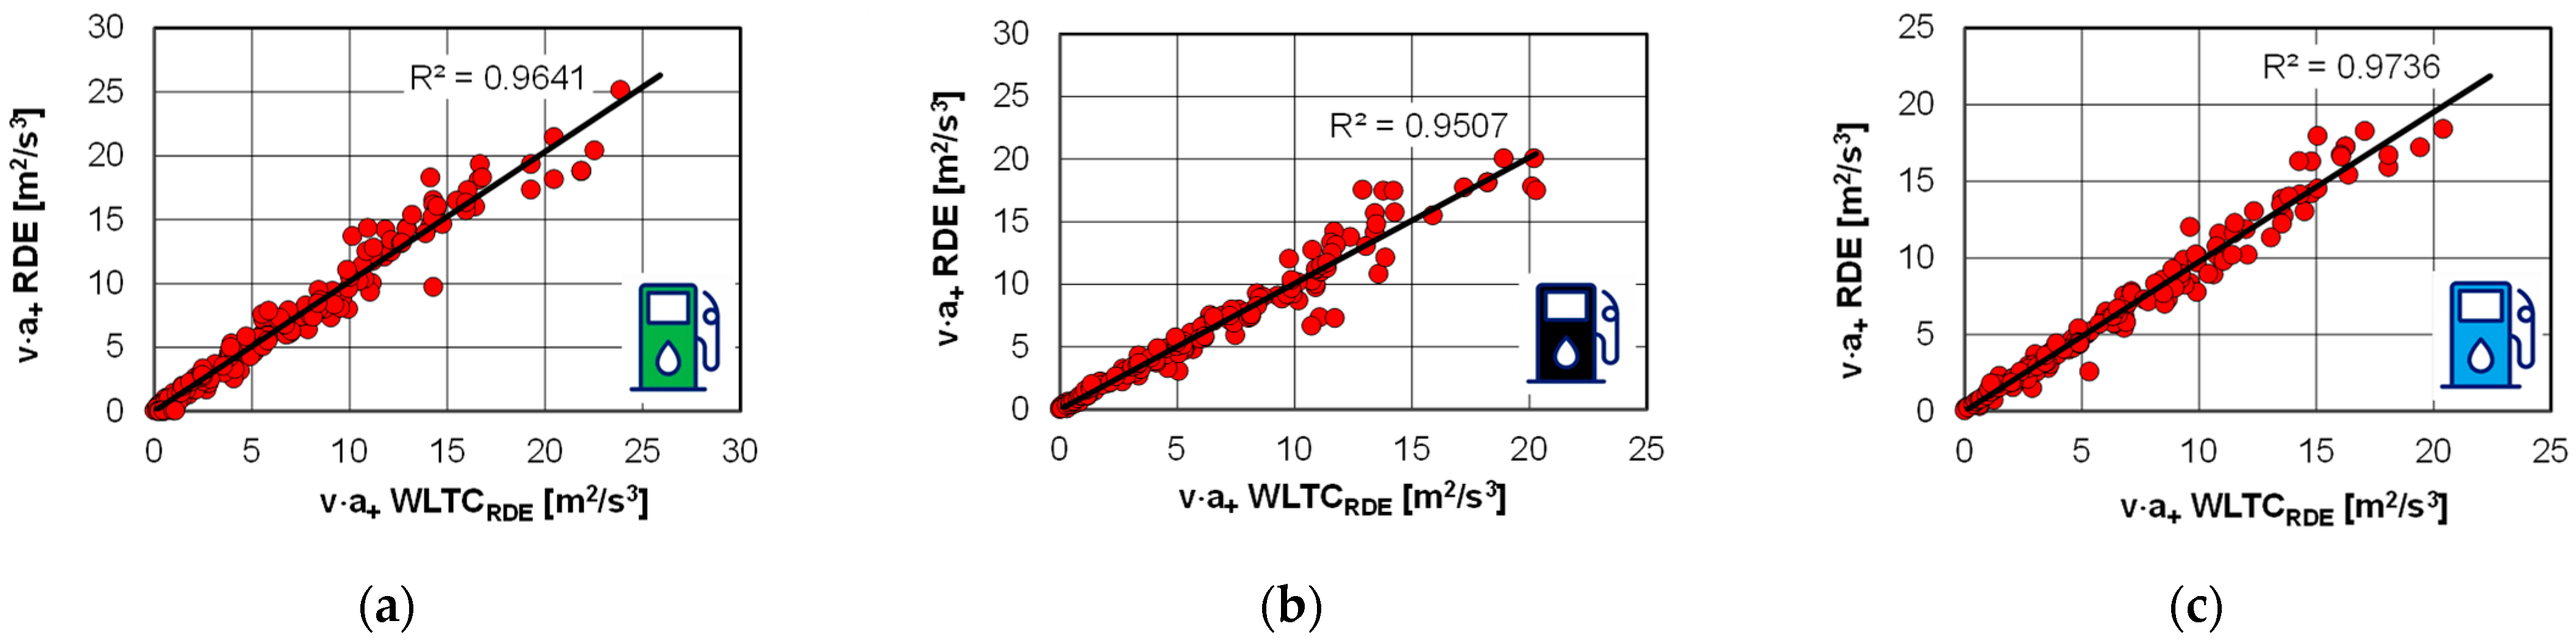
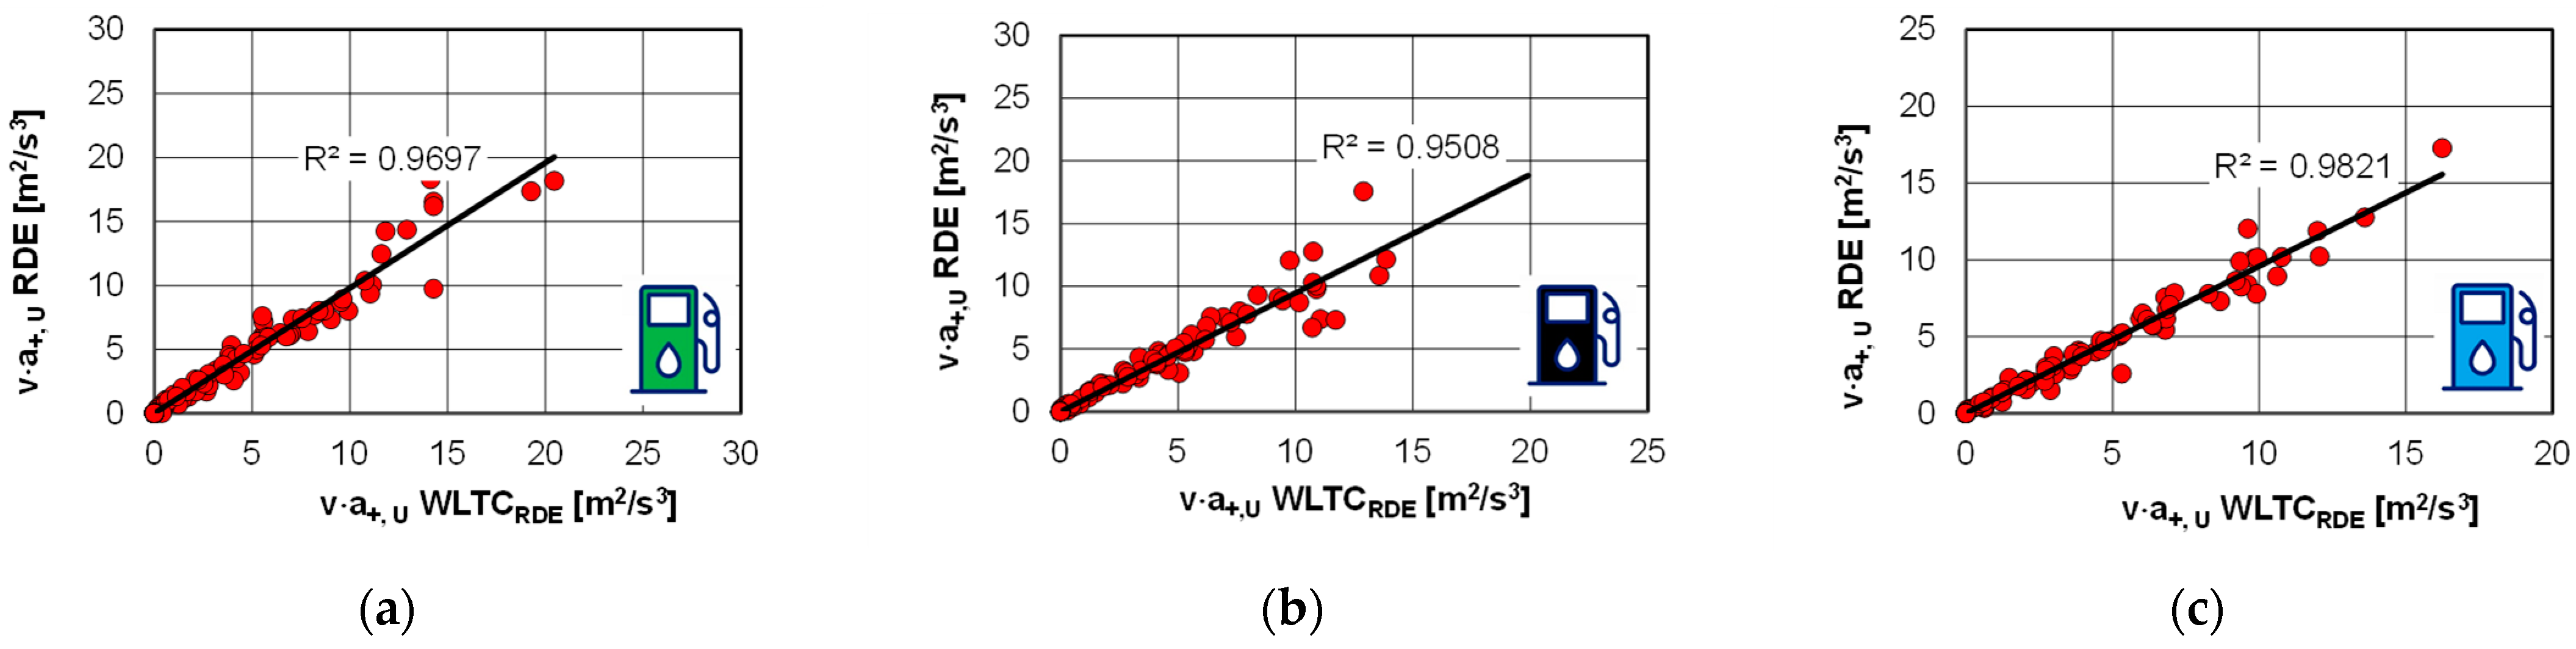
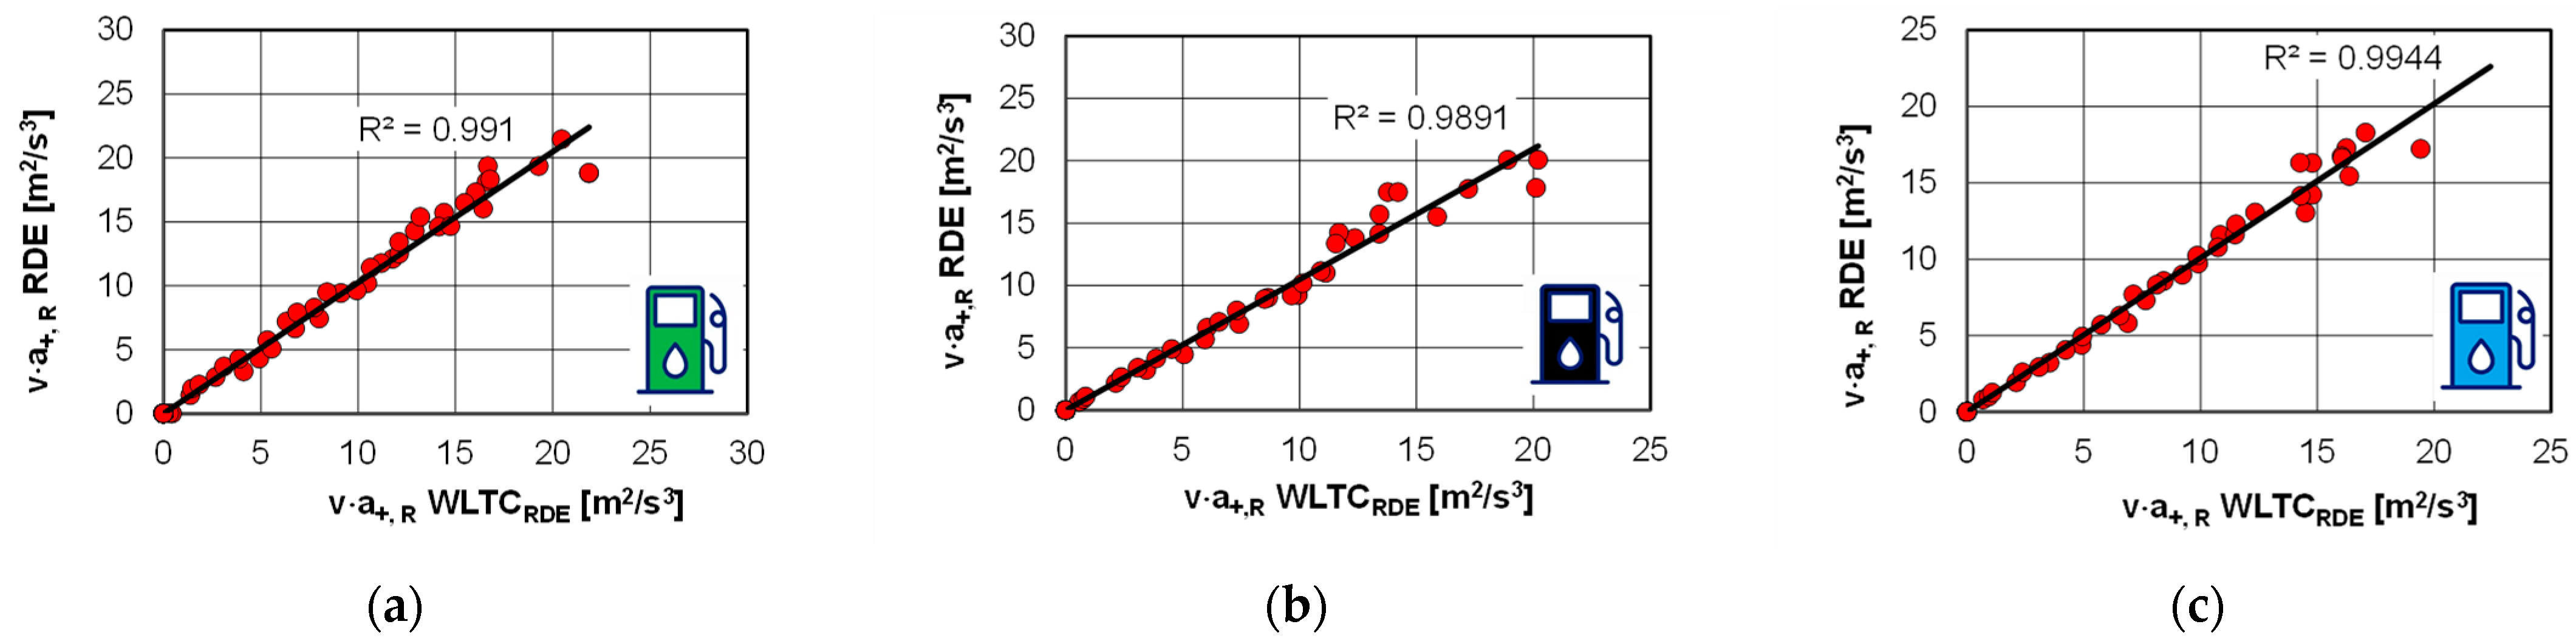
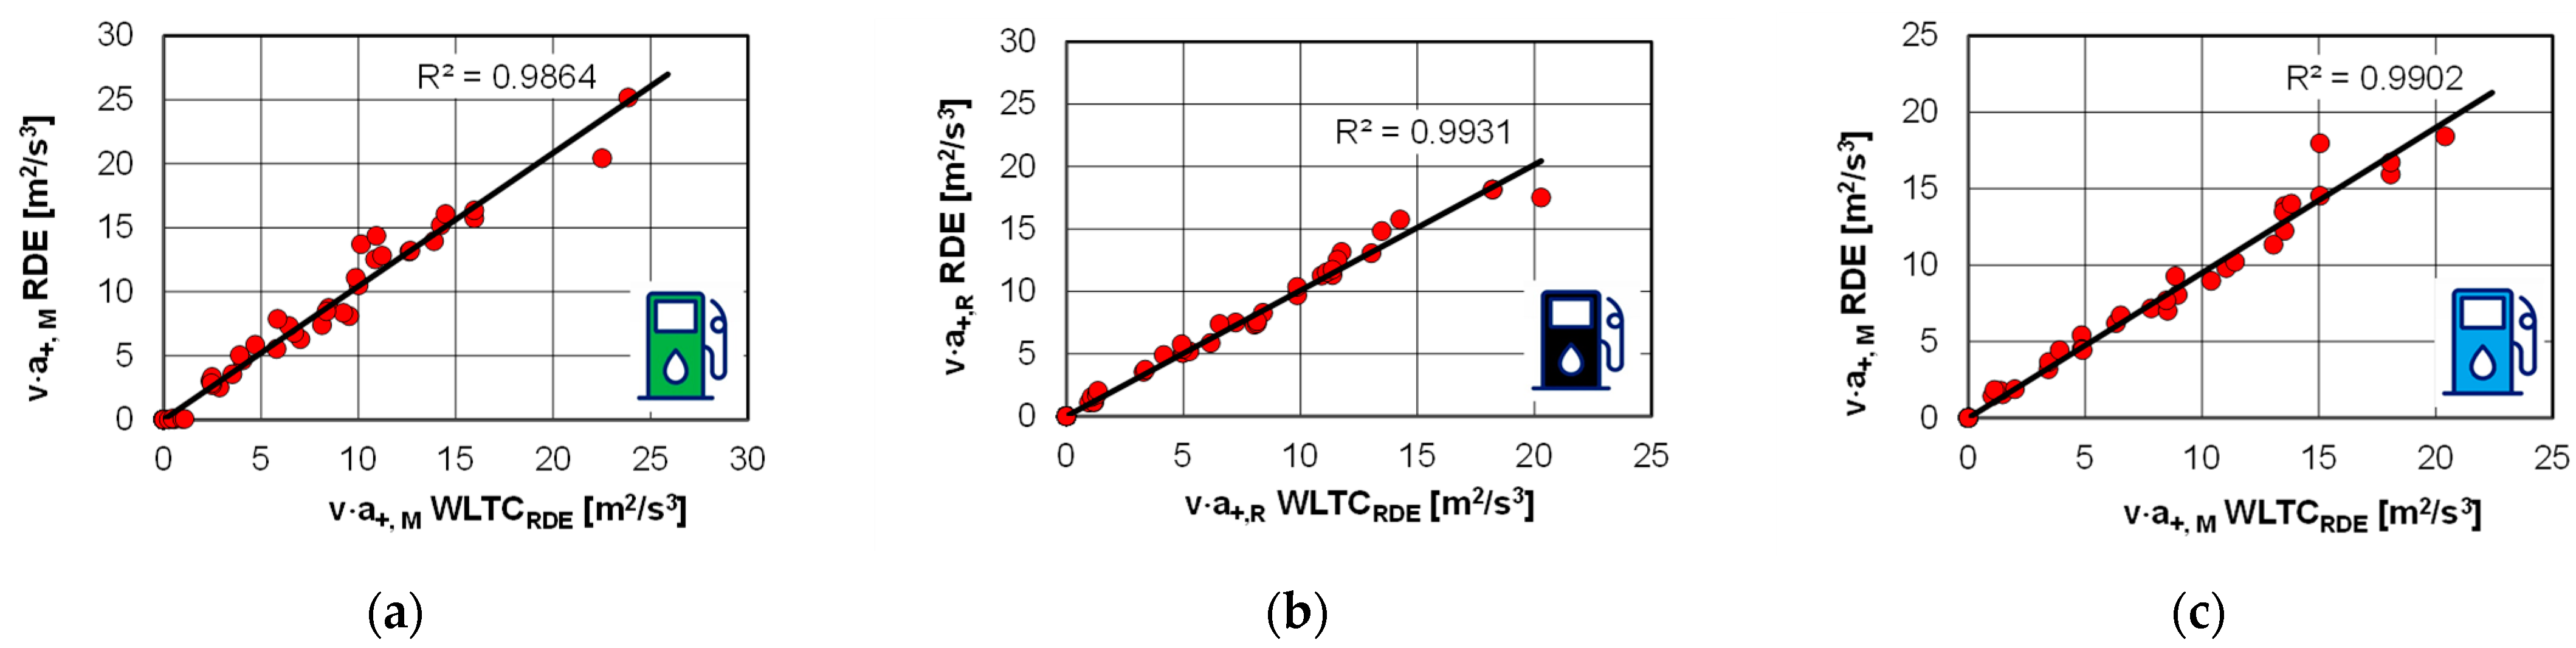
5.3. Correlation of the Dynamic Driving Test Parameters of Tested Vehicles

The next part of the study was to determine the correlation between the dynamic parameters of the tested vehicles. The product of velocity and positive acceleration was, in the authors’ opinion, the most reliable indicator. This indicator is often cited in comparisons because it is related to two key parameters—vehicle speed and acceleration. This indicator was compared for the driving conditions of the RDE and WLTC tests. It does not matter whether the phases were considered together (WLTC1+2) or for the whole WLTC test, nevertheless the results were still presented divided into sections as defined by the RDE procedure (Figure 20). The data were presented in vehicle speed–acceleration coordinates due to the possibility of comparing areas with the same coordinates. It should be noted that the comparison was made only for positive acceleration values, which had the largest share in the tests and the greatest impact on exhaust emissions. Comparison of the respective data sets, the values of the products of velocity and positive acceleration in the RDE and WLTCRDE tests (Figure 20, Figure 21 and Figure 22) showed very similar color distributions, which represent the differences in the compared values.
The highest observed values of the product of speed and positive acceleration occurred both in the rural and highway test sections for the vehicle equipped with a gasoline engine (Figure 20). In the case of a vehicle equipped with a diesel engine, the maximum values of the product of speed and acceleration occurred in the urban and rural driving sections (Figure 21). However, for a vehicle equipped with a hybrid drive (Figure 22), the maximum values of this indicator were found in all sections of the RDE test and the rural and highway sections of the WLTC test.
An appropriate comparison of the data obtained (Figure 20, Figure 21 and Figure 22) can be used to calculate the coefficient of determination for the performed RDE and WLTC tests in terms of the selected indicator, the product of speed and positive acceleration. The values of the determination coefficients were very similar to each other and amounted to over 0.95 irrespective of which vehicle was tested (Figure 23). This was proven by the use of the acomparable dynamic parameters of the vehicles throughout the research.
However, the consistency of these parameters throughout individual test sections should be considered. A comparison was carried out in the next stage of this section (Figure 24, Figure 25 and Figure 26) to assess the data. The obtained values of determination coefficients suggested a very high consistency of the values of the product of speed and acceleration for each tested vehicle.
Unfortunately, such a comparison also has its drawbacks. These include the characteristic itself, which was created in coordinates that correspond to the values obtained. However, when considering the variability ranges in speed and acceleration, which were 0.1 m/s2 and 10 km/h, respectively, it should be noted that these relationships did not have to be exactly proportional. However, comparing such a large range did not affect the result of the determination coefficient. The values of the latter were above 0.98 for vehicles in the highway section, above 0.98 for the rural section and above 0.95 for the urban section.
The data discussed above imply that the obtained results for dynamic conditions were similar (regardless of the type of drive). Unfortunately, this similarity does not allow for the conclusion that the vehicle driving conditions were the same. Nevertheless, it was possible to further compare the road emissions (or emission rate) in the performed tests using different calculation procedures.

6. Conclusions

In order to reduce the negative impact of the road transport sector on the environment, legislators have been introducing successive, increasingly restrictive laws for the best part of the last 30 years. One of the most important elements of these legislative changes was the regulation of both measurement and control methods for vehicle exhaust emissions. As a result of these changes, Europe has used two measurement tests since 2019: a laboratory test (performed on a chassis dynamometer) and a road test (performed in real vehicle operating conditions). According to the legislative intent, these tests were to complement each other, thanks to which the obtained exhaust emission results would be more reliable.
This comparison was made by comparing the following vehicle parameters:
  • share of travel speeds in different sections of the tests;
  • share of acceleration in entire test cycles as well as their sections;
  • share of the product of speed and acceleration in the performed tests and in their sections;
  • relative positive acceleration in different test sections as well as its mode (determined for every second of data acquisition);
  • the 95th percentile of speed and acceleration in different test sections.
It was concluded that the considered parameters in the WLTC and RDE tests related to each other, which made it possible to compare road emissions or the emission rates of individual exhaust components in research tests (or their sections). Based on the results obtained during dynamometer and road tests and their analysis according to the proposed procedures (WLTC, WLTC1+2, WLTCRDE and RDE), the following general conclusions were drawn:
  • a new method was proposed for comparing the results determined in the two-dimensional coordinates of vehicle speed–acceleration; the comparison of individual values in the appropriate ranges of the operating parameters creates two independent sets of data that can be correlated;
  • comparison of the WLTC and RDE tests allows for a joint comparison of the first and second phases of the WLTC test with the urban section of the RDE test; phase three of the WLTC test corresponds to the rural section of the RDE test, and phase 4 of the WLTC test corresponds to the highway section of the RDE test;
  • dividing the WLTC test into phases equivalent to the sections of the RDE procedure (urban, rural and highway) and also calculating the total exhaust emissions in the test according to this procedure resulted in similar values being obtained.

Author Contributions

Conceptualization, J.P. and K.K.; methodology, J.P. and K.K.; software, J.P. and K.K.; validation, J.P. and K.K.; formal analysis, J.P. and K.K.; investigation, J.P. and K.K.; resources, J.P. and K.K.; data curation, J.P. and K.K.; writing—original draft preparation, J.P. and K.K.; writing—review and editing, J.P. and K.K.; visualization, J.P. and K.K.; supervision, J.P. and K.K.; project administration, J.P. and K.K.; funding acquisition, J.P. and K.K. All authors have read and agreed to the published version of the manuscript.

Funding

This research received no external funding.

Data Availability Statement

Data are contained within the article.

Conflicts of Interest

The authors declare no conflict of interest.

Abbreviations

avehicle acceleration
DLRDeutsches Zentrum für Luft- und Raumfahrt (German Transport Institute)
EEAEuropean Environment Agency
FCEVfuel cell electric vehicles
HEVhybrid electric vehicle
HiLHardware-in-the-Loop
ICEinternal combustion engines
Mmotorway
MAWmoving average window
NEDCNew European Driving Cycle
OBDon-board diagnostics
PEMSportable emission measurement system
PHEVplug-in hybrid electric vehicle
PNparticle number
Rrural
RDEreal driving emissions
RPArelative positive acceleration
Sdistance
SoCstate of charge
SUMOSimulation of Urban Mobility
ttime
ushare
Uurban
UDCUrban Driving Cycle
vvehicle speed
WLTCWorldwide harmonized Light-duty vehicles Test Cycle
WLTPWorldwide harmonized Light-duty vehicles Test Procedure

References

  1. EEA. Monitoring CO2 Emissions from Passenger Cars and Vans in 2018. European Environment Agency, Report 2. 2020. Available online: https://www.eea.europa.eu/publications/co2-emissions-from-cars-and-vans-2018 (accessed on 12 September 2023).
  2. Transport. 2023. Available online: https://www.eea.europa.eu/pl/themes/transport/intro (accessed on 25 May 2023).
  3. Paris Agreement. Available online: https://ec.europa.eu/clima/policies/international/negotiations/paris_pl (accessed on 5 September 2023).
  4. Regulation (EU) 2019/631 of the European Parliament and of the Council of 17 April 2019 Setting CO2 Emission Performance Standards for New Passenger Cars and for New Light Commercial Vehicles, and Repealing Regulations (EC) No 443/2009 and (EU) No 510/2011. Available online: http://data.europa.eu/eli/reg/2019/631/oj (accessed on 9 September 2023).
  5. Commission Regulation (EU) 2017/1151 of 1 June 2017 Supplementing Regulation (EC) No 715/2007 of the European Parliament and of the Council on Type-Approval of Motor Vehicles with Respect to Emissions from Light Passenger and Commercial Vehicles (Euro 5 and Euro 6) and on Access to Vehicle Repair and Maintenance Information, Amending Directive 2007/46/EC of the European Parliament and of the Council, Commission Regulation (EC) No 692/2008 and Commission Regulation (EU) No 1230/2012 and repealing Commission Regulation (EC) No 692/2008. Available online: http://data.europa.eu/eli/reg/2017/1151/oj (accessed on 9 September 2023).
  6. Commission Regulation (EU) 2016/427 of 10 March 2016 Amending Regulation (EC) No 692/2008 as Regards Emissions from Light Passenger and Commercial Vehicles (Euro 6). Available online: http://data.europa.eu/eli/reg/2016/427/oj (accessed on 9 September 2023).
  7. Commission Regulation (EU) 2016/646 of 20 April 2016 Amending Regulation (EC) No 692/2008 as Regards Emissions from Light Passenger and Commercial Vehicles (Euro 6). Available online: http://data.europa.eu/eli/reg/2016/646/oj (accessed on 9 September 2023).
  8. Commission Regulation (EU) 2017/1154 of 7 June 2017 Amending Regulation (EU) 2017/1151 Supplementing Regulation (EC) No 715/2007 of the European Parliament and of the Council on Type-Approval of Motor Vehicles with Respect to Emissions from Light Passenger and Commercial Vehicles (Euro 5 and Euro 6) and on Access to Vehicle Repair and Maintenance Information, Amending Directive 2007/46/EC of the European Parliament and of the Council, Commission Regulation (EC) No 692/2008 and Commission Regulation (EU) No 1230/2012 and Repealing Regulation (EC) No 692/2008 and Directive 2007/46/EC of the European Parliament and of the Council as Regards Real-Driving Emissions from Light Passenger and Commercial Vehicles (Euro 6). Available online: http://data.europa.eu/eli/reg/2017/1154/oj (accessed on 9 September 2023).
  9. Commission Regulation (EU) 2018/1832 of 5 November 2018 Amending Directive 2007/46/EC of the European Parliament and of the Council, Commission Regulation (EC) No 692/2008 and Commission Regulation (EU) 2017/1151 for the Purpose of Improving the Emission Type Approval Tests and Procedures for Light Passenger and Commercial Vehicles, including Those for In-Service Conformity and Real-Driving Emissions and Introducing Devices for Monitoring the Consumption of Fuel and Electric Energy. Available online: http://data.europa.eu/eli/reg/2018/1832/oj (accessed on 9 September 2023).
  10. Donateo, T.; Giovinazzi, M. Some Repeatability and Reproducibility Issues in Real Driving Emission Tests; SAE Technical Paper 2018-01-5020; SAE: Warrendale, PA, USA, 2018. [Google Scholar] [CrossRef]
  11. Zhao, J.; Yang, R.; Yan, Y.; Ou, J.; Liu, Z.; Liu, J. Numerical Study on the Effect of Injector Nozzle Hole Number on Diesel Engine Performance under Plateau Conditions; SAE Technical Paper 2023-24-0033; SAE: Warrendale, PA, USA, 2023. [Google Scholar] [CrossRef]
  12. Yan, Y.; Yang, R.; Liu, Z.; Liu, J. Nitrogen Oxides Emission Characteristics of Zero-Carbon Ammonia-Hydrogen Fuels for Internal Combustion Engines; SAE Technical Paper 2023-01-0334; SAE: Warrendale, PA, USA, 2023. [Google Scholar] [CrossRef]
  13. Luján, J.M.; Bermudez, V.; Pla, B.; Redondo, F. Engine test bench feasibility for the study and research of real driving cycles: Pollutant emissions uncertainty characterization. Int. J. Engine Res. 2021, 23, 1103–1115. [Google Scholar] [CrossRef]
  14. Donateo, T.; Giovinazzi, M. Building a cycle for real driving emissions. Energy Procedia 2017, 126, 891–898. [Google Scholar] [CrossRef]
  15. Lee, J.; Kwon, S.; Kim, H.; Keel, J.; Yoon, T.; Lee, J. Machine learning applied to the NOx prediction of diesel vehicle under real driving cycle. Appl. Sci. 2021, 11, 3758. [Google Scholar] [CrossRef]
  16. Previti, U.; Brusca, S.; Galvagno, A. Passenger car energy demand assessment: A new approach based on road traffic data. In E3S Web of Conferences; EDP Sciences: Les Ulis, France, 2020; Volume 197, p. 05006. [Google Scholar] [CrossRef]
  17. Maddumage, W.U.; Abeyasighe, K.Y.; Perera, M.S.M.; Attalage, R.A.; Kelly, P. Comparing fuel consumption and emission levels of hybrid powertrain configurations and a conventional powertrain in varied drive cycles and degree of hybridization. Sci. Tech. 2020, 19, 20–33. [Google Scholar] [CrossRef]
  18. Krysmon, S.; Dorscheidt, F.; Claßen, J.; Düzgün, M.; Pischinger, S. Real Driving Emissions—Conception of a data-driven calibration methodology for hybrid powertrains combining statistical analysis and virtual calibration platforms. Energies 2021, 14, 4747. [Google Scholar] [CrossRef]
  19. Zanelli, A.; Millo, F.; Barbolini, M.; Neri, L. Assessment through Numerical Simulation of the Impact of a 48 V Electric Supercharger on Performance and CO2 Emissions of a Gasoline Passenger Car; SAE Technical Paper 2019-01-1284; SAE: Warrendale, PA, USA, 2019. [Google Scholar] [CrossRef]
  20. Hegde, S.; Bonfitto, A.; Galluzzi, R.; Molina, L.M.C.; Amati, N.; Tonoli, A. Equivalent consumption minimization strategy based on belt drive system characteristic maps for P0 hybrid electric vehicles. Energies 2023, 16, 487. [Google Scholar] [CrossRef]
  21. Molina Campoverde, P.A. Estimation of fuel consumption through PID signals using the real emissions cycle in the city of Quito, Ecuador. Sustainability 2023, 15, 12474. [Google Scholar] [CrossRef]
  22. Tomanik, E.; Jimenez-Reyes, A.J.; Tomanik, V.; Tormos, B. Machine-learning-based digital twins for transient vehicle cycles and their potential for predicting fuel consumption. Vehicles 2023, 5, 583–604. [Google Scholar] [CrossRef]
  23. Pulvirenti, L.; Rolando, L.; Millo, F. Energy management system optimization based on an LSTM deep learning model using vehicle speed prediction. Transp. Eng. 2023, 11, 100160. [Google Scholar] [CrossRef]
  24. Gebisa, A.; Gebresenbet, G.; Gopal, R.; Nallamothu, R.B. Driving cycles for estimating vehicle emission levels and energy consumption. Future Transp. 2021, 1, 615–638. [Google Scholar] [CrossRef]
  25. Pielecha, I.; Cieslik, W.; Szalek, A. Impact of Combustion Engine Operating Conditions on Energy Flow in Hybrid Drives in RDC Tests; SAE Technical Paper 2020-01-2251; SAE: Warrendale, PA, USA, 2020. [Google Scholar] [CrossRef]
  26. Kurtyka, K.; Pielecha, J. The evaluation of exhaust emission in RDE tests including dynamic driving conditions. Transp. Res. Procedia 2019, 40, 338–345. [Google Scholar] [CrossRef]
  27. Kurtyka, K.; Pielecha, J.; Merkisz, J. The evaluation of NOx emissions in RDE tests including dynamic driving conditions. IOP Conf. Ser. Earth Environ. Sci. 2021, 642, 012017. [Google Scholar] [CrossRef]
  28. Dollinger, M.; Fischerauer, G. Physics-based prediction for the consumption and emissions of passenger vehicles and light trucks up to 2050. Energies 2023, 16, 3591. [Google Scholar] [CrossRef]
Figure 1. Tested vehicles: (a) gasoline; (b) diesel, (c) hybrid.
Energies 16 07465 g001
Figure 2. Speed curves for individual WLTC tests: (a) gasoline; (b) diesel; (c) hybrid; the color of the line (green, black, blue) corresponds to the type of research object.
Energies 16 07465 g002
Figure 3. The route used for the road tests.
Energies 16 07465 g003
Figure 4. Vehicle speed curves for each individual RDE test: (a) gasoline; (b) diesel; (c) hybrid.
Energies 16 07465 g004aEnergies 16 07465 g004b
Figure 5. Elevation changes on the test route.
Energies 16 07465 g005
Figure 6. Comparison of the relative share of speed intervals as a function of individual WLTC and RDE test durations for: (a) gasoline; (b) diesel; and (c) hybrid vehicles.
Energies 16 07465 g006aEnergies 16 07465 g006b
Figure 7. Comparison of vehicle operating time shares in the WLTC and RDE tests for: (a) gasoline; (b) diesel; and (c) hybrid vehicles.
Energies 16 07465 g007aEnergies 16 07465 g007b
Figure 8. Comparison of vehicle operating time shares from Figure 7, for phases 1 and 2 of the WLTC test (labelled as WLTC1+2) and the urban section of the RDE test for: (a) gasoline; (b) diesel; and (c) hybrid vehicles.
Energies 16 07465 g008
Figure 9. Comparison of vehicle operating time shares from Figure 7 for phase 3 of the WLTC test and the rural section of the RDE test for: (a) gasoline; (b) diesel; and (c) hybrid vehicles.
Energies 16 07465 g009
Figure 10. Comparison of vehicle operating time shares from Figure 7 for phase 4 of the WLTC test and the highway section of the RDE test for: (a) gasoline; (b) diesel; and (c) hybrid vehicles.
Energies 16 07465 g010
Figure 11. Comparison of vehicle operating time shares from Figure 7 for the entire WLTC test and the entire RDE test for: (a) gasoline; (b) diesel; and (c) hybrid vehicles.
Energies 16 07465 g011
Figure 12. Comparing the driving speed in the WLTC test for the tested vehicles.
Energies 16 07465 g012
Figure 13. Comparison of vehicle speed shares obtained according to WLTCRDE (marked *) and RDE measurement procedures, taking into account individual test phases and vehicle drive types.
Energies 16 07465 g013
Figure 14. Comparison of positive acceleration obtained according to the WLTCRDE (marked *)and RDE test procedures, when considering individual test parts and vehicle drive systems.
Energies 16 07465 g014aEnergies 16 07465 g014b
Figure 15. Comparison of the products of speed and positive acceleration obtained according to the WLTCRDE (marked *) and RDE test procedures, when considering individual test parts and vehicle drive systems.
Energies 16 07465 g015aEnergies 16 07465 g015b
Figure 16. Travel dynamics for all tested vehicles depending on the driving test and calculation procedure—WLTC, WLTCRDE, and RDE divided into test parts.
Energies 16 07465 g016aEnergies 16 07465 g016b
Figure 17. Mean values of relative positive acceleration for the tested vehicles for each driving test and calculation procedure—WLTC, WLTCRDE, and RDE divided into test parts.
Energies 16 07465 g017
Figure 18. The product of instantaneous speed and positive acceleration for tests performed using three test procedures marked as WLTC, WLTCRDE, and RDE.
Energies 16 07465 g018
Figure 19. The 95th percentile of the product of velocity and positive acceleration related to vehicle speed for all the tested vehicles.
Energies 16 07465 g019
Figure 20. The product of speed and positive acceleration for a vehicle equipped with a gasoline engine: (a) in the RDE test; (b) in the WLTCRDE test.
Energies 16 07465 g020
Figure 21. The product of speed and positive acceleration for a vehicle equipped with a diesel engine: (a) in the RDE test; (b) in the WLTCRDE test.
Energies 16 07465 g021
Figure 22. The product of speed and positive acceleration for a vehicle equipped with a hybrid drive system: (a) in the RDE test; (b) in the WLTCRDE test.
Energies 16 07465 g022
Figure 23. Correlations of the product of speed and positive acceleration in the RDE and WLTC tests for: (a) gasoline, (b) diesel, and (c) hybrid vehicles.
Energies 16 07465 g023
Figure 24. Correlations of the product of speed and positive acceleration in the urban section of RDE and WLTCRDE tests for: (a) gasoline, (b) diesel, and (c) hybrid vehicles.
Energies 16 07465 g024
Figure 25. Correlations of the product of speed and positive acceleration in the rural section of RDE and WLTCRDE tests for: (a) gasoline, (b) diesel, and (c) hybrid vehicles.
Energies 16 07465 g025
Figure 26. Correlations of the product of speed and positive acceleration in the motorway section of RDE and WLTCRDE tests for: (a) gasoline, (b) diesel, and (c) hybrid vehicles.
Energies 16 07465 g026
Table 1. WLTC test requirements [4,5].
ParameterLowMediumHighExtra-High
Stop duration [%]26.511.16.82.2
Average speed [km/h]25.744.560.894.0
Maximum speed [km/h]56.576.697.4131.3
Maximum acceleration [m/s2]1.611.611.671.06
Minimum acceleration [m/s2]−1.50−1.50−1.50−1.44
Table 2. Some of the requirements and boundary conditions for a test to be RDE compliant [9].
ParameterEuro 6d
Conformity factorNOx: 1.43, PN: 1.50
Cold startyes
Limits for urban and RDE phaseyes
Altitudenormal≤700 m
extended700–1300 m
Ambient temperaturenormal0 °C to 30 °C
extended−7 °C to 0 °C and 30 °C to 35 °C
Trip compositionurban34%≤60 km/h
rural33%60–90 km/h
motorway33%>90 km/h
Maximum speed145 km/h
Total trip duration90–120 min
Distance (urban, rural, motorway)>16 km
Table 3. The drive system characteristics of the tested vehicles.
ParameterUnitGasolineDieselHybrid
Engine displacementdm31.62.01.8
Number of cylinders/valves4/164/84/16
Maximum powerkW/rpm81/550075/275073/5200
100 (electric)
TorqueNm/rpm152/4500280/1500142/4000
Volumetric power indicatorkW/dm350.637.555.5
Vehicle curb weightkg134915841415
Exhaust emission standardEuro 6dEuro 6dEuro 6d
Drive typefrontfrontfront
Designation used at workEnergies 16 07465 i001Energies 16 07465 i002Energies 16 07465 i003
Table 4. The characteristics of the RDE route used for the road emission tests.
ParameterRDE RequirementsGasolineDieselHybrid
Total trip distance 101.1 km96.1 km97.9 km
 Urbanmin. 16 km33.7 km31.7 km35.3 km
 Ruralmin. 16 km29.7 km33.2 km31.1 km
 Motorwaymin. 16 km37.7 km31.2 km31.5 km
 Urban share29–44%33.4%33.0%36.0%
 Rural share23–43%29.4%34.5%31.8%
 Motorway share23–43%37.3%32.5%32.2%
Total trip duration90–120 min116.5 min105.9 min114.7 min
 Urban 72.8 min63.2 min72.1 min
 Rural 24.0 min26.2 min25.2 min
 Motorway 19.7 min16.5 min17.5 min
Stop duration 11.3%8.19%9.5%
 Urban6–30%18.0%13.7%15.1%
 Rural 0.0%0.0%0.0%
 Motorway 0.0%0.0%0.0%
Average speed52.1 km/h54.5 km/h51.2 km/h52.1 km/h
 Urban27.8 km/h30.1 km/h29.4 km/h27.8 km/h
 Rural74.3 km/h76.0 km/h74.2 km/h74.3 km/h
 Motorway115.0 km/h113.4 km/h108.3 km/h115.0 km/h
Disclaimer/Publisher’s Note: The statements, opinions and data contained in all publications are solely those of the individual author(s) and contributor(s) and not of MDPI and/or the editor(s). MDPI and/or the editor(s) disclaim responsibility for any injury to people or property resulting from any ideas, methods, instructions or products referred to in the content.

