Article

Barriers to Renewable Energy Source (RES) Installations as Determinants of Energy Consumption in EU Countries

1
Department of Industrial Informatics, Silesian University of Technology, 40-019 Katowice, Poland
2
Faculty of Organization and Management, Silesian University of Technology, 44-100 Gliwice, Poland
3
Institute of Economics and Finance, University of Szczecin, 71-101 Szczecin, Poland
4
Penn State Hazleton, Pennsylvania State University, 76 University Drive, Hazleton, PA 18202-8025, USA
5
Department of Software Engineering, Ivano-Frankivsk National Technical University of Oil and Gas, 76019 Ivano-Frankivsk, Ukraine
*
Author to whom correspondence should be addressed.
Energies 2023, 16(21), 7364; https://doi.org/10.3390/en16217364
Submission received: 2 October 2023 / Revised: 16 October 2023 / Accepted: 26 October 2023 / Published: 31 October 2023

Abstract

:
The article presents an analysis of the statistical relationship between the determinants of and barriers to the development of renewable energy sources (RESs) in the macroeconomic system and the development of renewable energy source consumption in individual European Union countries. The article considers four key categories of RES development barriers in the European Union: political, administrative, grid infrastructural, and socioeconomic. The work is based on publicly available historical data from European Union reports, Eurostat, and the Eclareon RES Policy Monitoring Database. The empirical analysis includes all 27 countries belonging to the European Union. The research aimed to determine the impact of all four types of factors, including socioeconomic, on the development of RESs in European Union countries. The analysis uncovered that describing the European Union as a consistent region regarding the speed of renewable energy advancement and the obstacles to such progress is not accurate. Notably, a significant link exists between a strong degree of societal development and the integration of renewable energy sources. In less prosperous EU nations, economic growth plays a pivotal role in renewable energy development. Barriers of an administrative nature exert a notable influence on renewable energy development, especially in less affluent EU countries, while grid-related obstacles are prevalent in Southern–Central Europe. In nations where the proportion of renewable energy sources in electricity consumption is substantial, an excess of capacity in the renewable energy market significantly affects its growth.

1. Introduction

The goals of the energy policies of many countries around the world (highly developed countries) are to guarantee the reliability of fuel and energy supply, increase the competitiveness of the economy, increase energy efficiency, and minimize the negative environmental impact of the energy sector. One way to achieve these goals is to increase the exploitation of renewable energy sources (RESs). The consideration of energy and intensity consumption is pivotal in the journey toward decarbonization, as these factors directly influence the volume of greenhouse gas emissions discharged into the atmosphere [1]. In a modern world focused on environmental protection, renewable energy sources (RESs) are an alternative to the traditional energy carriers—fossil fuels [2]. Renewable energy is derived from natural processes in nature, which allows its resources to be replenished in repeated cycles, taking into account resource conditions. The strategic goal of global and European energy policy is to increase the use of RE (renewable energy) resources. Renewable energy includes energy from the direct use of solar radiation, wind, geothermal resources, water resources, solid biomass, biogas, and liquid biofuels. Faster deployment of renewable energy is one of the key solutions needed for decarbonization and climate change mitigation [3].
If Europe is to be climate neutral, electricity generation should be fully decarbonized by 2050, and more than 80% of the EU’s electricity must come from renewable sources (these are the plans) [4,5]. In December 2018, the revised Renewable Energy Directive 2018/2001/EU came into force [6]. The ambitious targets set for 2030 (a binding renewable energy target of at least 32% at the EU level) require the spread of renewable energy technologies and faster market penetration. To effectively manage the sporadic characteristics of renewable energy sources, industries must innovate by creating new technologies, constructing new transmission infrastructure, and allocating resources to storage solutions [7,8,9,10]. In addition to further technological development, which is made possible by, among other things, reducing costs and improving performance targets in line with the European Strategic Energy Technology Plan (SET Plan) [11], it is necessary to address a number of non-technological issues (behavior and awareness) that continue to stand in the way of the large-scale dissemination of RES technology [12,13].
The development of the RES sector is being pursued with the support of governments, with not only financial incentives but also the creation of an appropriate legal framework to encourage the development of the sector in EU countries. Each EU country has set its own targets for the share of RESs in total energy production, ranging from 10% in the case of Malta to 49% in Sweden. The share of renewable energy in the gross final energy consumption in the EU settled at a level of 21.8% in 2021 compared with 9.6% in 2004, and the share of renewable energy in electricity consumption was 37.5% in 2021 compared with 15.9% in 2004 [14]. The path of EU countries to RES growth in total energy sources is not easy. European countries are overcoming many barriers to achieve their RES growth targets [11]. The process of transitioning from fossil fuels to RES—which necessarily includes phases of technical-scale deployment of the new technology, such as research, prototyping, demonstration facilities, and commercialization—requires a significant lead time and is a difficult process [12]. A detailed analysis of the costs of planned investments is needed, and there are situations in which the lack of reflection of the costs of production, transmission, and use of energy is compounded by subsidies for the extraction and consumption of fossil fuels, which are applied in various forms (albeit reduced).
In doing so, it is necessary to adequately prepare the public for the adoption of new solutions through extensive education. In the EU, there are countries that are doing a great job of building infrastructure for RES, such as Sweden, as well as countries where RES investments are still insufficient, such as Poland (the country has been oriented toward centralized, large, and expensive fossil fuel-use projects) [14].
The long-standing tradition of using coal as the main energy fuel, the energy subsidies used in the past, and the low prices of traditional energy carriers have made the introduction of renewable energy much more difficult [15]. A barrier that is difficult to overcome is the high capital expenditure [16]. Taking into account the economic aspect (a prerequisite for achieving a significant share of renewables in the energy balance and in electricity), it must be taken into account that the higher price of energy produced from renewable sources (compared with classical sources), when used locally, can be at least partially reduced by the cost of unnecessary transmission (transfer) [17]. Nevertheless, in a number of cases, the cost of reserving energy supplies from the electricity and/or gas system must be taken into account [18]. There are a number of barriers limiting the development of power generation using renewable energy sources. They are a set of factors of psychological, social, institutional, legal, and economic nature [19,20].
In this paper, the authors analyze the main factors, i.e., determinants and barriers, of RES development in the European Union. The factors that may be barriers to the development of renewable energy are analyzed. The paper analyzes four key categories of RES development barriers in the European Union: political, administrative, network infrastructural, and socioeconomic. The relationship between them and the development of RES consumption in the European Union member states is examined.
The purpose of this paper was to analyze the barriers to the development of basic renewable energy sources (RESs) in countries of the EU and determine the strength of the impact of these factors/barriers on the share of RESs in energy consumption in the European Union. The empirical analysis covered all countries of the European Union. Within the framework of the goal and research problem thus set, the paper adopted the following research questions.
RQ1. How do political, administrative, grid, and socioeconomic barriers to renewable energy sources implementation affect the development of renewable energy in the economy?
RQ2. Are market economic factors a barrier or a driver of RES growth in energy consumption?
RQ3. Do the member countries of the European Union respond equally to the analyzed factors of and barriers to RES development?
The purpose of the work and the research questions posed in this way determined the structure of this work. The paper consists of theoretical background, the presentation of the data analysis and methods used, results, discussion, and conclusions.

2. Background to Analysis

2.1. The Current Trends in Green Energy Concepts

The prevailing global trend focuses on generating green energy, which entails utilizing renewable energy sources (RESs). This trend holds immense significance due to the urgent need to combat climate warming caused by greenhouse gas emissions. The primary avenue for achieving a substantial reduction in greenhouse gas emissions is the worldwide commitment to the “net zero by 2050” strategy, as established by the Paris Agreement on climate protection [4]. In alignment with the Paris Agreement, the European Union has bolstered its climate and energy policies, marking a significant shift in direction as part of the European Green Deal [1]. This strategic plan, grounded in a comprehensive impact assessment, has led the European Commission to propose even more stringent 2030 targets, aiming for at least a 55% reduction in greenhouse gas emissions compared with 1990 levels, as outlined in the draft European climate law (Fit 55).
The European Union has consistently pursued the objectives of the “Clean Energy for All Europeans” package (CEP) [2,3]. In December 2019, nearly all EU leaders expressed their commitment to implementing net zero strategies by 2050. The Paris Agreements have introduced a new dimension to climate policy, with the primary goal of limiting the global temperature increase to 2 °C above pre-industrial levels, as stated in Article 1.1(a), rather than solely focusing on reducing carbon dioxide emissions [4]. In accordance with these policies and various EU documents, nations are making substantial investments in renewable energy resources. Numerous programs and initiatives have been established within the EU, including information campaigns and subsidies to support new investments, such as programs that promote the installation of photovoltaic panels, solar panels, and heat pumps [1,2,3,4,5,6,11,12,15,16,17,18,19,20,21]. European policy has also spurred many countries to introduce regulations aimed at reducing greenhouse gas emissions and promoting the development of renewable energy sources [12,13].
The possibility of providing support for RES investment and development stems from the European Union’s energy policy, as defined in, among other things, Directive 2009/28/EC. Through the Horizon 2020 program, the European Union is implementing measures to find and support new and innovative solutions that will help Europe successfully achieve these goals—from drawing light and heat from the sun to geothermal energy from deep within the Earth and all other natural energy sources. Horizon 2020 has several important projects underway aimed specifically at eliminating market barriers and accelerating the deployment of renewable energy technologies. These include financial instruments, such as auctions, which are becoming a pillar of efforts to support renewable energy policies; the AURES (European #H2020 research project on Auctions for Renewable Energy Support) and AURES II projects have identified and evaluated the auction options in use and determined their impact on energy policy mechanisms and markets under different conditions (http://aures2project.eu/, accessed on 15 September 2023) [15]. At the regional level, the CoolHeating project [16] has supported the deployment of small modular heating and cooling grids in Southeast Europe using an improved business strategy and innovative financing schemes. The importance of prosumers, or energy users who both produce and consume electricity, is being addressed by the PV-Prosumers4Grid initiative [17]. The BestRES project [18] analyzed the possibility of aggregating various distributed renewable energy sources. In order for “bioenergy villages” to be created, bioenergy concepts must be in the investment stage. Thanks to the BioVill project [19], villages in Croatia, Serbia, Slovenia, Northern Macedonia, and Romania have reached a point in their development at which they can cooperate with long-established markets in Austria and Germany. WinWind project partners [20] have developed a number of good practices drawn from their own countries to increase public acceptance of wind energy in targeted regions. Biomass is also a valuable source of renewable energy. The SECURECHAIN project [22] has contributed to the optimal management of the wood biomass supply chain in Europe. The SEEMLA (abbreviation from sustainable exploitation of biomass for bioenergy from marginal lands) project (https://www.ifeu.de/en/project/seemla/, accessed on 15 September 2023) [22] aimed to obtain high energy yields from inferior land, while the subject of the uP_running initiative [22] is bioenergy obtained from tree pruning residues.
According to an analysis of the existing literature [9,10,11,12,13,14,15,16,17,18,19,20,21,22] it is evident that researchers are showing a growing interest in exploring the challenges associated with renewable energy source (RES) development. Furthermore, there is a noticeable emergence of studies that assess the influence of these barriers on the implementation of RESs [22]. This trend is clearly reflected in the scientific databases Web of Science and Scopus, as illustrated in Figure 1.
Despite the increase in literature interest in this research topic, the authors found a research gap in the topic undertaken. It was found that there is a lack of studies that take into account the analysis of all determinants and barriers affecting the implementation and thus development of RESs. There are studies creating indicators or indexes to measure the impact of barriers on RES implementation [22]. The literature has mostly either listed what the barriers to RES development are [23,24,25,26,27,28,29,30,31,32,33] or evaluated them only for a single country [24,25] or a non-EU country [27,30,31,33]. However, in the area of socioeconomic factors, the literature has analyzed either the economic factors resulting from market imperfections [23] or trade relationships [29] with overdated data [23,24,25,26,28] or omitted the level of social development of countries [22]. There is a lack of analyses that take into account the impact of the market (overcapacity) and socioeconomic factors (socioeconomic development of the countries) or barriers (in a negative impact situation). There is a lack of holistic analyses that additionally attempt to analyze the occurrence of similar relationships for groups of countries or regions in all analyzed areas of RES development. This study indicates that we are not dealing with a situation in which the impact of all barriers is similar across the EU or a situation in which each country is different. The findings provided by this study contribute novelty to the literature.

2.2. Barriers to Development of RESs

In the literature, various authors have pointed to several categories of barriers (Table 1). The main barriers associated with the development of renewable energy include limited opportunities for entrepreneurs to finance investments, legal support regulations, administrative and procedural difficulties, and with the operation of transmission networks.
Table 1 summarizes the barriers to renewable energy development from various studies conducted in different countries and regions over the years. In 1999 in Poland (Wiśniewski), the barriers included market issues related to economics and finance, as well as political and institutional challenges due to outdated goals and inadequate infrastructure [23]. In 2015 in Poland (Wasiuta), the barriers encompassed political and institutional problems, administrative challenges, economic and financial issues, location-related hurdles, and information and education gaps [24,25,26]. In 2015 in Chile (Nasirov et al.), the challenges consisted of economic and financial issues, technological and infrastructure obstacles, institutional and regulatory hurdles, and public awareness and information constraints [27].
In 2012 in the European Union [28], barriers were identified in generation, grids, market power and regulation, cross-border externalities, storage, and demand, and they included issues related to learning and knowledge spillovers, capital market restrictions, an uneven political playing field, community acceptance, planning consent and policy commitment, lack of network capacity, intermittency, controllability, securing peak capacity, market power and regulation, cross-border externalities, storage, and demand [31]. In 2021 in countries in the European Union [29], the barriers encompassed financial or economic factors; sociopolitical, regulatory, and environmental issues; and behavioral and psychological challenges [32]. In 2013 in Australia [30], barriers included administrative obstacles, lack of transparency, policy unpredictability, insufficient social approval, cost-related competitiveness issues, continued government backing for conventional electricity sources, and intellectual property issues [33].
Also, in 2005 in the United Kingdom [31], barriers involved systems failures, financial obstacles, skills gaps, risk perception, intellectual property issues, expectations and market uncertainty, policy framework, exit strategies and support continuity, and collaboration and partnerships. In 2021 in the European Union (Streimikiene), barriers covered financial or economic issues, sociopolitical, regulatory, and environmental factors, and behavioral and psychological challenges [32]. In 2023 in Canada (Patel and Parkins), barriers included economic, environmental/technical, planning, and political factors related to renewable electricity projects [33].
The literature review in Table 1 indicates that many factors influence the development of RESs. These factors are often grouped in different ways; nevertheless, the most important ones can be grouped into four groups of factors: administrative barriers [22,24,25,30,33], political barriers [22,23,24,25,27,28,30,31,32,33], grid barriers [22,26,27,28,33], and socioeconomic barriers [22,23,24,25,28,29,31,32,33]. Barriers to administrative processes were indicated in many literature items and mainly included public procurement, environmental planning, and the duration of administrative procedures. Network barriers are related to the state of regulation of networks and infrastructure. It is worth noting that these barriers are particularly emphasized in the literature in the field of renewable energy. Political barriers have been indicated by almost all publications on RES, and they concern unstable political support and remuneration for RES and a lack of or unstable climate strategy. The last group of barriers concerns market, economic, and social factors. To summarize this group of factors in the literature, it is indicated that they depend on the level of socioeconomic development of a given country and the balance of production capacity in the renewable energy market. Overcoming barriers to the installation of renewable energy sources in the European Union is a complex but necessary task. By addressing regulatory challenges, providing financial support, fostering innovation, and promoting public awareness, the EU can continue its journey toward a more sustainable and greener energy future. Through coordinated efforts at both the national and European levels, the EU can lead the way in the global transition to renewable energy sources and mitigate the impacts of climate change [23,24,25].
The first group analyzed are administrative barriers; among them, we can describe the following barriers [22,24,25,30,33]:
  • Administrative obstacles, including protracted regulatory approvals and permitting processes: lengthy and complex administrative procedures can hinder the timely development of renewable energy projects.
  • Lack of transparency and expensive procedures for connecting to the grid: the cost and complexity of connecting renewable projects to the grid can be a significant administrative barrier.
  • Policy unpredictability characterized by abrupt policy shifts and inconsistent decision-making: frequent changes in government policies related to renewable energy can create uncertainty for investors and developers.
To overcome these barriers, simplifying administrative procedures and reducing approval times can motivate renewable energy project developers. Also, transparent and cost-effective grid connection procedures are needed. Providing clear and affordable processes for connecting renewable projects to the grid can be a strong motivator. Offering long-term policy stability can encourage investment in renewable energy projects.
The second type of barriers are political barriers. In this case, the especially important barriers are [22,23,24,25,27,28,30,31,32,33]:
  • Unstable political support and changing policies: inconsistent political backing for renewable energy projects can deter investment.
  • Opposition from local communities and government bodies: resistance from local communities and municipal councils can pose political challenges.
  • Dependence on regional governments: relying on regional authorities for support can result in varying priorities and inconsistent policies.
To overcome these types of barriers in RES development, governments should support a clear renewable energy strategy that can motivate investment and development. Also, an important problem is effective community engagement and public acceptance. Encouraging local communities to embrace renewable projects can be a significant motivator. Coordination between different levels of government can facilitate a more conducive environment for renewables.
The third type of potential barriers are economic barriers. The most important among them are [22,23,24,25,27,28,31,32,33]:
  • High capital costs for renewable electricity projects: the initial investment required for renewable projects can be a barrier.
  • Long payback periods: extended timeframes for recovering investments can discourage potential investors.
  • Limited revenue/savings potential for renewable projects: concerns about the profitability of renewable energy projects can be a barrier.
  • High operational and maintenance costs: ongoing expenses for renewable projects can affect their economic viability.
To overcome economic barriers, it is important to decrease capital costs. This requires efforts to reduce the upfront costs of renewable energy projects, which can be a powerful motivator. Also, it is worth accelerating the timeframe for achieving a return on investment, which can make renewable projects more attractive, and providing financial incentives and support can motivate investors and developers.
The fourth type of the barriers are market barriers. These barriers are connected to problems like the following [22,23,24,25,28,29,31,32,33]:
  • Market structure issues hindering renewable integration: challenges in the market structure can impede the growth of renewable energy.
  • The dominance of a few players in the market: market concentration can limit competition and innovation.
  • Volatility in spot market prices: price fluctuations in energy markets can create uncertainty for investors.
  • Limited availability of financial resources: a lack of accessible funding can be a market barrier.
To overcome them, it is important to diversify the market structure. This can be accomplished by encouraging competition and diversity among market players, which can motivate renewable energy development. The next important activity is to reduce market volatility by stabilizing energy prices, and markets could provide a stronger incentive for investment. Also, expanding financial support options can motivate renewable energy projects.
The last type of barrier in RES development is connected to infrastructure. The most important infrastructure barriers are [22,26,27,28,33]:
  • Grid connectivity limitations and insufficient grid capacity: inadequate grid infrastructure can limit the integration of renewable energy.
  • Lengthy permit processing times for a large number of applications: delays in permitting can slow project development.
  • Inadequate infrastructure to support renewable energy deployment: a lack of infrastructure can be an infrastructure barrier.
To deal with infrastructure barriers, organizations should expand grid capacity and improve connectivity by strengthening grid infrastructure, which can facilitate renewable energy integration. Also, faster permitting can motivate developers to move forward with projects. Developing infrastructure that supports renewable energy can be a strong motivator.
Addressing these barriers and leveraging the corresponding motivators requires a comprehensive approach that includes regulatory changes, stable policies, financial incentives, infrastructure development, and community engagement. By carefully considering and addressing these factors, governments and stakeholders can accelerate the transition to renewable energy sources.

2.3. European Green Deal

The European Green Deal is an ambitious policy initiative aimed at addressing climate change and environmental challenges [34]. It set a goal of achieving climate neutrality by 2050, meaning that the European Union aims to balance its greenhouse gas emissions with removals, effectively eliminating its net contribution to climate change [35,36]. The Green Deal is closely tied to economic recovery efforts, especially in the wake of the COVID-19 pandemic [37,38,39].
According to Kotseva-Tikova and Dvirak’s research, the NRRPs of member states, including Bulgaria and Lithuania, are designed to align with the Green Deal’s objectives, making sustainable and green investments a priority for economic growth [40]. Both Bulgaria and Lithuania have taken measures to reduce greenhouse gas emissions. They have experienced changes in their industrial sectors, energy resources, and economic structures to contribute to the Green Deal’s goal of reducing emissions. The NRRPs of Bulgaria and Lithuania allocate a significant portion of their funding to support green initiatives. Lithuania plans to allocate 37.8% of its funds to green projects, while Bulgaria aims for 53.66%. These projects encompass areas such as renewable energy, energy efficiency, and environmental sustainability. To finance these green projects, both countries are looking to engage the private sector. Bulgaria anticipates substantial private sector investment of around EUR 2.4 billion, while Lithuania plans for EUR 815 per capita in private investments. This collaboration aims to leverage additional capital for sustainable initiatives [39,40].
EU institutions should work toward harmonizing renewable energy policies and regulations across member states [41]. This could create a more predictable environment for investors and project developers. Continued financial support for renewable energy projects is possible through mechanisms like the European Structural and Investment Funds (ESIF) and the European Green Deal Investment [42]. Available and implemented projects at the level of the European Commission are tools in the climate policy of the EU member states. Educating the public about the benefits of renewable energy and involving local communities in the decision-making process can build support for renewable projects [43,44].
Encouraging collaboration between research institutions, industry, and governments can drive technological advancements in the renewable energy sector [45]. Implementing a robust carbon pricing mechanism can make fossil fuels less competitive and incentivize the transition to renewable energy [46]. Strengthening cross-border energy infrastructure and fostering cooperation among member states can facilitate the sharing of renewable energy resources [47]. In Table 2, we sum up the main strategies to overcome barriers in RES installation.
Collaboration with international organizations and other countries allows for the sharing of best practices, technologies, and funding opportunities. Attracting foreign investment in renewable energy projects through favorable policies and regulations can boost development. Investment in grid expansion to accommodate renewable energy integration is essential [48]. Developing energy storage solutions can address intermittency challenges. Promoting electric vehicle (EV) infrastructure and encouraging EV adoption can act as distributed energy storage [49].
Offering insurance and guarantees can help mitigate risks associated with renewable energy investments [50]. The investments are realized in small, medium, and large markets. Manufacturing companies, particularly energy-intensive sectors like metallurgy, along with individual consumers in smaller local markets, share a common interest in making investments [61,62]. This shared interest stems from the imperative of deep decarbonization [33]. Energy-intensive industries, such as metallurgy, are compelled to allocate resources toward Renewable Energy Sources (RES) to ensure their continued viability within the market [63]. A prominent illustration of this commitment to decarbonization can be found in the metallurgical industry, as evidenced in the study by Gajdzik and Wolniak [64]. This industry, characterized by its substantial energy demands, recognizes that embracing RES represents a pivotal step toward achieving sustainability and reducing carbon emissions. Similarly, individual consumers in localized markets are increasingly inclined to invest in RES as a means of contributing to a cleaner and more environmentally responsible energy landscape [48].
Various industries beyond metallurgy are recognizing the significance of investing in renewable energy sources (RESs) to align with the imperatives of deep decarbonization. This strategic approach is not limited to any one sector but is instead a growing trend in the broader landscape of manufacturing and consumer markets [56].
Industries spanning from automotive manufacturing to electronics and technology production are increasingly turning to RES as a means to reduce their carbon footprint [55]. The automotive sector, for instance, is investing in electric vehicle (EV) technology, often powered by renewable electricity sources, to transition away from traditional fossil fuel-dependent vehicles. This shift not only reduces greenhouse gas emissions but also positions these companies favorably in an evolving market in which sustainability is a key driver of consumer preference [58].
Similarly, electronics and technology manufacturers are incorporating RES into their operations and products. Data centers, which are essential for the functioning of modern technology, are being powered by renewable energy to mitigate their substantial energy consumption [59,60,61,62,63,64]. Additionally, consumer electronics companies are designing products with energy efficiency in mind, often utilizing renewable energy to manufacture their devices [65,66]. Digitalization is a strong support for the development of industries [67]. In the European policy of the industrial concepts I 4.0 and I 5.0 [68,69], it is postulated that new technologies should be aimed at decreasing energy consumption. Even the tourism sector is incorporating green policies and promoting RESs and decarbonization [70].
Long-term power purchase agreements (PPAs) provide revenue stability for project developers. Funding research and development efforts to advance renewable energy technologies and make them more cost-effective is a key strategy for long-term sustainability [70]. Engaging in international diplomacy efforts, including participation in global climate agreements, can enhance the profile of renewable energy and create diplomatic opportunities for collaboration [71].
The success of these strategies depends on tailoring them to the specific challenges and opportunities of each region. It requires cooperation between governments, businesses, communities, and international partners to promote and expand renewable energy development on a global scale.

3. Materials and Methods

In this study, desk-based research methodology was used to collect and analyze empirical data on the barriers to renewable energy sources (RESs) in European countries. This method involves gathering and evaluating information from databases and secondary sources, such as the RES Policy Monitoring Database, Eurostat, United Nations reports on RES barriers in the EU, RES consumption and generation, socioeconomic development in EU member states, and other materials available online or in libraries. The aim of the research was to analyze the barriers to the development of basic renewable energy sources (RES) in EU countries, including the impact of socioeconomic development factors, and assess the strength of the impact of these factors/barriers on the share of RESs in energy consumption in the European Union. The goal of desk research was to gain a comprehensive understanding of the barriers to RES development in the European Union. The analysis was comparative in nature, and its outcome was the identification of barriers and connections between individual countries, aiming to determine which groups of countries are affected by specific types of RES development barriers.
Some key steps were taken in the analysis (Figure 2). First, the research topic was identified by defining the research questions and the research problem and reviewing the literature on RES barriers in the EU. The second step was identifying the main factors for and barriers to RES development and determining which factors or barriers would be analyzed. Third, official statistics were identified as the primary and secondary data sources for their reliability, completeness, and comparability over time. Fourth, existing data on categories of RES barriers were collected and summarized in tables. Fifth, data were combined and compared to identify trends in each RES barrier category. Finally, the data were analyzed to calculate relationships and to sum up the results of the analysis.
The literature review [22,23,24,25,26,27,28,29,30,31,32,33] indicated that the development of renewable energy sources (RESs) is influenced by various factors of an economic, political, administrative, technical, and infrastructural nature. These factors can serve as both drivers of (positive impact) and barriers to (negative impact) the development of renewable energy. Building on this background of the analysis, the authors of this paper aimed to answer the following research questions:
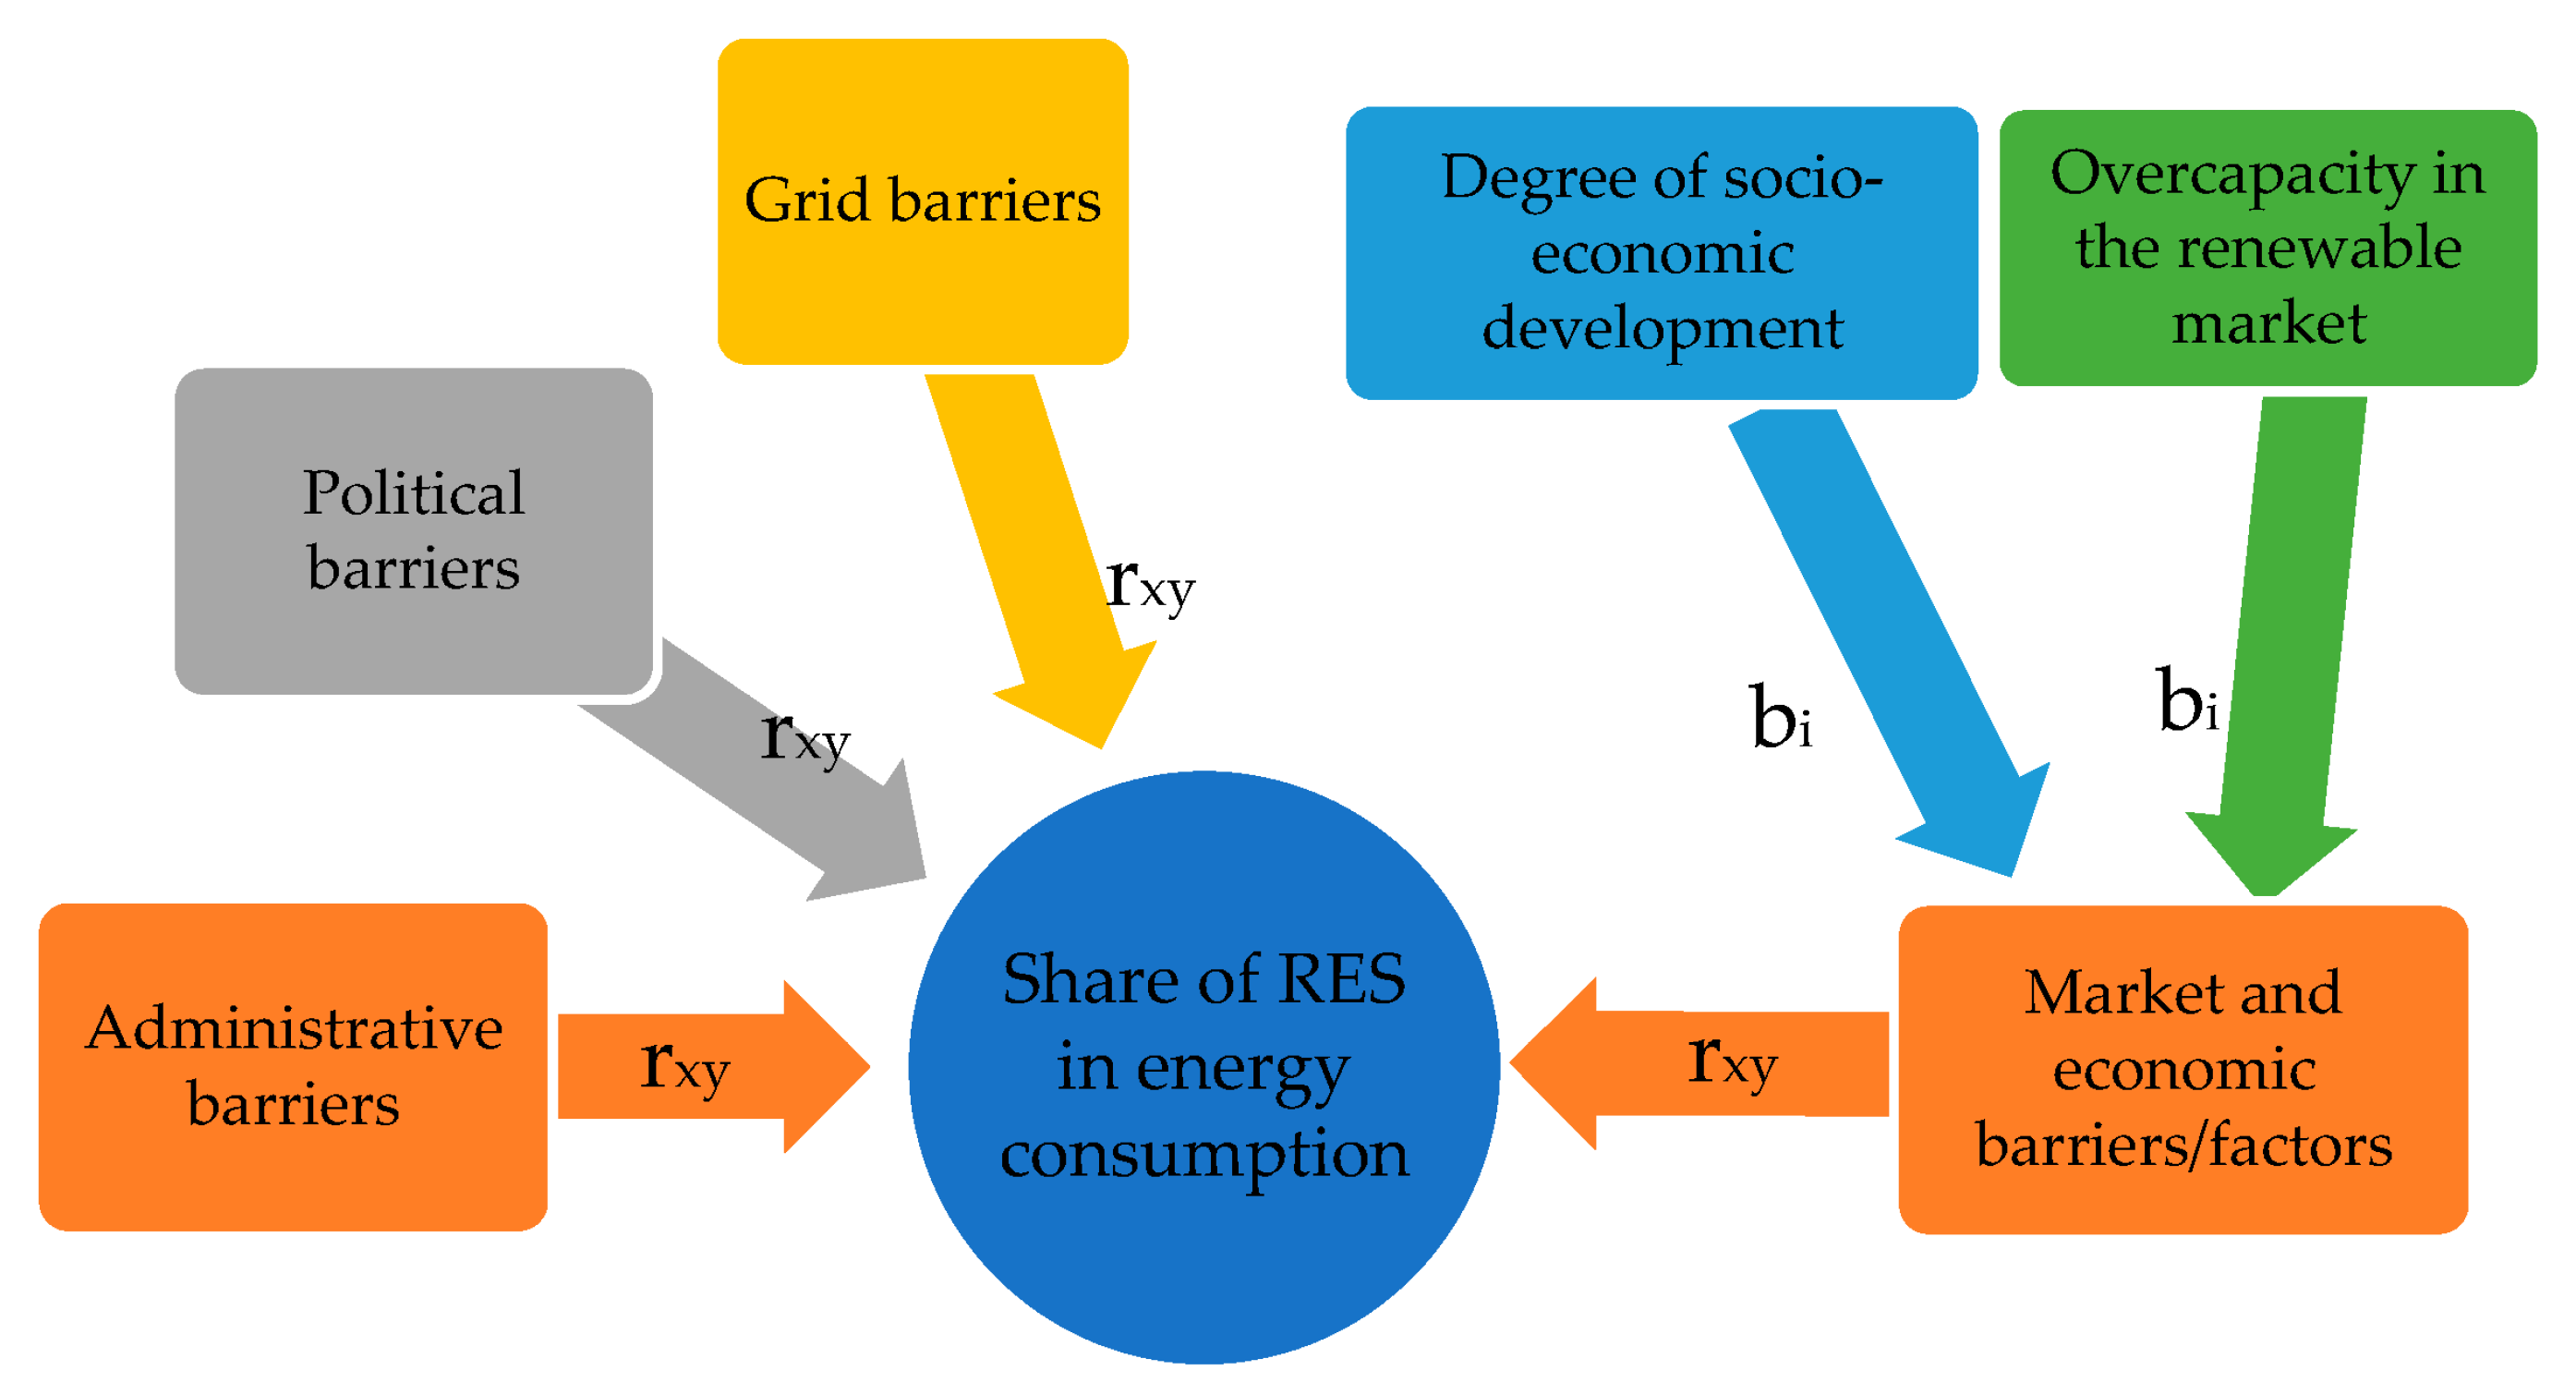
  • RQ1. How do political, administrative, grid, and socioeconomic barriers to renewable energy source implementation affect the development of renewable energy in the economy?
  • RQ2. Are market economic factors a barrier to or a stimulus for increasing the level of RESs in energy consumption?
  • RQ3. Do European Union member countries react in a uniform manner to the analyzed factors and barriers to the development of RESs?
As indicated in the assessment model (Figure 3), the authors assumed that the development of renewable energy sources in a country, understood in this paper as an increase in the share of RESs in energy consumption, can be determined by administrative processes barriers, grid barriers (the state of grid regulation and infrastructure), political barriers (the existence of an implausible RES or climate strategy), and market and economic barriers/factors. The latter are dependent on the level of socioeconomic development of a given country (social development and income levels) and the level of overcapacity in the renewable market.
The source of data regarding administrative, grid, and political barriers was the RES Policy Monitoring Database developed by Eclareon [22]. These barriers are measured using two indicators: the spread of barriers and the barrier index. The indicator used to measure the level of socioeconomic development was the Human Development Index (HDI), widely used worldwide and measured annually by the United Nations (UNDP) [71]. The indicator used to measure income levels as a socioeconomic factor of RES development was gross domestic product per capita (GDP per capita) [72]. As for the overcapacity in the renewable market, it was calculated as the difference between the share of the electricity production capacity of renewables in the total electricity production capacity and the share of gross electricity production from renewable sources in gross electricity production from all energy sources. The source of data for calculating all indicators related to socioeconomic development and the level of RESs in the economy was Eurostat [14,34,73]. Since the largest expansion of the European Union occurred in 2004, in order to ensure data comparability, the research period was 2004–2021. The endpoint of 2021 was chosen due to data availability, and this is also the most recent year for which data on RES development barriers and their extent are available. In the analysis, we took into account the EU-27 and not the EU-28. We excluded the UK from the analysis because as of 2020, the UK is not a member of the European Union. Thus, it is uncertain whether current and future EU climate policies, including RES policies, will be followed by the UK. Therefore, we assumed the state of EU membership as at the end of the study period (2021), i.e., 27 EU member states. In addition, the analysis was conducted for countries and not just the EU as one overall entity.
After collecting the existing data, the authors proceeded to the analysis of data concerning the barriers and the share of RESs in energy consumption to identify trends in each RES barrier category and in the development of renewable energy. All four barriers/factors were evaluated for each EU country. Then, a correlation analysis was conducted between RES development barriers and the change in the share of RESs in energy consumption in the EU to determine whether there are dependencies between the variables being studied, both for the EU as a whole and for each individual country. The final stage of the research process involved the analysis of relationships and a summary of the analysis results. In this stage, for factors related to socioeconomic development, a multiple linear regression analysis was performed to determine which of the market and economic barriers/factors statistically significantly influence RES development in EU member countries. The significance level was set at 0.05, which is also given in Section 3, and Statistica 13.3 software (TIBCO Software, Dublin, Ireland) was used for statistical calculations.

4. Results of the Analysis

The present study aimed to analyze the main factors influencing the development of renewable energy sources (RESs) and the impact of RES barriers and economic development factors on RES consumption in European countries. First, we assessed how the barriers to renewable energy development in the European Union have evolved (analyzing all 27 European Union member states); how the fundamental economic development factors related to the entire economy, such as the level of social development in those countries and the GDP per capita, have changed; and renewable energy (i.e., the electricity production capacity of renewables in the total electricity production capacity), and we examined how the relationships between these factors and RES energy consumption have developed. Table 3 presents the level of administrative, political, and grid barriers to the development of renewable energy (measured by the spread of these barriers and the barrier index measuring the possibility of influencing the deployment of RES technologies), as well as the development of RES consumption in the European Union. The goal of this analysis was to assess how RES barriers are shaped in individual countries and the corresponding long-term changes in renewable energy consumption.
Analyzing the data in Table 3, it should be noted that the greatest extent pertained to political barriers, i.e., barriers caused by the non-existence of a RES/climate strategy, sudden changes in the RES strategy, difficulties with practical implementation, or the lack of a support scheme for RES technologies, as well as those related to the remuneration available for RESs. The average spread of these barriers was 3.61, while administrative barriers were at 3.28 and network-related barriers were at 3.17. However, taking into account the barrier index values, which measure existing barriers to the deployment of RESs and their contribution to the opportunities for deploying specific projected RES technology [25], administrative process barriers had the greatest impact (with an average value of 0.89), whereas for grid barriers, the index was 0.81, and for political barriers, it was 0.83. In the case of administrative process barriers, these are barriers concerning the complexity and transparency of administrative procedures as well as the duration and associated costs of administrative procedures, barriers related to the integration of RESs into spatial and environmental planning, and conflicts with third parties. The data analysis suggests that across the EU, all types of barriers have at least a medium spread, although the extent of this spread varies between countries. Administrative process barriers had a large spread in Latvia, Romania, Spain, and Hungary, while they had a severe impact, as measured by the barrier index, in the Czech Republic, Estonia, Hungary, Ireland, Latvia, Lithuania, Malta, Poland, and Portugal. Meanwhile, grid regulation and infrastructure barriers had a large spread only in Hungary and Latvia, with a value of 4.00 or greater, while in most other countries, it was usually medium (i.e., valued between 2.51 and 3.50) or rather low, i.e., valued at 2.50 or lower (Czech Republic, Estonia, The Netherlands, and Portugal). Interestingly, a high level of the index for this type of barrier occurred in Austria, Belgium, Bulgaria, Greece, and Hungary, mainly in Southern European countries. Political barriers mostly had a medium spread in most countries (valued at 2.51–3.50), but they were large in France, Hungary, Ireland, Portugal, Slovakia, Slovenia, and Sweden. Moreover, these barriers significantly hindered the deployment of RESs in Bulgaria, Hungary, Italy, Lithuania, and Romania (barrier index valued above 0.9). When analyzing changes in the share of RESs in electricity consumption, it is also worth noting that during the research period, they largely corresponded to the share of RESs in the overall final energy consumption (the correlation was statistically significant and amounted to 0.57). Additionally, the largest changes in renewable consumption were in countries that are leaders in implementing climate policy goals and have over a 40% RES share in consumption, such as Denmark, Germany, Portugal, Spain, and Sweden.
Analyzing the European Union as a whole and the differences between countries, a low and statistically insignificant relationship between barriers to the development of RESs in European Union countries and changes in the share of renewables in electricity consumption was observed (see Table 4). The results of the correlation analysis also indicate that a higher correlation exists in the case of the spread of barriers than in the case of opportunities for the contribution of barriers to the deployment of RES technology (the barrier index). In the case of administrative barriers, the correlation values for both indicators measuring the impact of the barriers were close to zero, indicating a lack of correlation (administrative rules are independent in each country and do not apply to the entire EU area). By contrast, for the other types of barriers (grid and political), the correlation analysis was also low, but in the case of the spread of barriers, a certain level of a negative relationship was identified (−0.21 and 0.24, respectively). This can be explained by the fact that we were dealing with the impact of the same energy and climate policy for the entire EU area and that EU countries are interconnected by common grids. However, when examining not the long-term changes in renewable energy consumption but the current state of RES usage in energy consumption, in the case of opportunities for the contribution of barriers to the deployment of RES technology, there was a correlation with a moderate negative strength between political and administrative processes barriers and the share of RESs in energy consumption (−0.31 and −0.59 respectively).
Next, in order to determine the role of factors related to the market socioeconomic environment in shaping the development of RESs, Table 5 and Table 6 present how these variables changed during the study period and whether they correlated with the development of RESs, specifically their share in energy consumption.
The long-term analysis of factors in the market economic environment (Table 4) for the renewable energy market indicates that, in the long term, in all countries (except Greece and Italy), an increase in both the wealth of societies measured by GDP per capita and social development was observed in EU countries. In both cases, a greater extent of growth was observed in less affluent countries (in line with the convergence principle), while lower growth rates were observed in wealthier countries. Importantly, changes in RES consumption in the European Union (where the dataset consisted of values in individual countries) over the studied period were statistically significantly correlated with the level of socioeconomic development. The correlation coefficients with the Human Development Index were 0.43 (for 2021) and 0.45 (for 2004) and were statistically significant (at p < 0.05). Regarding the GDP per capita, the correlation with this variable was 0.31, but there was no statistically significant relationship for the entire EU.
Turning to the supply side of the renewable energy market, it is worth noting that in the case of several countries (Belgium, Croatia, Latvia, Luxembourg, and The Netherlands), significant fluctuations in overcapacity in the renewable electricity market were observed, which may suggest that this factor could influence the development of RESs in these countries (positively or negatively). Additionally, it was found that in Austria, Croatia, and Latvia, the share of RES production capacity decreased over the study period, indicating that the supply-side factor could be a hindrance to the development of RES consumption in these countries.
The correlation analysis indicated that, for most countries in the European Union, the development of renewable energy from 2004 to 2021 was positively correlated with the GDP per capita and the Human Development Index (HDI) as a measure of social development. The only correlation exceptions occurred for Greece, Italy, Spain, Slovenia, Portugal, Luxembourg, and Finland, where either the correlation was statistically insignificant (in the last four countries) or negative (in the first three countries). The correlation analysis also showed that in the case of overcapacity in the renewable market, the relationships were diverse. Some countries exhibited positive correlations, others exhibited negative correlations, and some showed no correlation with the growth of RES consumption in their respective countries.
To assess whether there was a statistically significant impact of some of these factors on RES development, a multiple linear regression analysis was conducted between these three market economic environment factors and the level of the share of RESs in energy consumption (see Table 7). In each case, partial correlations were also examined to confirm the linearity of the relationships (which was present in each of the cases mentioned below).
The multiple regression analysis conducted for each of the EU member states indicated that the most common driver influencing the development of RESs was the level of social development, as measured by the Human Development Index. In eight countries, an additional or sole factor (Romania and Slovakia) was the level of economic development (GDP per capita). It is worth noting that these were often countries in Central–Eastern Europe or located along the coast. It is also worth adding that while the HDI always had a positive impact on the share of RESs in electricity consumption, in the case of GDP per capita, the impact could be either positive (Bulgaria, Romania, Slovakia, and Sweden) or negative (Hungary, Italy, Portugal, and Spain). Another important conclusion worth emphasizing is that in the case of a significant portion of Central and Eastern European countries, there was a statistically significant impact of the level of overcapacity in the renewable market on the share of RESs in electricity consumption. Therefore, it can be stated that market economic factors in most EU countries are statistically significant factors influencing the development of RES consumption.
Next, on the basis of the results in Table 3, Table 4, Table 5, Table 6 and Table 7, a collective list was prepared to show how individual barriers in each of the EU Member States influenced the development of RESs during the study period (Table 8). This collectively determined the impact of all the factors examined in this paper on the development of RESs in energy consumption in the EU. The strength of the impact is indicated by the number of plus signs, where a higher number indicates a greater impact.
The results of the analysis of factors influencing RES development in EU countries showed that in most EU member states (18 out of 27), the most important factor for development was the level of social development (with a very strong impact in 11 countries) and the prosperity of the country, measured as GDP per capita growth (Bulgaria, Romania, Slovakia, and Sweden). The next in line as a driver was the presence of overcapacity in the renewable market (Belgium, Cyprus, France, Hungary, Luxembourg, Malta, and The Netherlands). It was also found that barriers most commonly had administrative origins (with a very strong impact in 9 countries and a strong impact in 16 countries) and political origins (with a very strong impact in 5 countries and a strong impact in 11 countries). Another area of concern is grid barriers (with a very strong impact in five countries and a strong impact in six countries), and finally, market-economic factors (present in eight countries, with a very strong impact in Latvia due to overcapacity). The results also showed that in 8 out of 27 countries, all four types of barriers were present; in Hungary, three were present; and in Bulgaria (grid, political), Latvia (administrative, overcapacity), and Lithuania (administrative, political), there were two types of barriers with a very strong discouraging impact on RES implementation.

5. Discussion

In the paper, we analyzed the impact of factors on the development of renewable energy source consumption in European countries. On the basis of the results of this analysis, the authors assessed which of these factors contributed to RES barriers in the renewable market. The analysis had a comparative nature, and its outcome was the identification of connections between individual countries. The literature review indicated that many factors influence the development of RESs. These factors are often grouped in different ways; nevertheless, most importantly, the literature underlines barriers such as barriers resulting from market imperfections of finance [23]; storage and demand or market power [28]; technological and infrastructure obstacles [27]; sociopolitical, regulatory, and environmental factors [32]; political support [22]; environmental/technical factors; planning [33]; barriers concerning grid problems [26,27,28,33] or administrative obstacles, including protracted regulatory approvals and permitting processes [25,27]; and others. Having undertaken a critical analysis of the literature, the authors identified four types of factors that can constitute barriers to the development and consumption of renewable energy sources: administrative processes barriers, grid barriers, political barriers, and market and economic barriers.
The first of these are barriers related to the complexity and transparency of administrative procedures, including the duration of administrative procedures and associated costs, barriers related to the integration of RESs into spatial and environmental planning, and conflicts with third parties [22,24,25,30,33]. Grid barriers relate to the lack of sufficient grid infrastructure (or its slow development) for the transmission and distribution of energy generated from renewable sources. Additionally, these barriers also pertain to the high costs of grid connection or the transparency of procedures for connecting RES to the grid [22,26,27,28,33]. Political barriers concern the existence of an unrealistic RES or climate strategy, a lack of or poorly functioning support system for these energy sources, remuneration for RES (it is either too low or favors other energy sources disproportionately in relation to the risks or current development needs), and the failure of the policy framework to keep up with the pace of renewable energy development [22,23,24,25,27,28,30,31,32,33]. Meanwhile, market and economic barriers encompass factors such as a low level of social development in the country, low-income growth for society, and overcapacity in the renewable market [22,23,24,25,28,29,30,31,32,33,72,73,74].
To answer RQ2, the authors checked the impact of socioeconomic factors on RES energy consumption in EU countries. The analysis conducted in this study indicates that a high level of development in a given country favors a high utilization of RESs and their consumption. It is worth noting that the highest share of RESs in electricity or final energy consumption was observed in the wealthiest countries, such as Denmark, Finland, Sweden, Germany, and Latvia (which is an exception among the wealthiest economies). Additionally, among less affluent economies in the EU, a significant driver of RES development was the increase in GDP per capita (Bulgaria, Poland, Portugal, and Slovenia). Even if a country does not support RESs or does so inefficiently, rising prosperity among the population leads to a greater willingness to consume RESs. This can be explained by the fact that investments in RESs are costly, which may suggest that in economies of less affluent countries, it is mainly the wealthier part of the population or the part with the fastest-growing incomes that invests in RESs. Therefore, low economic growth, recession, or a decline in the level of social development in the analyzed economies may constitute a barrier to the development of RESs.
Answering RQ1, it can be stated that different factors affect different countries. The analysis indicated that in the economies of less affluent EU countries (Czech Republic, Estonia, Hungary, Latvia, Lithuania, Malta, Poland, and Portugal) as well as in Ireland, administrative process barriers pose the strongest impediment to RES development. In most of these countries where the influence of administrative process barriers is strong, there was also a strong or very strong influence of political barriers. It was also found that in countries where the share of RESs in electricity consumption was high (Belgium, Germany, and Sweden) or had a significant increase in 2004–2021 (Cyprus, Estonia, and France), overcapacity in the renewable market exerted a strong influence on development. This could be related to increased uncertainty in the renewable market, which arises in such situations, aligning with findings highlighted in the literature [23,28,31,32].
In conclusion, answering RQ3, it should be noted that in countries in Southern–Central Europe, namely Austria, Bulgaria, Greece, Hungary, and Belgium, where there was a significant increase in RES capacity during the study period, grid barriers had a very significant impact on RES development. This aligns with the literature, emphasizing grid barriers as a significant factor slowing RES consumption [28].
The findings of this study align with those of several previous research works that have highlighted administrative barriers as a significant impediment to RES development. Other studies across Europe, for example, Kryszk et al. [43] and Rozwadowska and Szymański [75], have consistently pointed out the complexity and duration of administrative procedures as a key hindrance to renewable energy projects. This consistency underscores the need for streamlining bureaucratic processes to accelerate RES implementation.
The study’s observation of grid barriers impacting RES development in Southern–Central European countries is consistent with broader research trends. Grid constraints are often more pronounced in regions with slower infrastructure development. Similar results were observed in Liberia by Innis and Assche [76]. The problem in European Union countries was also described by Maciulytie-Sniukiene and Butkus [77]. Addressing this challenge requires targeted investments in grid expansion and modernization. These findings align with the broader discourse on grid integration for renewables. In companies, the key strategy can be the improvement of used technologies [78] and digitalization [79]. The barriers analyzed are particularly important for energy-intensive sectors, e.g., metallurgy [10,62,63,64,80,81,82,83]. In our opinion, while renewable energy represents a critical path toward a more sustainable and environmentally friendly future, it is not without risks and challenges. Mitigating these risks requires a combination of technological innovation, sound policy frameworks, international cooperation, and proactive planning. Striking a balance between the benefits of renewable energy and the risks associated with its implementation is essential for a successful energy transition. Ultimately, a well-managed and well-executed transition to renewable energy can yield not only environmental benefits but also economic and social advantages for societies worldwide.
The renewable energy sector is highly influenced by government policies and regulations. Changes in government leadership and shifts in policy priorities can introduce uncertainty and risks for investors and project developers. Stable, long-term policies that provide a predictable investment climate are essential for the success of renewable energy projects.
The transition to renewable energy could shift global energy dynamics and influence geopolitical relationships. Countries with abundant renewable resources may gain strategic advantages, while traditional fossil fuel-dependent nations may face economic and geopolitical challenges. Managing these shifts and ensuring cooperation in the global energy transition is essential to minimize conflicts and disruptions.

6. Conclusions

The study aimed to analyze the RES barriers in European countries from 2004 to 2021, taking into account factors such as administrative processes barriers, grid barriers, political barriers, and market and economic barriers. The analysis revealed that one cannot speak of the European Union as a uniform area in terms of the pace of renewable energy development and the factors hindering this development. The analysis indicated that there was no statistically significant relationship between the development of RES barriers in the European Union as a whole and changes in the share of renewables in electricity consumption. The results from the correlation analysis showed that, from the perspective of the entire European Union, in the short-term analysis (one year) of RES development, the spread of barriers was more significant. However, when analyzing long-term changes in the share of RESs in energy consumption, the opportunities for the contribution of barriers to the deployment of RES technology, influenced by political, administrative processes, and market and economic barriers, were statistically more significant. Relationships and statistically significant impacts of the analyzed barriers on RES development existed when analyzing individual countries.
A striking correlation existed between a high level of social development and the adoption of renewable energy sources. Notably, the countries with the highest RES utilization included Denmark (43.6% of final energy consumption), Finland (43.1%), Sweden (57.4%), Germany (39.7%), and Latvia (37.1%). In these nations, a robust GDP per capita growth rate contributed significantly to their willingness to embrace RES. Administrative process barriers have a substantial impact on RES development, particularly in less affluent EU countries. For instance, in the Czech Republic, Hungary, and Poland, these barriers exert strong discouraging effects. Streamlining administrative procedures, environmental planning, and reducing associated costs is imperative in these regions to expedite renewable energy adoption.
In specific regions, particularly Southern–Central Europe (e.g., Austria, Bulgaria, Greece, and Hungary), grid barriers posed significant obstacles to RES development. Challenges included slow grid infrastructure development, opaque grid connection procedures, and high connection costs. Addressing these issues is pivotal for unlocking the renewable energy potential in these areas.
With RES adoption ranging from approximately 37% to 57% in the most advanced countries, there is ample room for growth. Increased public spending on research and development, coupled with improved support mechanisms for innovators, will be pivotal in driving renewable energy technology innovation and fostering sustainable growth across the European Union.
It was found that in most EU countries, administrative process barriers (25 out of 27 countries) have a strong or very strong influence on RES implementation. However, in terms of market economic barriers, in as many as 11 countries, the level of social development exerted a very strong influence on the share of RESs in energy consumption, with a low level of social development acting as a barrier to development. Of the other two types of barriers, political barriers played an important role (16 out of 27, of which 9 had a very strong impact), while grid barriers had the least influence.
Distinctive patterns were observed among groups of countries. In most EU countries, there was not a strong influence of several types of barriers (in eight countries, all four types of barriers had a strong or very strong impact). Among less affluent EU countries, a significant barrier to RES development was a recession or low economic growth (Bulgaria, Poland, Portugal, and Slovenia). Rapid GDP per capita growth stimulates an increase in the share of RESs in electricity and final energy consumption. Similarly, administrative barriers played the most significant role in the economies of less affluent EU countries (with the exception of Ireland). In countries where the share of RESs in electricity consumption was high (Belgium, Germany, and Sweden) or had a significant increase from 2004 to 2021 (Cyprus, Estonia, and France), overcapacity in the renewable market had a strong impact on development. It was also noted that in countries in Southern–Central Europe, namely Austria, Bulgaria, Greece, and Hungary, a strong barrier to RES development was the state of grid infrastructure, including its slow development, procedures for connecting RES to the grid, and high costs of grid connection.
On the basis of this, several recommendations can be made in terms of fostering the growth of RES consumption, which policymakers can influence. In less affluent economies, significant emphasis should be placed on socioeconomic development, especially economic growth, and the elimination of administrative barriers, particularly by reducing the duration of these procedures and those related to environmental planning. More affluent countries should place a greater emphasis on reducing the level of overcapacity in the renewable market. The final recommendation applies to all economies: having a climate strategy and updating the functioning support system depending on the current situation in the renewable market.
Wealthier countries like Belgium, Germany, and Sweden and those experiencing significant RES capacity growth, such as Cyprus, Estonia, and France, contend with the impact of overcapacity in the renewable market. This factor introduces uncertainty into the renewable energy sector, aligning with findings in the existing literature. In our opinion, addressing this challenge is paramount for maintaining a stable and thriving renewable energy market.
This study constitutes a contribution to the analyzed field of knowledge. In undertaking this study, the authors conducted a comprehensive analysis of all determinants and barriers affecting the implementation and thus the development of RESs in 27 European Union countries. The authors thus filled the research gap in this area of the subject. Additionally, the authors examined the impact of market (overcapacity) and socioeconomic factors (socioeconomic development of the countries), which has not been carried out in the literature so far. Relationships regarding RES barriers for groups of countries or regions in the EU were also identified. There are also some theoretical conclusions to draw. The development of RESs is influenced not by individual sets of barriers but by different types of barriers. Another conclusion is the limited research on the state of barriers in all European Union countries, which would allow monitoring changes in this research area. The literature pays insufficient attention to the role of socioeconomic factors in RES development and their significant role in achieving target indicators by member states.
The statistical analysis of the RES barriers submitted indicates the need to make the needs and differences between different groups of countries realistic in overcoming barriers. The removal of barriers to building a diversified energy system is associated with RES policies implemented in countries. The analysis indicated that barriers to RES development are not uniform across the EU, despite the fact that EU directives apply to the entire territory of the European Union. Furthermore, specific development barriers or factors in the development of RESs are often specific to groups of countries or regions in Europe. In specific policies, much greater importance should be given to the causes that inhibit the development of renewable energy technologies and infrastructure. The measures taken in recent years are an important step forward, but without decisively removing barriers in the years to come, they will not change the face of climate policy. Ultimate success depends on the consistent implementation of energy sector reform plans and a significant increase in public spending on research and development—including from domestic funds—as well as the continuous improvement of existing instruments to support innovators, including learning from the experience gained over the past few years from completed projects. Like any study, this one also has limitations. The primary limitation is the need to monitor barriers every year for EU countries in order to analyze them in the coming years and the difficulties in accessing data. This is also a recommendation for future research directions, to conduct analyses in subsequent years, expand analyses for groups of countries within the European Union, and attempt international comparisons.

Author Contributions

The main activities of the team of authors can be described as follows: Conceptualization, B.G., R.W. and R.N.; methodology, R.N.; software, R.N., B.G. and R.W.; validation, B.G., R.N. and R.W; formal analysis, B.G., R.N. and R.W.; investigation, R.N., R.W. and B.G.; resources, B.G., R.N., R.W. and W.W.G.; data curation, R.N., B.G. and R.W.; writing—original draft preparation, R.N., B.G. and R.W.; writing—review and editing, R.W., B.G., R.N., T.R. and W.W.G.; visualization, B.G., R.W. and R.N.; supervision, B.G., R.N., T.R., R.W. and W.W.G.; funding acquisition, B.G. and R.W. All authors have read and agreed to the published version of the manuscript.

Funding

This research was funded by Silesian University of Technology: 11/040/BK_223/0029 and 13/990/KPW21/0166.

Data Availability Statement

The data presented in this study are available upon request.

Acknowledgments

The present article originated as part of a research internship of Bożena Gajdzik at the Institute of Mechanical Engineering, Ivano-Frankivsk National Technical University of Oil and Gas.

Conflicts of Interest

The authors declare no conflict of interest.

References

  1. European Green Deal. Komunikat Komisji do Parlamentu Europejskiego, Rady Europejskiej, Rady, Komitetu Ekonomiczno-Społecznego i Komitetu Regionów, Bruksela 11.12.2019, COM(2019)640 Final. Available online: https://eur-lex.europa.eu/legal-content/pl/TXT/?uri=CELEX%3A52019DC0640 (accessed on 15 June 2021).
  2. Clean Energy for All Europeans—Unlocking Europe’s Growth Potential. IP_16_4009. European Commission, Brussel. 2016. Available online: https://europa.eu/rapid/press-release_IP-16-4009_en.htm (accessed on 15 April 2023).
  3. European Comisssion—Komunikat Prasowy (in Polish): Czysta Energia dla Wszystkich Europejczyków, Czyli jak Wyzwolić Potencjał Wzrostu Europy, Bruksela 30.11.2016. Available online: https://ec.europa.eu/commission/presscorner/detail/pl/ (accessed on 15 April 2023).
  4. Porozumienie Paryskie do Ramowej Konwencji Narodów Zjednoczonych w Sprawie Zmian Klimatu, Sporządzonej w Nowym Jorku Dnia 9 Maja 1992 r, Przyjęte w Paryżu Dnia 12 Grudnia 2015 r., Dz.U. 2017, poz. 36. Available online: https://www.consilium.europa.eu/pl/policies/climate-change/paris-agreement/ (accessed on 15 September 2023).
  5. Eurostat. 2019. Available online: https://ec.europa.eu/eurostat/documents/2995521/9571695/8-12022019-AP-EN.pdf/b7d237c1-ccea-4adc-a0ba-45e13602b428 (accessed on 15 September 2023).
  6. Dyrektywa UE, Grudzień. 2018. Available online: https://eur-lex.europa.eu/legal-content/PL/TXT/?uri=CELEX%3A32018L2001 (accessed on 15 September 2023).
  7. Urbano, E.M.; Martinez-Viol, V.; Kampouropoulos, K.; Romeral, L. Future european energy markets and industry 4.0 potential in energy transition towards decarbonization. Renew. Energy Power Qual. J. 2020, 18, 190–195. [Google Scholar] [CrossRef]
  8. Matsunaga, F.; Zytkowski, V.; Valle, P.; Deschamps, F. Optimization of Energy Efficiency in Smart Manufacturing Through the Application of Cyber-Physical Systems and Industry 4.0 Technologies. J. Energy Resour. Technol. Trans. ASME 2022, 144, 102104. [Google Scholar] [CrossRef]
  9. Bernat, T.; Flaszewska, S.; Lisowski, B.; Lisowska, R.; Szymańska, K. Facing Environmental Goals for Energy-Efficiency Improvements in Micro and Small Enterprises Operating in the Age of Industry 4.0. Energies 2022, 15, 6577. [Google Scholar] [CrossRef]
  10. Wolniak, R.; Saniuk, S.; Grabowska, S.; Gajdzik, B. Identification of energy efficiency trends in the context of the development of industry 4.0 using the Polish steel sector as an example. Energies 2020, 13, 2867. [Google Scholar] [CrossRef]
  11. Strategic Energy Technology Plan. The SET Plan. EC. Brussel. 2007. Available online: https://setis.ec.europa.eu/implementing-actions_en (accessed on 20 September 2023).
  12. OECD. Greening Household Behaviour. The Role of Public Policy, p. 22. 2011. Available online: http://www.oecdilibrary.org/environment/greening-household-behaviour_9789264096875-en (accessed on 10 April 2023).
  13. Zhang, Z.; Zhu, W. Residential mobility and household energy-saving appliances purchasing behavior in urban areas: Evidence from China. Energy Rep. 2023, 9, 387–396. [Google Scholar] [CrossRef]
  14. Eurostat. Available online: https://ec.europa.eu/eurostat/databrowser/view/SDG_07_40__custom_7629467/default/table?lang=en (accessed on 10 September 2023).
  15. CORDIS. Europa. EU. Available online: https://cordis.europa.eu/article/id/401589-bringing-down-the-barriers-to-the-uptake-of-clean-energy-solutions-in-europe/pl (accessed on 15 September 2023).
  16. CORDIS. Europa. EU. Available online: https://cordis.europa.eu/project/rcn/303125/brief/pl (accessed on 15 September 2023).
  17. CORDIS. Available online: https://cordis.europa.eu/project/rcn/303126/brief/pl (accessed on 15 September 2023).
  18. CORDIS. Available online: https://cordis.europa.eu/project/rcn/200557/brief/pl (accessed on 15 September 2023).
  19. CORDIS. Available online: https://cordis.europa.eu/project/rcn/303124/brief/pl (accessed on 15 September 2023).
  20. CORDIS. Available online: https://cordis.europa.eu/project/rcn/303130/brief/pl (accessed on 15 September 2023).
  21. Namvar, A.; Salehi, J. Adaptive Residential Energy Hubs Scheduling Considering Renewable Sources. J. Oper. Autom. Power Eng. 2024, 12, 142–151. [Google Scholar]
  22. Eclareon. RES Policy Monitoring Database: Barriers and Best Practices for Wind and Solar Electricity in the EU27 and UK. European Climate Foundation. 2022. Available online: https://resmonitor.eu/en/categories/political-and-economic-framework/existence-of-res-support-scheme/barriers/ (accessed on 10 September 2023).
  23. Wiśniewski, G. Analiza barier w rozwoju energetyki odnawialnej w Polsce i propozycje rozwiązań systemowych, materiały z konferencji: Rozwój energetyki odnawialnej w Polsce”, Biuro Studiów i Ekspertyz Kancelarii Sejmu. Konf. I Semin. 1999, 2, 76. [Google Scholar]
  24. Wasiuta, A. Identification and assessment of barriers in renewable energy sources development. In Wybrane Problemy Administracji Publicznej Prawo—Zarządzanie—Polityka; Mikołajczewska, W., Kierończyk, P., Eds.; Wydawnictwo Gdańskiej Szkoły Wyższej: Gdańsk, Poland, 2015; pp. 153–170. [Google Scholar]
  25. Ekonomiczne i Prawne Aspekty Wykorzystania OZE w Polsce; Europejskie Centrum Energii Odnawialnej: Warsaw, Poland, 2000; Available online: http://www.pga.org.pl/prawo/ekonomiczne_i_prawne_aspekty.pdf (accessed on 10 September 2023).
  26. International Energy Agency. Enhancing the Market Deployment of Energy Technology; OECD/IEA: Paris, France, 1997; p. 47. [Google Scholar]
  27. Nasirov, S.; Silva, C.; Agostini, C.A. Investors’ Perspectives on Barriers to the Deployment of Renewable Energy Sources in Chile. Energies 2015, 8, 3794–3814. [Google Scholar] [CrossRef]
  28. Lehmann, P.; Creutzig, F.; Ehlers, M.-H.; Friedrichsen, N.; Heuson, C.; Hirth, L.; Pietzcker, R. Carbon lock-out: Advancing renewable energy policy in Europe. Energies 2012, 5, 323–354. [Google Scholar] [CrossRef]
  29. Carfora, A.; Pansini, R.V.; Scandurra, G. The role of environmental taxes and public policies in supporting RES investments in EU countries: Barriers and mimicking effects. Energy Policy 2021, 149, 112044. [Google Scholar] [CrossRef]
  30. Byrnes, L.; Brown, C.; Foster, J.; Wagner, L. Australian renewable energy policy: Barriers and challenges. Renew. Energy 2013, 60, 711–721. [Google Scholar] [CrossRef]
  31. Foxon, T.J.; Gross, R.; Chase, A.; Howes, J.; Arnall, A.; Anderson, D. UK innovation systems for new and renewable energy technologies: Drivers, barriers and systems failures. Energy Policy 2005, 33, 2123–2137. [Google Scholar] [CrossRef]
  32. Streimikiene, D.; Baležentis, T.; Volkov, A.; Morkūnas, M.; Žičkienė, A.; Streimikis, J. Barriers and Drivers of Renewable Energy Penetration in Rural Areas. Energies 2021, 14, 6452. [Google Scholar] [CrossRef]
  33. Patel, S.; Parkins, J.R. Assessing motivations and barriers to renewable energy development: Insights from a survey of municipal decision-makers in Alberta, Canada. Energy Rep. 2023, 9, 5788–5798. [Google Scholar] [CrossRef]
  34. Eurostat. Available online: https://ec.europa.eu/eurostat/databrowser/view/NRG_INF_EPCRW__custom_7549063/default/table?lang=en (accessed on 10 September 2023).
  35. Pietzcker, R.C.; Osorio, S.; Rodrigues, R. Tightening EU ETS targets in line with the European Green Deal: Impacts on the decarbonisation of the EU power sector. Appl. Energy 2021, 293, 116914. [Google Scholar] [CrossRef]
  36. Felea, A.I.; Felea, I.; Hoble, C.R. Multicriteria Quantification of the Compatibility of the Targets from Romania’s Relevant Strategies with the European Green Deal. Sustainability 2023, 15, 13386. [Google Scholar] [CrossRef]
  37. Czerwińska, K.; Pacana, A. Analysis of the implementation of the identification system for directly marked parts—DataMatrix Code. Prod. Eng. Arch. 2019, 23, 22–26. [Google Scholar] [CrossRef]
  38. Hutsol, T. European Green Deal: Improving the Efficiency of Using Planetary Hydraulic Machines. Energies 2023, 16, 6481. [Google Scholar] [CrossRef]
  39. Kukharets, V.; Hutsol, T.; Kukharets, S.; Glowacki, S.; Nurek, T.; Sorokin, D. European Green Deal: The Impact of the Level of Renewable Energy Source and Gross Domestic Product per Capita on Energy Import Dependency. Sustainability 2023, 15, 11817. [Google Scholar] [CrossRef]
  40. Kotseva-Tikova, M.; Dvorak, J. Climate Policy and Plans for Recovery in Bulgaria and Lithuania. Rom. J. Eur. Aff. 2022, 22, 79–99. [Google Scholar] [CrossRef]
  41. Grosse, C.; Mark, B. Does renewable electricity promote Indigenous sovereignty? Reviewing support, barriers, and recommendations for solar and wind energy development on Native lands in the United States. Energy Res. Soc. Sci. 2023, 104, 103243. [Google Scholar] [CrossRef]
  42. Pombo-Romero, J.; Langeveld, H.; Fernández-Redondo, M. Diffusion of renewable energy technology on Spanish farms: Drivers and barriers. Environ. Dev. Sustain. 2022, 25, 11769–11787. [Google Scholar] [CrossRef]
  43. Kryszk, H.; Kurowska, K.; Marks-Bielska, R.; Bielski, S.; Eźlakowski, B. Barriers and Prospects for the Development of Renewable Energy Sources in Poland during the Energy Crisis. Energies 2023, 16, 1724. [Google Scholar] [CrossRef]
  44. Chisale, S.W.; Lee, H.S. Evaluation of barriers and solutions to renewable energy acceleration in Malawi, Africa, using AHP and fuzzy TOPSIS approach. Energy Sustain. Dev. 2023, 76, 101272. [Google Scholar] [CrossRef]
  45. Pavlowsky, C.; Koch, J.; Gliedt, T. Place attachment and social barriers to large-scale renewable energy development: A social–ecological systems analysis of a failed wind energy project in the south-central United States. Socio-Ecol. Pract. Res. 2023, 5, 175–188. [Google Scholar] [CrossRef]
  46. Matallah, S.; Matallah, A.; Benlahcene, L.; Djelil, Z. The lure of oil rents and the lack of innovation: Barriers to the roll-out of renewable energy in oil-rich MENA countries. Fuel 2023, 341, 127651. [Google Scholar] [CrossRef]
  47. Abdul, D.; Wenqi, J.; Sameeroddin, M. Prioritization of ecopreneurship barriers overcoming renewable energy technologies promotion: A comparative analysis of novel spherical fuzzy and Pythagorean fuzzy AHP approach. Technol. Forecast. Soc. Chang. 2023, 186, 122133. [Google Scholar] [CrossRef]
  48. Othman, K.; Khallaf, R. Identification of the Barriers and Key Success Factors for Renewable Energy Public-Private Partnership Projects: A Continental Analysis. Buildings 2022, 12, 1511. [Google Scholar] [CrossRef]
  49. Barragán-Escandón, A.; Jara-Nieves, D.; Romero-Fajardoc, I.; Zalamea-Leónesteban, E.F.; Serrano-Guerrero, X. Barriers to renewable energy expansion: Ecuador as a case study. Energy Strategy Rev. 2022, 43, 100903. [Google Scholar] [CrossRef]
  50. Asante, D.; Ampah, J.D.; Afrane, S.; Adjei-Darko, P.; Asante, B.; Fosu, E.; Dankwah, D.A.; Amoh, P.O. Prioritizing strategies to eliminate barriers to renewable energy adoption and development in Ghana: A CRITIC-fuzzy TOPSIS approach. Renew. Energy 2022, 195, 47–65. [Google Scholar] [CrossRef]
  51. Shahzad, K.; Lu, B.; Abdul, D. Entrepreneur barrier analysis on renewable energy promotion in the context of Pakistan using Pythagorean fuzzy AHP method. Environ. Sci. Pollut. Res. 2022, 29, 54756–54768. [Google Scholar] [CrossRef]
  52. Sambodo, M.T.; Yuliana, C.I.; Hidayat, S.; Novandra, R.; Handoyo, F.W.; Farandy, A.R.; Inayah, I.; Yuniarti, P.I. Breaking barriers to low-carbon development in Indonesia: Deployment of renewable energy. Heliyon 2022, 8, e09304. [Google Scholar] [CrossRef] [PubMed]
  53. Adedoyin, F.F.; Erum, N.; Taşkin, D.; Chebab, D. Energy policy simulation in times of crisis: Revisiting the impact of renewable and non-renewable energy production on environmental quality in Germany. Energy Rep. 2023, 9, 4749–4762. [Google Scholar] [CrossRef]
  54. Zhu, T.; Curtis, J.; Clancy, M. Modelling barriers to low-carbon technologies in energy system analysis: The example of renewable heat in Ireland. Appl. Energy 2023, 330, 120314. [Google Scholar] [CrossRef]
  55. Kaznowski, R.; Sztafrowski, D. Electricity system based on renewable energy sources. Opportunities and barriers to development. Prz. Elektrotech. 2023, 99, 186–189. [Google Scholar]
  56. Kazemi, M.; Udall, J. Behavioral barriers to the use of renewable and energy-efficient technologies in residential buildings in Iran. Energy Effic. 2023, 16, 79. [Google Scholar] [CrossRef]
  57. Pacana, A.; Czerwińska, K. Indicator analysis of the technological position of a manufacturing company. Prod. Eng. Arch. 2023, 29, 22–26. [Google Scholar] [CrossRef]
  58. Pathak, S.K.; Sharma, V.; Chougule, S.S.; Goel, V. Prioritization of barriers to the development of renewable energy technologies in India using integrated Modified Delphi and AHP method. Sustain. Energy Technol. Assess. 2022, 50, 101818. [Google Scholar] [CrossRef]
  59. Juszczyk, O.; Juszczyk, J.; Juszczyk, S.; Takala, J. Barriers for Renewable Energy Technologies Diffusion: Empirical Evidence from Finland and Poland. Energies 2022, 15, 527. [Google Scholar] [CrossRef]
  60. Laldjebaev, M.; Isaev, R.; Saukhimov, A. Renewable energy in Central Asia: An overview of potentials, deployment, outlook, and barriers. Energy Rep. 2021, 7, 3125–3136. [Google Scholar] [CrossRef]
  61. Gajdzik, B.; Sroka, W.; Vveinhardt, J. Energy Intensity of Steel Manufactured Utilising EAF Technology as a Function of Investments Made: The Case of the Steel Industry in Poland. Energies 2021, 14, 5152. [Google Scholar] [CrossRef]
  62. Gajdzik, B.; Sroka, W. Resource Intensity vs. Investment in Production Installations-The Case of the Steel Industry in Poland. Energies 2021, 14, 443. [Google Scholar] [CrossRef]
  63. Gajdzik, B.; Jaciow, M.; Wolniak, R.; Wolny, R.; Grebski, W.W. Assessment of Energy and Heat Consumption Trends and Forecasting in the Small Consumer Sector in Poland Based on Historical Data. Resources 2023, 12, 111. [Google Scholar] [CrossRef]
  64. Gajdzik, B.; Wolniak, R.; Grebski, W. Process of Transformation to Net Zero Steelmaking: Decarbonisation Scenarios Based on the Analysis of the Polish Steel Industry. Energies 2023, 16, 3384. [Google Scholar] [CrossRef]
  65. Takman, J.; Andersson-Sköld, Y. A framework for barriers, opportunities, and potential solutions for renewable energy diffusion: Exemplified by liquefied biogas for heavy trucks. Transp. Policy 2021, 110, 150–160. [Google Scholar] [CrossRef]
  66. Mahmud, H.; Roy, J. Barriers to overcome in accelerating renewable energy penetration in Bangladesh. Sustainability 2021, 13, 7694. [Google Scholar] [CrossRef]
  67. Gajdzik, B.; Wolniak, R. Digitalisation and Innovation in the Steel Industry in Poland—Selected Tools of ICT in an Analysis of Statistical Data and a Case Study. Energies 2021, 14, 3034. [Google Scholar] [CrossRef]
  68. Industry 4.0 Digitalisation for Productivity and Growth. EPRS_BRI(2015)568337_EN. European Parliament. September 2015. Available online: https://www.europarl.europa.eu/RegData/etudes/BRIE/2015/568337/EPRS_BRI(2015)568337_EN.pdf (accessed on 10 September 2023).
  69. Industry 5.0, a Transformative Vision for Europe. Directorate-General for Research and Innovation. 10 January 2022. Available online: https://research-and-innovation.ec.europa.eu/knowledge-publications-tools-and-data/publications/all-publications/industry-50-transformative-vision-europe_en (accessed on 20 September 2023).
  70. Nagaj, R.; Žuromskaitė, B. Young Travellers and Green Travel in the Post-COVID Era. Sustainability 2023, 15, 13822. [Google Scholar] [CrossRef]
  71. UNDP (United Nations Development Programme). Available online: https://hdr.undp.org/data-center/human-development-index#/indicies/HDI (accessed on 10 September 2023).
  72. Halkos, G.E.; Tsirivis, A.S. Electricity Production and Sustainable Development: The Role of Renewable Energy Sources and Specific Socioeconomic Factors. Energies 2023, 16, 721. [Google Scholar] [CrossRef]
  73. Eurostat. Available online: https://ec.europa.eu/eurostat/databrowser/view/sdg_08_10/default/table?lang=en (accessed on 10 September 2023).
  74. Bembenek, M.; Karwat, B.; Melnyk, V.; Mosora, Y. Research on the Impact of Supplying the Air-Cooled D21A1 Engine with RME B100 Biodiesel on Its Operating Parameters. Energies 2023, 16, 6430. [Google Scholar] [CrossRef]
  75. Rozwadowska, M.; Szymański, P. Barriers that Limit the ScalingRozwadowska Magdalena, Szymański Piotr: Of RES Projects in Polish Cities. In Vision 2025: Education Excellence and Management of Innovations through Sustainable Economic Competitive Advantage, Proceedings of the 34th International Business Information Management Association Conference (IBIMA), Madrid, Spain, 13–14 November 2019; Soliman, K.S., Ed.; International Business Information Management Association: Philadelphia, PA, USA; pp. 11583–11595. ISBN 9780999855133.
  76. Innis, P.G.; Assche, K. Permanent incompleteness: Slow electricity roll-out, infrastructure practices and strategy formation in Monrovia, Liberia. Energy Res. Soc. Sci. 2023, 99, 103056. [Google Scholar] [CrossRef]
  77. Maciulytie-Sniukiene, A.; Butkus, M. Does Infrastructure Development Contribute to EU Countries’ Economic Growth? Sustainability 2022, 14, 5610. [Google Scholar] [CrossRef]
  78. Grzybowska, K.; Gajdzik, B. Optymisation of equipment setup processes in enterprises. Metalurgija 2012, 51, 555–558. [Google Scholar]
  79. Gajdzik, B. Environmental aspects, strategies and waste logistic system based on the example of metallurgical company. Metalurgija 2009, 48, 63–67. [Google Scholar]
  80. Skjærseth, J.B.; Eikeland, P.O. Governing EU low-carbon innovation: From strategic energy technology plan to European green deal. In Handbook on European Union Climate Change Policy and Politics; Edward Elgar Publishing: Cheltenham, UK, 2023; pp. 259–273. [Google Scholar]
  81. Mandaroux, R.; Schindelhauer, K.; Basse Mama, H. How to reinforce the effectiveness of the EU emissions trading system in stimulating low-carbon technological change? Taking stock and future directions. Energy Policy 2023, 181, 113697. [Google Scholar] [CrossRef]
  82. Wilczyński, D.; Talaśka, K.; Wałęsa, K.; Wojtkowiak, D.; Bembenek, M. Experimental Study on the Cutting Process of Single Triticale Straws. Materials 2023, 16, 3943. [Google Scholar] [CrossRef] [PubMed]
  83. Price, L.; Worrell, E. International Industrial Sector Energy Efficiency Policies. 2000, LBNL 46274. Ernest Orlando Lawrence Berkeley National Laboratory. Available online: http://ies.lbl. gov/node/162 (accessed on 30 October 2008).
Figure 1. Number of publications about RES barriers in the databases WoS and Scopus between 2004 and 2022 (“Barriers of renewables”).
Energies 16 07364 g001
Figure 2. Stages of the research process.
Energies 16 07364 g002
Figure 3. Model for analyzing the impact of factors of and barriers to RES development.
Energies 16 07364 g003
Table 1. Barriers to RES development according to the literature review.
Year and CountryAuthorsCategory of BarrierDescription
1999
Poland
Wiśniewski
[23]
Market
  • Resulting from market imperfections in the optimal allocation of resources, including market barriers of an economic and financial nature that occur when renewable energy technologies have already been introduced to the market and are typical of the situation in most European Union countries just facing a progressive process of liberalization of the energy sector and the taming of new technologies.
Political
  • Resulting from an anachronistic definition of development goals and a lack of adequate institutional infrastructure. Political and institutional barriers are typical of countries with economies in transition, including Poland.
2015
Poland
Wasiuta [24] and others [25]Political
  • Gaps in the legal acts of the RES support system;
  • Organizational problem in the form of a low share of green energy in the balance of energy sold;
  • Inclusion of biomass co-firing in old condensing boilers as RES;
  • A lack of obligation to take into account in the study of conditions and directions of the spatial development of the municipality the issues related to the development of local resources of renewable energy sources.
Administrative
  • Financial security for investments;
  • Public procurement;
  • Procedures;
  • Tax regulations;
  • Limitation in the Natura 2000;
  • Joint implementation projects;
  • Technical conditions.
Economic
  • A lack of economic motivation for foreign investors to invest in RES in Poland;
  • Inadequate economic mechanisms, including, in particular, fiscal ones, which would make it possible to obtain adequate financial benefits in relation to the amount of capital expenditure incurred for facilities, installations, and equipment intended for the production of energy from renewable sources;
  • Relatively high investment costs of renewable energy technologies,
  • High cost of work (e.g., geological) necessary to obtain energy from renewable sources;
  • A lack of due tax preferences for the import and export of equipment intended for renewable energy systems.
Infrastructure
  • Poor synchronization of local use of renewable energy resources with spatial planning;
  • Low level of respect for the opinions of local communities and in cooperation with them in the development of RESs.
Market
  • A lack of widespread access to information on the distribution of RES potential;
  • A lack of information on production and design companies and the consulting companies dealing with this subject;
  • A lack of publicly available information on the procedures to be followed when opening and implementing this type of investment, as well as standard costs of the investment cycle;
  • A lack of knowledge about the economic, social, and environmental benefits associated with the implementation of investments using renewable energy sources;
  • A lack of information about manufacturers, suppliers, and contractors of systems using energy from renewable sources;
  • A lack of educational and training programs on renewable energy sources aimed at engineers, designers, architects, representatives of the energy sector, bankers, and decision-makers;
  • Difficulties in accessing information on possible sources of financing.
GernarallyOECD/IEA, Paris 1997 [26]InfrastructureIn a technical sense, the vast majority of the world’s small- and medium-scale RES technologies already enable relatively reliable and trouble-free operation of equipment at a fairly high efficiency. Hence, the main objective of further research and development should be to strive for lower investment costs, including mainly material costs, rather than to slightly increase efficiency with a disproportionate increase in costs (this is especially true for high-power wind power technologies, photovoltaic systems, and technologies for obtaining liquid fuels from biomass).
2015
Chile
Nasirov et al.
[27]
Economic
  • Market structure issues hindering renewable integration;
  • Dominance of a few players in the market;
  • Challenges in negotiating power purchase agreements ;
  • Volatility in spot market prices.
  • Extended periods for financial recovery;
  • Absence of accounting for external impacts;
  • Limited availability of financial resources;
  • High upfront capital requirements.
Infrastructure
  • Grid connectivity limitations and insufficient grid capacity;
  • Lengthy permit processing times for a large number of applications;
  • Absence of a regulatory framework for land acquisition;
  • Elevated land speculation risk due to mining-related concessions;
  • Coordination gaps among pertinent institutions.
Administrative
  • Political instability as a contributing factor;
  • A lot of legal regulations that are continuously updated.
Market
  • Local resistance to project development;
  • Insufficient dissemination of information and public awareness;
  • Scarcity of required scientific and technical competencies in the workforce.
2012
European Union
Lehmann et al.
[28]
Administrative
  • Learning and knowledge spillovers: this barrier here is the lack of policies for promoting knowledge, sharing, and learning in the renewable energy sector. The policies for carbon lock-out include implementing feed-in tariffs (or quotas) and adopting feed-in tariffs with a breathing cap.
  • Uneven political playing field: this barrier highlights the absence of policies addressing political imbalances in the renewable energy sector. To promote carbon lock-out, policies should tighten the EU Emissions Trading Scheme, implement a price collar within the scheme, phase out fossil fuel subsidies, spur market liberalization, and use feed-in tariffs as a second-best means.
  • Community acceptance: this barrier pertains to the lack of policies to foster community acceptance of renewable energy projects. Policies for carbon lock-out involve promoting local ownership through feed-in tariffs (rather than quotas) and implementing transparent, participative planning and decision-making processes, along with clear and participative zoning.
  • Planning consent and policy commitment: this barrier relates to unclear and slow planning processes and a lack of government commitment to renewable energy deployment. Policies for carbon lock-out include handling planning more clearly and quickly, establishing one-stop contact points for investors, enforcing brief and binding approval periods, and having governments endorse explicit deployment scenarios.
  • Cross-border externalities: this barrier relates to challenges in coordinating cross-border transmission networks. To promote carbon lock-out, policies should encourage cooperative planning of European transmission networks by operators and foster cooperation between national regulators.
Infrastructure
  • A lack of network capacity: this barrier signifies insufficient network capacity for renewable energy integration. Partially deep connection charges and differentiated network use-of-system charges to provide locational signals are policies for carbon lock-out.
  • Intermittency, controllability, and securing peak capacity: this barrier points to challenges associated with the intermittency of renewable energy sources. Policies for carbon lock-out include defining technical requirements and offering feed-in tariffs with premiums for certain technologies, as well as promoting voluntary curtailment agreements.
  • Technology: this barrier relates to limited support for renewable energy pilot projects and large-scale deployment. Policies for carbon lock-out involve providing support for pilot projects and offering large-scale support for renewable technology deployment.
Economic
  • Economic incentives: this barrier signifies the absence of economic incentives for renewable energy storage and demand-side management. Policies for carbon lock-out include implementing dynamic electricity pricing, time-variant grid fees and taxes, and lowering entrance barriers to ancillary markets, such as reducing bid sizes in balancing markets.
  • Capital market restrictions: this barrier relates to restrictions in the capital market that hinder renewable energy investments. Policies for carbon lock-out involve substituting quotas with feed-in tariffs.
Market
  • Market power and regulation: this barrier highlights market power and regulatory issues affecting renewable energy development. Policies for carbon lock-out encompass unbundling, priority network access, setting timelines for processing connection requests, regulating efficient operation, and providing stronger regulatory incentives for investment and innovation.
2021
countries of
European Union
Carfora et al. [29]Political
  • RES policy can play an important role in the deployment of RES technologies, but the policy is very restrictive for businesses.
Market
  • Market factors: the development of RES generation can cause production capacity shortages or overcapacity and affect the effectiveness of RES investments. The authors also indicated that trade relationships and trade networks can shape investment choices and encourage investment in renewable energy.
2013
Australia
Byrnes et al.
[30]
Administrative and PoliticalBarriers in Australia:
  • Administrative obstacles, including protracted regulatory approvals and permitting processes [28,30].
  • Lack of transparency and expensive procedures for connecting to the grid [30,32].
  • Policy unpredictability characterized by abrupt policy shifts and inconsistent decision-making [30,33,34].
  • Continued government backing for conventional electricity sources, ingrained institutional practices, and the prevalence of established norms (dominant power structures).
Economic
  • Cost-related competitiveness issues.
Market
  • Insufficient social approval and public acceptance of renewable energy initiatives [30,35].
2005
United Kingdom
Foxon et al.
[31]
Infrastructure
  • “Systems failures” in moving technologies along the innovation chain, particularly in two stages: the transition between the demonstration stage and the pre-commercialization stage and between the pre-commercialization stage and the supported commercialization stage. These failures can be seen as barriers to progress.
Economic
  • Moving from the demonstration stage to pre-commercialization is hindered by insufficient financing available for research and development (R&D) and early demonstration projects. The incentives provided by measures like the Renewables Obligation are not enough to attract investment for high-risk, early-stage technologies.
Administrative
  • There is a lack of skills in key areas of renewable energy technology development, and this can be a barrier to progress. The text suggested that the skills needed for large-scale demonstration and early commercialization may differ from those involved in R&D and initial demonstration stages.
Market
  • The text identified various forms of risk, including technology risk, market risk, regulatory risk, and systems risks, which can deter the large-scale deployment of pre-commercial technologies. These risks can make investors hesitant to support renewable energy projects.
Intellectual Property (IP) Issues
  • Small and medium-sized enterprises (SMEs) face difficulties in registering patents and negotiating IP rights, which can hinder their ability to secure private equity finance and collaborate with universities.
Expectations and Market Uncertainty
  • The text emphasized the importance of long-term market expectations for renewable energy technologies. The uncertainty surrounding future market conditions could be a barrier to innovation and investment.
Policy Framework
  • The need for a stable and consistent policy framework was highlighted as a common theme. The longevity and stability of policies like Renewable Obligation Certificates (ROCs) were seen as beneficial for providing stability in the industry. A more stable policy framework not tied to individual technologies was recommended to create positive expectations for early-stage technologies.
Exit Strategies and Support Continuity
  • The text suggested that clear “exit strategies” need to be defined to determine when support will be withdrawn from technologies. This is important to ensure that technologies can progress to commercialization without perpetual public support.
Collaboration and Partnerships
  • The study identified partnerships between companies and end-users as promoting innovation and providing a competitive advantage. However, barriers to collaboration, such as IP issues, can exist.
2021
European Union
Streimikiene [32]Economic
  • Investment costs, although diminishing;
  • Limited earning and money savings potential;
  • A risk of losing investments when moving out;
  • High costs of RES technology maintenance;
  • Uncertainty regarding operational costs;
  • Use of organic waste for energy generation provides economic benefits;
  • Lengthy investment payback periods;
  • High energy dependency on fossil fuels;
  • Regulations favoring fossil energy producers.
Administrative and Political
  • A lack of attention and resources from local authorities for RES promotion;
  • An unstable political support and changing policies;
  • High poverty and inequality;
  • Insufficient local community engagement;
  • Dependence on regional governments;
  • Low capabilities of community leaders;
  • A lack of incentives and underdeveloped business models for prosumption;
  • A lack of openness from technology vendors;
  • Prevalence of the “not in my backyard” (NIMBY) phenomenon;
  • Ineffectiveness of regional governance;
  • Resistance to RES penetration from mandatory regime actors.
Market
  • There is a substantial level of doubt and a shortage of confidence in RES technologies.
  • Consistent training is essential for the effective utilization of RES technology.
  • Incompatibility with “smart solutions” is a significant issue.
  • Apprehensions about the performance and dependability of RES systems persist.
  • Locating reliable information proves to be a challenging task.
  • The intricacy of utilizing and maintaining RES technology is a notable factor.
  • Rural communities lack the experience and knowledge required in this field.
  • The complexity of funding and subsidy programs adds to the complications.
  • Concerns arise regarding the privacy and security of data usage.
  • Worries exist about issues related to space and noise.
  • There is a valid concern about the potential harm to residences and landscapes.
  • Neighbors express dissatisfaction based on aesthetic considerations.
2023
Canada
Patel and Parkins
[33]
Economic
  • The initial investment costs of renewable electricity projects are excessively elevated.
  • The time required for renewable electricity projects to generate returns is overly extended.
  • The relatively low cost of electricity makes it challenging for renewable projects to produce adequate revenue or savings.
  • The ongoing operational and maintenance expenses associated with renewable electricity projects are deemed prohibitively high.
  • The planning, evaluation, and involvement in renewable electricity projects are considered too expensive.
Infrastructural
  • Renewable electricity initiatives pose excessive risks.
  • The state of renewable electricity technology and infrastructure is not sufficiently developed to be practical in our municipality.
  • The local and/or provincial electrical grid is inadequate for supporting a municipal renewable project.
  • Renewable projects compromise the scenic beauty of our municipality.
  • Renewable projects have the potential to harm the local wildlife.
  • Renewable projects generate noise and health-related issues.
Political
  • My municipality has primary objectives different from focusing on generating renewable electricity.
  • Provincial funding opportunities are highly competitive or unreliable.
  • The province is not inclined to back a local renewable electricity initiative.
  • The responsibility for developing renewable electricity generation does not fall within the municipal purview.
  • Municipal personnel lack the technical expertise to strategize for renewable electricity.
  • Anticipated community resistance to renewable energy infrastructure.
  • My municipality can lower its carbon emissions without engaging in renewable electricity development.
  • The town or city council is likely to object to a renewable energy project.
Source: authors’ own work based on [25,26,27,28,29,30,31,32,33].
Table 2. The strategies to overcome barriers in RES installation.
Barriers to RES InstallationStrategies to Overcome Barriers
1. Regulatory ChallengesHarmonize EU-wide renewable energy regulations. Simplify and standardize permitting procedures. Promote regulatory predictability and stability.
2. Lack of FinancingProvide financial incentives and grants for RES projects. Establish green investment banks and funds for sustainable financing. Encourage public–private partnerships for project funding.
3. Grid IntegrationInvest in advanced grid technologies and smart grids for RES integration. Upgrade transmission and distribution networks to handle intermittent energy sources. Implement demand response programs to balance supply and demand.
4. NIMBYism (Not In My Backyard)Engage local communities through public consultations and education. Offer community ownership options in RES projects to share benefits. Mitigate environmental and visual impacts through innovative designs.
5. Technological InnovationAllocate funding for research and development of next-gen RES technologies. Establish innovation hubs and clusters to accelerate technology advancement. Support technology transfer and collaboration with industry partners.
6. Market BarriersPhase out fossil fuel subsidies gradually to reduce market distortions. Implement carbon pricing mechanisms, such as carbon taxes and cap-and-trade systems. Promote energy efficiency measures to reduce overall energy demand.
7. Interconnection IssuesEnhance cross-border energy infrastructure through EU projects and investments. Develop a common European electricity market to facilitate RES energy trading. Create a cooperative framework for balancing RES production and consumption.
8. Public ResistanceConduct public awareness campaigns highlighting the environmental and economic benefits of RESs. Involve citizens in decision-making processes through participatory forums. Provide transparency regarding project planning and environmental assessments.
9. Land Use ConflictsImplement zoning regulations that favor RES development in appropriate areas. Encourage the repurposing of degraded lands for RES projects. Promote mixed land use to reduce conflicts with agriculture and biodiversity conservation.
10. Energy Storage ChallengesInvest in energy storage research and development. Establish incentive programs for grid-scale and distributed energy storage solutions. Develop a strategic plan for integrating energy storage into the grid.
11. Permitting and Licensing DelaysStreamline and expedite permitting and licensing processes for RES projects. Create dedicated agencies or task forces to oversee approvals. Set clear timelines and benchmarks for permit reviews.
Source: authors’ own work based on [47,48,49,50,51,52,53,54,55,56,57,58,59,60].
Table 3. Barriers to the development of renewable energy and changes in the share of RESs in electricity consumption in the EU member states.
CountrySpread of Administrative BarriersSpread of Grid BarriersSpread of Political BarriersAdministrative Barrier IndexGrid Barrier IndexPolitical Barrier IndexChange in Share of RESs in EE Consumption in 2004–2021 (p.p.)Change in Share of RESs in Gross Final Energy Consumption in 2004–2021 (p.p.)
Austria3.353.293.400.870.950.7414.5613.89
Belgium3.333.443.200.840.940.8424.3011.10
Bulgaria2.803.602.860.840.950.9510.437.78
Croatia3.003.50n.d.0.870.87n.d.18.447.93
Cyprus3.75n.d.3.750.87n.d.0.8714.8215.35
Czech Rep.3.332.503.400.950.760.8710.8510.89
Denmark3.133.172.500.870.760.7638.8919.88
Estonia3.292.252.670.980.760.7628.7919.59
Finland2.753.003.400.850.760.8312.8213.86
France3.093.295.000.850.760.8411.2310.02
Germany2.712.802.440.840.740.8634.2512.96
Greece3.173.503.000.870.980.7628.0914.77
Hungary3.804.254.801.001.000.9911.449.75
Ireland3.633.644.201.000.860.7530.3710.17
Italy3.503.503.750.870.870.9519.9112.72
Latvia4.004.003.670.950.760.875.449.31
Lithuania3.223.003.250.960.750.9617.6911.01
Luxembourg3.003.003.000.750.860.6511.4510.84
Malta3.833.33n.d.0.970.86n.d.9.6612.05
The Netherlands2.902.503.430.740.740.8625.9510.97
Poland2.892.833.271.000.650.8715.128.74
Portugal3.322.505.000.970.650.8531.0414.78
Romania4.002.673.600.880.770.9914.066.79
Slovakia2.753.004.000.880.770.666.9711.02
Slovenia2.753.004.000.880.770.665.716.60
Spain3.903.503.600.860.840.7426.9412.38
Sweden3.453.335.000.860.750.8424.5124.15
Average3.283.173.610.890.810.8318.6612.20
Scale of the spread of barriers is valued 1.0–5.0; index of barriers is valued 0.0–1.0 ([22] (pp. 68–69)). Abbreviations: p.p.—percentage points; EE—electricity; RES—renewable energy sources; n.d.—no data available. Source: [22]; calculations based on [14].
Table 4. Correlation between RES development barriers and the change in the share of RESs in energy consumption in the EU.
IndicatorSpread of Administrative BarriersSpread of Grid BarriersSpread of Political BarriersAdministrative Barrier IndexGrid Barrier IndexPolitical Barrier Index
Share of RESs in EE consumption in 2021 (in %)−0.19−0.11−0.12−0.590.02−0.31
Change in share of RESs in EE consumption in 2004–2021 (in p.p.)−0.04−0.21−0.24−0.05−0.12−0.07
Table 5. Changes in the market economic environment and in renewable electricity production capacities in EU member states in 2004–2021.
CountryChange in GDP per Capita (in %)Change in HDI (in %)Change in RES Production Capacity (p.p.)Overcapacity in the Renewable Electricity Market in 2021 (%) (Standard Deviation in 2004–2021)
Austria11.303.3910.9214.69 (3.32)
Belgium13.814.1159.6046.30 (11.87)
Bulgaria79.595.1625.0730.10 (4.27)
Croatia36.607.79−26.2620.27 (11.14)
Cyprus14.267.9526.5511.73 (3.68)
Czech Rep.40.346.3414.7115.36 (1.67)
Denmark16.594.6445.4215.04 (2.32)
Estonia62.697.7547.9719.45 (5.61)
Finland11.514.2127.0221.43 (4.08)
France8.125.2423.0421.89 (3.88)
Germany20.903.0636.5019.42 (2.77)
Greece−14.515.2232.3126.10 (1.64)
Hungary44.015.6237.0226.56 (7.20)
Ireland88.827.2632.9512.17 (1.75)
Italy−4.493.4731.4026.38 (3.24)
Latvia76.848.01−11.1411.43 (9.85)
Lithuania103.858.1641.4335.61 (7.60)
Luxembourg7.415.4434.9595.72 (11.64)
Malta64.8011.2735.6525.99 (8.71)
The Netherlands18.014.9178.2056.81 (14.87)
Poland89.938.2834.4325.21 (5.17)
Portugal9.457.5830.7922.35 (3.76)
Romania93.3610.6532.5427.03 (5.83)
Slovakia73.186.8019.0230.16 (3.91)
Slovenia33.526.1318.6819.47 (5.07)
Spain1.877.2319.7617.10 (2.89)
Sweden22.115.2221.383.05 (2.99)
Abbreviations: p.p. means percentage points. Source: own calculations based on [14,71,72,73].
Table 6. The correlation between market economic environment factors and the share of RESs in energy consumption in EU member states in 2004–2021.
CountryGDP per CapitaHDIOvercapacity in the Renewable Market
Austria0.76500.9196−0.7450
Belgium0.84010.95520.9875
Bulgaria0.88900.89300.6618
Croatia0.67310.9343−0.4086
Cyprus0.10080.90010.9514
Czech Rep.0.80100.94720.4232
Denmark0.76100.97050.0114
Estonia0.82200.91130.7400
Finland0.45630.94640.8602
France0.64950.91490.9538
Germany0.92750.95990.0901
Greece−0.78530.90910.1680
Hungary0.84990.83660.9213
Ireland0.85100.9805−0.1048
Italy−0.77520.83180.4675
Latvia0.70630.8420−0.9409
Lithuania0.95440.95640.9321
Luxembourg0.11220.73000.8388
Malta0.95100.94420.9854
The Netherlands0.76940.75820.9742
Poland0.95350.97300.8056
Portugal0.34030.9758−0.6290
Romania0.84780.74130.8069
Slovakia0.89990.89860.8640
Slovenia0.46630.75550.6744
Spain−0.18000.9230−0.8069
Sweden0.88370.9224−0.7807
In red, relationships that are statistically insignificant have been marked (α = 0.05). Source: own calculations based on [71,72,73].
Table 7. The results of multiple regression analysis for market economic environment factors in EU member states in 2004–2021 (dependent variable: share of RESs in energy consumption).
CountryRGDP per CapitaHDIOvercapacity in the Renewable Market
Austria0.9150-b = 0.9150; p = 0.0000-
Belgium0.9875--b = 0.9875; p = 0.0000
Bulgaria0.9655b = 0.6386; p = 0.0003b = 0.7780; p = 0.0001b = −0.4992; p = 0.0024
Croatia0.9549-b = 1.0843; p = 0.0000b = 0.2477; p = 0.0213
Cyprus0.9514--b = 0.9514; p = 0.0000
Czech Rep.0.9472-b = 0.9472; p = 0.0000-
Denmark0.9705-b = 0.9705; p = 0.0000-
Estonia0.9113-b = 0.9113; p = 0.0000-
Finland0.9697-b = 0.6955; p = 0.0000b = 0.3279; p = 0.0044
France0.9538--b = 0.9538; p = 0.0000
Germany0.9795-b = 1.0188; p = 0.0000b = −0.2041; p = 0.0019
Greece0.9091-b = 0.9091; p = 0.0000-
Hungary0.9776b = −0.6084; p = 0.0044b = 0.5613; p = 0.0000b = 1.0890; p = 0.0000
Ireland0.9805-b = 0.9805; p = 0.0000-
Italy0.9300b = −0.4799; p = 0.0005b = 0.5926; p = 0.0001-
Latvia0.9409--b = −0.9409; p = 0.0000
Lithuania0.9564-b = 0.9564; p = 0.0000-
Luxembourg0.8388--b = 0.8388; p = 0.0000
Malta0.9854--b = 0.9854; p = 0.0000
The Netherlands0.9800-b = 0.1496; p = 0.0548b = 0.8695; p = 0.0000
Poland0.9864-b = 0.8097; p = 0.0000b = 0.2298; p = 0.0017
Portugal0.9946b = −0.2253; p = 0.0000b = 1.0924; p = 0.0000-
Romania0.8478b = 0.8478; p = 0.0000--
Slovakia0.8999b = 0.8999; p = 0.0000--
Slovenia0.7555-b = 0.7555; p = 0.0002-
Spain0.9864b = −0.3532; p = 0.0000b = 0.9852; p = 0.0000-
Sweden0.9615b = 0.6553; p = 0.0000-b = −0.4424; p = 0.0001
Abbreviations: b—coefficient, pp-value. Source: own calculations based on [71,72,73].
Table 8. Summary of the results of the analysis of the impact of factors/barriers on the development of RESs in EU member states.
CountryAdministrative BarriersGrid BarriersPolitical BarriersGDP per CapitaHDIOvercapacity in the Renewable Market
Austria++++++++++++ +++++
Belgium+++++++++++++ +++++
Bulgaria++++++++++++++++++++++
Croatia++++++++n.d. ++++++
Cyprus++++n.d.++++ +++++
Czech Rep.++++++++++++ +++++
Denmark++++++++++ +++++
Estonia+++++++++++ +++++
Finland+++++++++++ +++++
France+++++++++++ +++++
Germany+++++++++++ ++++++
Greece++++++++++++ +++++
Hungary+++++++++++++++++++++++++
Ireland++++++++++++ +++++
Italy++++++++++++++++++
Latvia++++++++++++ +++++
Lithuania+++++++++++++ +++++
Luxembourg++++++++++ ++++
Malta+++++++++n.d. +++++
The Netherlands++++++++++ +++++
Poland++++++++++++ +++++
Portugal++++++++++++++++++
Romania++++++++++++++++
Slovakia++++++++++++++
Slovenia++++++++++ +++
Spain++++++++++++++++++
Sweden++++++++++++++ ++
Red color means negative relationship, where + means very weak impact (values below 0.3), ++ means weak impact (0.3–0.59), +++ means medium impact (values 0.6–0.79), ++++ means quite a large impact (values 0.8–0.9), and +++++ means strong impact (values over 0.9).
Disclaimer/Publisher’s Note: The statements, opinions and data contained in all publications are solely those of the individual author(s) and contributor(s) and not of MDPI and/or the editor(s). MDPI and/or the editor(s) disclaim responsibility for any injury to people or property resulting from any ideas, methods, instructions or products referred to in the content.

