Article

Optimal Design and Analysis of a Hybrid Hydrogen Energy Storage System for an Island-Based Renewable Energy Community

College of Engineering, Design and Physical Sciences, Brunel University London, London UB8 3PH, UK
*
Author to whom correspondence should be addressed.
Energies 2023, 16(21), 7363; https://doi.org/10.3390/en16217363
Submission received: 2 August 2023 / Revised: 26 October 2023 / Accepted: 27 October 2023 / Published: 31 October 2023
(This article belongs to the Topic Advances in Renewable Energy and Energy Storage)

Abstract

:
Installations of decentralised renewable energy systems (RES) are becoming increasing popular as governments introduce ambitious energy policies to curb emissions and slow surging energy costs. This work presents a novel model for optimal sizing for a decentralised renewable generation and hybrid storage system to create a renewable energy community (REC), developed in Python. The model implements photovoltaic (PV) solar and wind turbines combined with a hybrid battery and regenerative hydrogen fuel cell (RHFC). The electrical service demand was derived using real usage data from a rural island case study location. Cost remuneration was managed with an REC virtual trading layer, ensuring fair distribution among actors in accordance with the European RED(III) policy. A multi-objective genetic algorithm (GA) stochastically determines the system capacities such that the inherent trade-off relationship between project cost and decarbonisation can be observed. The optimal design resulted in a levelized cost of electricity (LCOE) of 0.15 EUR/kWh, reducing costs by over 50% compared with typical EU grid power, with a project internal rate of return (IRR) of 10.8%, simple return of 9.6%/year, and return on investment (ROI) of 9 years. The emissions output from grid-only use was reduced by 72% to 69 gCO2e/kWh. Further research of lifetime economics and additional revenue streams in combination with this work could provide a useful tool for users to quickly design and prototype future decentralised REC systems.

1. Introduction

The current state of the energy generation landscape is undergoing a significant change as concerns are raised over climate change, energy cost, and energy security. The aim as stipulated in the Paris Agreement [1] of keeping the average surface temperature increase below 2 °C by 2050 is unlikely given global trends [2], and will be impossible without an ambitious sustainable energy development and technological innovation [3]. Recent events on the global stage have also caused nations in Europe and around the world to reconsider their energy security strategies [4,5]. The adoption of renewable energy at scale should include measures to increase the effectiveness whilst providing cost reductions [6].
The introduction of renewable energy systems (RES), including photovoltaic (PV) solar panels and wind turbines, have been the key driving force in removing global dependence on fossil fuels from the energy sector [7]. These types of generation assets are known as non-dispatchable as they are completely dependent on weather conditions [8] and so cannot be precisely controlled. This is a problem for transmission service operators (TSOs) as ensuring the voltage and frequency are balanced at a grid level becomes challenging [9]. The increasing volume of decentralised RES installed at the demand side is also problem for grid operators [10], as they can induce bidirectional grid flows and put additional strain on the network.
One solution to this problem is the use of energy storage systems (ESS) to store excess energy and increase the share of the total RES production directly through self-consumption [11,12]. Electro-chemical storage such as batteries have been deployed in many cases for use as grid-level storage [13,14,15], as they have the advantage of fast response to demand and can be installed in most global climates. A number of battery technologies including high-performance solid state chemistries are a promising solution due to their long-term stability and high capacity retention [16,17]. Most grid storage applications deploy LiFePO4 variants as they are widely available and have a relatively low cost [18]. Crucially for the research methods used in this work, the retrieval of reliable cost and environmental data is vital for an accurate result, which for LiFePO4 is widely available within the literature. Hydrogen has often been considered for long-term seasonal storage [19], due in part to the mentioned capacity retention challenges of battery storage. Hydrogen is also a flexible energy vector for many other uses, such as heating and industrial processes [20]. A hybrid battery and hydrogen ESS has a great potential to increase the share of renewables within the energy mix [21], thus decreasing the reliance on traditional power stations. The advent of widely available ESS has meant that it is now possible to emphasise the self-consumption of energy at a local level to reduce the problems of grid stress and planning. A ‘prosumer’ (an end user that is able to both consume and produce energy [22]) or group of prosumers could install decentralised RES coupled with storage technology, and self-consume the power generated at a local level.
To address these challenges, this work presents and evaluates the application of decentralised renewable energy communities (RECs). RECs in practice have many advantages and solve the most common issues associated with increased decentralised generation, while also promoting the further self-consumption of electricity. In a REC configuration, consumers and prosumers are no longer restricted to buying and selling energy from their utility company and can virtually ’share’ the excess energy between actors within the energy community itself. This is mutually beneficial for both the network operator, as they no longer need to manage unpredictable grid flows, and for the REC participants as they receive direct renumeration and a reduction in carbon emissions.
The REC considered in this work was based on the policy recommendations recently implemented by a number of EU countries outlined in the Renewable Energy Directive (RED-II) (EU) 2018/2001 [23]. The directive defines a REC as “a legal entity that is based on open and voluntary participation, it is autonomous and controlled by shareholders or members located in the proximity of renewable energy plants belonging to the community itself. The members may be physical persons, companies or local authorities…”. While the directive has been transposed into several other national laws and decrees, including Austria [24], France [25], Germany [26], and the Netherlands [27], the REC modelled in this work most closely resembles the framework practiced in Italy as discussed by Trevisan et al. [28]. Although the study was in Spanish territory, it was chosen to follow the Italian implementation as there are more example cases available and, as of 2021, further improvements to the 2019 Spanish REC policy are currently in progress [29].
As laid out in decree-law 199/2021 [30], a group of self-consuming members within the REC must be located within the same low-voltage (LV) network downstream of the same LV/MV substation. Energy is shared in the existing physical network using a virtual network model. The difference between the energy consumed and energy produced by the REC is resolved over each one-hour period to determine the capacity available to be shared [31]. The model created in this work uses the principles of the relevant regulation to design the virtual REC.
A number of studies including operational renewable energy communities have investigated the use of ESS within a REC to further improve the economic performance of centralised renewables. Trevisan et al. presented an optimised energy model considering PV solar and ESS to provide renewable power to a port REC, showing a decrease in energy bills of 28% compared with the business-as-usual case [32]. Bartolini et al. investigated how to size a mixed RES to fully self-consume all generation at a community level, as well as meeting the heat energy needs, and showed that using hydrogen generation and storage is an economically viable alternative to battery systems [33]. Although less explored in the literature, there have also been studies focused on the environmental and emissions reductions possible with such a community-based system. Wang et al. proposed a community-based virtual power plant solution in Japan with PV and battery ESS with the ability to reduce carbon emissions by 16.26% [34].
Several different modelling and optimisation software tools have also emerged to assist in model-based design and assessment. An in-depth review by Cuesta et al. presented popular renewable energy modelling tools, including the ability to model different renewable assets and output different technical, economic, environmental, and social key performance indicators [35]. Software such as HOMER (version 3.16), TRNSYS (version 18), and MATLAB/Simulink (2022b) are most often used due to their ease of use and available documentation. However, they can be restrictive for some REC cases due to their proprietary nature. Creating the model in Python will provide the flexibility of an open-source platform and a scalable product suitable for deployment as a lightweight software or web applications.
A number of optimisation procedures have been addressed and utilised in the literature to determine the optimal design of hybrid RES and ESS. Most cases vary the design capacities to achieve one or more competing criteria such as economics, grid independence, and environmental impact. Niveditha and Rajan Singaravel consider a multi-objective design criteria for achieving near zero energy buildings (NZEB), using the functions of cost, loss of load probability (LLP), and total energy transfer (TET) to determine the best sizing arrangement for the PV-wind-battery storage system [36]. Zhang et al. presents a capacity configuration for both an on-grid and off-grid mixed renewable system with hydrogen and batteries [37]. The NSGA-II algorithm was used to determine the trade-off relationship between system cost, renewable curtailment, and loss of load probability (LLP), which can be considered analogous to grid independence for grid-connected configurations. Xu et al. considers the design of an off-grid PV-wind-hydrogen storage system using the multi-objective criteria of LCOE, LLP, and power abandonment rate (PAR). The pareto optimal solution produces an LCOE of 0.226 USD/kWh at acceptable LLP and PAR values [38]. Studying the emissions associated with the grid independence would more accurately determine the positive environmental impact, which was of particular focus in this work. Results from the literature also do not consider the implementation of such an optimization procedure for RECs, and the impact of trading arrangements between members. Other algorithms including multi-objective particle swarm optimisation (MOPSO) [39] and multi-objective evolutionary algorithm with decision-making (MOEA-DM) [40] have also been applied to ESS design; however, NSGA-II remains very popular and has proven robustness in energy flow optimisation problems [41].

2. Contribution

In this study, a techno-economic and carbon emissions assessment was conducted for a decentralised REC. The case study location was chosen as Formentera; a largely rural Balearic Island located in the Mediterranean Sea as illustrated in Figure 1. Emphasis is put on the isolated nature of the energy grid, which naturally increases the energy cost and embedded carbon of electricity usage, making it an ideal location for the study. A comparison of the base case scenario was used to compare the improvements made with the implementation of the REC.
The community has shared usage of PV solar and wind power to produce energy, and a hybrid battery and regenerative hydrogen fuel cell to store excess production. The combination of battery and hydrogen minimises the potential shortcomings of decentralised storage. A virtual trading scheme based on the EU decree-law 199/2021 for REC implementation was used to evaluate the energy shared between community members, without considering incentives or feed in tariffs. Through the implementation of key economic and environmental parameters, the multi-objective optimisation determines the best design topology within the defined REC boundary conditions.
The multi-objective results reveal an inherent trade-off relationship between low-cost energy and the ability to decarbonise supply, and that this approaches a critical limit at both extremes of the pareto front. This work shows that across the pareto optimal sets, the hybridisation of energy storage provides a better overall performance than a battery-only or hydrogen-only case. Additional constraints can be applied to the objective domain to assist in design decision-making.
The implementation of the model in Python allows for the creation of a scalable product, which following digitisation trends in model-based design could provide a vital tool for communities and policymakers to determine the best method for assisting communities to reach net-zero emissions. To summarise, the novelty of this work is summarised as follows:
  • The modelling of a hybridised battery and RHFC system for a remote renewable energy community application using real-world power consumption data from a rural island location;
  • the use of multi-objective optimisation to evaluate the system pareto front based on economic and environmental performance;
  • the inclusion of a virtual trading layer based on the latest RED(III) REC policies;
  • the formulation of a scalable and modular renewable energy community modelling and simulation platform.

3. Materials and Methods

For the purposes of simplification, the simulation model was discretised into one hour time steps using kWh as the function unit for all energy flows within the system. The case study input assumptions including building load and meteorological datasets are defined first. The meteorological data at the chosen coordinate location were obtained from the National Aeronautics and Space Administration (NASA) Langley Research Center (LaRC) Prediction of Worldwide Energy Resource Project funded through the NASA Earth Science/Applied Science Program [43]. A combination of hourly and monthly energy consumption collected from the case study location was used to recreate typical annual load profiles for each of the seven buildings within the virtual REC. A selection of 24 industrial, commercial, and residential load profiles produced by Farhad et al. (2020) were used to augment the profiles where required [44].

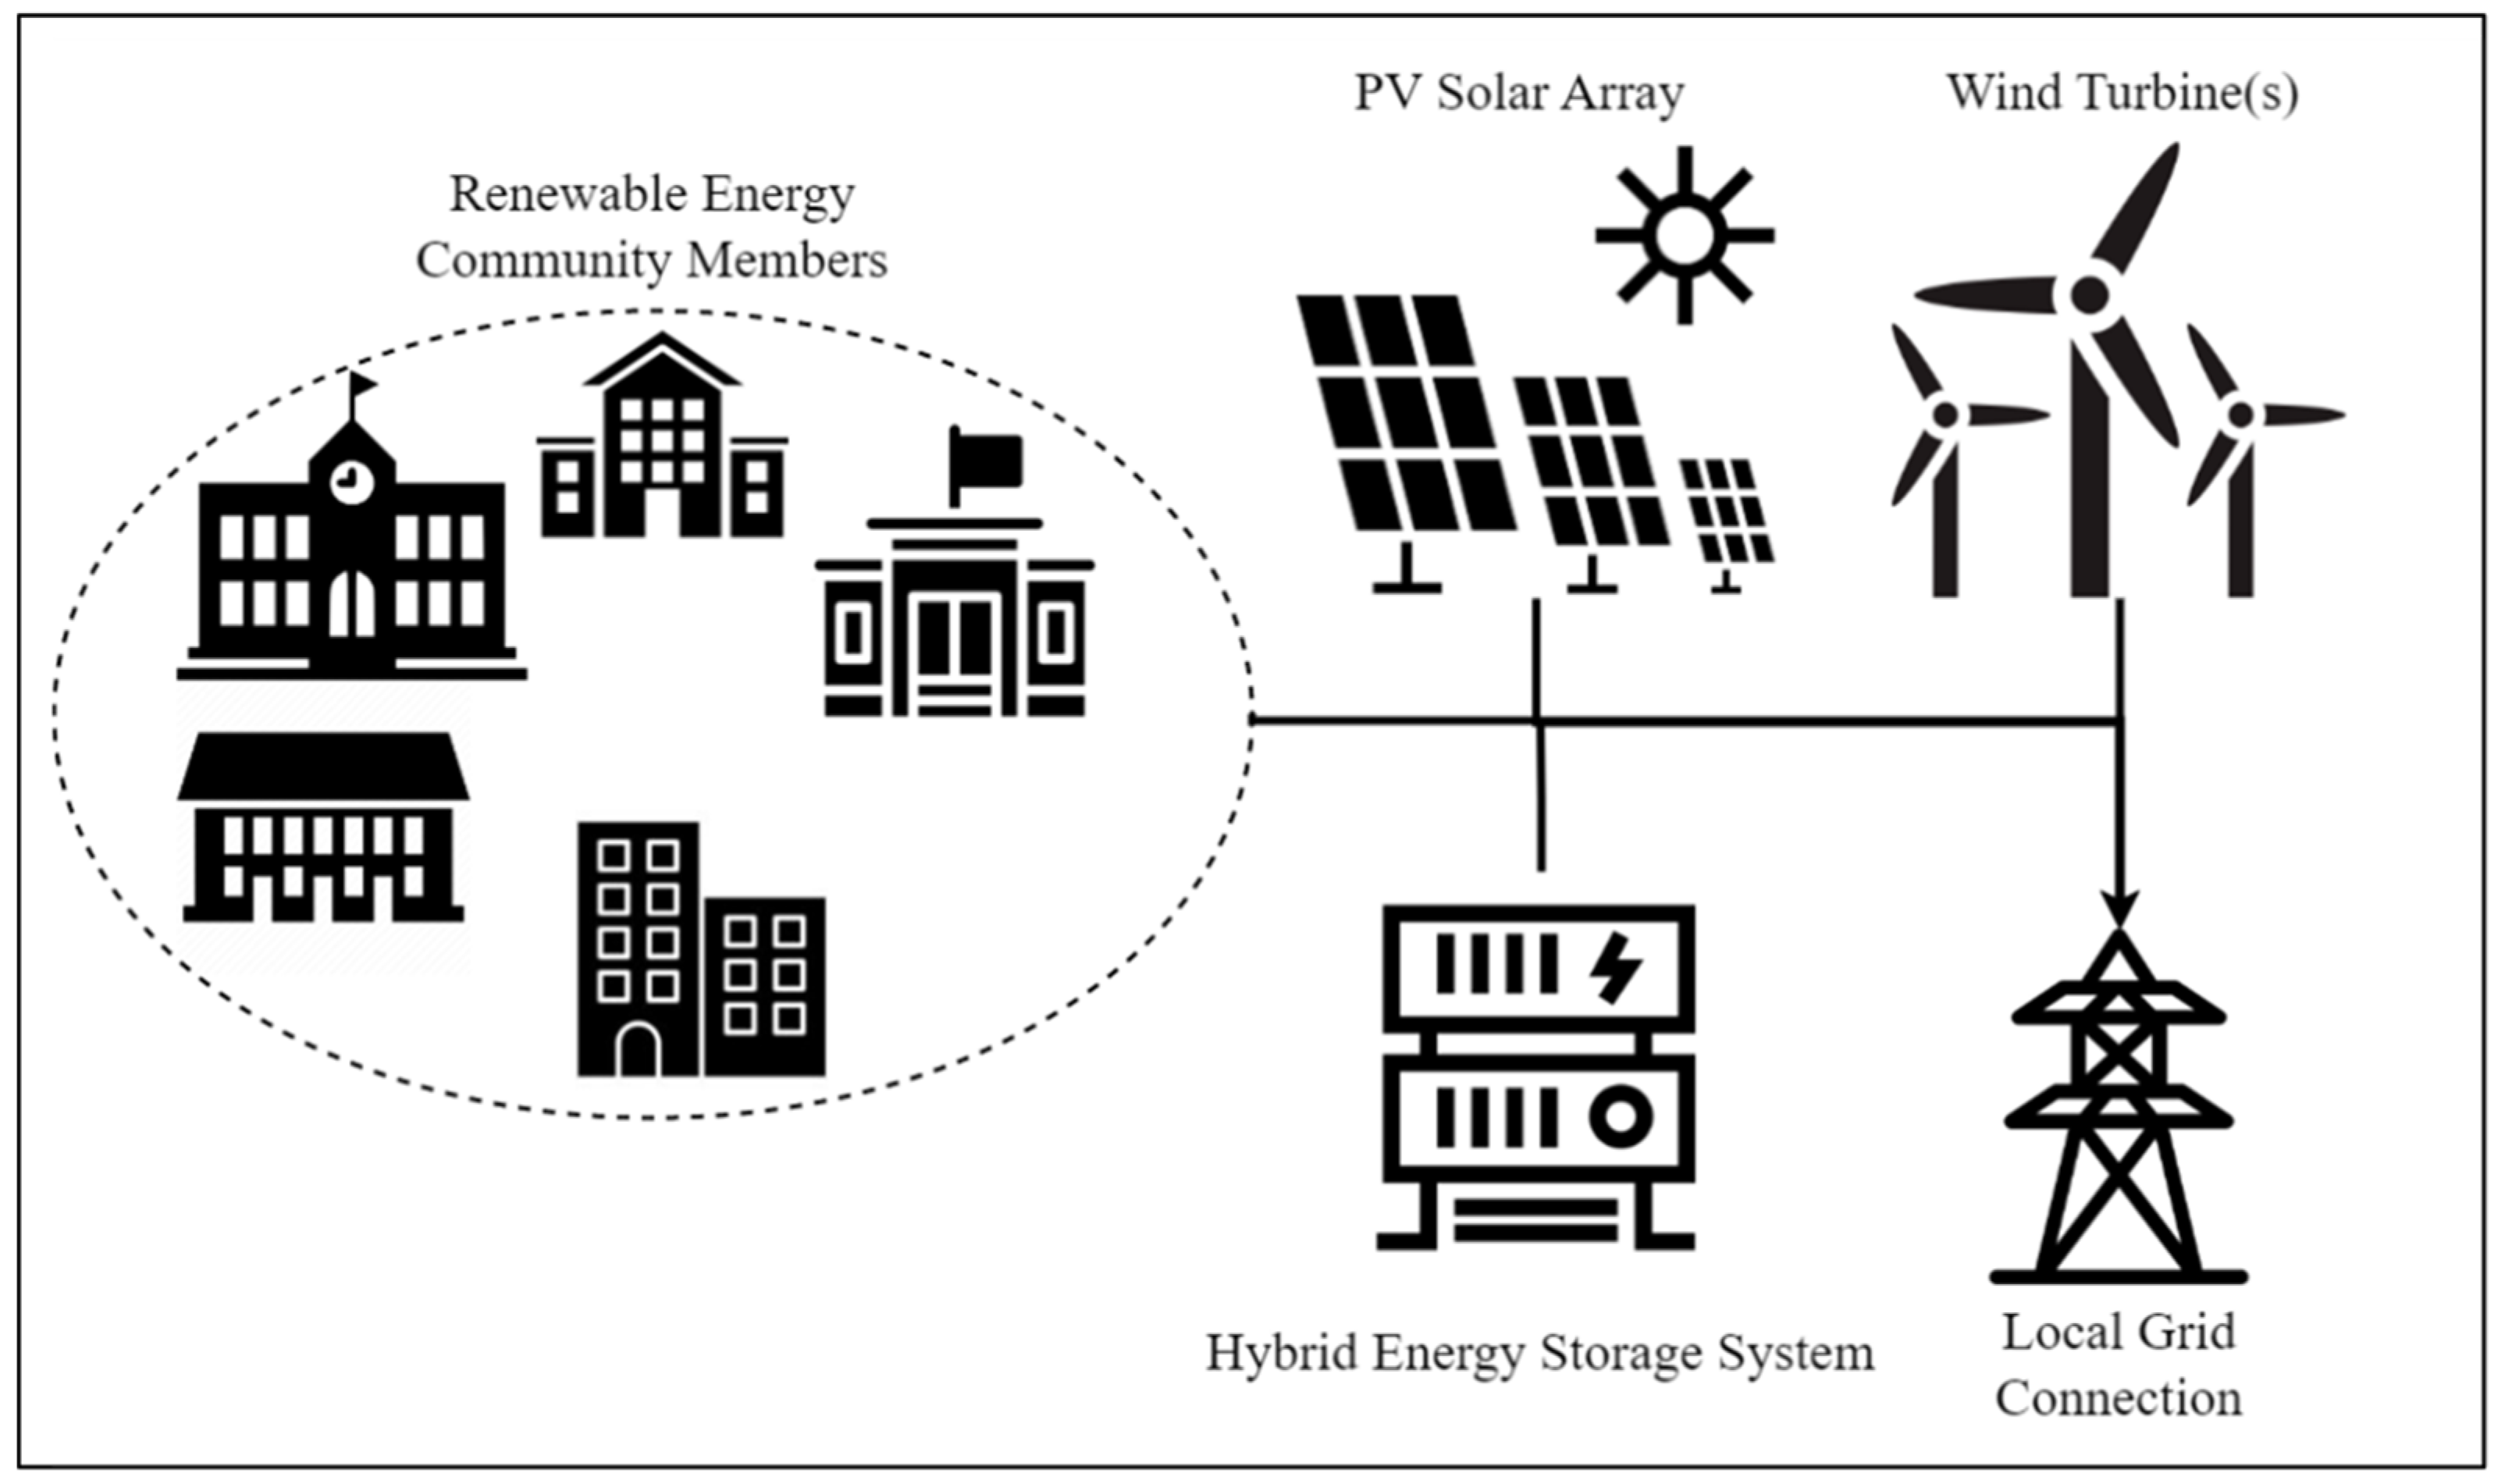
3.1. Renewable Energy Community Implementation

It was assumed that the community members will have a shared capital investment in the generation and storage assets. PV solar and wind assets can either be installed in the low-voltage energy grid within the same secondary substation of the REC, or spread out between the members, installing in open areas such as rooftops. The stationary ESS consisting of both a lithium-ion battery and a RHFC was installed with the REC boundary conditions in accordance with the EU decree-law 199/2021, with the capacity to accept but also release energy to the physical energy grid. A simple diagram of the system architecture is shown in Figure 2.
The control strategy consists of a load-following authority, but with additional considerations for the hybrid ESS. Since batteries have an improved performance as short-term storage, these are allowed to discharge first to cover the load of the REC. Once the battery depth-of-discharge (DOD) limit is reached, the hydrogen system is then activated to cover the remaining demand. During the charging phase, this control scheme occurs in reverse. By evaluating the excess energy available between the total REC consumption and production over each one-hour increment in line with decree-law 162/19 for community implementation in Italy, the total virtual energy flows between community members were derived. This case does not consider incentives to reduce financial strain and instead evaluates through a techno-economic assessment over a 20-year project period whether the hybrid system was able to provide net-positive economic and environmental performance over the business-as-usual case.
The electrical load profiles form the foundation of the assessment of economic and environmental improvements to the REC. The community consists of seven member buildings; a community centre, a small school, a large school, local government offices, and three typical residential units. For the community centre, two schools, and offices, sample daily load profiles, as well as the monthly average energy consumption, were collected directly from the test site. For the residential units, a combination of the annual heating, cooling, and appliances usage of 80.7 kWh/m2 was used to evaluation the typical characteristics of a residence in Spain [45], where the buildings were assumed to be 50 m2 in area. The monthly and yearly consumption was used to create a spline, over which the daily load profile was interpolated and repeated to create the one-year load profiles for each building. The total yearly consumption for each member is included in Table 1, with the monthly and daily load profiles shown in Figure 3. The three mixed homes have been combined to represent a mixed family building and to improve visibility within the analysis.

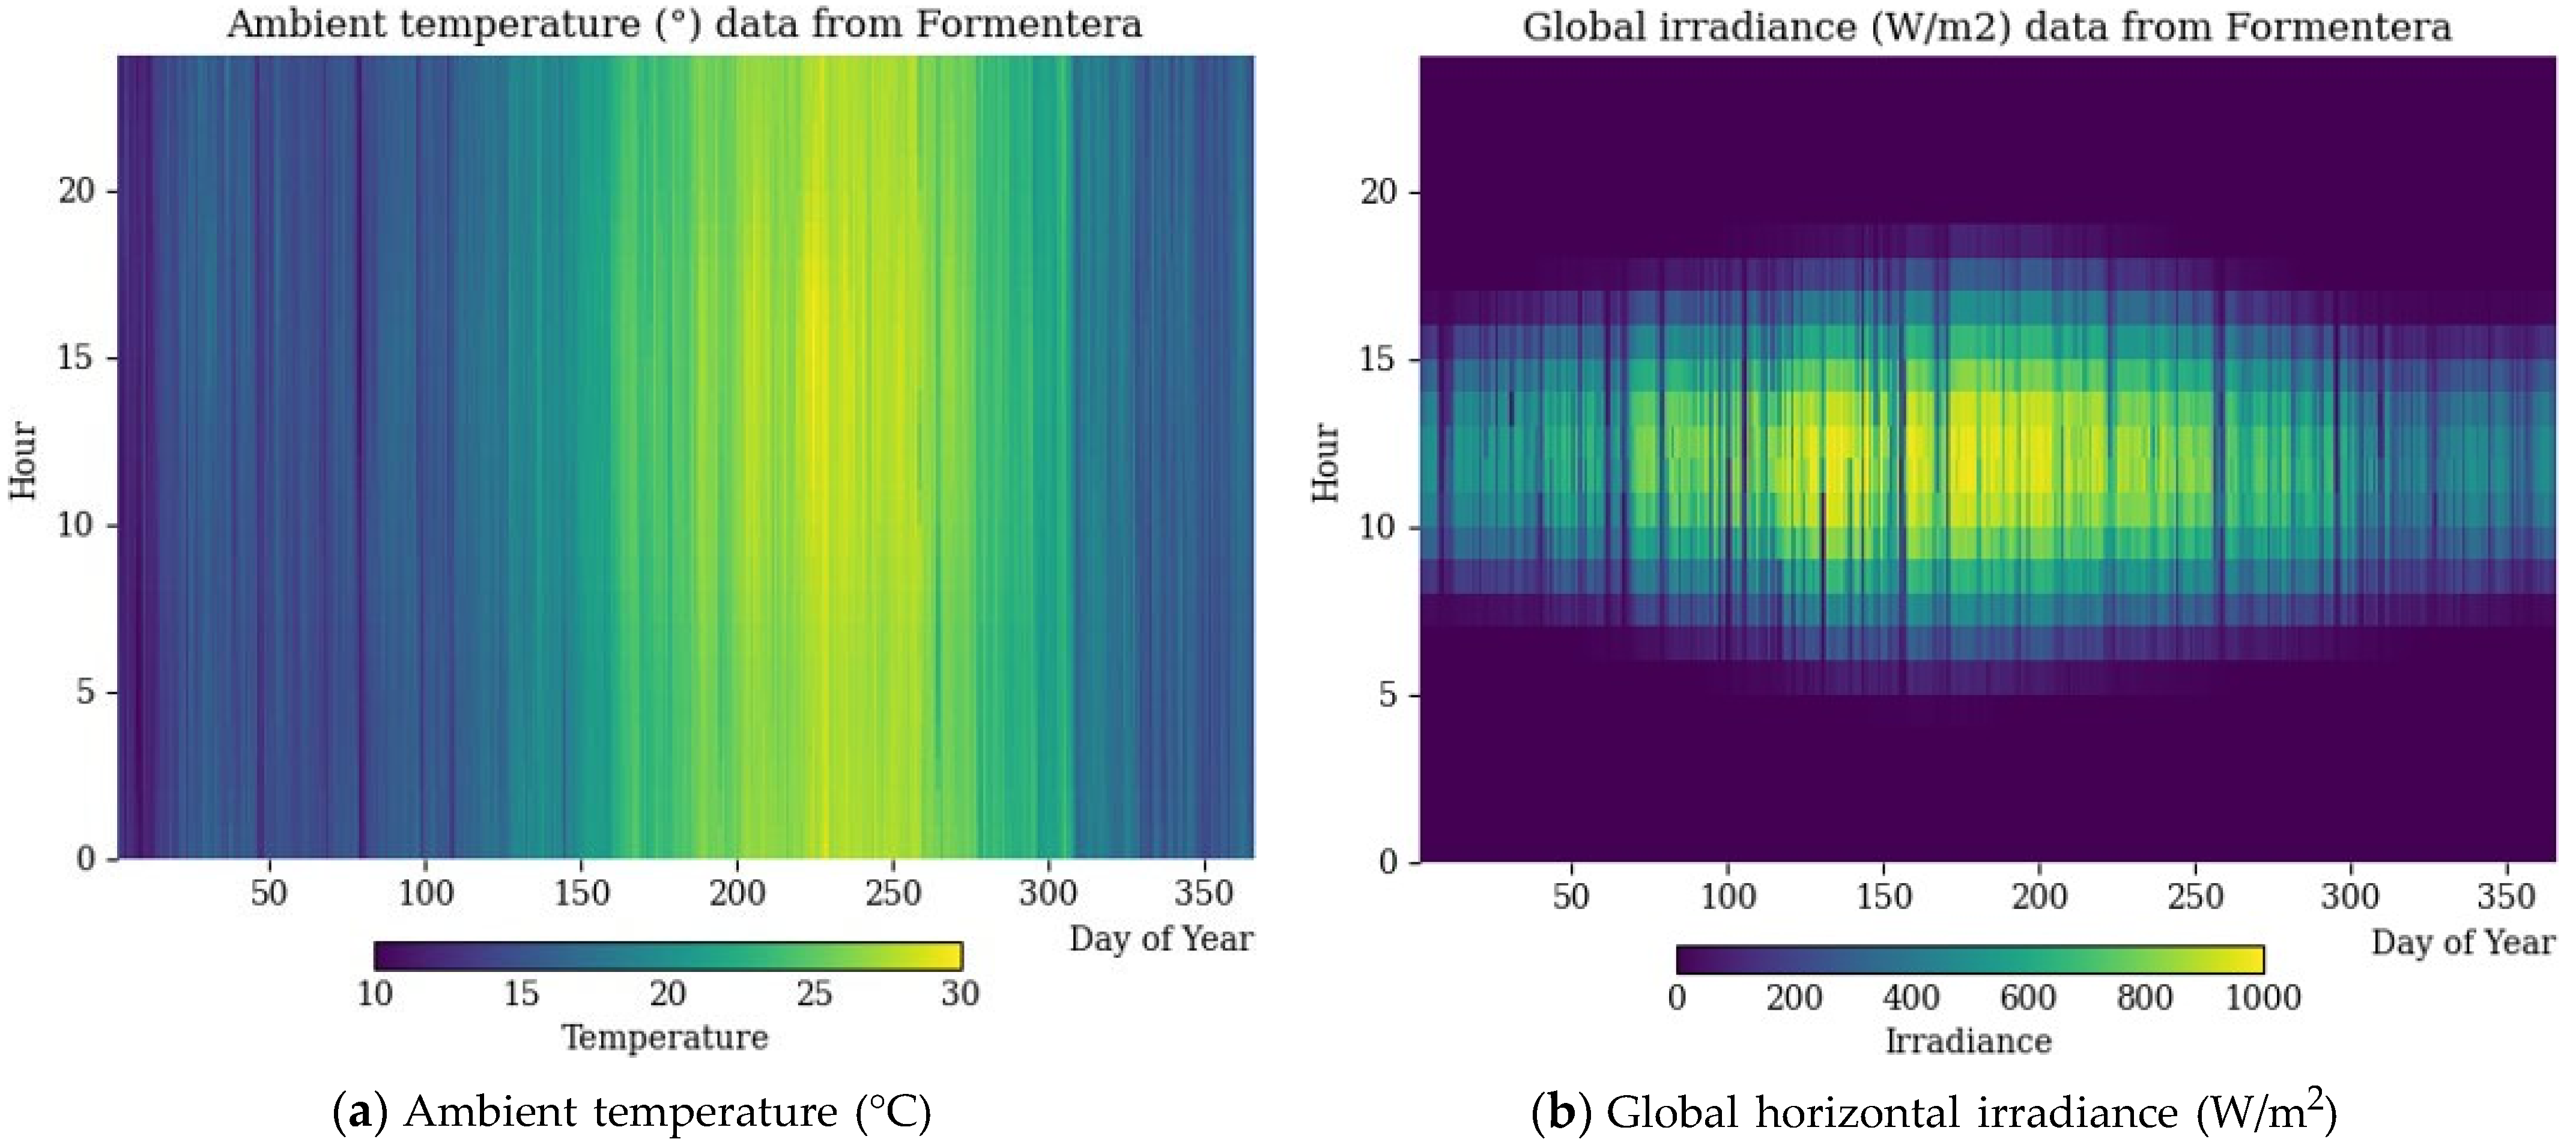
3.2. Weather and Environment Data

The weather data were collected for the year 2022 at the coordinate location of the chosen REC case study site. The model requires accurate measurements of ambient temperature, wind speed, and global horizontal irradiance (GHI) solar conditions to evaluate the hour-by-hour power output of the renewable generation technologies. Figure 4 shows the hourly mean temperature and GHI for each month over one year. A higher GHI is observed in the summer period as expected in the northern hemisphere.

3.3. System Design and Characteristics

3.3.1. PV Solar Array Model

The Mediterranean region’s warm and dry climate promotes the use of PV solar systems to generate clean energy. For the purposes of the study, the solar array was assumed to be installed at 180° directly to the south, and at an optimal tilt angle of 38.7°. The power output of the solar panels PPV was modelled using the following governing equation [46]:
P P V = C P V d f ( G ( t ) m o d u l e G S T C ) [ 1 + α P ( T c T c , S T C ) ]
where CPV is the generation capacity (kW) of the solar installation under standard conditions, df is the derate factor, G(t)module is the direct solar irradiance in W/m2, GSTC is the direct solar irradiance under standard test conditions (1000 W/m2), αP is the thermal power coefficient (%/°C), and Tc,STC is the PV cell temperature under standard test conditions (25 °C). Tc is the PV cell temperature and is calculated by considering the measured nominal operating cell temperature (NOCT). NOCT is the cell measured temperature at a solar irradiance GNOCT of 800 W/m2, an ambient temperature Ta,NOCT of 20 °C, and a wind speed of 1 m/s [44]. This known thermal characteristic can then be used to adjust the cell temperature and find the corrected power output using the following equation [47]:
T c = T ( t ) a + ( T c , N O C T T a , N O C T ) ( G ( t ) m o d u l e G N O C T ) ( 1 η m p τ α )
where T(t)a is the ambient temperature at timestep t and ηmp is the cell efficiency. The constants τα can be assumed to be 0.9 for most cases. Since ηmp is not known, the efficiency under standard conditions ηmp,STC is substituted into the cell temperature equation above and the result yields the following:
T c = T ( t ) a + ( T c , N O C T T a , N O C T ) ( G ( t ) m o d u l e / G N O C T ) [ 1 ( η m p , S T C ( 1 α P T c , S T C ) ) / τ α ] ) ( 1 + ( T c , N O C T T a , N O C T ) ( G ( t ) m o d u l e / G N O C T ) [ ( α P η m p , S T C ) / τ α ]
The GHI input data need to be adjusted based on the local latitude φ and module tilt β to find the module irradiance G(t, module) for the time of day and year. This is found with the following equations [48]:
G ( t ) m o d u l e = G ( t ) h o r i z o n t a l sin ( α + β ) sin α
α = 90 ° φ + δ
δ = 23.45 ° sin [ 360 / 365 ( 284 + d ) ]
where G(t)module is the module irradiance, G(t)horizontal is the GHI data, α is the elevation angle, and δ is the declination angle which deviates from the earth’s tilt of 23.45° depending on the day of the year d.

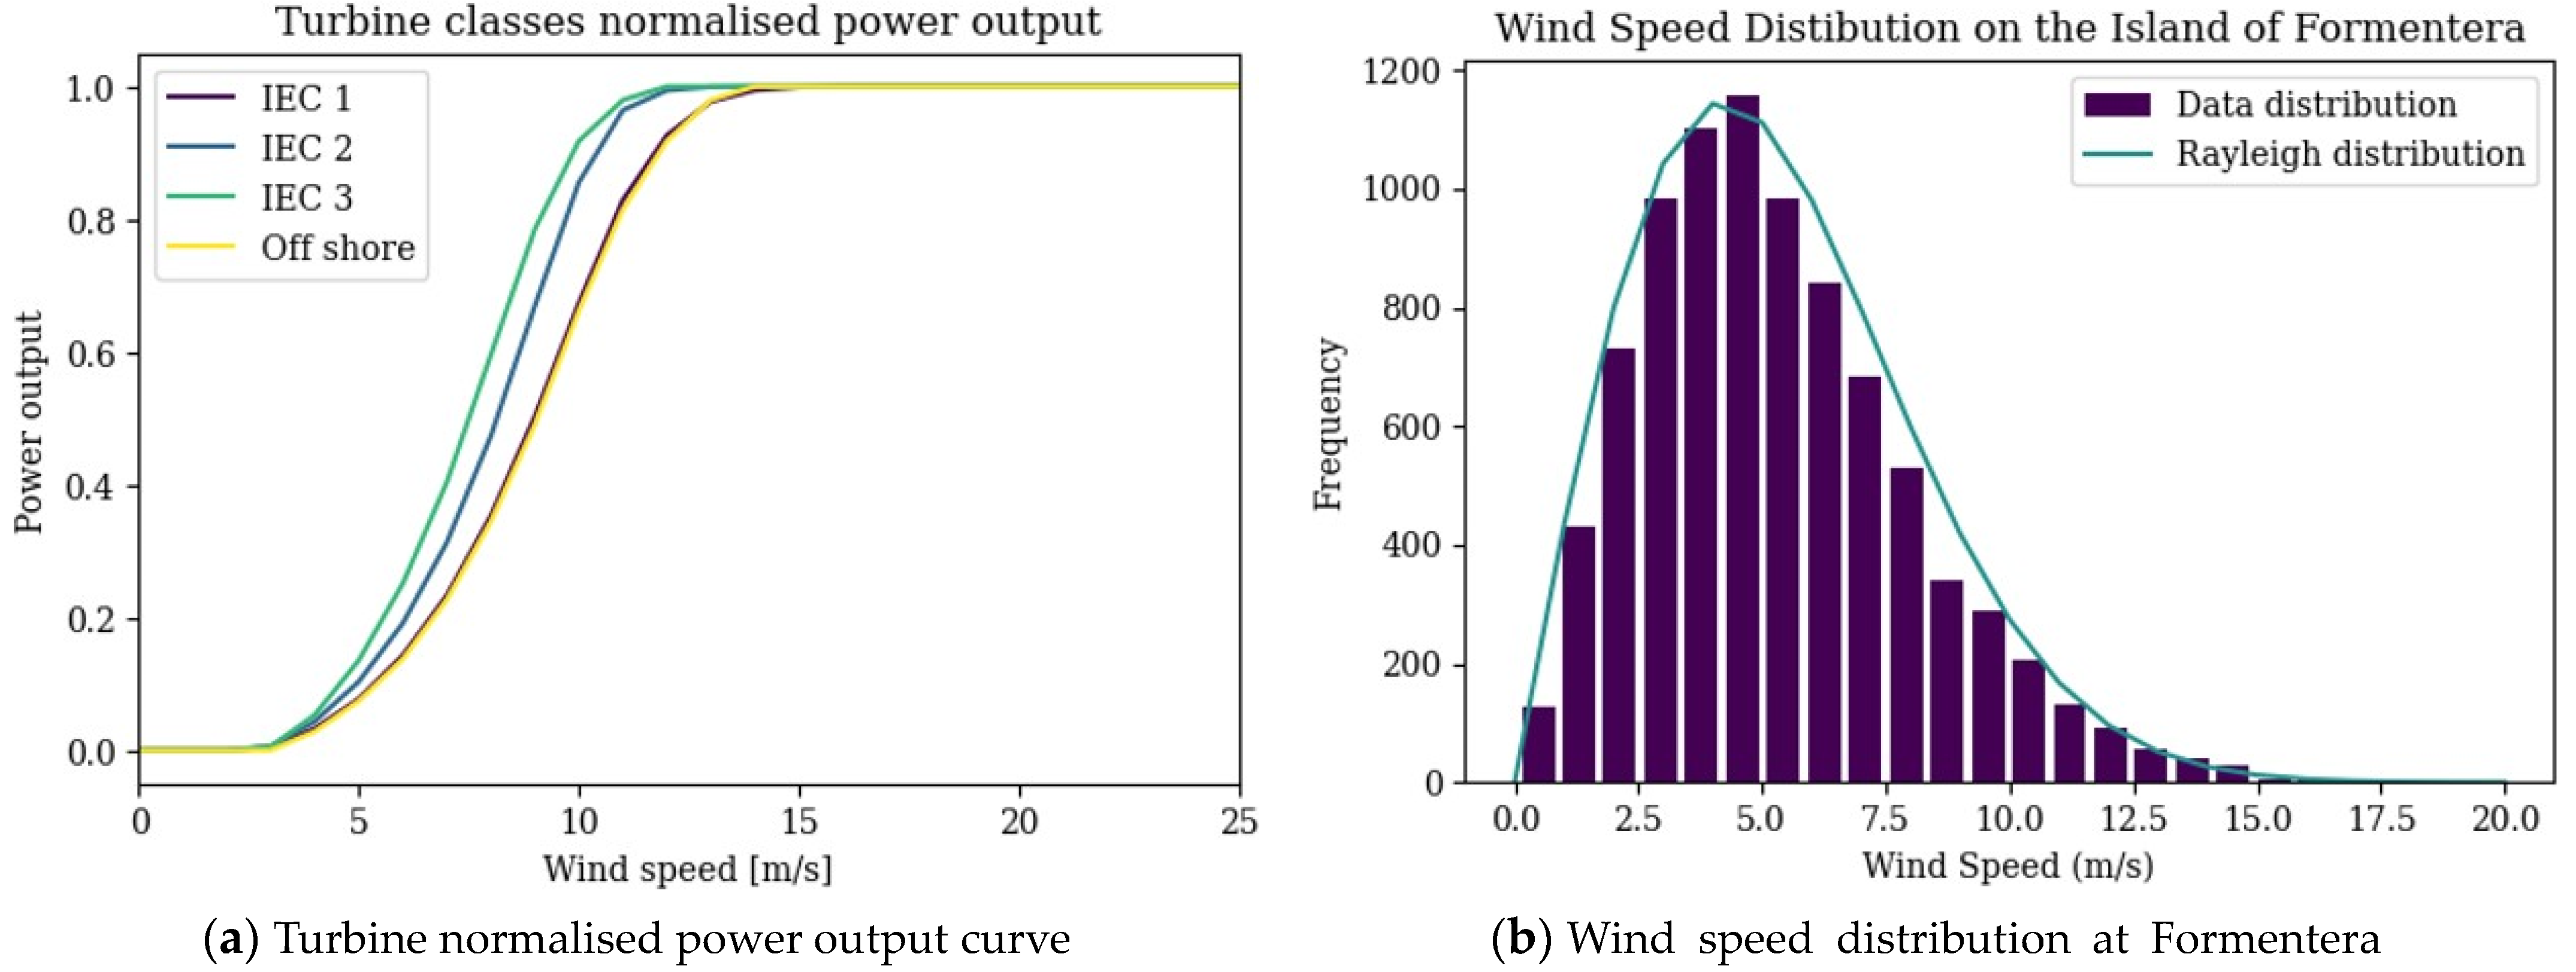
3.3.2. Wind Turbine Model

A generic dynamic wind turbine model was used to calculate the expected power output in the selected location using the following [49]:
P ( t ) = 1 2 C p ρ ( t ) A V 3 ( t ) ( η m η e )
where Cp is the power coefficient, ρ(t) is the air density at the hub height, A is the selected swept area in m2, V(t) is the wind speed in m/s at the time step t, and ηm and ηe are the mechanical and electrical efficiencies. The wind speed is usually measured at a different height compared to the hub height, Zhub. Therefore, the model uses the logarithmic law to derive the hourly wind speed at the hub height as follows [49]:
V h u b = V a n e m ( I n ( Z h u b / Z 0 ) I n ( Z a n e m / Z 0 ) )
where Z0 is the surface roughness length (m), Zanem is the anemometer height (m), Vhub is the wind speed at the required hub height (m/s), and the Vanem is the measured wind speed at the anemometer height (10 m for the dataset used). For simplicity, Cp is evaluated by way of a 2D-look up table based on the four classes of wind turbines described in IEC 61400 standard [50]. The average wind speed and distribution was evaluated and the most appropriate characteristic was chosen from the four available classes ranked from low to high wind speeds [51]. The normalised power range for each class of “Offshore”, “IEC-1”, “IEC-2”, and “IEC-3” are shown in Figure 5a. The energy output over the course of one year can also be determined analytically by assessing the wind speed distribution. The Rayleigh distribution, shown in Figure 5b, has been overlaid to show that the wind speed distribution data follow this statistical law, which indicates that the normalised power curves will operate effectively for the model.

3.3.3. Lithium Ion Battery Model

The battery model utilises a simplified version of the Shepard battery model [52], replacing internal and other resistive losses with a total charge ηcharge discharge ηdischarge efficiency for the hourly discharge case. The simplification allows for less information to be known about the chemistry and dynamics of the specific battery to perform calculations for the current capacity and state of charge (SOC). The battery system contains two parts: a charge model and a discharge model. The models take the power requirement from the battery and output the resulting SOC for the end of the timestep. These parts are defined as follows:
{ S O C ( t + 1 ) b a t t = Q ( t ) b a t t + P ( t ) b a t t η c h a r g e , d t ) Q ( t 0 ) b a t t 100 charging S O C ( t + 1 ) b a t t = Q ( t ) b a t t P ( t ) b a t t η d i s c h a r g e , d t ) Q ( t 0 ) b a t t 100 discharging
where SOCt+1,batt is the next timestep battery SOC, Qt,batt is the battery state of charge at timestep t, Qt0,batt is the initial SOC, Pt,charge is the average charge power draw, and Pt,discharge is the discharge power draw. These outputs are subject to the minimum and maximum SOC limits SOCmin and SOCmax. The model includes degradation in the battery capacity linearly as a function of charge cycles, as shown below:
Q ( l , t ) b a t t = Q ( t 0 ) b a t t α l
where Q(l, t)batt is the dynamic capacity in kWh as a function of cycles the cycles l, and α is the ageing factor (kWh/cycle).

3.3.4. Regenerative Hydrogen Fuel Cell

The RHFC model provides an alternative energy storage facility to the electrochemical battery. The model consists of a PEM fuel cell and PEM electrolyser capable of consuming and producing hydrogen, respectively. The system also considers a hydrogen storage module with its own rated capacity and efficiency. The overall equations are like that of the simplified battery model in that the electrolyser and fuel cell analogously represent the charge and discharge elements. The system can therefore be shown as the following:
{ Q ( t + 1 ) H 2 = Q ( t ) H 2 P ( t ) f c η f c , d t Fuel   cell Q ( t + 1 ) H 2 = Q ( t ) H 2 + P ( t ) e l η e l , d t Electrolyser
where Q(t + 1)H2 is the next timestep hydrogen energy stored (kWh), Q(t)H2 is the current timestep hydrogen energy stored (kWh) P(t)fc is the average fuel cell power production [kW] in the current one-hour timestep t, and P(t)el is the average electrolyser power consumption [kW]. ηfc and ηel are the average lifetime fuel cell and electrolyser efficiencies [%], respectively. Like the battery, these energy values are also subject to QH2,min and QH2,max limits.

3.3.5. Model Input Assumptions

Table 2 contains the necessary input assumptions for the energy models, including efficiencies and other system dynamics that determine the output power generated or stored. The PV panel characteristics are based on the Sunpower Maxeon panel series, while the wind turbine is an approximation of common small-scale turbine systems on the market. The roughness length assumption of 0.05 is defined as rural, farmland area with low crops and without many trees [53]. The hydrogen system efficiency values are based on industry knowledge gathered from leading European fuel cell and electrolyser manufacturers.

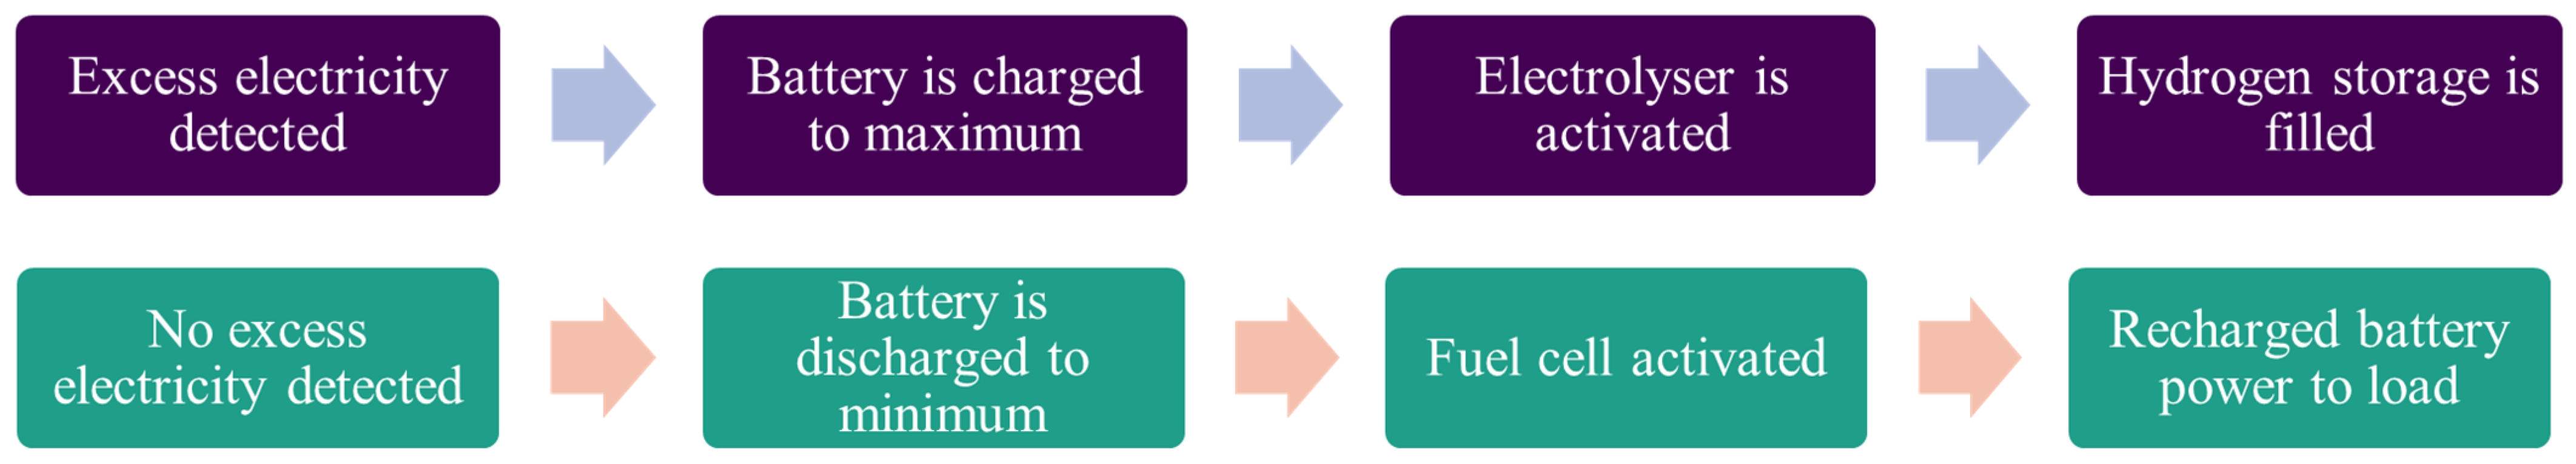
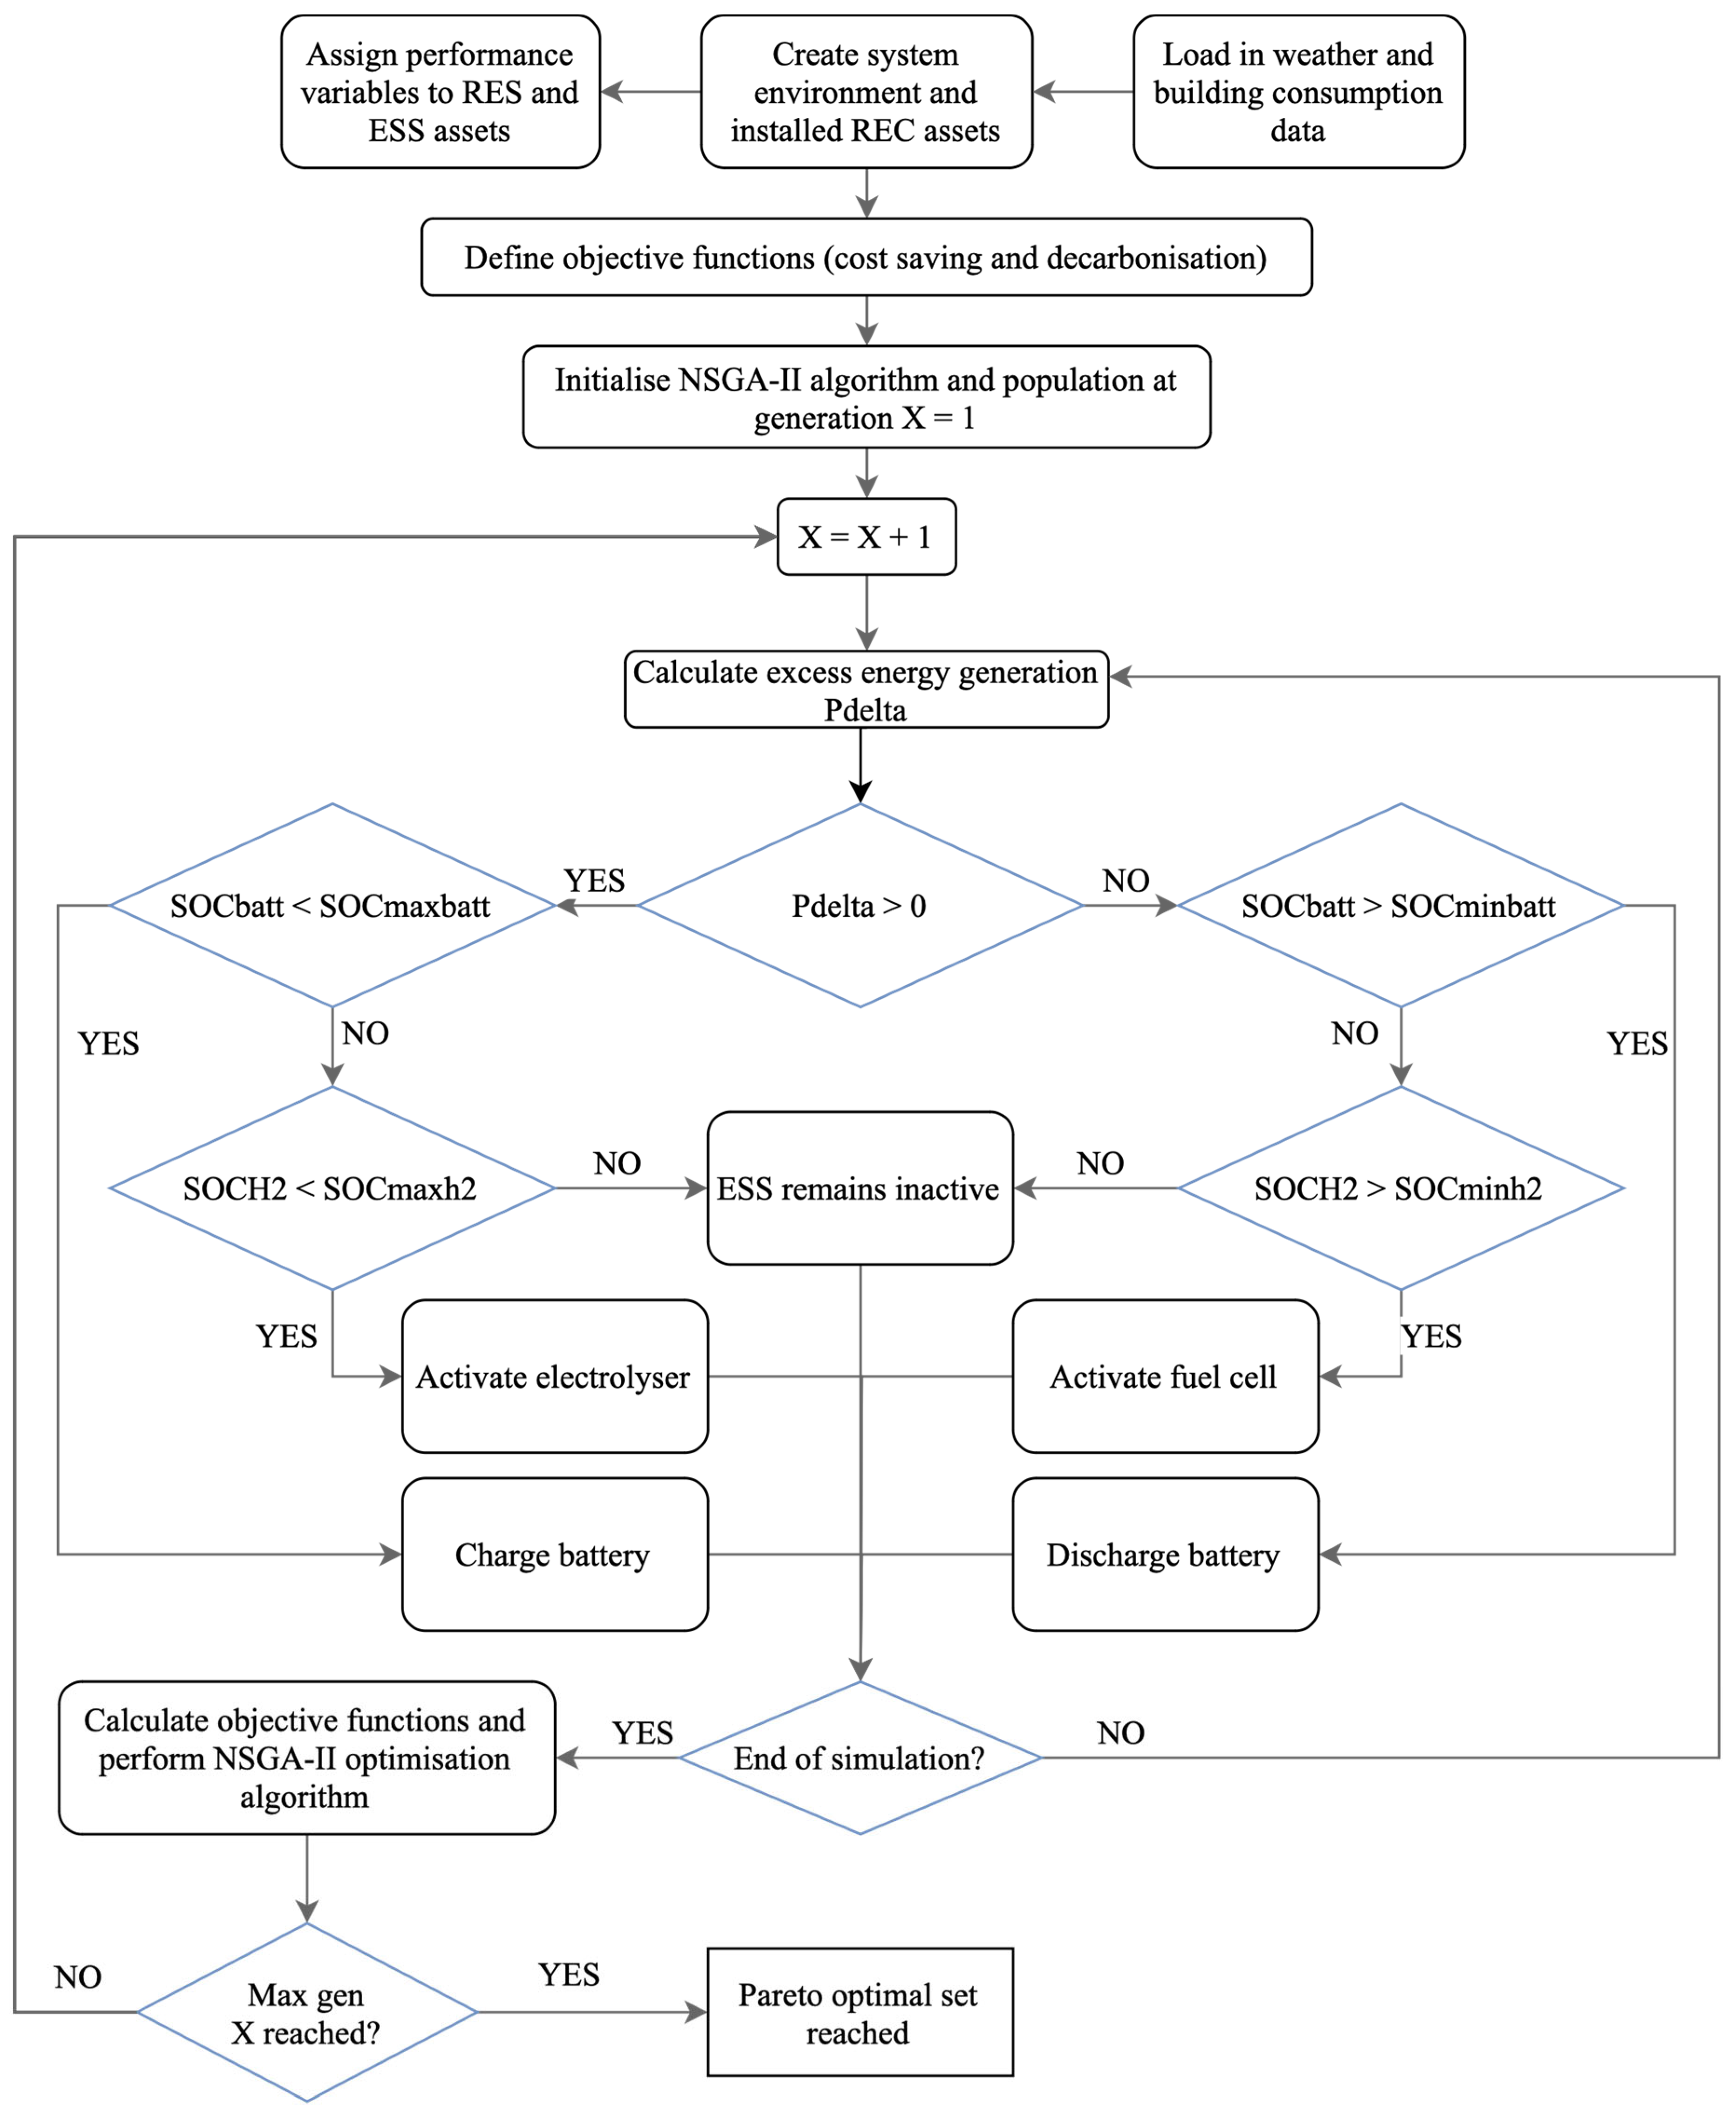
3.4. Energy Management Strategy

The energy management strategy for the hybrid storage system is shown in Figure 6. When generation supply is available in excess of demand, the battery charges first, followed by the larger capacity hydrogen storage via the electrolyser. When the demand outgrows the supply, the battery discharges first, followed by the activation of the fuel cell. In practical terms, the battery is actually being charged by the fuel cell while active, as the fuel cell cannot module its output without incurring performance losses. The charge and discharge states are is shown in Figure 6.
Virtual trading was used to fairly satisfy the community members based on the shared energy available. The excess energy available is shared equally, satisfying each load in ascending order of magnitude. This means that it is more likely that a member’s electricity demand will be fully satisfied if smaller. It should be noted that this algorithm can be modified to suit any location-specific REC policy.

3.5. Economic and Environmental Indicators

A selection of three different system configurations: the best economic outcome, best environmental outcome, and a midpoint configuration between the two would be assessed in the model. It is important from a financial perspective to understand the investment requirements and expected returns for prospective REC members. The net present value (NPV) is commonly employed to determine economic feasibility, as well as the internal rate of return (IRR), simple return [%], payback period [years], and levelized cost of electricity (LCOE) for energy specific cases. Generally, if the NPV is positive compared to the base scenario, the investment is worthwhile [54].
N P V = n = 1 N C O & M , n + C f , n ( 1 + R ) n C 0
where CO&M,t is the operation and maintenance cashflow for year t, Cf ,t is the fuel input cashflow, R is the discount rate, and C0 is the initial capital investment. It was assumed that any grid consumption is included in Cf ,t in units of EUR/year. The capital requirement and operating cashflows are summed for each generation and storage asset to solve for the system NPV. The IRR evaluates the rate of return if the NPV is set to zero, at which point the project breaks even.
N P V = n = 1 N C n ( 1 + I R R R ) n
Calculating the LCOE is beneficial when assessing the economic feasibility of different technologies. The LCOE was evaluated against the grid cost to assess the cost savings per unit of electricity which could be expected by the community members. LCOE is defined as the total cost or lifetime cost of the asset divided by the total electricity delivered to the consumer [55].
LCOE ( / kWh ) = n = 1 N C 0 , n + C O & M , n + C f , n n = 1 N E n
where C0,n is the capital cost of the asset, and En is the lifetime energy delivered. A range of different assessments exist for the economics of renewable assets, as it is highly dependent on the capital requirement, location, delivery and installation cost, and available labour among other factors. The resulting CAPEX, OPEX, and lifetime parameters are shown in Table 2. The costs include the balance of plant (BOP), such as DC-AC inverters and IoT control equipment. The project has an assumed discount rate R of 5% and an estimated inflation rate of 2% per year, as well as a year-one electricity grid unit cost of 0.30 EUR/kWh for each building. Where the asset lifetime is less than 20 years, the asset is retired and the cost of a new equivalent system was included in the NPV assessment in that given replacement year. This method assumes the BOP cost is relatively low.
The environmental impact was estimated through the global warming potential (GWP) of the assets, which when summed together and divided by the total energy delivered over the system lifetime derives the emissions intensity, measured in extgCO2eext/kWh. The values are then compared with the grid emissions intensity for the island, for which the total decarbonisation potential was evaluated. The grid emissions were found using generation data gathered from the national TSO (Red Electrica de Espana) for the year 2021 and found to have an average of 325 gCO2e/kWh.
E I t o t a l = j = 1 m ( E I j · E j ) j = 1 m ( E j )
EIj is the emissions intensity and Ej is the energy output for m number of generators and energy storage systems. This calculation was performed for each timestep of the simulation to find the dynamic emissions value depending on the instantaneous energy mix of the REC. The emissions intensity found within the literature can vary due to the range of manufacturing techniques and factors considered when performing the life cycle assessment (LCA). For this reason, some values such as those used for the hydrogen system are taken as an educated estimation of the emissions impact based on a variety of sources. The GWP embedded during manufacturing and installation for the assets and technology costs are shown in Table 3.

3.6. Multi-Objective Optimisation Procedure

Designing and configuring the optimal system sizing for a hybrid decentralized energy system is a complex process. There are a number of non-linear phenomena being simulated, as well as many potential design objectives and constraints. The chosen objective functions considering both cost and carbon reduction are the NPV and the equivalent GWP. The objective functions rely on varying the capacities of the PV solar, wind, battery, and RHFC installations at the site.
The NSGA-II uses a heuristic evolutionary learning algorithm with a population of potential design solutions within the defined constraints. It then ranks the population based on a non-dominated sorting, producing a pareto front of optimal solutions by minimizing both objective functions [36]. Each individual in the population was determined based on the simulation of the model of a one-year period and evaluating the two objectives. The best-performing individuals are passed to the next generation, whereas a combination of mutations and created offspring (crossover) determines the remaining individuals. NSGA-II provides several advantages including the use of elitism and reduced computational complexity [67]. The solving process for NSGA-II implementation is shown in Figure 7. The algorithm also requires inputs, including the population size, number of offspring, stopping conditions, and variable constraints, as shown in Table 4. The lower limit for all system assets was set to zero, while the upper limit was set to 200 kW in line with the adopted REC regulation for this study. The pymoo module created and maintained by Blank et al. [68] was used to implement the NSGA-II algorithm in Python.
The input parameters were set into the simulation model with the selected objective functions and run within the NSGA-II algorithm. The optimisation ran to the maximum allowed generations before terminating. Due to the bound nature of the problem, the component capacity variables start as a random distribution, from which the non-dominated solutions on the pareto front are derived. Well-performing individuals are moved forward to the next generation, as well as a selection of offspring and individuals that have experienced random mutation. As the generations progress, the population steadily converges on a large set of non-dominated solutions that align with the pareto front between the best system economics and decarbonisation performance, denoted by the objective functions of cost savings and emissions intensity. The graph in Figure 8 shows the convergence of the objective function products during the progression through the first 200 generations of the hybrid system optimisation, which will converge towards a single value.

4. Results and Discussion

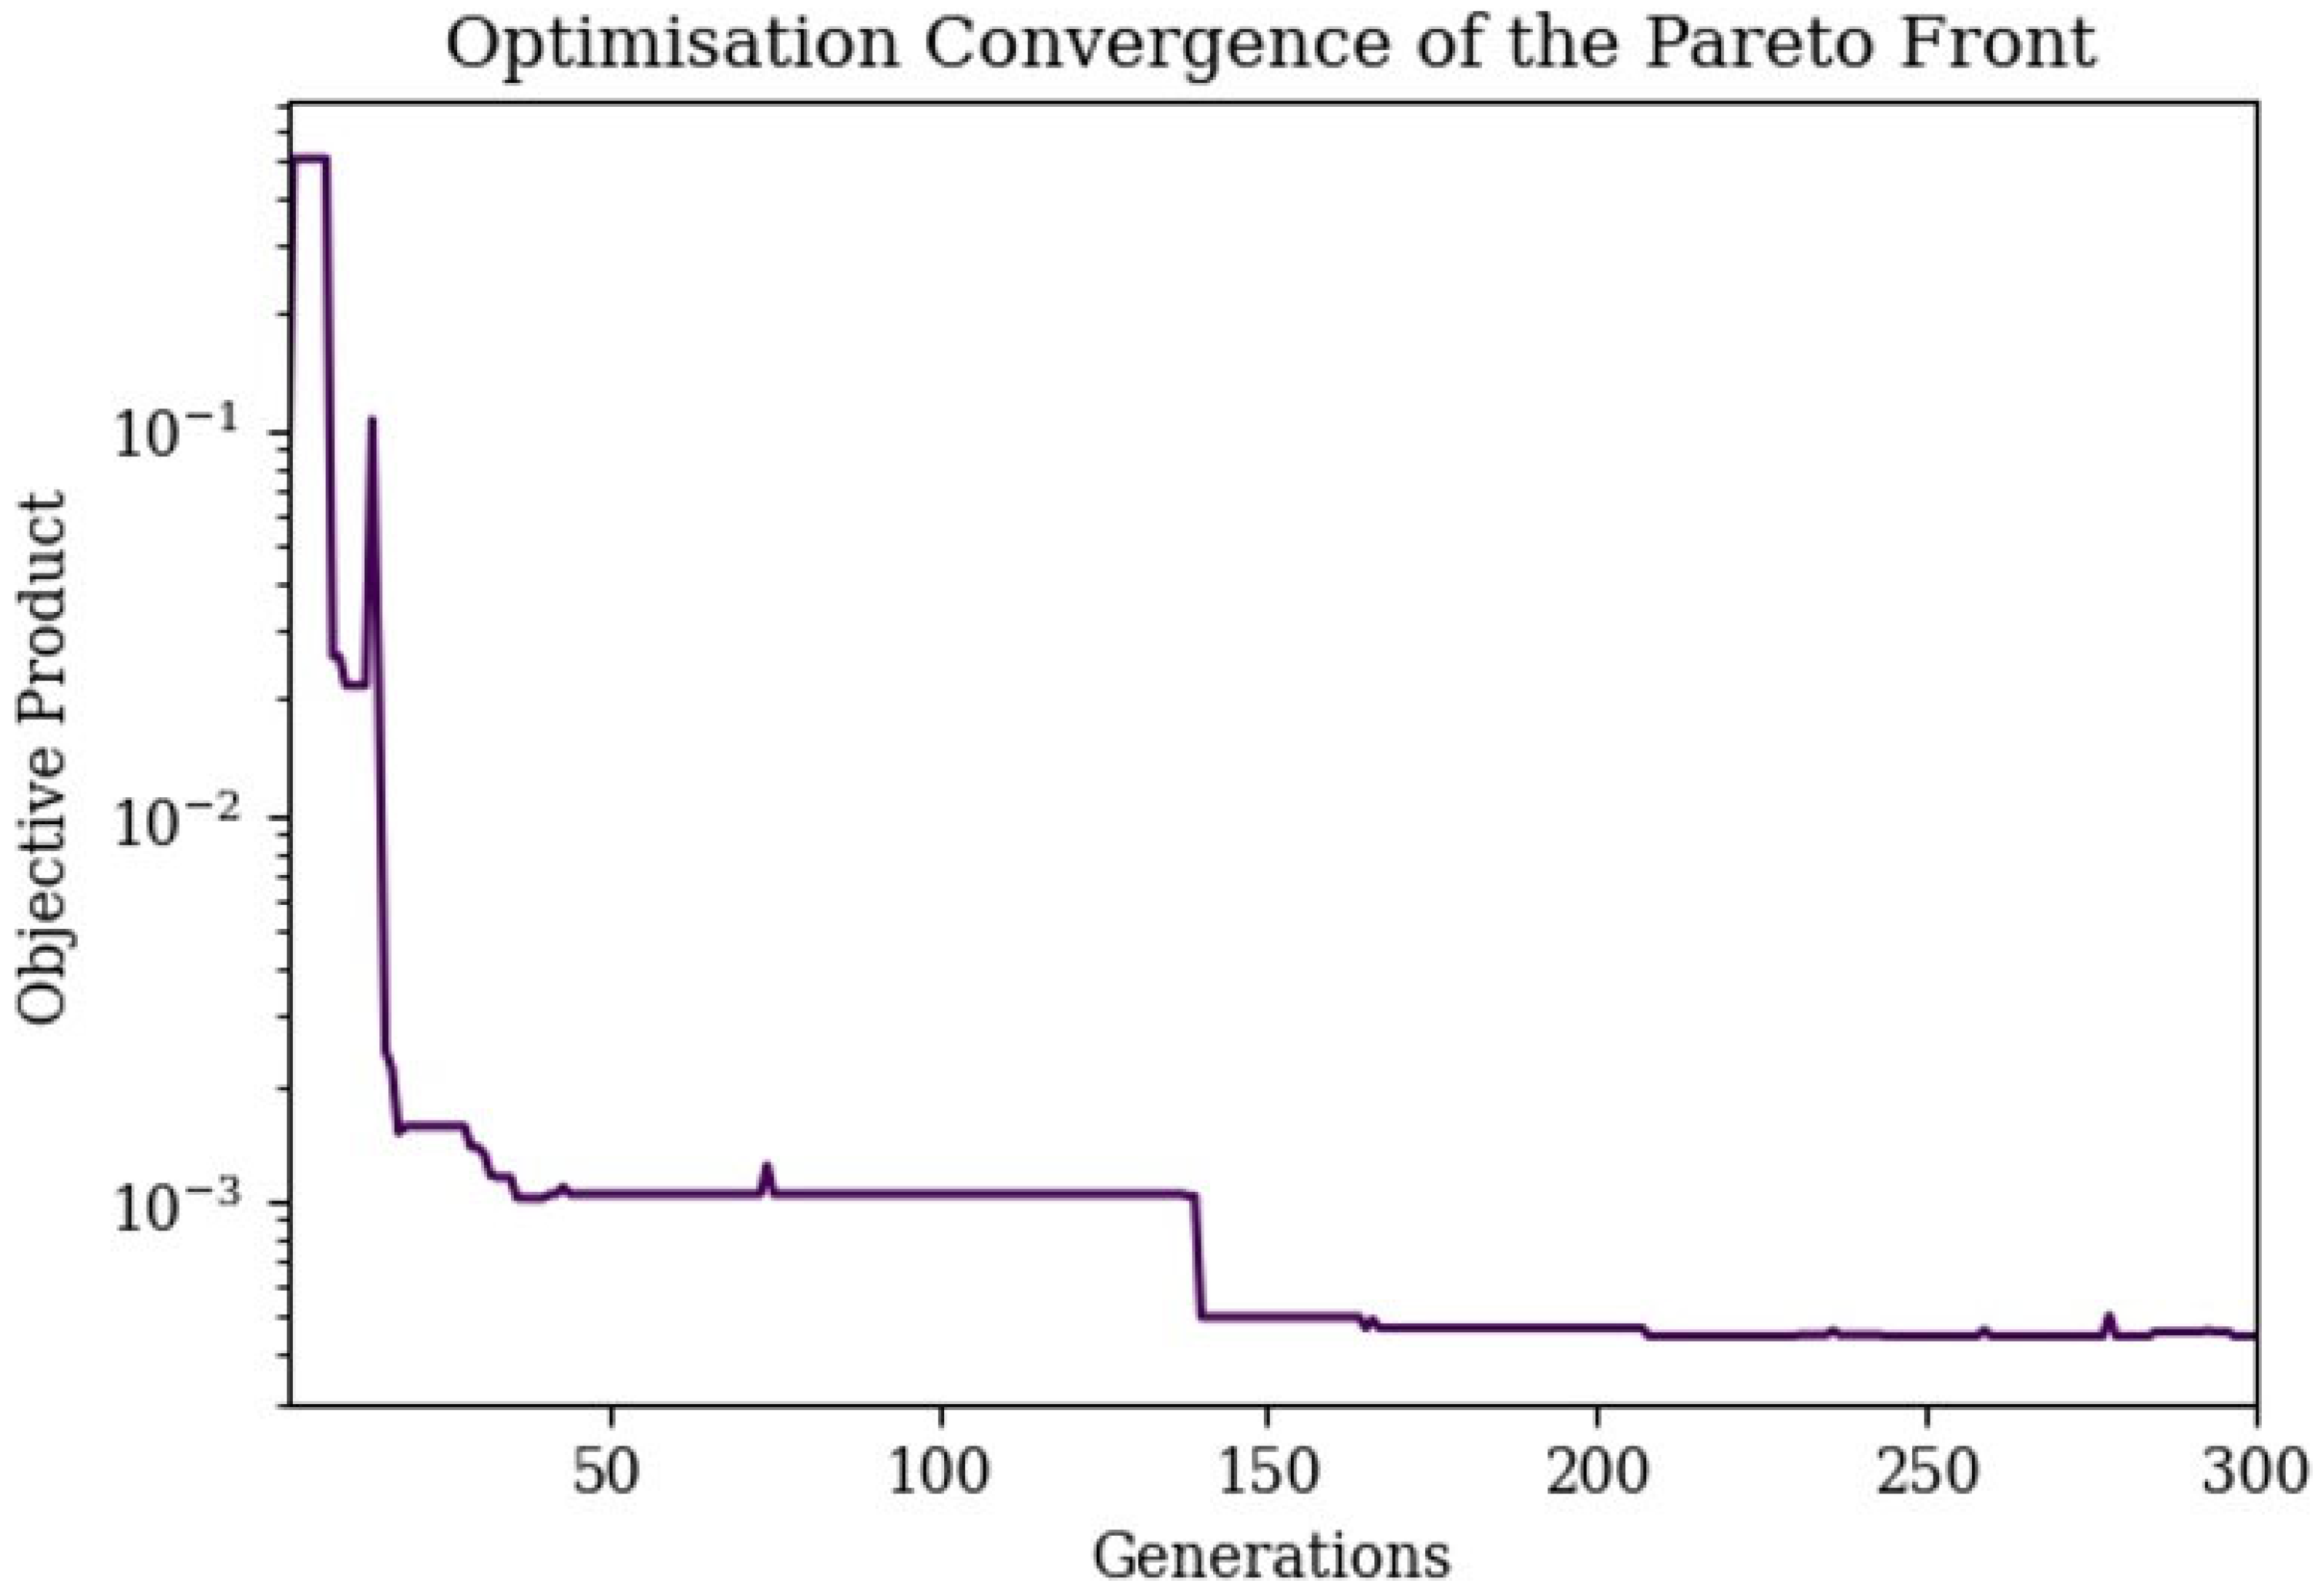
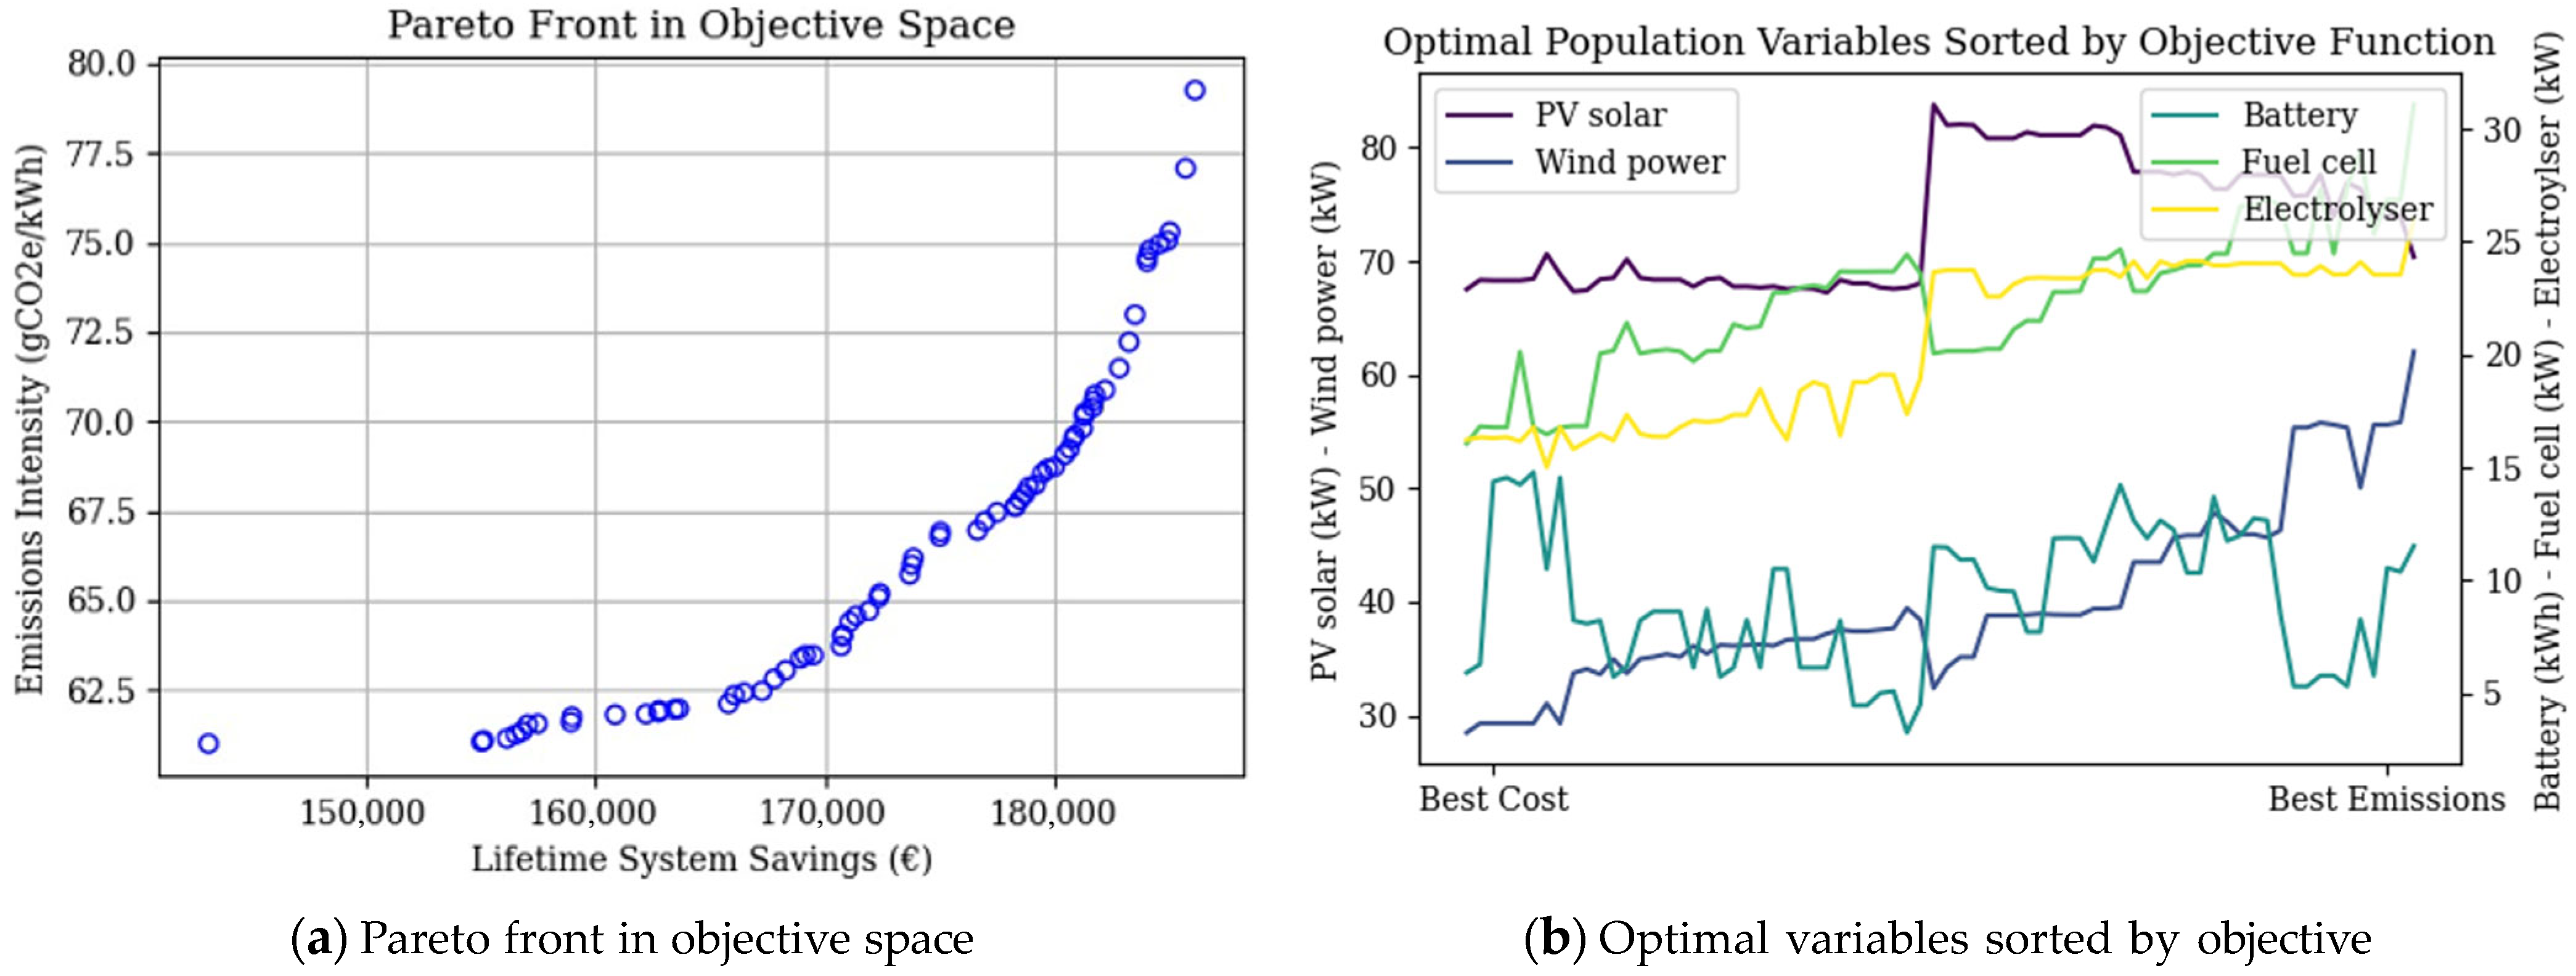
4.1. Optimisation Results of the Hybrid Energy Generation and Storage Renewable Energy Community

The primary case studied was the hybrid architecture consisting of both a lithium battery and an RHFC. Within the resulting pareto front in Figure 9a, each point on the graph represents a different combination of design capacities ranging from the configuration able to achieve the highest economic returns to the system able to deliver the lowest net carbon output. The lifetime cost savings potential ranges from approximately EUR 130k to EUR 186k, while the emission intensity ranges from 82 to 140 gCO2e/kWh. It is interesting to note that the savings do not start at zero, implying that below EUR 130k returns, the configuration was able to increase in economic performance as well as decarbonisation before reaching an inflection point. At this point, it is clear that the net savings were able to continue increasing, while the net emissions reached its minimum and began to climb again. At the other end of the front, the gradient began to increase as both the returns increase but also the emissions intensity. This continued up to the point where the system can no longer provide additional savings without an exponential increase in embedded emissions and therefore environmental impact.
The resulting pareto front presents several crucial outcomes and challenges for providing a low cost and net-zero energy system. Firstly, an inherent trade-off relationship was observed between the ability to decarbonise and ensure net profitability. Secondly, the REC architecture, within the context and constraints of the study, can reduce carbon emissions by over 75% compared to local grid usage. However, this is a hard limit due to the capacity factors of the components and the embedded carbon within the system during manufacturing. Additionally, trying to decrease the carbon emissions further only incurs a financial penalty, which would be hard to incentivise to the REC members.
The graph in Figure 9b displays the capacities of PV solar, wind power, battery, fuel cell, and electrolyser systems with the final population arranged by the two objective functions. The best economic outcome is on the left, while the best environmental outcome is on the right. It can be observed that all systems generally tend towards an increase in capacity as the emissions improve. This is most likely because a larger total off-grid capacity has a higher self-consumption rate, and therefore is relying less on the grid which has a high emissions intensity of 325 gCO2e/kWh. The REC was consequently able to reduce emissions to a greater extent. This, of course, negatively impacts the economics of the REC as more capital has to be invested into a more substantial design. It appears from the graph that the wind power, as well as the fuel cell and electrolyser which make up the RHFC are most sensitive to changes in the objective functions. The following section explores the chosen optimal design, and details why the capacities affect the objective functions in this way.

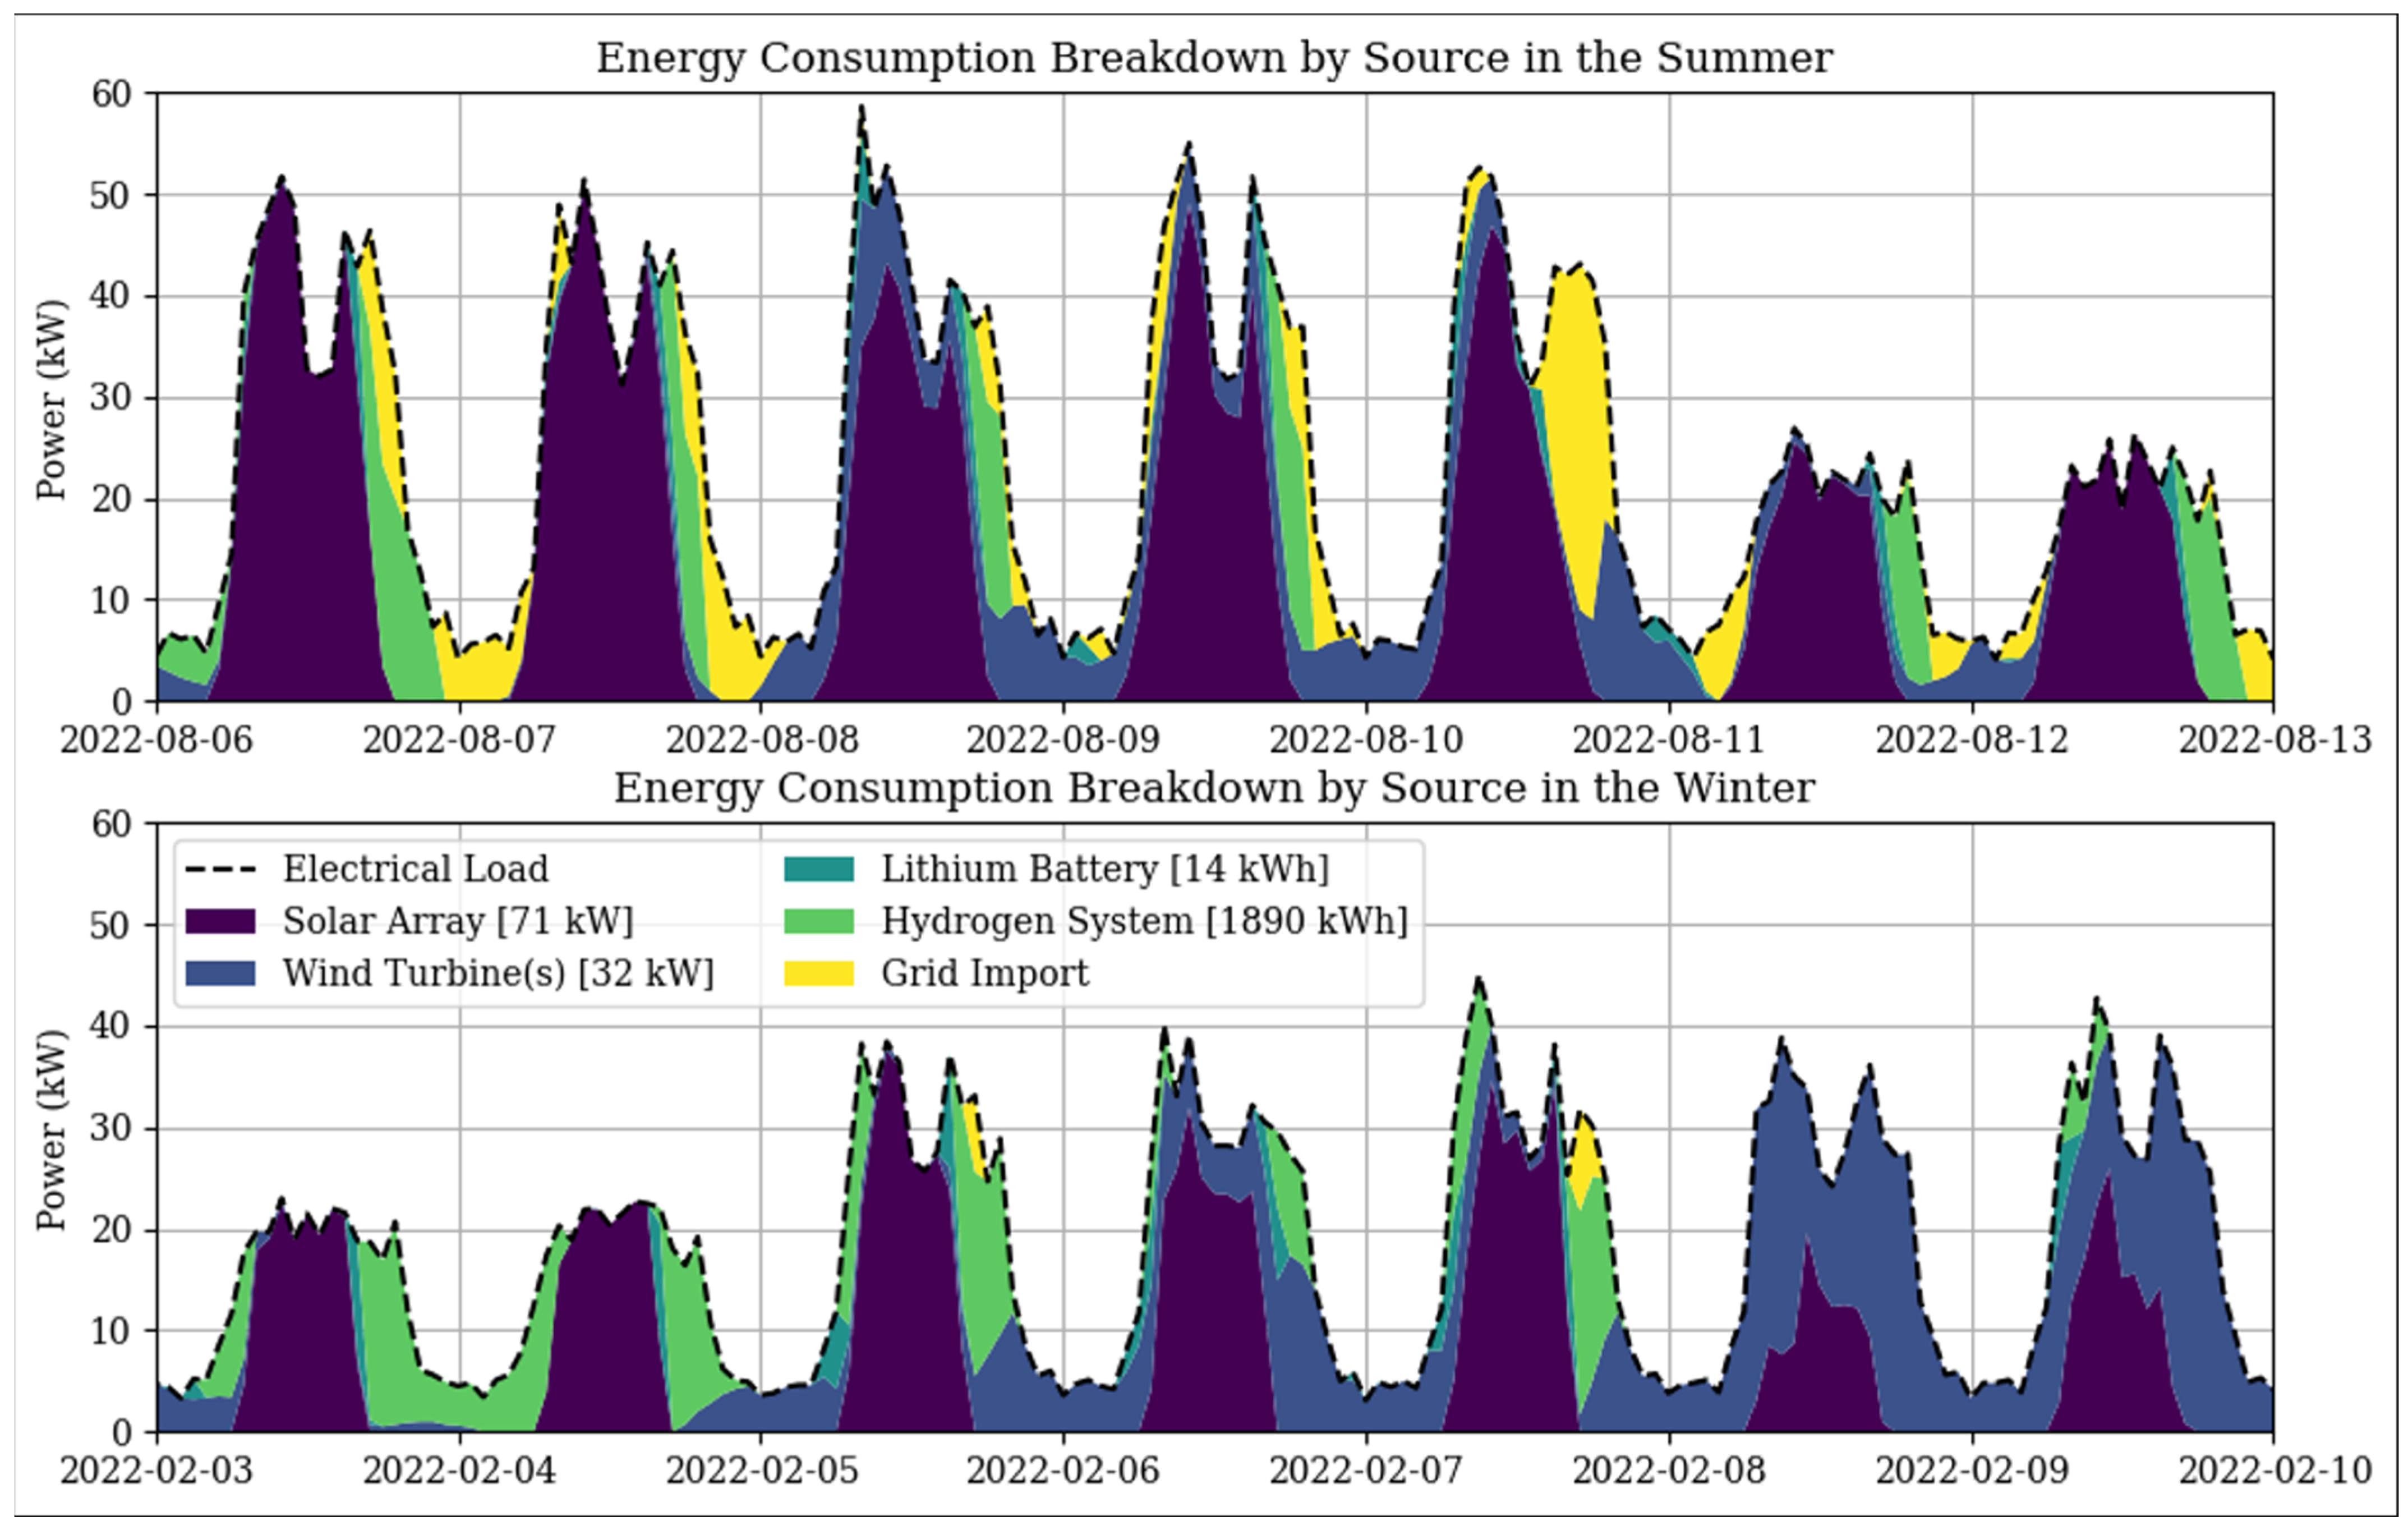
4.2. Best Hybrid System Design for the Renewable Energy Community

The pareto front provides a range of potential non-dominated solutions in which neither objective function is favoured over the other. There are several methods that can be used to choose a nominally ‘best’ system from the population to perform further analysis. Based on the research conducted by Wang and Rangaiah [69], it was chosen to use simple additive weighting (SAW). SAW normalises both objective function values, where zero is the worst possible result and one is the most improved. The values are then summed for each member of the population to find the best overall solution.
{ F i j = f i j f j + for   a   maximisation   criterion ,   where f i + = m a x i m f i j F i j = f i j f j for   a   maximisation   criterion ,   where f i = m i n i m f i j
A i = j = 1 n F i j
Fij is the normalised set of objective functions j for the pareto population i and fij is the initial set. f i + and f i are the maximum and minimum criteria of the set, respectively. Ai then provides the best set of design variables to use in the hybrid REC, given in Table 5. The system was then simulated to perform analysis of all performance indicators.
Figure 10 contains two one-week sample periods obtained from the simulation, displaying the balance of each asset and their contribution to balancing the total REC load. Typical summer and winter periods are used to observe the seasonal variation in the system response. The REC load was higher on average during the summer period, leading to increased reliance and leading the energy grid to fill gaps in the consumption requirement when the ESS was unavailable. The winter period, by contrast, was able to satisfy the load requirement with the exception of some short periods. This shows that although the REC can operate largely off-grid, it is still beneficial from both an economic and emissions perspective to remain grid-connected from the short period when the REC generation and hybrid storage cannot fully balance the consumption. The hydrogen system requires a maximum storage of 1835k, which was evaluated from the simulation as the storage required to avoid any state-of-charge limits. The value therefore is a worst-case scenario for the system, as it is likely that a smaller storage would be chosen in accordance with the installation space available within the REC. Given the lower heating value (LHV) of hydrogen and the average fuel cell efficiency of 46%, the system would require approximately 14 Nm2 of hydrogen stored at 35bar to supply the required quantity of a one-year period.
Table 6 below shows a full breakdown of the economic and environmental performance of each grouped asset. The solar array was able to deliver the most energy to the REC due to the high capacity of 71 kW, but also the higher solar potential on the island of Formentera of 4.7 kWh/m2, compared to London, UK, of 2.9 kWh/m2. Energy generated from wind provides the next greatest portion of over 24%, the benefit of which is that energy is generated during the night period as well as the day to charge the battery and a steady quantity of hydrogen. The battery itself was relatively small compared to the other components at 14 kWh and responds only when the energy generated is no longer available in excess of supply. The fuel cell and electrolyser were sized at 20 kW and 18 kW, respectively. It is interesting to note that the electrolyser was smaller in power input capacity than the fuel cell, even though the efficiencies would dictate the fuel cell would need approximately half the rated power of the electrolyser to achieve the same capacity factor. The increased generation from wind power over more of the simulation may allow the electrolyser to run for longer periods and make up the fuel cell’s lower efficiency.

4.2.1. Techno-Economic Assessment

It is important to analyse each component on an individual basis to fully understand their contribution to the economic and emissions performance within the system. This would not only help to confirm the results seen in the pareto optimality, but also from a practical perspective assist a potential system designer to identify the most important assets, any particularly sensitive parameters, and assess the risks associated with each.
The solar array has the largest capital and operational costs compared with the wind power alternative due to the higher unit costs per kW. Despite this, the PV solar was able to achieve a greater capacity factor, which is the measure of energy output as a ratio of the total potential output of the same period. PV solar is naturally limited by the hours of solar available, while wind power is limited by the average wind speed and distribution. The higher capacity is the main mechanism which produced a lower LCOE for the PV solar of 0.07 compared with wind power’s 0.09 EUR/kWh, despite the higher CAPEX and OPEX costs. This result also implies that although wind power is possible on with the REC, it may be beneficial from a to study a PV solar generation only option due to the potential impracticalities of local wind turbines. The inverse was then observed for the environmental impact, in that the PV solar has considerably higher embedded emissions of 40.7 gCO2e/kWh compared with the 15.9 gCO2e/kWh expected from equivalent wind energy. These results show a good agreement with the reported embedded emissions from the IPCC AR5 report [70] of 45 gCO2e/kWh and 13 gCO2e/kWh for solar and wind, respectively.
At EUR 106k, the RHFC CAPEX was a factor of twenty higher than the battery. This trend carries over into the LCOE results, where an approximate doubling of the levelized cost was observed for the hydrogen system compared with lithium batteries. These outcomes are in line with similar hydrogen system results found in the literature [55,71]. It is widely known that hydrogen technology is a less financially viable alternative for many applications, so this result was somewhat expected. This could change in the near future as the costs of hydrogen technology reduce.
The emissions output from the battery per kWh delivery was far higher than the hydrogen solution at 72.4 and 18.6 gCO2e/kWh, respectively. The trend is also supported by the population variables in Figure 9b, in which it is noted that as the hydrogen assets increased in capacity, the emissions result improved, while the net savings deteriorated.
Figure 11 contains the present value curve of the grid-only case, that is when electricity cost is paid to the utility company over the project period. The curve starts at zero as there is no capital cost associated with grid usage, but the operational cost per year is high. By contrast, the modelled REC requires an initial investment of EUR 380k. However, the lower year-on-year cost means that the system can pay off the investment cost, described as the payback term, in 9 years. The project ends with a final total savings of EUR 178k when the inflation and discounts rates of 2% and 5%, respectively, are considered. The result produces an IRR of 10.9%, year’s returns of 9.6%, and an average system LCOE of 0.16 EUR/kWh. This assessment was based on the cost of equipment and installation since 2020.
Considering the historical and currently observed trends in renewable generation and storage equipment cost, it is projected that by 2030 and beyond there will continue to be a substantial decrease in the financial requirements for this type of system. The results shown here are therefore towards the upper bounds in terms of uncertainty about the future cost of an REC implementation.

4.2.2. REC Members’ Net Savings and Environmental Impacts

The model not only provides a global view of the potential impact of an REC configuration but is also able to analyse the reduction in cost and emissions on a per load basis. There were seven discretised loads within the model, with each being able to mutually accept and trade energy with the decentralised assets. Table 7 below shows the average LCOE and emissions intensity for each building and the percentage decrease in emissions. The REC provided a considerable degree of self-consumption, ranging from 91.1% for the largest load to over 98% for the smallest. In terms of the impact on the energy cost, the new LCOE ranged between 0.16 and 0.17 EUR/kWh compared to 0.30 EUR/kWh for grid-only. The decarbonisation of energy usage was also seen to be in the range of 75–77% in the first year of installation.

4.3. Best Case and Extremes Comparison

During the study, it was vital to understand not only the characteristics of the system at the ‘best’ pareto result, but also the performance at the extremes of the multi-objective optimisation. The result gives an indication as to how sensitive the result was to changing parameters. Table 8 contains the results of the three chosen REC configurations in terms of hybrid generation and storage capacities.

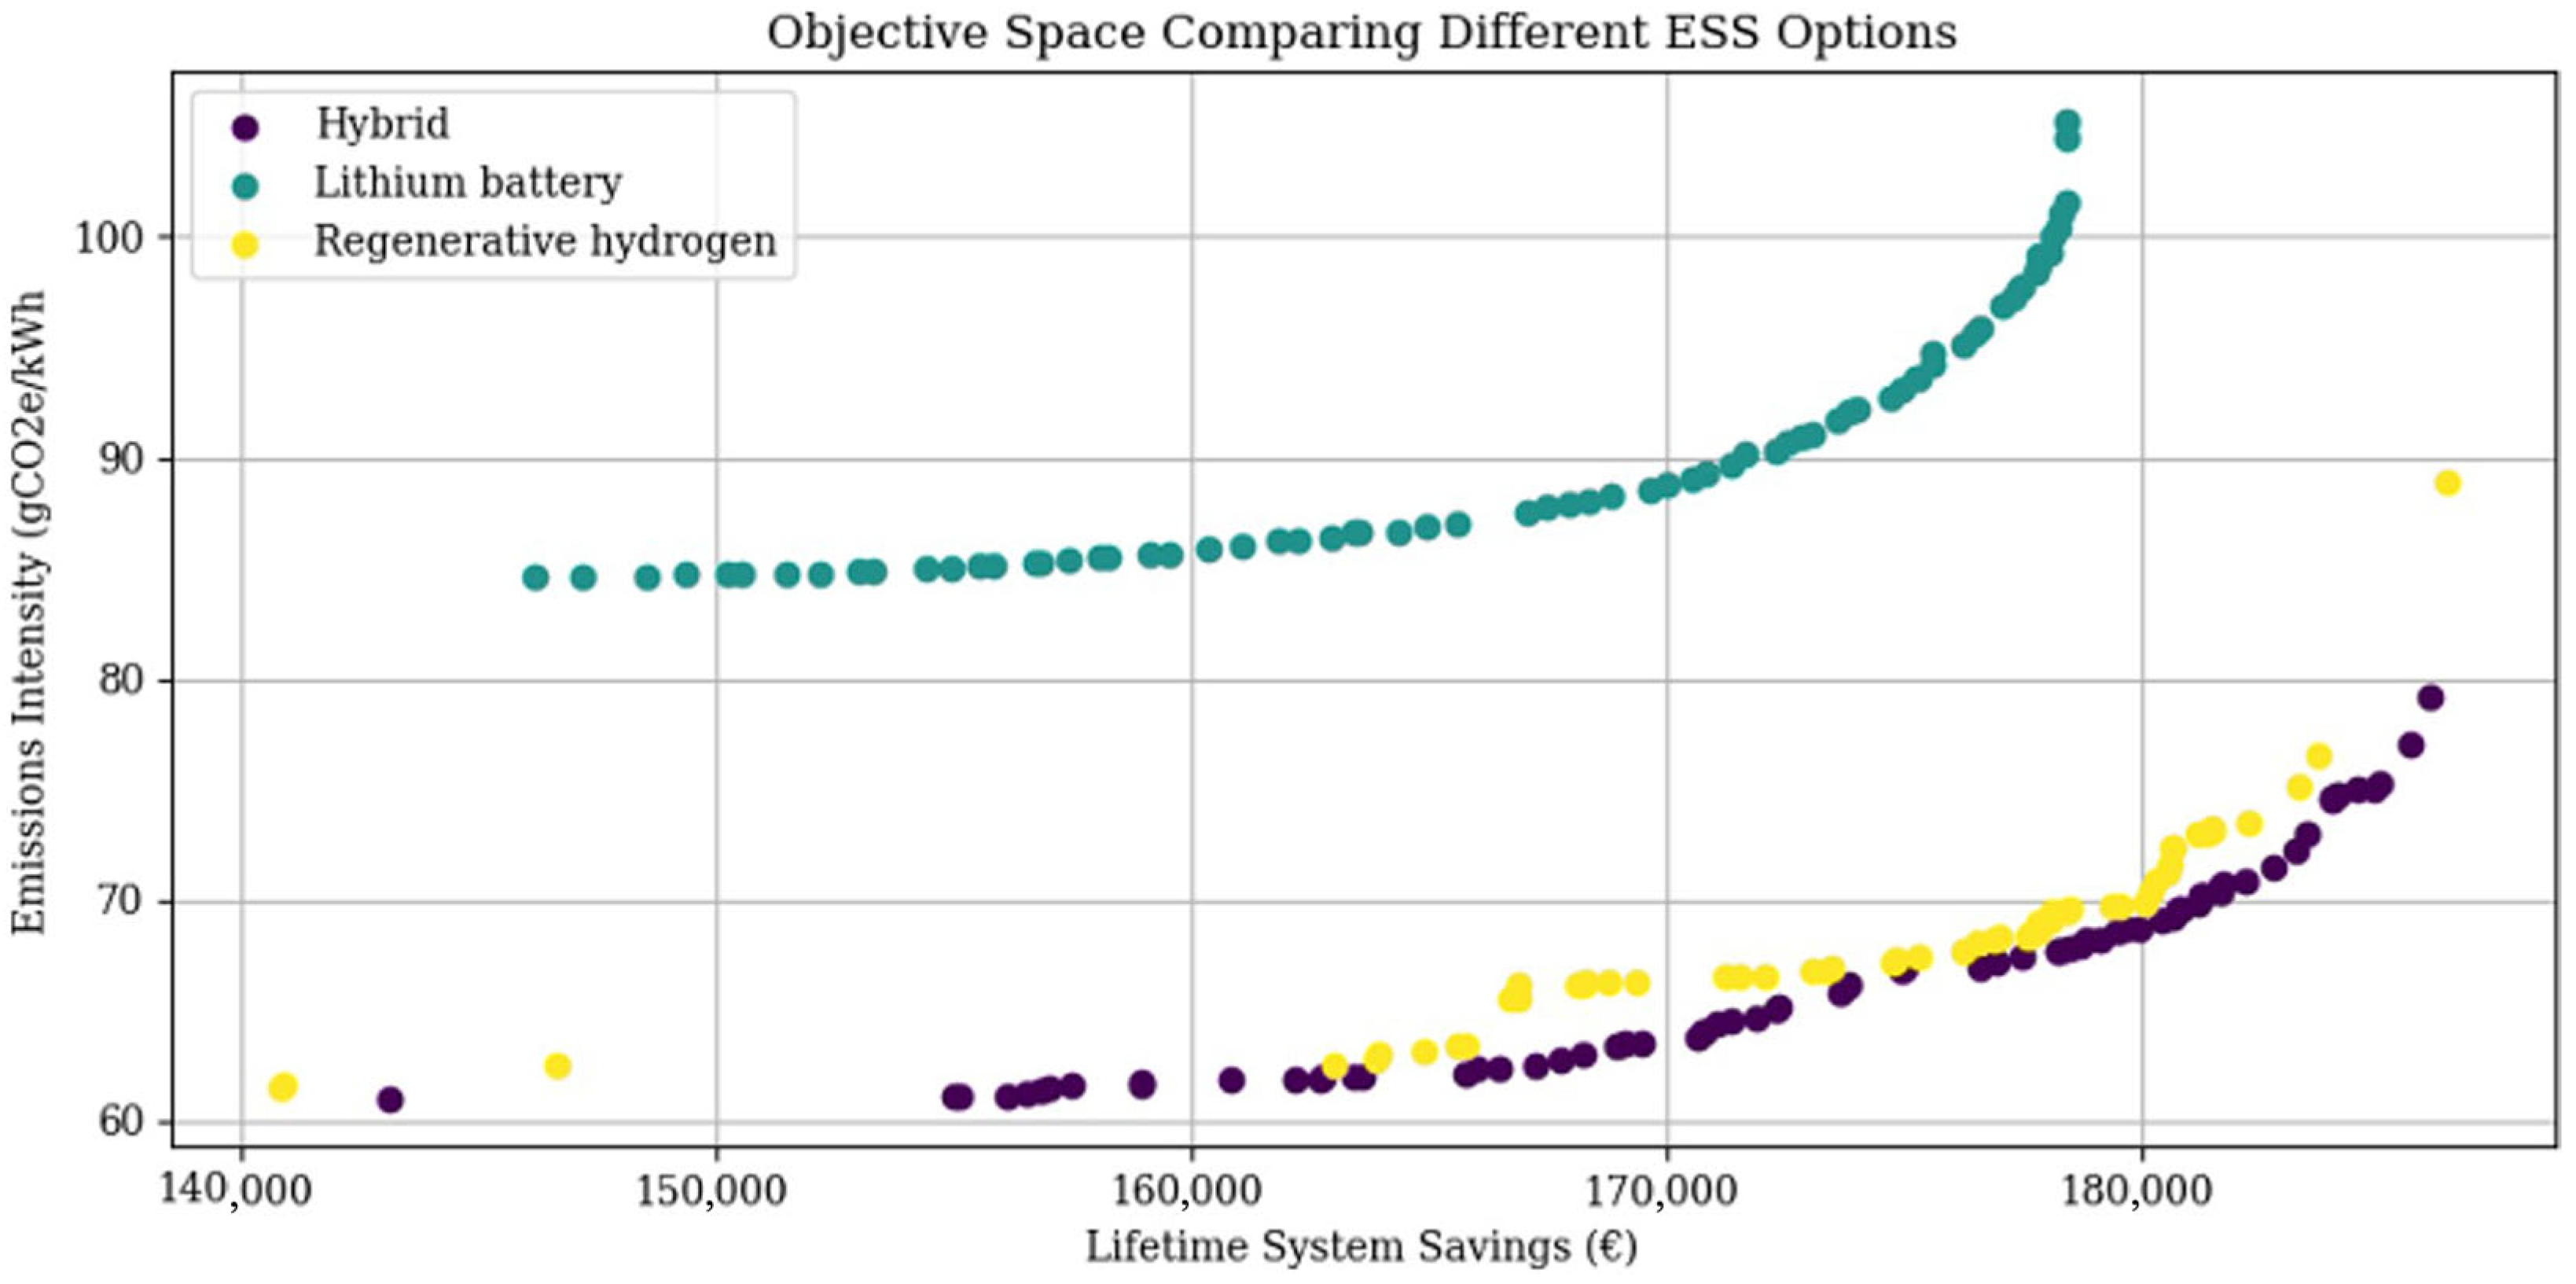
4.4. Pareto Front Comparison of Energy Storage System Technologies

The hybrid ESS comprised of a lithium battery and RHFC system produces differing performance outcomes based on the relative capacities of the technologies. Therefore, a comparison of the multi-objective optimisation for the same REC set-up with an additional battery-only ESS and RHFC-only ESS are required to ensure that the hybrid design was able to provide the best performance in terms of environmental impact and cost savings for the REC members. Figure 12 compares these pareto fronts, from which the combination of the technologies was able to produce a significant improvement over the technologies working independently. This was likely due to the fact that the battery is better at providing a short-term response but suffers from increased degradation if used frequently for charge and discharge, and similarly the hydrogen system requires a high capital cost and is best suited to the long-term storage of grid energy. The battery alone also has increased embedded carbon, which limited its ability to decarbonise. The hydrogen-only system suffered from the limitation that the electrolyser only runs at rated power, limiting flexibility.
Table 9 below summarises a range of LCOE results from the literature with similar smart grid and renewable energy architectures, incorporating hydrogen storage where available. It should be noted that specific parameters such as renewable resource availability, local technology costs, and system sizing may induce uncertainty in the resulting total system LCOE. For example, locations with a higher solar potential are naturally able to achieve a lower PV solar LCOE, and conversely, remote areas with high delivery and installation costs would experience higher project costs. The resulting average is 0.13 EUR/kWh, which is in good agreement with the central economic and environmental trade-off case produced in this work.

5. Conclusions

This work presents a novel decentralised hybrid generation and ESS implementing both battery and hydrogen technology for use in a geographically isolated rural renewable energy community. A review of the existing state of the art was presented and highlighted the gaps in knowledge for such a system, particularly when considering both economic feasibility and a dynamic calculation of the environmental impact. This discussion comes at an interesting time for Europe and around the world as policymakers work to facilitate the potential benefits of aggregating decentralised renewables, one such method being the REC. The steady cost reduction in PV solar and wind power as seen over the past years has also accelerated growth in the decentralised energy sector. The rise of cost-effective hydrogen technology is set to make a considerable impact on how energy is stored and transported as a vector.
The results from this study show that there is an inherent trade-off relationship between cost reduction and the ability to decarbonise the energy system. By using a model built in Python, several different economic and environmental scenarios can be assessed. The implementation of a multi-objective algorithm gives potential system designers and policymakers a range of possible solutions. In this case, the optimal design results in an LCOE of 0.15W EUR/kWh, a project IRR of 10.8%, and an ROI of 9 years. Greenhouse gas emissions were reduced by 72% in the first year of installation to 69 gCO2e/kWh.
In further studies, emphasis should be placed on performing a sensitivity analysis and understanding where uncertainty may arise in the energy model. In particular, varying the component input assumptions such as capital cost and embedded emissions in line with reported ranges from the literature would further account for future uncertainty in performance. Additionally, further improvements to the system sizing optimisation method, including additional objective functions such as the loss of load probability from the literature, quantifying social impacts, and applying local space constraints would capture other potential strengths and weaknesses of the hybrid storage technology. Finally, research into the implementation of REC architectures in other locations around the world beyond the case study in this work would not only provide additional validation but also give a global perspective of how effective an REC could be in keeping energy costs stable and curbing the impacts of climate change.

Author Contributions

R.G.: Conceptualization, methodology, software, validation, formal analysis, investigation, resources, data curation, writing—original draft preparation, writing—review and editing, visualization. Z.D.: Supervision, project administration, funding acquisition, writing—review and editing. All authors have read and agreed to the published version of the manuscript.

Funding

This research is sponsored by the EU Horizon 2020 research and innovation program under the grant agreement No 957852: Virtual Power Plant for Interoperable and Smart isLANDS—VPP4ISLANDS. More information is available at https://cordis.europa.eu/project/id/957852 (accessed on 30 August 2023).

Data Availability Statement

Data will be made available on request.

Acknowledgments

Special thanks are extended to the Consel de Formentera for allowing access to energy consumption data, from which the energy community model was built.

Conflicts of Interest

The authors declare no conflict of interest.

Abbreviations

The following abbreviations are used in this manuscript:
CAPEXCapital Expenditure
DODDepth of Discharge
ESSEnergy Storage System
GAGenetic Algorithm
GHIGlobal Horizontal Irradiance
GWPGlobal Warming Potential
IECInternational Electrotechnical Commission
IRRInternal Rate of Return
LCOELevelised Cost of Electricity
NPVNet Present Value
NSGANon-dominated Sorting Genetic Algorithm
OPEXOperational Expenditure
PEMProton Exchange Membrane
PVPhotovoltaic
RECRenewable Energy Community
REDRenewable Energy Directive
RESRenewable Energy System
RHFCRegenerative Hydrogen Fuel Cell
ROIReturn on Investment
SOCState of Charge
TSOTransmissions System Operator

References

  1. United Nations. The Paris Agreement; United Nations: Paris, France, 2015. [Google Scholar]
  2. Intergovernmental Panel on Climate Change. Synthesis Report of the IPCC Sixth Assessment Report (AR6); IPCC Secretariat: Geneva, Switzerland, 2022. [Google Scholar]
  3. Wang, R.; Usman, M.; Radulescu, M.; Cifuentes Faura, J.; Lorente, D. Achieving ecological sustainability through technological, innovations, financial development, FDI and energy consumption in developing European countries. Gondwana Res. 2023, 119, 138–152. [Google Scholar] [CrossRef]
  4. Department for Business, Energy & Industrial Strategy. British Energy Security Strategy; HM Goverment UK: London, UK, 2022. [Google Scholar]
  5. Boie, I.; Fernandes, C.; Frías, P.; Klobasa, M. Efficient strategies for the integration of renewable energy into future energy, infrastructures in Europe—An analysis based on transnational modeling and case studies for nine European regions. Energy Policy 2014, 67, 170–185. [Google Scholar] [CrossRef]
  6. Kabeyi, M.J.B.; Olanrewaju, O.A. Sustainable Energy Transition for Renewable and Low Carbon Grid Electricity Generation and Supply. Front. Energy Res. 2022, 9, 743114. [Google Scholar] [CrossRef]
  7. Gielen, D.; Boshell, F.; Saygin, D.; Bazilian, M.D.; Wagner, N.; Gorini, R. The role of renewable energy in the global energy transformation. Energy Strategy Rev. 2019, 24, 38–50. [Google Scholar] [CrossRef]
  8. Saboori, H.; Mohammadi, M.; Taghe, R. Virtual Power Plant (VPP), Definition, Concept, Components and Types. In Proceedings of the 2011 Asia-Pacific Power and Energy Engineering Conference, Washington, DC, USA, 25–28 March 2011; pp. 1–4. [Google Scholar] [CrossRef]
  9. Hirth, L.; Ziegenhagen, I. Balancing power and variable renewables: Three links. Renew. Sustain. Energy Rev. 2015, 50, 1035–1051. [Google Scholar] [CrossRef]
  10. Mohd Azmi, K.H.; Mohamed Radzi, N.A.; Azhar, N.A.; Samidi, F.S.; Thaqifah Zulkifli, I.; Zainal, A.M. Active Electric Distribution Network: Applications, Challenges, and Opportunities. IEEE Access 2022, 10, 134655–134689. [Google Scholar] [CrossRef]
  11. Rezaeimozafar, M.; Monaghan, R.F.; Barrett, E.; Duffy, M. A review of behind-the-meter energy storage systems in smart grids. Renew. Sustain. Energy Rev. 2022, 164, 112573. [Google Scholar] [CrossRef]
  12. Aneke, M.; Wang, M. Energy storage technologies and real life applications—A state of the art review. Appl. Energy 2016, 179, 350–377. [Google Scholar] [CrossRef]
  13. Hesse, H.C.; Schimpe, M.; Kucevic, D.; Jossen, A. Lithium-Ion Battery Storage for the Grid—A Review of Stationary Battery Storage System Design Tailored for Applications in Modern Power Grids. Energies 2017, 10, 2107. [Google Scholar] [CrossRef]
  14. Wali, S.; Hannan, M.; Ker, P.J.; Rahman, M.A.; Mansor, M.; Muttaqi, K.; Mahlia, T.; Begum, R. Grid-connected lithium-ion battery energy storage system: A bibliometric analysis for emerging future directions. J. Clean. Prod. 2022, 334, 130272. [Google Scholar] [CrossRef]
  15. Vykhodtsev, A.V.; Jang, D.; Wang, Q.; Rosehart, W.; Zareipour, H. A review of modelling approaches to characterize lithium-ion battery energy storage systems in techno-economic analyses of power systems. Renew. Sustain. Energy Rev. 2022, 166, 112584. [Google Scholar] [CrossRef]
  16. Jamal, H.; Khan, F.; Si, H.R.; Kim, J.H. Enhanced compatibility of a polymer-based electrolyte with Li-metal for stable and dendrite-free all-solid-state Li-metal batteries. J. Mater. Chem. A 2021, 9, 27304–27319. [Google Scholar] [CrossRef]
  17. Jamal, H.; Khan, F.; Si, H.R.; Kim, J.H. Enhancement of the ionic conductivity of a composite polymer electrolyte via surface functionalization of SSZ-13 zeolite for all-solid-state Li-metal batteries. J. Mater. Chem. A 2021, 9, 4126–4137. [Google Scholar] [CrossRef]
  18. Mongird, K. 2020 Grid Energy Storage Performance Assessment; US Department of Energy: Richland, WA, USA, 2020. [Google Scholar]
  19. Zhang, W.; Maleki, A.; Rosen, M.A.; Liu, J. Optimization with a simulated annealing algorithm of a hybrid system for renewable energy including battery and hydrogen storage. Energy 2018, 163, 191–207. [Google Scholar] [CrossRef]
  20. French, S. The Role of Zero and Low Carbon Hydrogen in Enabling the Energy Transition and the Path to Net Zero Greenhouse Gas Emissions: With global policies and demonstration projects hydrogen can play a role in a net zero future. Johns. Matthey Technol. Rev. 2020, 64, 357–370. [Google Scholar]
  21. Coppitters, D.; De Paepe, W.; Contino, F. Robust design optimization and stochastic performance analysis of a grid-connected photovoltaic system with battery storage and hydrogen storage. Energy 2020, 213, 118798. [Google Scholar] [CrossRef]
  22. Haji Bashi, M.; De Tommasi, L.; Le Cam, A.; Relaño, L.S.; Lyons, P.; Mundó, J.; Pandelieva-Dimova, I.; Schapp, H.; Loth-Babut, K.; Egger, C.; et al. A review and mapping exercise of energy community regulatory challenges in European member states based on a survey of collective energy actors. Renew. Sustain. Energy Rev. 2023, 172, 113055. [Google Scholar] [CrossRef]
  23. European Parliament. Directive (EU) 2018/2001 of the European Parliament and of the Council of 11 December 2018 on the Promotion of the Use of Energy from Renewable Sources; European Parliament: Brussels, Belgium, 2018. [Google Scholar]
  24. Fina, B.; Monsberger, C. Legislation for renewable energy communities and citizen energy communities in Austria: Changes from the legislative draft to the finally enacted law. J. World Energy Law Bus. 2022, 15, 237–244. [Google Scholar] [CrossRef]
  25. Sebi, C.; Vernay, A.L. Community renewable energy in France: The state of development and the way forward. Energy Policy 2020, 147, 111874. [Google Scholar] [CrossRef]
  26. Broska, L.H.; Vögele, S.; Shamon, H.; Wittenberg, I. On the Future(s) of Energy Communities in the German Energy Transition: A Derivation of Transformation Pathways. Sustainability 2022, 14, 3169. [Google Scholar] [CrossRef]
  27. Swens, J.; Diestelmeier, L. 4—Developing a legal framework for energy communities beyond energy law. In Energy Communities; Löbbe, S., Sioshansi, F., Robinson, D., Eds.; Academic Press: Cambridge, MA, USA, 2022; pp. 59–71. [Google Scholar] [CrossRef]
  28. Trevisan, R.; Ghiani, E.; Pilo, F. Renewable Energy Communities in Positive Energy Districts: A Governance and Realisation Framework in Compliance with the Italian Regulation. Smart Cities 2023, 6, 563–585. [Google Scholar] [CrossRef]
  29. Gallego-Castillo, C.; Heleno, M.; Victoria, M. Self-consumption for energy communities in Spain: A regional analysis under the new legal framework. Energy Policy 2021, 150, 112144. [Google Scholar] [CrossRef]
  30. Official Gazette. Legislative Decree no. 192/2021; Official Gazette: Rome, Italy, 2021. [Google Scholar]
  31. Di Silvestre, M.L.; Ippolito, M.G.; Sanseverino, E.R.; Sciumè, G.; Vasile, A. Energy self-consumers and renewable energy communities in Italy: New actors of the electric power systems. Renew. Sustain. Energy Rev. 2021, 151, 111565. [Google Scholar] [CrossRef]
  32. Trevisan, R.; Ghiani, E.; Ruggeri, S.; Mocci, S.; Pisano, G.; Pilo, F. Optimal sizing of PV and Storage for a Port Renewable Energy Community. In Proceedings of the 2022 2nd International Conference on Energy Transition in the Mediterranean Area (SyNERGY MED), Thessaloniki, Greece, 17–19 October 2022; pp. 1–5. [Google Scholar] [CrossRef]
  33. Bartolini, A.; Carducci, F.; Muñoz, C.B.; Comodi, G. Energy storage and multi energy systems in local energy communities with high renewable energy penetration. Renew. Energy 2020, 159, 595–609. [Google Scholar] [CrossRef]
  34. Wang, Y.; Gao, W.; Li, Y.; Qian, F.; Yao, W. Techno-economic analysis of the transition toward the energy self-sufficiency community based on virtual power plant. Front. Energy Res. 2023, 11, 1010846. [Google Scholar] [CrossRef]
  35. Cuesta, M.; Castillo-Calzadilla, T.; Borges, C. A critical analysis on hybrid renewable energy modeling tools: An emerging opportunity to include social indicators to optimise systems in small communities. Renew. Sustain. Energy Rev. 2020, 122, 109691. [Google Scholar] [CrossRef]
  36. Niveditha, N.; Rajan Singaravel, M. Optimal sizing of hybrid PV–Wind–Battery storage system for Net Zero Energy Buildings to reduce grid burden. Appl. Energy 2022, 324, 119713. [Google Scholar] [CrossRef]
  37. Zhang, Y.; Sun, H.; Tan, J.; Li, Z.; Hou, W.; Guo, Y. Capacity configuration optimization of multi-energy system integrating wind turbine/photovoltaic/hydrogen/battery. Energy 2022, 252, 124046. [Google Scholar] [CrossRef]
  38. Xu, C.; Ke, Y.; Li, Y.; Chu, H.; Wu, Y. Data-driven configuration optimization of an off-grid wind/PV/hydrogen system based on modified NSGA-II and CRITIC-TOPSIS. Energy Convers. Manag. 2020, 215, 112892. [Google Scholar] [CrossRef]
  39. Xuan, J.; Chen, Z.; Zheng, J.; Zhang, Z.; Shi, Y. Optimal planning of hybrid electric-hydrogen energy storage systems via multi-objective particle swarm optimization. Front. Energy Res. 2023, 10, 1034985. [Google Scholar] [CrossRef]
  40. He, Y.; Guo, S.; Zhou, J.; Ye, J.; Huang, J.; Zheng, K.; Du, X. Multi-objective planning-operation co-optimization of renewable energy system with hybrid energy storages. Renew. Energy 2022, 184, 776–790. [Google Scholar] [CrossRef]
  41. Wang, H.; Xie, Z.; Pu, L.; Ren, Z.; Zhang, Y.; Tan, Z. Energy management strategy of hybrid energy storage based on Pareto optimality. Appl. Energy 2022, 327, 120095. [Google Scholar] [CrossRef]
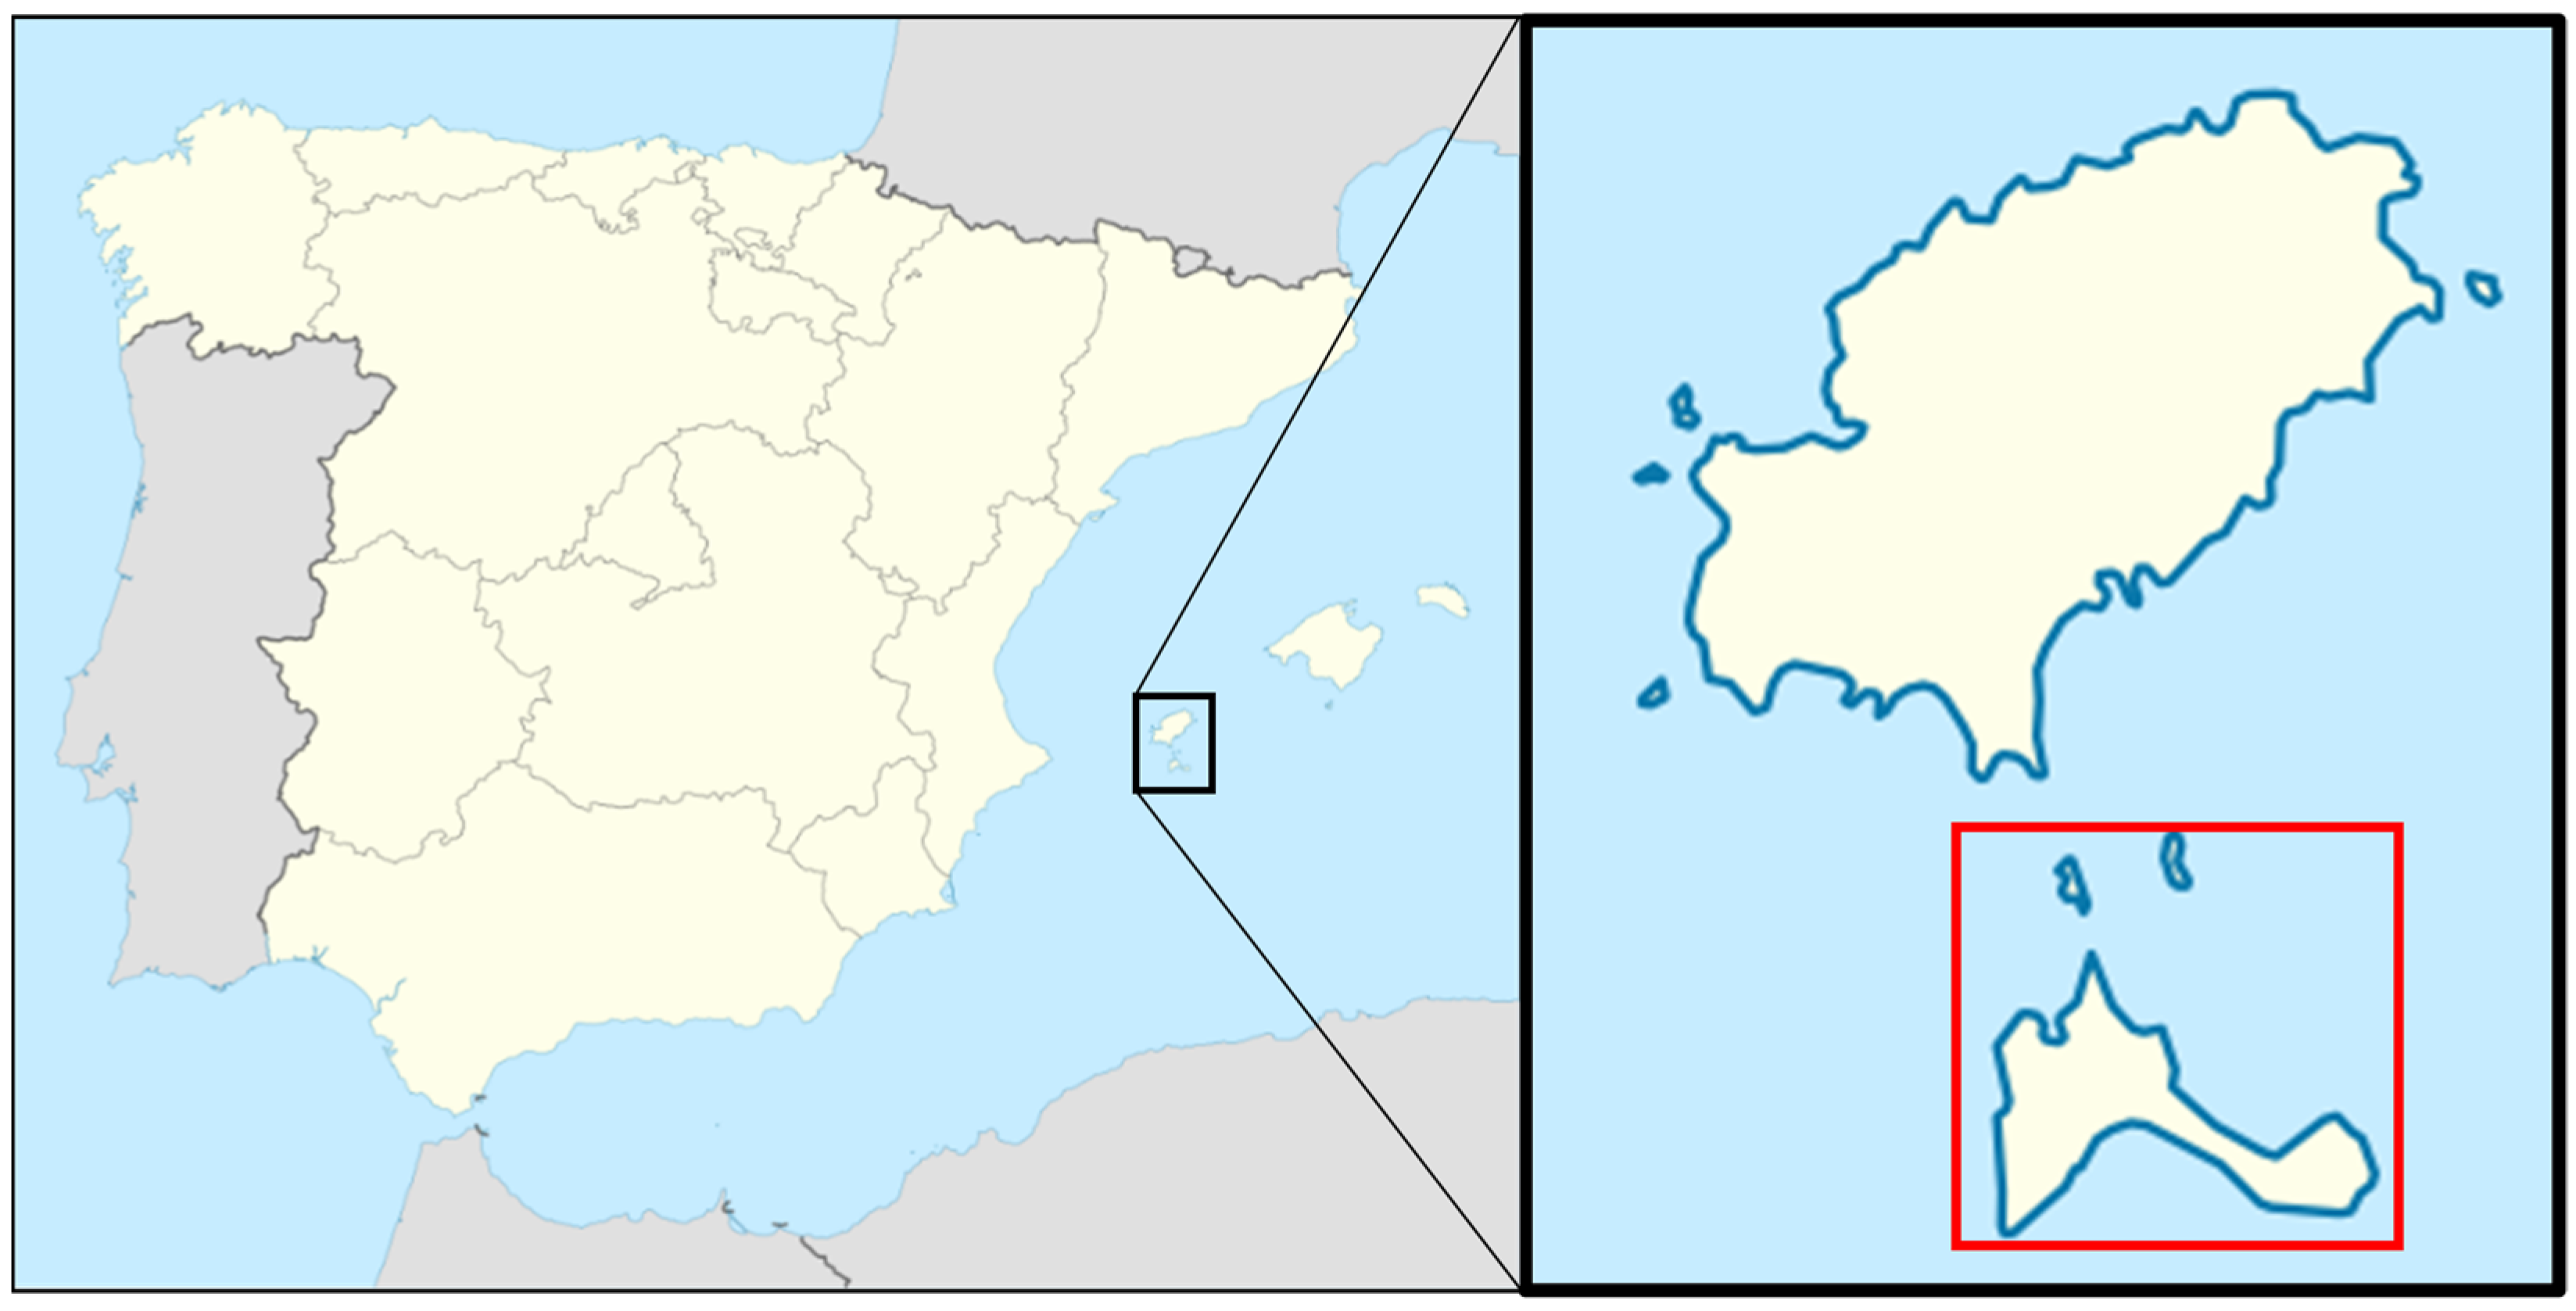
  42. ©NordNordWest. CC-BY-SA-3.0. Spain Location Map. 2008. Available online: https://en.wikipedia.org/wiki/File:Spain_location_map.svg (accessed on 30 August 2023).
  43. NASA. LARC Power Data Access Viewer; NASA: Houston, TX, USA, 2023. [Google Scholar]
  44. Farhad, A.; Ali, G.; Mohsen, J. Dataset on Hourly Load Profiles for a Set of 24 Facilities from Industrial, Commercial, and Residential Enduse Sectors; Mendeley Data; Rutgers The State University of New Jersey: New Brunswick, NJ, USA, 2020; p. 1. [Google Scholar]
  45. Pinto, E.S.; Serra, L.M.; Lázaro, A. Energy communities approach applied to optimize polygeneration systems in residential buildings: Case study in Zaragoza, Spain. Sustain. Cities Soc. 2022, 82, 103885. [Google Scholar] [CrossRef]
  46. Chung, M.; Shin, K.Y.; Jeoune, D.S.; Park, S.Y.; Lee, W.J.; Im, Y.H. Economic Evaluation of Renewable Energy Systems for the Optimal Planning and Design in Korea—A Case Study. J. Sustain. Dev. Energy Water Environ. Syst. 2018, 6, 725–741. [Google Scholar] [CrossRef]
  47. Duffie, J.; Beckman, W. Solar Engineering of Thermal Processes; Wiley: Hoboken, NJ, USA, 1991. [Google Scholar]
  48. Reda, I.; Andreas, A. Solar Position Algorithm for Solar Radiation Applications; National Renewable Energy Laboratory: Golden, CO, USA, 2008. [Google Scholar]
  49. Corke, T.; Nelson, R. Wind Energy Design; Taylor and Francis Group: Miami, FL, USA, 2018. [Google Scholar]
  50. Wood, D. Improvements to the Simplified Loads Methodology in IEC 61400-2; National Renewable Energy Laboratory: Golden, CO, USA, 2021. [Google Scholar]
  51. Draxl, C.; Clifton, A.; Hodge, B.M.; McCaa, J. The Wind Integration National Dataset (WIND) Toolkit. Appl. Energy 2015, 151, 355–366. [Google Scholar] [CrossRef]
  52. Shepherd, C.M. Design of Primary and Secondary Cells: II. An Equation Describing Battery Discharge. J. Electrochem. Soc. 1965, 112, 657. [Google Scholar] [CrossRef]
  53. Burton, T.; Sharp, D.; Jenkins, N.; Bossanyi, E. Wind Energy Handbook; John Wiley and Sons: Chichester, UK, 2001. [Google Scholar]
  54. Warner, S.; Hussain, S. The Finance Book; Pearson Education Ltd.: Harlow, UK, 2017. [Google Scholar]
  55. Jansen, G.; Dehouche, Z.; Corrigan, H. Cost-effective sizing of a hybrid Regenerative Hydrogen Fuel Cell energy storage system for remote and off-grid telecom towers. Int. J. Hydrog. Energy 2021, 46, 18153–18166. [Google Scholar] [CrossRef]
  56. Feldman, D.; Dummit, K.; Zuboy, J.; Margolis, R. Fall 2022 Solar Industry Update; National Renewable Energy Laboratory: Golden, CO, USA, 2022. [Google Scholar]
  57. Carvalho, M.; Menezes, V.L.; Gomes, K.C.; Pinheiro, R. Carbon footprint associated with a mono-Si cell photovoltaic ceramic roof tile system. Environ. Prog. Sustain. Energy 2019, 38, 13120. [Google Scholar] [CrossRef]
  58. Stehly, T.; Beiter, P.; Duffy, P. 2019 Cost of Wind Energy Review; National Renewable Energy Laboratory: Golden, CO, USA, 2019. [Google Scholar]
  59. Intergovernmental Panel on Climate Change. Climate Change 2021: The Physical Science Basis Contribution of Working Group I to the Sixth Assessment Report of the Intergovernmental Panel on Climate Change; Cambridge University Press: Cambridge, UK, 2021. [Google Scholar]
  60. Romare, M.; Dahllöf, L. The Life Cycle Energy Consumption and Greenhouse Gas Emissions from Lithium-Ion Batteries; IVL Swedish Environmental Research Institute: Stockholm, Sweden, 2017. [Google Scholar]
  61. Ballard. Fuel Cell Life Cycle Assessment, Burnaby; Ballard: Burnaby, BC, Canada, 2018. [Google Scholar]
  62. Department for Business, E.; Strategy, I. Hydrogen Production Costs; HM Government UK: London, UK, 2021. [Google Scholar]
  63. Enapter. A Small Carbon Footprint for Big Climate Impact; Enapter: Saerbeck, Germany, 2022. [Google Scholar]
  64. Reddi, K.; Elgowainy, A.; Rustagi, N.; Gupta, E. Techno-economic analysis of conventional and advanced high-pressure tube trailer configurations for compressed hydrogen gas transportation and refueling. Int. J. Hydrog. Energy 2018, 43, 4428–4438. [Google Scholar] [CrossRef]
  65. Agostini, A.; Belmonte, N.; Masala, A.; Hu, J.; Rizzi, P.; Fichtner, M.; Moretto, P.; Luetto, C.; Sgroi, M.; Baricco, M. Role of hydrogen tanks in the life cycle assessment of fuel cell-based auxiliary power units. Appl. Energy 2018, 215, 1–12. [Google Scholar] [CrossRef]
  66. Salameh, T.; Al-Othman, A.; Olabi, A.G.; Issa, S.; Tawalbeh, M.; Alami, A.H. Comparative life cycle assessment for PEMFC stack including fuel storage materials in UAE. In Proceedings of the 2020 Advances in Science and Engineering Technology International Conferences (ASET), Dubai, United Arab Emirates, 4 February–9 April 2020; pp. 1–5. [Google Scholar] [CrossRef]
  67. Deb, K.; Pratap, A.; Agarwal, S.; Meyarivan, T. A fast and elitist multiobjective genetic algorithm: NSGA-II. IEEE Trans. Evol. Comput. 2002, 6, 182–197. [Google Scholar] [CrossRef]
  68. Blank, J.; Deb, K. Pymoo: Multi-Objective Optimization in Python. IEEE Access 2020, 8, 89497–89509. [Google Scholar] [CrossRef]
  69. Wang, Z.; Rangaiah, G.P. Application and Analysis of Methods for Selecting an Optimal Solution from the Pareto-Optimal Front obtained by Multiobjective Optimization. Ind. Eng. Chem. Res. 2017, 56, 560–574. [Google Scholar] [CrossRef]
  70. Intergovernmental Panel on Climate Change. Climate Change 2014: Synthesis Report; IPCC Secretariat: Geneva, Switzerland, 2014. [Google Scholar]
  71. Hasan, T.; Emami, K.; Shah, R.; Hassan, N.; Belokoskov, V.; Ly, M. Techno-economic Assessment of a Hydrogen-based Islanded Microgrid in North-east. Energy Rep. 2023, 9, 3380–3396. [Google Scholar] [CrossRef]
  72. El Hassani, S.; Oueslati, F.; Horma, O.; Santana, D.; Moussaoui, M.A.; Mezrhab, A. Techno-economic feasibility and performance analysis of an islanded hybrid renewable energy system with hydrogen storage in Morocco. J. Energy Storage 2023, 68, 107853. [Google Scholar] [CrossRef]
  73. Alluraiah, N.C.; Vijayapriya, P. Optimization, Design, and Feasibility Analysis of a Grid-Integrated Hybrid AC/DC Microgrid System for Rural Electrification. IEEE Access 2023, 11, 67013–67029. [Google Scholar] [CrossRef]
  74. Pai, P.F.; Acakpovi, A.; Adjei, P.; Nwulu, N.; Asabere, N.Y. Optimal Hybrid Renewable Energy System: A Comparative Study of Wind/Hydrogen/Fuel-Cell and Wind/Battery Storage. J. Electr. Comput. Eng. 2020, 2020, 1756503. [Google Scholar] [CrossRef]
  75. Temiz, M.; Dincer, I. Development of solar and wind based hydrogen energy systems for sustainable communities. Energy Convers. Manag. 2022, 269, 116090. [Google Scholar] [CrossRef]
Figure 1. Formentera Island, highlighted in red, is located east of the Spanish mainland in the Mediterranean [42].
Energies 16 07363 g001
Figure 2. Renewable energy community system architecture. The community buildings grouped on the left are connected virtually to the distributed generation and storage assets, which are also able to export to the local power grid.
Energies 16 07363 g002
Figure 3. Building electrical energy service demand model based on the requirements of the renewable energy community. Figure 3b displays the average daily power demand curves of the different building types within the model.
Energies 16 07363 g003
Figure 4. Temperature and solar conditions over a one-year period at the island location. The weather conditions are assumed to remain constant year-on-year through the lifetime of the system.
Energies 16 07363 g004
Figure 5. Wind model input assumptions are primarily a combination of standardised wind turbine power coefficients and the load wind speed data measured at 10 m above sea level.
Energies 16 07363 g005
Figure 6. Energy management strategy of the hybrid storage system.
Energies 16 07363 g006
Figure 7. Hybrid energy system model approach with multi-objective optimisation algorithm NSGA-II solving process.
Energies 16 07363 g007
Figure 8. Convergence of the optimisation pareto front as shown by an aggregated scalar objective function minimising towards a single value.
Energies 16 07363 g008
Figure 9. Key outputs from the multi-objective optimisation process, indicating relationship between cost reduction and climate impact of the system design.
Energies 16 07363 g009
Figure 10. Energy generation hour-by-hour breakdown by source. Example shown includes typical summer and winter weeks.
Energies 16 07363 g010
Figure 11. The present value over the project period. The system was primarily compared with a ’business-as-usage’ grid-only scenario.
Energies 16 07363 g011
Figure 12. The present value over project period compared with the ’business-as-usual’ grid-only scenario.
Energies 16 07363 g012
Table 1. Total annual electrical consumption for each member of the renewable energy community.
Annual Consumption
Community centre66,500
Elementary school19,200
High school46,200
Government offices28,900
3× Residential units12,000
Table 2. Hybrid renewable energy system design input assumptions across the different included technologies.
PV Solar
Panel Power (W)400
Panel Area (m2)2
Thermal Coefficient (%/°C)−0.3
NOCT (°C)42
Lifetime (years)20
Wind turbine
Hub Height (m)20
Roughness Height (m)0.05
Lifetime (years)20
Lithium battery
Total Efficiency (%)95
Maximum Cycles8000
Maximum Age (years)10
Regenerative hydrogen fuel cell
Fuel Cell Efficiency (%)46
Electrolyser Efficiency (%)68
Lifetime (years)20
Table 3. Hybrid renewable energy system economic and climate impact assumptions for the different modelled technologies.
TechnologyCAPEXOPEXLifetimeEmissions
Embedded
PV Solar Array [55,56,57]2500 EUR/kW30
EUR/kW/year
20 years1826
kgCO2e/kW
Wind Turbine
[58,59]
2850 EUR/kW32
EUR/kW/year
20 years520 kgCO2e/kW
Lithium-Ion LFP
[18,60]
328 EUR/kWh5
EUR/kWh/year
10 years or 8000
cycles
254
kgCO2e/kWh
PEM Fuel Cell
[18,61]
1200 EUR/kW13
EUR/kW/year
20 years73.3
kgCO2e/kWh
AEM
Electrolyser [18,62,63]
1500 EUR/kW14
EUR/kW/year
20 years or 35,000 h239
kgCO2e/kWh
Hydrogen Storage Vessel [64,65,66]30 EUR/kWh-20+ years5.1
kgCO2e/kWh
Table 4. Initialisation parameters and constraints of the NSGA-II optimisation algorithm.
ParameterValue
Population Size72
No. of Offspring24
Max No. of Generations400
Lower Bounds (all assets)0 kW/kWh
Upper Bounds (all assets)200 kW/kWh
Table 5. Optimal installed capacities of the energy system assets.
REC AssetOptimal Values
PV Solar71 kW
Wind Turbine(s)32 kW
Lithium Battery14 kWh
PEM Fuel Cell20 kW
AEM Electrolyser18 kW
Table 6. The economic and environmental performance of the different REC assets in the optimal design configuration.
Technology AssetEnergy-Delivered (kWh)Capacity-Factor (%)CAPEX (EUR)OPEX
(EUR/year)
LCOE
(EUR/kWh)
Emissions (gCO2e/kWh)
PV Solar
[71 kW]
141,18419177,50021300.0740.7
Wind
Turbine(s)
[32 kW]
60,5172291,20010240.0915.9
Lithium
Battery [14 kWh]
4910854463080.0872.4
Hydrogen
System [1836 kWh]
26,36015106,0005700.1718.6
Table 7. Quantity of energy delivered to the REC compared with the quantity of energy delivered from the grid.
REC MemberREC Delivered (kWh)Grid Delivered (kWh)
Community centre61,0785461
Elementary school18,807348
High school44,7431437
Council offices28,244683
Residential units11,975514
Table 8. Comparison REC configurations for extreme cases for net savings and decarbonisation potential compared with the chosen nominal case.
Best Net SavingsNominalBest Emissions Savings
REC Delivered (kWh)151,493156,536158,823
Self-Consumption (%)91.094.596.2
LCOE (EUR/kWh)0.150.160.19
Net Savings (EUR)187,080178,229139,647
Savings (%)514736
IRR (%)12.610.97.1
Simple Payback (%)10.19.68.0
Payback Term (years)8.39.011.5
Emissions796961
(gCO2e/kwh)
Decarbonisation (%)75.678.881.2
Table 9. Comparison of the levelized cost of electricity results of similar hybrid hydrogen smart grid systems within the literature.
ReferenceSmart Grid ArchitectureAssetsLocationScaleLCOE
(EUR/kWh)
This workEnergy communitySolar, wind, battery/RHFCFormentera, Spain<100 kW0.15
[55]DC microgridSolar, battery/RHFCSub-Saharan <100 kW0.16
[72]AC microgridSolar/wind, genset/RHFCMorocco<1 MW0.07
[73]AC microgridSolar/wind, hydrogenIndia<1 MW0.08
[74]Energy communitySolar/wind, battery/RHFCGhana<100 kW0.26
[75]Energy communitySolar/wind, hydrogenCanada>1 MW0.08
Disclaimer/Publisher’s Note: The statements, opinions and data contained in all publications are solely those of the individual author(s) and contributor(s) and not of MDPI and/or the editor(s). MDPI and/or the editor(s) disclaim responsibility for any injury to people or property resulting from any ideas, methods, instructions or products referred to in the content.

