Abstract
The carbon capture, utilization and storage (CCUS) technique is widely applied in order to solve energy shortages and global warming, in which CO2 storage plays an important part. Herein, the CO2 storage in reservoir pores with a dead-end is investigated using a molecular dynamics simulation. The results indicate that, when a CO2 molecule flows through a reservoir pore towards its dead-end, it is readily captured inside said dead-end. When the pressure difference of the CO2 injection increases, the transport speed of the CO2 becomes faster, and the storage efficiency increases. The rate constants for the absorption of the carbon dioxide at 5 MPa, 10 MPa, and 15 MPa are 0.47 m/s, 2.1 m/s, and 3.1 m/s. With the same main channel, a narrower dead-end with less oil molecules would cause a smaller spatial potential resistance, which would lead to a faster CO2 replacement and storage process. The 3 nm main channel with a 1.5 nm dead-end model had the highest absorption rate of 5.3 m/s out of the three sets of models with different dead-ends. When the dead-end’s width was constant, the rate constants for the absorption of carbon dioxide in the 6 nm main channel with a 1.5 nm dead-end model was 1.8 m/s, which was higher than that of the 3 nm–1.5 nm model. This study investigates the mechanism of CO2 storage in reservoir pores with a dead-end at the molecular level and provides a scientific basis for the practical application of CO2 storage.
1. Introduction
The continuous development of the global economy has caused an increasing consumption of energy resources derived from fossil fuels. Abusing the use of these carbon-based substrates has resulted in extensive CO2 emissions, which have led to severe environmental problems such as air pollution and the greenhouse effect [1]. CO2 sequestration is a way of storing CO2 for a long period of time either underground or in other storage media, aiming to reduce CO2 emissions and combat climate change [2,3]. For example, geological storage consists in the injection of CO2 gases into underground reservoirs, where the presence of a sealing layer prevents the leakage of the CO2 and allows its long-term storage [4]. Oceanic storage involves injecting CO2 gases into the ocean, where the CO2 can be stored in the form of hydrates, and, as the ocean has a large absorptive capacity, this method can reduce the atmospheric CO2 concentration up to a certain extent [5]. In addition, CO2 can be made to react with minerals to form stable carbonate minerals [6]. This process can permanently sequester CO2 on a geological time-scale but, currently, still faces technical and economic challenges. Among the above-mentioned methods, geological storage is currently relatively well-developed and considered an important technology for climate change mitigation. Despite its challenges, such as the diversity of geological conditions and the feasibility of finding suitable reservoirs and ensuring stable, long-term storage of the gas, subsurface storage is still seen as one of the important tools for reducing atmospheric CO2 concentrations [7]. CO2-enhanced oil recovery (CO2-EOR) is a commercially viable option for CO2 sequestration because the EOR technology is mature and a portion of the injected CO2 will be left behind after the breakout. Reservoirs are also good options because there are large amounts of geological data from past exploration and production operations and the field infrastructure already exists. In addition, enhanced oil recovery through CO2 injection can compensate the cost of CO2 injection [8,9,10]. Therefore, it is essential to develop an efficient method for capturing CO2 in the atmosphere, as well as making full use of it. To this end, carbon capture, utilization and storage (CCUS) technologies have been brought up and have attracted a lot of attention worldwide. Among the various CCUS technologies, CO2-enhanced oil recovery (CO2-EOR) and CO2 geological storage (CO2-GS) are the two main strategies that have been widely used in the oil industry to enhance oil recovery and sequester CO2 in geological formations [11,12,13].
Oil recovery in reservoirs requires a displacing component to drive the crude oil off to the wellhead [14]. This is usually achieved using water, gas, or a chemical injection [15]. Among them, CO2 can enter a supercritical state in a reservoir and dissolve into the crude oil [16,17].
Kang et al. quantitatively characterized the density distribution of dissolved CO2 in crude oil, revealing the mechanisms of CO2 dissolution and diffusion leading to crude oil swelling and an improved crude oil mobility [18]. As a result, the physicochemical properties of the oil are changed, with its viscosity being decreased, its flooding pressure being increased, and its mobility being enhanced, forming a concentrated oil bank that is swept into producing wells with an improved recovery ratio [19,20]. On the other hand, the as-used CO2 has been successfully injected and buried in the reservoirs thus far [21,22]. The effectiveness of CO2 flooding is heavily dependent on its behavior in the subsurface reservoir, where the interaction between the CO2 and the reservoir’s fluids can alter the fluids’ flow and distribution performance, thus affecting their efficiency [23]. Therefore, it is important to investigate the mechanisms of CO2 flooding and storage in different reservoirs.
Recently, shale has been regarded as a prominent, unconventional resource, with vast reserves of crude oil. However, unlike traditional reservoirs, shale is a type of sedimentary rock consisting of a mixture of muddy or silt particles, organic matter, and cementitious impurities, etc. [24]. Therefore, shale rock is filled with well-developed nanopores of sizes ranging from a few to tens of nanometers, which have an extremely low porosity and exhibit CO2 permeability [25,26,27]. Due to their tiny size, strong oil adsorption capacity, and high density, these pores play an important role in shale oil and shale gas exploration and development [28,29,30]. In the late stage of an oil drive, the distribution of the residual oil shows the characteristics of overall dispersion and local enrichment; the oil phase mainly exists in micro/nanopores and presents a discontinuous state. Among these nanopores, a large number of dead-end structures caused by compaction and cementation have been characterized [31]. Because these dead-ends cannot be connected to other pores in the network [32], when large numbers of dead-end pores exist, the permeability of the reservoir will be reduced, and the transport of fluids (such as oil and gas) will be impeded [33]. Ergo, the critical influence of dead-end pores in making shale reservoirs less permeable has significantly limited the amounts of recoverable resources, as well as the recovery efficiency. At the same time, these dead-ends provide a relatively enclosed space, which prevents the CO2 gas from leaking or spreading elsewhere. This helps one to ensure that the CO2 is stably stored in the formation for a long period of time, preventing it from entering the atmosphere and negatively affecting the environment [34]. A well-designed dead-end containment can ensure that the stored CO2 will not be released for decades, or even longer. Therefore, it is crucial to understand the microscopic role of fluids within dead-end pores’ spaces to propose effective CO2-EOR and CO2-GS strategies [35].
Compared to experimental approaches, theoretical methods have been considered a more practical and efficient way to investigate the mechanisms of CO2-EOR and CO2-GS at a low cost. Thereby, many theoretical studies have been carried out, focusing on the flow pattern and distribution of CO2 under different conditions in shale rocks [36,37]. Nielsen et al. investigated the interfacial tension changes between CO2 and brine phases in aquifers at different pressures below the critical CO2 pressure and, thus, having a major impact on the CO2 storage capacity and seal integrity of subsurface reservoirs [38]. Zhao et al. investigated the countercurrent diffusion of hydrocarbons and CO2 in the casein of shale formations from a molecular point of view, analyzed the different type of interactions between the casein and the CO2, and found that the casein with a higher number of benzene molecules had a larger specific surface area and a greater CO2 storage capacity [39]. Zhang et al. investigated the adsorption behaviors of CO2 in the dry and partially water-saturated kaolinite nanopores on two different substrates. The presence of water reduced the CO2 adsorption in the kaolinite pores and affected their CO2 sequestration [40]. Fang et al. investigated the dynamic mixing of CO2 and oil phases within rough walls, where the CO2 extraction capacity decayed with increasing injection pressure. The results indicate that this effect on the residual oil in the tank varied when the surface structure of the rock changed [41]. Chang et al. investigated the mechanisms of different nanofluids in EOR. Compared to hydrophilic nanofluids, which can promote oil recovery, hydrophobic nanofluids find it difficult to repel residual oil and tend to block channels [42]. Only recently, a few works have concentrated on the influence of dead-end pores on CO2-EOR. Lu et al. studied the influence of the trough’s width and depth and discovered that, as the trough became deeper, the displacement summit of the CO2 changed from a concave meniscus to a convex meniscus, indicating more trapped oil in the dead-end pores and a lower recovery [43]. Luan et al. discovered the hindering effect of water in the pore space of the water-bearing dead-end pore on the CO2’s displacement and revealed the relationship between the rupture time of water film and recovery efficiency [44,45]. However, the influence of the injection pressure, the width of a pore’s dead-end, and the width of the main channels on CO2-EOR and CO2-GS strategies in shale reservoirs remain to be uncovered.
Herein, molecular dynamics simulations were applied to study the microscopic behavior of fluids during CO2 oil recovery and sequestration in rough quartz nanopores representing shale rocks. The motion characteristics of the CO2 molecules in the dead-end pores were analyzed to reveal the flow behavior of the CO2 in the dead-end of the pores. And, by varying the injection pressure and rock structure, the effect of the pressure and of the pore structure on the CO2’s sequestration were investigated. This study provides new insights into CO2 flow and distribution during CO2 flooding and storage in shale pores, which have a great practical value for the design and optimization of future CCUS projects.
2. Models and Methodology
2.1. Modeling
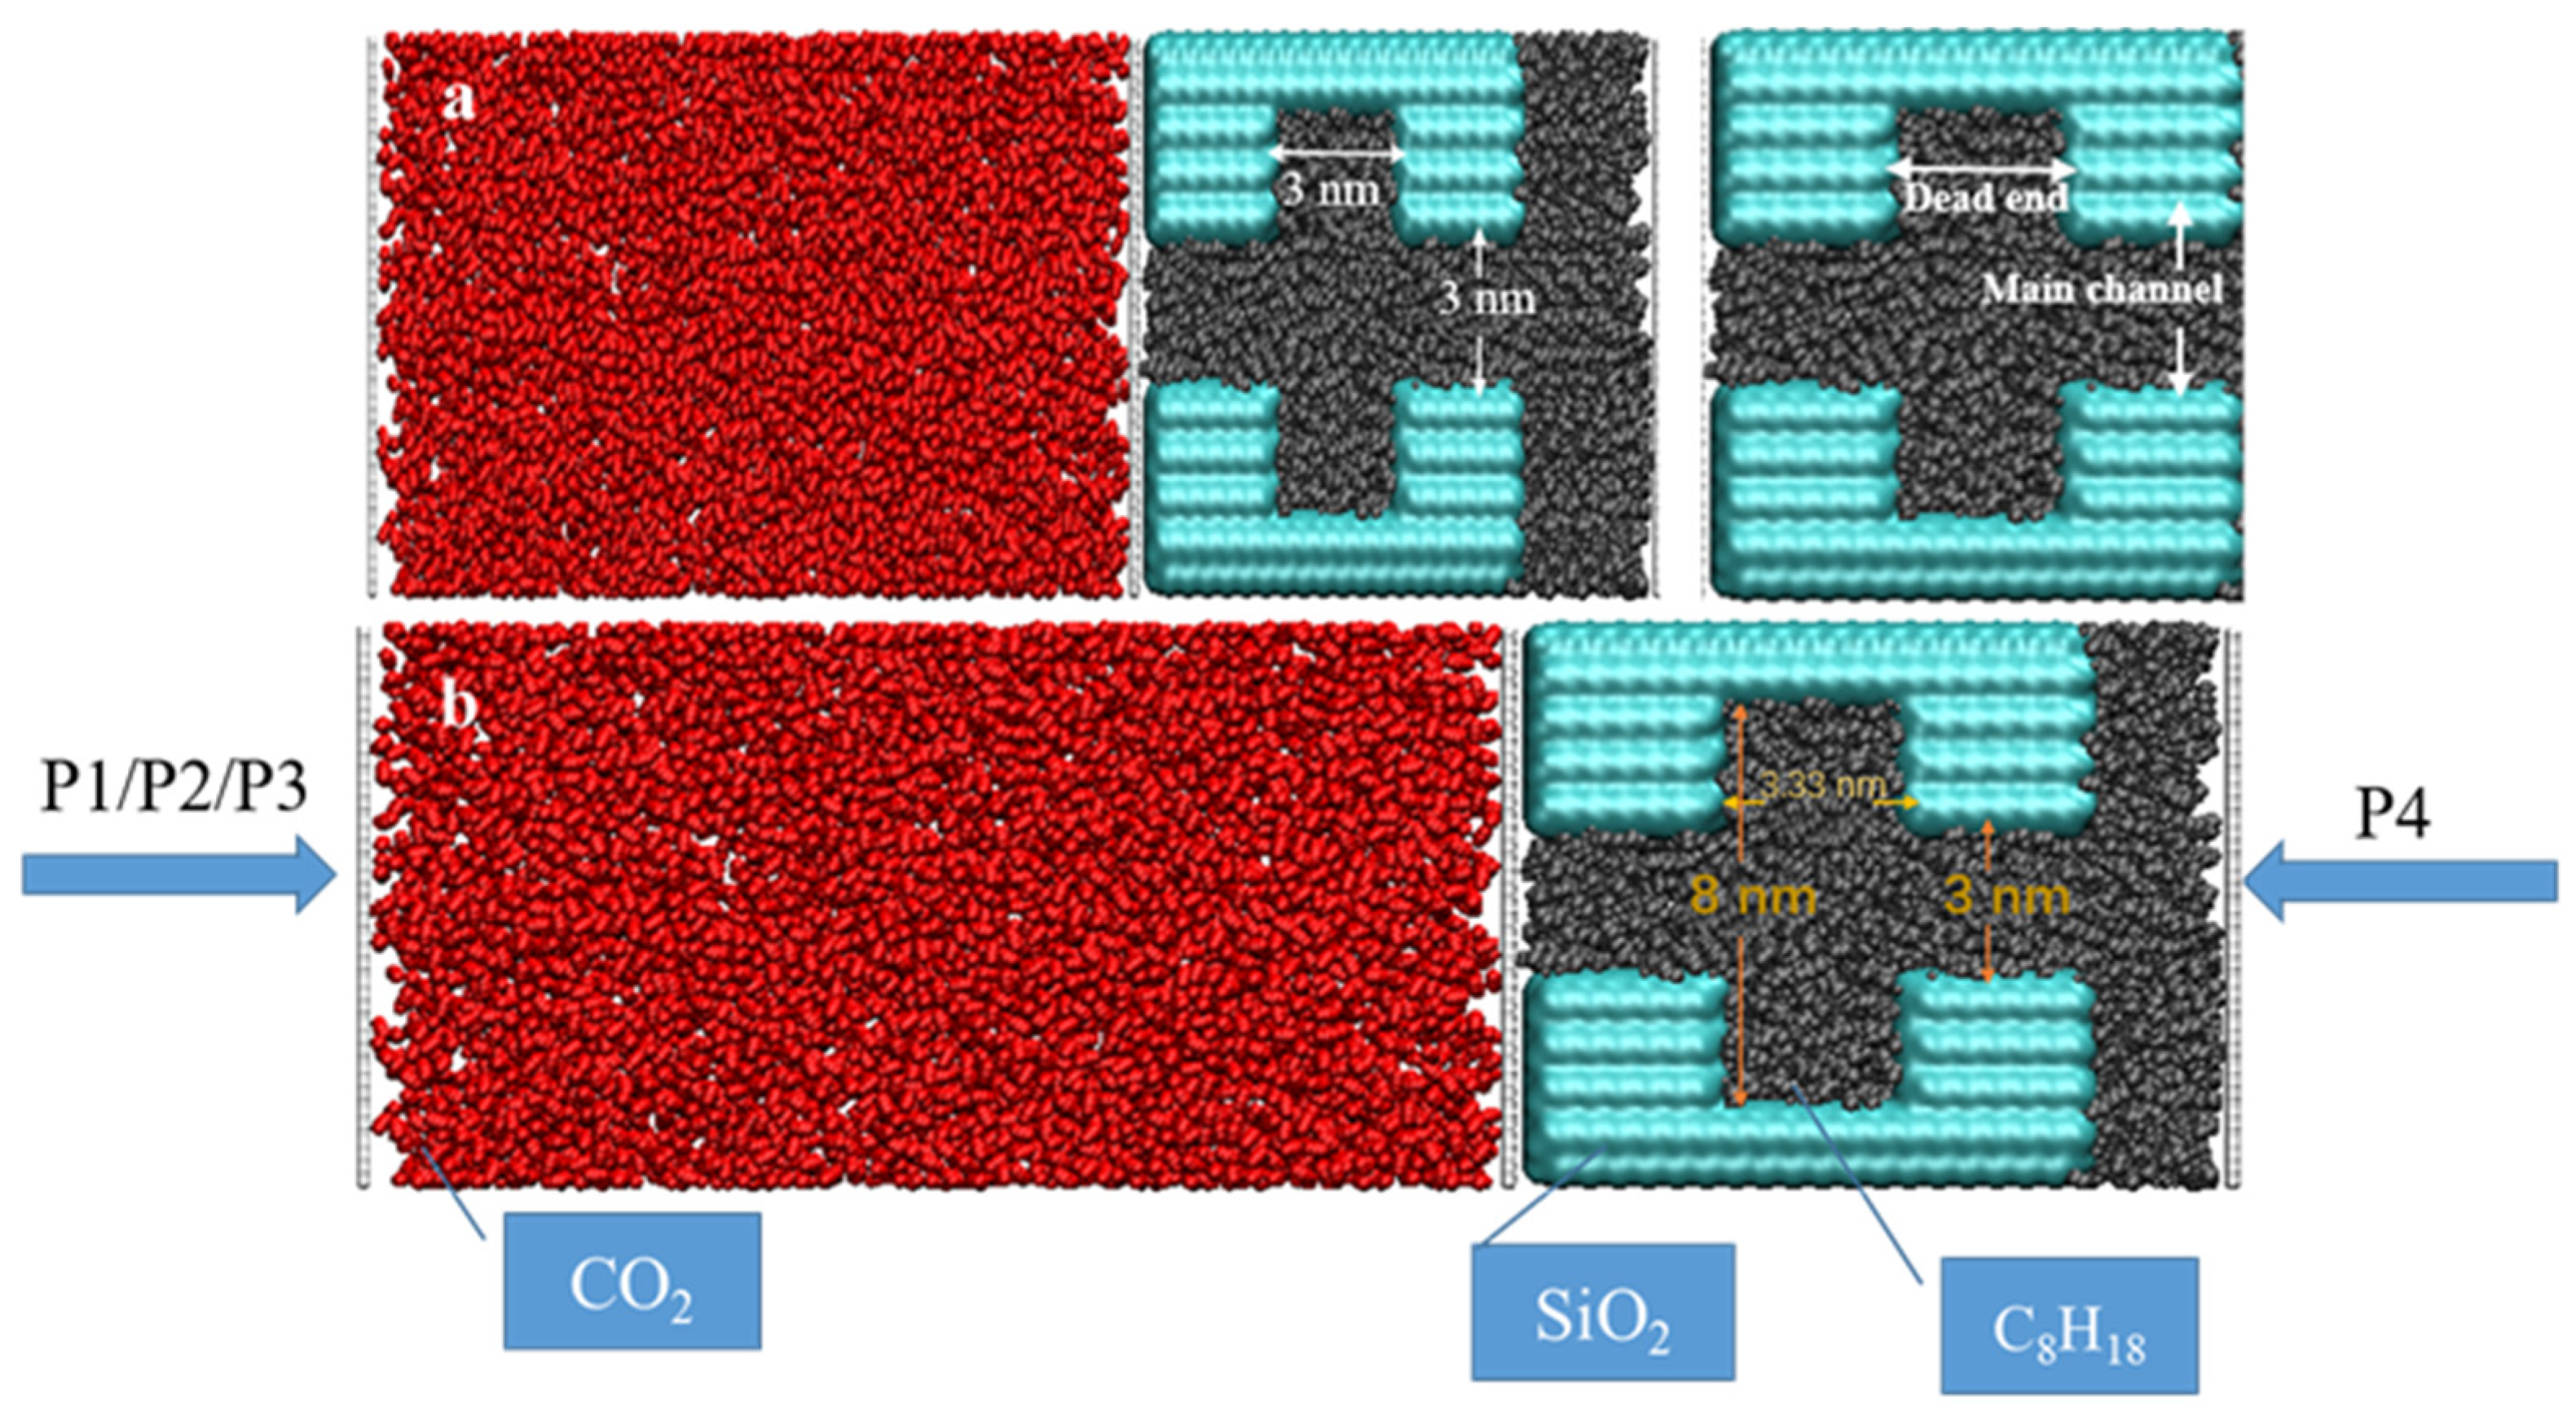
Quartz is one of the most typical and important mineral components of shale formations [46] and is commonly used to study the transport, adsorption, and migration characteristics of fluids in nanopores [47]. Therefore, in this paper, fractured pores consisting of quartzite walls are constructed to represent shale’s geological conditions and are defined as rigid pores. The walls were constructed using α-squaredite cut along the (010) crystallographic direction. Complete hydroxylation was achieved by attaching an H-atom to each O-atom on the surface [48]. Various models of petroleum pores and dead-ends were developed to investigate the effects of different pressures, widths of dead-ends, and sizes of main channels on CO2 sequestration. The first model was constructed using a main channel which was 3 nm wide, a dead-end which was 2.5 nm deep and 3.33 nm wide, and three sets of pressures (5 MPa, 10 MPa, and 15 MPa) to investigate the displacement efficiency at different pressures. The second group of models was constructed using a main channel measuring 3 nm and dead-end channels measuring 1.5 nm, 3 nm, and 6 nm in width, respectively, to study the effect of the dead-end’s width on CO2 sequestration; the third batch was constructed using main channels measuring 6 nm and 3 nm and dead-ends measuring 1.5 nm, 3 nm, and 6 nm to compare the effect of the main channel’s width on CO2 sequestration. An octane was used to represent crude shale oil and was randomly placed in the pore space. The stable distribution of the octane in the pore space was obtained using equilibrium molecular dynamics (EMD) simulations for 3 ns. The temperature was controlled at 333 K using a Nose–Hoover thermostat [49], and the system pressure was set to 20 MPa.
In order to investigate CO2 sequestration in the different systems, 3 ns EMD simulations were performed in separate spaces to construct the CO2 structure on the left side of the quartz pore (Figure 1). A sufficient amount of CO2 molecules were placed on the left side of the entrance to the main channel, and the temperature and pressure conditions were set to 333 K and 20 MPa. The CO2 injection process was simulated using the differential pressure method, with system I applying pressures of P1 (25 MPa), P2 (30 MPa), and P3 (35 MPa) to the left side of the He plate, respectively, while a contradictory pressure of P4 (20 MPa) was employed along the x-axis on the He plate, in the very right side of the model. In systems II and III, the pressure P1 was applied on the left-hand side of the He plate, and P4 was set on the right side. Non-equilibrium molecular dynamics (NEMD) methods were carried out to simulate CO2 injection in different shale pore spaces.
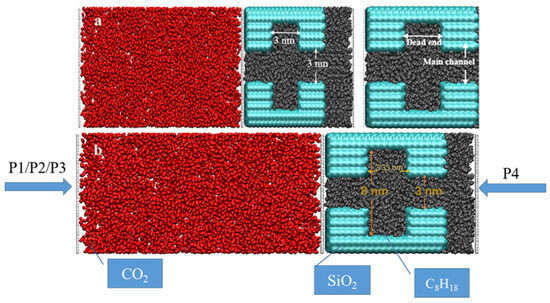
Figure 1.
Snapshots of the initial structure of the displacement model: (a) different structures system and (b) differential pressure system.
2.2. Simulation Details
Simulation is the process of modelling the motion and behavior of a molecular system by solving the equations of motion of the molecules. Its governing equations are based on Newton’s second law:
where F is the force acting on the molecule; m is the mass of the molecule, and a is the acceleration of the molecule. The molecule updates its velocity and position at each time-step according to this equation.
The all-atom force field (OPLS-AA) [50] is used to describe the octane molecules because of its ability to accurately describe the thermodynamic and structural properties of alkanes. The CO2 molecules are described with the (EPM2) force field [51], which accurately reproduces the critical point and properties of a CO2 molecule. The (ClayFF) force field is used to simulate the quartz pores [52], and the periodic boundary conditions are applied to all the models in the Y-direction for a wide range of applications in quartz wall simulations [53].
where and represent the charges of atoms i and j, respectively; represents the permittivity of the vacuum, and represents the distance between the atoms i and j. In this simulation, the non-bonding interactions are based on the Lennard-Jones (LJ) potential [54].
where represents the depth of the Leonard-Jones well between the atoms i and j, and represents the zero potential distance. For different types of atoms, the Lorentz–Berthelot mixing rule determines the way they interact with each other [55].
All the MD simulations were carried out using the (LAMMPS) software with a time-step of 1 fs. The EMD simulations were carried out in an NPT integration and the NEMD simulations in an NVT integration. The dynamic processes were visualized using the VMD software. The specific implementation details are shown in the Supporting Information in Tables S1–S3.
3. Results and Discussion
The snapshot in Figure 2 presents a typical initial displacement process of supercritical CO2 and oil. The initial configuration shows that the oil fills the dead-end and main channels, while the CO2 molecules are randomly distributed outside the octane system. By designing different dead-ends and pore widths, the mechanism of CO2 embedding in them can be deeply explored and optimized.

Figure 2.
Initial screen snapshots(Red for carbon dioxide Black for oil Blue for quartz pores).
3.1. Size of the Dead-End
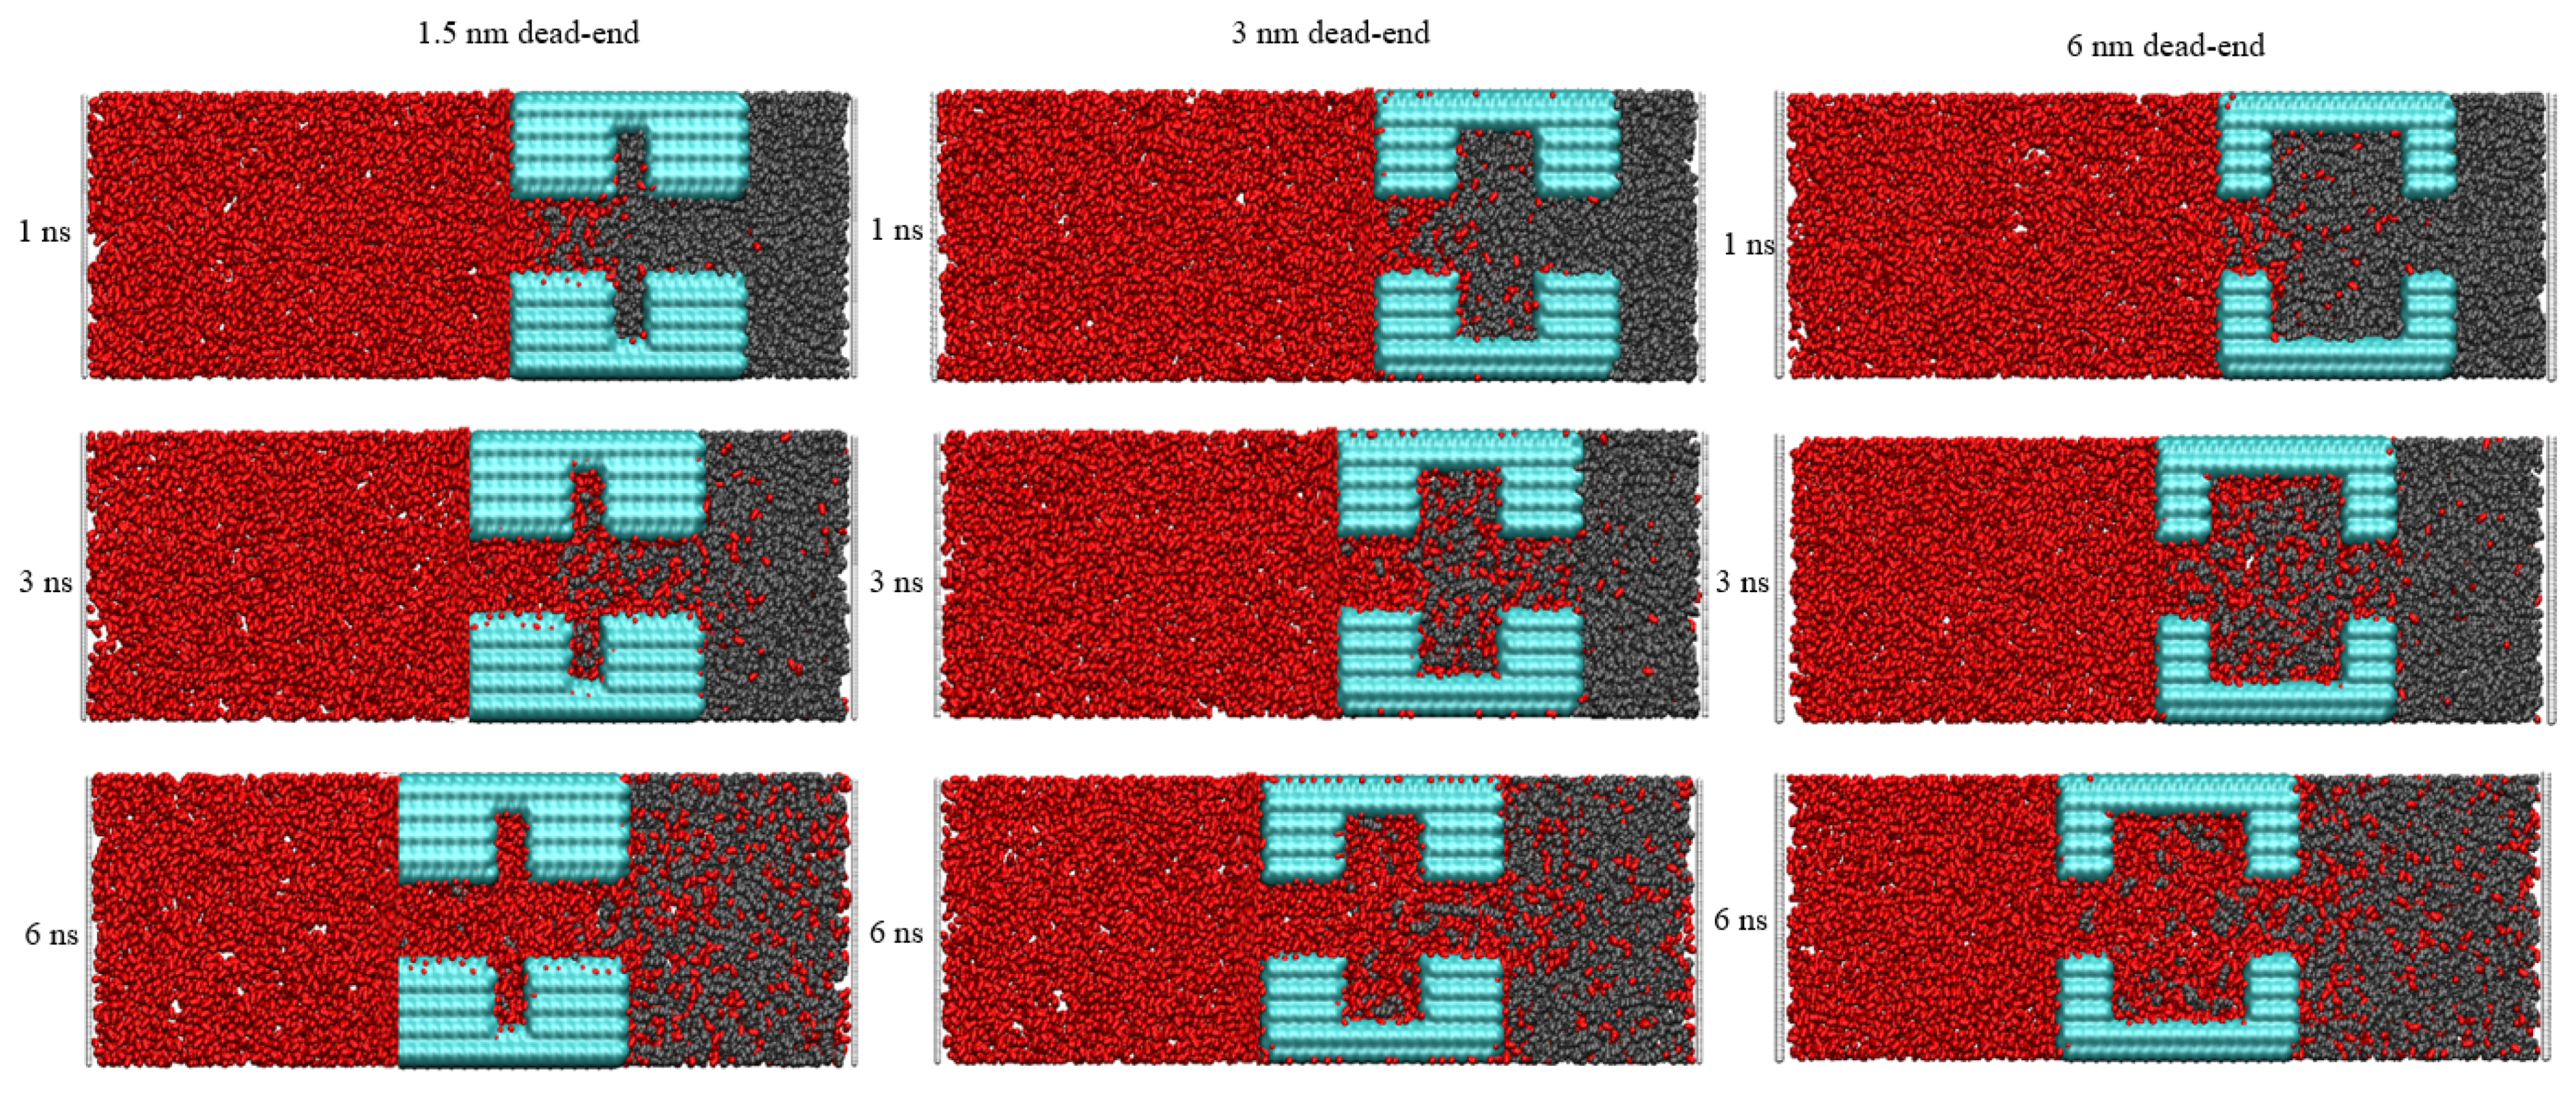
To dig into the influence of pore structure on CO2 sequestration, the effect of different dead-ends on CO2 burial were investigated. In Figure 3, snapshots at different times are shown to reveal the burial process. During the injection, the CO2 exhibits an excellent ability to strip the oil molecules from the wall. The 1.5 nm sized dead-end shown in Figure 2 is too narrow and stores the least amount of oil molecules. Because the middle region of the 1.5 nm dead-end has fewer oil molecules, meaning it provides less obstruction to the CO2, the injected CO2 forms a coherent and thick adsorption layer in the main channel. At the same time, the oil molecules in the dead-end can be dissolved in the CO2, a process which completes the burial of the CO2 more rapidly in the dead-end. And, the larger pore size makes it easier for the CO2 to enter the 3 nm and 6 nm dead-ends. However, since more oil molecules are stored in the dead-ends, a longer time is required to complete the replacement of the oil with the CO2. In the different dead-ends, the flow of the oil and CO2 are very different. Obvious vortex motions exist in the 3 nm and 6 nm dead-ends but are not seen in the 1.5 nm dead-end. As shown in Figure 3, the CO2 first separates the oil into more pieces, and these small fractions of oil are then displaced from the dead-end faster by the subsequent, incoming CO2, a process which is more obvious in the 6 nm dead-end.
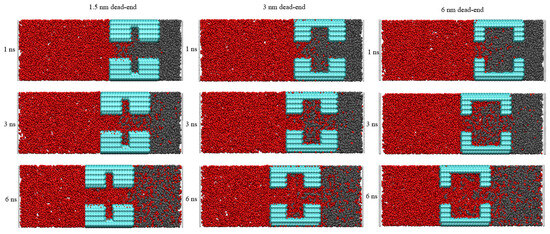
Figure 3.
Snapshots of the CO2’s oil-stripping action in different-sized dead-ends. (Red for carbon dioxide Black for oil Blue for quartz pores).
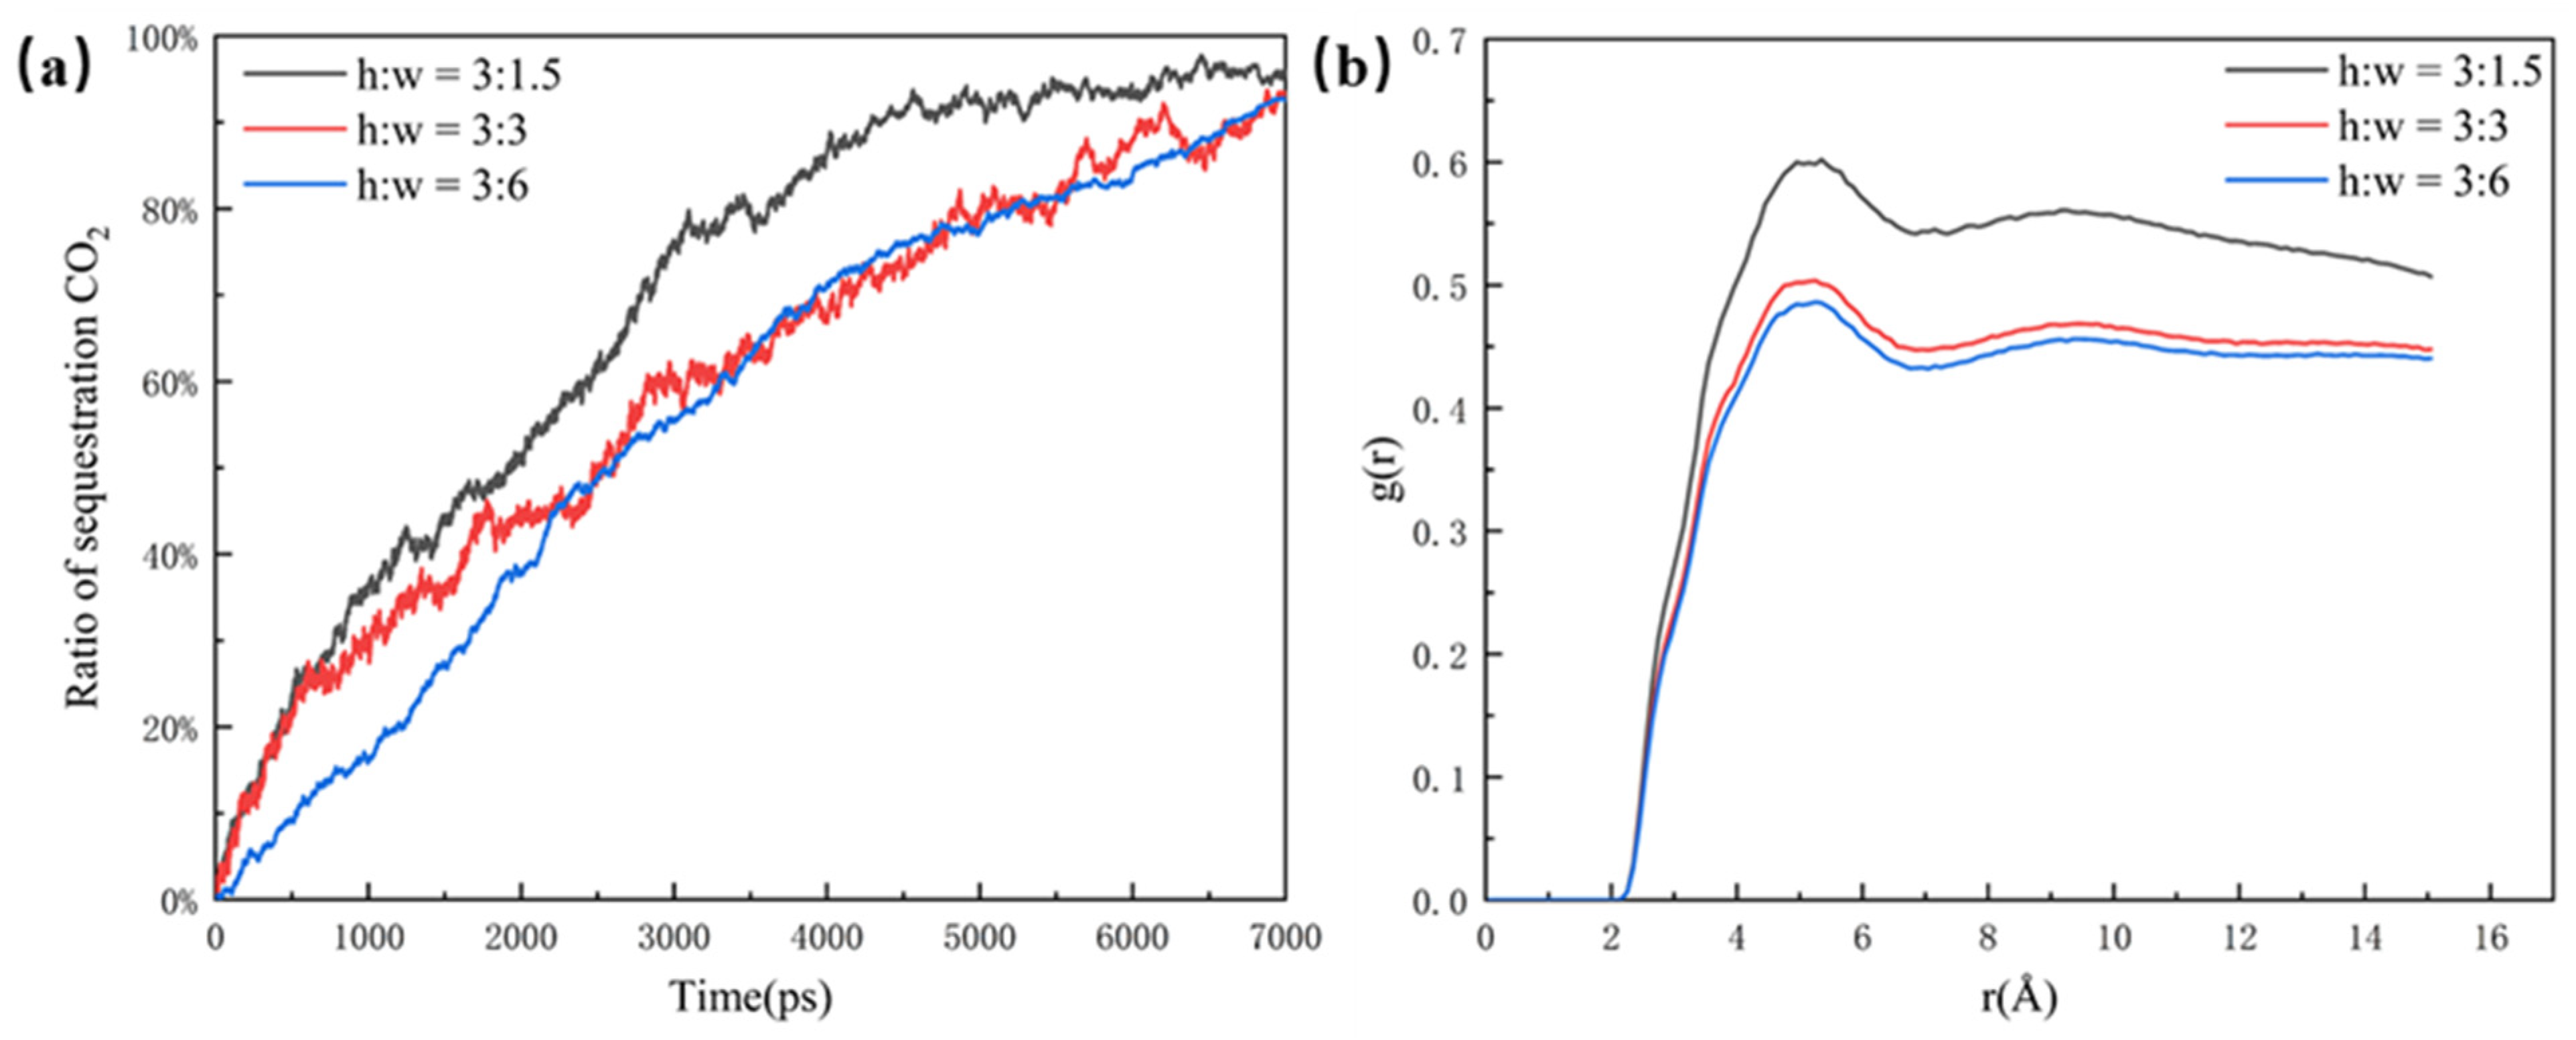
As shown in Figure 4a, the CO2 sequestration ratio is used in this paper to illustrate the effect of different pores on CO2 sequestration efficiency. Although the CO2 molecules can enter the 6 nm dead-end faster, the efficiency of the overall sequestration for the 3 nm dead-end and the 6 nm dead-end are almost the same. This is because more oil molecules in the 6 nm dead-end make it slower for the CO2 molecules to fill the whole pore structure. In comparison, the 1.5 nm dead-end has the highest sequestration efficiency and CO2 ratio, reaching the highest point of around 95% at about 4500 ps. The clear difference between the 1.5 nm dead-end and the other two groups is mainly due to the small size and low spatial potential resistance of the 1.5 nm dead-end, which has less influence on the CO2’s sequestration and oil’s displacement in the pore. The radial distribution function of the 1.5 nm dead-end in Figure 4b is significantly larger than that of the other two groups, which indicates that the smaller the dead-end, the better the mixing. The better mixing of the two phases results in the faster migration of the oil molecules, thus leading to a higher efficiency of CO2 sequestration.
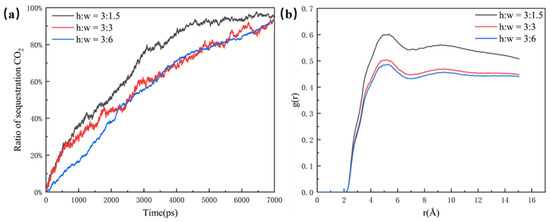
Figure 4.
(a) Ratio of sequestration of CO2 in the pore at a closed pore size of 1.5 nm, 3 nm, and 6 nm and (b) radial distribution function in the pore at a closed pore size of 1.5 nm, 3 nm, and 6 nm, at the same time.
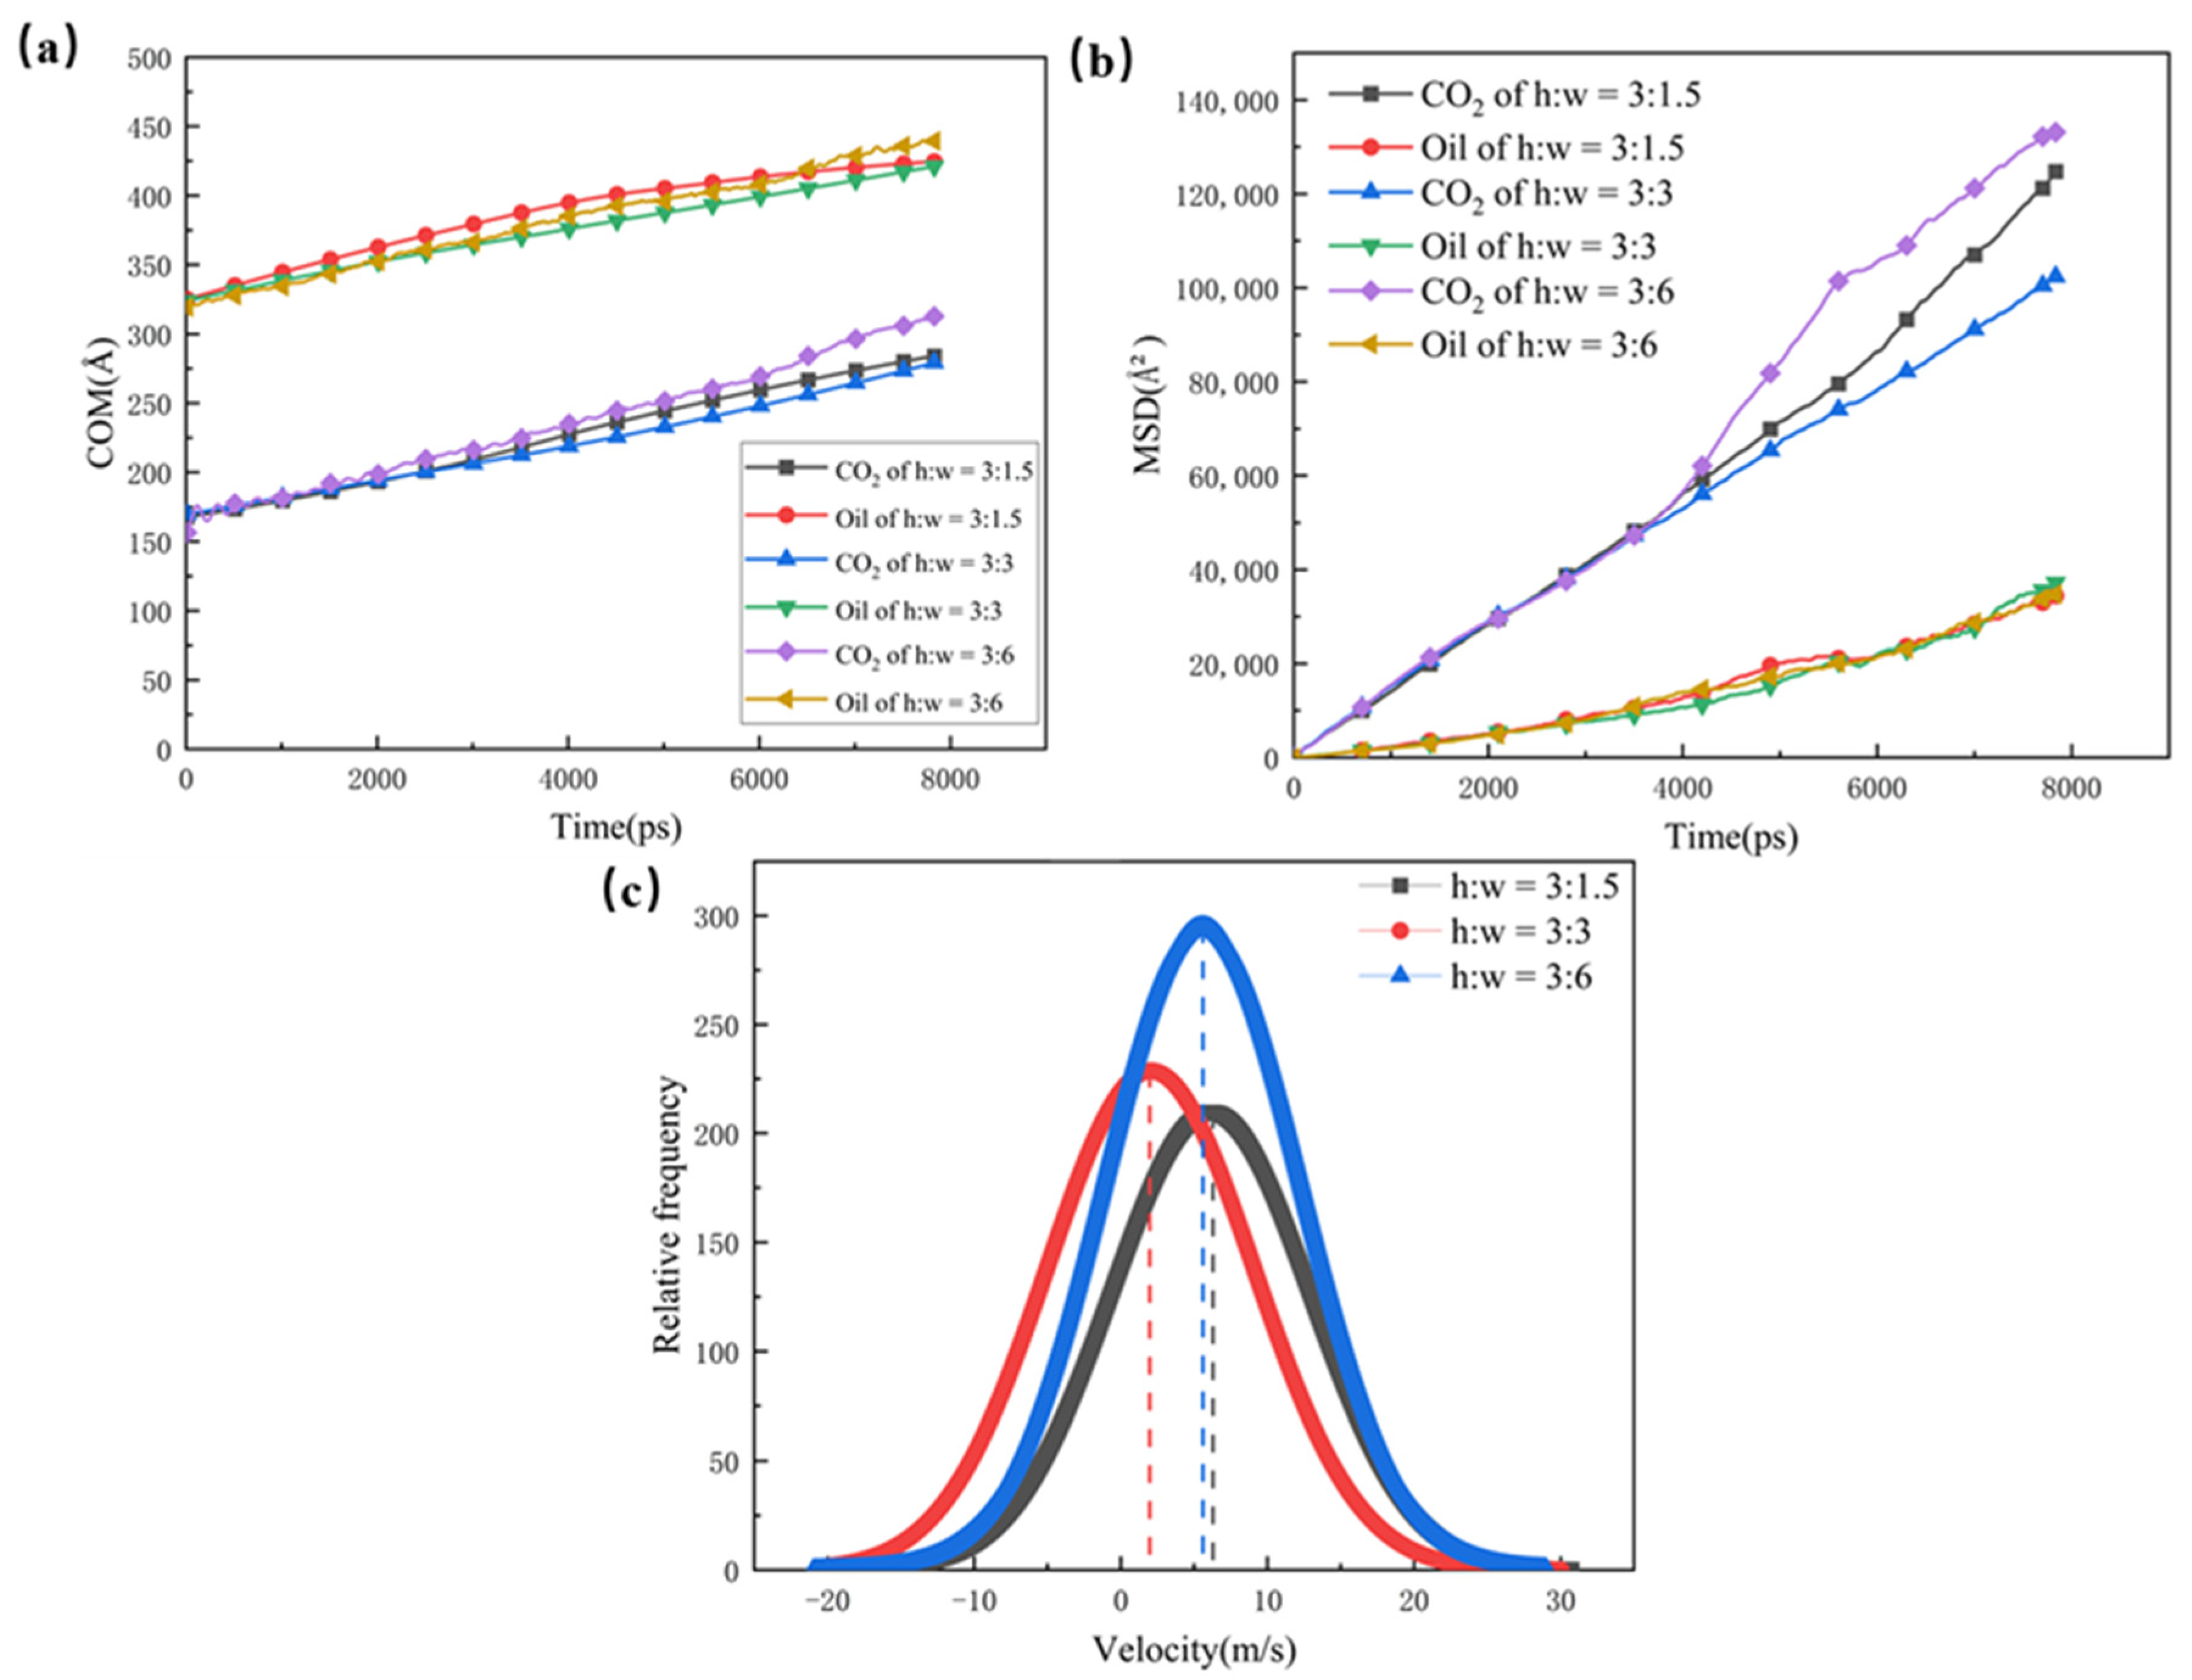
The COM and MSD displacements of the oil, CO2, and rate constants for CO2 absorption are also calculated in Figure 5; they were used to illustrate the mobility and diffusion capacity of the two phases in the different pore channels. The structure with a wider dead-end has a larger number of oil molecules, which hold a greater hindering effect on the CO2. Therefore, the COM and MSD displacements of the pores with larger dead-ends are slower, and the larger dead-ends have small rate constants for CO2 absorption. With the smallest size of dead-end, the CO2 in the 1.5 nm dead-end is less hindered by the oil molecules, and the CO2 forms a coherent adsorption layer in the main channel and, thus, results in higher mobility and diffusion abilities. For this reason, the 1.5 nm dead-end shows higher rate constants for CO2 absorption than the 3 nm dead-end and the 6 nm dead-end.
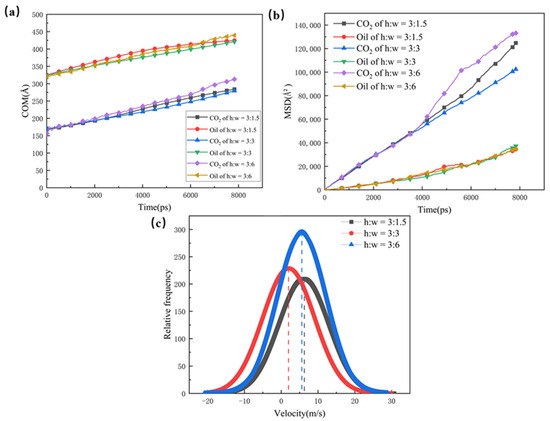
Figure 5.
(a) Centre of mass displacement of CO2 and oil in different pores, (b) root mean square displacement of CO2 and oil in different pores, and (c) rate constants for CO2 absorption in different pores (The dotted line defines the rate of absorption).
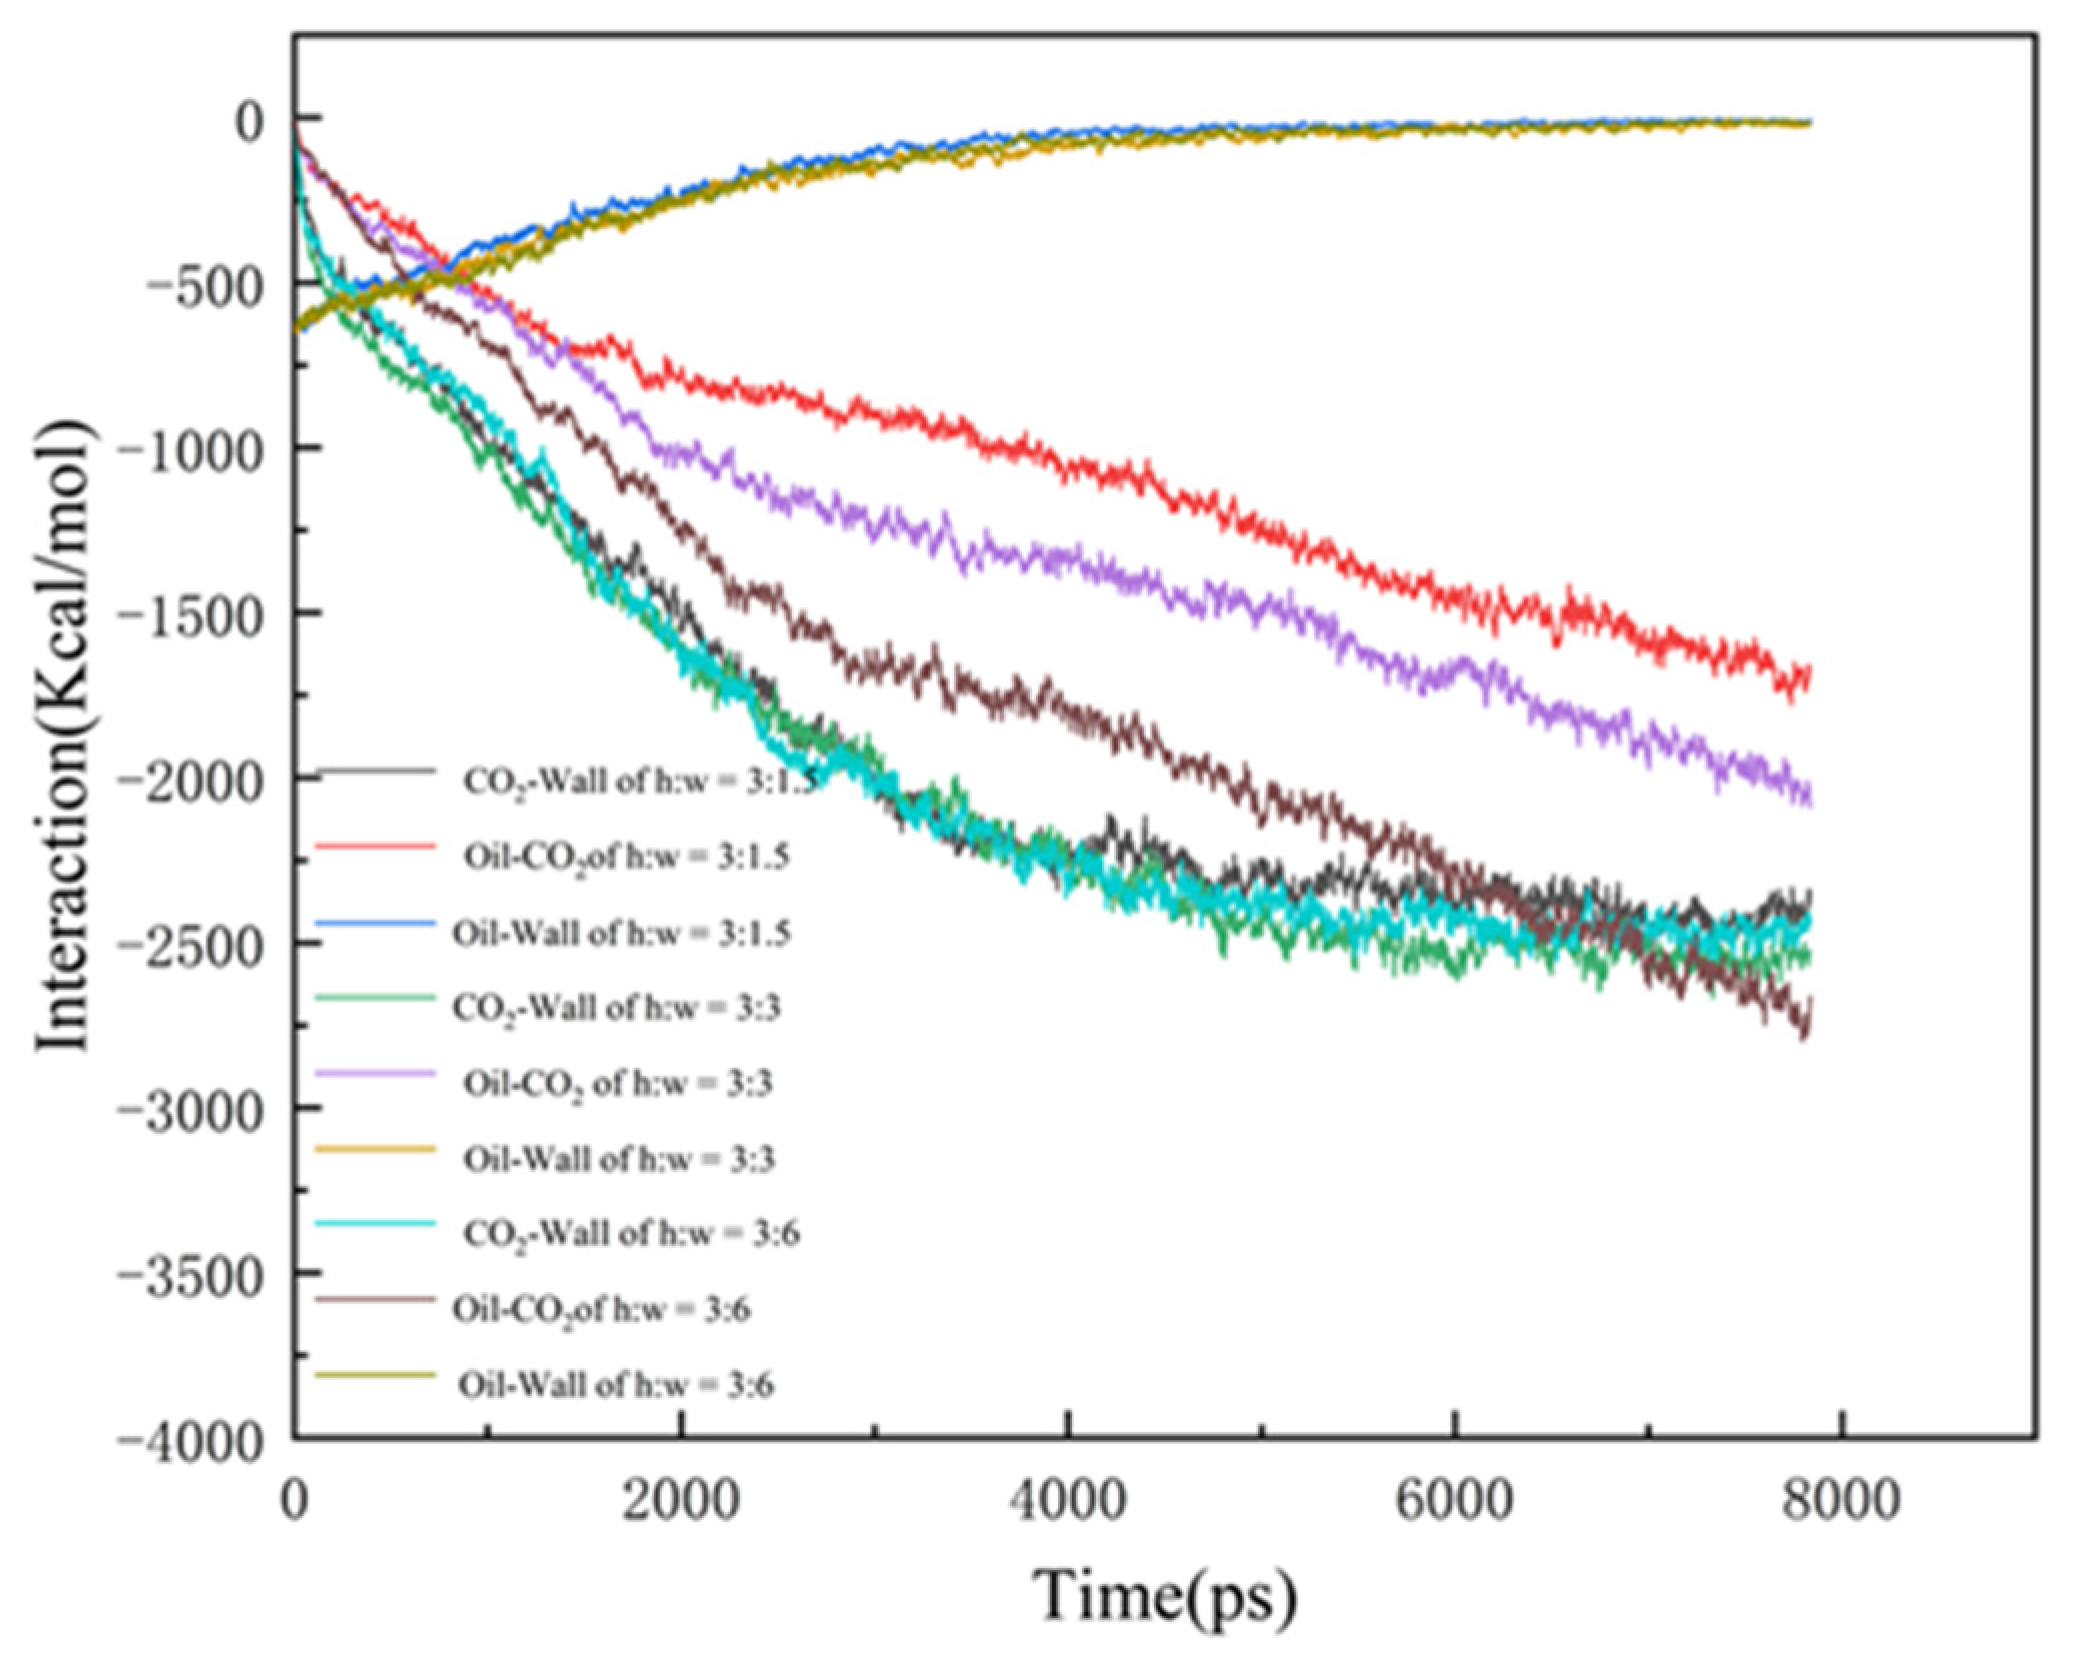
In order to investigate the mechanism of CO2-enhanced recovery in shale reservoirs with different pore widths, the interaction of CO2, oil, and wall were calculated, as shown in Figure 6:
where EOil-Wall is the interaction of the CO2 with the quartz surface; Etotal is the energy of the whole CO2 system, and ECO2-Wall is the energy of the CO2 and the quartz wall, respectively. Eoil-CO2 provides the driving force for the diffusion of the oil molecules, with the largest difference among the three data. This is mainly due to the wider pore space and larger dead-ends, in which the CO2 has more contact with the oil, with a greater interaction. Due to the stronger interaction, the oil is more difficult to strip from the pore wall and takes a longer time to be driven off the exit, thus resulting in the lowest CO2 burial efficiency at the dead-end of 6 nm. In the case of Eoil-wall and ECO2-wall, the interaction in the 1.5 nm dead-end pore reaches equilibrium slightly earlier, indicating a higher burial efficiency.
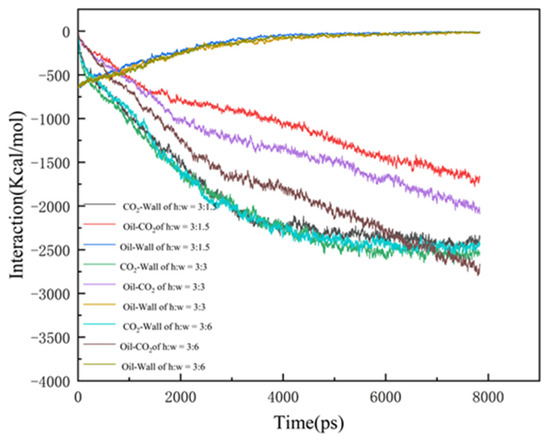
Figure 6.
The interaction energy between the components of the three models.
3.2. Different Width of the Main Channel
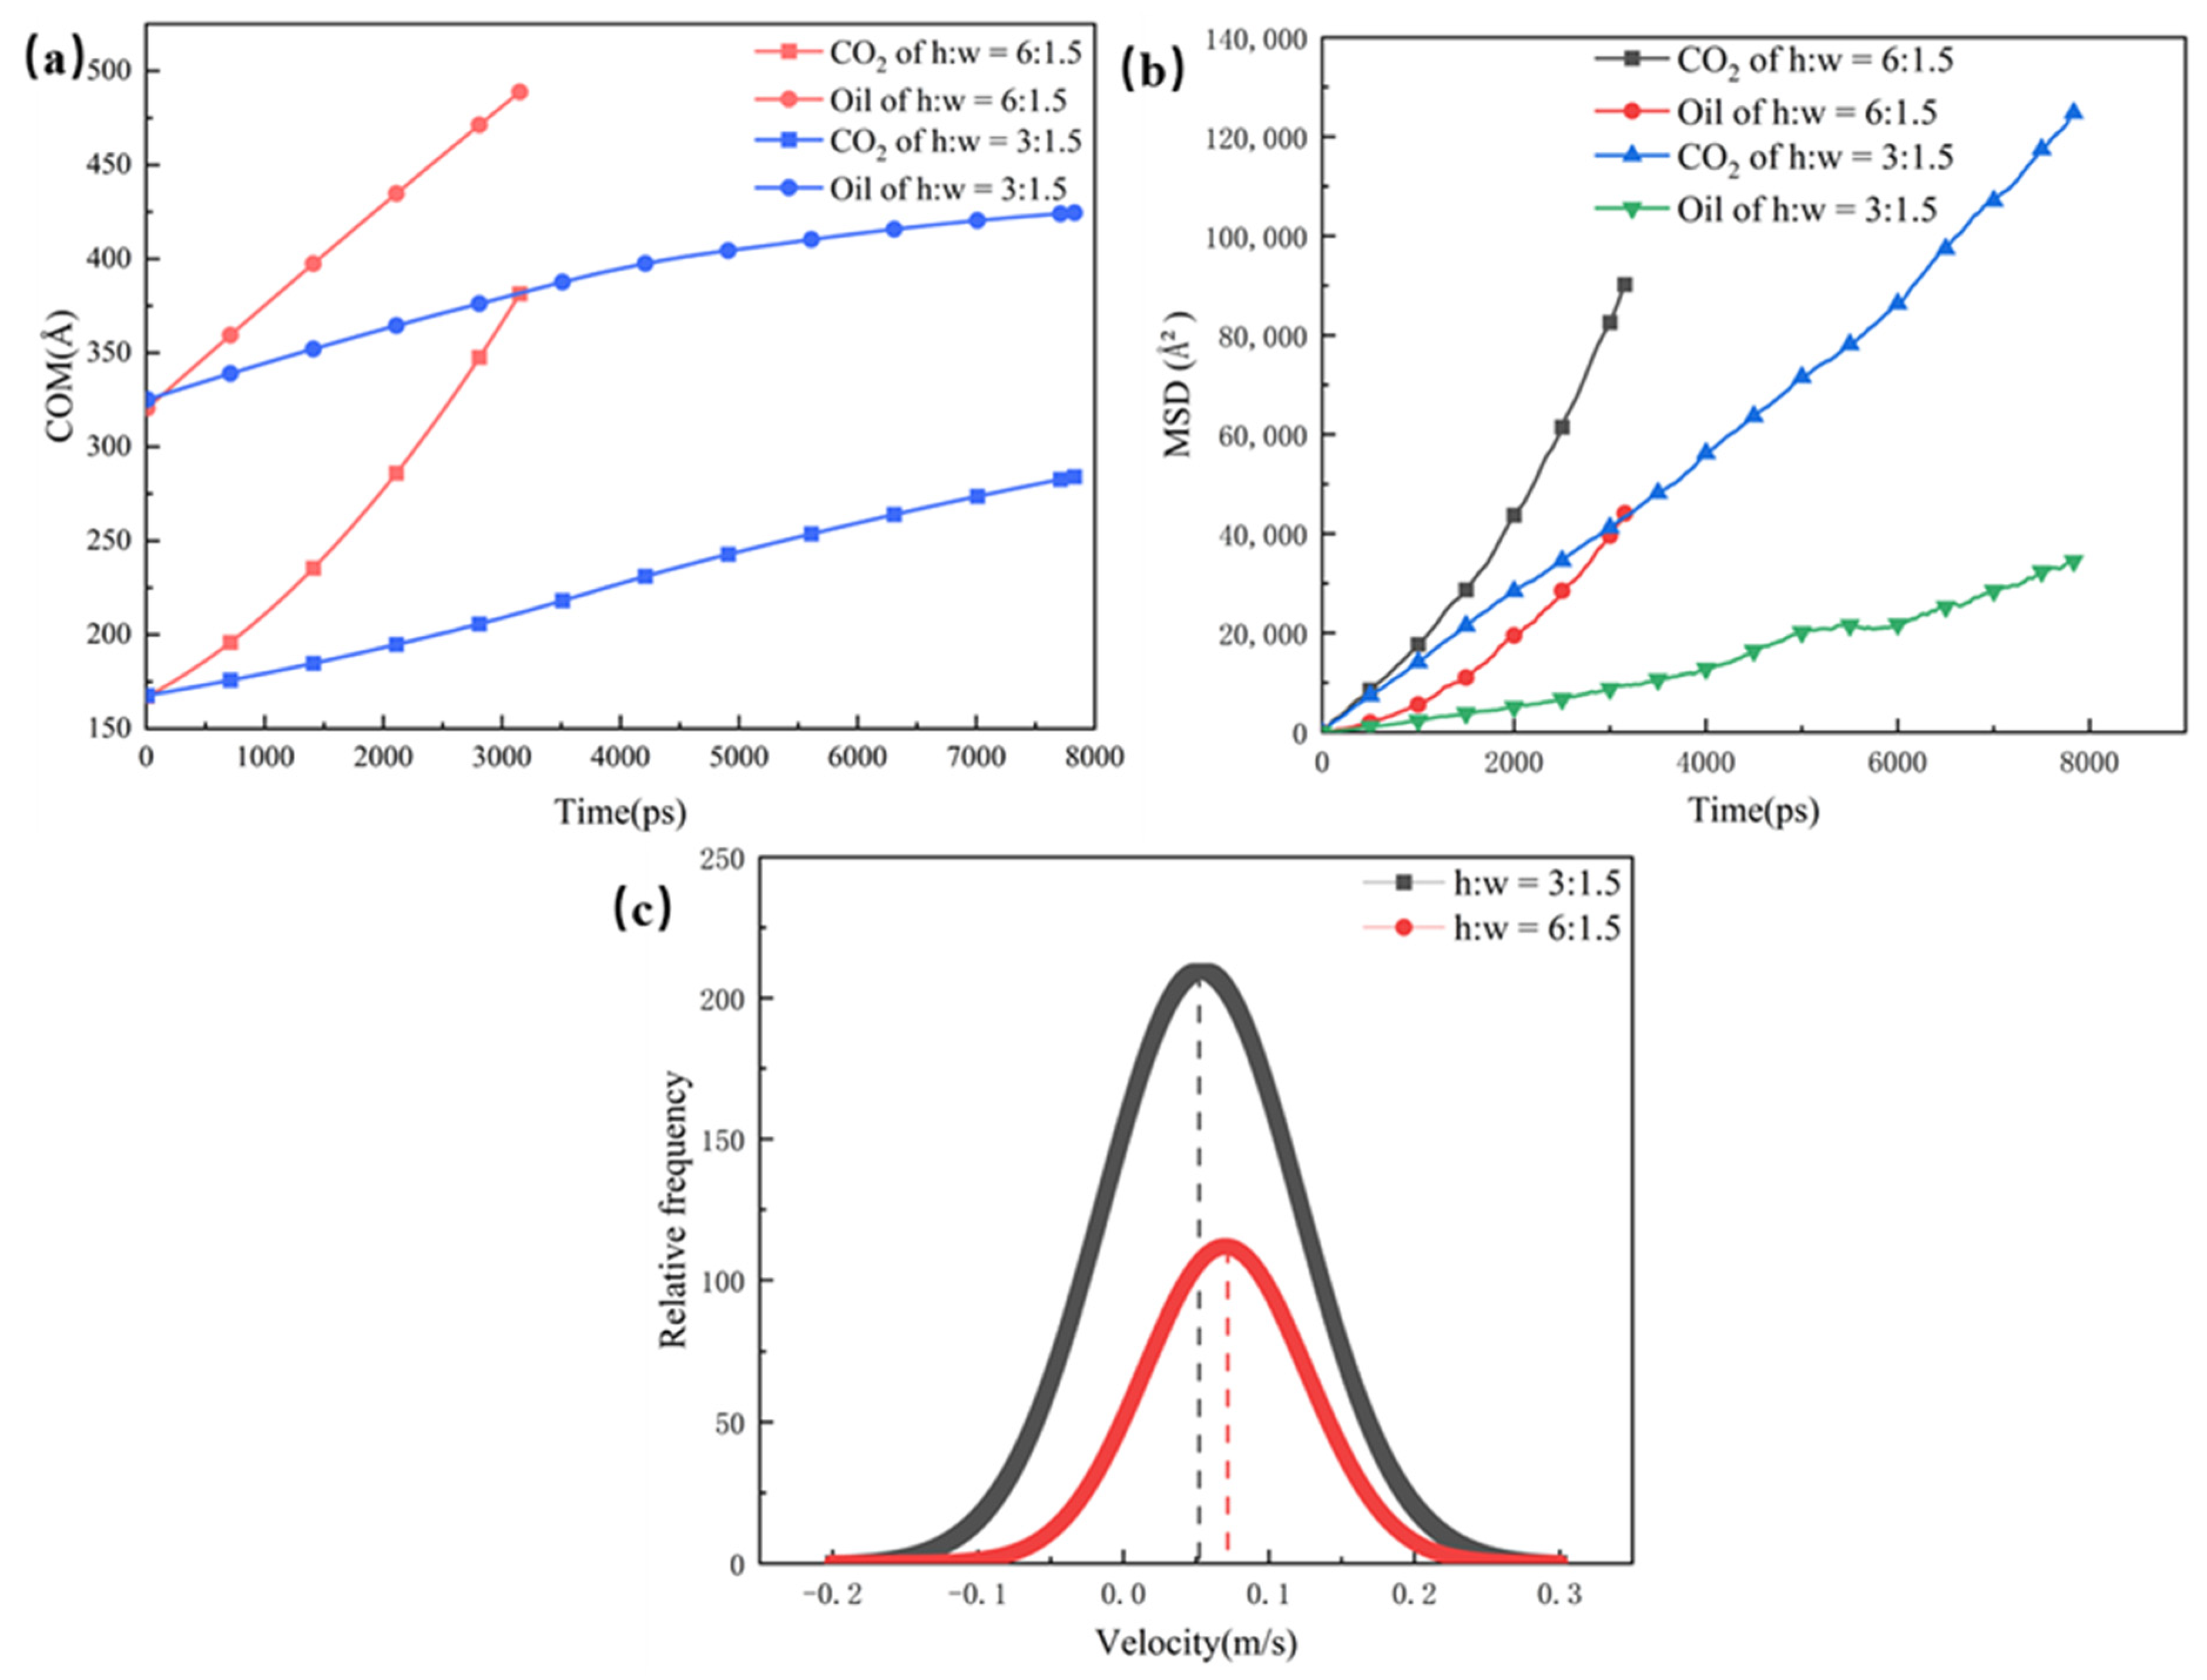
Apart from the dead-end, the size of the main channel is another factor that affects CO2 burial. Therefore, two sets of models with main channels measuring 3 nm and 6 nm were constructed with dead-end apertures of 1.5 nm, 3 nm, and 6 nm. As seen from the COM displacement in Figure 7a, the mobility of both phases is higher in the large pore than in the small pore. This is due to the fact that a large amount of CO2 enters the main channel and strips the oil off the wall in order to enter the free phase, and, then, the free oil is rapidly driven out of the pore space. The data in Figure 7c also demonstrate that the rate constants for CO2 absorption are greater for the larger pores of the main channel. Since liquid and gas molecules do not stay in a fixed position but are constantly moving, there is a correspondence between the amount of displacement and the diffusion coefficient, which gives a visual response to the diffusion ability of the substance. As shown in Figure 7b, the slopes of the two components of the pores of the 6 nm main channel are larger than the slopes of the pores within the 3 nm main channel, indicating that the diffusion ability of the CO2 and of the oil are stronger in the pores with a larger main channel. These results are mainly due to the fact that a larger main channel can have more CO2 entering the pore space, which is favorable to the replacement of the oil. Therefore, the diffusion abilities of CO2 and oil are strengthened, and the CO2 burial rate in a dead-end is increased as well.
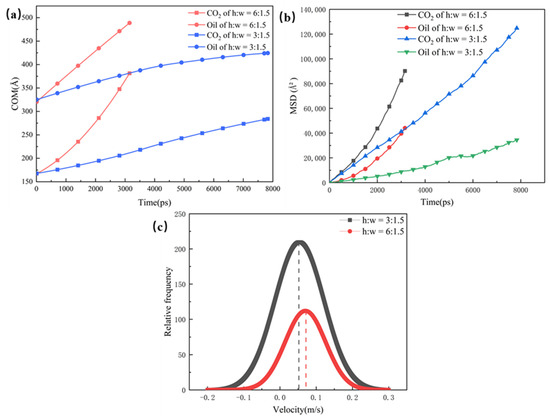
Figure 7.
(a) 1.5 nm dead-end center of mass displacement for different main channels, (b) 1.5 nm dead-end of root mean square displacement for different main channels, and (c) ate constants for CO2 absorption in different main channels.
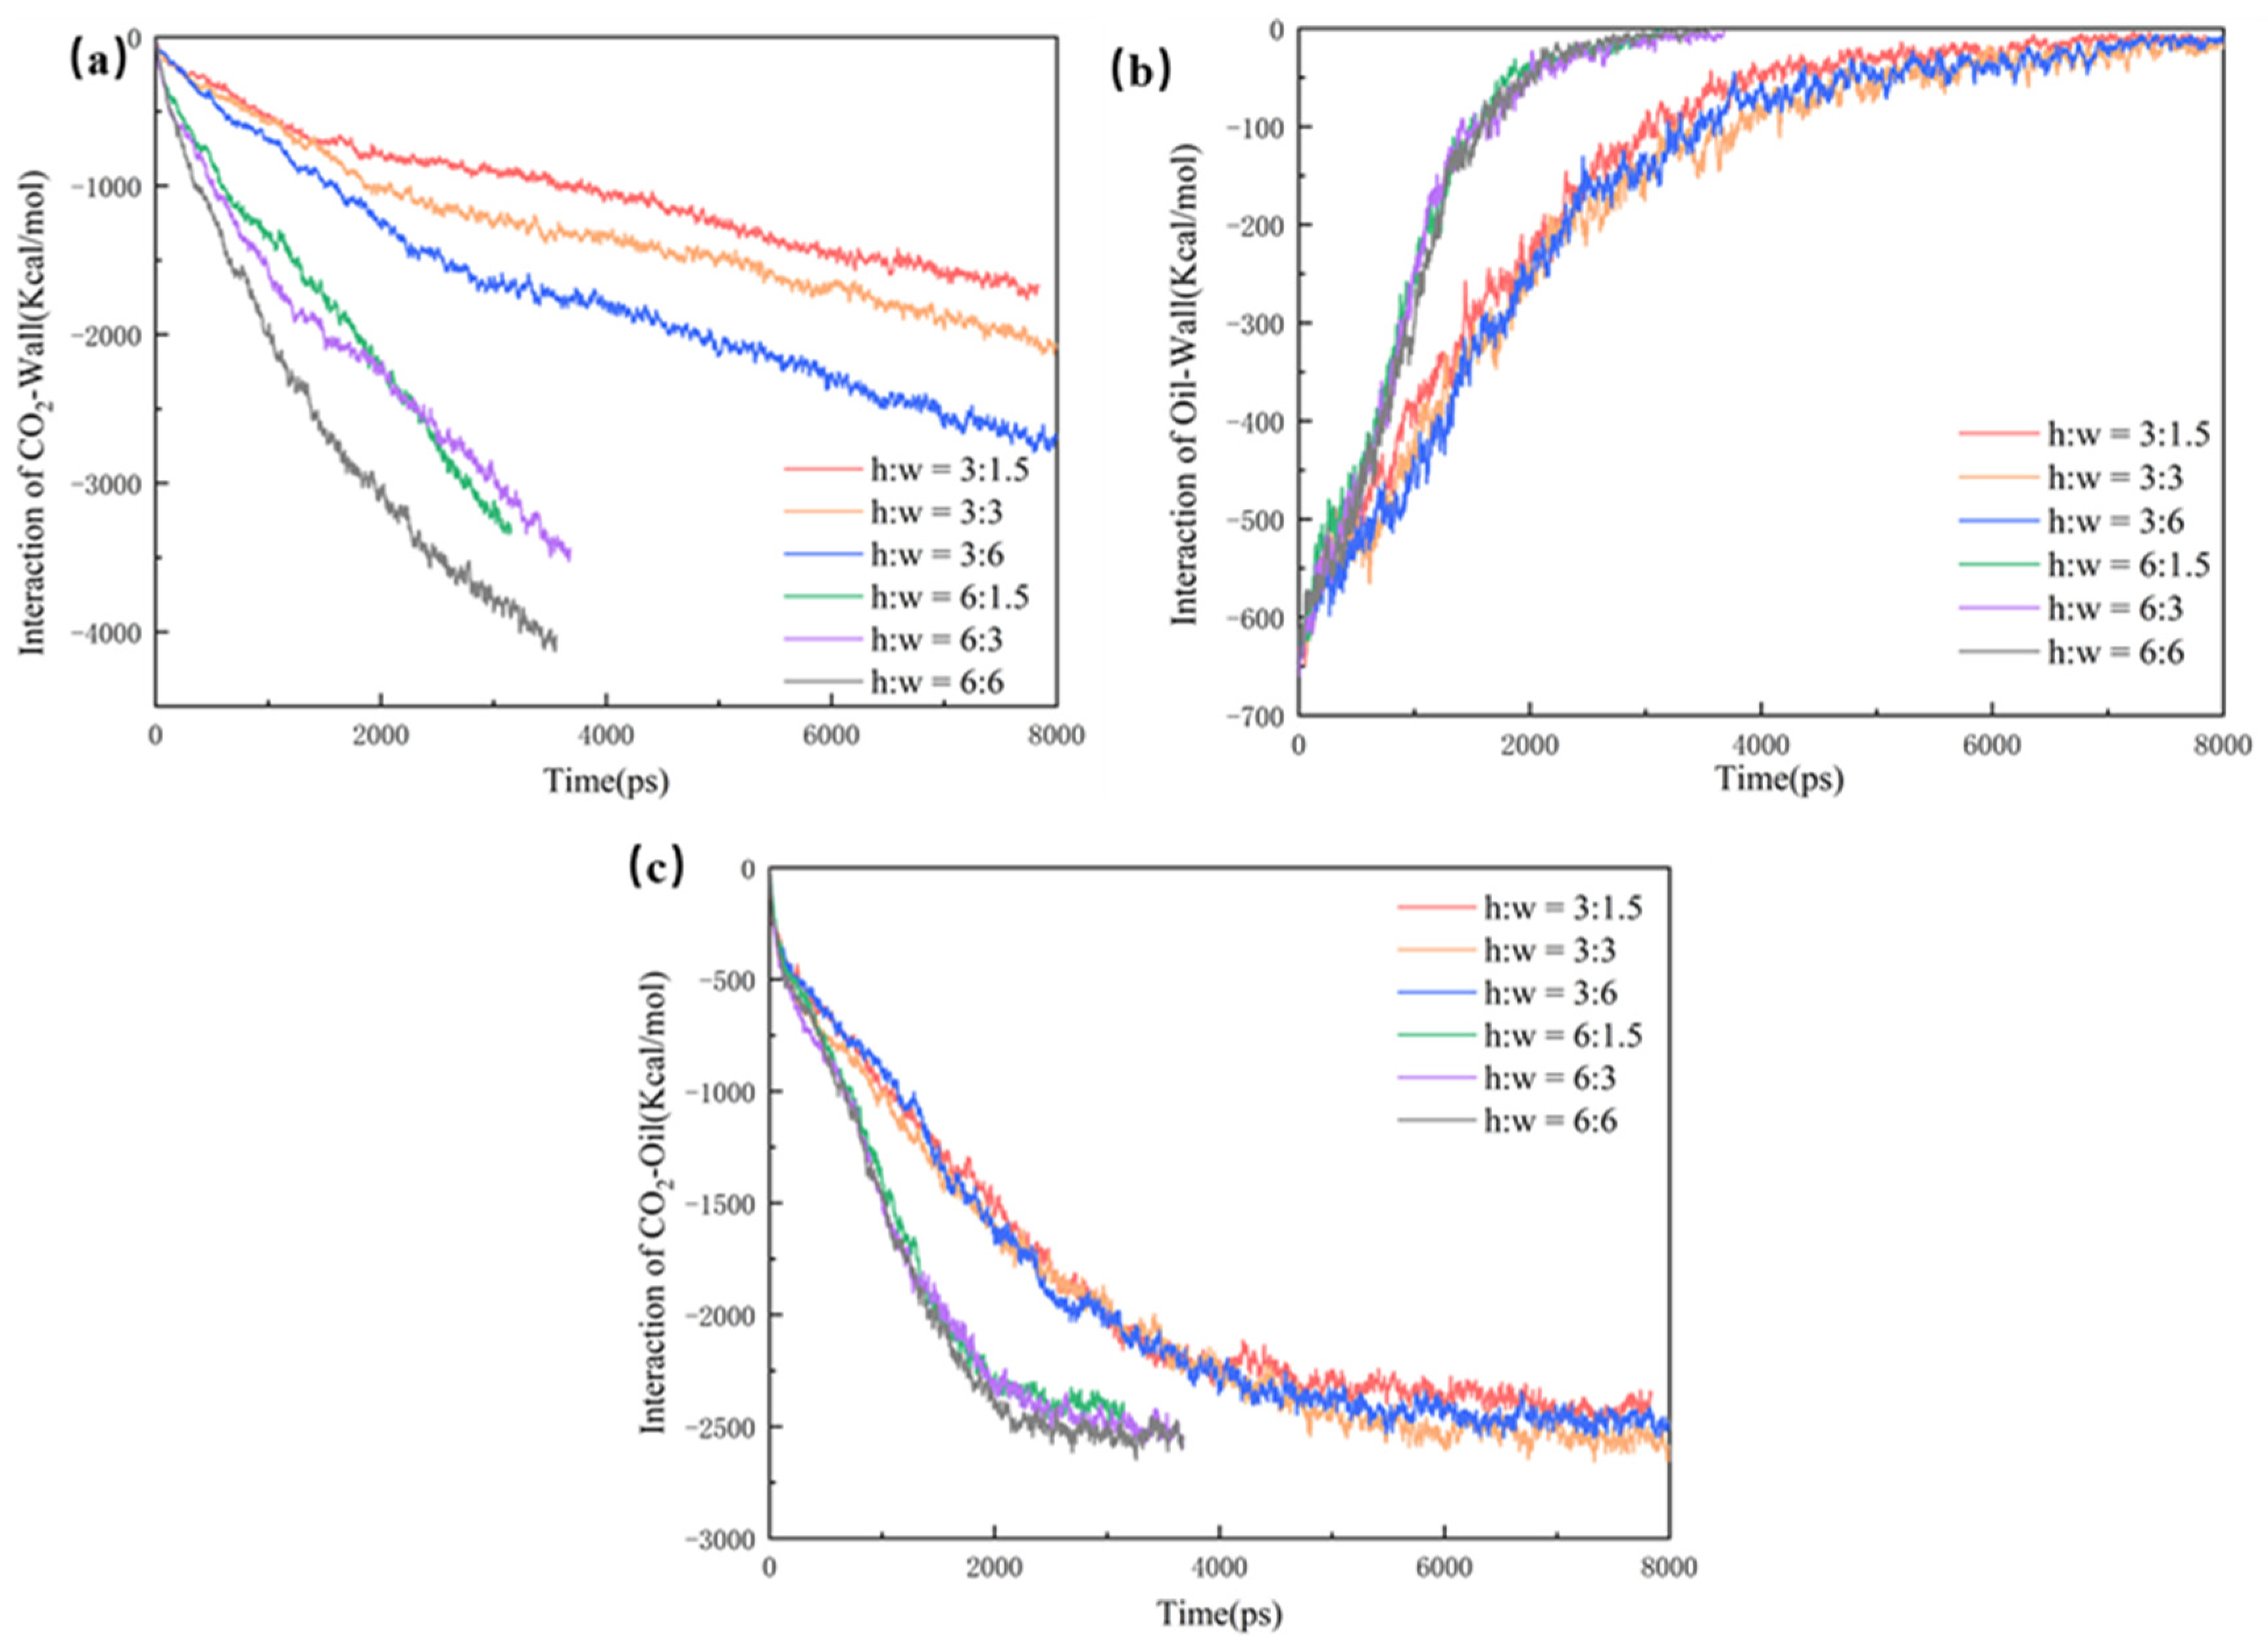
The mechanisms of CO2 sequestration in pores with different main channels were also investigated by comparing the interaction energies of the CO2 and the oil wall. As shown in Figure 8a, the ECO2-wall of the 6 nm main channel pores reach equilibrium earlier, indicating that the CO2 is adsorbed on the wall’s surface earlier and that the burial efficiency is much higher than that in the 3 nm main channel pores. As seen in Figure 8b, the EOil-wall in the pores with larger main channels can reach zero faster, which indicates that the oil on the wall of the large main channels is stripped off and driven out of the pores more rapidly. Therefore, the CO2 burial efficiency is higher than that of the small pores. As shown in Figure 8c, the ECO2-Oil of the 6 nm main channel pores is much larger than that of the 3 nm one because of the larger contact area. On the other hand, the ECO2-Oil increases more rapidly in the 6 nm main channel pores and reaches a larger value. This also indicates that the 6 nm main channel pores can bury more CO2 molecules. Hence, in pores with larger main channels, more CO2 mixing with the oil is conducive to the improvement of CO2 recovery and promotes the volume expansion and viscosity reduction in the oil, which reduces the interfacial tension and benefits CO2 sequestration.
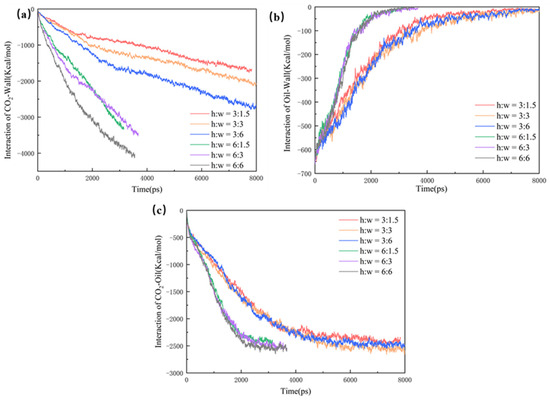
Figure 8.
(a) CO2–wall interaction energy, (b) oil–wall interaction energy, and (c) CO2–oil interaction.
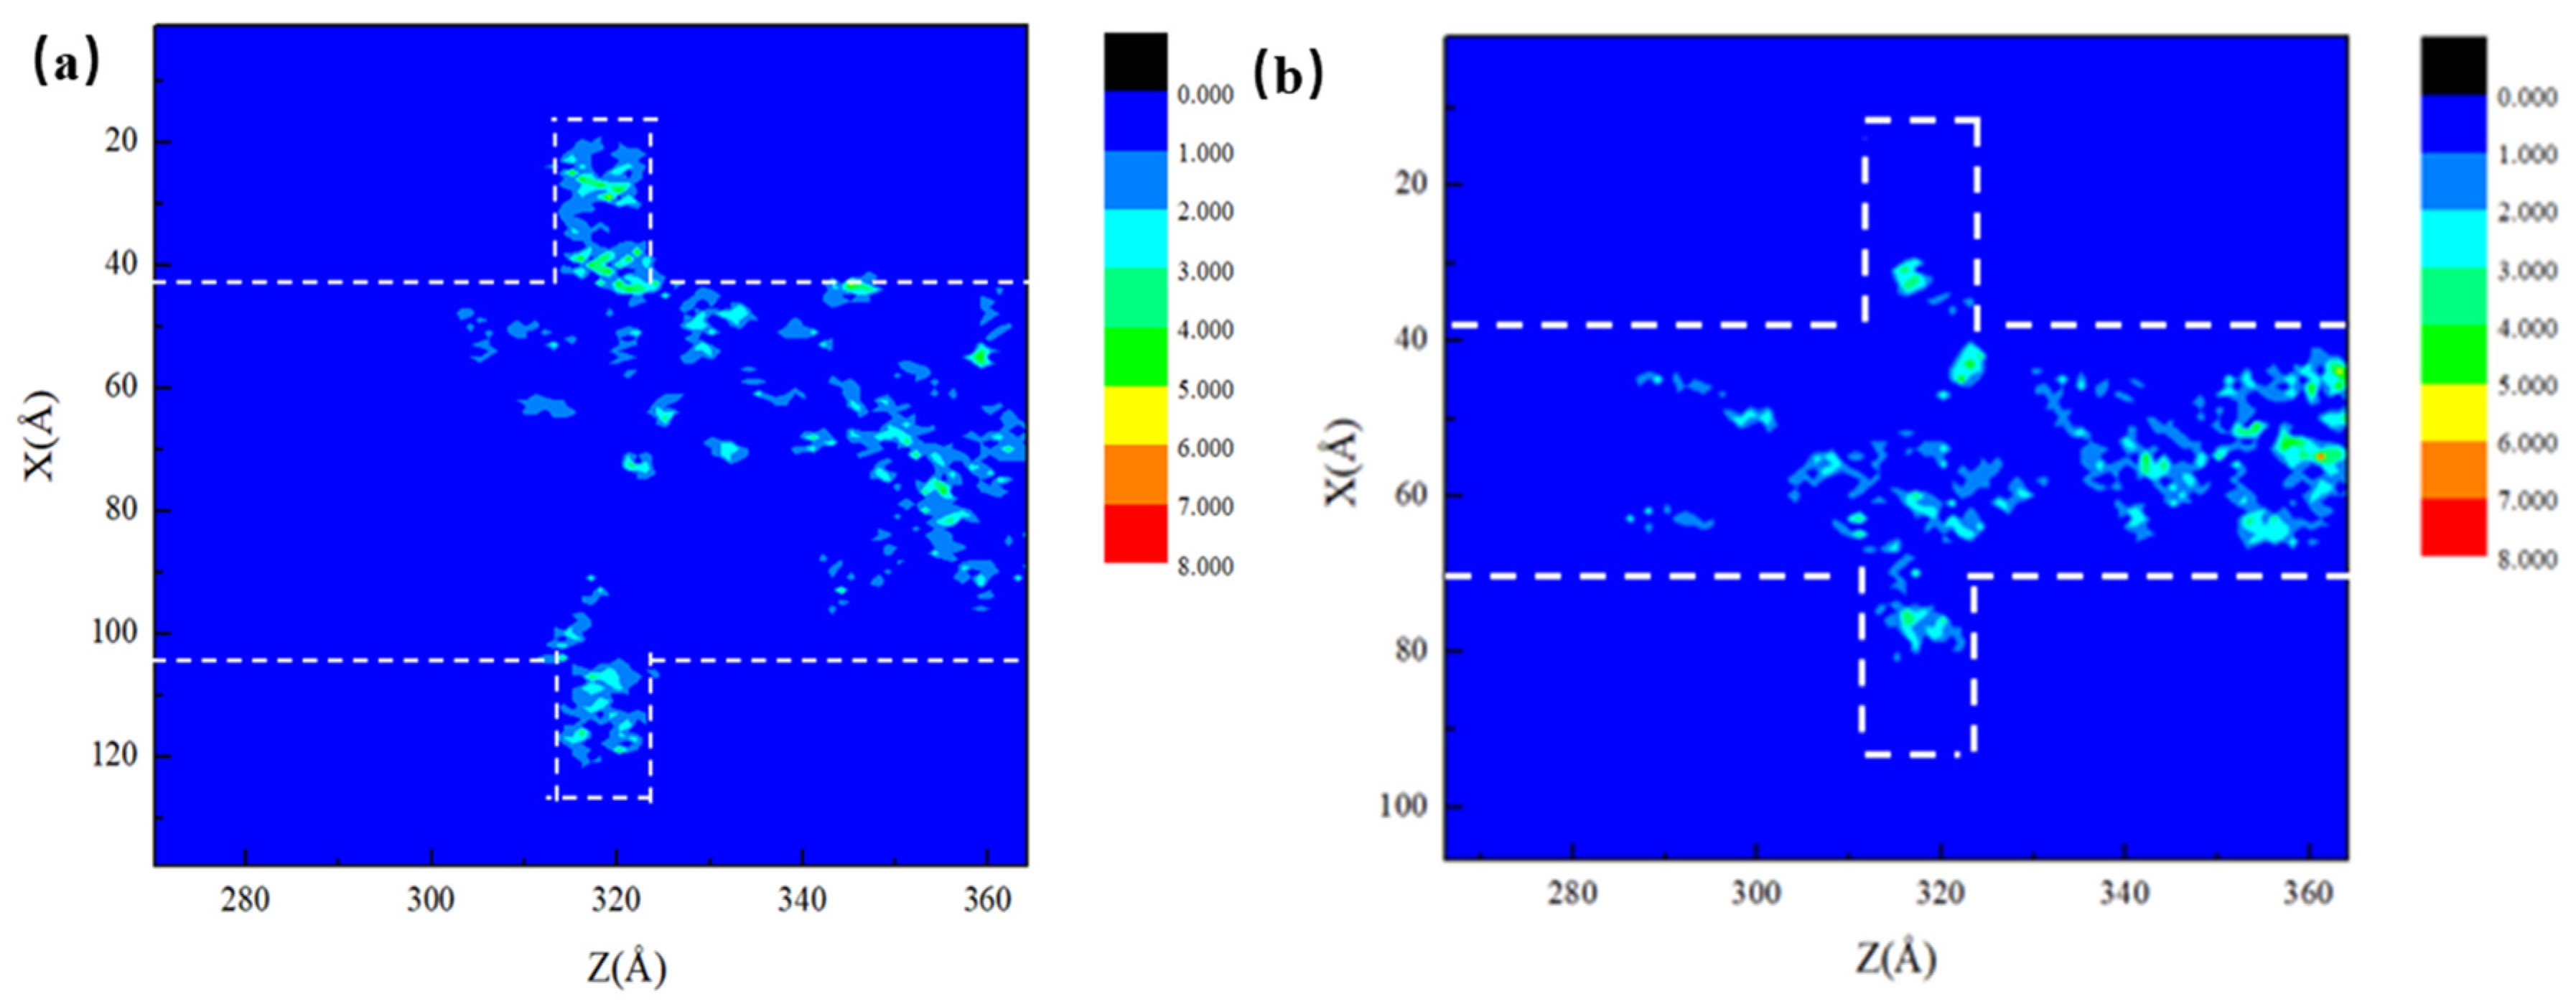
In order to have a clearer insight of the flow behavior of oil in the system during CO2 injection, two-dimensional density maps of the octane molecules in the 6 nm and 3 nm main channel pores are given in Figure 9. The maps were recorded at the moment corresponding to the same percentage of residual oil in the main channel. In accordance with the 2D density plots, the displacement of the oil can be more intuitively reflected. The influence of the main channel on CO2 burial in the dead-end is clearly seen at this moment, where the CO2 in the pores within a narrower main channel travelled along the wall to the bottom of the dead-end and stripped the oil molecules off the wall more easily. In the 6 nm main channel pores, the stripping of the oil by CO2 dissolution mainly took place at the junction between the dead-end and the main channel, indicating a negative effect of the wide main channel on CO2 burial at the dead-ends.
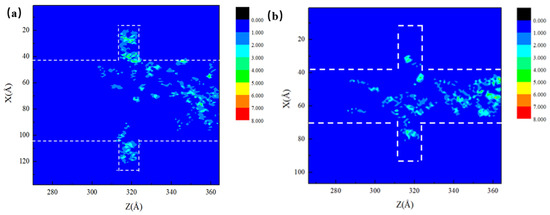
Figure 9.
(a) 6 nm oil 2D density map and (b) 3 nm oil 2D density map.
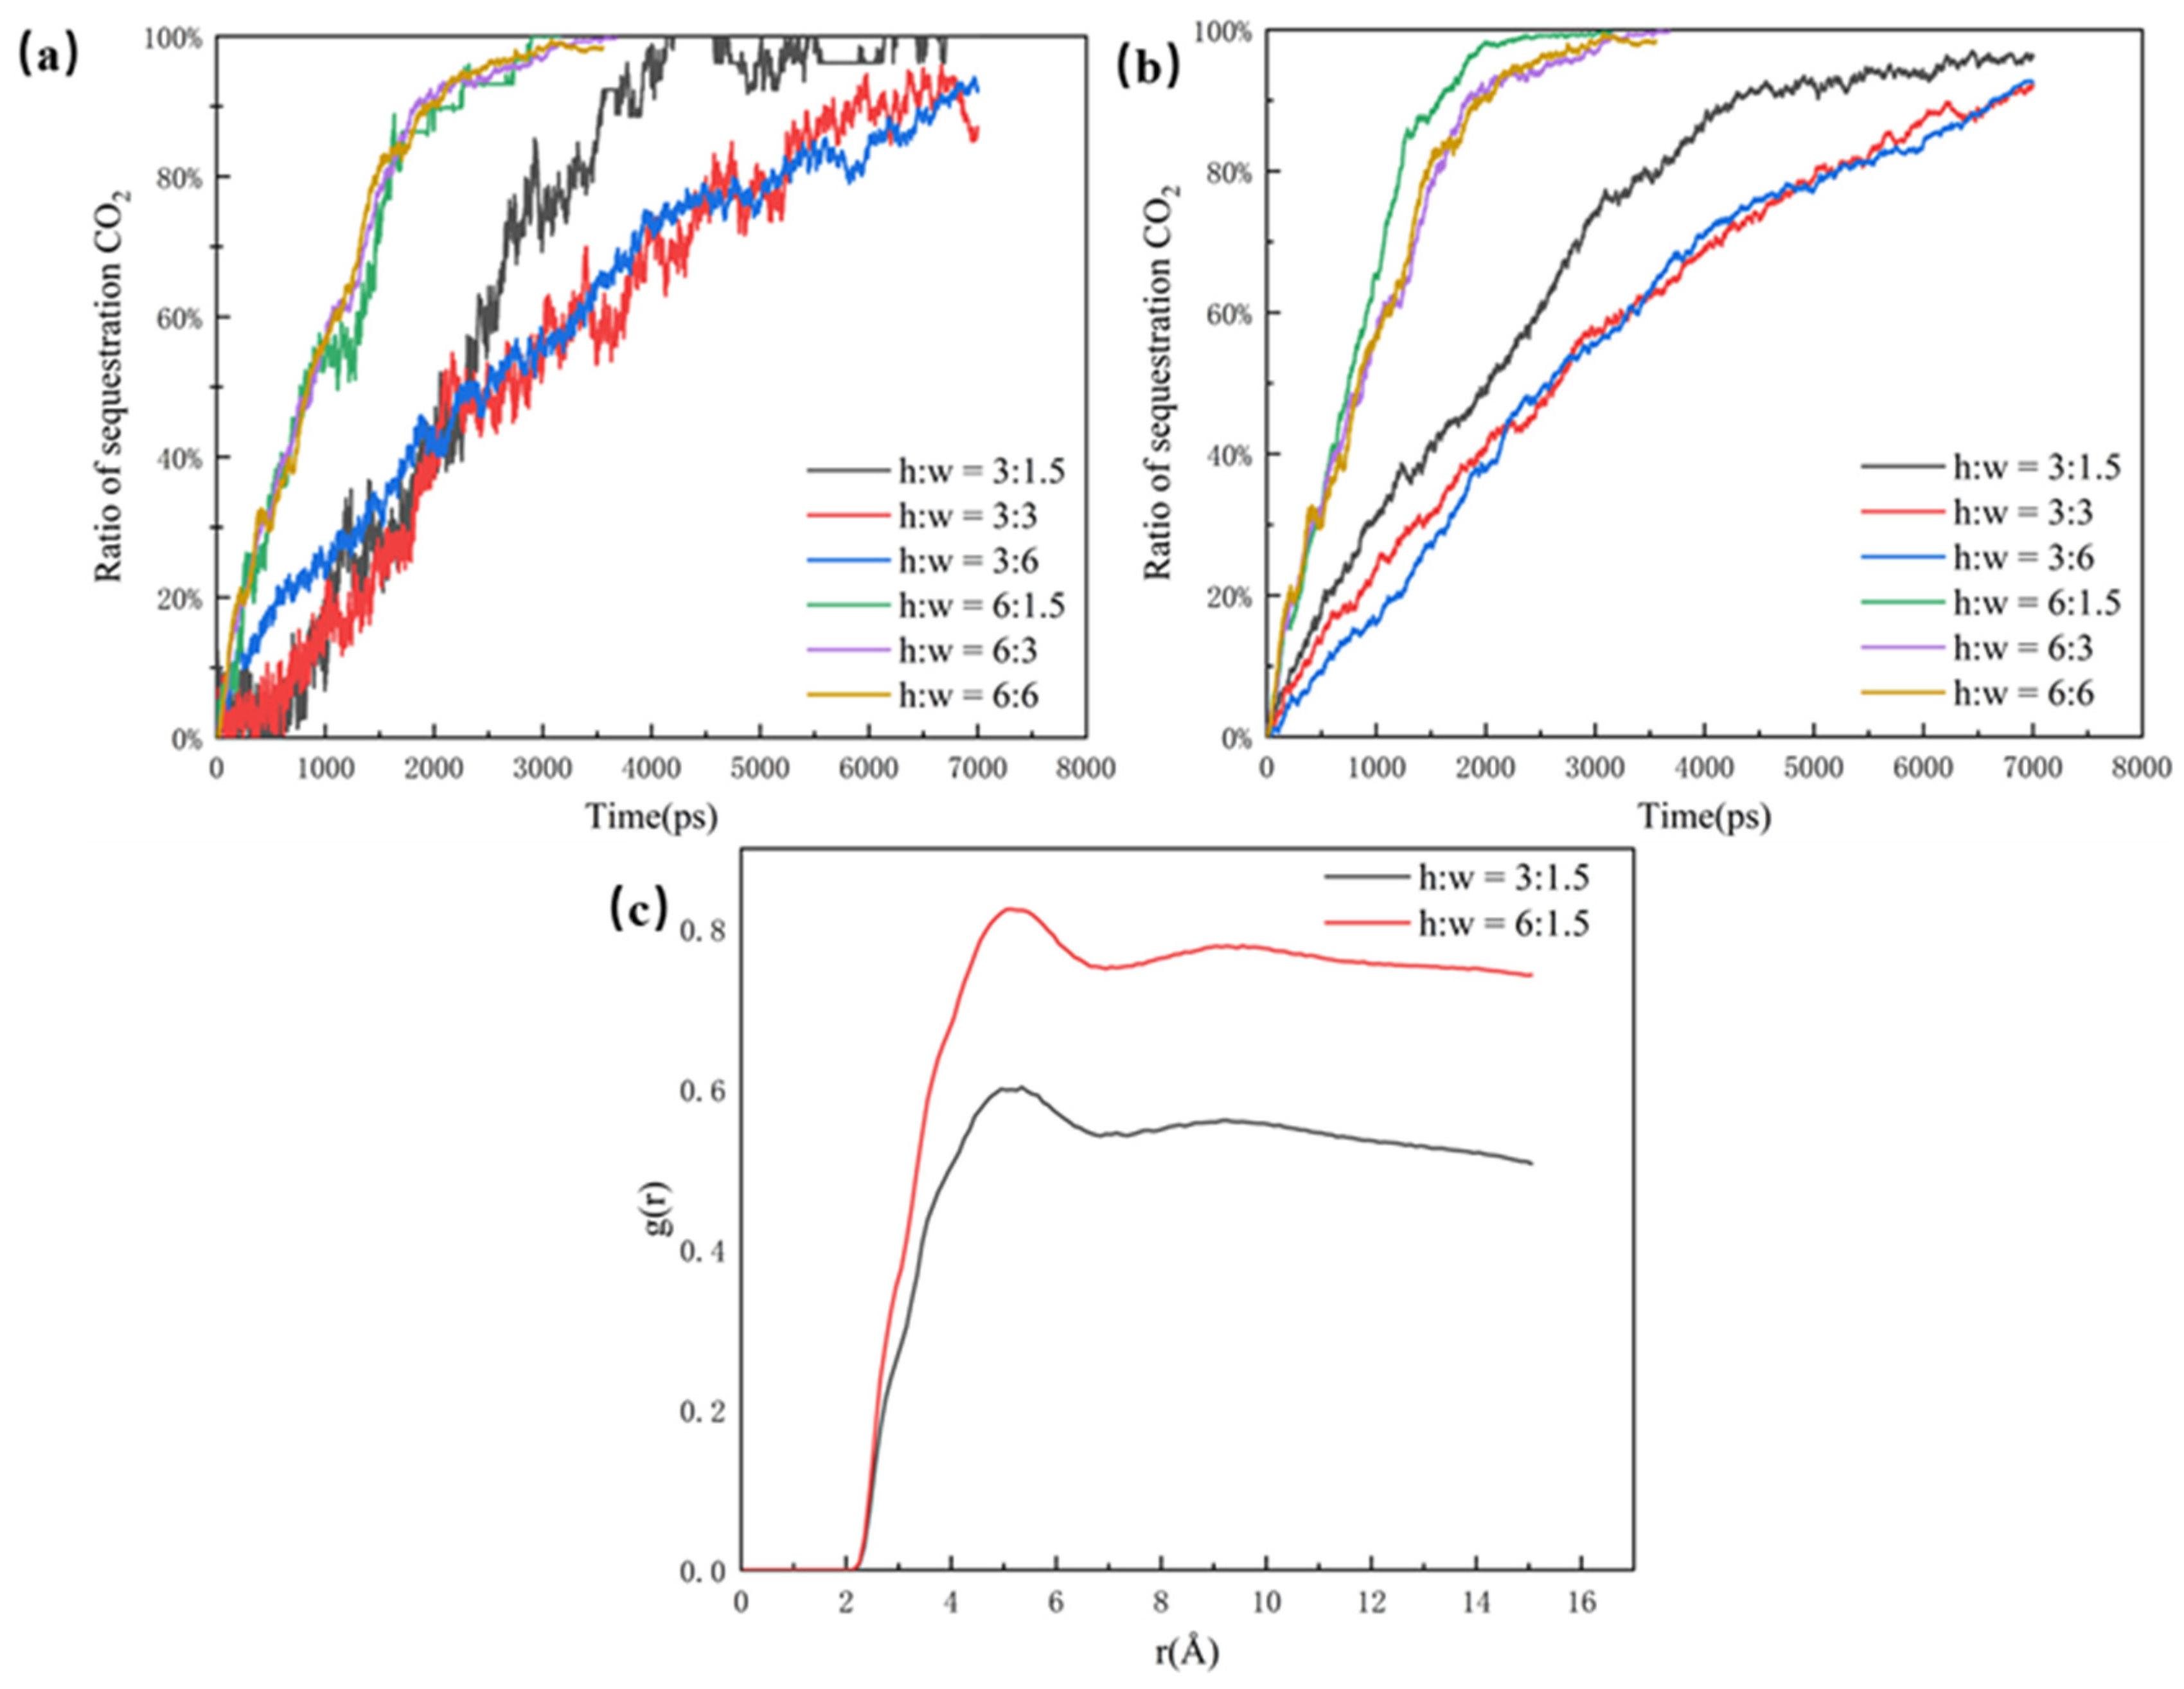
Considering the total ratio of buried CO2, the pores within the wider main channel exhibit a significant replacement efficiency, which is revealed in Figure 10. This is because the CO2 molecules travel faster in the larger main channel, and more CO2 comes into contact with the oil molecules over a shorter period of time. In addition, with a larger size, the main channel completes CO2 burial before the dead-end, whereas, in the smaller pore, the dead-end burial is completed earlier than in the main channel. This phenomenon is due to the fact that the CO2 in the narrower main channel structure is able to enter the dead-end along the wall to strip the oil molecules. In the wider main channel, most of the oil is dissolved and stripped by the CO2 at the junction between the dead-end and the main channel, as well as on both sides of the dead-end. The two typical sets of RDF data within the different main channels selected in Figure 10c illustrate that the larger the main channel the better the mixing phase. As a result, CO2 sequestration is higher in pores with same dead-ends but larger main channels.
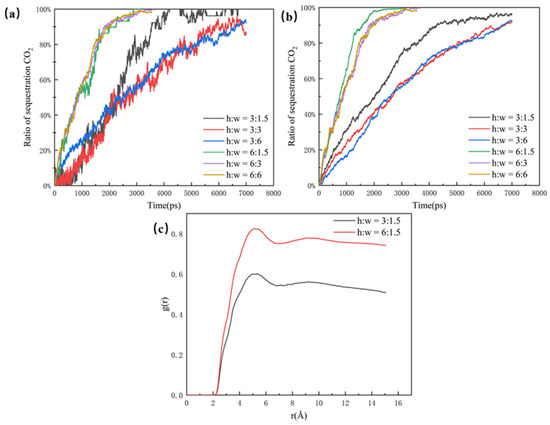
Figure 10.
(a) Ratio of sequestration of CO2 in the main channel, (b) ratio of sequestration of CO2 in the dead-end, and (c) radial distribution function at 3 nm and 6 nm for the main channel at the same burial moment.
3.3. Differential Pressures
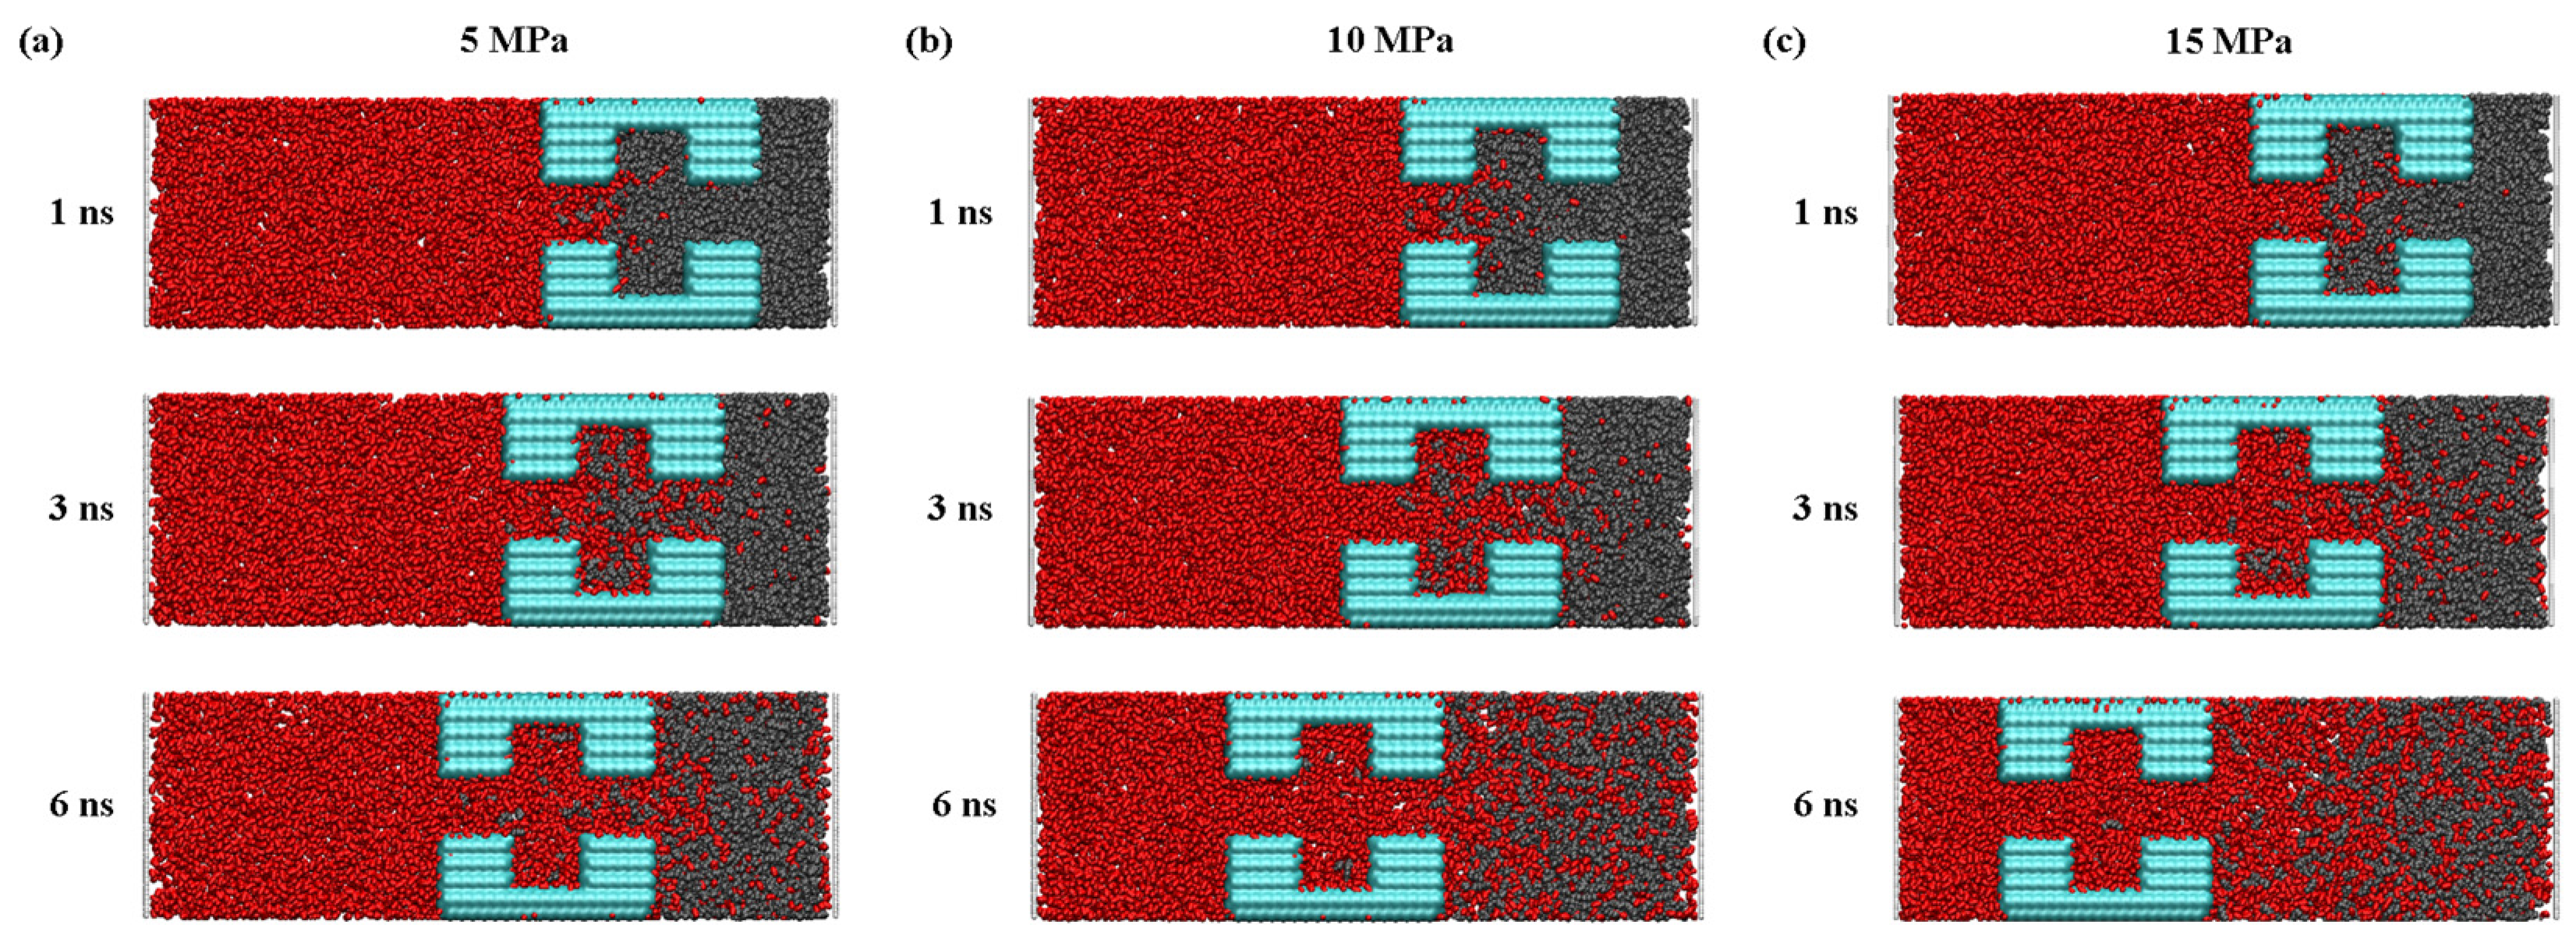
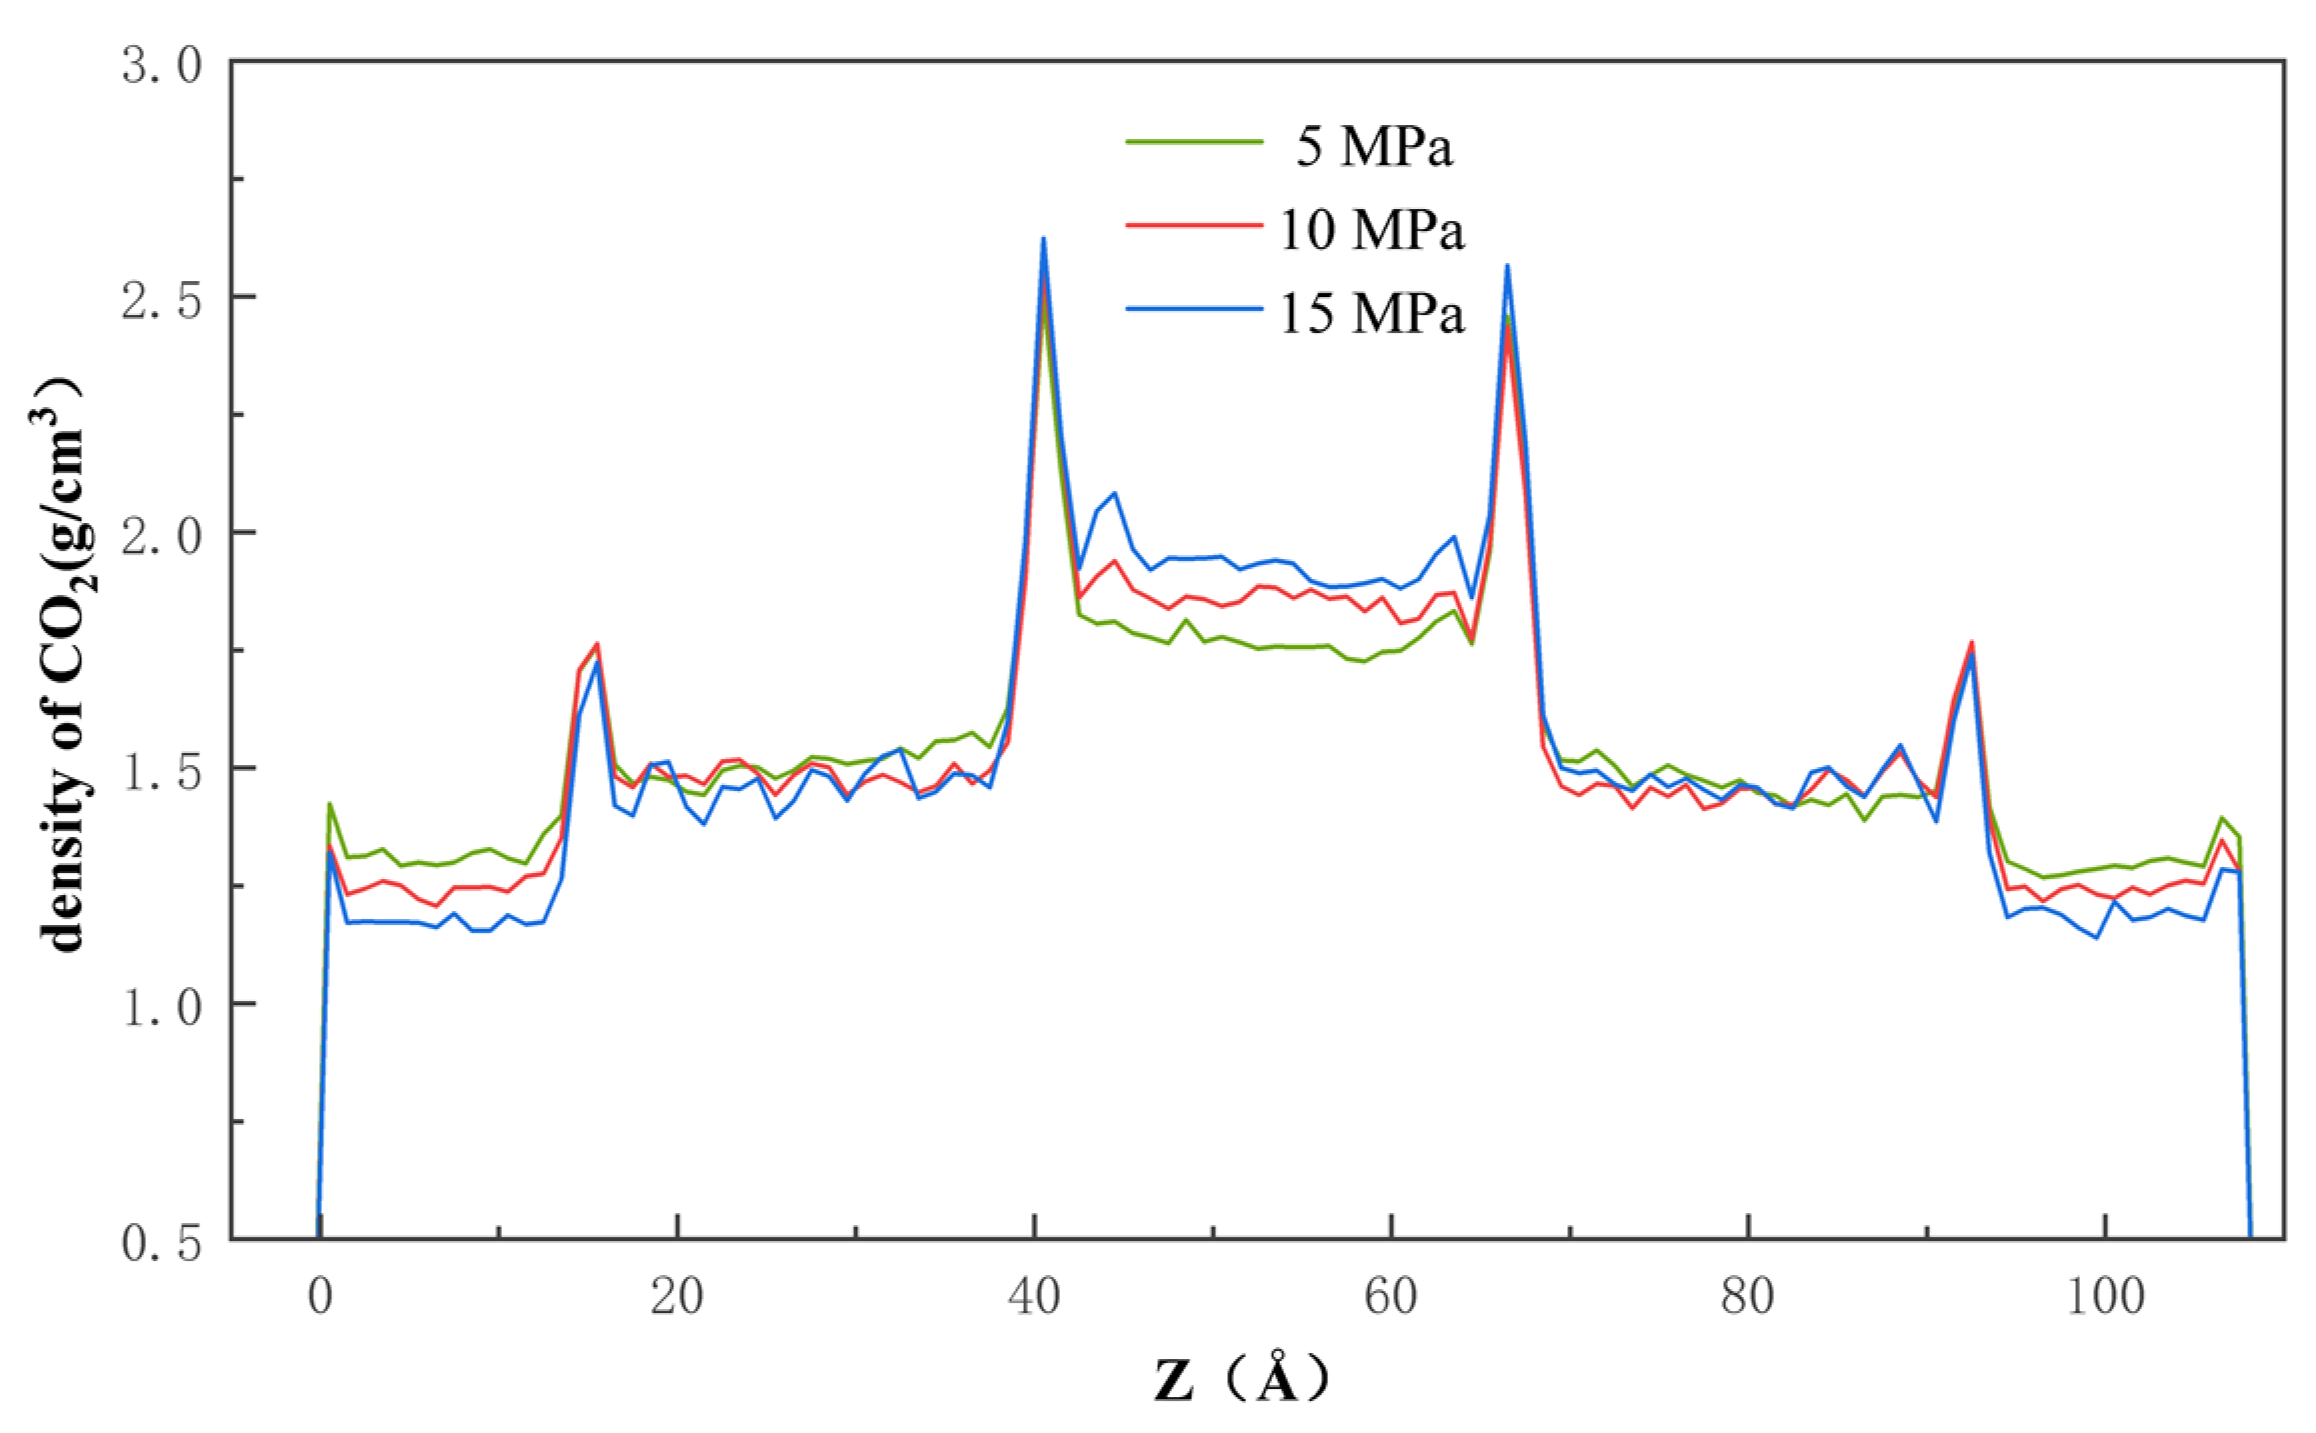
Pressure is another factor that affects the process of CO2 injection into the pores with a dead-end, the detailed understanding of which is essential for the optimization of the sequestration solution. Figure 11 clearly shows that, after entering the pore, the CO2 molecules are, at first, adsorbed onto the quartz wall’s surface through physical adsorption, based on Van der Waals’ interaction and charge interaction. Then, once the CO2 molecules occupy most of the adsorption sites, the remaining CO2 molecules enter the pore space through mechanisms of diffusion and slip. As shown in Figure 12, the rate of CO2 entering the pore increases as the pressure difference increases, which indicates that the pressure difference can directly affect the movement and diffusion rate of the CO2 molecules. On the other hand, the effect of the pressure difference on the entry of CO2 into the pores and its retention on the wall’s surface is also significant. By increasing the injection pressure, the entry of the CO2 molecules into the pore channel can be effectively promoted and the density of the CO2 near the wall’s surface is increased. At the same time, in the middle of the pore channel, the density of the CO2 also increases with increasing pressure difference.
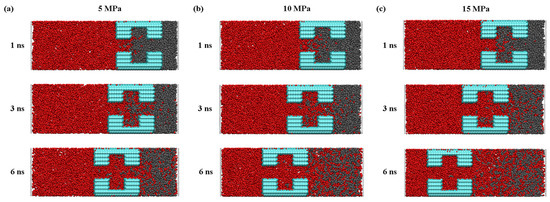
Figure 11.
The snapshot of the CO2 replacement of the oil process at (a) 5 MPa, (b) 10 MPa, and (c) 15 MPa.
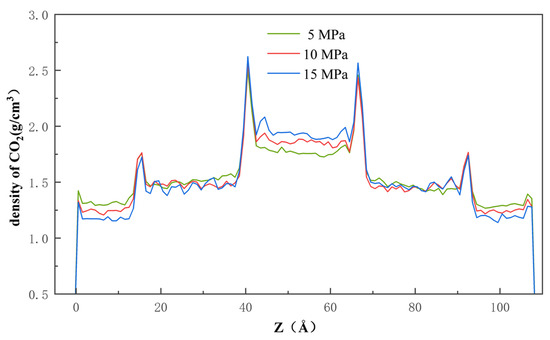
Figure 12.
Density of the CO2 along the x-axis at 5 MPa, 10 MPa, and 15 MPa.
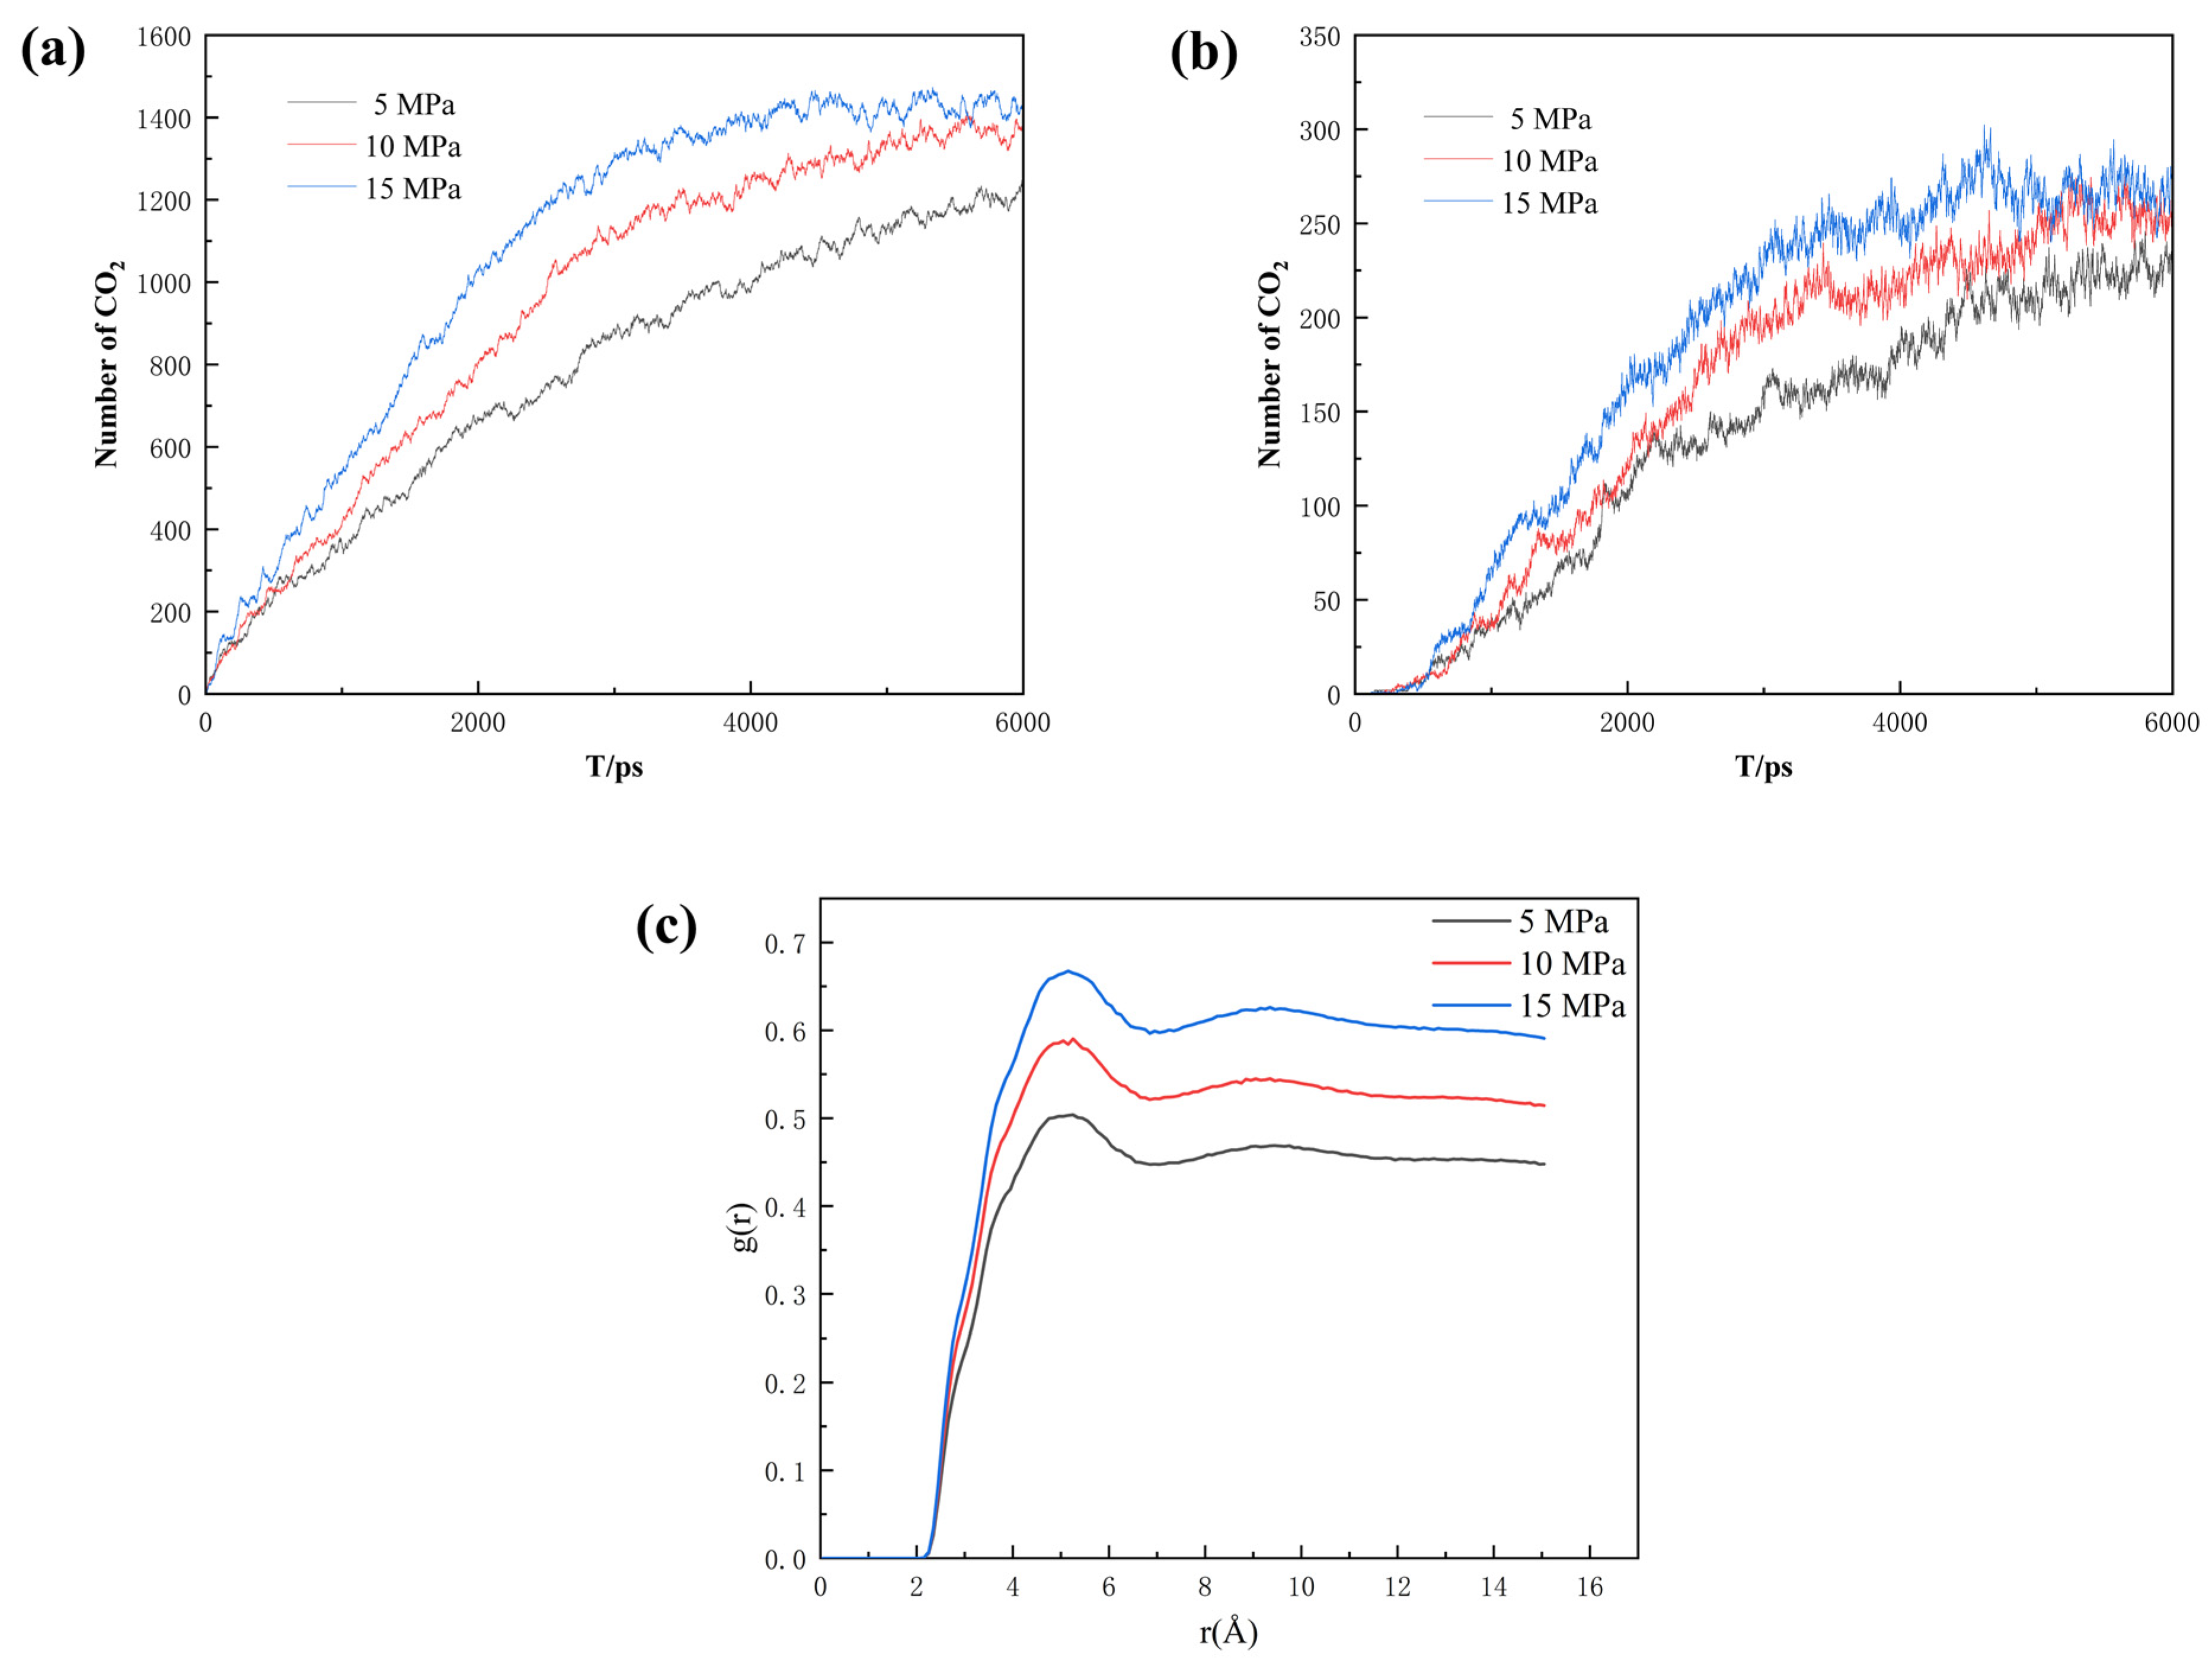
For describing the sequestration effect, the number of CO2 molecules entering the pore space was calculated. As shown in Figure 13a, the number of CO2 molecules entering the main channel increases significantly upon the increment in pressure difference. Compared to the main channel with both an entrance and an exit, the semi-closed nature of the dead-end makes it easier to seal the CO2, which is crucial to CO2 sequestration. As seen in Figure 13b, the number of CO2 molecules entering the dead-end pore also increases with rising pressure difference. However, when the differential pressure is 15 MPa, the number of CO2 molecules entering the dead-end pore decreases slightly in the later stages, and the high pressure can push the already-sequestered CO2 molecules in the dead-end pore out of the pore space. Therefore, the injection pressure should be reasonably adjusted when injecting CO2 into the reservoir to maximize the CO2 sequestration effect. As seen in Figure 13c, the higher the pressure the higher the degree of phase mixing. So, it can be concluded that the increase in pressure promotes the sequestration of CO2.
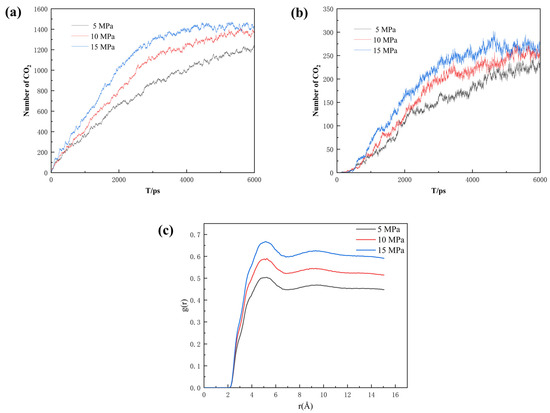
Figure 13.
(a) Number of CO2 molecules entering the main channel, (b) number of CO2 molecules entering the dead-end pore, and (c) radial distribution function of the three pressures at the same burial time.
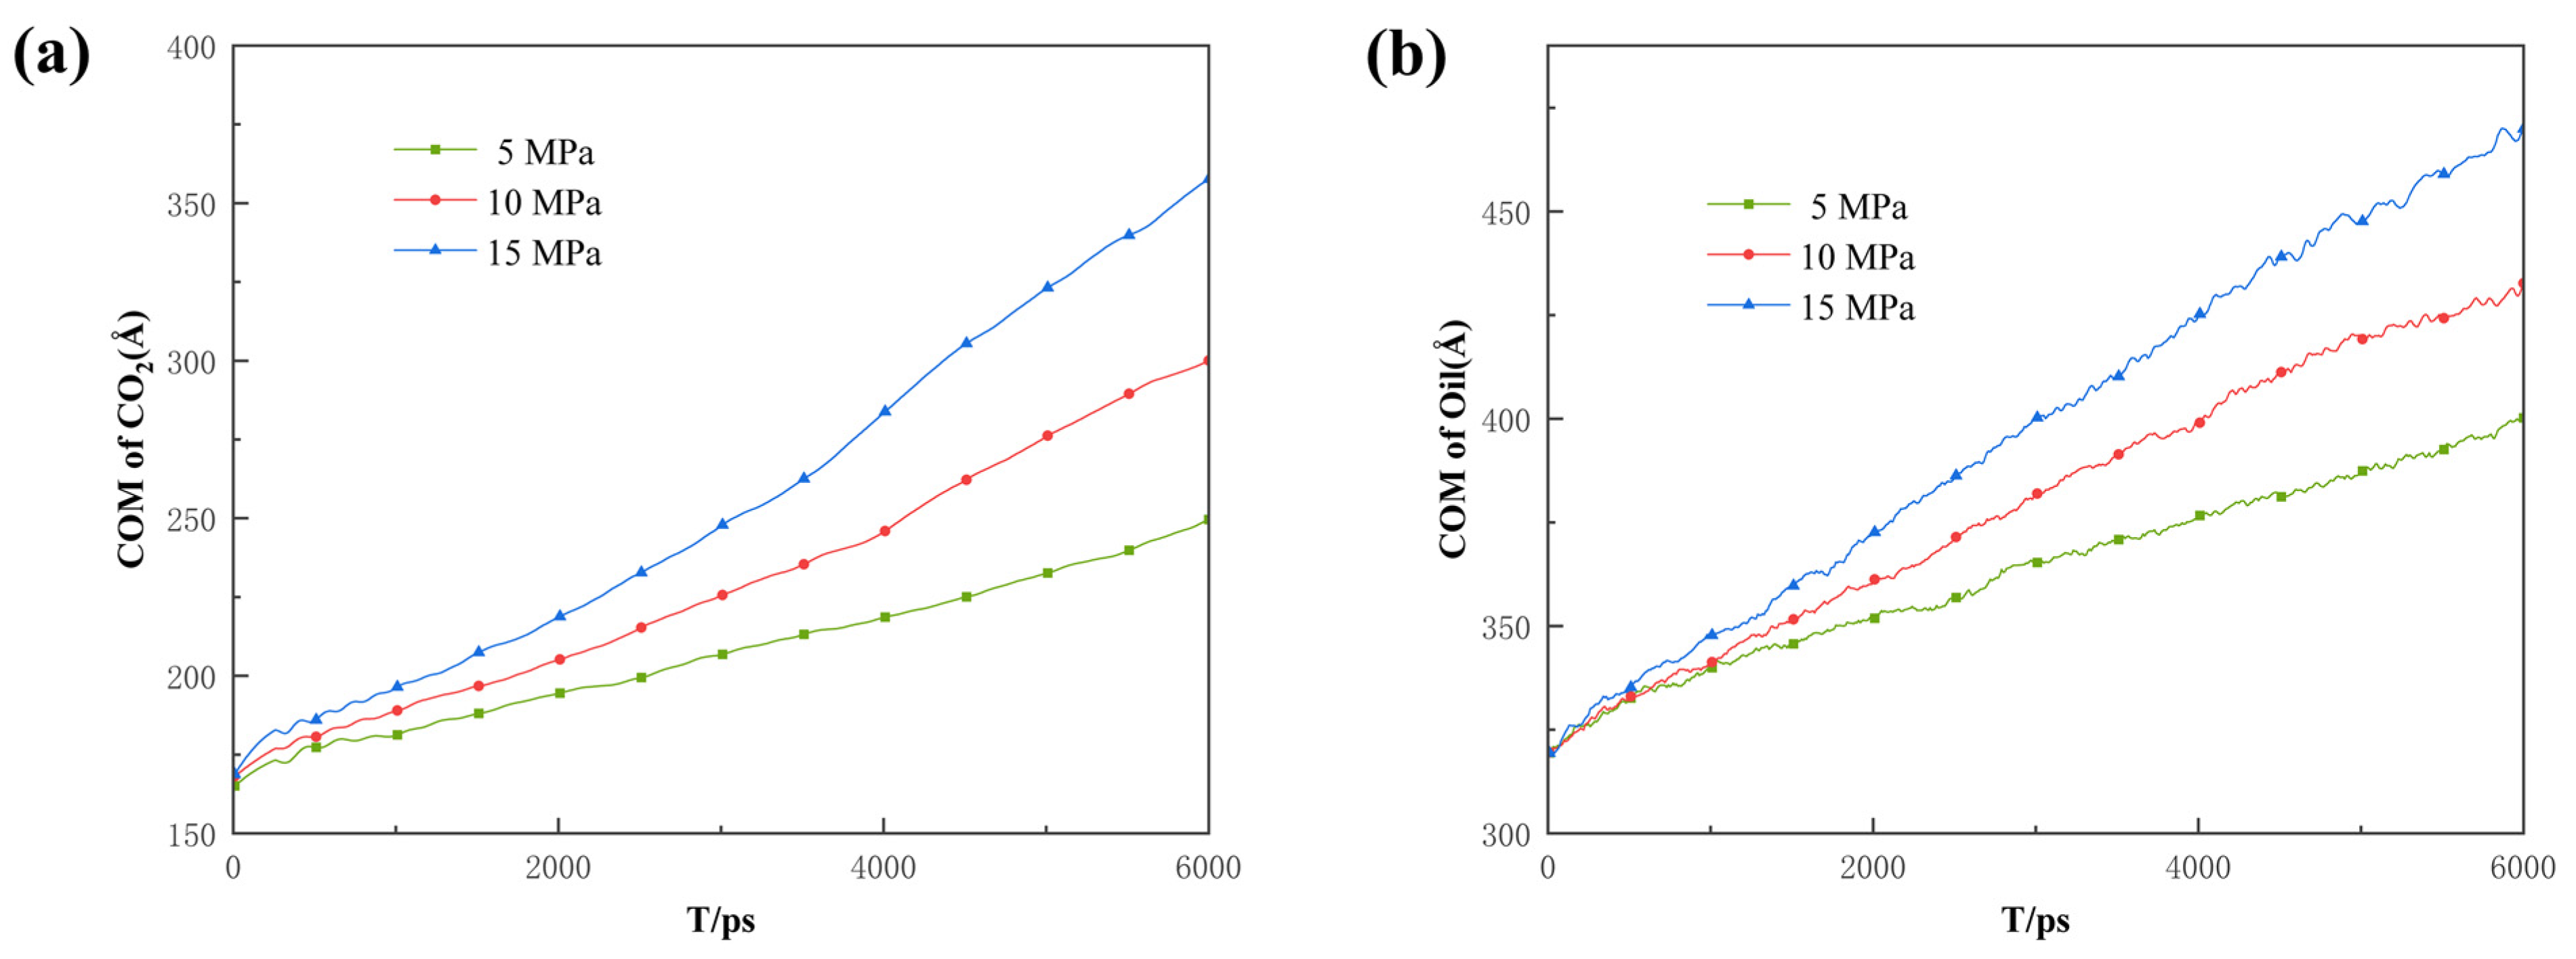
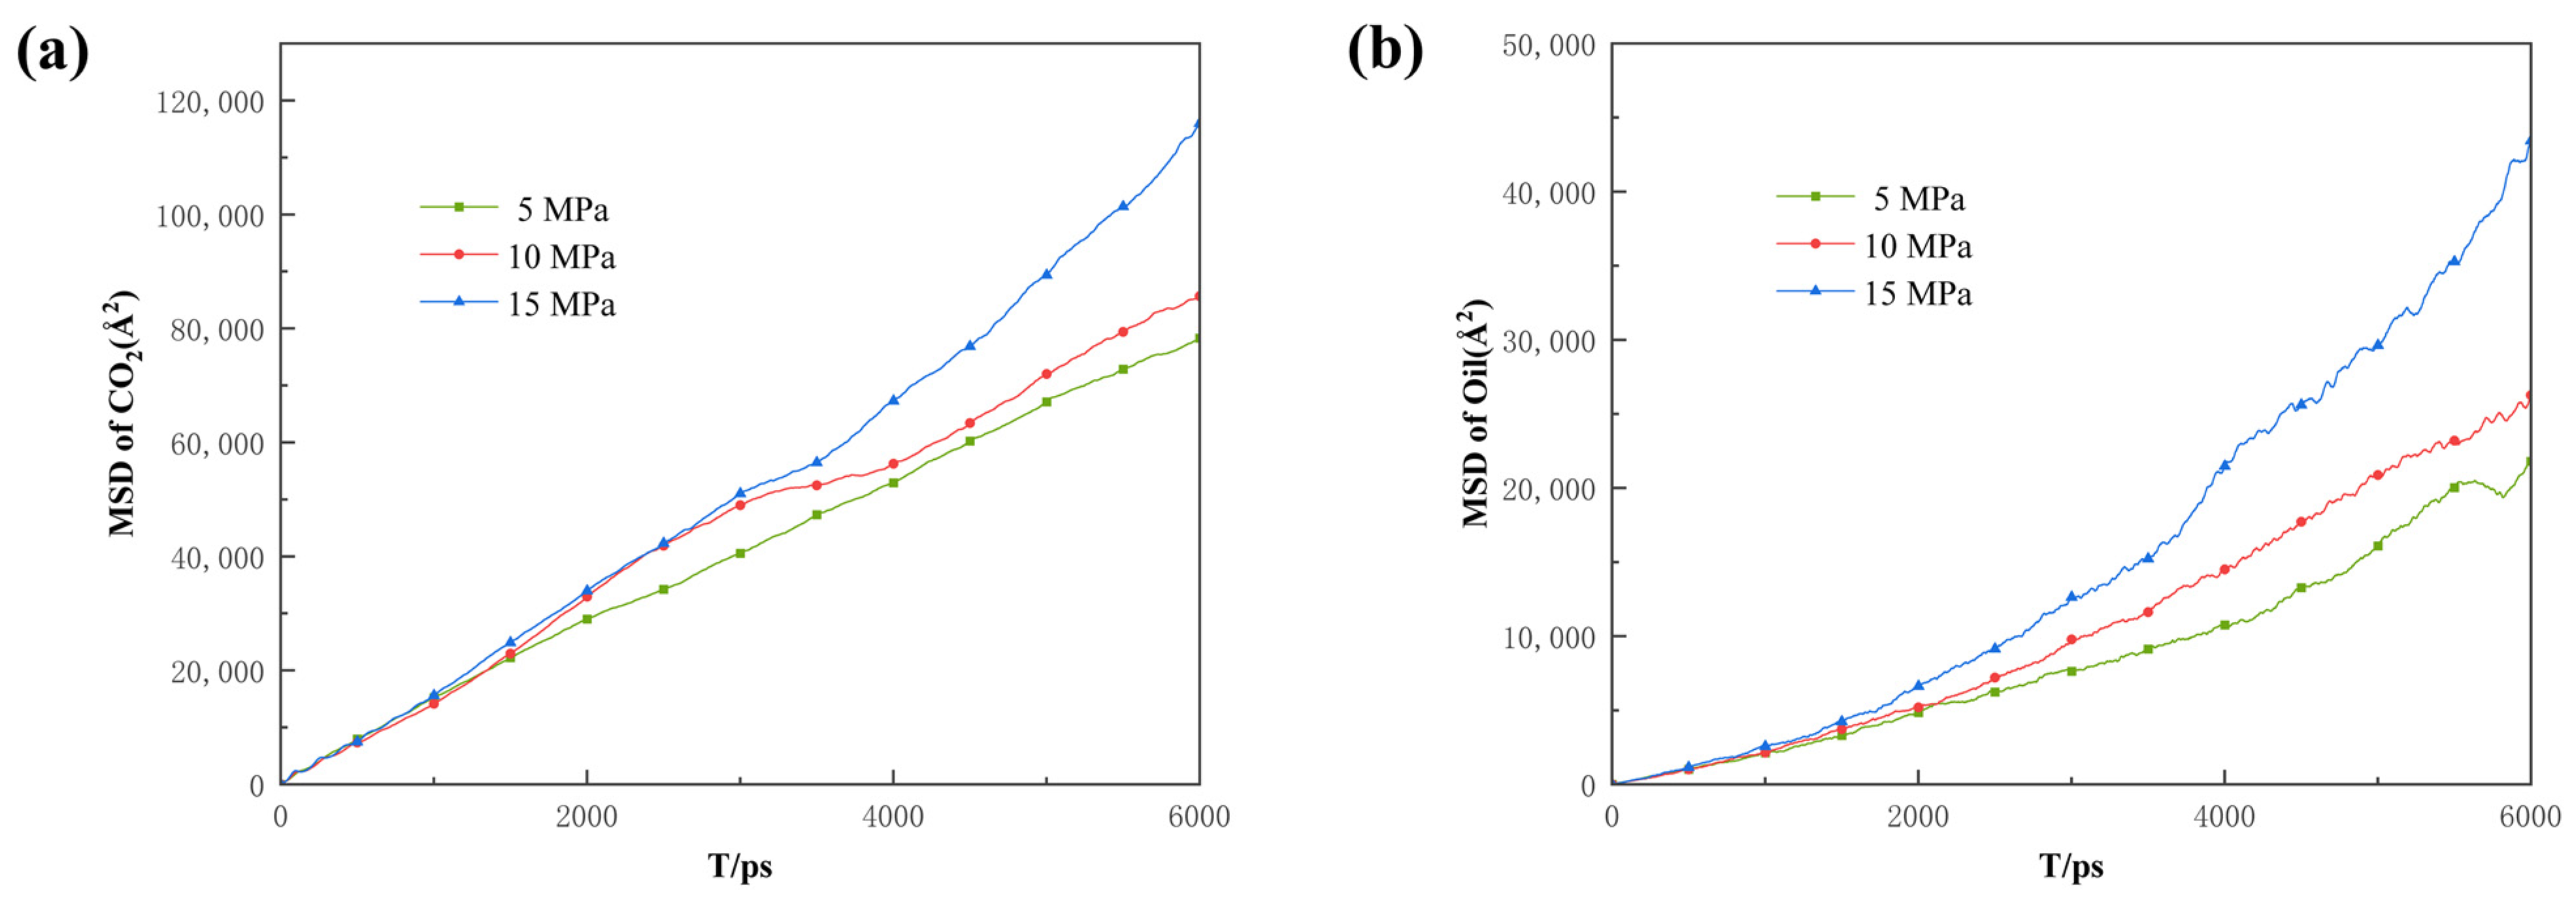
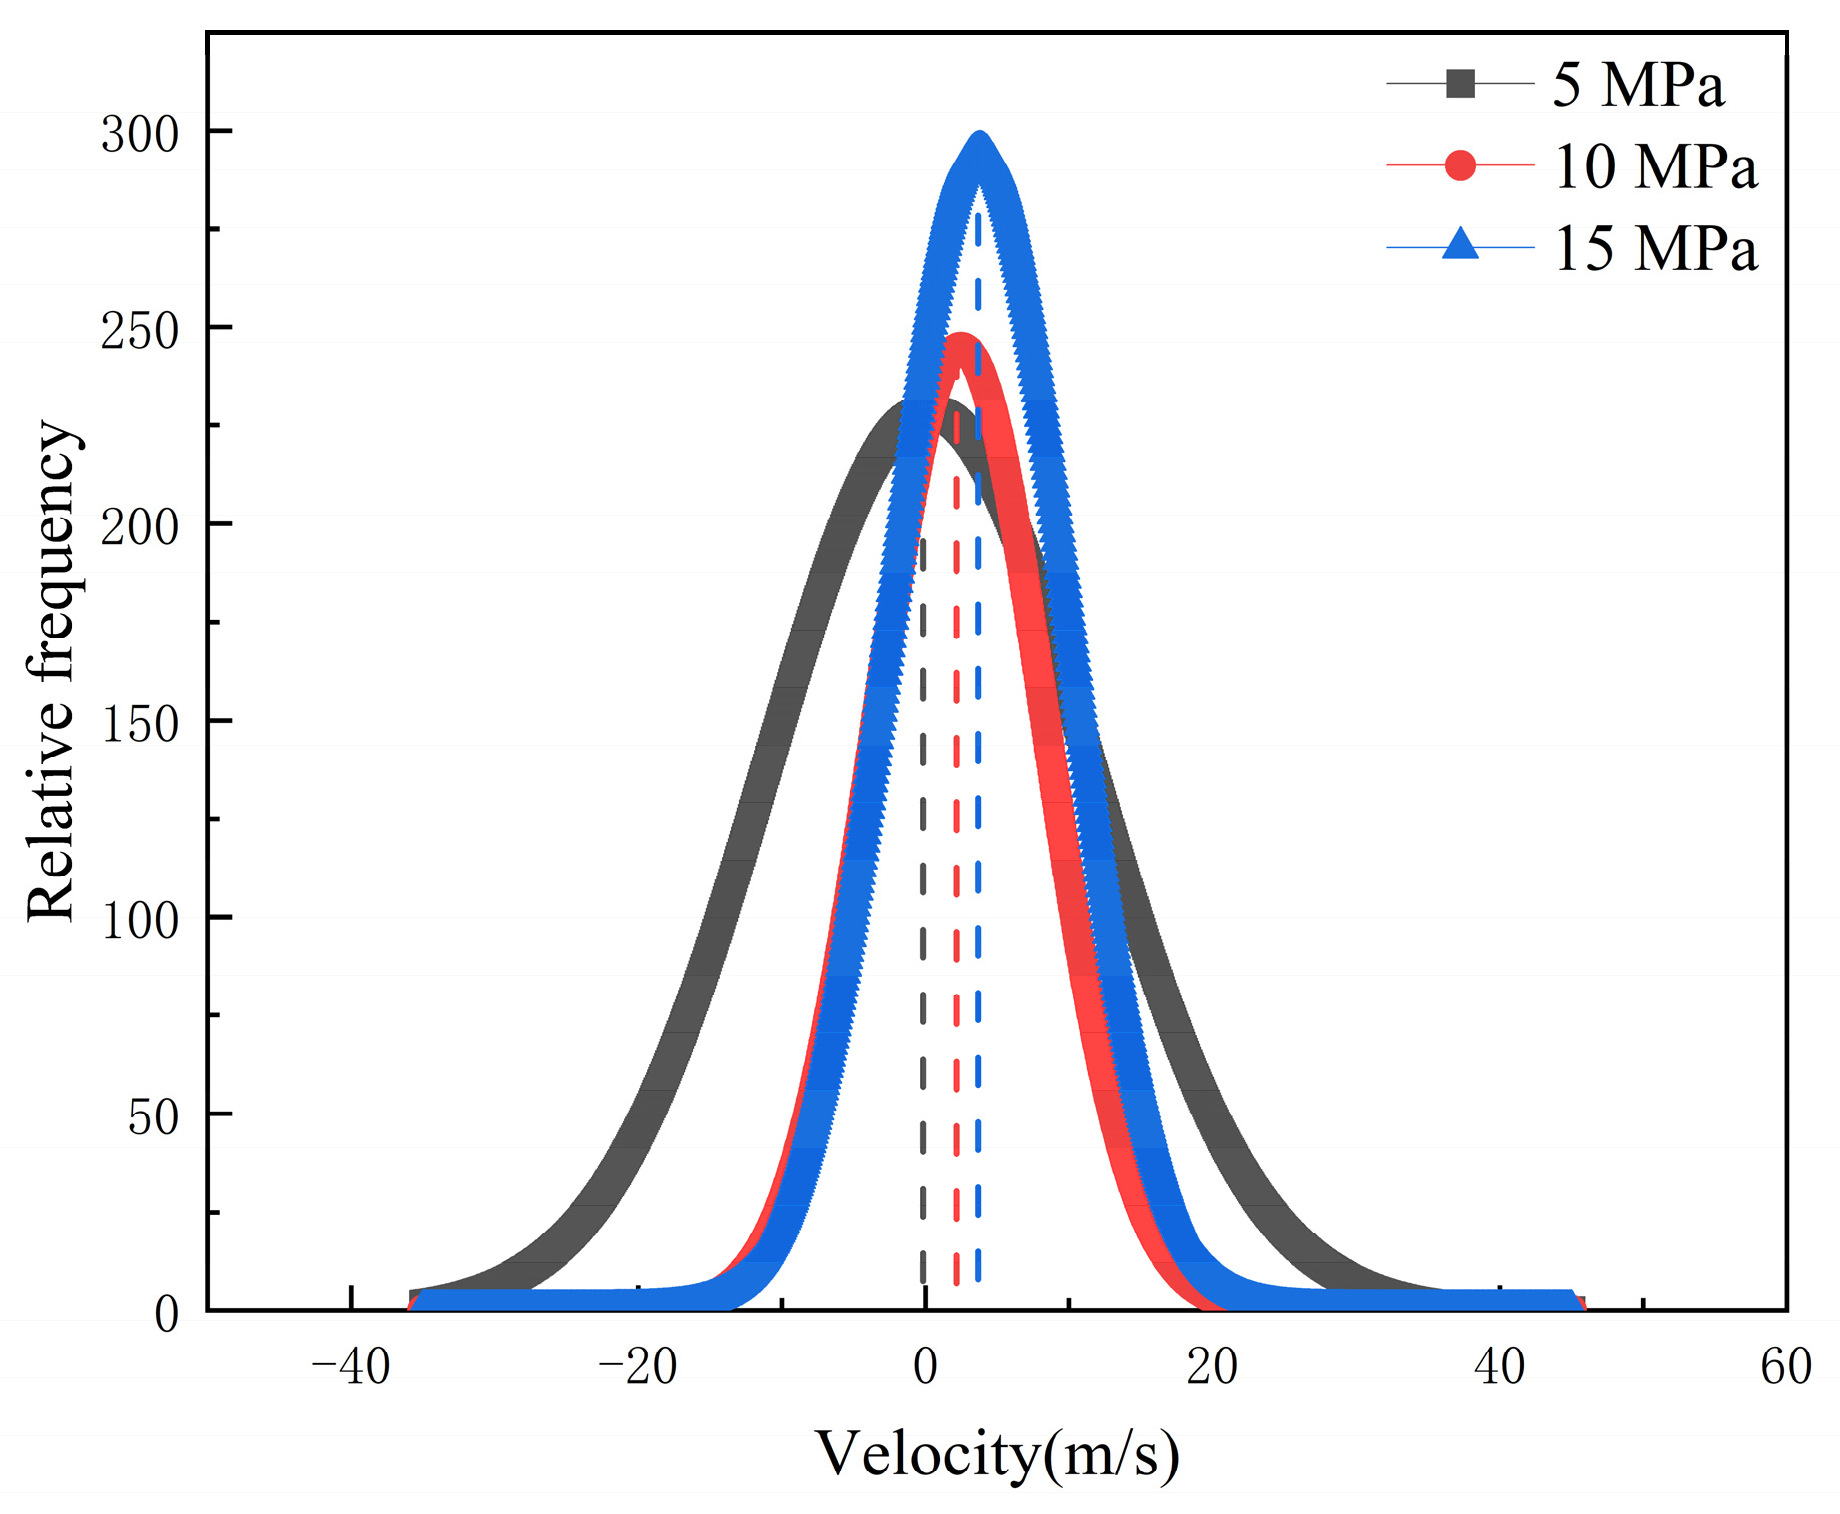
Additionally, the COM and MSD displacement and rate constants for CO2 absorption within the pores were calculated to describe the influence of pressure on the mobility of different fluids. As can be seen in Figure 14, Figure 15 and Figure 16, the CO2 molecules have better mobility within the pore channel when there is a large pressure difference during the sequestration process. These molecules can easily enter the dead-end, thus increasing the chance of CO2 sequestration and improving the sequestration effect. The data in Figure 16 also demonstrate that the higher the pressure, the greater the rate constant is for CO2 absorption. Therefore, in the practical application of CO2 storage technology, the mobility factor needs to be fully considered and controlled in order to achieve better CO2 storage.
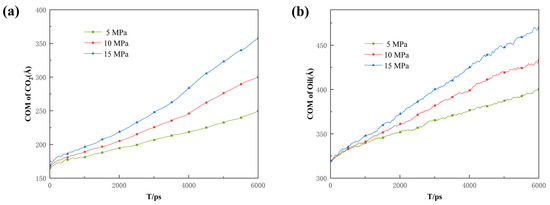
Figure 14.
Displacement of the center of mass of (a) CO2 and (b) oil under different differential pressure conditions.
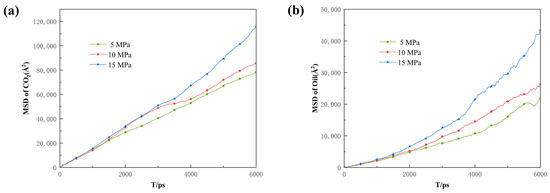
Figure 15.
Root mean square displacement of (a) CO2 and (b) oil under different differential pressure conditions.
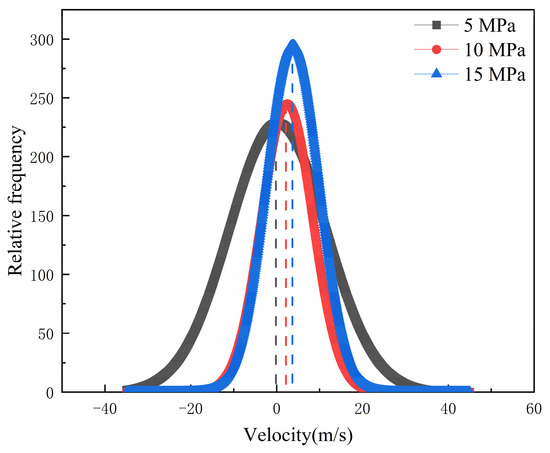
Figure 16.
Rate constants for CO2 absorption under different differential pressure conditions.
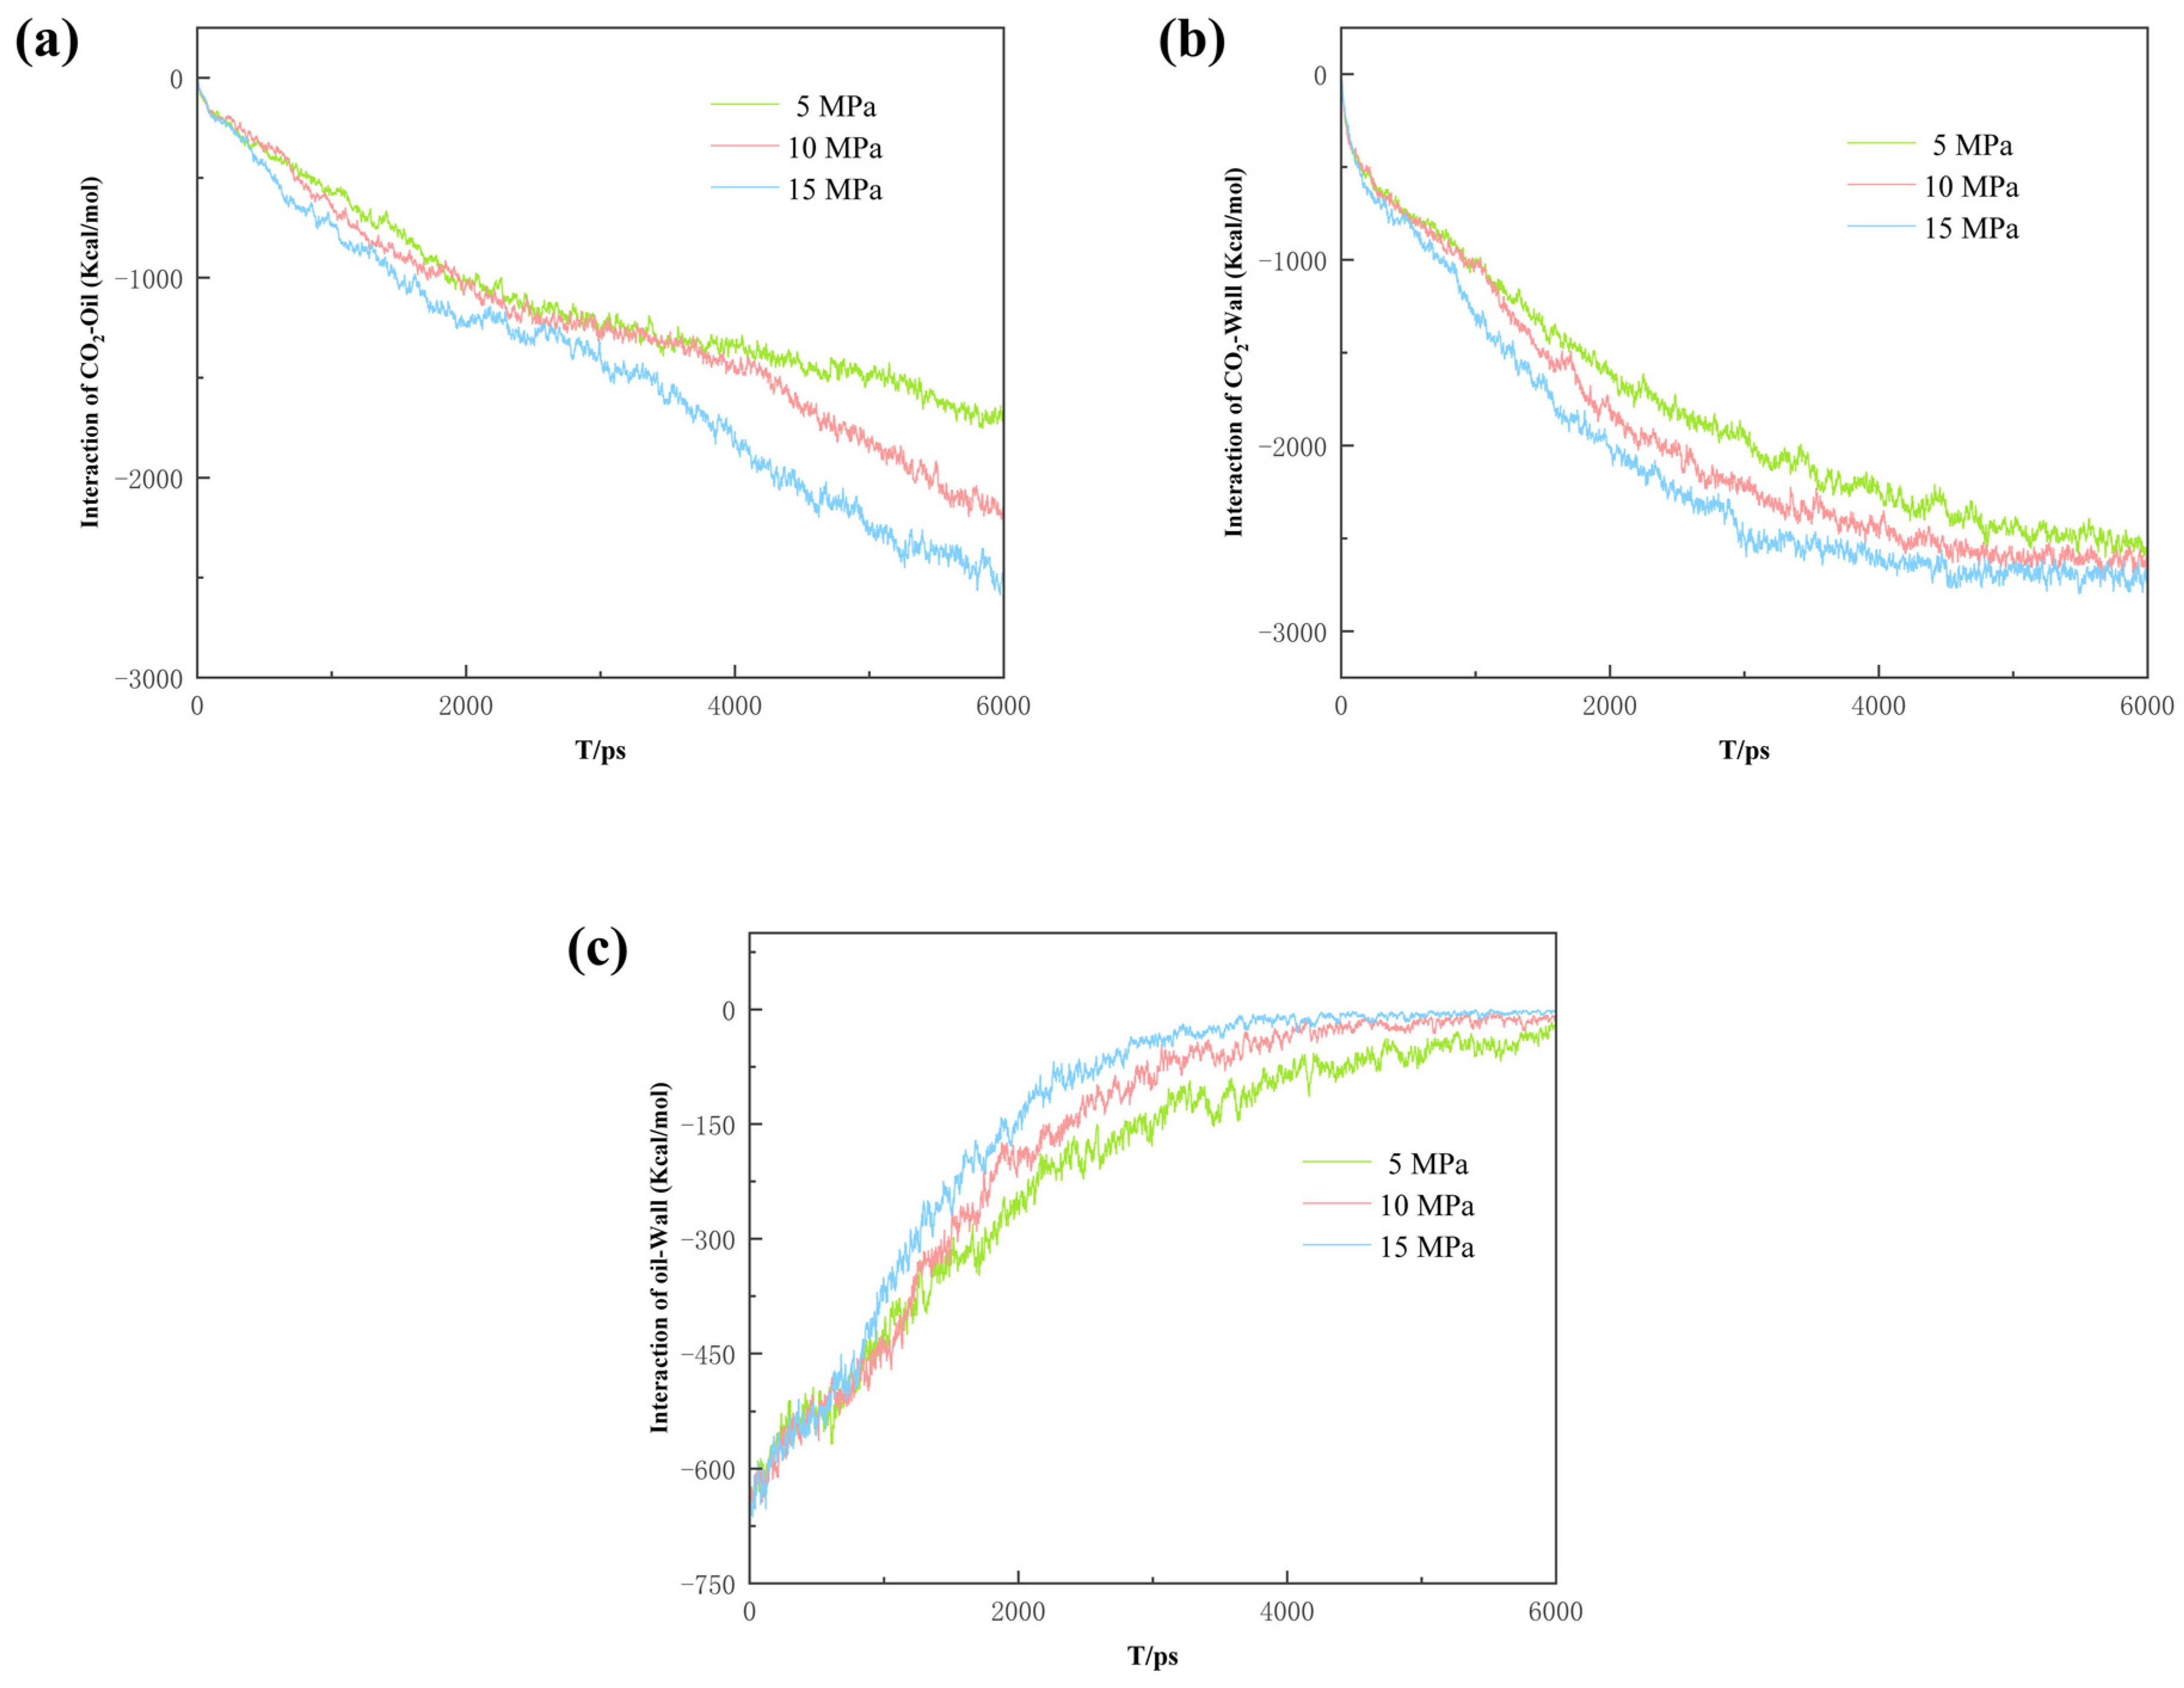
In order to explore the interaction between the phases under different differential pressure conditions, interaction energy calculations were carried out. According to Figure 17a, the Eoil-CO2 shows a plateau period under low pressure conditions, which is due to the lack of sufficient external driving force in the orifice. When the CO2 molecules are close to the dead-end, they are inhibited from moving further towards the exit due to the enhanced Eoil-CO2 from the increased contact area with the oil molecules. However, this plateau period is not obvious under high pressure conditions due to an external driving force sufficient to overcome the Eoil-CO2. On the other hand, the CO2 flows faster due to high pressure and is more inclined to enter the main channel rather than go into the dead-end. As seen in Figure 17b, the EWall-CO2 increases with the increase in pressure difference, which corresponds to the Eoil-Wall in Figure 17c. During the process of CO2 stripping the crude oil, the higher the pressure difference, the stronger the interaction between the CO2 and the rock. The results suggest a strong influence of the pressure difference on the CO2’s sequestration effect. And, the increase in pressure difference enhances the EWall-CO2 and, thus, strengthens the resistance that the CO2 needs to overcome to escape. Therefore, pressure needs to be increased appropriately to improve the sequestration performance of a pore when considering CO2 sequestration.
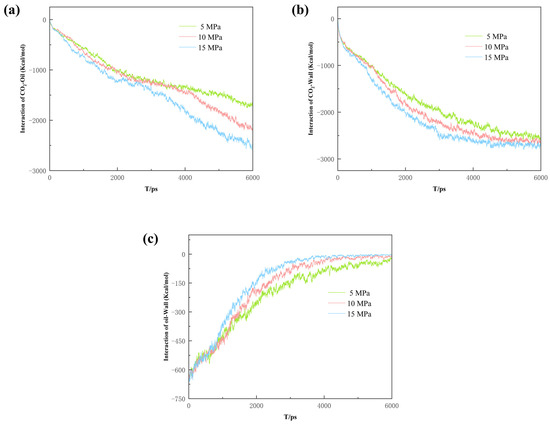
Figure 17.
(a) CO2–oil interaction energy, (b) CO2–wall interaction energy, and (c) oil–wall interaction energy.
During CO2 sequestration, one of the CO2 molecules was marked and the others were hidden in order to better observe the trajectory of the molecules within the dead-end. Figure 18 shows that the CO2 molecule exhibits a swirling pattern of movement in the dead-end pore and interacts with the oil molecules, which strongly increases the chances of contact with and diffusion in the pore wall. Furthermore, it enhances the contact between the CO2 molecules, the rock wall’s surface, and the oil compared to the linear motion in the main channel. As a result, it is easier for the CO2 molecules to remain within the pore space, further improving the sequestration efficiency.

Figure 18.
Snapshots of a CO2 molecule at (a) different periods, (b) 350 ps, (c) 680 ps, (d) 1080 ps, and (e) 2110 ps inside a dead-end pore. (The red molecule represent the CO2 molecule and the blue dotted lines and arrows represent the movement of the molecules).
4. Conclusions
Molecular dynamics simulation was used to investigate the effects of different differential pressures and pore structures on CO2 displacement and sequestration. The main points are summarized as follows:
- (1)
- In different dead-end systems, the replacement efficiency varies due to the size of the dead-ends. With a larger size, carbon dioxide cannot occupy the pore wall fast enough, resulting in a lower replacement efficiency. A smaller dead-end shows a higher replacement efficiency. This is because the CO2 molecules in the dead-end are presented with less obstructions: although a smaller dead-end is more difficult to enter, it presents fewer oil molecules in its middle region, producing less obstructions for the CO2. Therefore, the CO2 can form a more coherent, thicker adsorption layer in the main channel and dissolve the oil molecules in the dead-end, thus completing CO2 burial in the dead-end more rapidly.
- (2)
- In the pores with different main channels observed, the larger main channel facilitated a more extensive contact between the CO2 and the oil, leading to a faster stripping time and promoting the oil’s expansion and viscosity reduction. This, in turn, reduced interfacial tension and resulted in better mixing and a higher displacement efficiency.
- (3)
- The injection pressure of CO2 had a significant impact on its sequestration. As the pressure difference increased, the rate of CO2 entering the dead-ends significantly improved, resulting in a better sequestration. Furthermore, the CO2 exhibited vortex motion within the dead-end, which enhanced the contact between the CO2 molecules, the pore walls, and the oil molecules. This enhanced contact increased the difficulty for the CO2 molecules to escape, implying that dead-ends play a crucial role in CO2 sequestration and have a positive effect on long-term CO2 storage.
The above findings reveal the influence of different factors in the geological storage of CO2 and provide a guidance for optimizing the storage process. In practical applications, this method is expected to help improve CO2 storage efficiency, reduce greenhouse gas emissions, and provide support and a reference for achieving long-term, sustainable CO2 storage. By comparing the results of the study with existing CO2 storage methods, it is possible to complete experimentally unmeasurable nanoscale sequestration scenarios, thus improving the potential of existing storage strategies.
Supplementary Materials
The following supporting information can be downloaded at: https://www.mdpi.com/article/10.3390/en16217341/s1, Table S1: Force field parameters for oil, gas, and quartz; Table S2: Molecular numbers; Table S3: Simulated box sizes.
Author Contributions
Writing—original draft, writing—review and editing, and conceptualization, Z.J.; writing—original draft, methodology, and conceptualization, C.H.; data curation and formal analysis, Y.S.; supervision, X.Y.; supervision, H.F.; writing—review and editing, X.L.; writing—review and editing, S.L.; validation and software, W.L. All authors have read and agreed to the published version of the manuscript.
Funding
This research was funded by the National Natural Science Foundation of China (22101300), the Shandong Natural Science Foundation (ZR2020ME053, ZR2020QB027, ZR2022ME105, and ZR2023ME004), the Qingdao Natural Science Foundation (23-2-1-232-zyyd-jch), the State Key Laboratory of Enhanced Oil Recovery’s Open Fund-Funded Project (2022-KFKT-28), the Major Special Projects of the CNPC (2021ZZ01-03 and 2021ZZ01-05), and the Fundamental Research Funds for the Central Universities (22CX03010A, 20CX06007A, and 22CX01002A-1).
Data Availability Statement
Not applicable.
Acknowledgments
The support given by the National Natural Science Foundation of China, the Shandong Natural Science Foundation, the Qingdao Natural Science Foundation, the State Key Laboratory of Enhanced Oil Recovery’s Open Fund-Funded Project, the Major Special Projects of the CNPC, and the Fundamental Research Funds for the Central Universities is acknowledged.
Conflicts of Interest
The authors declare no conflict of interest.
References
- Qiu, S.; Lei, T.; Wu, J.; Bi, S. Energy Demand and Supply Planning of China through 2060. Energy 2021, 234, 121193. [Google Scholar]
- Singh, M.; Mahmoodpour, S.; Ershadnia, R.; Soltanian, M.R.; Sass, I. Comparative study on heat extraction from Soultz-sous-Forêts geothermal field using supercritical carbon dioxide and water as the working fluid. Energy 2023, 266, 126388. [Google Scholar]
- Mahmoodpour, S.; Singh, M.; Mahyapour, R.; Omrani, S.; Sass, I. Numerical Simulation of Carbon Dioxide–Nitrogen Mixture Dissolution in Water-Saturated Porous Media: Considering Cross-Diffusion Effects. Fluids 2023, 8, 22. [Google Scholar]
- Zhang, S.; DePaolo, D.J. Rates of CO2 mineralization in geological carbon storage. Acc. Chem. Res. 2017, 50, 2075–2084. [Google Scholar] [PubMed]
- Wang, H.; Lu, Y.; Zhang, X.; Fan, Q.; Li, Q.; Zhang, L.; Zhao, J.; Yang, L.; Song, Y. Molecular Dynamics of Carbon Sequestration via Forming CO2 Hydrate in a Marine Environment. Energy Fuels 2023, 37, 9307–9317. [Google Scholar]
- McCaughan, J.; Iglauer, S.; Bresme, F. Molecular dynamics simulation of water/CO2-quartz interfacial properties: Application to subsurface gas injection. Energy Procedia 2013, 37, 5387–5402. [Google Scholar]
- Cheng, Y.; Liu, W.; Xu, T.; Zhang, Y.; Zhang, X.; Xing, Y.; Feng, B.; Xia, Y. Seismicity induced by geological CO2 storage: A review. Earth-Sci. Rev. 2023, 239, 104369. [Google Scholar]
- Wang, X.; Van ’t Veld, K.; Marcy, P.; Huzurbazar, S.; Alvarado, V. Economic co-optimization of oil recovery and CO2 sequestration. Appl. Energy 2018, 222, 132–147. [Google Scholar]
- Ajoma, E.; Saira; Sungkachart, T.; Ge, J.; Le-Hussain, F. Water-saturated CO2 injection to improve oil recovery and CO2 storage. Appl. Energy 2020, 266, 114853. [Google Scholar]
- Alam, M.M.M.; Hassan, A.; Mahmoud, M.; Sibaweihi, N.; Patil, S. Dual Benefits of Enhanced Oil Recovery and CO2 Sequestration: The Impact of CO2 Injection Approach on Oil Recovery. Front. Energy Res. 2022, 10, 877212. [Google Scholar]
- Han, D.Y.; Cao, Z.B.; Xu, X.Q. Study on Solvent Extraction of Mongolia Outcrop Oil Sands. Energy Sources Part A Recovery Util. Environ. Eff. 2013, 35, 13–16. [Google Scholar] [CrossRef]
- Shakiba, M.; Ayatollahi, S.; Riazi, M. Activating solution gas drive as an extra oil production mechanism after carbonated water injection. Chin. J. Chem. Eng. 2020, 28, 2938–2945. [Google Scholar] [CrossRef]
- Wan, J.; Peng, T.; Jurado, M.J.; Shen, R.; Yuan, G.; Ban, F. The influence of the water injection method on two-well-horizontal salt cavern construction. J. Pet. Sci. Eng. 2019, 184, 106560. [Google Scholar] [CrossRef]
- Yu, T.; Li, Q.; Hu, H.; Tan, Y.; Xu, L. Residual oil retention and stripping mechanism of hydrophilic pore surfaces during CO2 and N2 combined gas flooding. J. Pet. Sci. Eng. 2022, 218, 110989. [Google Scholar] [CrossRef]
- Wang, Q.; Zheng, W.; Liu, J.; Cao, B.; Hao, J.; Lu, X.; Zheng, K.; Cui, L.; Cui, T.; Sun, H. Integration of Profile Control and Thermal Recovery to Enhance Heavy Oil Recovery. Energies 2022, 15, 7346. [Google Scholar] [CrossRef]
- Janssen, M.T.G.; Mutawa, A.S.; Pilus, R.M.; Zitha, P.L.J. Foam-assisted chemical flooding for enhanced oil recovery: Effects of slug salinity and drive foam strength. Energy Fuels 2019, 33, 4951–4963. [Google Scholar] [CrossRef]
- Sun, G.; Liu, D.; Li, C.; Yang, D.; Wei, G.; Yang, F.; Yao, B. Effects of dissolved CO2 on the crude oil/water interfacial viscoelasticity and the macroscopic stability of water-in-crude oil emulsion. Energy Fuels 2018, 32, 9330–9339. [Google Scholar] [CrossRef]
- Kang, Y.; Zhang, L.; Luo, J.; Guo, Y.; Cheng, S.; Wu, D.; Li, K.; Guo, S. Molecular dynamics simulation of CO2 dissolution-diffusion in multi-component crude oil. Front. Environ. Sci. 2023, 11, 1243854. [Google Scholar] [CrossRef]
- Liu, B.; Shi, J.; Wang, M.; Zhang, J.; Sun, B.; Shen, Y.; Sun, X. Reduction in interfacial tension of water–oil interface by supercritical CO2 in enhanced oil recovery processes studied with molecular dynamics simulation. J. Supercrit. Fluids 2016, 111, 171–178. [Google Scholar] [CrossRef]
- Ma, Z.; Ranjith, P.G. Review of application of molecular dynamics simulations in geological sequestration of carbon dioxide. Fuel 2019, 255, 115644. [Google Scholar] [CrossRef]
- Hamza, A.; Hussein, I.A.; Al-Marri, M.J.; Mahmoud, M.; Shawabkeh, R.; Aparicio, S. CO2 enhanced gas recovery and sequestration in depleted gas reservoirs: A review. J. Pet. Sci. Eng. 2020, 196, 107685. [Google Scholar]
- Perera, M.S.A.; Gamage, R.P.; Rathnaweera, T.D.; Ranathunga, A.S.; Koay, A.; Choi, X. A review of CO2-enhanced oil recovery with a simulated sensitivity analysis. Energies 2016, 9, 481. [Google Scholar] [CrossRef]
- Hosseinzadeh Dehaghani, Y.; Assareh, M.; Feyzi, F. Simultaneous Prediction of Equilibrium, Interfacial, and Transport Properties of CO2-Brine Systems Using Molecular Dynamics Simulation: Applications to CO2 Storage. Ind. Eng. Chem. Res. 2022, 61, 15390–15406. [Google Scholar] [CrossRef]
- Yu, H.; Lebedev, M.; Zhou, J.; Lu, M.; Li, X.; Wang, Z.; Han, T.; Zhang, Y.; Johnson, L.M.; Iglauer, S. The rock mechanical properties of lacustrine shales: Argillaceous shales versus silty laminae shales. Mar. Pet. Geol. 2022, 141, 105707. [Google Scholar]
- Wang, Y.; Liu, L.; Cheng, H. Gas adsorption characterization of pore structure of organic-rich shale: Insights into contribution of organic matter to shale pore network. Nat. Resour. Res. 2021, 30, 2377–2395. [Google Scholar]
- Liu, K.; Ostadhassan, M.; Zhou, J.; Gentzis, T.; Rezaee, R. Nanoscale pore structure characterization of the Bakken shale in the USA. Fuel 2017, 209, 567–578. [Google Scholar]
- Nelson, P.H. Pore-throat sizes in sandstones, tight sandstones, and shales. AAPG Bull. 2009, 93, 329–340. [Google Scholar]
- Yang, G.; Zeng, J.; Qiao, J.; Liu, Y.; Liu, S.; Jia, W.; Cao, W.; Wang, C.; Geng, F.; Wei, W. Role of Organic Matter, Mineral, and Rock Fabric in the Full-Scale Pore and Fracture Network Development in the Mixed Lacustrine Source Rock System. Energy Fuels 2022, 36, 8161–8179. [Google Scholar]
- Foroozesh, J.; Abdalla, A.I.M.; Zhang, Z. Pore network modeling of shale gas reservoirs: Gas desorption and slip flow effects. Transp. Porous Media 2019, 126, 633–653. [Google Scholar]
- Wang, F.; Zai, Y. Fractal and multifractal characteristics of shale nanopores. Results Phys. 2021, 25, 104277. [Google Scholar] [CrossRef]
- Kar, A.; Chiang, T.Y.; Ortiz Rivera, I.; Sen, A.; Velegol, D. Enhanced transport into and out of dead-end pores. ACS Nano 2015, 9, 746–753. [Google Scholar] [CrossRef] [PubMed]
- Zhao, J.; Jin, Z.; Jin, Z.; Hu, Q.; Hu, Z.; Du, W.; Yan, C.; Geng, Y. Mineral types and organic matters of the Ordovician-Silurian Wufeng and Longmaxi Shale in the Sichuan Basin, China: Implications for pore systems, diagenetic pathways, and reservoir quality in fine-grained sedimentary rocks. Mar. Pet. Geol. 2017, 86, 655–674. [Google Scholar]
- Liu, J.; Xie, H.; Wang, Q.; Chen, S.; Hu, Z. Influence of pore structure on shale gas recovery with CO2 sequestration: Insight into molecular mechanisms. Energy Fuels 2019, 34, 1240–1250. [Google Scholar]
- Fathaddin, M.T.; Awang, M.B.; Ardjani, K. A numerical study of pressure changes in dead-end pores. J. Hydrol. Hydromech. 2008, 56, 23–33. [Google Scholar]
- Wang, X.; Zhou, J.; Sun, X.; Tian, S.; Tang, J.; Shen, F.; Wu, J. The influences of composition and pore structure on the adsorption behavior of CH4 and CO2 on shale. Front. Earth Sci. 2021, 15, 283–300. [Google Scholar]
- Luo, Y.; Liu, X.; Xiao, H.; Zheng, T. Microscopic production characteristics of tight oil in the nanopores of different CO2-affected areas from molecular dynamics simulations. Sep. Purif. Technol. 2023, 306, 122607. [Google Scholar]
- Luo, Y.; Xiao, H.; Liu, X.; Zheng, T. Occurrence characteristics and influential factors of movable oil in nano-pores by molecular dynamics simulation. Colloids Surf. A Physicochem. Eng. Asp. 2022, 655, 130320. [Google Scholar] [CrossRef]
- Nielsen, L.C.; Bourg, I.C.; Sposito, G. Predicting CO2–water interfacial tension under pressure and temperature conditions of geologic CO2 storage. Geochim. Cosmochim. Acta 2012, 81, 28–38. [Google Scholar]
- Zhao, X.; Sang, Q.; Li, Y.; Liu, H.; Dong, M. CO2-kerogen interaction dominated CO2-oil counter-current diffusion and its effect on ad-/absorbed oil recovery and CO2 sequestration in shale. Fuel 2021, 294, 120500. [Google Scholar]
- Zhang, M.; Jin, Z. Molecular simulation on CO2 adsorption in partially water-saturated kaolinite nanopores in relation to carbon geological sequestration. Chem. Eng. J. 2022, 450, 138002. [Google Scholar]
- Fang, T.; Zhang, Y.; Ma, R.; Yan, Y.; Dai, C.; Zhang, J. Oil extraction mechanism in CO2 flooding from rough surface: Molecular dynamics simulation. Appl. Surf. Sci. 2019, 494, 80–86. [Google Scholar]
- Chang, Y.; Xiao, S.; Ma, R.; Wang, X.; Zhang, Z.; He, J. Displacement dynamics of trapped oil in rough channels driven by nanofluids. Fuel 2022, 314, 122760. [Google Scholar]
- Lu, P.; Mo, T.; Wei, Y.; Guo, Z.; Feng, G. Molecular insight into oil displacement by CO2 flooding on rough silica surface. J. Supercrit. Fluids 2022, 181, 105507. [Google Scholar] [CrossRef]
- Luan, Y.; Liu, B.; Hao, P.; Zhan, K.; Liu, J. Oil displacement by supercritical CO2 in a water cut dead-end pore: Molecular dynamics simulation. J. Pet. Sci. Eng. 2020, 188, 106899. [Google Scholar] [CrossRef]
- Luan, Y.; Dou, X.; Zhou, Y.; Hao, P.; Liu, B.; Liu, J. Effect of the Water Film Rupture on the Oil Displacement by Supercritical CO2 in the Nanopore: Molecular Dynamics Simulations. Energy Fuels 2022, 36, 4348–4357. [Google Scholar] [CrossRef]
- Emmings, J.F.; Dowey, P.J.; Taylor, K.G.; Davies, S.J.; Vane, C.H.; Moss-Hayes, V.; Rushton, J.C. Origin and implications of early diagenetic quartz in the Mississippian Bowland Shale Formation, Craven Basin, UK. Mar. Pet. Geol. 2020, 120, 104567. [Google Scholar]
- Xu, K.; Chen, S.; Lu, J.; Li, Y.; Yin, X.; Wu, X.; Li, C. Molecular Simulation Analysis of Methane Adsorption Micromechanisms and the Impact of Water Saturation on Methane Adsorption in Transitional Shale. Lithosphere 2022, 2022, 8195502. [Google Scholar]
- Wang, S.; Javadpour, F.; Feng, Q. Molecular dynamics simulations of oil transport through inorganic nanopores in shale. Fuel 2016, 171, 74–86. [Google Scholar]
- Beckedahl, D.; Obaga, E.O.; Uken, D.A.; Sergi, A.; Ferrario, M. On the configurational temperature Nosè-Hoover thermostat. Physica A 2016, 461, 19–35. [Google Scholar] [CrossRef]
- Heinz, H.; Lin, T.J.; Kishore Mishra, R.; Emami, F.S. Thermodynamically consistent force fields for the assembly of inorganic, organic, and biological nanostructures: The INTERFACE force field. Langmuir 2013, 29, 1754–1765. [Google Scholar]
- Trinh, T.T.; Vlugt, T.J.; Kjelstrup, S. Thermal conductivity of carbon dioxide from non-equilibrium molecular dynamics: A systematic study of several common force fields. J. Chem. Phys. 2014, 141, 134504. [Google Scholar] [CrossRef] [PubMed]
- Cygan, R.T.; Greathouse, J.A.; Kalinichev, A.G. Advances in Clayff Molecular Simulation of Layered and Nanoporous Materials and Their Aqueous Interfaces. J. Chem. Phys. 2021, 125, 17573–17589. [Google Scholar] [CrossRef]
- Argüello-Luengo, J.; González-Tudela, A.; Shi, T.; Zoller, P.; Cirac, J.I. Analogue quantum chemistry simulation. Nature 2019, 574, 215–218. [Google Scholar] [CrossRef]
- Granados-Bazan, E.L.; Quinones-Cisneros, S.E.; Deiters, U.K. Structure and contact angle in sessile droplets of binary mixtures of Lennard-Jones chains: A molecular dynamics study. Langmuir 2021, 37, 10945–10957. [Google Scholar] [CrossRef]
- Forsman, J.; Woodward, C.E. Limitations of the Derjaguin approximation and the Lorentz−Berthelot mixing rule. Langmuir 2010, 26, 4555–4558. [Google Scholar] [CrossRef] [PubMed]
Disclaimer/Publisher’s Note: The statements, opinions and data contained in all publications are solely those of the individual author(s) and contributor(s) and not of MDPI and/or the editor(s). MDPI and/or the editor(s) disclaim responsibility for any injury to people or property resulting from any ideas, methods, instructions or products referred to in the content. |
© 2023 by the authors. Licensee MDPI, Basel, Switzerland. This article is an open access article distributed under the terms and conditions of the Creative Commons Attribution (CC BY) license (https://creativecommons.org/licenses/by/4.0/).

