Article

Pollutant Emissions from Municipal Biowaste Composting: Comparative Analysis and Contribution of N-Containing Organic Compounds

1
Winogradsky Institute of Microbiology, Research Center of Biotechnology, Russian Academy of Sciences, Moscow 119071, Russia
2
Bach Institute of Biochemistry, Research Center of Biotechnology, Russian Academy of Sciences, Moscow 119071, Russia
3
Biological Faculty, Lomonosov Moscow State University, Moscow 119991, Russia
4
College of Harbour and Coastal Engineering, Jimei University, Xiamen 361021, China
*
Author to whom correspondence should be addressed.
Energies 2023, 16(21), 7271; https://doi.org/10.3390/en16217271
Submission received: 20 September 2023 / Revised: 7 October 2023 / Accepted: 14 October 2023 / Published: 26 October 2023
(This article belongs to the Special Issue Waste Management and Bio-Energy Production)

Abstract

:
The disposal of municipal biowaste is associated with the formation of malodorous and frequently hazardous volatile compounds. The composition of volatile pollutants formed during composting of mechanically sorted organic fraction of municipal solid waste (ms-OFMSW), sewage sludge (SS), food waste (FW), and wood waste (WC) during 28 days in a laboratory setup was analysed using electrochemical measurements, gas chromatography, and solid phase microextraction. Despite the close biodegradation intensity of SS+WC, ms-OFMSW, and FW+WC, the average temperature values were 57.0, 51.7, and 50.6 °C. The emission of volatile substances per day were: CO2 0.64, 0.68, and 0.64 g/kg, NH3 22.3, 93.1, and 4.9 µg/kg, CH4 5.3, 1.5 and 8.7 mg/kg, H2S 5.0, 3.3 and 1.8 µg/kg organic matter. The ratios of emission from SS+FW, ms-OFMSW and FW+WC for inorganic substances were 1.0, 1.1, and 1.0, and for organic compounds (VOC) were 1, 24, and 123. A total of 121 VOC was identified. The 12 N-containing compounds detected at the beginning of composting, some of which are highly toxic, ranged from 3.2 to 21.0% of the total VOC and belonged to amines with a very low olfactory thresholds and heterocyclic compounds. The results of this research help to optimise the systems used to remove pollutants from exhaust air.

1. Introduction

Unstable municipal solid waste (MSW) mainly includes mechanically separated organic fraction of municipal solid waste (ms-OFMSW), food waste (FW), sewage sludge (SS), and wood waste (WC) [1,2]. They are all serious sources of environmental pollution resulting from anthropogenic activities [1]. Population growth inevitably leads to an increase in the volume of SS and OFMSW [3,4].
One of the most common methods of treating solid waste is aerobic composting. Despite the clear advantages of this method, simplicity and reliability, the main disadvantage is the emission of a large volume of exhaust air into the atmosphere. Depending on the amount of processing, the volume of exhaust air can range from 50,000 to 240,000 m3 h−1 and contain toxic, hazardous, and odorous volatile compounds (VC), including inorganic gaseous substances and volatile organic compounds (VOC). These include odorous such as ammonia, hydrogen sulphide, S-compounds, some aldehydes, esters, and volatile fatty acids [5,6,7]. Their presence in exhaust air requires the use of effective treatment methods, otherwise such emissions can lead to atmospheric pollution, causing unpleasant living conditions in neighbouring areas and even harming the health of the population. Long-term exposure to some components of these emissions can increase the risk of cancer [8], damage to the central nervous system, and respiratory system [9]. Even if the effect of individual substances on human health is within acceptable limits, their cumulative effect on the organism often exceeds acceptable levels [6].
The composition of VC in the exhaust air is highly dependent on the type and morphology of the waste, the composting period, and the time of year [6]. The variability of the gaseous composition of the emissions creates difficulties for their further purification [9]. It is important to note that different types of waste may be processed in the same production facility, resulting in a different quantitative and qualitative composition of pollutants during different periods of operation. Knowledge of the composition of gas emissions and their relationship to physicochemical parameters will allow more accurate selection of the most effective methods for subsequent filtration [10,11].
Composting of SS releases mainly ammonia (20–75%), terpenes (5–40%), hydrogen sulphide (1–26%), sulphides (up to 8%), and organic acids (1–10%) [5,12]. The generally accepted practice of composting SS+WC as an additional carbon source [12,13] changes the composition of the exhaust air by the appearance of terpenes [14,15]. The main volatile pollutants in the composting of both the ms-OFMSW and the FW are: terpenes, which account for 30–85% of total emissions, alcohols and aldehydes (3–30%), sulphur-containing compounds (3–20%), aromatic compounds (1–15%), ketones (up to 13%), nitrogen-containing (1–10%), organic acids (1–10%), esters (up to 5%) [5,6,7,12,16,17,18,19]. The VC data are obtained under different laboratory and production composting conditions, using different methods, and are expressed in non-comparable units. Most of the publications report values of mass of substances per unit volume of air. In this case, it is difficult to determine the real emission of substances, as each waste has its own values of moisture and biodegradable content. Thus, despite the large amount of available data on VC, it is practically difficult to compare their quantitative and qualitative composition and the dynamics of changes during the composting period. Studies are needed that can characterize emissions from the most commonly composted waste under the same conditions.
Existing research have shown how complex and variable the composition of exhaust air is [2,7,12,13,17,20,21]. Identification of the main odour sources in complex gas mixtures of volatile compounds is possible with high sensitivity and accuracy using GC/MS in combination with a pre-concentration method such as solid phase microextraction (SPME) [5]. Composting waste is associated with significant emissions of malodorous amines. For example, it is known that the olfactory threshold of the most common trimethylamine is less than 0.0001 ppm [22]. Consequently, such odorous compounds are significant air pollutants during composting. Only a few studies mentioned the presence of N-containing organic compounds [5,16], but there are no data on the dynamics of their formation.
We assumed that at the beginning of composting, the proportion of N-compounds in the volume of VOC of the exhaust air will be significant and further their proportion will decrease with the decomposition of proteins. We assumed that different waste compositions would produce different quantitative and qualitative compositions of VC during composting.
The aims of this work were: (i) to study the differences in the quantitative and qualitative composition and dynamics of VC formation during composting of the main types of municipal solid waste; (ii) to evaluate the composition and dynamics of emission of N-containing compounds. This study was carried out under controlled conditions of experimental laboratory composting of four main types of municipal solid waste: SS, ms-OFMSW, FW and WC, using electrochemical analysis and gas chromatography.

2. Materials and Methods

2.1. Substrates for Composting

Samples of ms-OFMSW and WC, mainly deciduous species from sanitary pruning, were obtained at the waste processing complex (Moscow region, coordinates: 56.048547, 36.996277). Samples of SS were obtained from sewage treatment plants (Samara Region, coordinates: 53.542721, 49.563595) with a retention time of 40 ± 3 days in sludge pits. In order to equalise the mass fraction of water (about 60%) and the C/N ratio (25–30) [23,24,25], WC and water were added to SS in the following weight ratios: SS—2.00, WC—1.35, tap water—2.00. Wood chips (10–20 mm) were used as a bulking agent and additional carbon source [2,5], SS+WC substrate was prepared.
FW consisted of expired products (w/w): cabbage (19.7%), potatoes (19.7%), apples (7.9%), bread (7.9%), bananas (7.9%), oranges (7.7%), minced meat (4.0%), fish (1.6%), cottage cheese (1.6%), egg (0.8%), and ballast fractions: plastic (4.1%), textile (0.8%). Wood chips 16.3% (w/w) was added as a structural carbon containing bulking agent [5,26], FW+WC substrate was prepared.
Each substrate was inoculated with 10% (w/w) ready-made compost from the FW of the previous experiment to a waste:inoculum ratio of 10:1. The inoculum contained heterotrophic aerobic microorganisms in the amount of 106–107 CFU g−1 mesophilic and thermophilic hydrolytic and lignolytic fungi of the genus Byssochlamys (98%) and bacteria of the genera Thermobifida (15%), Streptomyces (14%), Bacillus (15%), Paenibacillus (9%), and Geobacillus (5%) [27]. The initial parameters of the composting substrates are given in Table 1.

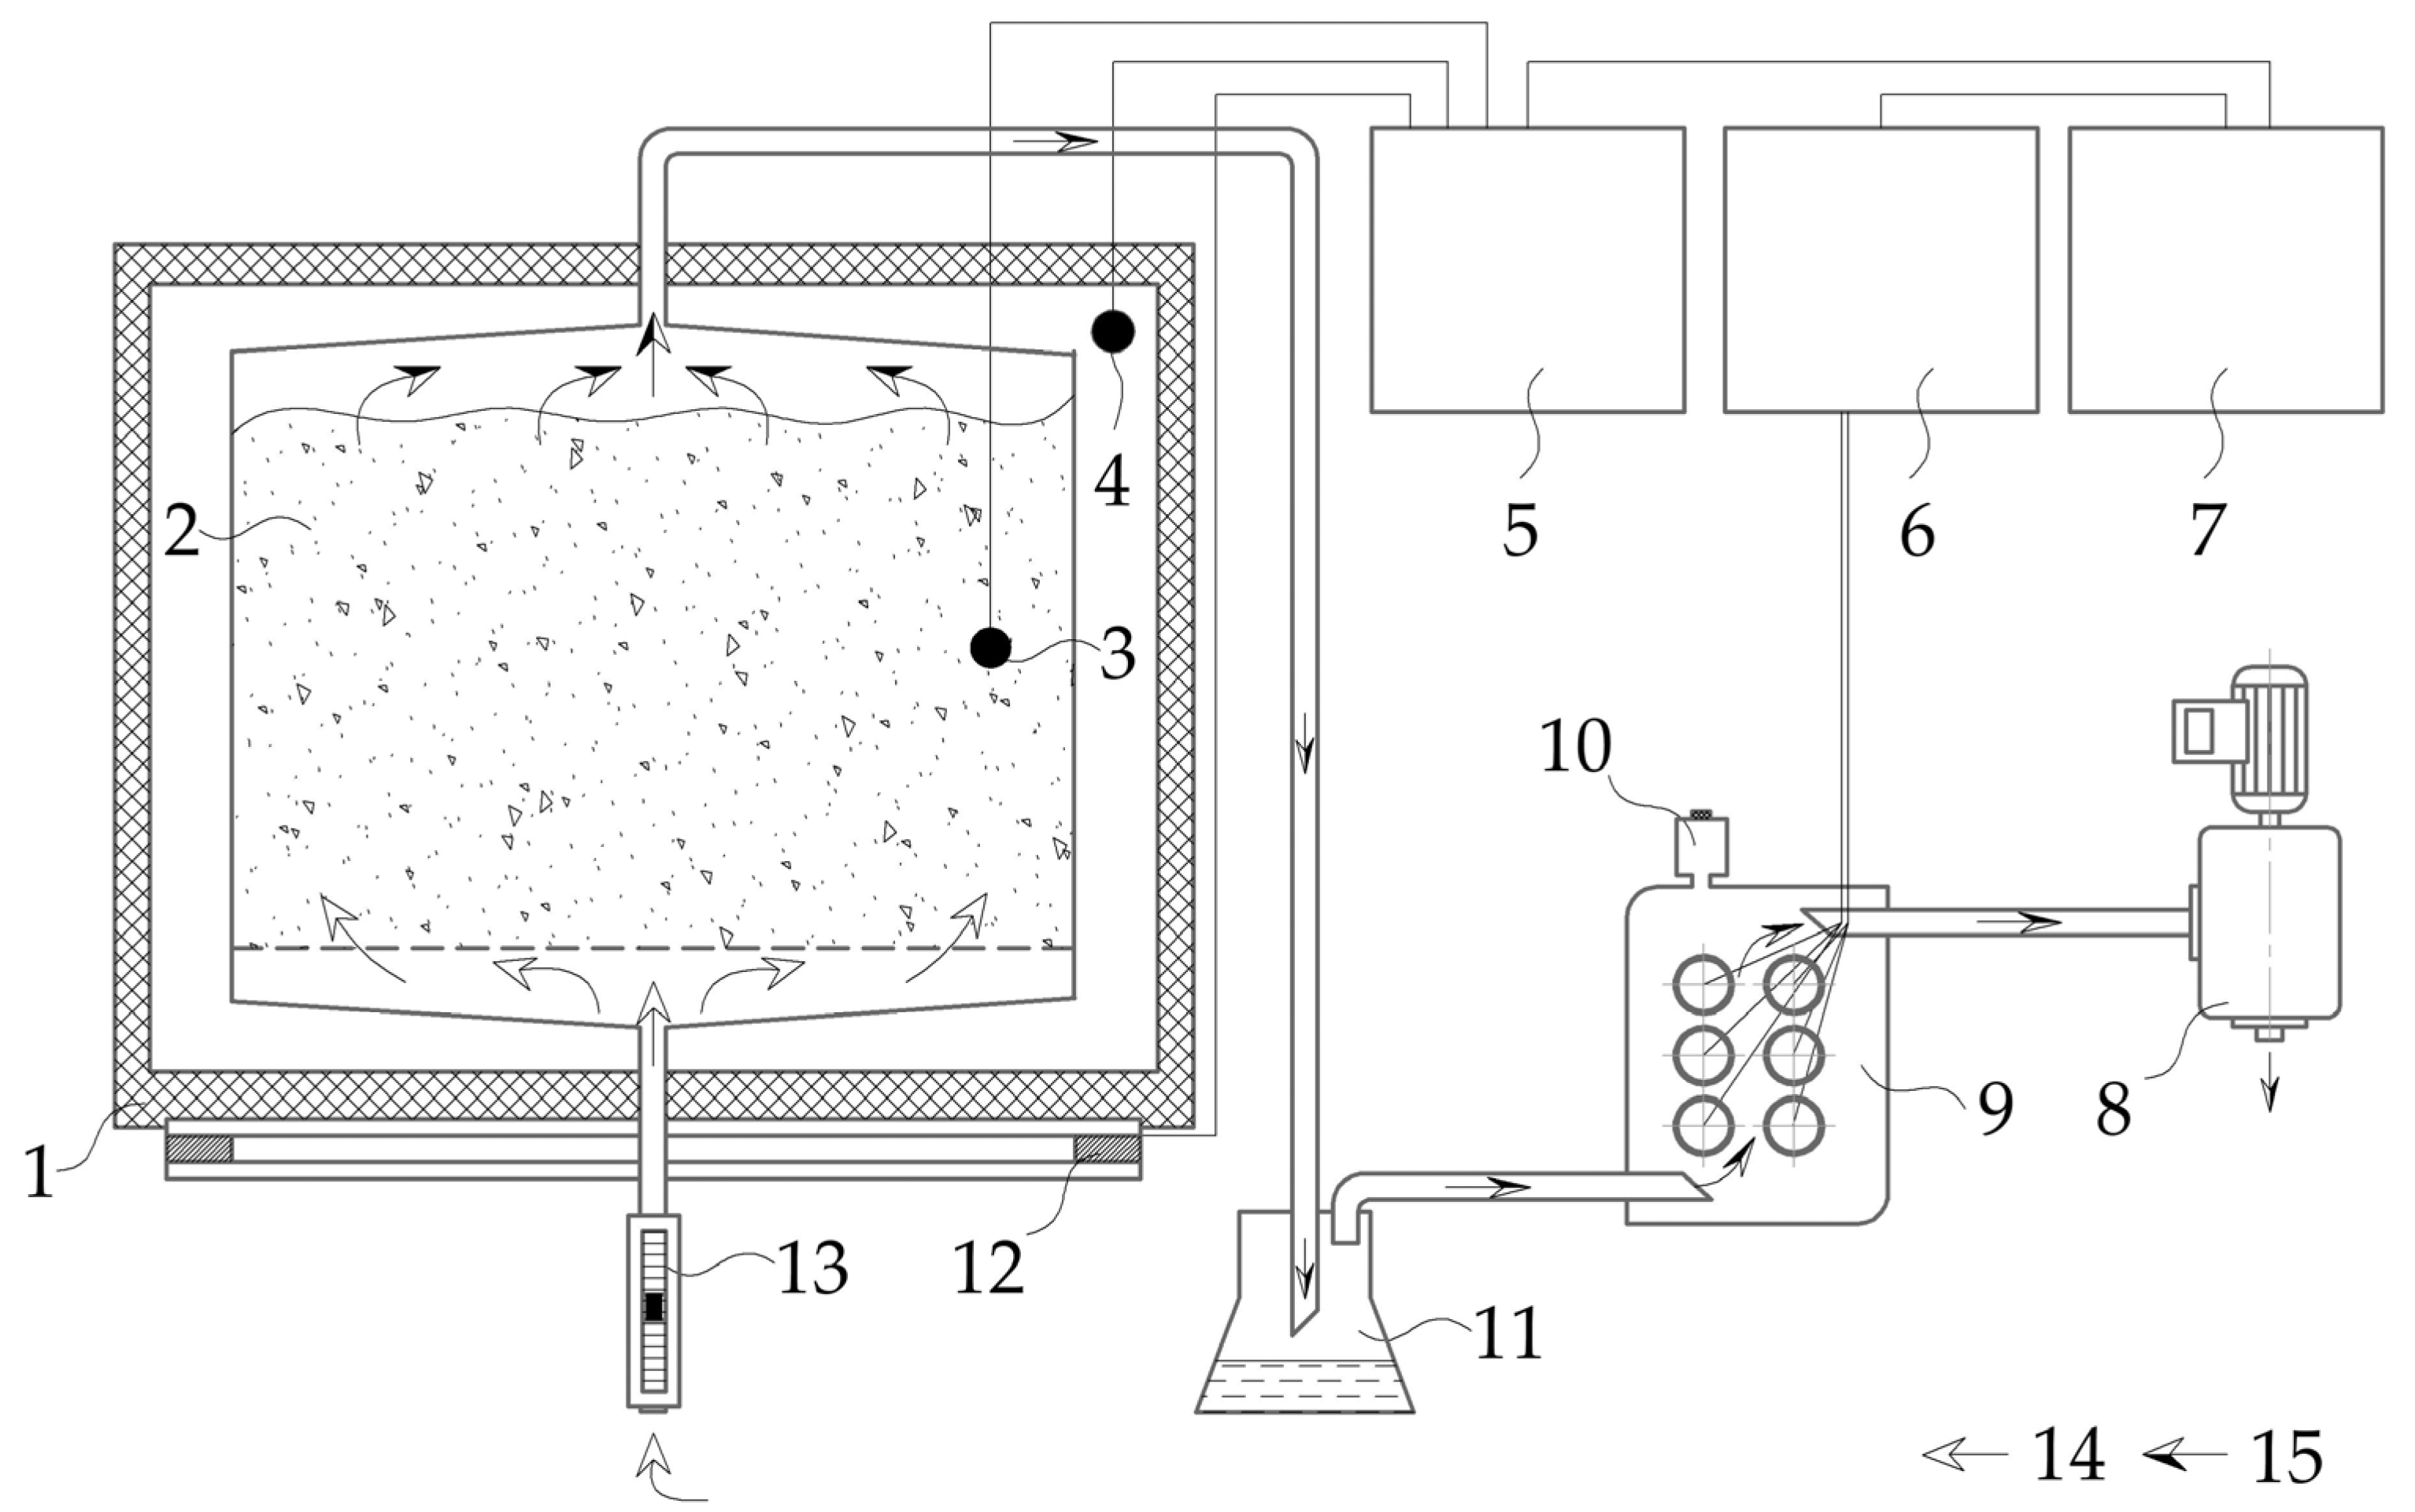
2.2. Experimental Composting Setup

The composting process was carried out during the 28-day active phase of the process [24] under laboratory conditions, using a multi-chamber bioreactor for aerobic solid-phase biodegradation of organic waste, according to the scheme (Figure 1). The mechanism of air flow in the composting system (Figure 1) was as follows: clean atmospheric air (14) was drawn through the rotameter (13) due to the discharge generated by the blower (8); the air passed through the reaction vessel (2) in the chamber (1), where it became waste air (15), and through flexible tubes it moved through a flask (11) where condensate was collected and a, then from there into a chamber with gas sensors (9) connected to a gas analyser (6), where sampling port for SPME (10) was installed.
Containers of 10 dm3 with ms-OFMSW (4.836 ± 0.657 kg), SS+WC (5.607 ± 0.652 kg) and FW+WC (4.690 ± 0.012 kg) were placed into reaction chambers. A total of 6 reaction chambers were used simultaneously, 2 for each substrate type. The containers were made of polymeric material with 5 mm round perforations in the walls and bottom to provide aeration [28]. The temperature in each chamber was maintained at the current substrate temperature ±0.2 °C using a heating element and an IVTM-7/2C temperature controller (Exis, Moscow, Russia). Each chamber was controlled independently. The experiments were carried out in the laboratory under the following initial conditions: temperature 23.4 ± 0.8 °C, air humidity 26.4 ± 2.2%. Each compost mixture was aerated with an intensity of 0.117 L of air min−1 due to the discharge generated by the compressor with a periodicity of 1 min after every 10 min, which simulated the aeration regime of the in-vessel composting system [29]. The air flow velocity was controlled with rotameters RMS-A-0.035 GUZ-2 (Pribor-M, Korolyov, Russia). On sampling days (7, 14, 21), tap water was added to each substrate to compensate for evaporation losses. The mass fraction of moisture was maintained at 60 ± 10%. On day 14, after sampling, each substrate was mixed [25]. All experiments were repeated at least twice.

2.3. Measurements of Substrates Parameters

The gas composition in the air emissions from each of the compostable substrates was determined daily using a MAG-6 S-1 gas analyser (Exis, Moscow, Russia): O2 (from 0 to 30 ± 0.4 vol.%), CO2 (from 0 to 10 ± 0.1 vol.%), NH3 (from 0 to 70 ± 4 mg m−3), H2S (from 0 to 140 ± 2 mg m−3), CH4 (from 0 to 5 ± 0.2 vol.%). If the CO2 content exceeded 10% by volume, the values would have been taken from the calculation: 21%—V(O2), where V(O2) is the volumetric oxygen concentration, due to the limitation of the CO2 measuring range of the gas analyser. It is based on the fact that when organic matter decomposes, the volume of oxygen consumed is equal to the volume of CO2 produced. Measurements were taken on 21 days out of 28 days of composting (0–5; 7–12; 15–20; 22–28 days).
Concentration of VC obtained with the gas analyser in vol.% (CO2, O2, CH4) were calculated for g day−1 kg−1 OM according to the formula:
C(gas) (g day−1 kg−1 OM) = F × T × 24 h/day × vol.%gas/100% × ρgas/m,
where:
F—flow rate during purging, F = 0.117 L min−1;
T—frequency of purge activation, T = 5.45 min h−1;
ρ gas—gas density (g L−1);
m—the mass of OM, kg.
Concentration of VC obtained in mg/m3 (NH3, H2S):
C(gas) (g day−1 kg−1 OM) = F × T × 24 h/day × C(gas)/m.
The transition to this unit of measurement was made in order to correctly compare the data obtained in different units of measurement.
The values of temperature, pH, electrical conductivity (EC), moisture mass fraction, organic matter (OM), germination index (GI), total organic carbon (C), Kjeldahl total nitrogen (N) and C/N were measured and calculated as in previous study [27]. Substrate temperature was measured continuously using an IRT-4/16-T meter-regulator (Exis, Moscow, Russia). pH and EC were obtained by measuring a suspension of an aqueous extract of 10 g of substrate in 300 mL of distilled water. The pH and EC (µS cm−1) were measured using an ANION 4150 laboratory analyser (Infraspak-Analit, Novosibirsk, Russia). Mass fraction of water (%) was determined by thermogravimetric method on an EVLAS-2M moisture analyser (Sibagropribor, Novosibirsk, Russia). OM (%) content was determined by thermogravimetric method at 430 °C [30] using a PM-16M-1200 muffle furnace (EVS, Saint Petersburg, Russia). The total content of organic carbon (C, %) was estimated as OM:1.8 [31]. The Kjeldahl total nitrogen (N, %) in the dry matter was determined by sample mineralisation in a DKL 6 automatic digester (VelpScientifica, Usmate Velate, Italy) under conditions of heating up to 420 °C with concentrated sulfuric acid in the presence of hydrogen peroxide and a mixed catalyst, followed by distillation of ammonium into a boric acid solution using an UDK 139 semi-automatic distillation system (VelpScientifica, Usmate Velate, Italy). Further titration with hydrochloric acid on an Easy Plus (model Easy pH) titrator (Mettler Toledo, Greifensee, Switzerland). The C/N ratio was calculated using experimental data. The effect of compost on plant growth was assessed by seed germination and the root length of Raphanus sativus based on calculation of the germination index (GI, %) [32]. The measurements were carried out in three replicates.

2.4. VOC Sampling and Analysis

Gas chromatography (GC) combined with preliminary vapour concentration by SPME was used to determine volatile organic impurities, taking into account their relatively low concentrations [33,34]. Samples were taken at 3, 5, 7, 9, 11, 14, 18, 22, 25, 28 days of composting.
Each sample was taken from a flow-through sampling chamber which was bleeding with the sampled air, filled with the sampled air for at least 30 min prior to sampling, using the SPME technique with a manual holder with an adsorbent tip 57916-U series (Supelco, Bellefonte, PA, USA), a 65 μm diameter polydimethylsiloxane/divinylbenzene (PDMS/DVB) threadlike adsorber coated with nitinol, according to the manufacturer’s recommendations.
The manual holder needle was inserted into the sampling chamber through a gas-tight septa, the tip was extended and held in the flow of the sampled air for 60 min to adsorb VOC. The tip was then removed to transport the manual holder to the gas chromatograph. Thermal desorption occurred in the chromatograph injector at a temperature of 150 °C for 1 min.
VOC composition was analysed using a Kristall-5000.1 gas chromatograph (Chromatek, Yoshkar-Ola, Russia) with a flame ionisation detector (FID), on a capillary column OV-101 (length 30 m, diameter 0.25 mm, ChromLab, Lyubertsy, Russia).
The total analysis time was 90 min. The injector temperature was 150 °C and the detector temperature was 230 °C. The temperature of the column thermostat changed during the chromatography according to the following scheme: 60 °C for 6 min, then increased at a rate of 5 °C min−1 to 122 °C, after 6 min at a rate of 2 °C min−1 to 165 °C, after 10 min at a rate of 1 °C min−1 to 185 °C and maintained at this temperature until the end of the analysis time. Gas carrier was helium. The gas carrier flow rate was constant, 30 cm s−1. FID gas flow rate: hydrogen—50 mL min−1; air—500 mL min−1; helium purge—50 mL min−1. Prior to sample injection, the carrier gas flow in the injector was stopped for 2 min and then restored to 2 mL min−1 for the duration of the analysis.
In order to identify the components of the gas-air mixtures studied, gas chromatographic analysis of the samples previously obtained by the SPME method was carried out on a QP-2010 gas chromatograph (Shimadzu, Kyoto, Japan) with a mass spectrometric detector (quadrupole mass spectrum analyser), using a column OV-101 (length 25 m, diameter 0.25 mm) under exactly similar analysis conditions to those described above. Identification of detected peaks was performed using the NIST-11 and NIST-11c database.
The localisation of peaks identified by GC-mass spectrometry (GC/MS) in chromatograms obtained on a Kristall-5000.1 chromatograph was clarified, where necessary, by calculating linear retention indices relative to the retention indices of standard linear alkanes (nonane, undecane, tridecane, pentadecane, heptadecane, octadecane, and nonadecane) which were determined under similar chromatographic conditions.
RIx = RIn + 200 (TRx − TRn)/(TRn+2 − TRn),
where
RIx—retention index of the identified substance;
RIn—alkane retention index before the peak of the identified substance;
TRx—retention time of the identified substance;
TRn—alkane retention time before the peak of the identified substance;
TRn+2—alkane retention time after the peak of the identified substance.
Processing of chromatograms and calculation of areas under peaks (AP) was carried out using the program “Chromatek Analytic 3.0” for Windows. The combined area under the peaks (CAP) is taken as the sum of all compounds in a measurement. The total peak area (TAP) is taken as the sum of a compound or group of compounds over a period of 10 measurements. The total VOC (TVOC) is the sum of all VOC from waste air from one composting substrate over a period of 10 measurements.
The measurement error of the method used was assumed to be ±10%, taking into account the large number of low-altitude peaks and their not always clearly expressed separation, and the complexity of the temperature gradient scheme. Identified compounds were classified by chemical structure using publicly available information from PubChem website [35].

2.5. Statistical Data Analysis

The experiment was performed at least twice for each substrate. Throughout the study, two replicates of each physicochemical parameter measurement were performed. The results and the error bars are presented as “mean ± standard deviation” for two replicates. The Pearson correlation coefficient (R) [7,36] was used to determine the relationships between different variables using the “Hmisc” and “corrplot” libraries for the R-Studio program for Windows.

3. Results

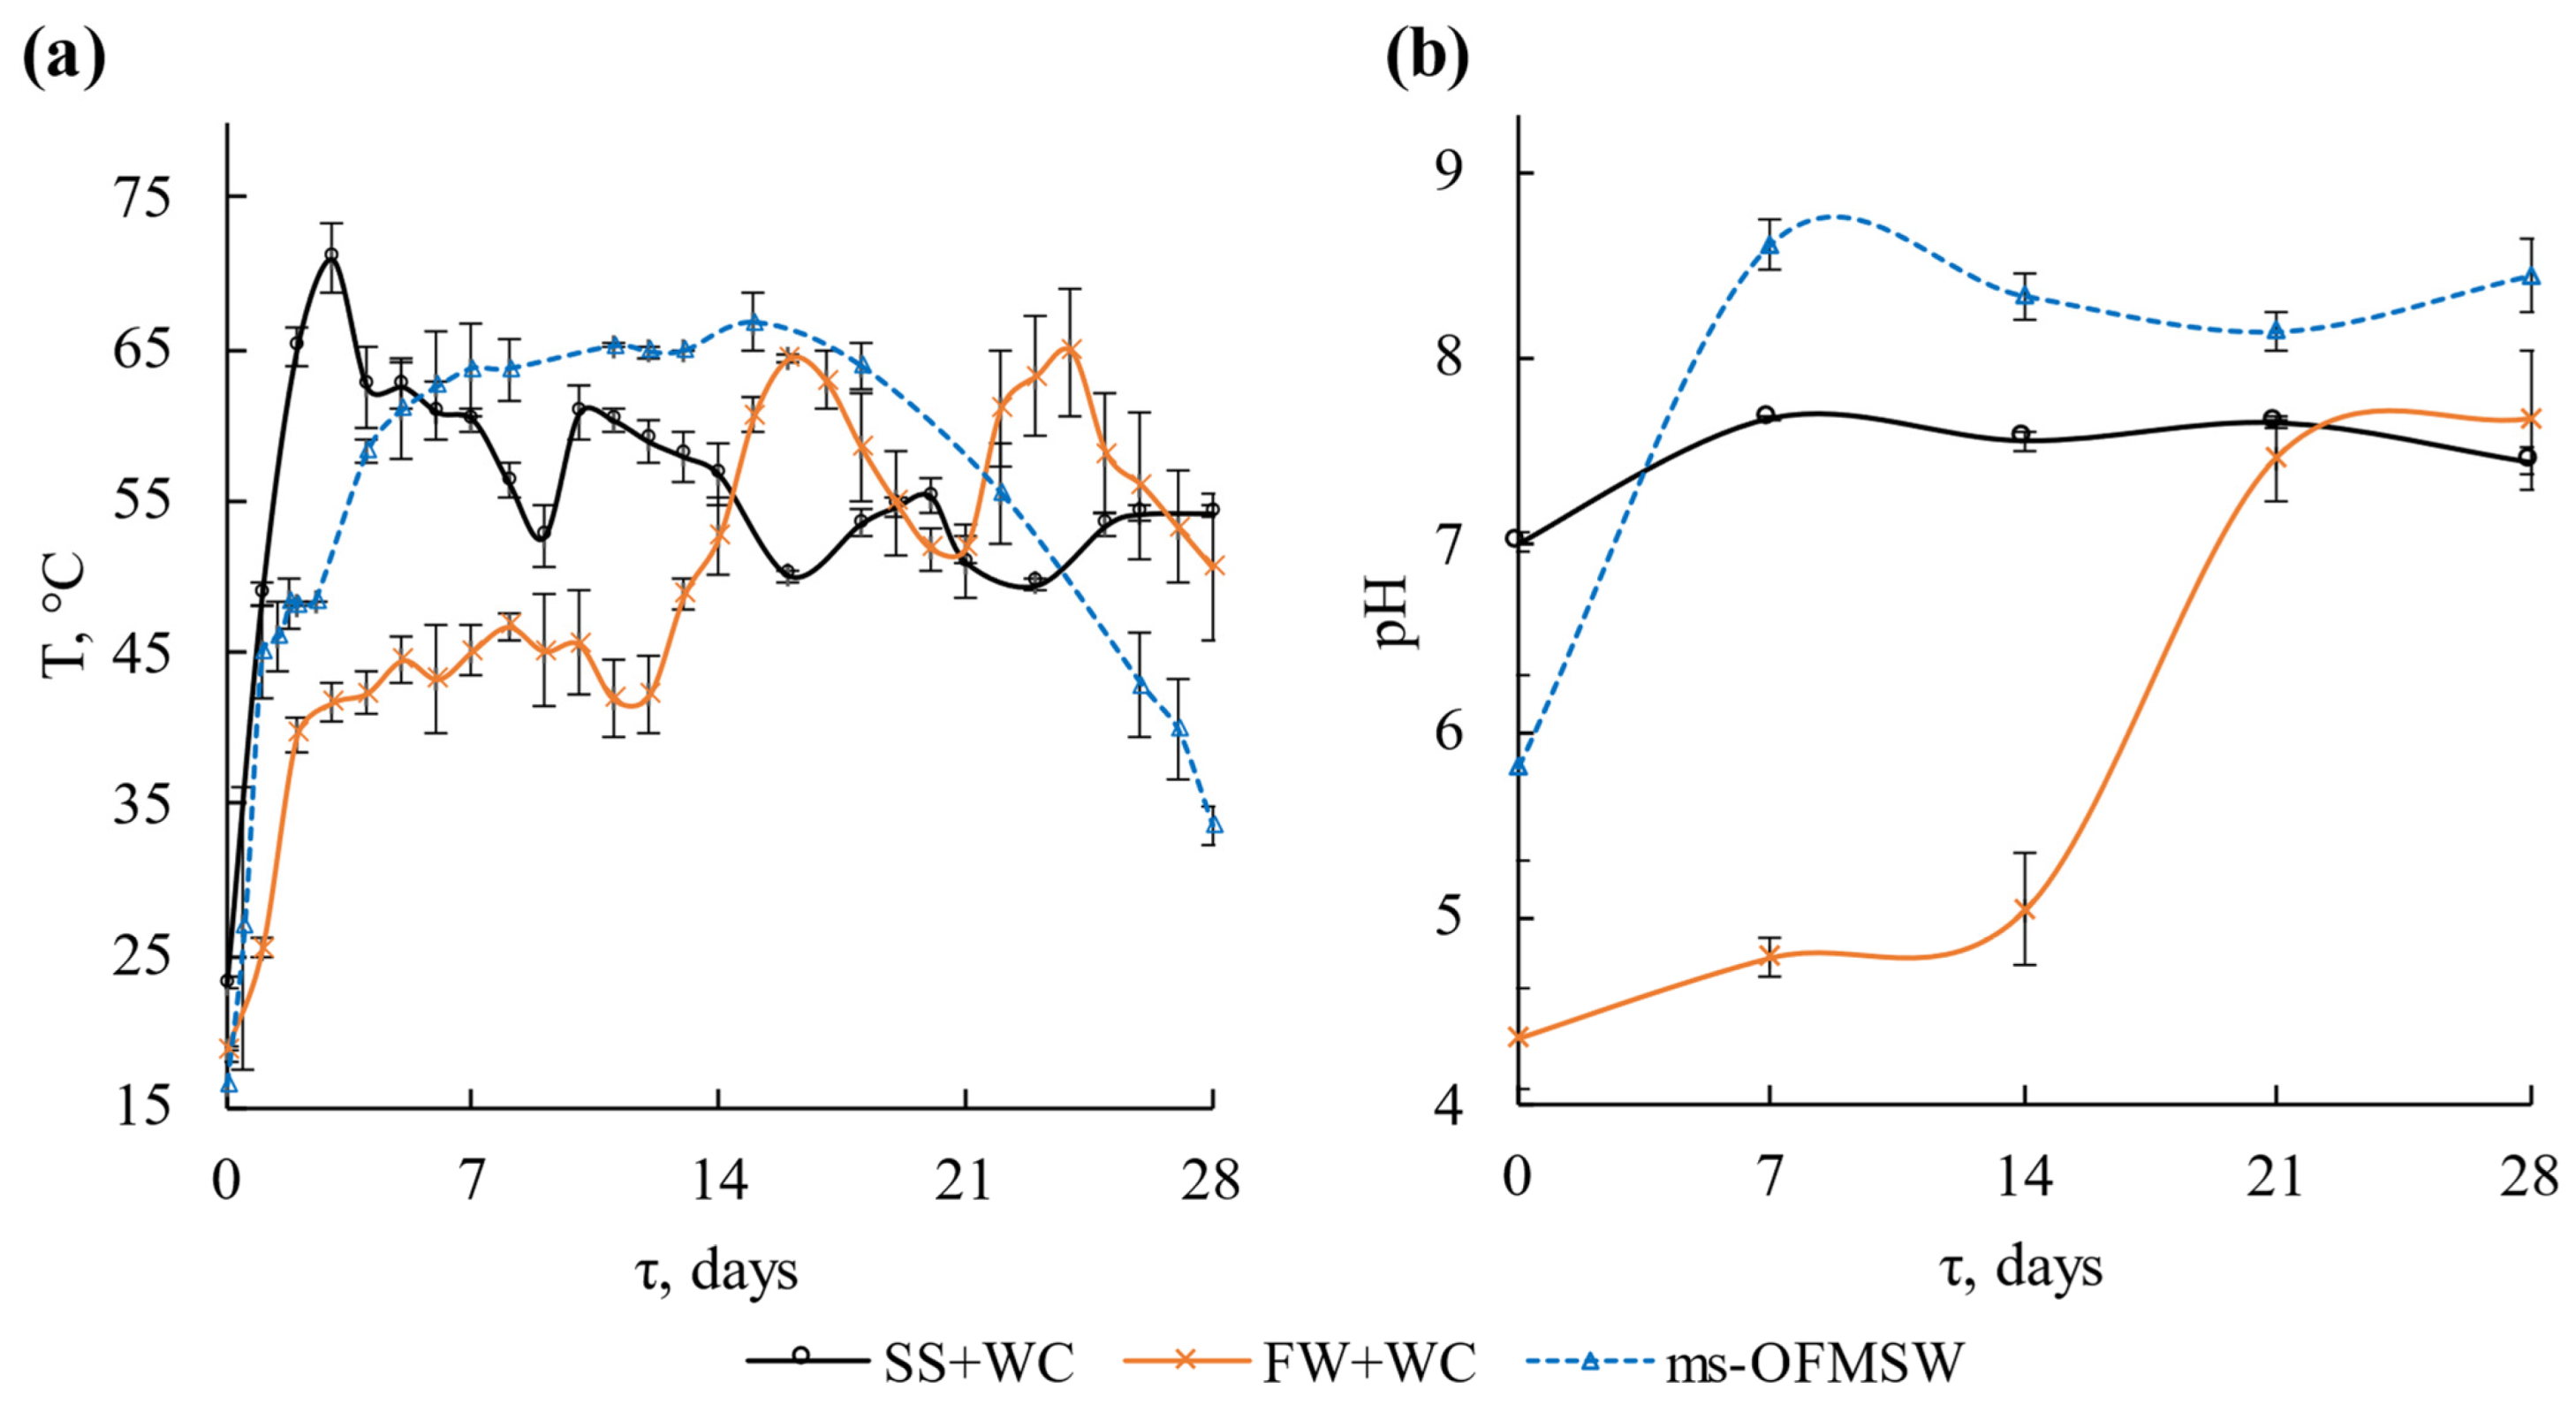
3.1. Dynamics of Physicochemical Parameters

The dynamics of change in temperature of self-heating composted substrates is shown in Figure 2. During the composting of SS+WC, the maximum temperature of 71.0 °C was observed on day 3. Then the temperature decreased smoothly to 56.8 °C on day 14 and then to 54.6 °C on day 28. The temperature in the ms-OFMSW chamber increased more slowly and was only 50.0 °C on day 3. A temperature of 62.5 °C was reached on day 6 and remained at the same level for 2 weeks, then gradually decreased. The maximum value in ms-OFMSW chamber (66.7 °C) was on day 15 after substrate mixing. The temperature of FW+WC was 40.0–45.0 °C for the first 12 days, then gradually increased to 64.8 °C on day 24 and started to decrease. From day 2, the average temperatures in the SS+WC, FW+WC and ms-OFMSW chambers were 57.0, 50.6 and 54.8 °C, respectively.
The substrates were different in terms of temperature change profiles, their initial pH, and pH change during the process. The initial pH during ms-OFMSW composting was 5.5 and then increased linearly to 8.3 on day 7 and remained at this level until the end of the process. In FW+WC, the pH rose from 4.0 to 4.7 in 14 days and then sharply increased to neutral values (7.2). The pH of SS+WC fluctuated in the neutral range (7.0–7.5) throughout the process. During the active phase of the biodegradation process of ms-OFMSW and FW+WC from 2 to 21 days, a high positive correlation between the dynamics of temperature and pH changes was observed. The correlation coefficients R are 0.95 and 0.70, respectively, p-value < 10−5.

3.2. VC Emission Dynamics

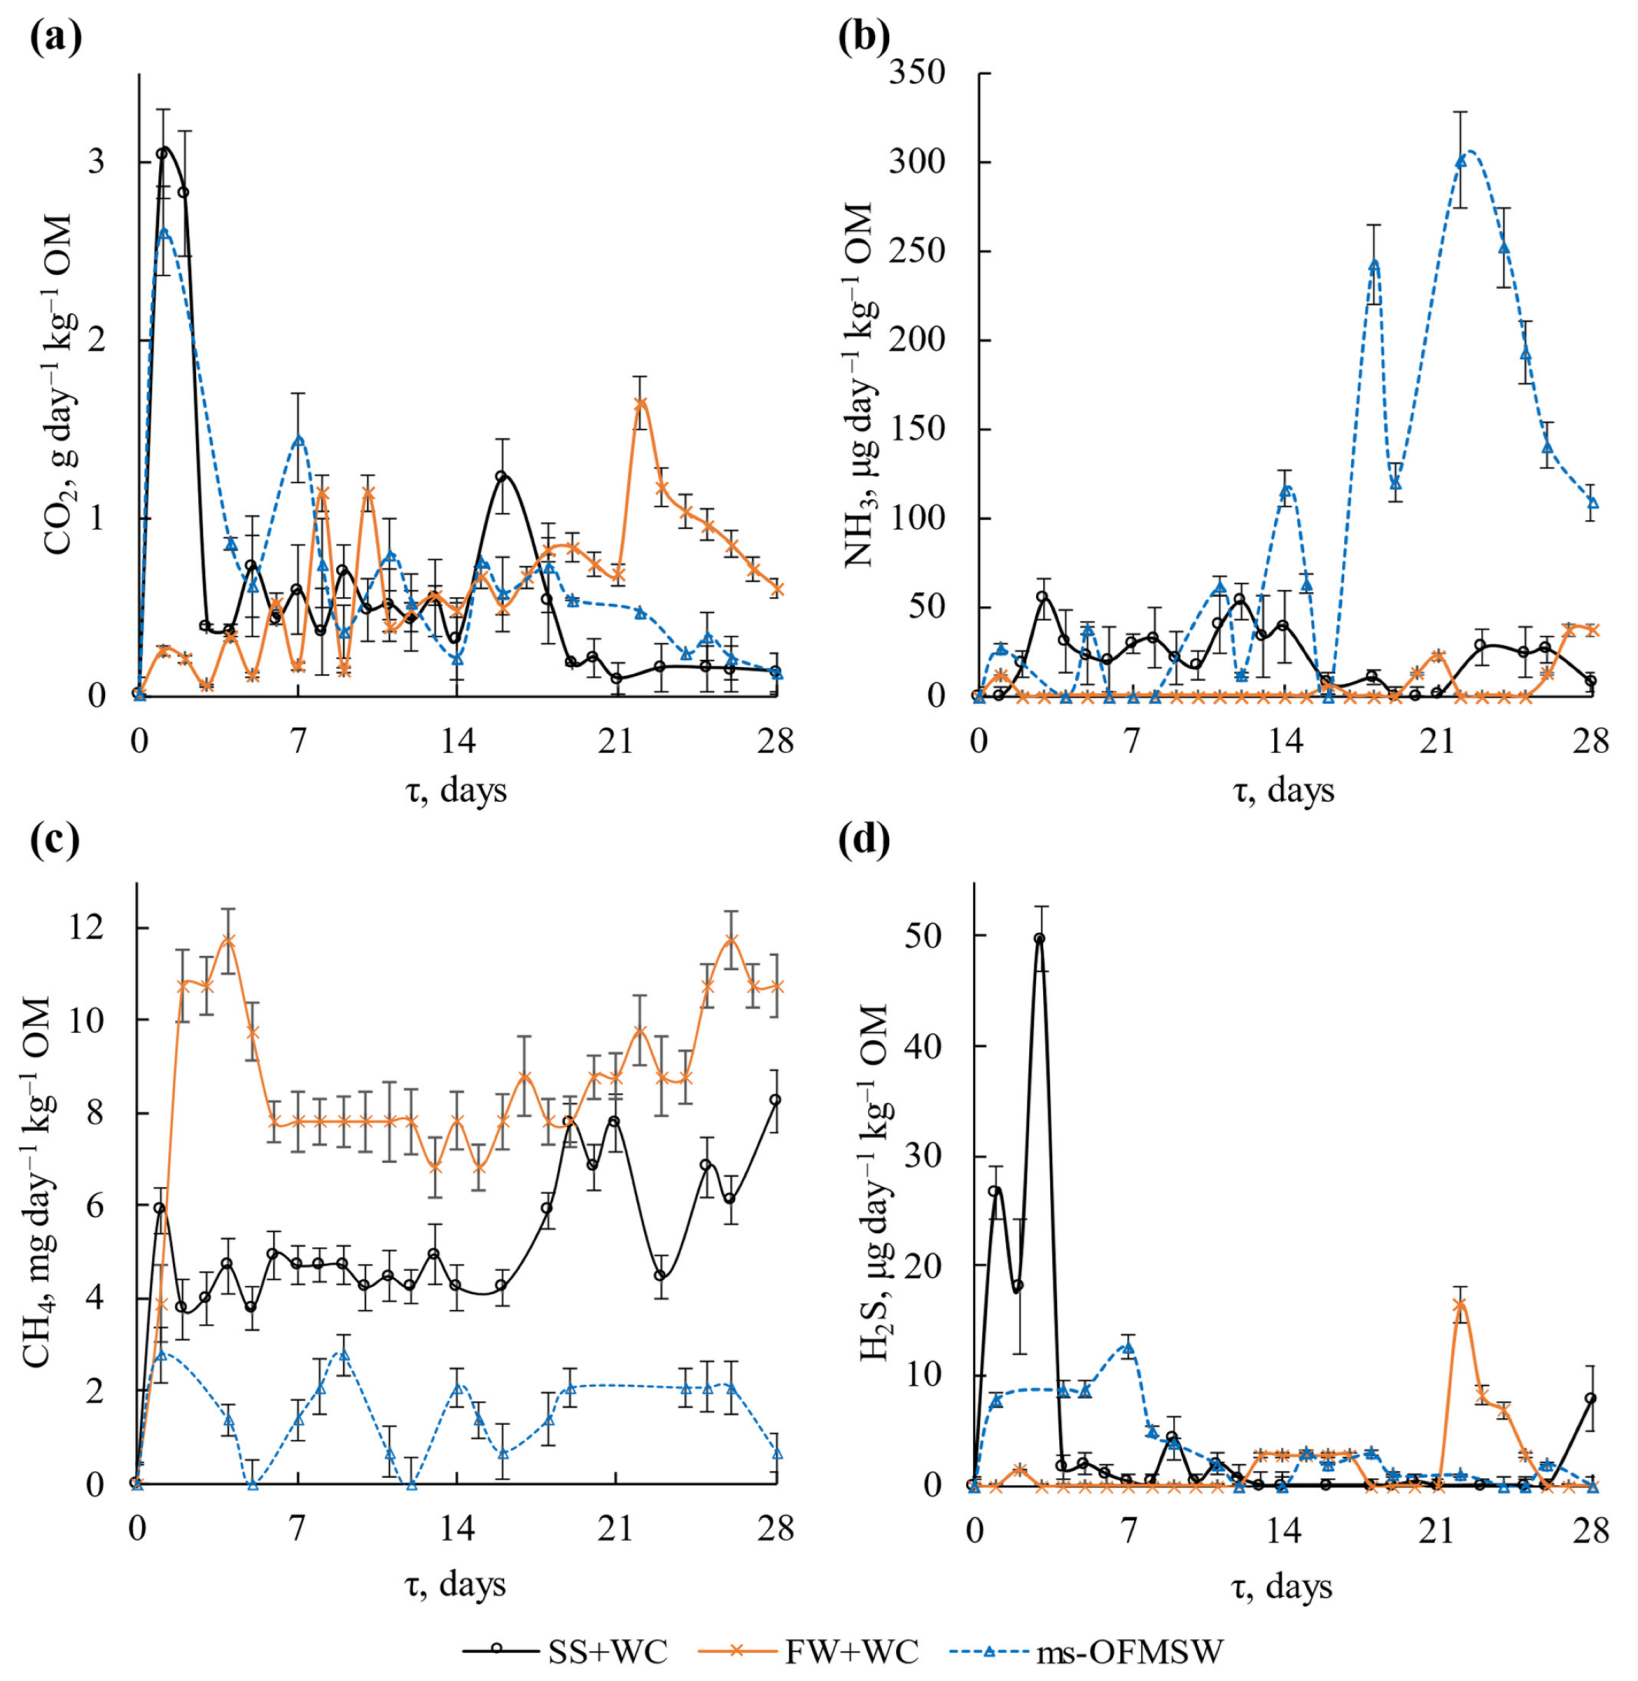
3.2.1. Emission of Carbon Dioxide, Ammonia, Methane and Hydrogen Sulphide

The peak of CO2 emissions was detected on day 2 of composting SS+WC and ms-OFMSW, 3.0 and 2.6 g day−1 kg−1 OM, respectively (Figure 3a). Subsequently, CO2 emissions from both substrates decreased to 0.5 g day−1 kg−1 OM and remained at this level. However, in both cases, there were twofold increases in emissions on days 7 and 15 from ms-OFMSW and SS+WC, respectively. From days 3–21, a negative correlation between CO2 emission and pH was found (R = −0.73, p-value < 10−4) during composting of SS+WC. On the contrary, CO2 emissions during FW+WC composting increased gradually, with a peak on day 22 (1.65 g day−1 kg−1 OM). For the composting of FW+WC, a positive correlation was noted between CO2 emission and temperature (R = 0.61). The average daily values of CO2 emissions during the composting of SS+WC, ms-OFMSW and FW+WC were practically the same, with 0.64, 0.68 and 0.64 g day−1 kg−1 OM, respectively.
NH3 emission during ms-OFMSW and SS+WC composting was at the same level until day 14, approximately 30 µg day−1 kg−1 OM (Figure 3b). After mixing the substrate of ms-OFMSW on day 14 and reaching the maximum temperature, the emission undulated 6 times and peaked at 300.9 µg day−1 kg−1 OM. At the same time, ammonia emission from SS+WC composting remained at the same level and took values below the detection limit from days 19 to 21. NH3 emission from FW+WC composting was lower than from other substrates, but on days 21, 27 and 28 it exceeded that from SS+WC (36.8 µg day−1 kg−1 OM).
CH4 concentration was practically unchanged throughout the composting of all wastes, with small fluctuations (Figure 3c). However, its content in the exhaust air of SS+WC composting was about 2.5 times higher than that from ms-OFMSW (4.0 versus 1.5 mg day−1 kg−1 OM). The average level of CH4 emission during composting was distributed among the substrates as follows (mg day−1 kg−1 OM):
FW+WC (7.8) > SS+WC (4.0) > ms-OFMSW (1.5).
During the first 4 days, simultaneously with the CO2 peak, active H2S emission was during SS+WC composting with a maximum value of 49.7 µg day−1 kg−1 OM (Figure 3d), and at a much lower level (12.6 µg day−1 kg−1 OM) during ms-OFMSW composting until day 7. There was a slight increase to 46 µg day−1 kg−1 OM in the emission from SS+WC composting at the end of the process on day 28. The maximum H2S emission of FW+WC composting was 16.4 µg day−1 kg−1 OM on day 22.

3.2.2. VOC Emission

Composting under the identical conditions of three types of MSW showed minor differences in the total emission of inorganic gaseous compounds. In contrast, the differences in VOC emissions were highly significant.
The highest VOC emission during composting of FW+WC was observed on day 14 (Figure 4a). The highest emission in composting of ms-OFMSW was on day 5 with the total (combined) area under peaks for one measurement, or CAP, of ≈15,000 CU (confidential units), and of SS+WC on day 3 (CAP ≈ 487 CU). The highest levels of VOC emission for each substance were compared, resulting in a ratio:
FW+WC (90) > ms-OFMSW (29) > SS+WC (1).
The VOC detection signal from the exhaust air during FW+WC composting increased sharply up to day 5, then rose linearly up to day 18 (up to ≈42,600 CU). Then there was a sharp decline until day 22 (≈16,700 CU), with values remaining until day 28. The detected signal of VOC from the exhaust air of ms-OFMSW composting had a sharp increase up to day 3, then after a peak on day 5 it decreased and reached a minimum of 2700 CU. Until day 18, the emission of pollutants from SS+WC gradually decreased from 487 to 315 CU. After 18 days, the VOC values from ms-OFMSW and SS+WC were below the sensitivity threshold of the FID detector.

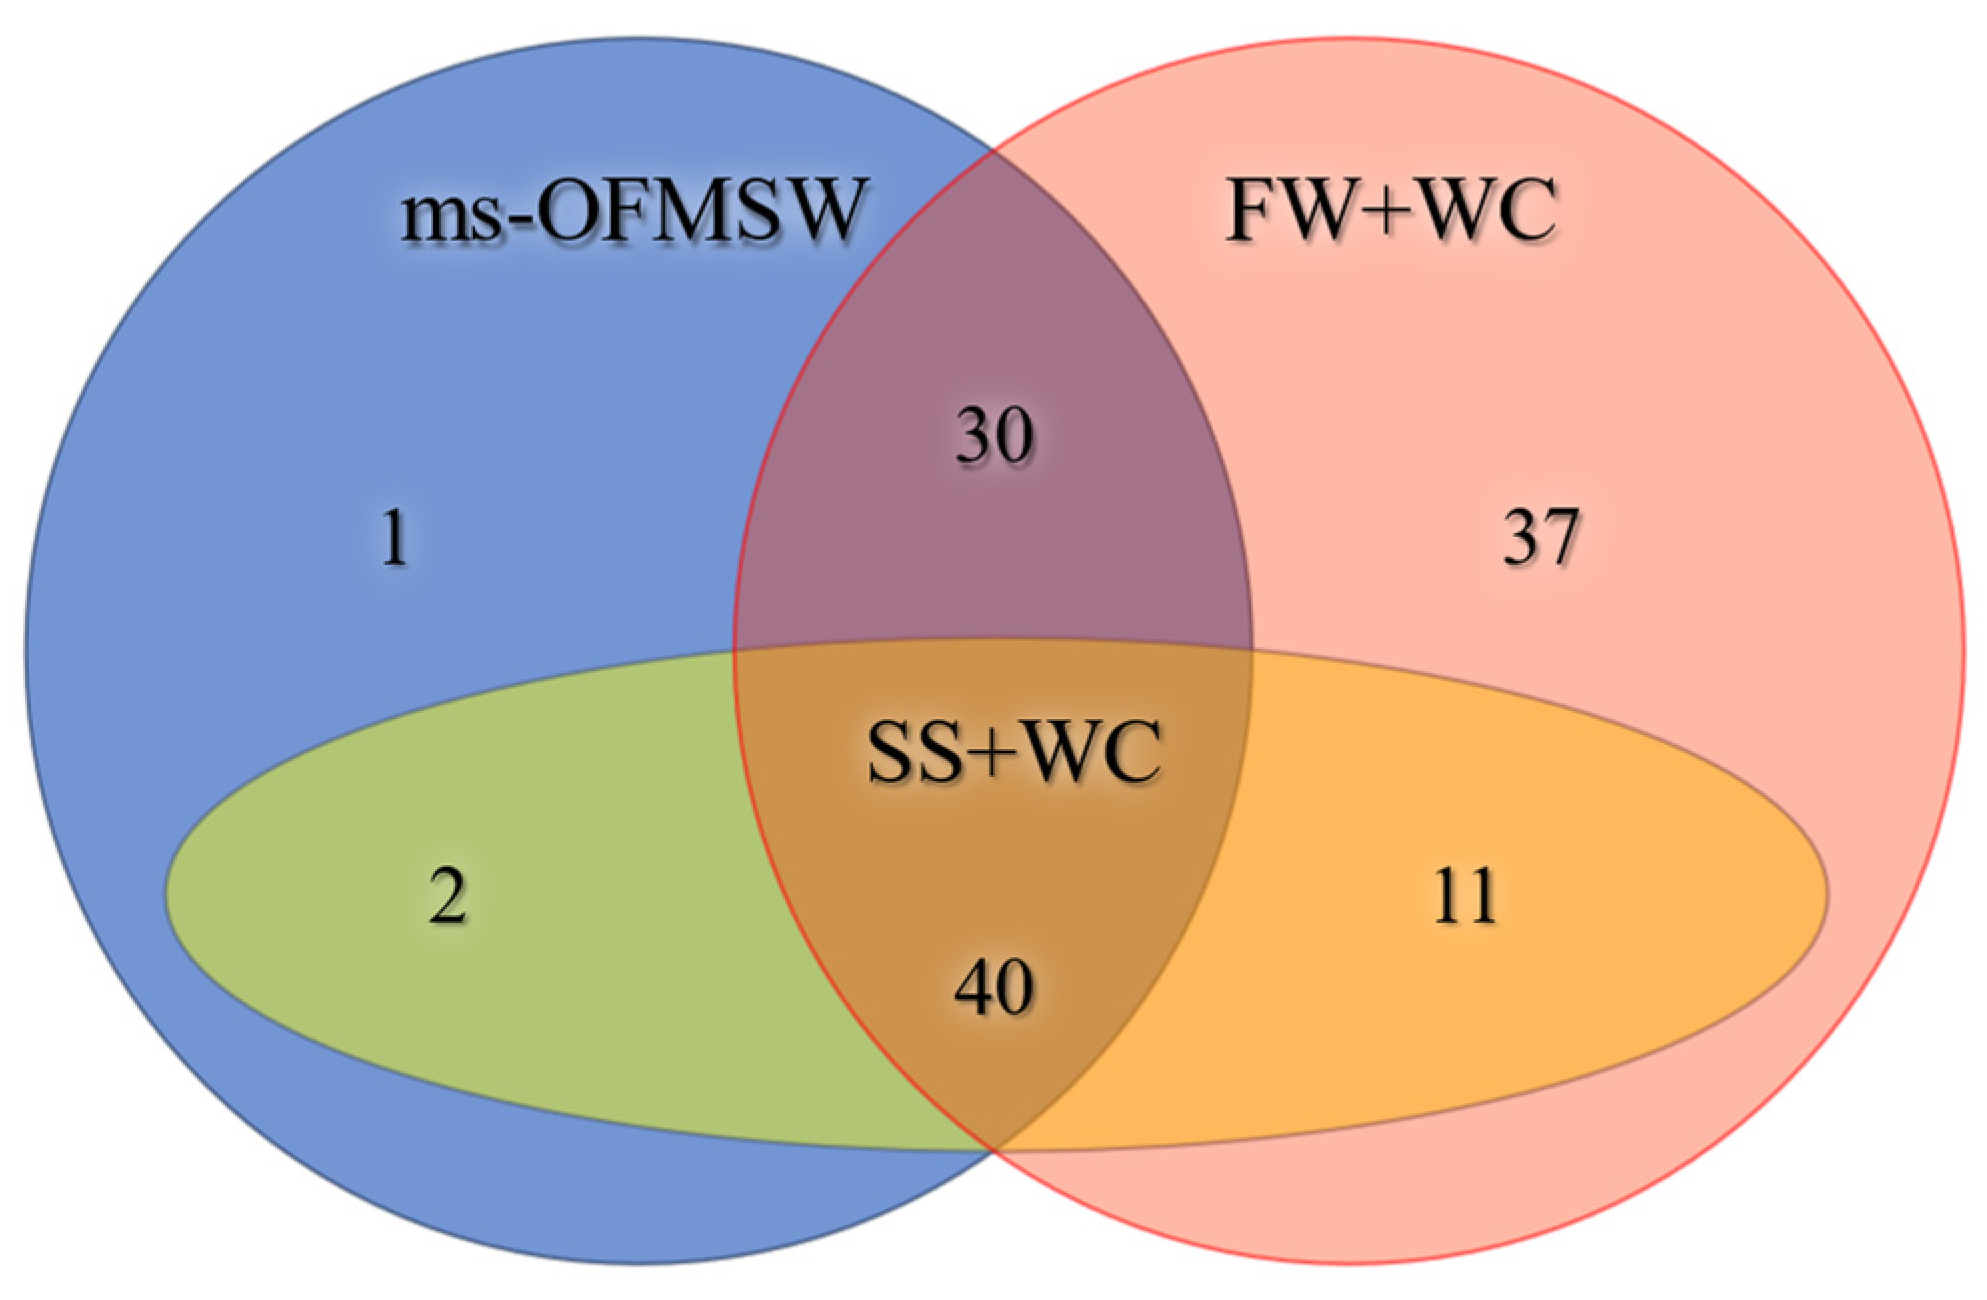
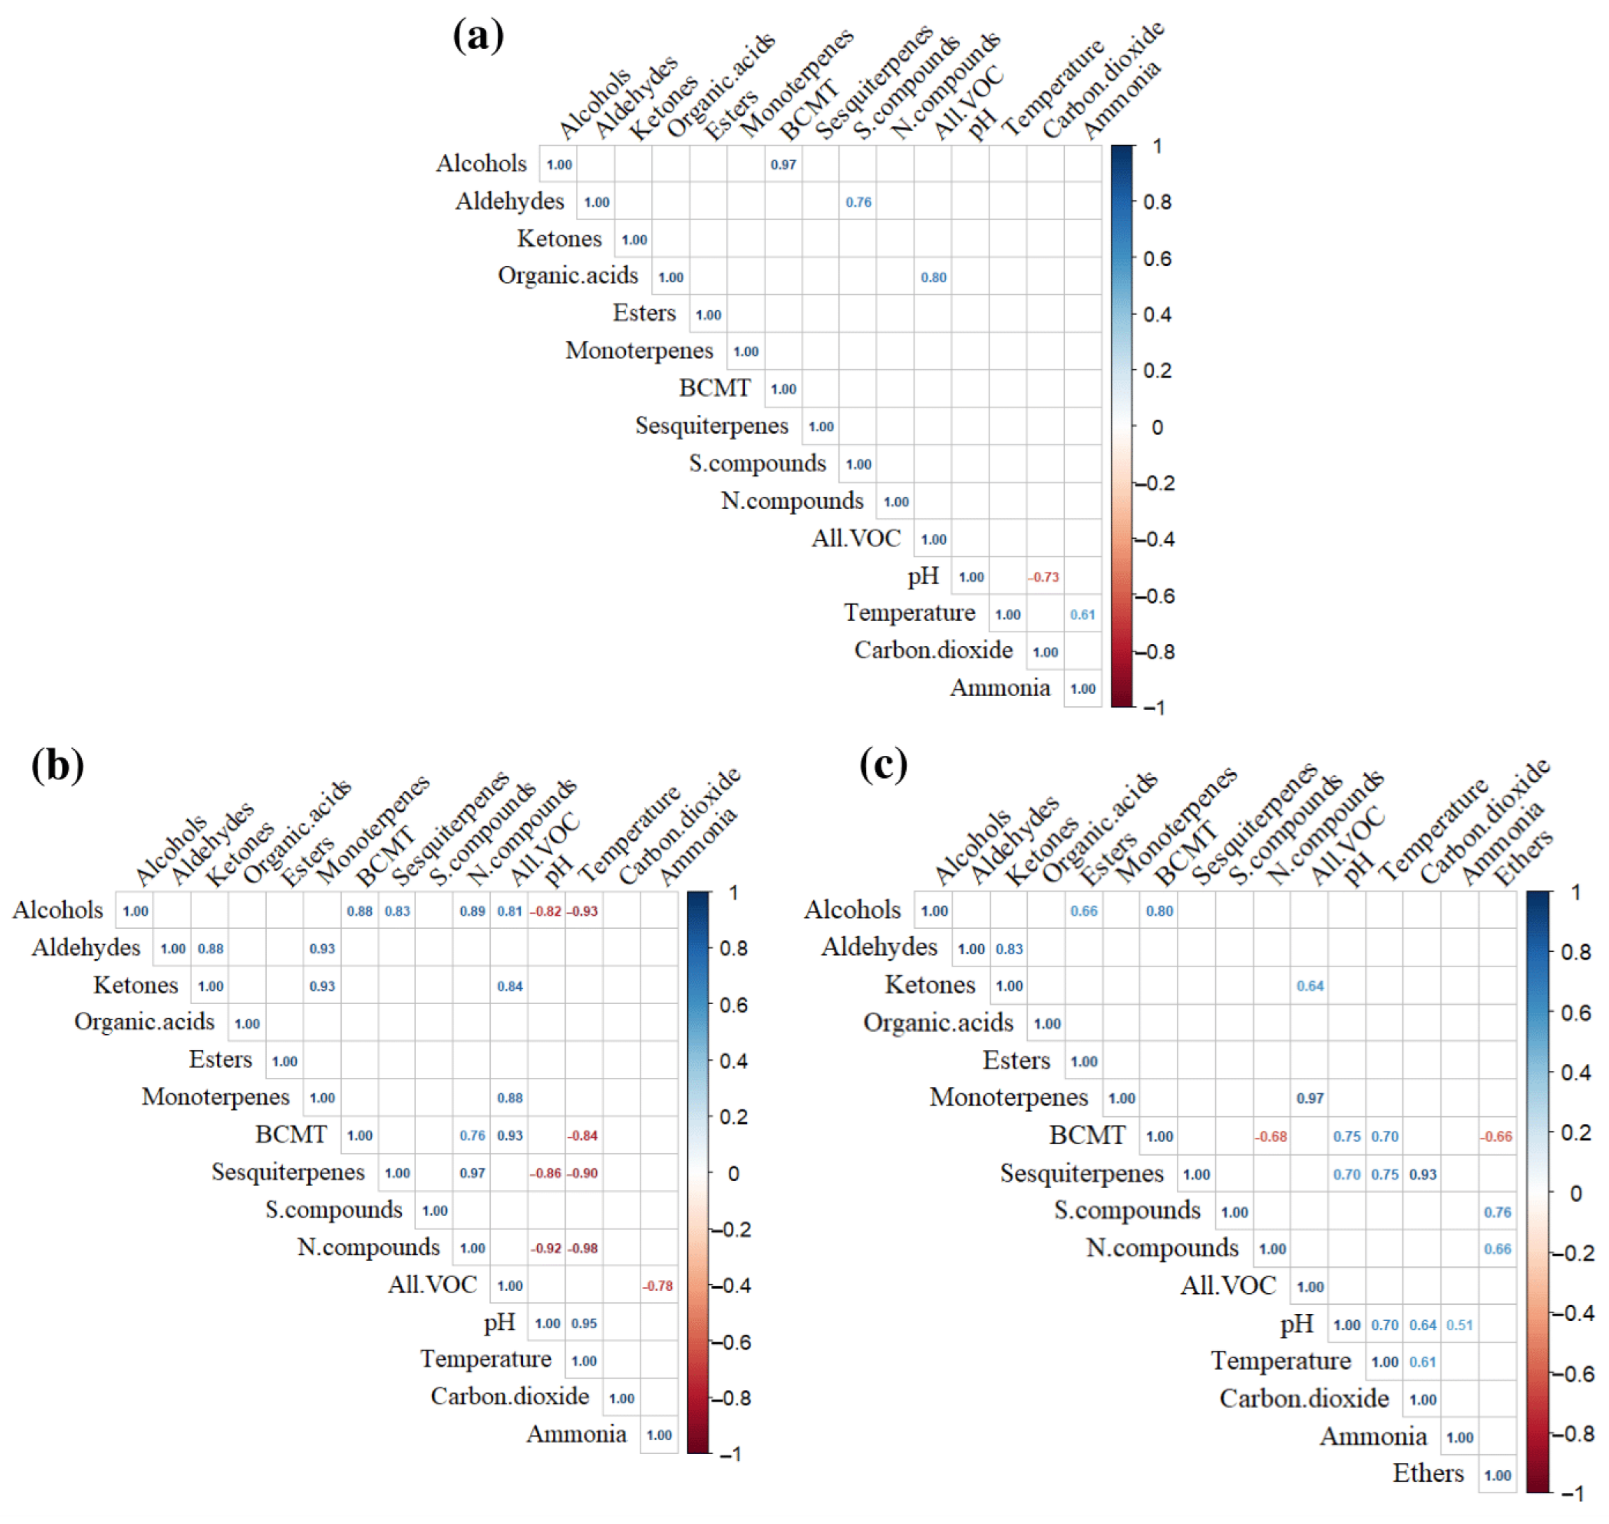
3.3. Chemical and Correlational Analysis of VOC Composition

A total of 121 VOC was identified during composting of waste in the exhaust air: 53, 73 and 118 compounds were identified for SS+WC, ms-OFMSW and FW+WC, respectively. Of these, 40 were present in all composting substrates and 37 only in ms-OFMSW and FW+WC. The diagram in Figure 5 illustrates the number of unique and common VOC among the three substrates.
We discussed the division of our data and their concordance/confirmation by the results of the cited literature sources [35]. In total, compounds belonging to 12 different classes of organic compounds were identified: alkenes, alcohols, ethers, aldehydes, ketones, organic acids (Org-acids), esters, monoterpenes (MT), bicyclic monoterpenes (BCMT), sesquiterpenes (ST), sulphur-containing (S-compounds or sulphides), and nitrogen-containing (N-compounds). Certain groups were divided into sub-groups according to the number of functional groups (monohydric and polyols), structures (acyclic, cyclic, and polycyclic) and the class of derivatives (terpenoids, monoterpenoids, and sesquiterpenoids). The most common compounds found in the emissions of each composting substrate are listed in Table 2. All S- and N-containing compounds are listed in Table 3.
All identified compounds, their total peak areas for 10 measurements, or TAP, and their percentage of the total VOC for all measurements, or TVOC, as well as the TAP of each of the 12 chemical groups are presented in the Supplementary Materials (Table S1).
For the statistical analysis of the results, three correlation matrices of the parameters were created for each composting substrate (Figure 6). This table includes Pearson coefficients R as an indicator of the linear correlation between two variables. All values of R presented in Figure 6 have a p-value < 0.05.
Each of the three correlation matrices in Figure 6 is characterised by a positive correlation of alcohols and BCMT. The following correlations were typical for the two matrices for ms-OFMSW and FW+WC. The total amount of VOC correlated with the content of ketones and monoterpenes, the content of aldehydes and ketones correlated with each other. Temperature and pH correlated with each other. In both cases the content of organic acids did not correlate with other variables. BCMT and ST correlated positively with temperature and pH during FW+WC composting, whereas similar ms-OFMSW parameters correlated negatively.
Figure 6a shows the correlation between total VOC and organic acids, aldehydes and S-compounds, temperature and ammonia. Figure 6b shows the negative correlation of N-compounds with temperature and pH and a positive correlation with alcohols, BCMT, sesquiterpenes, a negative correlation of ammonia with total VOC. Figure 6c shows the negative correlation between N-compounds and BCMT, esters and BCMT. There was a positive correlation between alcohols and esters, alcohols and BCMT, and a positive correlation of CO2 with temperature and pH.

3.3.1. SS+WC

It should be mentioned that concentration of VOC in emission from SS+WC was at least one order of magnitude lower compared to emissions from other substrates. The highest concentration of VOC in the exhaust air was detected on days 3 and 7. In addition, the emissions on these days had the most diverse composition, i.e., all groups of compounds were present in the exhaust air (Figure 4b). The emission of aldehydes stopped on days 5 and 9. Since day 11, the emission of BCMT and monoterpenes stopped, but they reappeared in the samples on day 18. On day 3, the highest emission of N-compounds (≈220 CU) and organic acids (≈85 CU) were observed; on day 7, the highest emission of alcohols (≈128 CU), esters (≈12 CU) and BCMT (≈203 CU) were observed. On day 9, the highest emission of MT (≈41 CU) was; on day 14, the highest emission of ST (≈150 CU) was, and on day 18, the highest emission of aldehydes (≈46 CU), S-compounds (≈18 CU), and ketones (≈17 CU) were observed.
The composition of the exhaust air from SS+WC for the entire analysis period, which TVOC was 2424 ± 242 CU, is shown in Table 2. ST (31.4%), N-compounds (21.0%), and alcohols (19.4%) were present in each sample. Most of the VOC in the SS+WC exhaust air were ST, especially substances: α-, β-, γ-calacorenes and β-elemene. N-compounds became the second in number for the whole period of SS+WC composting (Table 3), and most of them consisted of dimethylamine, ethylmethylamine, ethylamine. On days 3 and 18, the emission of N-compound exceeded all other groups. Alcohols became the third class of compounds by volume. They included monohydric alcohols such as ethanol and dimethyloctanol and terpenoids: terpinene-4-ol and cis-sesquisabinene hydrate.
Organic acids were 13.7% of the TVOC, mainly represented by acetic and butyric acids. Monoterpenes (4.0%) were mainly represented by β-myrcene, δ-, α-, and γ-terpinenes. Ketones (3.1%) were mainly represented by α-pinocarvone, fenchone, and acetone. Aldehydes (3.0%) were mainly represented by acetaldehyde. Sulphides (1.9%) are represented only by dimethyl trisulphide. BCMT (1.7%) were represented by δ-, β-, and α-pinenes. In Figure 4b, “others” (in ascending order) included alkenes and esters, which together accounted for 1.5% of total VOC.

3.3.2. ms-OFMSW

During the composting of ms-OFMSW, most of the VOC were monoterpenes (Figure 4b, Table 2). On day 5, their content was maximum (AP = 11,780 CU), then their number gradually decreased. At the same time, on day 3 the highest emissions of ST (≈3300 CU), N-compounds (≈1200 CU), alcohols (≈900 CU), BCMT (≈750 CU), organic acids (≈380 CU), were observed. On day 5, there were the highest emissions of ketones (≈300 CU), esters (≈195 CU) and aldehydes (≈117 CU). The highest emission of S-compounds (≈160 CU) occurred on day 11. All classes of compounds shown in Figure 4 were present in each measurement. The “others” included esters, S-compounds, and aldehydes, accounting for 2.9% of the TVOC.
In the exhaust air from ms-OFMSW composting the TVOC were 58,093 ± 5809 CU. The majority were monoterpenes (72.2% of TVOC), most of which were limonene and α-terpinene. ST (7.7% of the TVOC) were mainly represented by α-ylangene, α-, β-, γ-calacorenes, and α-, β-copaenes (361 ± 30 CU). Alcohols (5.4%) were mainly represented by monoterpenoids such as terpinene-4-ol, β-phenchol and sesquiterpenoids: cis-sesquisabinene hydrate. The TAP of ethanol was 218 ± 24 CU. The amount of BCMT was slightly lower (5.1%), represented by δ- and β-pinenes. N-compounds (3.2%) were mainly represented by ethylamine, 1-methylpiperazine, and 2,3-dimethylpyrazine (Table 3). Ketones (1.9%) were mainly monoterpenoids with one carbonyl group: fenchone and α-pinocarvone. Acetone was not detected. Organic acids (1.6%) were represented by propionic acid and butyric acid. S-compounds (1.0%) were mainly represented by dimethyl trisulphide, and dimethyl sulphide; dimethyl disulphide was also detected (Table 3). Aldehydes (6%) were represented mainly by nonanal and butanal.

3.3.3. FW+WC

During the composting of FW+WC, as well as in the composting of ms-OFMSW, the majority of the emitted VOC consisted of monoterpenes, which were present in all samples and in the maximum amount for 14–18 days. On day 3, the maximum emissions of N-containing compounds (≈7900 CU) and ethers (≈720 CU) were observed. On day 5, the maximum emissions of organic acids (≈790 CU), on day 7, S-compounds (≈895 CU), on day 9, aldehydes (≈1340 CU), on day 11, ketones (≈8000 CU) were observed. On day 18, the maximum emissions of alcohols (≈2065 CU), esters (≈380 CU), and, likewise, MT (≈36,700 CU) and BCMT (≈570 CU), whose peaks differed by less than <15% from day 14. On days 22–28, the amount of ST (≈460 CU), aldehydes, esters, and BCMT decreased by 1.1–1.8 times, alcohols, esters, ketones, organic acids, esters, and N-compounds by 2.0–2.7 times and MT by 3.0 times.
The TVOC in the exhaust air of the FW+WC composting was 299,706 ± 29,970 CU. It can be stated that this exhaust was the most concentrated in VOC content. The majority were monoterpenes (75.4% of TVOC), mainly limonene, α-terpinene, and acyclic β-myrcene. Ketones made up a much smaller proportion (8.6%) represented mainly by acetone and 2-methylvinyl ketone. N-compounds (5.7%) were represented by ethylamine, tert-butylamine, and ethanolamine. Alcohols (3.0%) were represented by methanol, ethanol, and in smaller amounts of monoterpenoids: terpinene-4-ol, isoborneol, α-terpineol. Aldehydes (1.9%), represented by propanal, 2,2-dimethylpropanal and acetaldehyde. BCMT (1.1%) were represented by α-, β- and δ-pinenes and camphene. Organic acids (1.1%) were butyric, acetic, and propionic. The remaining compounds detected in the emission (ST, ethers, esters and S-compounds) accounted for less than 1% of the TVOC (Table 2). Despite the fact that S-compounds (dimethyl trisulphide, dimethyl disulphide and dimethyl sulphide) accounted for 0.6%, they could participate in the formation of an unpleasant odour of the waste air.

3.4. N-Containing Compounds

All identified N-compounds in the exhaust air of each composting substrate with their percentage content within the group are shown in Figure 7.
It was characteristic for each of the three substrates that an increased content of N-compounds was observed in the exhausts on day 3 (Figure 4b–d). It was also characteristic for each substrate that at least 45% of the N-compounds are represented by dimethylamine, trimethylamine and ethylamine.
The emission of ms-OFMSW differed from other substrates by the contribution of heterocyclic N-compounds, which accounted for up to 50% of the emission of N-compounds, whereas in the emission of SS+WC and FW+WC, approximately 84–97% were non-cyclic amines. The emission of FW+WC was characterised by the most diverse composition of N-containing and even oxygen-containing compounds: ethanolamine and ethyl acetohydroxamate, which total amount was comparable to the total amount of N-compounds in the emission of ms-OFMSW (1467 CU vs. 1842 CU, Table 3).

4. Discussion

During composting, the temperature increased due to the aerobic decomposition of organic matter in the waste. Comparison of the temperature profiles of composting substrates showed that they differed in the rate and nature of temperature change. During composting of FW+WC, there was a moderate heating until 15 days, which repeated the dynamics described earlier [5]. The temperature dynamics during composting of SS+WC and ms-OFMSW characterized by an increase in temperature from the very beginning of the process (up to 55–65 °C) and a gradual decrease until the end of the process, indicating the presence of a more active microbiota at the beginning, which has also been reported in other studies [12,37]. Similar dynamics of this process have been observed previously [5,28]. An increase in temperature was also the reason for a decrease in the solubility in water of all the inorganic substances studied: CO2, NH3 and H2S, that are capable to influence the pH of substrates.
The initial pH of the substrates differed significantly: SS+WC was characterised by a neutral pH, ms-OFMSW was slightly acidic 6.0 and FW+WC was strongly acidic 4.5. Thus, the initial conditions determined the subsequent development of a specific microbial community. This was confirmed by the strong correlation between pH and temperature, which is an important indicator of microbial activity during composting [5,19,24]. The initial low pH of FW+WC was apparently caused by the presence of readily available substances and their use by the fermenters, with the formation of organic acids, as well as the absorption of CO2, during the collection and accumulation of the waste [38]. This led to low microbial activity during 14 days of composting FW+WC, as indicated by the relatively low temperature (45 °C). In contrast, a favourable initial pH of 7 for microorganisms in SS+WC resulted in an acceleration of composting compared to other substrates. During the aerobic composting process, when nitrogenous compounds are decomposed, NH3 is isolated and dissolved and NH4OH is formed, which further alkalinises the medium during the composting of all types of waste. Ammonium ions neutralise acids (organic and carbonic) produced by the vital activity of microorganisms.
The dynamics of CO2 emission during SS+WC and ms-OFMSW composting were similar, there were a maximum in it in the first days of composting and it is typical for aerobic composting of various wastes [21,28]. The accumulation of CO2 in the amount of 13–15 vol%, which corresponds to 2.6–3.0 g CO2 per day−1 kg−1 OM, is the result of oxygen consumption by microorganisms—the O2 concentration decreased to 6–8 vol%. Active oxygen consumption on the background of insufficient aeration intensity leads to formation of local anaerobic zones and occurrence of products such as H2S, CH4, and some VOC. The increased temperature may have led to community succession, resulting in a significant CO2 emission on day 7 in the air from ms-OFMSW. The microbial community in SS+WC likely changed after the temperature was set at 55 °C on day 2, which explains the high emissions of CO2 on days 2 and 3. On the contrary, FW+WC respiration was less active at the beginning and the maximum CO2 was at the end of composting, which correlated with temperature and pH (Figure 6). This is due to favourable conditions for oxidation of readily available organic matter occurred in the second half of the process. The difference in CO2 emissions between FW+WC composting and other substrates was likely due to the low initial pH.
At the beginning of SS+WC composting, despite a sharp increase in temperature to 71 °C and a consequent decrease in solubility of NH3 and N-containing compounds, no high NH3 emission was observed. Probably, the content of available proteins for microorganisms in SS+WC was low. However, the emission before day 14 was slightly higher than in the next days. Probably because communities of nitrifying organisms that are characteristic of SS had already developed [21,39]. For the ms-OFMSW, the situation was reversed: from day 14 onwards, there was a sharp increase in emissions at the time of the reaching the maximum temperature. Similarly, the composting of FW+WC showed an increase in NH3 emission by the end of the experiment. It has been reported that various wastes are characterised by an increase in NH3 emissions 2 weeks after the start of the composting process [21]. Active NH3 emission of ms-OFMSW was observed after the peak substrate temperature was reached, the first reason could be the decomposition of ammonium carbonate [40]. The second reason could be the death of mesophilic microorganisms due to temperature and the degradation of their proteins. Moreover, in the case of ms-OFMSW, this could occur both with an increase in temperature and death of mesophiles and with a decrease in temperature and death of thermophiles (days 18–28). This is evidenced by the inverse correlation between NH3 and the total amount of VOC, which may be caused by a change in microbial communities. In most cases, a significant excess of NH3 emissions over total VOC emissions is reported when composting ms-OFMSW, FW+WC [16,41] and SS+WC [12].
The presence of methane indicates the formation of local anaerobic zones within dense particles of composting material. The presence of CH4 has also been reported in other studies of aerobic composting of waste [28,42]. The structure of the ms-OFMSW substrate was looser than that of FW+WC and SS+WC, which even in a mixture with WC contained dense particles inaccessible to atmospheric oxygen. Exceeding emission of CH4 in the composting of FW+WC is probably related to a denser structure of its individual particles, and in the SS+WC to compaction as the process proceeded. CH4 emission was observed throughout the process and the ratio of average emission between ms-OFMSW, SS+WC and FW+WC was 1.0:3.5:5.8.
The active emission of H2S at the beginning of the decomposition of ms-OFMSW and SS+WC was probably associated with the rapid start of the decomposition of the sulphur containing OM, for example, the presence of dead SS+WC biomass and protein degradation. At the same time, no similar ammonia emission was observed, which could be due to the formation of ammonium sulphide, which reduced the emission of both substances. The subsequent emission of ms-OFMSW is caused both by the degradation of proteins and by the increase in temperature to 65 °C by day 7. The emission of FW+WC was significantly different from other substrates, which was probably caused by a gradual development of the microbiota and gradual compaction of the substrate. The emission of H2S from aerobic composts has also been reported by other authors [5,16].
In our current research of pollutants from composting, the increase in temperature and the start of VOC emissions are primarily associated with increased microbial activity [43], as well as subsequent cooling and maturation of the substrate leads to a significant decrease in emissions [44]. In a number of studies, the appearance of VOC has been linked precisely to the creation of anaerobic conditions inside the substrate, resulting in fermentation, rotting and incomplete decomposition of organic matter in the medium [7,17,19]. The VOC emission from ms-OFMSW had a maximum amount of VOC on day 5 and a significant decrease on day 11, which is confirmed by other studies [5,7,19]. The VOC emission from the SS+WC was at its maximum at the beginning and had the characteristic dynamic as described previously [5,12]. Apparently, the dynamics of VOC emission, with a peak on day 14 during FW+WC composting, depended on the type of waste and the initial microbial community. In the period from 18 to 22 days, VOC emissions decreased more than twofold when composting each type of waste. The ratio between the total VOC emissions of FW+WC, ms-OFMSW and SS+WC was 123, 24 and 1, respectively.
The differences in the composition of VOC from SS+WC and ms-OFMSW were significant. During composting of ms-OFMSW, no alkenes were in the emissions, whereas SS+WC showed a single occurrence of 2,6-dimethyl-1-heptene. SS+WC was also characterised by the presence of acyclic monoterpenes, β-myrcene, whose TAP was higher than all other monoterpenes. A greater variety of amines was found in SS+WC; ethylmethylamine, diethylamine and ethanolamine. However, heterocyclic compounds were present in the emission from ms-OFMSW. In addition, the total amount of amines in the exhaust from ms-OFMSW exceeded that from SS+WC. The absence of aldehydes, sulphides, MT, BCMT, organic acids in the air from SS+WC composting on some days can be explained by the complete decomposition of intermediates by microorganisms under favourable conditions and the appearance of these compounds due to incomplete decomposition when the conditions varied.
The emission of ms-OFMSW differed from SS+WC in a significantly greater variety of alcohols, esters, monoterpenes and S-compounds. The TVOC of ms-OFMSW was about 14.5 times higher than that of SS+WC. The qualitative content of chemical groups of the ms-OFMSW exhaust air did not change during the whole analysis period, in contrast to SS+WC. The TAP of minor components: aldehydes and esters, which represented less than 1.7% of the total amount in the ms-OFMSW emission, exceeded the number of similar compounds in the SS+WC emission. Limonene was the main component of the ms-OFMSW composting emission and was completely absent in the SS+WC.
The emission of ms-OFMSW and SS+WC had approximately the same relative content of S-compounds, esters and aldehydes, and they were almost always minor components, and only the composition of ST was the same. In addition, calacorenes formed a significant proportion of both of these substrates. The relative content of ST in the emissions during composting of ms-OFMSW and SS+WC was quite high. In both cases, the relative content of alcohols was the third highest of the other groups, and was also about 1.5–2.0 times higher than the content of organic acids. At the same time, the diversity of alcohols was the greatest, mainly due to terpenoids with a hydroxyl group in their structure.
The content of various VOC in FW+WC was a combination of compounds from the other two composting substrates, but has a higher similarity with the composition of emissions from ms-OFMSW. In contrast to ms-OFMSW, alkenes were present in the FW+WC emission. Unlike in SS+WC, they appeared in four samples on different days. The emission of FW+WC differed from both substrates in the presence of, acyclic and cyclic ethers, their detectable signal is comparable to TVOC of SS+WC. N-compounds and aldehydes were 10 and 15 times more abundant in the emission of FW+WC than in ms-OFMSW. In FW+WC, acetone was present in 7.4% of all compounds, in contrast to ms-OFMSW.
Sesquiterpenes detected in the emission during ms-OFMSW composting are the only group of compounds whose total emission was higher than that of a same group from FW+WC. Only a few studies on emissions from composting have identified this group of compounds [14]. The TAP of only 20 of the 73 compounds detected in the exhaust from ms-OFMSW were higher than the TAP of the same FW+WC compounds.
Minor components in FW+WC, as in other substrates, were esters, S-compounds and alkenes, typical of biowaste composting [5]. For FW+WC, the chemical groups with the highest number of compounds were alcohols, ST, aldehydes, ketones, N-compounds, and for ms-OFMSW and SS+WC: alcohols, ST and N-compounds. The following compounds: ethanol, C2-C4 aliphatic acids, terpinenes and terpineol, pinene, copaenes, calacorenes, trimethylamine, dimethylamine, ethylamine, and ethanolamine were present in emissions of each studying substrate. The classes with the highest number of different substances were alcohols, ST, aldehydes, ketones and N-compounds.
In our study of emissions from biowaste composting, no alkanes, alkenes (non-isoprene) and benzene derivatives were found. Similar results have been found in comparable studies [5,21]. However, other works have detected emissions of alkanes, alkenes, benzene derivatives, and even siloxanes from SS [12,13], and linear alkanes, alkenes, and aromatic compounds from ms-OFMSW [6,20]. The our current research shows that the composition of oxygen-containing compounds in the exhaust from ms-OFMSW is unstable and probably depends on many factors, such as the time of year, the type of substrate, the stage of composting, etc. [6,20].
In both the emission from ms-OFMSW and FW+WC, terpenes (primarily limonene) made up over 50% of all VOC, as documented by other researchers [6,7,19]. Terpenes were detected on day 5 of composting and their concentration gradually decreased, as confirmed by the work of other authors [14,19]. Monoterpenes (C10), BCMT (C10), and ST (C15) are isoprene polymers combined in various forms, which makes them the most diverse secondary metabolite class [45]. They are intermediates in the aerobic decomposition of plant OM, lignin and cellulose, and are highly biologically and chemically reactive. Most MT are irritating to the conjunctiva, mucous membranes and skin at certain concentrations [35,44].
According to the data analysis, it was found that there is a reliable correlation between bicyclic monoterpenes and alcohols in the emissions from each of the composting substrates. During the analysis, monoterpenes with an alcohol functional group and a structure typical of BCMT were identified, including isoborneol, β-fenchol, and pinocarveol, among others (Table S1). It can be reasonably assumed that the composting of plant residues similar in composition to WC will result in the release of a mixture of BCMT and monoterpenoids-alcohols.
Alcohols, aldehydes and ketones are the compounds released by microorganisms during the decomposition of plant raw materials. They are formed during fermentation as a result of the reaction of hydrogenation and dehydrogenation, with the change of the carbonyl group to the alcohol group and vice versa [43]. The alcohol content in the emission during composting of FW+WC correlated with the content of esters formed via esterification of alcohols and organic acids (mainly acetic) [43].
In our study, the S-compounds emissions during composting of SS+WC, mc-OFMSW and FW+WC were 2.0, 1.0 and 0.6% (of total VOC), respectively. S-compounds, i.e., dimethyl sulphide and dimethyl disulphide, are usually the main odourants in the composting of MSW. Their formation is linked to microbial metabolism of methionine and cysteine under anaerobic conditions [7,46]. As the olfactory threshold of sulphides is very low, 5–10% sulphides of the total VOC concentration can generate 97% of an unpleasant odour [5].
On day 3, there was a notable increase in the N-compound content in the emissions for each of the three substrates. Simultaneously, there was no increase in NH3 emissions. This may be due to the high solubility of NH3 in water and its neutralisation with sulphides and carbonates.
The emission from each substrate contained N-compounds: trimethylamine, dimethylamine, diethylamine, and ethylamine with olfactory thresholds of 0.0001, 0.03, 0.05 and 0.05, respectively [22]. They have a typical fishy odour [47]. Emissions from FW+WC and ms-OFMSW were matched by the presence of the heterocyclic compounds 2,5-dimethylpyrazine, 3,5-dimethylpyrazole and 1-methylpiperazine causing the peppery odour [48]. Pyrazines are formed by the reaction of amino acids with sugars [48], for example in the heating of meat, and as metabolites of many cells [35]. It is likely that all of these compounds contribute significantly to the development of a specific odour during the composting process.
Some of the N-compounds are toxic [49,50]. However, only a limited number of works on emission analysis mention trimethylamine and some other N-compounds [5,14,16]. On the contrary, in our study most of the N-compounds were ethylamine and dimethylamine. Amines are formed by the decarboxylation of individual amino acids by many groups of gram-positive and gram-negative organisms [51]. Decarboxylation of amino acids for the synthesis of amines and other amino acids can be performed by extracellular enzymes [52]. For instance, ethylamine is formed by decarboxylation of alanine [53]. Trimethylamine is formed by cleavage of choline, carnitine and glycine-betaine by three different enzymes [54]. Dimethylamine is formed from trimethylamine by demethylation [55].
In the case of ms-OFMSW composting, high temperature and alkaline pH negatively affected the formation of N-compounds. Their occurrence was due to the activity of amine-producing microorganisms, which were probably negatively affected by the increase in temperature and pH.
During the composting of ms-OFMSW, the amount of N-compounds correlated with the amount of BCMT, ST and alcohols. Since all these groups are markers for the decomposition of plant residues [5,14], it can be assumed that the emission of N-containing compounds was mainly due to the decomposition of plant waste. Since terpenes and N-compounds did not correlate during composting of the FW+WC, and there was an inverse correlation with BCMT, it was probable that N-compounds predominantly arose from animal residues in this substrate.
The human receptors responsible for detecting trimethylamine, which causes a fishy and ammonia-like scent, have an affinity for many of its related compounds. Susceptibility to such odours is an important evolutionarily trait, forcing the avoidance of spoiled products and places prone to microbial contamination [47]. However, the odour threshold concentration of dimethylamine, which is the main contaminant of SS+WC is higher than the concentration limit that can potentially harm a person. This means that accidental exposure to the compounds such as dimethylamine and ethylamine requires the body to recover [49], particularly the mucous membranes, eyes and skin [50,56].
Up to 8% of ethanolamine, a bifunctional compound containing hydroxyl and amino groups formed by decarboxylation of the amino acid serine, was detected in the emissions of N-compounds from all substrates. The ethanolamine molecules are hydrophilic, so most of the ethanolamine formed dissolved in a liquid film on the surface of the solid particles of the substrates and entered the exhaust air with the droplet moisture.

5. Conclusions

The emission of most inorganic VC depended more on the intensity of biodegradation than on the type of waste. Whereas the quantitative and qualitative composition of VOC emissions depended on the type of waste, with close dynamics of their formation. Of the 121 detected VOC, 40 were found in emissions from all waste types. The addition of WC led to the appearance of bicyclic monoterpenes and monoterpenoid alcohols in the emissions.
The N-containing VOC detected at the beginning of composting, some of which are highly toxic, were amines with a very low olfactory threshold and heterocyclic compounds. The probable source of their occurrence during the composting of ms-OFMSW was the decomposition of wastes of plant origin and of FW+WC of animal origin. Dimethylamine was the main pollutant in the composition of N-compounds detected in the emission from SS+WC. Ethanolamine was up to 8% of the N-compounds and was first identified during the composting of municipal biowaste.
These data will help to define requirements for the removal of N-compounds from the exhaust air during composting and to select the most optimal and effective methods for its subsequent purification. The obtained data plays a crucial role for assessing the risks to human health and comfort of living near municipal biowaste industrial composting facilities and the logistics of their siting.

Supplementary Materials

The following supporting information can be downloaded at: https://www.mdpi.com/article/10.3390/en16217271/s1, Table S1. Comparison of the composition of volatile organic compounds (VOC) in the exhaust air from composting of FW+WC, ms-OFMSW and SS+WC, the total area under the peaks of compound or a chemical group (bold) for 10 measurements (TAP) in conventional units (CU) and their percentage of the total VOC (TVOC, CU).

Author Contributions

Conceptualization, V.M., V.Z., I.B.K. and S.Z.; methodology, V.M., V.Z., I.B.K. and N.Z.; software, I.M. and V.O.; validation, I.M., A.S. and V.O.; formal analysis, I.M., A.S. and V.O.; investigation, V.M., V.Z., I.M., N.Z., A.S. and V.O.; re-sources, V.M., V.Z., I.B.K. and S.Z.; data curation, V.M., V.Z., I.B.K. and S.Z.; writing—original draft preparation, V.M., I.M., V.Z., I.B.K. and S.Z.; writing—review and editing, V.M., V.Z., I.B.K., N.Z. and S.Z.; visualization, I.M., A.S. and V.O.; supervision, V.M. and I.B.K.; project ad-ministration, V.M. and N.Z.; funding acquisition, V.M. All authors have read and agreed to the published version of the manuscript.

Funding

This article was made with the support of the Ministry of Science and Higher Education of the Russian Federation in accordance with agreement № 075-15-2022-318, dated 20 April 2022. The grant was provided for state support for the creation and development of a World-class Scientific Center “Agrotechnologies for the Future”.

Data Availability Statement

The data is contained in the article.

Acknowledgments

The measurements were carried out on the equipment of the Shared-Access Equipment Center “Industrial Biotechnology” of Federal Research Center “Fundamentals of Biotechnology” Russian Academy of Sciences.

Conflicts of Interest

The authors declare no conflict of interest. The funders had no role in the design of the study; in the collection, analyses, or interpretation of the data; in the writing of the manuscript; or in the decision to publish the results.

References

  1. Towprayoon, S.; Shmarin, S.; Gao, Q.; Osama Abdel-Aziz, A.; Farkaš, J.; Zanzottera, N.M.; Ijaz, M.; Sharma, C. Waste Generation, Composition and Management Data. In 2019 Refinement to the 2006 IPCC Guidelines for National Greenhouse Gas Inventories; IPCC Task Force on National Greenhouse Gas Inventories: Bangkok, Thailand, 2019; Volume 5. [Google Scholar]
  2. Nordahl, S.L.; Preble, C.V.; Kirchstetter, T.W.; Scown, C.D. Greenhouse Gas and Air Pollutant Emissions from Composting. Environ. Sci. Technol. 2023, 57, 2235–2247. [Google Scholar] [CrossRef] [PubMed]
  3. Teklehaimanot, G.Z.; Kamika, I.; Coetzee, M.A.A.; Momba, M.N.B. Population Growth and Its Impact on the Design Capacity and Performance of the Wastewater Treatment Plants in Sedibeng and Soshanguve, South Africa. Environ. Manag. 2015, 56, 984–997. [Google Scholar] [CrossRef] [PubMed]
  4. Chen, D.M.-C.; Bodirsky, B.L.; Krueger, T.; Mishra, A.; Popp, A. The World’s Growing Municipal Solid Waste: Trends and Impacts. Environ. Res. Lett. 2020, 15, 074021. [Google Scholar] [CrossRef]
  5. Rincón, C.A.; De Guardia, A.; Couvert, A.; Le Roux, S.; Soutrel, I.; Daumoin, M.; Benoist, J.C. Chemical and Odor Characterization of Gas Emissions Released during Composting of Solid Wastes and Digestates. J. Environ. Manag. 2019, 233, 39–53. [Google Scholar] [CrossRef] [PubMed]
  6. Mustafa, M.F.; Liu, Y.; Duan, Z.; Guo, H.; Xu, S.; Wang, H.; Lu, W. Volatile Compounds Emission and Health Risk Assessment during Composting of Organic Fraction of Municipal Solid Waste. J. Hazard. Mater. 2017, 327, 35–43. [Google Scholar] [CrossRef] [PubMed]
  7. Defoer, N.; De Bo, I.; Van Langenhove, H.; Dewulf, J.; Van Elst, T. Gas Chromatography—Mass Spectrometry as a Tool for Estimating Odour Concentrations of Biofilter Effluents at Aerobic Composting and Rendering Plants. J. Chromatogr. A 2002, 970, 259–273. [Google Scholar] [CrossRef]
  8. Kume, K.; Ohura, T.; Amagai, T.; Fusaya, M. Field Monitoring of Volatile Organic Compounds Using Passive Air Samplers in an Industrial City in Japan. Environ. Pollut. 2008, 153, 649–657. [Google Scholar] [CrossRef] [PubMed]
  9. Domingo, J.L.; Rovira, J.; Vilavert, L.; Nadal, M.; Figueras, M.J.; Schuhmacher, M. Health Risks for the Population Living in the Vicinity of an Integrated Waste Management Facility: Screening Environmental Pollutants. Sci. Total Environ. 2015, 518–519, 363–370. [Google Scholar] [CrossRef]
  10. Allievi, M.J.; Silveira, D.D.; Cantão, M.E.; Filho, P.B. Bacterial Community Diversity in a Full Scale Biofilter Treating Wastewater Odor. Water Sci. Technol. J. Int. Assoc. Water Pollut. Res. 2018, 77, 2014–2022. [Google Scholar] [CrossRef]
  11. Pachaiappan, R.; Cornejo-Ponce, L.; Rajendran, R.; Manavalan, K.; Femilaa Rajan, V.; Awad, F. A Review on Biofiltration Techniques: Recent Advancements in the Removal of Volatile Organic Compounds and Heavy Metals in the Treatment of Polluted Water. Bioengineered 2022, 13, 8432–8477. [Google Scholar] [CrossRef]
  12. Zhu, Y.; Zheng, G.; Gao, D.; Chen, T.; Wu, F.; Niu, M.; Zou, K. Odor Composition Analysis and Odor Indicator Selection during Sewage Sludge Composting. J. Air Waste Manag. Assoc. 2016, 66, 930–940. [Google Scholar] [CrossRef] [PubMed]
  13. González, D.; Guerra, N.; Colón, J.; Gabriel, D.; Ponsá, S.; Sánchez, A. Filling in Sewage Sludge Biodrying Gaps: Greenhouse Gases, Volatile Organic Compounds and Odour Emissions. Bioresour. Technol. 2019, 291, 121857. [Google Scholar] [CrossRef] [PubMed]
  14. Raclavská, H.; Růžičková, J.; Raclavský, K.; Juchelková, D.; Kucbel, M.; Švédová, B.; Slamová, K.; Kacprzak, M. Effect of Biochar Addition on the Improvement of the Quality Parameters of Compost Used for Land Reclamation. Environ. Sci. Pollut. Res. 2023, 30, 8563–8581. [Google Scholar] [CrossRef]
  15. Maulini-Duran, C.; Artola, A.; Font, X.; Sánchez, A. A Systematic Study of the Gaseous Emissions from Biosolids Composting: Raw Sludge versus Anaerobically Digested Sludge. Bioresour. Technol. 2013, 147, 43–51. [Google Scholar] [CrossRef] [PubMed]
  16. Wei, Y.; Li, J.; Shi, D.; Liu, G.; Zhao, Y.; Shimaoka, T. Environmental Challenges Impeding the Composting of Biodegradable Municipal Solid Waste: A Critical Review. Resour. Conserv. Recycl. 2017, 122, 51–65. [Google Scholar] [CrossRef]
  17. Schiavon, M.; Martini, L.M.; Corrà, C.; Scapinello, M.; Coller, G.; Tosi, P.; Ragazzi, M. Characterisation of Volatile Organic Compounds (VOCs) Released by the Composting of Different Waste Matrices. Environ. Pollut. 2017, 231, 845–853. [Google Scholar] [CrossRef]
  18. Gutiérrez, M.C.; Hernández-Ceballos, M.A.; Márquez, P.; Chica, A.F.; Martín, M.A. Identification and Simulation of Atmospheric Dispersion Patterns of Odour and VOCs Generated by a Waste Treatment Plant. Atmos. Pollut. Res. 2023, 14, 101636. [Google Scholar] [CrossRef]
  19. Agapiou, A.; Vasileiou, A.; Stylianou, M.; Mikedi, K.; Zorpas, A.A. Waste Aroma Profile in the Framework of Food Waste Man-agement through Household Composting. J. Clean. Prod. 2020, 257, 120340. [Google Scholar] [CrossRef]
  20. Agapiou, A.; Vamvakari, J.P.; Andrianopoulos, A.; Pappa, A. Volatile Emissions during Storing of Green Food Waste under Different Aeration Conditions. Environ. Sci. Pollut. Res. 2016, 23, 8890–8901. [Google Scholar] [CrossRef]
  21. Smet, E.; Van Langenhove, H.; De Bo, I. The Emission of Volatile Compounds during the Aerobic and the Combined Anaerobic/Aerobic Composting of Biowaste. Atmos. Environ. 1999, 33, 1295–1303. [Google Scholar] [CrossRef]
  22. Nagata, Y. Measurement of Odor Threshold Value Review of “Measurement of Threshold Value by Tiriangle Odor Bag Method Bull. Jap. Env. Sanit. Cent. No. 17. 1990” Paper. J. Jpn. Assoc. Odor Environ. 2012, 43, 401–407. [Google Scholar] [CrossRef]
  23. Martínez-Valdez, F.J.; Martínez-Ramírez, C.; Martínez-Montiel, L.; Favela-Torres, E.; Soto-Cruz, N.O.; Ramírez-Vives, F.; Saucedo-Castañeda, G. Rapid Mineralisation of the Organic Fraction of Municipal Solid Waste. Bioresour. Technol. 2015, 180, 112–118. [Google Scholar] [CrossRef] [PubMed]
  24. Castaldi, P.; Garau, G.; Deiana, P.; Melis, P. Evolution of Carbon Compounds during Municipal Solid Waste Composting: Suitability of Chemical and Biochemical Parameters in Defining the Stability and Maturity of the End Product. Dyn. Soil Dyn. Plant 2009, 3, 17–31. [Google Scholar]
  25. Palaniveloo, K.; Amran, M.A.; Norhashim, N.A.; Mohamad-Fauzi, N.; Peng-Hui, F.; Hui-Wen, L.; Kai-Lin, Y.; Jiale, L.; Chian-Yee, M.G.; Jing-Yi, L.; et al. Food Waste Composting and Microbial Community Structure Profiling. Processes 2020, 8, 723. [Google Scholar] [CrossRef]
  26. Schwalb, M.; Rosevear, C.; Chin, R.; Barrington, S. Food Waste Treatment in a Community Center. Waste Manag. 2011, 31, 1570–1575. [Google Scholar] [CrossRef]
  27. Mironov, V.; Vanteeva, A.; Merkel, A. Microbiological Activity during Co-Composting of Food and Agricultural Waste for Soil Amendment. Agronomy 2021, 11, 928. [Google Scholar] [CrossRef]
  28. Mironov, V.; Vanteeva, A.; Sokolova, D.; Merkel, A.; Nikolaev, Y. Microbiota Dynamics of Mechanically Separated Organic Fraction of Municipal Solid Waste during Composting. Microorganisms 2021, 9, 1877. [Google Scholar] [CrossRef]
  29. Ivanov, Y.; Mironov, V. Test Results In-Vessel Composting System at the Cattle Farm Located in the Central Part of Russia. AMA Agric. Mech. Asia Africa Lat. Am. 2018, 49, 86–90. [Google Scholar]
  30. Navarro, A.F.; Cegarra, J.; Roig, A.; Garcia, D. Relationships between Organic Matter and Carbon Contents of Organic Wastes. Bioresour. Technol. 1993, 44, 203–207. [Google Scholar] [CrossRef]
  31. Arrigoni, J.P.; Paladino, G.; Garibaldi, L.A.; Laos, F. Inside the Small-Scale Composting of Kitchen and Garden Wastes: Thermal Performance and Stratification Effect in Vertical Compost Bins. Waste Manag. 2018, 76, 284–293. [Google Scholar] [CrossRef]
  32. Cesaro, A.; Belgiorno, V.; Guida, M. Compost from Organic Solid Waste: Quality Assessment and European Regulations for Its Sustainable Use. Resour. Conserv. Recycl. 2015, 94, 72–79. [Google Scholar] [CrossRef]
  33. Laor, Y.; Parker, D.; Pagé, T. Measurement, Prediction, and Monitoring of Odors in the Environment: A Critical Review. Rev. Chem. Eng. 2014, 30, 139–166. [Google Scholar] [CrossRef]
  34. Font, X.; Artola, A.; Sánchez, A. Detection, Composition and Treatment of Volatile Organic Compounds from Waste Treatment Plants. Sensors 2011, 11, 4043–4059. [Google Scholar] [CrossRef]
  35. Kim, S.; Chen, J.; Cheng, T.; Gindulyte, A.; He, J.; He, S.; Li, Q.; Shoemaker, B.A.; Thiessen, P.A.; Yu, B.; et al. PubChem 2023 Update. Nucleic Acids Res. 2023, 51, D1373–D1380. [Google Scholar] [CrossRef] [PubMed]
  36. Shan, G.; Zhang, H.; Jiang, T. Correlation Coefficients for a Study with Repeated Measures. Comput. Math. Methods Med. 2020, 2020, 7398324. [Google Scholar] [CrossRef] [PubMed]
  37. Mironov, V.V.; Bochkova, E.A.; Gannesen, A.V.; Vanteeva, A.V.; Russkova, Y.I.; Nozhevnikova, A.N. Dynamics of Biological Processes during Composting of Anaerobically Digested Wastewater Sludge. Microbiology 2020, 89, 470–482. [Google Scholar] [CrossRef]
  38. Guo, R.; Li, G.; Jiang, T.; Schuchardt, F.; Chen, T.; Zhao, Y.; Shen, Y. Effect of Aeration Rate, C/N Ratio and Moisture Content on the Stability and Maturity of Compost. Bioresour. Technol. 2012, 112, 171–178. [Google Scholar] [CrossRef]
  39. Mironov, V.; Moldon, I.; Shchelushkina, A.; Zhukov, V.; Zagustina, N. Bio-Drying of Municipal Wastewater Sludge: Effects of High Temperature, Low Moisture Content and Volatile Compounds on the Microbial Community. Fermentation 2023, 9, 570. [Google Scholar] [CrossRef]
  40. Pagans, E.; Barrena, R.; Font, X.; Sánchez, A. Ammonia Emissions from the Composting of Different Organic Wastes. Dependency on Process Temperature. Chemosphere 2006, 62, 1534–1542. [Google Scholar] [CrossRef]
  41. Mao, I.-F.; Tsai, C.-J.; Shen, S.-H.; Lin, T.-F.; Chen, W.-K.; Chen, M.-L. Critical Components of Odors in Evaluating the Performance of Food Waste Composting Plants. Sci. Total Environ. 2006, 370, 323–329. [Google Scholar] [CrossRef]
  42. Jokela, J.P.Y.; Kettunen, R.H.; Rintala, J.A. Methane and Leachate Pollutant Emission Potential from Various Fractions of Municipal Solid Waste (MSW): Effects of Source Separation and Aerobic Treatment. Waste Manag. Res. J. Int. Solid Wastes Public Clean. Assoc. ISWA 2002, 20, 424–433. [Google Scholar] [CrossRef] [PubMed]
  43. Gao, G.; Zhang, X.; Yan, Z.; Cheng, Y.; Li, H.; Xu, G. Monitoring Volatile Organic Compounds in Different Pear Cultivars during Storage Using HS-SPME with GC-MS. Foods 2022, 11, 3778. [Google Scholar] [CrossRef] [PubMed]
  44. Moreno, A.I.; Arnáiz, N.; Font, R.; Carratalá, A. Chemical Characterization of Emissions from a Municipal Solid Waste Treatment Plant. Waste Manag. 2014, 34, 2393–2399. [Google Scholar] [CrossRef] [PubMed]
  45. Perveen, S. Introductory Chapter: Terpenes and Terpenoids. In Terpenes and Terpenoids; Perveen, S., Al-Taweel, A., Eds.; IntechOpen: Rijeka, Croatia, 2018. [Google Scholar]
  46. He, Z.; Chen, K.; Huang, C.; Xin, X.; Tan, H.; Jiang, J.; Wu, X.; Zhai, J. Microbial Metabolism and Health Risk Assessment of Kitchen Waste Odor VOCs. Environ. Sci. Pollut. Res. 2023, 30. [Google Scholar] [CrossRef] [PubMed]
  47. Dewan, A.; Cichy, A.; Zhang, J.; Miguel, K.; Feinstein, P.; Rinberg, D.; Bozza, T. Single Olfactory Receptors Set Odor Detection Thresholds. Nat. Commun. 2018, 9, 2887. [Google Scholar] [CrossRef] [PubMed]
  48. Müller, R.; Rappert, S. Pyrazines: Occurrence, Formation and Biodegradation. Appl. Microbiol. Biotechnol. 2010, 85, 1315–1320. [Google Scholar] [CrossRef]
  49. Rosenfeld, P.E.; Clark, J.J.J.; Hensley, A.R.; Suffet, I.H. The Use of an Odour Wheel Classification for the Evaluation of Human Health Risk Criteria for Compost Facilities. Water Sci. Technol. 2007, 55, 345–357. [Google Scholar] [CrossRef]
  50. Jang, J.-K. Amines as Occupational Hazards for Visual Disturbance. Ind. Health 2016, 54, 101–115. [Google Scholar] [CrossRef]
  51. Wójcik, W.; Łukasiewicz, M.; Puppel, K. Biogenic Amines: Formation, Action and Toxicity—A Review. J. Sci. Food Agric. 2021, 101, 2634–2640. [Google Scholar] [CrossRef]
  52. Feng, Z.; Zhang, J.; Chen, G.; Ge, Y.; Zhang, X.; Zhu, H. Extracellular Expression of L-Aspartate-α-Decarboxylase from Bacillus Tequilensis and Its Application in the Biosynthesis of β-Alanine. Appl. Biochem. Biotechnol. 2019, 189, 273–283. [Google Scholar] [CrossRef]
  53. Deng, W.; Ogita, S.; Ashihara, H. Ethylamine Content and Theanine Biosynthesis in Different Organs of Camellia Sinensis Seedlings. Z. Naturforsch. C 2014, 64, 387–390. [Google Scholar] [CrossRef] [PubMed]
  54. Jameson, E.; Quareshy, M.; Chen, Y. Methodological Considerations for the Identification of Choline and Carnitine-Degrading Bacteria in the Gut. Methods 2018, 149, 42–48. [Google Scholar] [CrossRef] [PubMed]
  55. Zeisel, S.H.; DaCosta, K.A.; Fox, J.G. Endogenous Formation of Dimethylamine. Biochem. J. 1985, 232, 403–408. [Google Scholar] [CrossRef] [PubMed]
  56. Hathaway, G.J.; Proctor, N.H. Proctor and Hughes’ Chemical Hazards of the Workplace; John Wiley & Sons: Hoboken, NJ, USA, 2014; ISBN 0471268836. [Google Scholar]
Figure 1. Schematic illustration of a (test) laboratory setup simulating the conditions of aerobic solid phase biodegradation: chamber (1); reaction vessel (2); temperature sensors (3, 4); temperature meter-regulator (5); gas analyser (6); computer (7); blower (8); gas sensors (9); sampling port for solid phase microextraction (SPME) (10); flask (11); heating element (12); rotameter (13); atmospheric air (14); waste air (15).
Energies 16 07271 g001
Figure 2. Comparison of profiles of physicochemical parameters: (a) temperature; (b) pH of the substrate suspension from reaction chambers with: SS+WC, FW+WC and ms-OFMSW (error bars are mean ± standard deviation).
Energies 16 07271 g002
Figure 3. Dynamics of emission of the main gaseous compounds during SS+WC, FW+WC and ms-OFMSW composting: (a) CO2, (b) NH3, (c) CH4, (d) H2S (error bars are mean ± standard deviation).
Energies 16 07271 g003
Figure 4. Dynamics of VOC formation for 3 substrates (a), where (b) is SS+WC, (c) is ms-OFMSW, (d) is FW+WC (error bars are mean ± standard deviation) and the content of the chemical groups in the exhaust air: for (b) “others” are 1.5% of total amount of VOC, including: alkenes and esters; for (c) “others” are 2.9%: esters, S-compounds and aldehydes; for (d) “others” are 2.3%: ethers, esters, S-compounds, alkenes; Org-acids (organic acids) and BCMT (bicyclic monoterpenes).
Energies 16 07271 g004
Figure 5. Venn diagram showing the number of unique and common VOC in air emissions from SS+WC, ms-OFMSW and FW+WC composting.
Energies 16 07271 g005
Figure 6. Correlation matrices of Pearson coefficients R, at p-value < 0.05 of different variables of composting of (a) SS+WC, (b) ms-OFMSW, and (c) FW+WC: All. VOC is the total amount of volatile compounds, BCMT are bicyclic monoterpenes.
Energies 16 07271 g006
Figure 7. Percentage ratio of N-containing compounds in the emission from the composting substrates (from the total of 10 measurements).
Energies 16 07271 g007
Table 1. Initial physicochemical and biological parameters of the 3 composting substrates.
ParametersSubstrate Type
SS+WCms-OFMSWFW+WC
pH6.72 ± 0.055.14 ± 0.084.06 ± 0.22
Electrical conductivity (EC, µS cm−1)1024 ± 0.031310 ± 12857 ± 24
Mass fraction of water (%)58.90 ± 4.7144.87 ± 2.2469.8 ± 2.2
Kjeldahl total nitrogen (N, %)2.3 ± 0.31.38 ± 0.301.21 ± 0.18
Ash content (%)38.12 ± 0.7140.55 ± 6.9312.84 ± 1.04
Organic matter (OM, %)65.45 ± 1.5059.45 ± 6.9387.16 ± 1.04
Total content of organic carbon (C, %)38.50 ± 0.6029.73 ± 3.4743.58 ± 0.58
C/N ratio14.95 ± 1.2021.54 ± 3.7736.02 ± 0.76
Germination index (GI, %)102.6 ± 24.734.0 ± 4.073.69 ± 12.40
Table 2. Comparison of composition of the VOC that constituted the majority in the emissions from each composting substrate.
Classification [35]Composting Substrates
Chemical GroupsFW+WCms-OFMSWSS+WC
SubgroupCompoundTAP *, CU% **TAP *, CU% **TAP *, CU% **
ALCOHOLS8944 ± 10733.0%3155 ± 3475.4%470 ± 5219.4%
MonohydricEthanol1970 ± 2170.7%218 ± 240.4%74 ± 83.1%
Dimethyloctanol347 ± 380.1%284 ± 310.5%83 ± 93.4%
MonoterpenoidsTerpinen-4-ol681 ± 750.2%381 ± 420.7%4 ± 20.2%
β-Fenchol208 ± 230.1%379 ± 420.7%n.d.n.d.
Sesquiterpenoidscis-Sesquisabinene hydraten.d.n.d.384 ± 420.7%83 ± 93.4%
ETHERS2598 ± 2700.9%n.d.n.d.n.d.n.d.
Diisopropyl ether1531 ± 1530.5%n.d.n.d.n.d.n.d.
Ethylhexyl ether546 ± 550.2%n.d.n.d.n.d.n.d.
ALDEHYDES5675 ± 5671.9%365 ± 360.6%71 ± 73.0%
Acetaldehyde680 ± 680.2%n.d.n.d.65 ± 62.7%
Propanal2012 ± 2010.7%n.d.n.d.n.d.n.d.
Nonanal24 ± 2<0.1%136 ± 140.2%n.d.n.d.
KETONES25,657 ± 28228.6%1106 ± 1221.9%75 ± 83.1%
Acetone22,173 ± 24397.4%n.d.n.d.5 ± 20.2%
2-Methyl vinyl ketone1182 ± 1300.4%n.d.n.d.n.d.n.d.
1-Heptene-3-one205 ± 230.1%404 ± 440.7%n.d.n.d.
Terpenoid-ketonesFenchone205 ± 230.1%229 ± 250.4%22 ± 20.9%
α-Pinocarvone487 ± 540.2%139 ± 150.2%36 ± 41.5%
ORGANIC ACIDS (Org-acids)3418 ± 4101.1%944 ± 1131.6%331 ± 3313.7%
Acetic acid1156 ± 1390.4%61 ± 70.1%126 ± 135.2%
Propionic acid508 ± 610.2%349 ± 420.6%26 ± 31.1%
Butyric acid1202 ± 1440.4%444 ± 530.8%103 ± 104.3%
ESTERS2341 ± 2810.8%691 ± 831.2%33 ± 41.4%
Methyl acetate610 ± 730.2%54 ± 70.1%n.d.n.d.
Phenyl propyl carbonate766 ± 920.3%206 ± 250.4%21 ± 20.9%
MONOTERPENES (MT)225,929 ± 18,07475.4%41,938 ± 335572.2%96 ± 74.0%
α- & β-Terpinene2499 ± 2000.8%977 ± 781.7%n.d.n.d.
δ-Terpinene541 ± 430.2%113 ± 90.2%29 ± 21.2%
D-Limonene214,289 ± 17,14371.5%40,179 ± 321469.2%n.d.n.d.
Acyclic MTβ-Myrcene6423 ± 5142.1%n.d.n.d.48 ± 42.0%
BICYCLIC MONOTERPENES (BCMT)3268 ± 2941.1%2952 ± 2665.1%40 ± 31.7%
δ- & β-Pinene759 ± 770.3%2952 ± 2665.1%36 ± 41.4%
α-Pinene1377 ± 1240.5%n.d.n.d.5 ± 20.2%
Camphene798 ± 720.3%n.d.n.d.n.d.n.d.
SESQUITERPENES (ST)2620 ± 2360.9%4500 ± 4057.7%762 ± 6131.4%
α-Ylangene45 ± 4<0.1%2765 ± 2494.8%37 ± 31.5%
β-Elemene83 ± 7<0.1%192 ± 170.3%131 ± 105.4%
α-, β- & γ-Calacorene357 ± 320.2%512 ± 330.9%164 ± 146.8%
α- & β-Selinene416 ± 370.2%107 ± 100.2%27 ± 21.1%
* Total area under peaks of the compound or the chemical group (bold) for 10 measurements (TAP) in confidential units (CU); ** of TVOC—Total Volatile Organic Compounds (TVOC) for 10 measurements in CU; n.d.—not detected.
Table 3. Comparison of the composition of S- and N-compounds in the emissions of each composting substrate.
Classification [35]Composting Substrates
Chemical GroupsFW+WCms-OFMSWSS+WC
SubgroupCompoundTAP *, CU% **TAP *, CU% **TAP *, CU% **
S-COMPOUNDS1911 ± 1910.6%601 ± 601.0%46 ± 41.9%
Dimethyl sulphide509 ± 510.2%16 ± 2<0.1%n.d.n.d.
Dimethyl disulphide257 ± 260.1%138 ± 140.2%n.d.n.d.
Dimethyl trisulphide1145 ± 1150.4%447 ± 450.8%46 ± 41.9%
N-COMPOUNDS17,165 ± 18885.7%1842 ± 2033.2%495 ± 4520.4%
AminesTrimethylamine24 ± 3<0.1%44 ± 50.1%56 ± 52.3%
Dimethylamine553 ± 610.2%45 ± 50.1%200 ± 188.2%
Ethylamine8531 ± 9382.8%755 ± 831.3%110 ± 104.5%
Ethylmethylamine659 ± 720.2%n.d.n.d.117 ± 114.8%
Diethylamine813 ± 890.3%12 ± 1<0.1%4 ± 10.2%
tert-Butylamine3708 ± 4081.2%n.d.n.d.n.d.n.d.
Heterocyclic1-Methylpiperazine506 ± 560.2%426 ± 470.7%n.d.n.d.
2,3-Dimethylpirazine310 ± 340.1%422 ± 460.7%n.d.n.d.
2,5-Dimethylpirazine308 ± 340.1%n.d.n.d.n.d.n.d.
3,5-Dimethylpyrazole287 ± 320.1%53 ± 60.1%n.d.n.d.
AlkanolamineEthanolamine1281 ± 1410.4%85 ± 90.1%9 ± 10.4%
KetoximesEthyl acetohydroxamate186 ± 200.1%n.d.n.d.n.d.n.d.
* Total area under peaks of the compound or the chemical group (bold) for 10 measurements (TAP) in confidential units (CU). ** of TVOC; Total Volatile Organic Compounds (TVOC) for 10 measurements in CU. n.d.—not detected.
Disclaimer/Publisher’s Note: The statements, opinions and data contained in all publications are solely those of the individual author(s) and contributor(s) and not of MDPI and/or the editor(s). MDPI and/or the editor(s) disclaim responsibility for any injury to people or property resulting from any ideas, methods, instructions or products referred to in the content.

