Abstract
The article presents research on the possibilities of utilising the Lean Management method to increase the profitability of coal mining operations through cost rationalisation and production optimisation. The Lean Management method has its roots in the automotive industry, but its significant benefits can allow it to be transferred to other industries. Based on the analysis of global literature describing examples of its application in general mining, as well as the authors’ own observations related to Polish hard coal mining, it was determined that the Lean Management method is not being utilised in this field. This article outlines the course and results of an original expert-mathematical study to assess the usefulness of specific Lean Management tools and techniques in hard coal mining. The study drew on knowledge obtained from selected, competent experts who demonstrated high levels of agreement in their assessments. Five core production areas were identified, and twelve widely used Lean Management tools and techniques were selected. The obtained assessments of the usefulness of Lean tools could serve as valuable guidance for mining management in the selection of methods for improving mining production in coal mines.
1. Introduction
The EU climate policy pursued in recent years, particularly in the aspect of the European Green Deal, is unequivocally negative towards hard coal as an energy resource. A number of directives, strategies and regulations introduced aim to completely decarbonise the energy sector in the European Union by 2050. In the document entitled Energy Policy of Poland 2040 (PEP2040), published in 2021 [1], the share of coal in electricity generation in Poland in 2030 is projected to be between 37% and 56%, and in 2040 between 11% and 28% (depending on the price of CO2 emission allowances).
On the other hand, Poland still has significant hard coal deposits. At the end of 2020, the total hard coal balance resources in Poland amounted to 64.4 billion tonnes, of which 28.4 billion tonnes were developed resources. Most of the resources are thermal coal deposits [2]. The above facts allow one to conclude, therefore, that Poland’s energy sector is and will continue to be in the coming decades, largely based on hard coal. The Russian military aggression against Ukraine in February 2022, in addition to a number of other factors, has also had a significant impact on the hard coal sector and the European energy sector as a whole. The situation is dynamic and difficult to predict, but strong signals about the need for independence from Russian energy resources, coming from almost the entire European Union, indicate that energy security objectives may slow down the EU’s decarbonisation plans. Confirmation of such a possibility can be found, inter alia, in the Assumptions to the Update of the Energy Policy of Poland until 2040 [3], prepared by the Ministry of Climate and Environment and adopted by the Polish Council of Ministers on 29 March 2022. The document indicates, inter alia, that Poland’s updated energy policy must also take into account energy sovereignty, the use of domestic hard coal deposits may be periodically increased in situations where the energy security of the state is threatened, and the rate of reduction in the extraction and use of Polish coal may decrease slightly compared to previous scenarios [3]. PEP2040 indicates that in the long term, due to increasing environmental requirements and decreasing demand of the economy for fossil fuels, including hard coal, the role of these products in the economy will gradually decrease. During the transition period, the key task of mining companies is to continuously take measures to increase the efficiency of their operations as well as the competitiveness of their products [1].
As the first objective to increase the profitability of hard coal mining, the above-mentioned document mentions the rationalisation and optimisation of current operating costs and the sales system as well as the creation of stabilising mechanisms for periods of downturn [1]. One such solution could be the implementation of the Lean Management methodology. Unfortunately, there are few good examples of its application in Polish coal mines and above all, there is a lack of research on the usefulness of individual Lean tools in mining conditions.
The following article introduces the Lean Management method, which is currently one of the most popular process improvement methods in industry, presents concepts and examples of practical application of the method in the mining industry, describes the course and presents the results of a mathematical and expert study on the usefulness of Lean Management tools and techniques in the operating conditions of Polish coal mines.
2. Materials and Methods
2.1. Lean Management Method and Its Tools
Lean Management is a universal concept, especially in terms of the numerous successful implementations of this method in both the manufacturing and service sectors [4], and is one of the best-known and most widely used methods for the operational management of companies. It is also referred to as Lean Manufacturing, Lean Production and Lean for short [5]. Lean Management is defined in several ways in the literature: as a philosophy (e.g., [6,7]), a system (e.g., [8,9]), a concept (e.g., [5,10]), a methodology (e.g., [11,12]) or finally a method (e.g., [13,14,15]). The choice of the appropriate term should always be determined by the scope of the deliberations.
The Lean Management method has its roots and foundations in the TPS—the Toyota Production System (after the name of the automotive corporation in which this system developed over decades) [5]. On the other hand, the concept of Lean in the context of production management was first used in 1988 by J. Krafcik in his article, “Triumph of the Lean Production System” [8], with references precisely to the system used in Toyota factories. The idea of Lean Manufacturing was popularised by J. P. Womack, D. T. Jones and D. Roos. In 1990, they published the famous paper, “The Machine That Changed the World” [16], in which they pointed to the Toyota Production System as the first lean manufacturing system. The fathers of the Toyota Production System are considered to be Toyota president E. Toyoda and T. Ohno, director of one of Toyota’s factories (and later vice-president) [17]. Toyota’s ambition was to create an original Japanese production technique, adapted to the country and its culture and taking into account the new business environment. The Japanese did not force themselves to build everything from scratch but drew on American models [18]. Toyota was inspired by some of the solutions used in Ford’s production system, but taken as a whole, the two systems were radically different. The key differences between the two are indicated in Table 1.

Table 1.
Comparison of Ford and Toyota production systems [19].
Professor J. K. Liker, in his book The Toyota Way [20], outlined 14 principles that Toyota followed in implementing its production system. These principles are used for the implementation and application of Lean Management.
Liker also proposed the concept of the ‘Toyota House’ as a graphic representation of the Lean philosophy which is shown in Figure 1. The roof of the Toyota House represents the predominant goal of the organisation. It is based on two pillars: Just in Time, or precisely on time, and Jidoka, i.e., embedding quality into the production process. The foundations of the House of Toyota, and at the same time the entire Toyota Production System philosophy, are levelled production and process standardisation. Between the foundation and the roof, two forces at work lead to continuous improvement: a top-down one, i.e., motivating employees and a culture of teamwork, and a bottom-up one, i.e., eliminating waste.
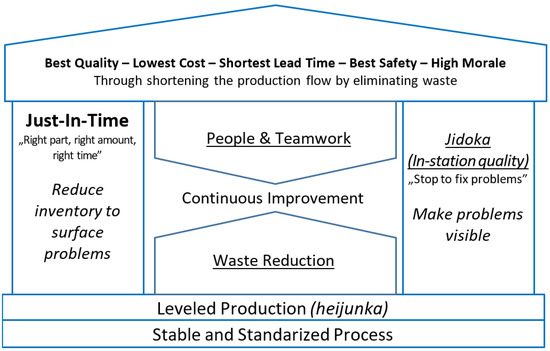
Figure 1.
The Toyota House Model [21].
The success of TPS as a new approach to process management resulted in Toyota’s rapid expansion in the global market and excellent financial performance, which attracted the attention of academics and practitioners alike—owners and managers of various companies around the world. As a result, the idea of lean manufacturing was quickly popularised [22]. Lean Management, based on the Toyota experience, places a very strong emphasis on eliminating waste in processes. In Lean, anything that does not add value from the customer’s point of view is considered waste. One of the key assumptions of this method is to thoroughly analyse the processes (e.g., using value stream mapping—VSM) and to assign each activity to a group of value-added activities from the customer’s point of view or to non-value-added activities [23]. Anything that does not add value in the eyes of the customer is, in the Lean method, waste (Japanese: muda). One of the founders of Lean—T. Ohno—distinguished seven key process losses, commonly known as the ‘7 muda wastes’ or ‘7 wastes of Lean’ [24]: overproduction, waiting, transport, overprocessing, inventory, unnecessary movement and quality defects. The Lean Management method uses a number of tools and techniques to help the organisation reduce waste and add value for the customer, including [25]:
- 5S—A tool to better organise the workplace (and the whole factory) and to help maintain order. 5S is an acronym from the words: Selection; Systematics; Cleaning; Standardisation; Self-discipline (Japanese: Seiri, Seito, Seiso, Seiketsu, Shitsuke), (translated as ‘sort’, ‘set in order’, ‘shine’, ‘standardise’ and ‘sustain’);
- 5Why—The practice of asking the question “why?” several times at the origin of a problem in order to determine the root cause;
- Andon—Light (or sound) signalling on production lines for rapid notification of problems;
- Continuous flow—The continuous production and transfer (without downtime or storage) of individual pieces or small batches in a process. Production of only those items for which there is a current demand at the next workstation;
- Continuous Improvement—Continuous efforts to improve products, services or processes. It most often uses the PDCA and Kaizen approaches;
- Ishikawa diagram—A diagram that illustrates cause and effect relationships and separates causes from effects. Otherwise known as a fish diagram, a fault tree diagram, a cause-and-effect diagram,
- Spaghetti diagram—A technique for visualising the mobility path of workers, products, semi-finished products or materials. Most often, the drawing of movement paths is superimposed on the layout (diagram) of the plant;
- Flow Production—A way of organising mass production to minimise flow time through the process. Involves the standardisation of raw materials and parts, operation times and appropriate process layout and scheduling. It is otherwise referred to as flow production;
- Gemba—The place where the actual work is done, where value is added to the product or where the service is provided;
- Genchi Genbutsu—The principle of verifying an existing problem or event at the actual site of its origin, related to investigating the problem at its source;
- Heijunka—A technique of properly planning and balancing production to avoid downtime and stockpiling to level production;
- Hoshin Kanri—A strategic management principle aimed at integrating, unifying and organising the key elements of a company’s strategy;
- Jidoka—Organisation of production systems to autonomously detect and eliminate errors and deviations from accepted standards. Most often associated with the separation of the machine from the operator and its autonomisation;
- Just in Time (JIT)—A production system for producing what is needed, at the right time and in the right quantity, to minimise wastage in the process;
- Kaikaku—Radical, revolutionary process improvement, often requiring investment. It is the opposite of, but also a synergistic complement to Kaizen;
- Kaizen—The continuous, gradual improvement of processes and organisations through the use of the small-steps method. Also linked to the employee idea system;
- Kanban—A Pull system production control tool using cards, representing an internal order for a component;
- One Piece Flow (OPF)—A process organisation that allows components (semi-finished products) to be processed and transferred through the process one piece at a time. It involves a transport and production batch equal to 1, otherwise understood as a one-piece flow;
- Overall Equipment Effectiveness (OEE)—An indicator of the total use of machinery. It is the product of machinery availability, actual productivity and production quality;
- Plan, Do, Check, Act (PDCA)—An algorithm for conducting improvement activities in the spirit of Continuous Improvement: Plan; Do; Check; Apply;
- Poka-yoke—An approach to preventing inadvertent errors. It is understood as any tool that prevents an error/quality defect from occurring in a process, independent of the operator. It is usually uncomplicated, cheap and quick to prepare;
- Pull system—A production system in which the start of a job at a station is initiated by a demand at the next station in the process. Orders are generated in the process from the last step (from the end) backwards. It is referred to as a suction system;
- Single Minute Exchange of Die (SMED)—A technique for minimising machine changeover times;
- Supermarket—An inter-operational warehouse that supports self-controlled production. It allows retrieval and replenishment of stock only for a certain number of components, thus preventing overproduction. It is an important component of the suction system;
- Total Productive Maintenance (TPM)—A maintenance management technique aimed at ensuring maximum availability of equipment. It strives to achieve zero breakdowns, zero shortages and zero accidents at work;
- Visual Management (VM)—A set of techniques and ways to visualise problems, events, information and objectives. An improvement in communication and process management.
2.2. Concepts for Using Lean Management in Mining
The global mining industry is increasingly looking for proven organisational solutions to reduce mining and mineral processing costs. These solutions are often imported from other industries. Lean management is an example of a method that is receiving increasing recognition in this sector [4].
The Lean method has emerged and developed over decades mainly in the automotive production environment. Despite numerous examples of applications in various other processes and industries, it is the automotive production halls that should be considered its ‘natural environment’. Lean requires full, consistent and methodical implementation and adaptation of tools and techniques to local conditions [26]. As the production conditions in mines differ significantly from those of an automotive company, the implementation of the method in the conditions of a mining company must, therefore, differ from that of an automotive company.
A comparison of conditions in the mining industry with those in the automotive industry in the context of the possibility of implementing Lean was presented in the works of K. Dunstan [27] and J. Helman [28]. The authors conducted their analysis mainly from an ore mining perspective, and the results of their analysis are presented in Table 2 and Table 3.
Table 2.
Comparison of the specifics of the raw materials and minerals industry and Automotive [27].
Table 3.
Comparison of the specificities of the mining industry and the automotive industry [28].
The authors of both papers agreed on a number of important differences between the two industries, including the volatile, unstable working conditions in mining versus the stable, safe conditions of the production halls and the built-in need for a push system in the mining sector.
The possibility of replacing the push system with a Pull system (Pull system) in mining was discussed in more detail by J. Helman in another publication [29], demonstrating that there is no substantive justification for attempting to apply a Pull system to strictly mining processes. Nevertheless, elements of the Pull system can be implemented in areas of a mine where there is a flow of different types of materials [29]. At this point, it is also worth citing the work of M. Sukiennik and P. Bak [30], which considers the possibility of implementing Lean in the broader power industry. The paper lists important elements that differentiate this industry from most industrial sectors [30]:
- Process continuity, which is required in the power industry but not in typical companies;
- Stability of the working environment—in the power industry, this is basically nonexistent;
- Diversification of suppliers—virtually impossible in the power industry;
- The need for specialised staff in the power industry is present in many areas of operation, which makes staff turnover difficult and contributes to problems in a situation of demographic decline;
- In the power industry, companies are closely linked to other entities, which is not the case in typical industries;
- The need to maintain a certain level of production that determines the actions of power companies.
The article referenced above highlights the cultural aspect of Lean implementation outlines the elements that can contribute to implementation failure, and proposes three main steps for implementing Lean in the power industry [30]:
- Initial implementation;
- Proper implementation;
- Developing a culture of continuous improvement.
J. Korski, in his work [31], points to Lean Management as the peak current system approach to production process management aimed at customer satisfaction and economic efficiency. The article also comprehensively describes the possibilities and conditions for applying this approach to mining companies.
In the work of V. Mikhalchenko and Y. Rubanik extensively discussed the five principles of Lean Management in the context of Russian coal mining, concluding that the implementation of Lean principles is possible, but will require a fundamental change in the basic principles of design and management of industrial coal mining systems. A qualitative increase in the efficiency of resource use through the implementation of a new approach to shaping production systems on Lean principles will contribute to a significant increase in the competitiveness of mining enterprises in modern economic conditions [32].
For the sake of balance, it is worth citing a more sceptical paper by S. Haugen, who, based on her mining experience, discusses in detail the 14 principles of the Toyota Production System in the context of metal mining. The paper emphasises that the implementation of continuous flow and the reduction of inventory buffers brings problems to light, motivating improvement, but before buffers are eliminated, it is important to ensure that we are able to deal with new problems that arise because of this [33].
S. Haugen points out that a stable, predictable and repeatable production process is a prerequisite for Lean principles or tools to work properly, and mining processes are not such. Furthermore, Lean contributes to lower production costs by increasing flexibility and speed (and not just eliminating waste). If this effect is not desirable for a mining company (e.g., due to continuous high market demand and low value of capital frozen in work-in-progress), Lean may not be a good solution [33].
Several other works, in addition to presenting a general approach to the application of Lean in mining, propose a more detailed analysis—at the level of specific tools. In an article discussing the possibilities of implementing Lean in underground ore mining [34], A. R. Wijaya, R. Kumar and U. Kumar gave examples regarding the occurrence of eight Lean losses in the mining industry and analysed the feasibility of implementing selected Lean principles and tools. The results are presented in Table 4 and Table 5.
Table 4.
Incidence of eight losses in mining [34].
Table 5.
Feasibility of implementing selected Lean principles and tools in mining [34].
In addition, J. Helman, in the article cited previously [28], presents an assessment regarding the adaptability of exemplary Lean Management tools in mining, as shown in Table 6.
Table 6.
Adaptability of Lean Management tools in mining [28].
J. C. Yingling, R. B. Detty and J. J. Sottile describe in detail the Lean concept and the possible benefits of its potential application in US coal mines. The authors point to the possible application of the following Lean principles and tools in specific areas of the mine, among others [35]:
- TPM;
- SMED;
- Pull system;
- Standardisation/standardised work;
- Continuous flow;
- JIT;
- Kanban;
- PDCA;
- Kaizen.
As indicated in the above-cited article [35], many of the elements of the SMED tool are already applicable to longwall changeover processes. Also described are tools and principles (e.g., flexibility, production levelling, flow design), which, according to the authors, may be impossible or difficult to translate directly to mining conditions [35].
In their article, A. Bator and A. Paluchniak [36] proposed the use of one of the main elements of the Lean method—the 5S tool (extended by the sixth S, which stands for Safety) to increase work safety in mines. The paper takes a closer look at 5S and points to the possibility of its application in the Polish coal mining industry in order to avoid many accidents, especially those of a fatal nature.
In 2016, J. Brodny and K. Stecuła pointed out the validity of applying the TPM concept to reduce costs in coal mines by increasing the efficiency of machine utilisation. They described the most important TPM indicator (and at the same time, one of the most important in the whole Lean method)—the OEE, i.e., the machine utilisation efficiency index. The paper proposes a method of obtaining the data for calculating the indicator and presents the results of an analysis regarding 16 work shifts for a longwall complex consisting of a shearer, a longwall conveyor, a face conveyor and a crusher. According to the authors’ calculations, the effective utilisation of the entire machinery set during the study period was less than 54%. Even having taken into account the specifics of mining production, this result was considered far too low compared to other production industries. As the authors themselves pointed out, it is difficult to assess the results obtained against other mining companies due to the lack of reliable data to which they could be compared [37].
A similar concept of using the OEE indicator in measuring the efficiency of a longwall complex was presented in detail by R. Polak [38]. The paper also presents an analysis of data from over 850 failures and determines the distributions of two other important Total Productive Maintenance indicators: MTBF (Mean Time Between Failures) and MTTR (Mean Time To Repair).
The vast majority of publications present the authors’ own view on the feasibility of implementing Lean in mining, based on their knowledge of the issue and the literature, but rarely supported by the results of wider research or documented implementation trials. For this reason, the following section discusses examples of practical applications for the Lean Management method in the Polish and global mining industry.
2.3. Examples of Lean Management Method Application in the Polish and Global Mining Industry
The literature presents numerous examples of mining companies that have attempted to implement the Lean method. Alcoa was probably the first raw materials company to use the Toyota Production System and developed its own version, called the Alcoa Business System (ABS) [39]. According to the International Quality and Productivity Centre (IQPC), since the combination of two business improvement strategies, Lean and Six Sigma, began to permeate the Australian mining industry, there has been strong evidence demonstrating that overall process improvement has been achieved, resulting in faster and higher levels of return on investment [40].
A. Klippel, C. Petter and J. Antunes, in a 2008 article [41], reported on two cases when ore mining process mapping based on the Lean concept was applied. The examples cited involved the use of value stream mapping to classify activities as value-adding or non-value-adding (needed and unnecessary from the customer’s point of view). Specific actions were taken to eliminate non-value-adding activities and minimise waste, resulting in significant benefits in increased productivity, reduced costs and improved workplace safety [41].
The Rio Tinto Group began implementing Lean in aluminium ore mining in 2004 as a complement to its Six Sigma improvement programme. Subsequently, the project was expanded to include copper ore mining as well as coal and iron ore operations, mainly in Australia. Building on Rio Tinto’s understanding of Lean (‘the continuous removal of waste’), K. Dunstan, B. Lavin and R. Sanford proposed that Lean in practice consists of [27]:
- Involving cell leaders;
- Asking employees to respect the agreed standards for their work;
- Enabling employees to write their own standards and improve them;
- Visual presentation of key production performance data (visual management);
- Enabling shopfloor staff to make data-driven operational decisions;
- Organising operational and maintenance staff into production teams;
- Applying the business improvement toolkit.
The Rio Tinto Group named its Lean Six Sigma programme ‘IPT’ (from Improving Performance Together) and applied it to all its business units [42].
Rio Tinto Alcan used Six Sigma and Lean Manufacturing tools to streamline processes and increase productivity. In 2008 alone, savings from the use of Lean Management and Six Sigma at Rio Tinto Alcan amounted to more than $28 million [43].
BHP Billiton ran a similar programme called Business Excellence. Several of the group’s oil sands operations in Canada have begun to apply Lean and Six Sigma principles and methods to reduce defects and wastage in the production operations of the bitumen materials creation process [39].
Quadra FNX Mining (now KGHM International) had its own programme, called ‘Rising the Bar’. The programme was based on the appropriate application of Lean Six Sigma tools, starting with value stream mapping for the entire process, which establishes a benchmark for performance using standard definitions and KPIs (Key Performance Indicators) [39].
The Diavik diamond mine also focused resources on the Lean Six Sigma business improvement system. The method at Diavik aimed to improve the efficiency of operations by removing duplicate or redundant activities and automating processes as much as possible. The focus was on rethinking processes in depth and defining how they can be done in a way that is better, faster and cheaper [44]. All departments at the Diavik diamond mine were required to find ways to reduce costs. The automation of underground processes and the Lean Six Sigma initiative are examples of sustainable operations at Diavik. A success story was that ideas to reduce cost intensity were generated by employees and subcontractors at all levels of the organisation. Total savings for the first six months of 2013 amounted to $6 million [44].
The above-mentioned implementations at Rio Tinto, BHP Billiton and Diavik are examples of using a combination of Lean Management and Six Sigma methods. Lean tends to focus on day-to-day small improvements, while Six Sigma focuses on large-scale, often months-long optimisation projects that bring leaps in productivity, quality improvements and cost reductions. Six Sigma, despite placing the utmost importance on hard statistical and analytical tools, often reaches for Lean Management tools in implementation projects. Lean itself, on the other hand, fares somewhat less well with highly automated processes. The combination of both concepts often creates a synergy effect [45].
A paper by Castillo et al., published in 2015, presented the results of a study on the impact of Lean Management implementation on labour outcomes in three copper mines in Chile. The study used a survey questionnaire administered to area managers. The survey form asked about changes in the following areas [46]:
- Design effectiveness (disruption, physical work progress, programme reliability, productivity, efficiency);
- Organisational effectiveness (teamwork, participation, communication, commitment and learning).
The study indicated a statistically significant improvement in both design and organisational efficiency in all three mines studied.
In the underground coal mining industry, a good example of the application of Lean was found in the German mines of RAG AG, which are no longer in operation due to depleted resources. Measures to eliminate waste and standardise processes began there in 2000, under the slogan ‘Zero accidents and 100 per cent added value’. Lean processing guidelines for this programme are [47]:
- Creating value from the customers’ point of view;
- Look at the entire value stream;
- Pull principle for processes;
- Synchronised flow;
- Seek perfection.
RAG adapted many existing Lean tools to the mining context and developed its own specific tools for mining processes. Two examples of this transfer were the SMED tools and the PDCA cycle. RAG called these the ‘Boxenstopp’ and the APUC cycle, or Analysis, Planning, Implementation, Controlling (German: Analyse, Planung, Umsetzung, Controlling) [47].
In 2000, RAG started a pilot implementation of Lean in the business processes of one of its mines. The necessary Lean tools (e.g., 5S, Visual Management, Boxenstopp/SMED, Pull system) were successively implemented into the daily practice of the employees. Following the initial successes of the implementation of Lean and its tools, implementations were also launched at the group’s other mines. Subsequently, the implementation was extended to support processes such as machine maintenance and logistics, as well as administration and management processes [48].
RAG has also defined its Lean principles to be applied in process development by employees and management [48]:
- Create customer value, which means stable, efficient processes without waste;
- Look at the whole value stream, not just its elements;
- Pull principle, the customer or the next stage of the process initiates the work in the position before;
- Implement a continuous improvement process.
In RAG production, the most frequently used tools were visual management (VM), SMED and the Pull system. An important aspect was the interaction between production and the other departments. The idea of the seven Lean losses was presented and discussed at many meetings, workshops and training courses. This enabled employees to look at processes from a broader perspective, which helped to identify losses and propose solutions to problems. The search for the seven losses in the processes became part of daily work and part of continuous improvement [48].
While analysing the above examples, it can be seen that mining companies tailor their Lean Management implementation programme to their needs, often using an individual name for their programme [49].
In the article “Study on Coal Lean Mining Theory and Practice”, Z. Liu cited the example of one brigade (in an underground coal mine in China, using the pillar system) where, using the Lean approach, it was possible to reduce the operational time of performing activities by 77 min (16.5%) [50].
In their article, E. M. Ade and V. S. Deshpande described the basic definitions and principles of Lean Management and gave an example of the implementation of an overhead rail to transport miners to the face in one coal mine in India as an example of Lean Thinking [51].
An example of a similar improvement in the spirit of Lean from Poland was given by A. Bator et al. [52], as well as P. Bogacz and M. Migza [49]. In the Mysłowice-Wesoła mine, a belt conveyor used only for transporting people was implemented, which made it possible to significantly increase the availability of workers at the actual work site [53] following [52]. A similar, albeit on a larger scale (a longwall with the longest panel length in the world) implementation took place at LW ‘Bogdanka’ [54]. Another example given by the above-cited authors is the significant increase in the utilisation of machinery and equipment at the Silesia mine, mainly through the implementation of a 24/7 working system, but also through the introduction of planned maintenance and increased flexibility of the workforce—each brigade is universal in terms of qualifications and must be able to, both, mine and perform basic rebuilding [55] after [52]. The aforementioned article points out that the factors that most affect the efficiency of mines are the cycle time of the operations being carried out, the productivity of the machines and the use of human resources, and that all these factors can be optimised by applying Lean methodologies. For this to be successful, as a first step, mine management should develop a training programme to develop awareness of Lean Manufacturing among mine employees [52].
The need for Lean training, but mainly among managers of coal mines, was also indicated by D. Sztajerska and M. Bogdański. According to the authors, without equipping managers (at various levels of the organisation) with knowledge of modern process management concepts, mainly Lean Management and Lean Manufacturing, it will not be possible to improve processes in a mine [56].
The cited article by these authors also describes implemented improvements in the maintenance process of one of the Polish Mining Group S.A mines. One of the implemented solutions was a standard failure card, which is shown in Figure 2. The authors indicate that on the basis of the implemented failure cards, it is planned to perform root cause analysis using, among others, the Ishikawa Diagram and the 5Why tool [56].
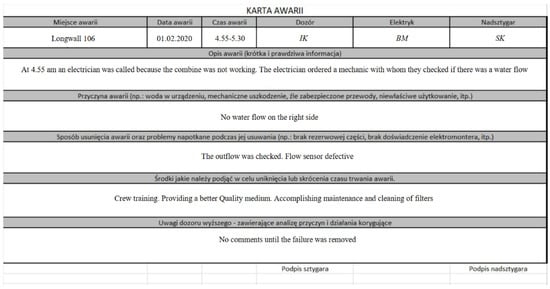
Figure 2.
Completed equipment failure card at a coal mine [56].
The best-documented examples, including the adaptation and implementation of Lean elements in Polish underground mining, refer to the implementation at KGHM Polska Miedź S.A. as part of the project Adaptation and Implementation of Lean Methodology in Copper Mines.
The following areas of the above project have been designated [57]:
- “Lean Mining” area;
- The area Kaizen—Employee Ideas;
- The “TPM” area;
- The area “Process Approach”;
- The area “Modelling and simulation”.
Methods with potential for being applied in the mining industry in the areas identified above are Total Productive Maintenance, 5S, standardisation, Kaizen and PDCA [57]. The implementation of Lean elements at KGHM Polska Miedź S.A. took place in both the mining and processing parts.
The effects of TPM implementation in O/ZWR KGHM Polska Miedź S.A. include [58]:
- Elimination of the tube-and-chain conveyor for the crusher dust extraction system, thereby achieving zero breakdowns and saving 6.0 kW per shift;
- Reduction in downtime by 11%, including the planned downtime by 8% and unplanned downtime by 45%;
- Suction piping improvements—threefold increase in failure-free operation.
Further work utilising the concept and specific Lean Management tools at KGHM Polska Miedź S.A. included value stream mapping of the current and future state for the shift foreman’s workflow (scope: loading, hauling, anchoring and drilling) [59], reduction of administrative documentation maintained by a foreman and a pilot programme to implement the Kaizen concept. An employee idea submission programme was introduced, and some staff were trained in problem-solving methodologies: FMEA and Ishikawa Diagram. The pilot programme resulted in 29 Kaizen ideas [59].
The example of KGHM Polska Miedź proves that the implementation of Lean tools in underground mining is not only possible but can also bring real benefits. The examples cited regarding the application of Lean tools in a copper mine do not show any characteristics that could negate the possibility of application in other underground mines, such as coal mines [4]. Examples of successful Lean implementations in mining show that it is an attractive development path [60].
Rational implementation of Lean Management tools in coal mines can result in significant savings. For this to be possible, an individual approach of implementers and Lean experts is required, i.e., not copying ready-made solutions from other industries, but expert selection (and adaptation) of Lean tools to the conditions of the mine. On the part of mine management, a greater openness to organisational change and a strong commitment to the implementation process itself is required [4].
An analysis of the world literature on the possibilities of implementing Lean in the mining industry, with examples of implementation, can also be found in works [61,62,63].
As indicated in the above analysis, there are examples in the literature of implementing Lean Management elements in the Polish coal mining industry, but unfortunately, they are few and usually concern a limited scope of work. The cited cases of success in implementing Lean in the global coal mining industry, as well as a good example of implementing elements of this method in Polish underground ore mining, suggest that the implementation of Lean could be very beneficial for Polish coal mines. Unfortunately, there is a lack of research indicating which Lean Management tools and techniques could be most useful in this sector.
2.4. Expert Mathematical Study
In order to investigate the suitability of Lean Management tools and techniques in coal mines and thus to confirm the theses and individual examples of Lean implementations cited above, the authors of this article used an expert-mathematical method.
The expert-mathematical method, also known as the method of competent judges [64], remains an effective method for forecasting and scientifically solving complex tasks. Its essence consists of the use of data obtained as a result of a scientifically justified procedure of collecting, systematising and analysing information from experts in a given field [65]. It is a method using, among other things, elements of the Delphi method, group evaluation of experts, analysis of experts’ competence and concordance analysis (concordance of experts’ evaluations by Kendall’s W coefficient).
2.4.1. Lean Management Method and Its Tools
The work began with the design of a research sheet in line with the requirements of the expert-mathematical method. Its most important function was to collect expert assessments of the usefulness of Lean tools and techniques in the conditions of Polish coal mines.
In the next stage, five basic production areas of Polish coal mines were determined (own elaboration based on [66]), for which the usefulness of individual Lean Management tools and techniques was to be determined:
- Accessibility works;
- Preparatory works;
- Exploitation of the deposit;
- Logistics (haulage of excavated material and transport of materials);
- Processing of hard coal.
Twelve widely used tools and techniques of the Lean Management method were then selected:
- 5S;
- TPM—Total Productive Maintenance
- Ishikawa diagram;
- Spaghetti Diagram;
- JIT—Just in time;
- Kanban;
- VSM—Value Stream Mapping;
- Mistake proofing (Poka-yoke);
- Employee Suggestion Programme (Kaizen);
- OPF—One Piece Flow;
- SMED—Single Minute Exchange of Die;
- VM—Visual management.
The spreadsheet prepared by the authors allowed for an assessment of the usefulness of each of the 12 tools in each of the five areas of mine operation on a scale from 0 (no usefulness) to 10 (very high usefulness), for a total of 60 questions.
An additional function of the sheet was the possibility for the experts to self-assess their knowledge regarding each of these five production areas and the Lean Management method, as well as the sources of their knowledge. This structure of the sheet allowed for an analysis of the experts’ competence in each of the five areas and in terms of the Lean method.
The sheet was created in the Google Forms tool and consisted of a foreword and two main parts: an expert self-assessment and an assessment of the usefulness of Lean tools at the mine.
Table 7 shows the structure of the expert self-assessment sheet for the first of the following six sections:
Table 7.
Study on the usefulness of Lean Management tools in the Polish coal mining industry—part 1—experts’ self-assessment.
Section 1—Lean in Accessibility Works;
Section 2—Lean in Preparatory Works;
Section 3—Lean in the Field Operation;
Section 4—Lean in Logistics (Ore Haulage and Material Transport);
Section 5—Lean in Coal Preparation;
Section 6—Knowledge of Lean Management.
Table 8 shows the structure of the Lean tool suitability assessment sheet at the mine for the first of the twelve tools (5S, Total Productive Maintenance, Ishikawa Diagram, Spaghetti Diagram, Just in Time, Kanban, Value Stream Mapping, Mistake proofing—Poka-yoke, Employee Suggestion Program—Kaizen, OPF—One Piece Flow, Single Minute Exchange of Die, Visual Management).
Table 8.
Study on the usefulness of Lean Management tools in the Polish coal mining industry—part 2—assessment of the usefulness of Lean tools (example for 5S tool).
2.4.2. Selection of Experts
The study adopted a multi-step expert qualification system. The first step was the selection of an initial group of experts, who were drawn from practitioners in the mining industry and from a group of academics. For academics, the following qualification criteria were adopted:
- Authorship or co-authorship of scientific papers in the field of broadly defined management in hard coal mining in Poland;
- Possession of at least a doctoral degree;
- For industrial workers, on the other hand, the following criteria were adopted:
- Working in a Polish coal mine;
- Senior management (survey sheets were mainly addressed to mine directors and technical directors of mine operations).
In step two, a competency analysis of the experts who took part in the study was carried out based on a self-assessment and an analysis of the experts’ sources of knowledge. This part asked, among other things, about their knowledge regarding the operation of selected production areas of coal mines and about Lean Management.
Step three was to analyse the concordance of the experts’ ratings. The most commonly used measure for this purpose is the concordance coefficient (Kendall’s W coefficient), proposed by Kendall and Smith [67]. For a concordance analysis to be statistically significant, a certain minimum number of experts is required, depending, among other things, on the number of questions (factors assessed in the study).
The minimum number of experts is calculated from the relationship defined by Formula (1) below [68] after [65]:
where:
- NE—minimum number of experts required;
- fβ (b − 1)—the quantiles of the distribution χ2 corresponding to the confidence level β and the number of degrees of freedom b − 1;
- b—the number of factors assessed;
- γ—assumed accuracy in assessing concordance (Kendall’s W);
- W0—the minimum limit value of the concordance coefficient (Kendall’s W).
The multi-step approach reduces the number of experts whose knowledge is used in the study, which, on the one hand, may result in an insufficient number of experts, but on the other hand, ensures that those who have gone through all three steps of the algorithm have the necessary knowledge and competence.
2.4.3. Assessment of Experts’ Competence
The expert team should be competent and composed of high-calibre specialists with (moderately) compatible views. In addition to objective indicators of competence, such as, for example, the number of scientific publications, academic title held, the number of years worked, or position held. Self-evaluation can be an important element. The practice has shown that an expert’s self-assessment of his or her relative competence in various fields can be relatively well correlated with his or her actual proficiency in those fields [69] after [70].
In the survey sheet prepared according to the method of competent judges, in addition to the main subject of the experts’ assessment, there is also a section on the expert’s self-assessment (on a scale from 0 to 10) [71] and sources of knowledge. This allows for the subsequent elimination of expert judgements that, for example, do not feel competent in a particular part of the subject under study.
Additional verification of the expert’s self-assessment is done by analysing the sources of knowledge held by the expert and determining the competence degree coefficient. The expert’s degree of competence coefficient is calculated from the relationship described by Equation (2) [70,71] et al.:
where:
- Kk—expert competence coefficient;
- Kz—coefficient of knowledge of the problem in question on a point scale multiplied by 0.1, obtained from the self-assessment;
- Ka—the argumentation coefficient obtained by adding up the scores from the master table (shown in Table 9), as indicated by the experts in the analysis of the impact of knowledge sources on the knowledge of the issue.
Table 9. Benchmark table for the determination of the argumentation coefficient [70] i [71].
It is worth noting that practical experience and theoretical analysis are the most important elements when calculating the argumentation coefficient. The level of knowledge of the literature, the state of the issue abroad and, finally, the expert’s own intuition has no influence on the value of the argumentation coefficient. Thus, an expert with a low influence of practical experience and no theoretical research on the issue will obtain the lowest possible argumentation coefficient value. Such a result may not be sufficient to qualify this expert’s knowledge for further research, even they rated their own knowledge of the issue highly. This methodology favours experts with a high impact of theoretical analysis and practical experience.
The higher the value of the competence index is taken as a limit value, the more proficient experts’ knowledge will be used in the study, eliminating the knowledge of less competent persons. As a consequence, however, it is possible to reject people who are, in fact, high-level experts but have assessed their knowledge too harshly. Another consequence may be that the number of experts whose knowledge will be used in the study is too low.
As an example of a limiting competence factor to qualify an expert for a study, some authors give a value of Kk = 0.5 [70]. Others consider this value as “low” and 0.8 as “medium” [65]. In light of the above, Kk = 0.7 appears to be a safe limit value, indicating sufficient competence of the expert taking part in the study.
2.4.4. Assessment of Experts’ Compliance
There are three main sources of disagreement in opinions on a given subject of evaluation. The first is the low competence of the group of evaluators (the competence of the group as a whole rather than of individual members is more relevant here). The second reason for disagreement is related to an improperly organised evaluation process. The third source of disagreement is an ill-defined object of evaluation [72].
The finding of non-conformity in the assessments should result in action being taken to eliminate the causes of non-conformity or, where the causes are not remediable, refraining from formulating an overall assessment [72].
In order to assess the concordance of the experts’ assessments, the results of their assessments should be transformed into the form of rank orderings (preference series).
Spearman’s rank correlation coefficient ρ or Kendall’s rank correlation coefficient τ is used to measure the ordering consistency between two preference series. When comparing more than two rank series, Kendall’s W concordance coefficient is the most commonly used measure for assessing preference congruence [72].
The measurement of concordance is reduced to the construction of the W coefficient, in which the numerator expresses a value reflecting the degree of actual links between the preference series (S) and the denominator, an analogous value calculated for the situation of full concordance of rank orderings, i.e., the maximum possible Smax [72], which is carried out using Formula (3):
where:
- S—the degree of actual linkage between preferential series;
- Smax—the maximum achievable degree of linkage between preferential series;
- Rj—the sum of ranks for the jth object;
- n—the number of assessed objects;
- m—the number of expert assessors.
If the results of the expert assessments produce series with tied ranks, the averaged rank method is necessary to use the concordance coefficient in measuring concordance. The method involves averaging the tied ranks so that they produce a series analogous to the series in the strong order. This transformation results in an ordering whose sum of the ranks is equal to (n (n + 1))/2, i.e., equal to the sum of the analogous series with unrelated ranks [72].
To determine the value of the concordance coefficient for tied ranks, in addition to averaging the ranks, it is also necessary to make an adjustment in the denominator of the concordance coefficient (Smax). For this purpose, for ranks with tied ranks, the value of Ti is calculated according to Formula (4):
where:
- k—the number of groups having the same rank (j = 1, 2, …, k) in the i-th row;
- tj—the number of identical tied ranks in a given group.
When all m series have tied ranks, the value of T is determined from the following Equation (5):
where:
- T—correction for tied ranks occurring in all ranks.
In the case of full concordance between m series, the tied ranks refer to the same objects, so the magnitude of T is multiplied by m. Finally, the concordance coefficient for the case with tied ranks is determined by the following Equation (6):
The Kendall’s W concordance coefficient calculated in this way takes a level on a scale from 0 to 1. The degrees of concordance for the W coefficient are prioritized as follows [71]:
- Sufficient—W∈ <0.20; 0.40>;
- Good—W∈ <0.41; 0.60>;
- Plus good—W∈ <0.60; 0.80>;
- Very good—W∈ <0.81; 0.95>;
- Ideal—W∈ <0.96; 1.00>.
The values obtained should be further checked with an appropriate significance test. Assuming the independence of the experts, we can consider that the occurrence of a particular rank ordering is as likely as any other. On this basis, the distribution S can be identified. For a given m and n, there are n!m all possible rank orderings. For low values of m and n, arrays of the actual probability distribution of obtaining a particular value of a given S have been developed.
For n > 7, a satisfactory approximation of the true S distribution is the chi-square distribution is given. For robust rankings, the value of the χ statisticr2 is calculated from the Equation (7):
For tied ranks, this value is calculated according to the Formula (8):
Testing the statistical significance of the concordance coefficient involves the null hypothesis H0, that the rank series under study are uncorrelated. The null hypothesis is rejected if the value of , calculated according to the above relationship, is equal to or higher than the value of , as read from the chi-square distribution tables for n − 1 degrees of freedom (df) and for the assumed significance level α.
The rejection of the null hypothesis means that the concordance coefficient W determined between the expert assessments is not random and can therefore, be used in further research work.
3. Results
The expert survey described methodologically in Section 2.4 was conducted between 1 March 2021 and 15 April 2021. The sheets were distributed electronically (by email). Each email contained introductory content, a brief description of the purpose and scope of the study, a request to participate in the research survey and a link to the survey form.
The form was anonymous and easy to complete by indicating the answer sets of single-choice questions.
According to the authors, the anonymity of the experts encouraged independent thinking and allowed them to express their opinions freely without fear of criticism. The lack of contact between experts, on the other hand, prevented one expert from influencing another and prevented the study from being dominated by one person or part of the respondents [65].
A group meeting with experts was also not considered due to the restrictions in place at the time due to the prevailing COVID-19 pandemic.
Based on the criteria described in the previous section, a group of 110 experts was selected and sent an email with a link to the form. Among the representatives of science, there were 59 experts representing scientific and research institutions and 51 associated with coal mines operating within the territory of Poland.
A total of 54 responses were received, giving a response rate of 49%. It is worth noting here that, although there are surveys that achieve results above 70% or even 80% [65], in many surveys conducted via the Internet, the rate is much lower. It is even indicated that the average level is 5–7% [65]. The 49% obtained was therefore considered by the authors to be a sufficient result. All answers were complete (the design of the sheet prevented partial answers—all questions were compulsory).
3.1. Results of the Assessment of Experts’ Competence
The survey sheet targeted experts who should be characterised by a wide range of competencies within the coal mining industry, but not every high-calibre expert has a similar level of knowledge of such disparate production areas as preparatory works, mining or processing. In addition, for the expert’s assessments to be useful, he or she should also have relevant knowledge of the Lean Management method. For this reason, the experts were asked to self-assess separately for each of the five main production areas of the coal mines as well as their knowledge of the Lean Management method and to indicate the sources of their knowledge. The value of the competence coefficients for each expert in each area was then calculated. A level of 0.7 was adopted as the level of the competence coefficient, allowing the expert to be considered sufficiently competent. This level of the coefficient was adopted as the minimum limit value qualifying the experts for the study.
For each of the five designated production areas of the mine, experts with the minimum required competence factor value in the area and in the Lean Management method were selected. This made it possible to designate between 14 and 16 experts (depending on the area) whose assessments were used in the remainder of the study. Out of a total of 54 experts who completed the survey form, only 19 met the requirements in at least one production area of the mine and in knowledge of the Lean Management method.
The reason for rejecting as many as 32 forms was insufficient knowledge of the Lean method. In order to competently assess the applicability of Lean Management tools to a mine’s production area, it is essential to have expert knowledge of the method. This points to the need to popularise Lean Management among mining experts, especially in view of the numerous successful applications in other industries.
To check if the number of experts was sufficient, the relationship described by Equation (1) was used, and the minimum number of experts was calculated for the following parameters:
- The number of factors b = 12 (12 Lean tools);
- In line with practice [73], the value of γ was assumed to be 0.01;
- In line with practice [71], a minimum sufficient value for the Kendall concordance coefficient W0 = 0.2;
- Confidence level β = 0.95.
For each of the mine production areas, the minimum number of experts calculated in the above manner is 9, while the number of experts who were qualified as sufficiently competent is between 14 and 16, depending on the mine area. For each area, the minimum number of experts has therefore been reached.
3.2. Results of Expert Concordance
In the next step, a check was made on the level of concordance regarding the qualified experts. In the case under consideration, there are series with related ranks. This is primarily due to the very purpose of the survey. In order to obtain ranks with a strong order, it would have been necessary to ask the experts to rank the individual Lean tools in order from least to the most useful in a given production area of the mine. Such an approach would not have answered the key questions of whether and how useful Lean tools could be in particular production areas of mines. After all, in a ranking of strengths, even a tool that would be indicated as the best among the 12 proposed would not necessarily, according to the expert, be suitable for implementation. Similarly, in the expert’s opinion, when all tools are suitable for implementation in a particular area of the mine, a strong ranking would not convey this information. Further expansion of the survey sheet would be necessary.
In the current form of the spreadsheet, each expert could independently rate the usefulness of each of the 12 tools in each area on a scale from 0 to 10. The resulting tool usefulness ratings can be ranked from least useful to most useful, but the results should be treated as ranks with tied ranks, as more than one tool could receive the same rating from a given expert—and thus be ranked ex aequo in the same place in the ranking. In the present case, this even had to happen, as there are 12 evaluated objects (Lean tools), and the possible scoring has only 11 items (from 0 to 10).
If the results of the experts’ evaluations produce ranks with tied ranks, these should be transformed into averaged ranks, as detailed in Section 2.4.4. The transformation was done for each expert in each area. After the transformation of the ranks, the mutual positions of the individual tools in the ‘ranking’ do not change. However, the sum of the averaged ranks changes and, after the transformation, is equal to the sum of the ranks in the strong ranking (i.e., in the case studied, the sum of consecutive numbers from 1 to 12, i.e., 78). This makes it possible to determine the value of the concordance coefficient, unencumbered by the error resulting from the unequal sum of ranks.
An additional advantage of such a transformation is that it allows a more accurate comparison of expert assessments of different stringency. For example, an expert using only ratings between 0 and 5 in practice may, in fact, rate very similarly to an expert using ratings between 4 and 10 (as long as the lowest, average and highest ratings are for the same tools). Of course, in the final analysis of the usefulness of the tools in question, it is the individual experts’ “absolute” numerical assessment of the usefulness of the tool itself that is most important.
Table 10 shows an example of the averaged ranks (transformed from expert assessments) for assessing the application of Lean tools in accessibility works.
Table 10.
Averaged ranks of ratings given by competent experts to Lean tools for accessing works.
To facilitate interpretation of the table, a colour scale was used, where the colour of each cell represents the value of the averaged rank given by the m-th expert to the n-th tool. The scale has 12 colours (from dark red for the lowest possible averaged rank value of 1, through shades of red, orange, yellow and green to dark green representing the highest possible averaged rank value of 12).
To determine the value of the concordance coefficient for the tied ranks, in addition to averaging the ranks, it is also necessary to make a T correction in the denominator of the concordance coefficient. In the study carried out, all m series for each of the mine areas studied have tied ranks. In this case, the T-value was calculated using Formula (5). The calculations were carried out separately for each study area.
The next step was to calculate the value of Kendall’s W concordance coefficient, using Formula (6), and the value of the mean rank correlation coefficient pav Spearman for each of the mine’s production areas. The results of the above calculations are shown in Table 11.
Table 11.
Kendall’s W coefficients and Spearman’s pav values for the qualified groups of experts in each area.
The value of the calculated concordance coefficient W ranged from 0.41 for the accessibility works to 0.46 for the exploitation of the deposit. Referring to the scale for the W coefficient described in Section 2.4.4, the results obtained show good concordance between the expert assessors for each of the mine areas examined.
On the basis of the obtained values of the concordance coefficient W and Spearman’s rank correlation, it should be considered that the concordance between the experts is sufficient to make generalised judgements and decisions based on them. However, these values should be checked with an appropriate significance test beforehand.
For n > 7 (and, in the case under study, n = 12), a satisfactory approximation of the true S distribution is a chi-square distribution.
Testing the statistical significance of the coefficient of concordance involves posing the null hypothesis (H0) that the rank series under study are not related. In the case under test, the null hypothesis is rejected if the calculated value of for the tied ranks is equal to or higher than the value of , as read from the chi-square distribution tables for n − 1 degrees of freedom (df) and for an assumed significance level α = 0.05.
The calculated χ valuesr2 and the readings from the tables [74] of the χ valuesα2 for the expert assessments studied are given in Table 12.
Table 12.
Calculated χ valuesr2 and table read χ valuesα2.
On the basis of the above data for each of the mine’s production areas, the null hypothesis stating that the series under study are not related to each other must be rejected. It can therefore be assumed that the concordance W coefficients determined between the experts’ assessments are not random—they are therefore statistically significant. The evaluations obtained from the selected, competent experts can therefore be used to formulate generalised evaluations and decisions.
3.3. Empirical Results of the Expert Study
As shown in Section 3.1 and Section 3.2, a sufficient number of competent experts participated in the survey, and their responses should be considered to be in agreement, allowing them to be used in further research.
Table 13 shows the averaged results of the assessments of the usefulness of the various Lean tools in each area of the mine operation.
Table 13.
Averaged results of suitability assessments.
Based on the analysis of the results in Table 13, it can be seen that in all areas, the 5S tool was considered the most useful by the experts. Among the tools whose averaged usefulness was rated above 8 were Total Productive Maintenance and Ishikawa Diagram.
Similarly, the lowest-rated tool was consistently One-Piece Flow, with an average rating of just 3.7 for the usefulness of this tool across the different areas of mining operations. The next lowest-rated tools were SMED and Kanban, although for these tools, the rating was more dependent on the area of mining operations.
In addition to the mean scores, basic statistics were determined for all results (an example of the coal preparation area is shown in Table 14) and presented in the form of empirical columnar distributions (shown in Table 15).
Table 14.
Basic statistics for assessing (on a scale of 0 to 10) the usefulness of applying Lean Management tools in hard coal preparation.
Table 15.
Distributions of empirically obtained expert evaluations (each bar represents the number of evaluations obtained, and the horizontal axis represents the rating on a scale from 0 to 10).
4. Discussion and Conclusions
The literature examples cited in the paper indicating the applicability of individual elements of the Lean Management method in mining conditions are mainly based on the opinions and experience of the authors of the individual publications cited and on individual practical implementations by some mining companies. However, there is certainly a lack of articles presenting the results of empirical studies of this issue, going in the direction of systematising knowledge on the usability as well as the implementation algorithm of individual Lean tools in mining. For this reason, the following article presents the course and results of the author’s expert-mathematical study on the assessment of the usefulness of individual Lean Management tools and techniques in a coal mine. The study made use of the knowledge obtained from selected, competent experts, who showed a high level of agreement in their assessments.
They indicated the highest usefulness of the 5S, Total Productive Maintenance (TPM), and Ishikawa Diagram tools. It is worth noting that the experts highlighted the high utility of these tools in all areas of the mine’s operation, with slightly (a few per cent) lower relative levels compared to providing works. If we consider the methodological guidance of Lean Manufacturing, it should be noted that both 5S and TPM belong to tools used for managing production factors, specifically, space and equipment and machinery, respectively. This points to the greatest utility of such Lean tools, as well as production factors themselves, in the coal mining industry. Directly following the Lean tools used for standardisation and optimisation of production factors, experts identified, in terms of the highest utility, the Ishikawa Diagram. This tool is used for identifying the root causes of problems and is one of the quality tools belonging to the group of problem-solving tools. According to the authors of this publication, this indicates a high need for the application of solutions related to identifying the causes of defects and subsequently eliminating them. This is an evident reference to the third principle of Lean Manufacturing, which is the principle of identifying root causes [23]. It may also be related, although it is not a final conclusion but rather a supposition, to the connection of this tool with the previously mentioned 5S and TPM. Especially in the case of the latter, it seems very likely, considering the approach to error elimination through the identification and elimination of their causes, which takes place in Step 4 and Step 5 of TPM [58].
Analyzing the values of assessments provided by experts regarding the other Lean Manufacturing tools, it is noteworthy that their indicated level of usefulness is significantly lower. It is approximately 25–30% lower in this regard compared to 5S, TPM, and the Ishikawa Diagram. This is symptomatic considering the fact that among these tools are those related to logistics, material flow, and the product stream itself. Significantly lower, by over 40%, is the assessment of the usefulness of SMED, and over 70% lower is the usefulness of OPF. This is surprising, especially in the case of the SMED tool, which, like TPM, relates to the machinery park, although it is focused on changeovers rather than maintenance. This can be explained to some extent by the connection of SMED with maximising flow capacity.
Further interesting insights were provided by basic statistical calculations regarding the usefulness of applying Lean tools. It is worth noting, in this regard, the relatively low values of dispersion characteristics, especially the range, for the highest and lowest-rated tools, as well as the highest levels of these characteristics for tools related to maximising the operational efficiency of product flow, mainly JIT, Kanban, and Poka-Yoke. This indicates a lack of consensus among experts regarding these tools.
The assessments on the usefulness of Lean tools presented in the previous chapter can become a useful guideline for mine managers in the selection of methods to improve mine production.
It is worth noting that, despite the good agreement shown between the experts, for most of the surveyed tools, it is possible to observe a considerable variability in the ratings obtained. In addition, it is important to recognise that the scores obtained are subjective—for one expert, a 7 may mean high usefulness, while for another, it may mean medium usefulness at best. On the basis of the research conducted so far, it is not possible to draw a clear line of demarcation between tools of low usefulness and tools of medium or high usefulness, as this boundary may run slightly differently for each expert.
The next step to consider seems to be the selection of an appropriate inference method in order to determine the tools that should be applied in particular areas of the mine’s operation in order to assist managers in deciding whether to implement a particular tool in a particular area.
Analysing the available methods of inference and decision support, it seems that a method that can be used to solve the above research problem is the method of inference using fuzzy logic rules.
The next planned stage of the research is to determine a theoretical, fuzzy model of the inference system. Then, this model can be fed with the empirical results obtained in the above study to build a model and algorithm for the application and implementation, respectively, of the Lean Management method in coal mines.
Author Contributions
Conceptualisation, M.K., P.B. and M.M.; methodology, M.K., P.B. and M.M.; validation, M.K., P.B. and M.M.; formal analysis, M.K., P.B. and M.M.; investigation, M.K., P.B. and M.M.; resources, M.K., P.B. and M.M.; writing—original draft preparation, M.K., P.B. and M.M.; writing—review and editing, M.K., P.B. and M.M.; visualisation, M.K., P.B. and M.M.; supervision, M.K., P.B. and M.M. All authors have read and agreed to the published version of the manuscript.
Funding
This paper presents the results of research conducted at AGH University of Krakow no. 16.16.100.215.
Data Availability Statement
No new data supporting reported results were created.
Conflicts of Interest
The authors declare no conflict of interest.
References
- Polityka Energetyczna Polski 2040; Ministerstwo Klimatu i Środowiska: Warszawa, Poland, 2021.
- Szuflicki, M.; Malon, A.; Tymiński, M. Bilans Zasobów złóż Kopalin w Polsce wg Stanu na 31 XII 2020 r.; Państwowy Instytut Geologiczny—Państwowy Instytut Badawczy: Warszawa, Poland, 2021.
- Założenia do Aktualizacji Polityki Energetycznej Polski do 2040 r. (PEP2040). In Wzmacnianie Bezpieczeństwa i Niezależności Energetycznej; Ministerstwo Klimatu i Środowiska: Warszawa, Poland, 2022.
- Migza, M.; Bogacz, P. Możliwość wykorzystania narzędzi Lean Management w przedsiębiorstwach sektora górnictwa podziemnego w Polsce. Przegląd Górniczy 2015, 71, 58–61. [Google Scholar]
- Walentynowicz, P. Zakres Zastosowania Lean Management w Przedsiębiorstwach Produkcyjnych—Wyniki Badań Empirycznych, in; Knosala, R., Ed.; Innowacje w zarządzaniu i inżynierii produkcji; Oficyna Wydawnicza Polskiego Towarzystwa Zarządzania Produkcją: Opole, Poland, 2013; pp. 407–418. [Google Scholar]
- Bożek, M.; Handzelewicz, A. Determinanty efektywnego wdrożenia filozofii Lean Maufacturing. Probl. Jakości 2012, 44, 13–20. [Google Scholar]
- Leite, H.D.R.; Vieira, G.E. Lean philosophy and its applications in the service industry: A review of the current knowledge. Production 2015, 25, 529–541. [Google Scholar] [CrossRef]
- Krafcik, J. Triumph of the Lean Production System. Sloan Manag. Rev. 1988, 30, 41–52. [Google Scholar]
- Martyniak, Z. System lean management. Organ. Kier. 1998, 1, 21–29. [Google Scholar]
- Parkes, A. Lean Management. Genesis. Management 2015, 19, 106–121. [Google Scholar] [CrossRef][Green Version]
- Hakim, H. Not just for cars: Lean methodology. Nurs. Manag. 2014, 45, 39–43. [Google Scholar] [CrossRef] [PubMed]
- Kimsey, D.B. Lean Methodology in Health Care. AORN J. 2010, 92, 53–60. [Google Scholar] [CrossRef]
- Cholewicka-Goździk, K. Metoda LEAN—doskonalenie procesów i produktów: Wokół książki Jamesa P. Womack’a i Daniela T. Jones’a. Probl. Jakości 2001, 1, 21–25. [Google Scholar]
- Jóźwiakowski, P. Lean Management—Metoda racjonalnego zarządzania produkcją, Zeszyty Naukowe DWSPiT. Stud. Z Nauk. Tech. 2015, 4, 33–46. [Google Scholar]
- Lipecki, J. Lean management jako metoda restrukturyzacji zarządzania. Ekon. Organ. Przedsiębiorstwa 1998, 8, 12–15. [Google Scholar]
- Womack, J.P.; Jones, D.T.; Roos, D. The Machine That Changed the World: The Story of Lean Production; Rawson Associates: New York, NY, USA, 1990. [Google Scholar]
- Toyota Production System. Toyota Motor Corporation. Available online: https://global.toyota/en/company/vision-and-philosophy/production-system/ (accessed on 19 February 2022).
- Dekier, Ł. Zastosowanie Systemu Sugestii Przedsiębiorstwach Zarządzanych Zgodnie z Metodą Lean Management; Rozprawa doktorska; Uniwersytet Ekonomiczny w Poznaniu: Poznań, Poland, 2017. [Google Scholar]
- Jakonis, A. Kulturowe uwarunkowania Lean management. Przedsiębiorczość I Zarządzanie 2011, 12, 29–55. [Google Scholar]
- Liker, J.K. Droga Toyoty; MT Biznes: Warszawa, Poland, 2005. [Google Scholar]
- Liker, J.K.; Morgan, J.M. The Toyota Way in Services: The Case of Lean Product Development. Acad. Manag. Perspect. 2006, 20, 5–20. [Google Scholar] [CrossRef]
- Lisiński, M.; Ostrowski, B. Lean Management w Restrukturyzacji Przedsiębiorstwa; Wydawnistwo Antykwa: Kraków, Poland, 2006. [Google Scholar]
- Womack, J.P.; Jones, D.T. Lean Thinking; Simon & Schuster: New York, NY, USA, 2003. [Google Scholar]
- Ohno, T. Toyota Production System. In Beyond Large-Scale Production; Productivity Press: New York, NY, USA, 1988. [Google Scholar]
- Marchwinski, C.; Shook, J.; Schroeder, A. Lean Lexicon. 4.0; The Lean Enterprise Institute: Cambridge, MA, USA, 2008. [Google Scholar]
- Kubis, N. Narzędzia Lean Management. Zagadnienia Tech.-Ekon. 2005, 50, 291–303. [Google Scholar]
- Dunstan, K.; Lavin, B.; Sanford, R. The application of lean manufacturing in a mining environment. In Proceedings International Mine Management Conference, Melbourne, Australia, 16–18 October 2006; The Australasian Institute: Melbourne, Australia, 2006; pp. 145–157. [Google Scholar]
- Helman, J. Analysis of the potentials of adapting elements of Lean Methodology to the unstable conditions in the mining industry. AGH J. Min. Geoengin. 2012, 36, 151–157. [Google Scholar]
- Rosienkiewicz, M.; Helman, J. Koncepcja Zastosowania Elementów Systemu Ssącego w Przemyśle Wydobywczym, w; Knosala, R., Ed.; Innowacje w Zarządzaniu i Inżynierii Produkcji; Oficyna Wydawnicza Polskiego Towarzystwa Zarządzania Produkcją: Opole, Poland, 2014; pp. 646–657. [Google Scholar]
- Sukiennik, M.; Bąk, P. Applying Lean Management Solutions in the Context of the Organisational Culture of Energy Sector Enterprises. Inżynieria Miner. 2018, 20, 117–122. [Google Scholar]
- Korski, J. Lean Management w przedsiębiorstwie górniczym. Wiadomości Górnicze 2011, 62, 23–27. [Google Scholar]
- Mikhalchenko, V.; Rubanik, Y. Application of the “lean thinking” concept to the analysis of coal mining region’s sustainable development objective. In E3S Web of Conferences, Proceedings of the First Interregional Conference “Sustainable Development of Eurasian Mining Regions” (SDEMR-2019), Kemerovo, Poland, 25–27 November 2019; EDP Sciences: Les Ulis, France, 2019; Volume 134, p. 03001. [Google Scholar]
- Haugen, S. Lean Mining; Mineralproduksjon: London, UK, 2013; pp. B21–B40. [Google Scholar]
- Wijaya, A.R.; Kumar, R.; Kumar, U. Implementing Lean Principle into Mining Industry—Issues and Challenges. In Proceedings of the 18th International Synposium on Mine Planning and Equipment Selection, Banff, Alberta, Canada, 16–19 November 2009; Volume 16. [Google Scholar]
- Yingling, J.C.; Detty, R.B.; Sottile, J.J. Lean Manufacturing principles and their applicability to the mining industry. Min. Res. Eng. 2000, 9, 215–238. [Google Scholar] [CrossRef]
- Bator, A.; Paluchniak, A. Wykorzystanie metody 5S do poprawy bezpieczeństwa pracy. Przegląd Górniczy 2013, 69, 7–10. [Google Scholar]
- Brodny, J.; Stecuła, K. Analiza Efektywności Wykorzystania Zestawu Maszyn Górniczych, w; Knosala, R., Ed.; Innowacje w Zarządzaniu i Inżynierii Produkcji; Oficyna Wydawnicza Polskiego Towarzystwa Zarządzania Produkcją: Opole, Poland, 2016; pp. 419–421. [Google Scholar]
- Polak, R. Adaptacja kluczowych miar efektywności strategii TPM w warunkach kopalni węgla kamiennego. Zesz. Nauk. Inst. Gospod. Surowcami Miner. I Energią Pol. Akad. Nauk. 2014, 87, 49–68. [Google Scholar]
- Turnbull, G.K. The Alcoa Business System: Pathway to Performance; Alcoa Inc.: Pittsburgh, PA, USA, 2003. [Google Scholar]
- Mottola, L.; Scoble, M.; Lipsett, G. Machine Monitoring and Automation as Enablers of Lean. In Proceedings of the Second International Future Mining Conference, Sydney, NSW, Australia, 22–23 November 2011; pp. 81–86. [Google Scholar]
- Klippel, A.; Petter, C.; Antunes, J. Lean management implementation in mining industries. In Proceedings Dyna Conference 2008; Universidad Nacional de Colombia: Bogota, Columbia, 2008; pp. 81–89. [Google Scholar]
- Rio Tinto. Annual Report. 2010. Available online: http://www.riotinto.com/ (accessed on 21 February 2022).
- Gladstone Sustainable Development Report 2008. Our People, Our Operations, Our Community, Boyne Smelters Limited, Rio Tinto Alcan Yarwun. 2008. Available online: https://www.yumpu.com/en/document/view/52658581/gladstone-sustainable-development-report-2008 (accessed on 11 February 2022).
- Diavik Dialogue Newsletter. Volume 16, 2nd Quarter 2013, Diavik Diamond Mines, Rio Tinto, Yellowknife 2013. Available online: https://www.miningnorth.com/_rsc/site-content/library/diamondmining/2013-10-30_Diavik_Ten_Year_Milestones_PUB_FINAL.pdf (accessed on 10 February 2021).
- Kęsek, M.; Bogacz, P.; Migza, M. The application of Lean Management and Six Sigma tools in global mining enterprises, 2nd International Conference on the Sustainable Energy and Environmental Development. IOP Conf. Ser. Earth Environ. Sci. 2019, 214, 012090. [Google Scholar] [CrossRef]
- Castillo, G.; Alarcon, L.F.; Gonzalez, V.A. Implementing Lean Production in Copper Mining Development Projects: Case Study. J. Constr. Eng. 2015, 141, 05014013. [Google Scholar] [CrossRef]
- Löchte, J.; Langhanki, B. Zero Accidents and 100 Percent Value Added—Utopian Challenging, Aachen International Mining Symposia 2015; RWTH Aachen University: Aachen, Germany, 2015; pp. 27–28. [Google Scholar]
- RAG. Aktiengesellschaft 2016; RAG AG: Aachen, Germany, 2016. [Google Scholar]
- Bogacz, P.; Migza, M. Zastosowanie Lean Six Sigma w doskonaleniu procesów produkcyjnych w przemyśle wydobywczym. Inżynieria Miner. 2016, 17, 23–29. [Google Scholar]
- Liu, Z. Study on Coal Lean Mining Theory and Practice. Adv. Mater. Res. 2013, 605, 538–541. [Google Scholar] [CrossRef]
- Ade Er, M.; Deshpande, V.S. Lean Manufacturing and Productivity Improvement in Coal in Mining Industry. Int. J. Eng. Res. Dev. 2012, 2, 35–43. [Google Scholar]
- Bator, A.; Fuksa, D.; Kęsek, M.; Ślósarz, M. Zarządzanie produkcją odchudzoną - kierunki działań dla poprawy funkcjonowania kopalń. Przegląd Górniczy 2015, 71, 8–10. [Google Scholar]
- Górnictwo: Jazda na Taśmie w Kopalni Mysłowice-Wesoła, Portal Górniczy NETTG.pl. 2015. Available online: https://nettg.pl/gornictwo/128262/gornictwo-jazda-na-tasmie-w-kopalni-myslowice-wesola/set/page/2 (accessed on 13 February 2022).
- Bogacz, P.; Cieślik, Ł.; Osowski, D.; Kochaj, P. Analysis of the scope for reducing the level of energy consumption of crew transport in an underground mining plant using a conveyor belt system mining plant. Energies 2022, 15, 7691. [Google Scholar] [CrossRef]
- Gałązka, W. PG Silesia: System 24/7 Daje Wydajność i Zatrudnienie, Portal Górniczy NETTG.pl. 2014. Available online: https://nettg.pl/gornictwo/121579/pg-silesia-system-24-7-daje-wydajnosc-i-zatrudnienie (accessed on 13 February 2022).
- Sztajerska, D.; Bogdański, M. Improvement of maintenance process in a coal mine—Case study, Zeszyty Naukowe. Organ. Zarządzanie/Politech. Śląska 2021, 150, 279–298. [Google Scholar]
- Sobol-Wojciechowska, J.; Szwancyber, Ł.; Zaremba, L. Implementacja metodologii Lean w warunkach KGHM „Polska Miedź” SA—Poprawa efektywności i innowacyjności przedsiębiorstwa wydobywczego. Wiadomości Górnicze 2013, 64, 399–405. [Google Scholar]
- Konieczny, A.; Kidoń, M.; Kanikuła, T. TPM to kształtowanie postaw, a nie konserwacja maszyn—Dwuletnie doświadczenia O/ZWR KGHM Polska Miedź, Lean Enterprise Institute Polska. 2014. Available online: htttp://www.lean.org.pl (accessed on 13 February 2022).
- Burduk, A.; Chlebus, T.; Helman, J.; Kowalski, A.; Rosienkiewicz, M.; Stefaniak, P. Adaptacja wybranych metod Lean Manufacturing do wybranych warunków przemysłu wydobywczego. Napędy Sterow. 2014, 16, 106–112. [Google Scholar]
- Migza, M.; Bogacz, P. Lean Thinking in Mining Industry. In Problemy Nedropol’Zovaniâ: Meždunarodnyj Forum-Konkurs Molodyh Učenyh: 22–24 Aprelâ 2015; Nacional’nyj Mineral’no-Syr’evoj Universitet «Gornyj»: Sankt-Peterburg, Russia, 2015; p. 214. [Google Scholar]
- Flynn, J.R.; Vlok, J.P. Lean Approaches in Asset Management within the Mining Industry. In Proceedings of the 2014 World Congress on Engineering Asset Management, Pretoria, South Africa, 28–31 October 2014; Springer: Cham, Switzerland, 2015; pp. 101–118. [Google Scholar]
- Lööw, J.; Johansson, J. An overview of Lean Production and its application in mining. In Proceedings of the Aachen International Mining Symposia: Mineral Resources and Mine Development, Aachen, Germany, 27–28 May 2015; RWTH Aachen University, Institute of Mining Engineering: Aachen, Germany, 2015; pp. 121–136. [Google Scholar]
- Seifullina, A.; Er, A.; Nadeem, S.P.; Garza-Reyes, J.A.; Kumar, V. A Lean Implementation Framework for the Mining Industry. IFAC-Pap. 2018, 51, 1149–1154. [Google Scholar] [CrossRef]
- Gorbaniuk, O. Wykorzystanie Procedury Sędziów Kompetentnych w Naukach Społecznych i Możliwość jej Oceny Psychometrycznej za Pomocą Narzędzi Dostepnych w Statistica, StatSoft Polska. Available online: https://media.statsoft.pl/pdf/czytelnia/wykorzystywanie_procedury_sedziow_kompetentnych.pdf (accessed on 10 February 2022).
- Zając, S.; Izdebski, W.; Skudlarski, J. Metoda ekspercko-matematyczna jako narzędzie wspomagające prognozowanie i naukowe rozwiązywanie skomplikowanych zadań, Prace Naukowo-Dydaktyczne PWSZ im. S. Pigonia Krośnie 2015, 331–355. [Google Scholar]
- Turek, M. Podstawy Podziemnej Eksploatacji Pokładów Węgla Kamiennego; Główny Instytut Górnictwa: Katowice, Poland, 2010. [Google Scholar]
- Kendall, M.G.; Smith, B.B. The Problem of m Rankings. Ann. Math. Stat. 1939, 10, 275–287. [Google Scholar] [CrossRef]
- Masiuk, A. Wpływ Profilaktyki Eksploatacyjnej na Efektywność Produkcji mleka, Rozprawa Habilitacyjna; Fundacja Rozwój SGGW: Warszawa, Poland, 1998. [Google Scholar]
- Męczyńska, A. Metoda Heurystyczna—Grupowa Ocena Ekspertów w Zastosowaniu do Analizy Procesów, Produktów, w; Knosala, R., Ed.; Komputerowo zintegrowane zarządzanie; WNT: Warszawa, Poland, 1999. [Google Scholar]
- Grabowska, J. Grupowa ocena ekspertów do identyfikacji czynników kształtujących system informacji logistycznej. Założenia i opis metody, wybór czynników i dobór ekspertów. Zesz. Nauk. Politech. Śląskiej. Ser. Organ. Zarządzanie 2015, 78, 155–165. [Google Scholar]
- Mieszaniec, J. Identyfikacja Kluczowych Składników Potencjału Konkurencyjności Kopalń Węgla Kamiennego. Ph.D. Thesis, Akademia Górniczo-Hutnicza im, Stanisława Staszica w Krakowie, Kraków, Poland, 2002. [Google Scholar]
- Cabała, P. Zastosowanie współczynnika konkordancji w pomiarze zgodności ocen ekspertów. Przegląd Stat. 2010, 2–3, 36–52. [Google Scholar]
- Skudlarski, J. Hierarchia ważności czynników techniczno-organizacyjnych w odniesieniu do efektywności obsługi serwisowej ciągników rolniczych. Acta Sci. Pol. Tech. Agrar. 2005, 4, 49–57. [Google Scholar] [CrossRef]
- Wieczorek, M. Statystyka Lubię to! Zbiór zadań, 1st ed.; SGH: Warsaw, Poland, 2013. [Google Scholar]


Disclaimer/Publisher’s Note: The statements, opinions and data contained in all publications are solely those of the individual author(s) and contributor(s) and not of MDPI and/or the editor(s). MDPI and/or the editor(s) disclaim responsibility for any injury to people or property resulting from any ideas, methods, instructions or products referred to in the content. |
© 2023 by the authors. Licensee MDPI, Basel, Switzerland. This article is an open access article distributed under the terms and conditions of the Creative Commons Attribution (CC BY) license (https://creativecommons.org/licenses/by/4.0/).