Article

Optimal Planning Strategy for Reconfigurable Electric Vehicle Chargers in Car Parks

1
Department of Electrical, Computer and Software Engineering, Faculty of Engineering, The University of Auckland, Auckland 1023, New Zealand
2
Department of Electrical and Electronic Engineering, School of Engineering, Computer and Mathematical Sciences, Faculty of Design and Creative Technologies, Auckland University of Technology, Auckland 1142, New Zealand
*
Authors to whom correspondence should be addressed.
Energies 2023, 16(20), 7204; https://doi.org/10.3390/en16207204
Submission received: 28 September 2023 / Revised: 19 October 2023 / Accepted: 20 October 2023 / Published: 23 October 2023
(This article belongs to the Special Issue Smart Electric Vehicle Charging Approaches for Demand Response)

Abstract

:
A conventional electric vehicle charger (EVC) charges only one EV concurrently. This leads to underutilization whenever the charging power is less than the EVC-rated capacity. Consequently, the cost-effectiveness of conventional EVCs is limited. Reconfigurable EVCs (REVCs) are a new technology that overcomes underutilization by allowing multiple EVs to be charged concurrently. This brings a cost-effective charging solution, especially in large car parks requiring numerous chargers. Therefore, this paper proposes an optimal planning strategy for car parks deploying REVCs. The proposed planning strategy involves three stages. An optimization model is developed for each stage of the proposed planning strategy. The first stage determines the optimal power rating of power modules inside each REVC, and the second stage determines the optimal number and configuration of REVCs, followed by determining the optimal operation plan for EV car parks in the third stage. To demonstrate the effectiveness of the proposed optimal planning strategy, a comprehensive case study is undertaken using realistic car parking scenarios with 400 parking spaces, electricity tariffs, and grid infrastructure costs. Compared to deploying other conventional EVCs, the results convincingly indicate that the proposed optimal planning strategy significantly reduces the total cost of investment and operation while satisfying charging demands.

1. Introduction

The speed of the global transition of the transport industry towards environmental friendliness is critically based on the rate of adoption of EVs [1,2,3]. Therefore, to increase the rate of adoption, more EV chargers (EVCs) are required. Further, with growing EV charging demands, more EVCs are expected to be publicly available [4,5,6]. Careful consideration must be given to various factors to properly plan EVC investments for public charging purposes. These include satisfying charging demands that vary in location and the charging time allowed [7,8,9,10,11,12], minimizing waiting time [13], and peak-load shaving and valley filling to mitigate grid loading impacts [14,15,16,17,18,19,20].
Satisfying public charging demands depends on properly planning the number and location of EVCs [7,8,9,10,11,12,13]. Meeting these demands can ensure the utilization rate of EVCs is high, which improves the cost-effectiveness of investment. However, the average utilization of public level-two and fast chargers is only 25% and 37%, respectively [21]. Numerous EVC planning issues for public charging have been addressed in the literature, including locations and installing appropriate numbers of fast and slow EVCs to meet charging demands with minimum investment costs [7,8,9,10,11,12,13,22]. However, existing works only considered the number of EVCs to be installed without determining the optimal power rating of each EVC. Nevertheless, satisfying charging demands also depends on determining the appropriate power ratings of EVCs. For example, EVCs that are undersized in terms of power rating may be highly utilized but unable to fully satisfy all charging demands. Not being able to satisfy charging demands introduces a risk that EV users may run out of charge, which lowers the attractiveness of owning and using an EV. If EVCs are oversized in terms of power rating, the level of utilization is lowered, and the cost-effectiveness of the investment is reduced. Currently, the average utilization of the rated capacity of EV chargers is only from 35% to 71% [21]. Therefore, EVC planning must be appropriate to ensure EVC investment is cost-effective without compromising on the ability to satisfy charging demands.
Less work exists on the planning of EVCs for large car parks. A planning approach for large car parks to determine the optimal number of fast EVCs and waiting queue size was presented in [23]. In [24], a planning method was developed to optimally plan the number of fast EVCs and EV charge waiting spaces, with the charging demands modeled using queuing theory and the Markov chain. An energy management strategy was presented in [25] to maximize the EV penetration level and revenue in a car park with a transformer capacity limit. In each of the studies reported in [23,24,25], different issues related to EV car parks were addressed. However, the EVCs used in those studies were conventional types that allow for charging only one EV at a time. This leads to underutilization of EVCs whenever the charging power demanded is less than the rated capacity of EVCs. This can occur for several reasons, for example, when the battery state-of-charge (SOC) is high and the charging power demanded from the EVC is low, or when the charging capacity allowed for a particular EV model is less than the power rating of the EVC. Thus, the cost-effectiveness of conventional EVC investments is limited. This can be addressed by raising the flexibility of EVCs, allowing one EVC to serve multiple EVs. An approach to improving the flexibility of EVCs was presented in [26] by using a four-way switch to adjust the connection of the EVC to only one of four connected EVs parked at four different charging spaces. However, this approach does not allow for concurrent charging of several EVs and gives limited improvement. In [27], the authors proposed a method to improve the flexibility of EVCs by allowing an EVC to connect multiple EVs. Thus, the charging schedules of the connecting EVs on an EVC can be controlled. By applying their method, fewer EVCs can be installed, increasing the utilization of EVCs. The authors in [28] designed a charging system to improve the flexibility of EVCs by connecting serval EVCs to serval charging spaces. In their method, the random parking behaviors of EV users at charging spaces can be solved by controlling the power flow from an available EVC to a charging space via the connection cables among the charging spaces and EVCs. However, the methods in [27,28] have some limitations. Firstly, the charging power of EVCs is not flexible, making EVCs less likely to adapt to the charging power requirements of different EV models. In addition, each EVC can only charge one EV at a time, so concurrent charging of multiple EVs is not available. Moreover, the fact that their methods are practically viable is unknown because they did not mention any EVC manufacturing companies that had produced similar products.
To address the shortcomings of the existing methods, conventional EVCs have been specifically adapted to overcome flexibility and utilization issues. EVCs of this type are referred to as reconfigurable EVCs (REVCs).
A REVC comprises internal PMs that can be dynamically allocated to realize different levels of output power at multiple outlets [29]. Several outlets can be coupled to a power cabinet housing the PMs, with a control unit used to connect and disconnect PMs in a power cabinet between outlets. This flexibility allows for better use of charging resources. For example, if an EV needs only a portion of the power rating of a REVC, idle PMs can be used for charging other EVs concurrently, which cannot be achieved by conventional EVCs. Further, since the PMs of a REVC are self-contained, they are easily installed and removed. Moreover, the wide power range makes a REVC suited to a wide range of charging powers. These are significant benefits, and numerous manufacturers have developed REVC products with similar functionality [30,31,32,33,34,35,36,37,38]. REVCs have been utilized in public areas, and some customers have provided positive feedback on using REVCs in terms of flexibility [39]. A comparison of REVCs and conventional slow and fast EVCs is shown in Table 1.
There are two types of REVCs on the market. One is the integrated-type REVCs, where each REVC has multiple identical PMs inside, as illustrated in Figure 1a. Generally, the number of EVs that can be charged concurrently by an integrated-type REVC depends on the number of PMs inside and the number of charging cables connected to a REVC. A disadvantage of the integrated-type REVCs is the need for long charging cables to reach charging spaces distant from the REVCs. For example, the lower-level charging spaces in Figure 1a are distant from the REVCs in the upper charging spaces. This need for long cables is an inconvenience and safety issue that practically limits the number of charging cables fitted to an integrated-type REVC to two or three. Consequently, the number of charging spaces served by an integrated-type REVC is limited.
The other type of REVC is the split-type, shown in Figure 1b, which has a power cabinet and separate charging posts (CPs). For split-type REVCs, power outlets are CPs connected to a REVC. The CPs are distributed at each charging space and connected to a power cabinet via unobtrusive underground cables (dashed lines in the figure). Charging cables of a convenient length connect to the CPs and are used to plug into the EVs. The use of underground cables and charging posts allows charging spaces to be served that are distant from the power cabinet, such as lower-level charging spaces. The PMs within the split and integrated-type REVCs are controlled and reconfigured as necessary to deliver the required power levels to different EVs.
The planning of REVCs has not previously been reported, despite key differences with conventional EVCs that mean higher levels of flexibility and utilization can potentially be realized. The key differences include the ability to charge multiple EVs concurrently and to change the power allocated to each connected EV dynamically. Especially for split-type REVCs, each one can connect many CPs, which introduces the numerous combinations of REVC numbers and corresponding CP numbers for planning in large car parks. Therefore, it is critical to have an optimal planning strategy to obtain the optimal plan for deploying REVCs in large car parks. An optimal planning strategy that incorporates these key differences and is suited to the planning of REVCs for small or large car parks is needed to realize the full potential of REVC technology. Accordingly, an optimal planning strategy for REVCs is presented in this paper. Compared with existing research, the key contributions of this paper are summarized as follows:
  • The proposed optimal planning strategy can be applied as a planning tool for car parks deploying REVCs under various scenarios.
  • The proposed optimal planning strategy can be applied as an operation controller for REVCs to allocate charging powers and spaces for individual EVs.
  • The proposed optimal planning strategy can not only determine the size (number of REVCs) of EV car parks but also determine the optimal power rating for PMs and each REVC.
  • A grouping method is proposed to aggregate EV charging demands for scenarios with a large number of EVs.
The remainder of the paper is organized as follows: The overall framework for the proposed optimal planning strategy is illustrated in Section 2. In Section 3, the modeling for determining the power rating of power modules is described. The optimization model for determining the number and configuration of REVCs is formulated in Section 4. In Section 5, the optimization model to determine the operation plan of REVCs is formulated. In Section 6, a comprehensive case study is undertaken to illustrate the effectiveness of the optimal planning strategy under various conditions and to show the benefits of using REVCs compared to conventional EVCs. Finally, conclusions are given in Section 7.

2. Overall Framework for Optimal Planning Strategy

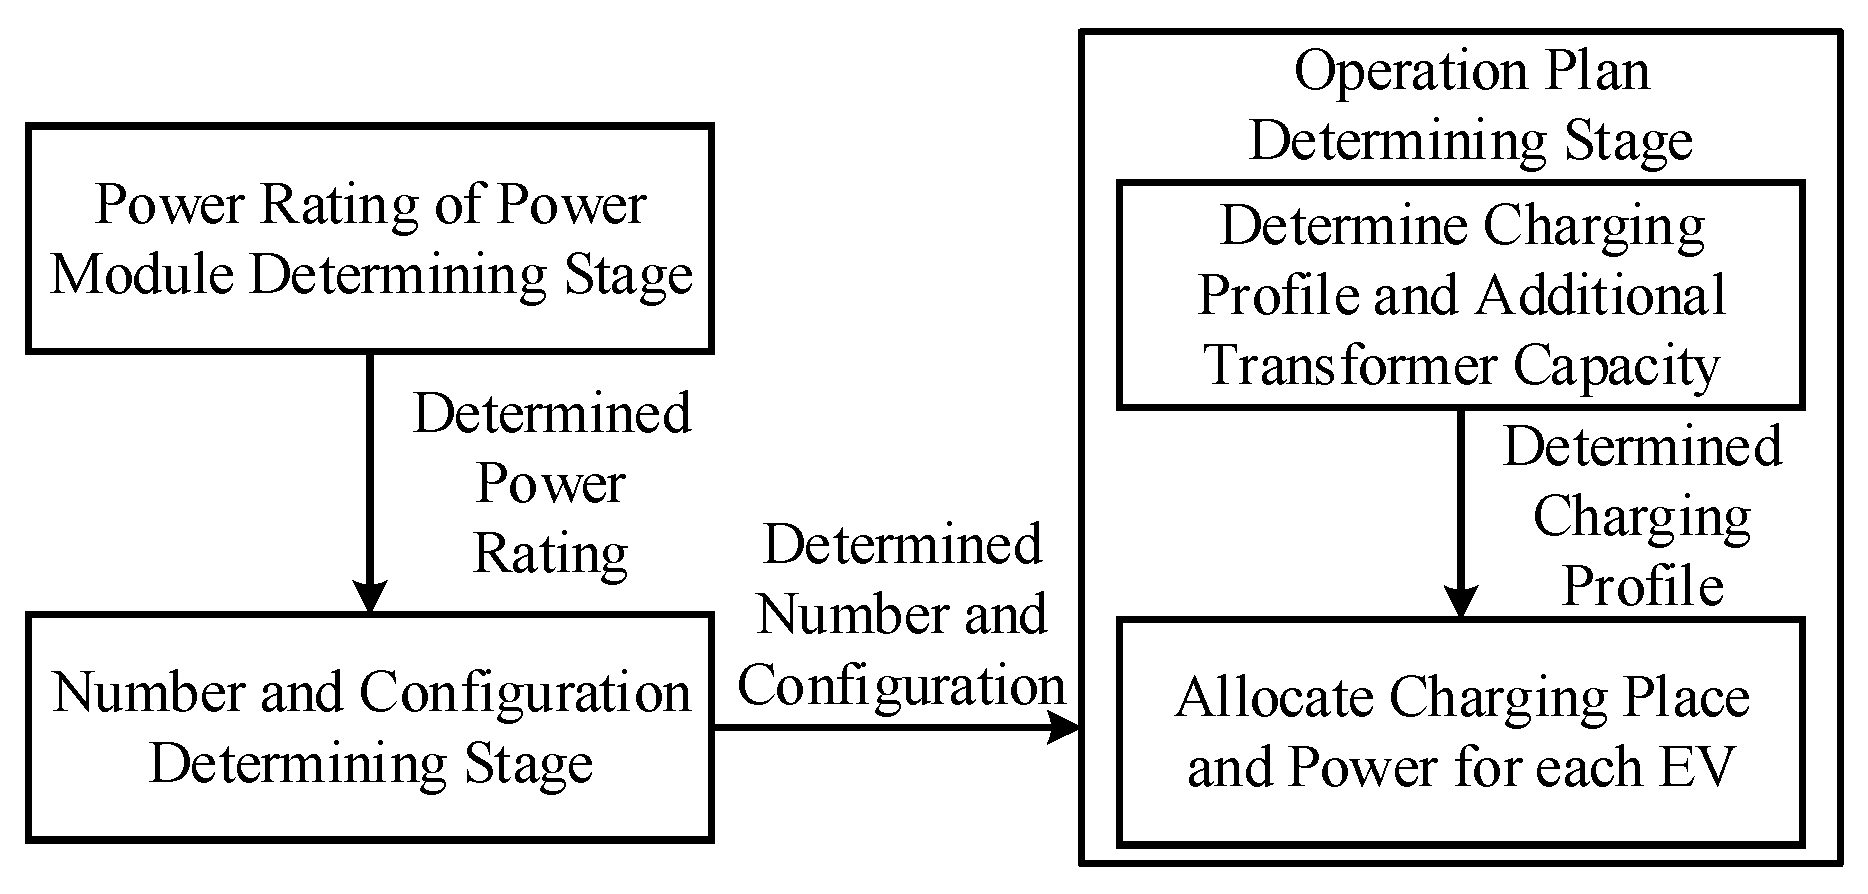
In this section, the overall framework of the proposed three-stage optimal planning strategy is introduced. To provide an integrated plan, each stage of the proposed strategy should be closely related. The outputs of the previous stage are applied as parameters to the next stage. The first stage is to determine the optimal power rating of PMs. In this stage, the degree of utilization of PMs is modeled. Therefore, the objective is to determine the optimal power rating of PMs with a maximized degree of utilization. After the optimal power rating of PMs is determined, this optimal power rating is used as a parameter for the second stage. The second stage is to determine the optimal number and configuration of REVCs, including determining the number of REVCs, the number of PMs in each REVC, and the number of CPs connected to each REVC. Then, in the third stage, the optimal operation plan can be determined based on the EV charging demands, which include the charging profile for the whole car park, the additional transformer capacity to be upgraded, and allocations of charging space and charging power for individual EVs. The determined number and configuration of REVC in the second stage and the collected charging demands are applied as parameters and constraints for the third stage to allocate the optimal charging space and charging power for each EV. To obtain EV charging demands, government travel reports or data mining methods can be utilized [40,41]. Once the data on EV charging demand is obtained, advanced forecasting strategies can be applied to predict future EV charging behaviors [42,43]. The forecasting of the data is out of the scope of this paper, and please refer to the references for detailed explanations. Detailed explanations of the proposed strategy and modeling are demonstrated in the following sections. The overall framework of the proposed optimal planning strategy is displayed in Figure 2.

3. Model for Determining the Power Rating of Power Modules

Because a REVC is made up of multiple identical PMs, and PMs are key components of a REVC, determining the optimal power rating of PMs is essential. The objective is to select the optimal power rating of PMs to achieve the highest degree of utilization. For example, in Figure 3, an EV with a low battery SOC allows for charging at a 50 kW rate. If the EVCS comprises five 10 kW PMs, all PMs will be fully utilized. If the EVCS comprises four 15 kW PMs or three 20 kW PMs, underutilization will occur on the last PM. From this example, it is apparent that the highest degree of utilization is achieved with 10 kW PMs. In addition, the degree of utilization also depends on the charging power of an EV.
When an individual EV is applying a REVC, mathematically, the number of working PMs is expressed as:
N individual = ceil ( P x EV P u PM ) ,
where the charging rate of this EV is at P x EV , and the power rating of PMs is P u PM . Consequently, for this EV, the degree of utilization for the last PM is:
UD individual = 1 [ N individual P x EV P u PM ] .
The degree of utilization can be generalized to a scenario with several different EV types with diverse charging rates:
UD all = x = 1 x = X w x · UD individual
where X is the number of EV types, and wx is the weighting factor of each EV type.
Therefore, the objective is to choose the optimal power rating of PMs when the degree of utilization is maximized, which can be expressed as:
P ˙ u PM = arg max P u PM UD all ( P u PM ) .

4. Model for Determining the Number and Configuration of REVCs

After determining the optimal power rating of PMs, the optimal number and configuration of RVECs can be determined. The number and configuration of REVCs are determined by the parking behaviors of EV users. However, parking behavior is uncertain. Therefore, some typical scenarios with different parking behaviors are considered to represent uncertainty. Consequently, for determining the number and configuration under uncertainty, an optimization model is formed as a robust optimization problem. The purpose is to calculate an optimal solution when the worst-case scenario occurs within a number of scenarios “δ”. From the EV car park operator’s perspective, at this stage, the objective includes minimizing the equivalent annual investment cost of REVCs and the degree of dissatisfaction due to losing some EV customers, as expressed in (5). The degree of dissatisfaction is described by the time at which EV users look for charging spaces at other EV car parks. The constraints account for the technical specifications of REVC and the number of parking spaces, as formulated in (9)–(16). Thus, the optimization model is formulated as follows:
min a max δ Δ CRF · [ cost inv ( a , δ ) + cost time ( a , δ ) ] ,
where:
CRF = d ( 1 + d ) m ( 1 + d ) m 1 ,
cost inv ( a , δ ) = ( N PM ( δ ) · P ˙ u PM · cost PM kW + N CP ( δ ) · cost CP + N CP ( δ ) · cost cable + cost other ) · N ( δ ) ,
cost time ( a , δ ) = N loss ( δ ) · cost time perEV ,
subject to:
P REVC min N PM ( δ ) · P ˙ u PM P REVC max ,
n CP min N CP ( δ ) n CP max ,
N pt EV ( δ ) = N CP ( δ ) · N ( δ ) + N loss ( δ ) ,
N CP ( δ ) · N ( δ ) + N loss ( δ ) S ,
N PM ( δ )   { Z + } ,
N CP ( δ )   { Z + } ,
N ( δ )   { Z + } ,
N loss ( δ )   { Z 0 + } .
The objective function and constraints are further explained as follows.

4.1. Objective Function

The objective function is to minimize the equivalent annual investment cost of REVCs and the time cost (dissatisfaction degree) of some EV customers, which is expressed in (5). Decision variables are the number of power modules for a REVC ( N PM ( δ ) ), number of charging posts for a REVC ( N CP ( δ ) ), number of REVCs to be installed ( N ( δ ) ), and number of lost EVs ( N loss ( δ ) ). In (6), d is the discount rate, m is the life cycle of the project, and CRF is the capital recovery factor of the costs. The capital recovery factor represents the conversion relationship from the present value to equivalent annual costs in years. Equation (7) defines the investment costs of deploying the split-type REVCs, including PMs, CPs, underground and charging cables, and other expenses. If the integrated-type REVCs are deployed, the second term can be removed from (7). The time cost (dissatisfaction degree) is defined in (8), which indicates the inconvenience of the user experience due to losing some EV customers. The time cost (dissatisfaction degree) is calculated by the product of the number of lost EVs and the cost of losing an EV. Because the number of charging EVs changes on different days of the year, it is necessary to determine the optimal number of REVCs to guarantee that most EVs have charging spaces. However, if too many REVCs are installed to satisfy all the charging EVs on peak days, the cost-effectiveness of the REVCs will be reduced. The reason is that many charging spaces will be idle on off-peak days due to too many REVCs. Therefore, the purpose of having the time cost (dissatisfaction degree) in the objective function is to save investment costs by not installing too many REVCs but accommodating most EVs.

4.2. Constraints

REVC must follow the technical specifications of the manufacturers. These technical specifications include the power rating of each REVC and the number of CPs allowed for each split-type REVC. These constraints are expressed in (9) and (10). For certain places, such as workplaces, commercial areas, and residential areas, EV users normally park their EVs in parking spaces for longer durations. EV users may set up their charging demands and connect charging cables on arrival. Therefore, to accommodate peak-time charging, the sum of the total number of CPs to be installed ( N CP ( δ ) · N ( δ ) ) with the number of lost EVs should be equal to the number of charging EVs during peak time ( N pt EV ( δ ) ), defined in (11). In addition, the total number of CPs with the number of losing EVs should not be greater than the total number of parking spaces (S) in a car park, as defined in (12). The product of the number of CPs connected to each REVC ( N CP ( δ ) ) and the number of REVC ( N ( δ ) ) defines the total number of parking spaces offering charging (charging spaces). All the variables in this optimization model are integers, as shown in (13)–(16).

5. Model for Determining the Operation Plan

After the optimal number and configuration of REVCs are determined, the operation plan can be determined. The operation plan is also an important factor to be determined when planning EV charging infrastructure. This is because the operation cost is a large proportion of the total cost. In most of the studies, the operation cost of EV charging is defined by the charging schedule of each EV [26,27,28]. To determine the charging schedule of each EV, a group of decision variables is applied to control how much power is delivered to each EV during each time slot. However, this is not suitable for planning scenarios with a large number of EVs because it is impractical and inefficient for the power distribution network (PDN) operator to control individual EVs directly. Therefore, to accommodate the large-scale EV charging scenarios, a hierarchical method is proposed to determine the operation plan, as displayed in Figure 4. Before EVs arrive at the EV car park, the EV users set up their charging demands via the mobile app. Some mobile apps have been commercialized for public EV charging [44,45,46]. Next, the charging demands are sent to the communication and control center (CCC) of the EV car park. Then, the CCC aggregates individual charging demands and sends the aggregated charging demand to the PDN operator on behalf of the EV car park. After the PDN operator receives the power request from the EV car park, the PDN operator dispatches power to the EV car park. The EV car park obtains the daily charging profile based on the dispatched power. Afterwards, based on the charging profile, the CCC calculates the optimal operation plan for each EV and sends the allocation information for charging spaces to each EV via the mobile app. Finally, each EV goes to the allocated charging space and gets charged. This method fits the large-scale EV charging infrastructure planning problems and day-ahead scheduling of EV charging problems since the EV charging demands are normally forecasted beforehand.
To apply the proposed hierarchical method, there are two sub-stages to determine the optimal operation plan, as shown in Figure 2. In the first sub-stage, the individual EV charging demands are aggregated. Then, the aggregated charging demand is used to determine the optimal charging profile and additional transformer capacity to be upgraded. Afterwards, in the second sub-stage, the determined charging profile and additional transformer capacity are applied as constraints to determine the allocation of charging spaces and powers for individual EVs.

5.1. Determining the Charging Profile and Additional Transformer Capacity to Be Upgraded

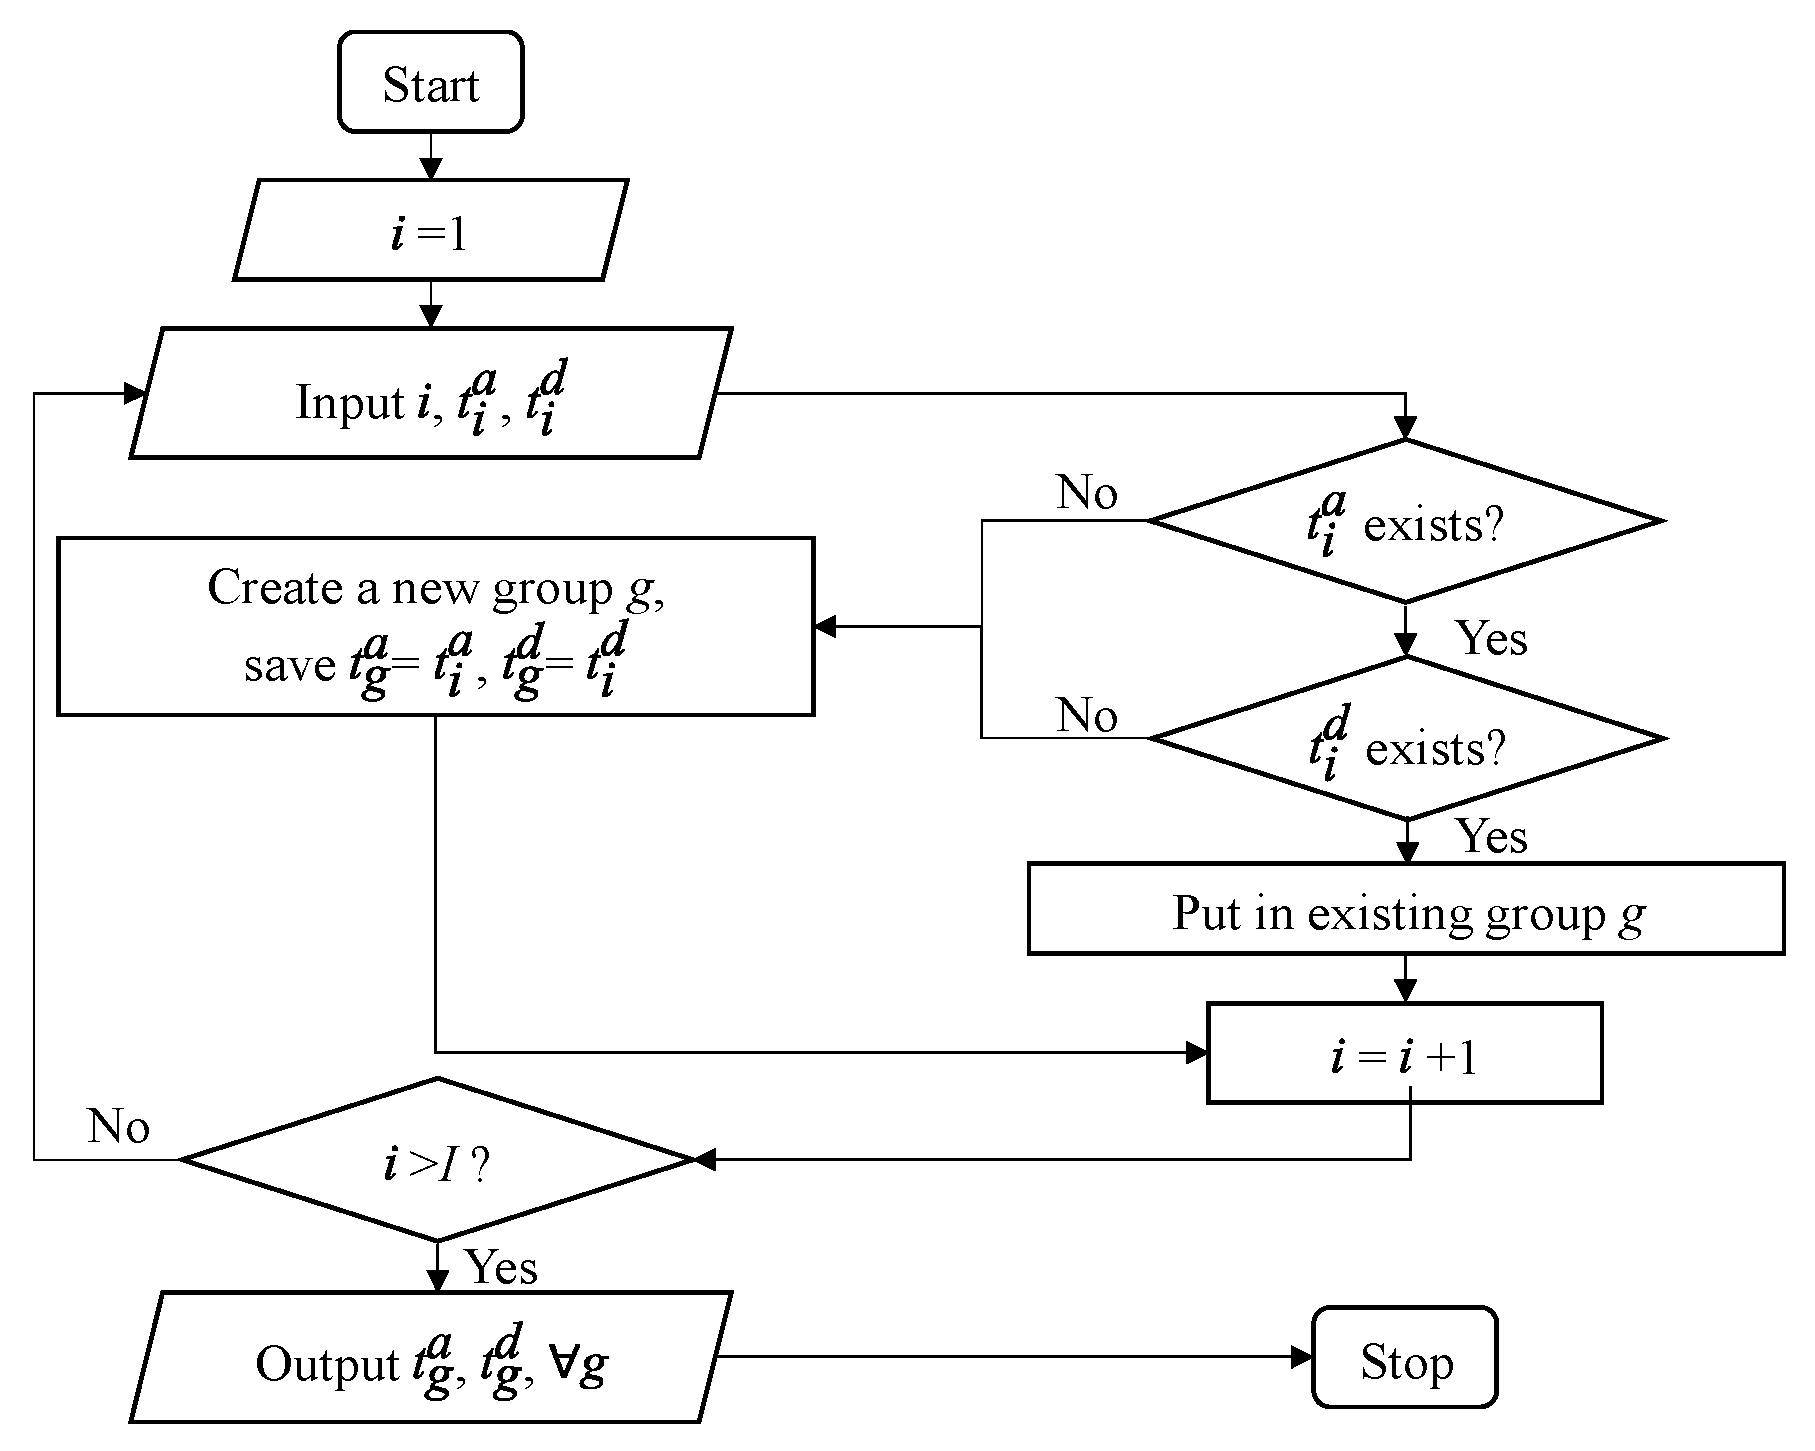
In this sub-stage, individual EV charging demands are aggregated, and EVs are classified into different groups depending on their arrival and departure times, as demonstrated in Figure 5. Different colors are applied to represent different arrival and departure times of EVs. For example, in Figure 6, EV1, EV2, and EV5 arrive and depart during the same time slot, as highlighted in blue; therefore, they are grouped into the same set. EV3 and EV4 arrive and depart during the same time slot, as highlighted in orange; therefore, they are grouped into the same set.
For a group of EVs ( g     G ) under scenario δ , to satisfy the energy demand, the total energy supplied from the grid should not be less than the total energy demands, as expressed in (17). To protect the EV batteries, (18) defines the sum of the total charged energy and energy at arrival for each group to be not more than the group battery capacity.
t = t g a t = t g d P g , t tot δ · Δ t · η gi GI ( SOC gi d SOC gi a ) · BC gi , g     G ,
gi GI SOC gi a · BC gi + t = t g a t = t g d P g , t tot δ · Δ t · η gi GI BC gi ,   g     G ,
where P g , t tot δ is the total charging power of a group in a time slot t; Δ t is the duration of a time slot; η is the charging efficiency; SOC gi d is the desired SOC; SOC gi a is the SOC at arrival; and BC i is the battery capacity for an EV. Apart from utilizing the SOCs of an EV, the energy level during a time slot of an EV can be utilized to represent the charging process as well. In this study, to simplify the representation of the model, SOCs of EVs are applied to the model.
The total charging power for each group should not be smaller than zero, as expressed by (19). During each time slot ( t     T ), which is taken as 15 min in this paper, the sum of the total charging power in all the groups cannot exceed the sum of the maximum allowed charging power of all EVs, as expressed by (20).
P g , t tot δ     0 ,   t     T ,   g     G ,
g G P g , t tot δ i I P i max , t     T ,
where P i max is the maximum allowed charging power for an EV i .
To protect the transformer of the PDN, during each time slot, the total charging power of all EV groups must not exceed the difference between the upgraded transformer capacity and the baseload ( L t base ). The upgraded transformer capacity is defined by adding the existing transformer capacity ( C ex ) with additional transformer capacity to be upgraded ( C transformer δ ) to accommodate EV charging demands, as formulated in (21) and (22). Therefore, the peak demand ( P demand peak ( δ ) ) is not larger than the upgraded transformer capacity but not smaller than the addition of charging power for all EV groups and the baseload, as expressed by (23).
g G P g , t tot δ ( C ex + C transformer δ ) · PF L t base ,   t T ,
C transformer δ 0 ,
C ex + C transformer δ P demand peak ( δ ) g G P g , t tot δ + L t base ,   t     T ,
where PF is the power factor of the transformer.
From the EV car park operators’ perspective, the objective is to minimize the expected operational cost in all the scenarios. The corresponding optimization model is formulated as a linear programming problem below.
min b E δ cost operation b , δ = min b δ Δ w δ · cost operation b , δ ,
where:
cost operation b , δ = CRF · C transformer δ · cos t transformer kVA , + 365 · g = 1 G t = 1 T P g , t tot δ · ET t · Δ t + 12 · P demand peak ( δ ) · cost demand kW ,
subject to (17)–(23).
The charging demands of EVs are uncertain. Therefore, some typical scenarios are taken to represent the uncertainty of the charging demands. These typical scenarios have a different probability ( w δ ). Consequently, to comprehensively consider these scenarios, the expected value of the annual operation cost of all the scenarios with different probabilities is calculated. Thus, the objective function in this sub-stage is to minimize the expected value of the annual operation cost, as expressed by (24). The annual operation cost incorporates three parts: the first term is the upgrade cost of the transformer; the second term is the EV charging cost; and the third term is the cost of demand charge, as expressed by (25). The decision variables are the transformer capacity to be upgraded ( C transformer δ ), total charging power of each group in each time slot ( P g , t tot δ ), and the peak demand ( P demand peak ( δ ) ). The upgrade cost of the transformer is the cost that the EV car park operator spends to upgrade the additional capacity of the transformer to accommodate EV charging demands. The EV charging cost is based on the EV car park operator purchasing electricity from the utility company. The electricity tariff ETt is set up by the utility company. The demand charge is a monthly fee to maintain the amount of grid capacity needed to deliver enough power to a large energy user. It depends on the peak power that a large energy user puts on the grid.

5.2. Allocation of Charging Spaces and Powers for EVs

In this sub-stage, the charging spaces and powers can be allocated to individual EVs based on the EV charging demands, the determined number and configuration of REVCs, and the determined charging profile.
To satisfy the energy demand, the total energy supplied from the grid for each EV ( i   I ) should not be less than the energy required by each EV, as expressed by (26). To protect the battery of each EV, (27) defines the sum of the charged energy and energy at arrival for each EV as not more than the battery capacity of each EV.
t = t i a t = t i d n N P i , n , t δ · Δ t · η ( SOC i d SOC i a ) · BC i , i   I ,
t = t i a t = t i d n N P i , n , t δ · Δ t · η + SOC i a · BC i BC i , i   I ,
where t i a and t i d are the arrival time and departure time of an EV, respectively; SOC i a and SOC i d are the arrival and departure SOC of an EV, respectively; BCi is the battery capacity of an EV.
The charging power of each EV ( P i , n , t δ ), during each time slot, should not be smaller than zero or greater than the maximum charging power allowed by each EV, as expressed by (28).
0   P i , n , t δ S i , n , t δ · P i max δ ,   i   I ,   n   N ,   t     T ,
where S i , n , t δ is a set of binary variables defining the connection between an EV i and a REVC n N , as shown in (29).
S i , n , t δ 0 , 1 .
The summation of the individual EV charging power during each time slot should not be greater than the total charging power for the whole EV car park, as expressed in (30).
i I n N t T P i , n , t δ P t tot δ ,   t T ,
To avoid situations where the sum of the charging power of EVs exceeds the determined charging profile, a new set of variables P t add δ is applied to indicate that the CCC makes additional power requests to the PDN operator. In (31), the additional power request during each time slot should be greater or equal to zero because the power is dispatched from the PDN.
P t add δ 0 , t     T ,
Thus, the total charging power for the whole EV car park is the sum of the determined charging profile and the additional power requests, as expressed in (32).
P t tot δ = g G P g , t tot δ + P t add δ , t     T ,
In (33), for each REVC, during each time slot, the total charging power provided by a REVC cannot exceed its power rating ( N PM ( δ ) · P ˙ u PM ).
i I P i , n , t δ N PM ( δ ) · P ˙ u PM , n N , t     T ,
where P ˙ u PM is determined in Section 3, and N PM ( δ ) is determined in Section 4.
Since the configuration of the REVCs is determined in Section 4, for each REVC, the number of connected EVs during each time slot cannot be more than the number of CPs linked to each REVC, as expressed by (34).
i I S i , n , t δ N CP , n N , t     T ,
An EV is only allowed to connect one REVC during the time it stays in the car park, as formulated in (35). In (36), an EV is not connected to any REVCs before it arrives or after it leaves the car park.
n N S i , n , t δ = 1 ,   i   I , t     t i a , t i d ,
n N S i , n , t δ = 0 , i I , t     1 , t i a 1 t i d + 1 , T ,
The primary purpose of this sub-stage is to ensure that the sum of the power allocated to EVs is close to the charging profile determined in the previous sub-stage. Therefore, the objective is to minimize the difference between the total charging power for the whole EV car park and the summation of the charging power of individual EVs in each time slot. Thus, the optimization model for allocating charging spaces and powers is formulated below as a mixed-integer linear programming problem.
min P i , n , t δ P t tot δ i I n N t T P i , n , t δ ,
subject to (26)–(36).

6. Case Study

6.1. Case Overview and Parameter Settings

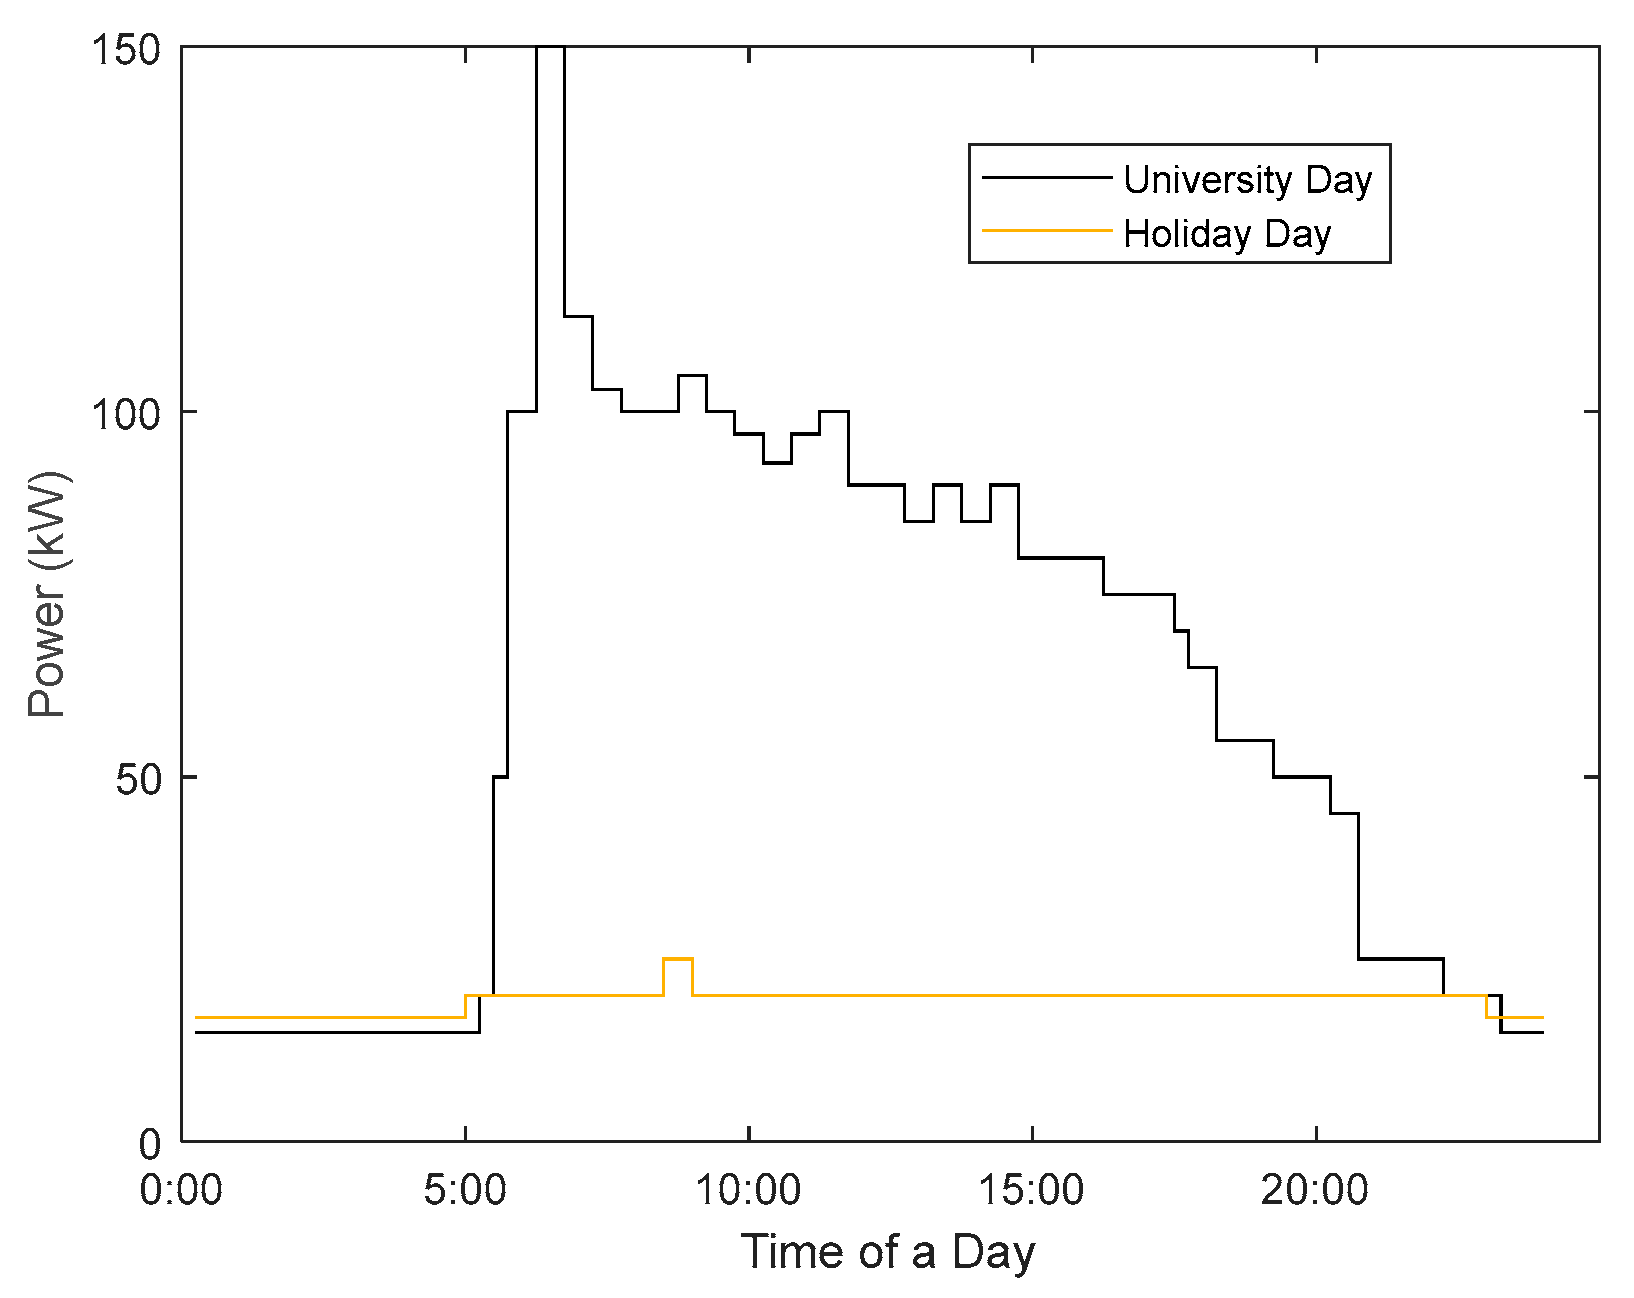
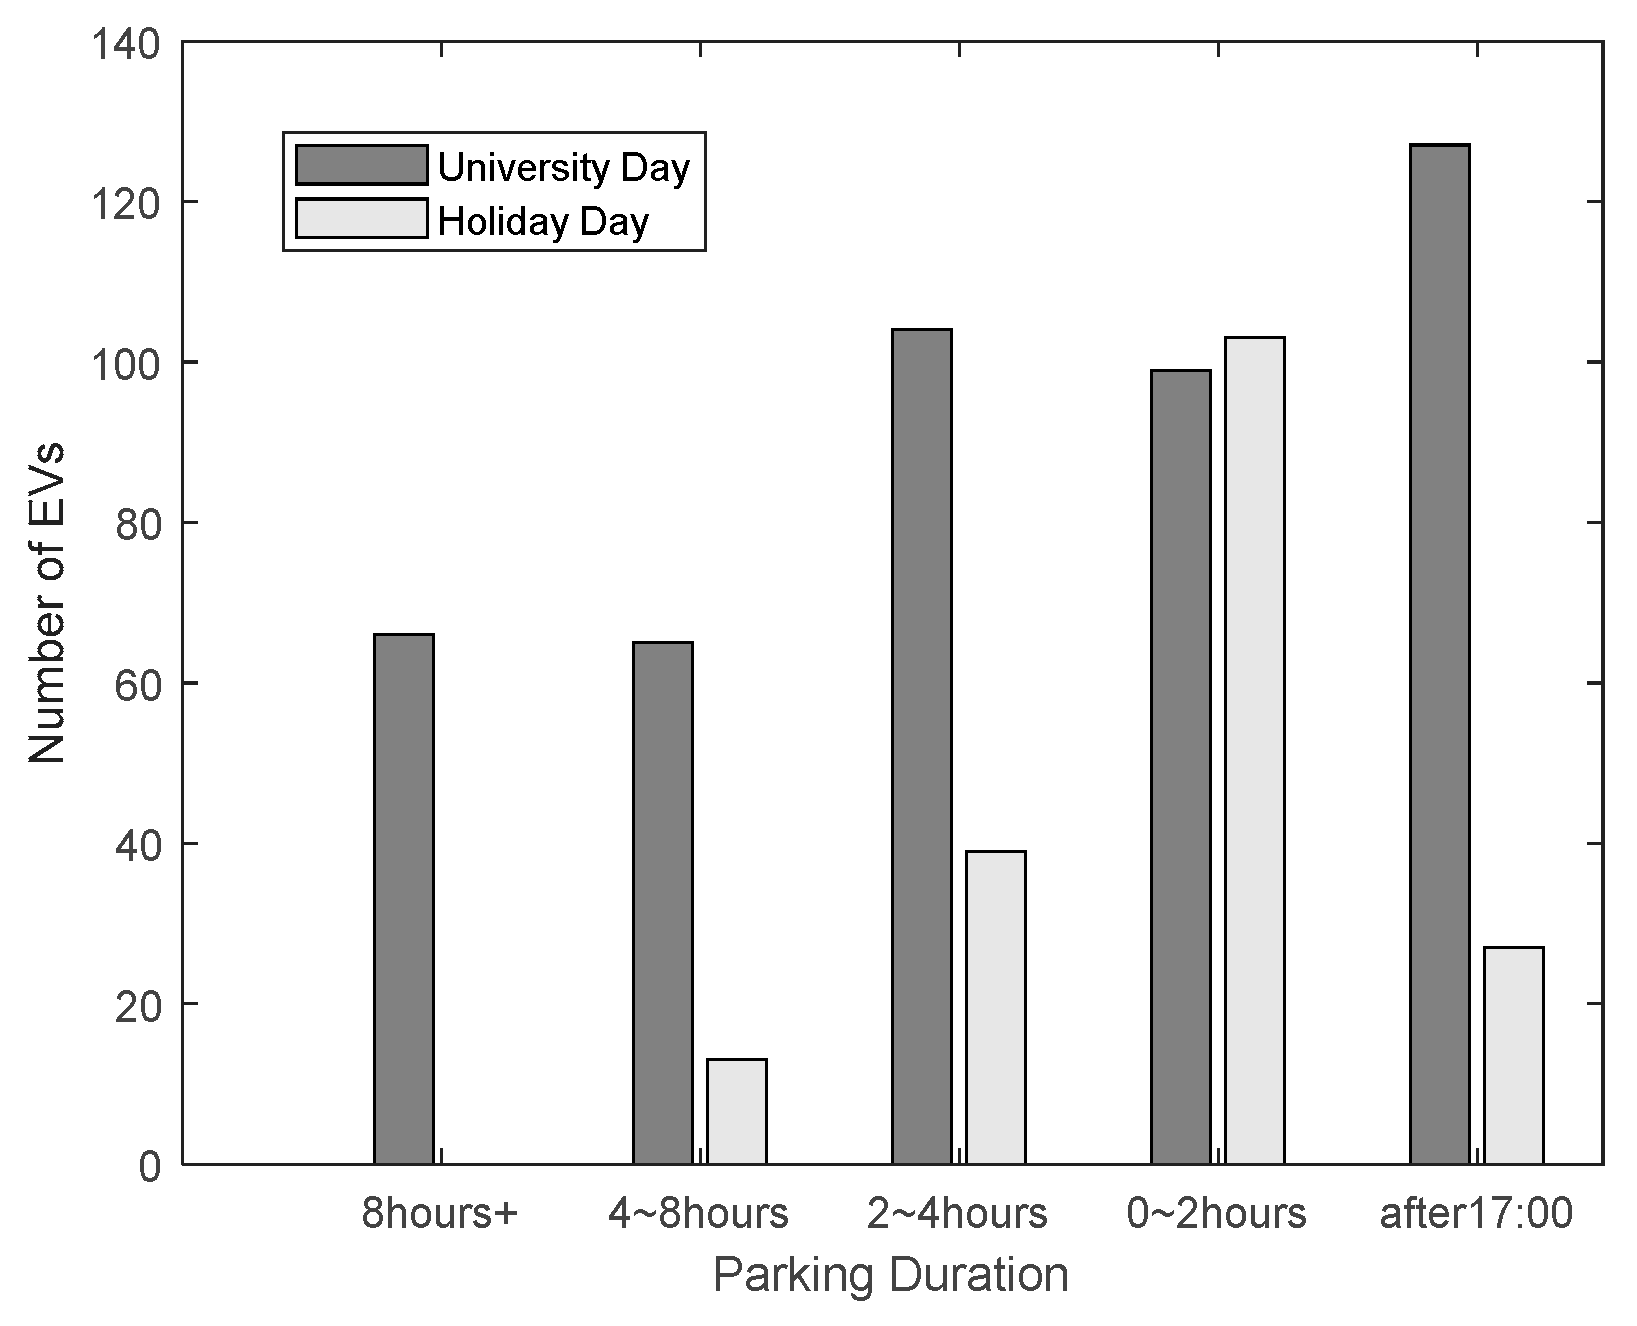
The proposed optimal planning strategy is applied to an existing car park with 400 parking spaces on the south campus of Auckland University of Technology, New Zealand. The existing transformer capacity, Cex, is 750 kVA. In this case study (University), there are four typical types of days based on the weather conditions in Auckland city. According to the annual calendar of the University, the probabilities of the occurrence of these types of days are 0.26 (University days in summer), 0.31 (University days in winter), 0.33 (holiday days in summer), and 0.10 (holiday days in winter) [47]. The existing baseload of the campus is illustrated in Figure 7. There are a total of 461 vehicles on a university day, and there are a total of 182 vehicles on a holiday day. Arrival times and parking durations of these vehicles were recorded during working hours from 9:00 to 17:00, as shown in Figure 8 and Figure 9, respectively. The data were collected in the University car park from 9 am to 5 pm on University days and holiday days, respectively. Arrival and departure times and parking durations of vehicles were recorded manually. Then, the recorded data were summarized according to the University days and holiday days. All the vehicles parked were internal combustion engine vehicles. For the case study, the vehicles are assumed to be EVs. Popular EV models in New Zealand, including the Nissan Leaf, BMW i3, Hyundai Kona, and Renault Zoe, are applied in this case study. The proportions of these EV models are assumed as 40%, 30%, 20%, and 10%, respectively. Rated battery capacities and maximum charging powers for each EV type are shown in Table 2. In the summer season, the usable battery capacities were assumed to be rated capacities. However, in the winter season, due to the influence of temperature, the usable battery capacities were assumed to be 90% of the rated capacities [48]. The arrival SOC and departure SOC for each EV are taken as 40% and 80%, respectively [26,49,50,51]. Transformer and REVC parameters are displayed in Table 3 [52]. The electricity tariffs are listed in [53], used as electricity purchase prices paid by REVC operators, as shown in Table 4. The demand charge per kW ( cost demand kW ) is taken as 8.46 $/kW [54]. The discount rate (d) is assumed to be 6% [55]. The life cycle of the project (m) is assumed to be 10 years. The time cost (dissatisfaction degree) of losing an EV is set as the time cost of an EV looking for an available charging space in another EV car park. The time cost per hour is taken as the median hourly wage, which is NZD 29.66 [56]. Therefore, in 10 years, the time cost (dissatisfaction degree) of losing an EV is the multiplication of time cost per hour (NZD 29.66/hour), time spent every year (17 h) [57], and the project life cycle (10 years).
In Section 6.3, the comparison primarily focuses on split-type REVCs and conventional EVCs, as split-type REVCs are considered to have the highest flexibility. After that, Section 6.5 compares split-type REVCs and integrated-type REVCs.

6.2. Optimal Power Rating of PMs

According to REVC manufacturers, five commonly available power ratings of PMs are used. These power ratings include 10 kW, 15 kW, 16 kW, 20 kW, and 30 kW [58,59].
Based on (3) and (4), calculated degrees of utilization of PMs are displayed in Table 5. In this scenario, PMs with a 10 kW power rating have the highest degree of utilization. Consequently, 10 kW PMs are selected and will be utilized as a parameter in the number and configuration determining stage.

6.3. Planning Results

The optimization in the number and configuration determining stage is conducted according to the selected power rating of PMs and other parameters. The numerical simulation results of planning are shown in Table 6. The outputs of the number and configuration determining stages are utilized as parameters in the operation plan determining stage. The planning results of REVC are compared with slow and fast EVCs under coordinated and uncoordinated charging. Coordinated charging is an operation to control the charging schedules of EVs to realize some objectives, such as peak shaving or reducing charging costs. Uncoordinated charging is an ordinary operation in which EVs get charged immediately after connecting EVCs. The optimization problems were solved by CPLEX using the branch-and-bound method [60]. Planning results show that the number of REVCs to be deployed is much fewer than the number of slow EVCs or fast EVCs, and the total cost of planning REVCs is less than the other two types of EVCs. This is because each REVC can serve several charging spaces concurrently and dynamically allocate charging power to different charging spaces. This contrasts with conventional slow or fast EVCs, which can serve only one charging space at a time.
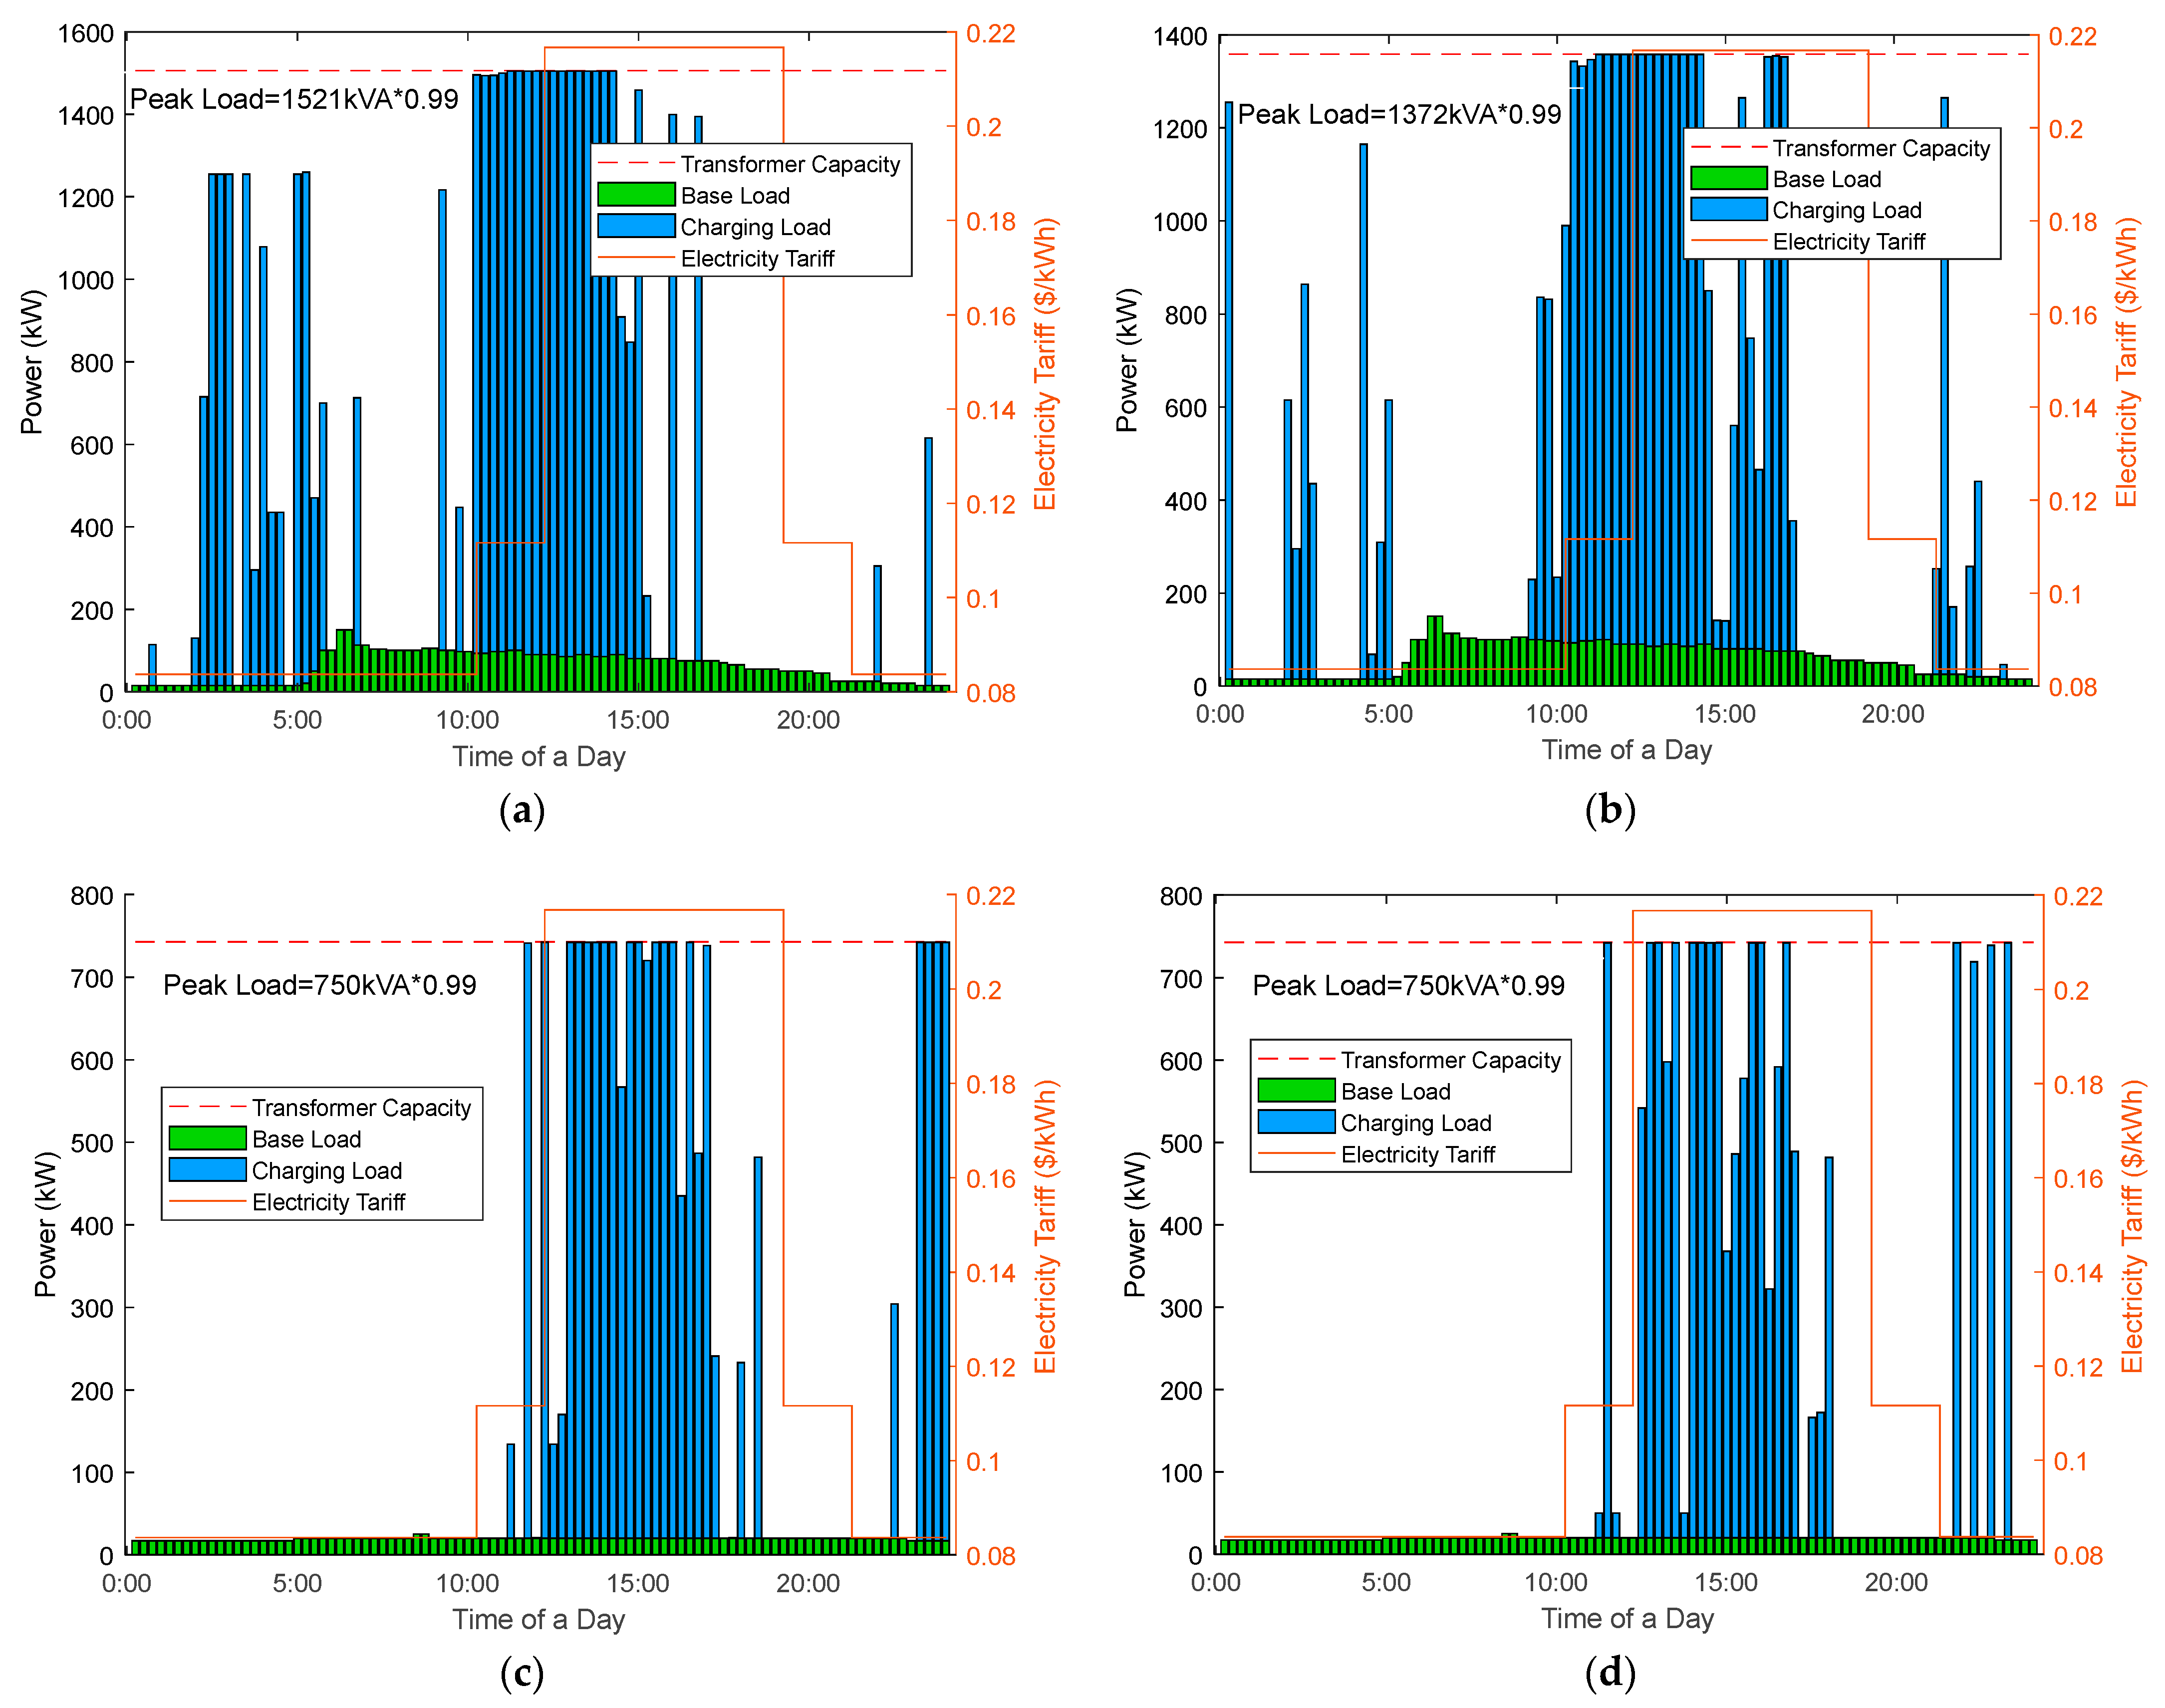
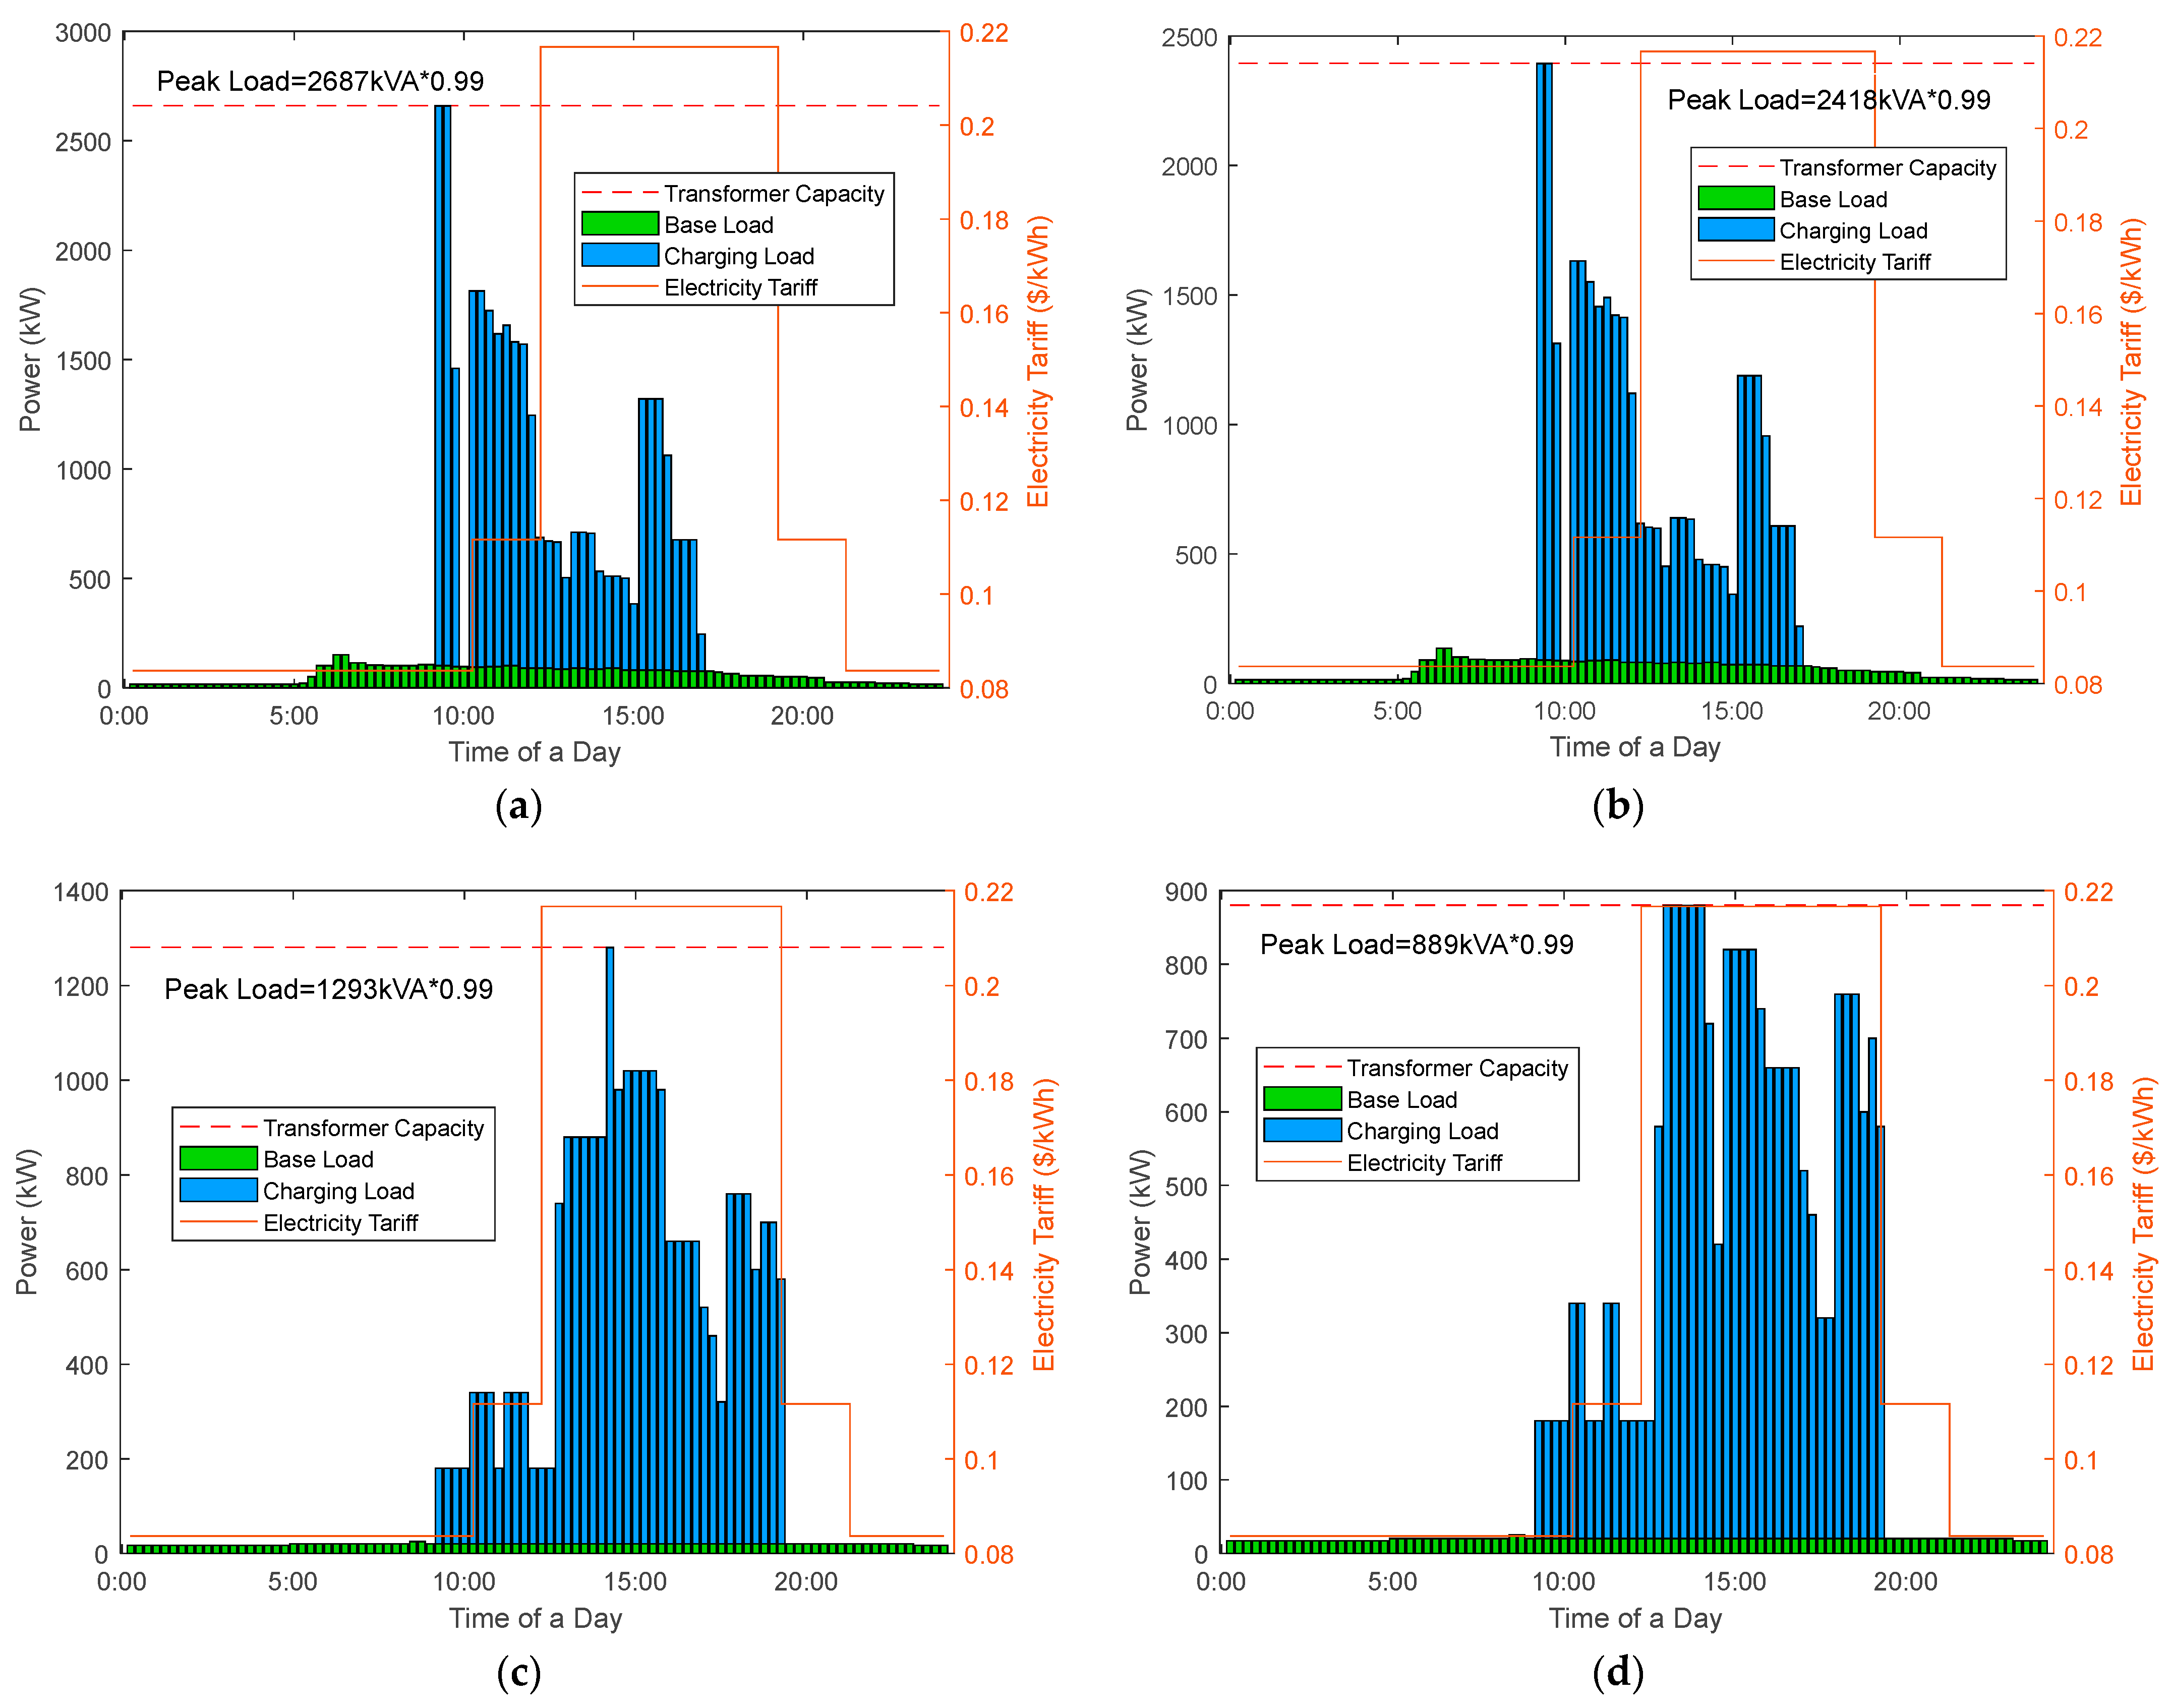
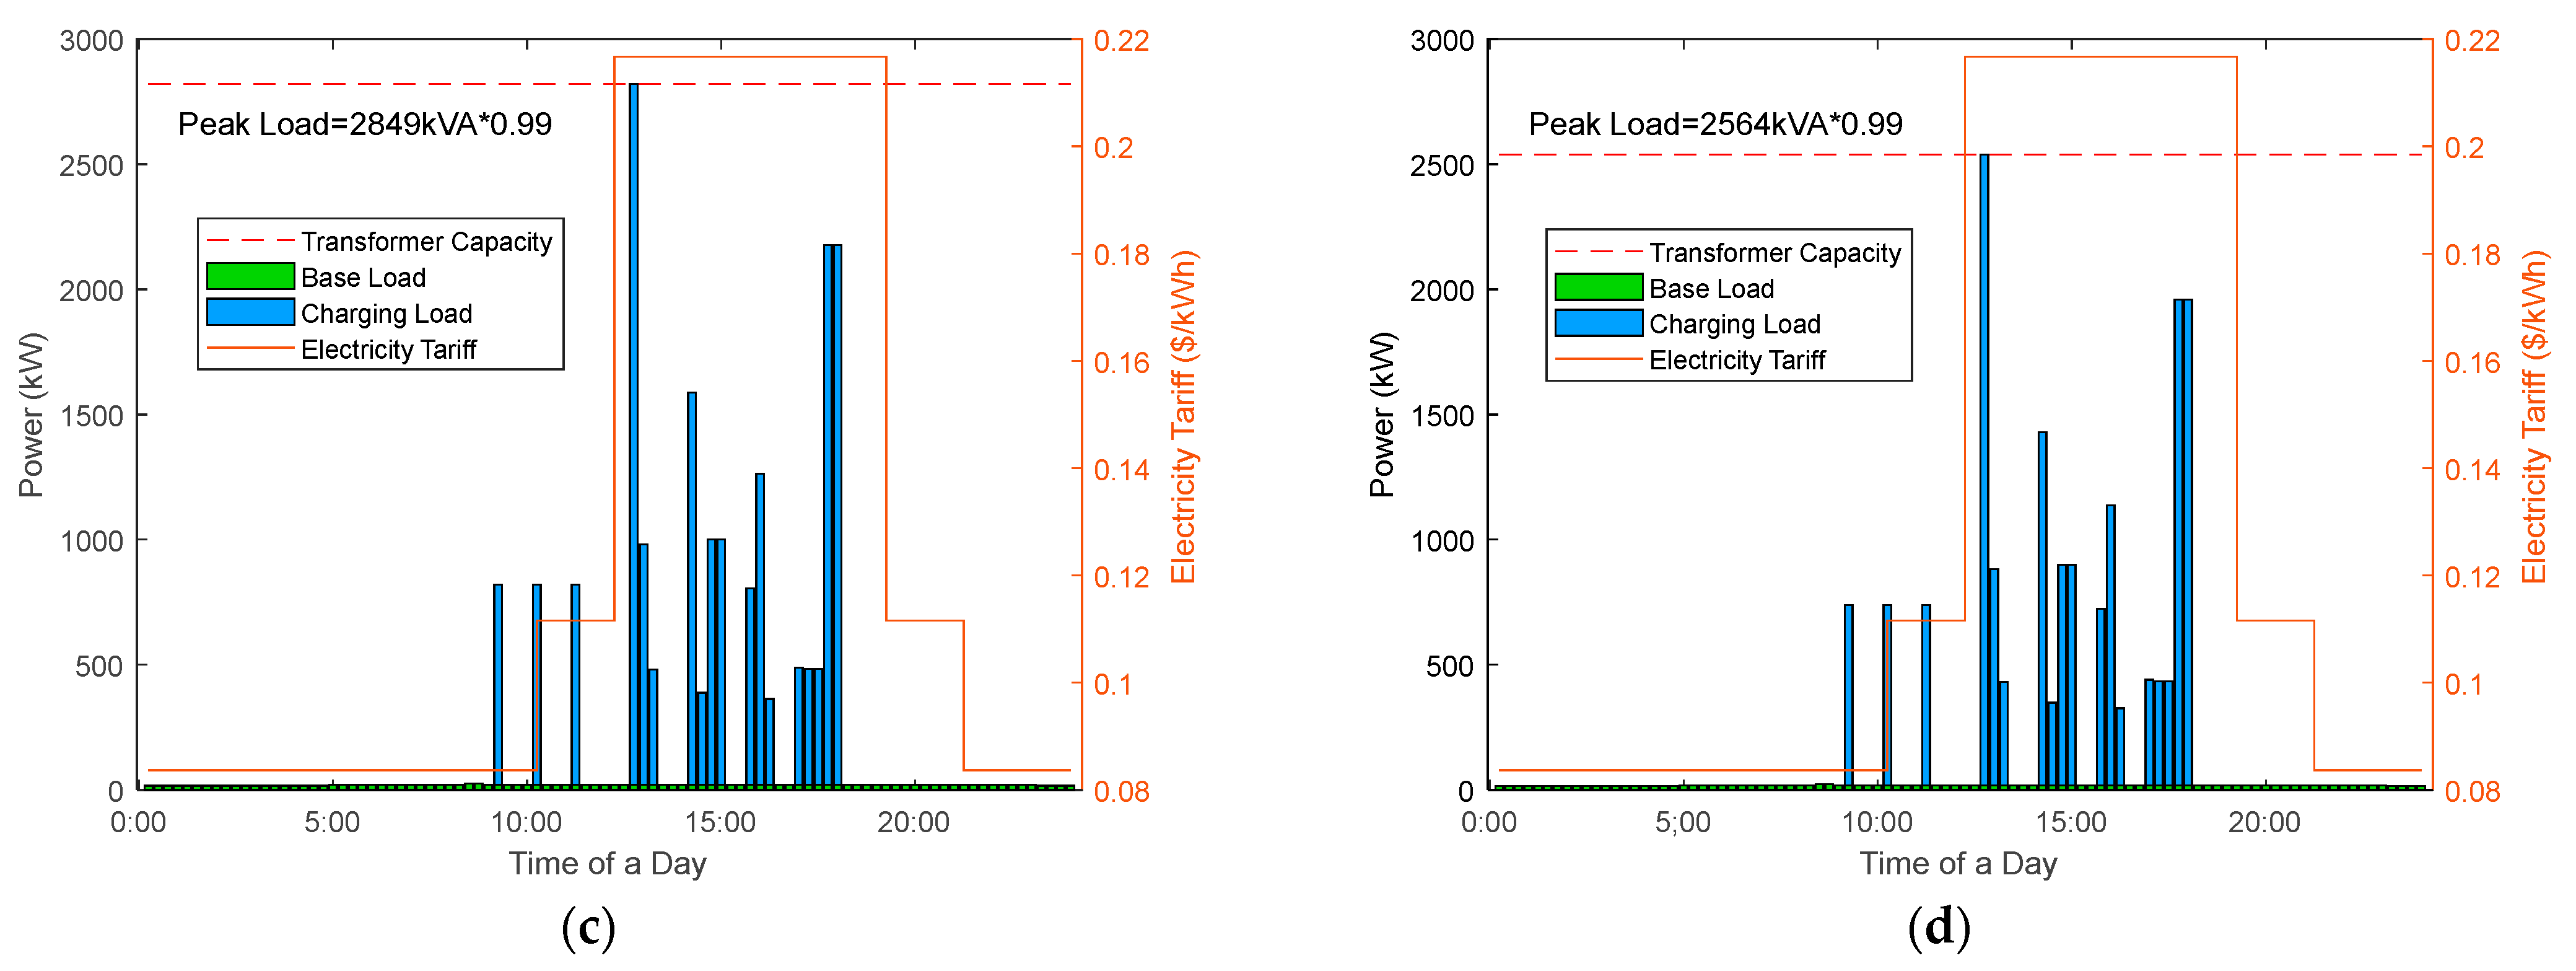
According to the outputs of the number and configuration determining stage and EV charging demands, optimization in the operation plan determining stage is conducted. The coordinated charging strategy can be achieved by applying the proposed charging strategy, where the operation cost is reduced significantly, as indicated in Table 6. Even though the operation cost, the cost of demand charge, and the transformer upgrade cost of three different types of EVCs are the same with coordinated charging, the total annual cost of deploying REVCs is 9% and 84% less than slow and conventional fast EVCs, respectively. This is due to the fact that a smaller number of REVCs can be deployed than conventional EVCs, and a larger number of EVs can be charged concurrently by each REVC. The charging profiles of REVCs under different scenarios by applying the proposed optimal planning strategy are illustrated in Figure 10. Comparing Figure 10a,b, the peak load is larger in the summer than in the winter. This is because the driving range of an EV is short in winter due to the weather impact on the usable battery capacity [39]. Consequently, under the same arrival and departure SOCs, the energy delivered to an EV is less in winter. For charging profiles on a holiday day of the summer season or winter season, most of the charging sessions happen during the peak-tariff period. This is because most of the EVs arrive after 12:00 and depart before 18:00. Therefore, due to the constraints of arrival and departure times, their charging sessions are arranged during the peak-tariff period. Comparing the charging profiles on a university day and on a holiday day, the peak load is much smaller on a holiday day than on a university day. This is due to the fact that the number of charging EVs on a holiday day is much smaller than on a university day. The charging profiles of slow and fast EVCs with uncoordinated charging are shown in Figure 11 and Figure 12, respectively. In Figure 10, many charging sessions are scheduled during off-peak and shoulder periods, compared to Figure 11 and Figure 12. This is because by applying the optimization model in the third stage of the proposed strategy, the function of coordinated charging can be achieved, and charging sessions can be shifted to relatively lower tariff periods to minimize the operation cost. For EVs stayed overnight, charging sessions can be arranged during night periods with off-peak tariffs. For EVs parked for a short time, charging power can be designated to a proper level without compromising on charging demands.
In addition, the cost of the demand charge and the upgraded transformer capacity by applying coordinated charging are relatively smaller. However, for uncoordinated charging, charging sessions occur immediately after the arrival of EVs. Therefore, at the peak time of the arrival of numerous EVs, many charging sessions are carried out at the same time, resulting in a high peak load. Consequently, high peak loads result in a large demand charge and upgraded transformer capacity.

6.4. Influence of State-of-Charge

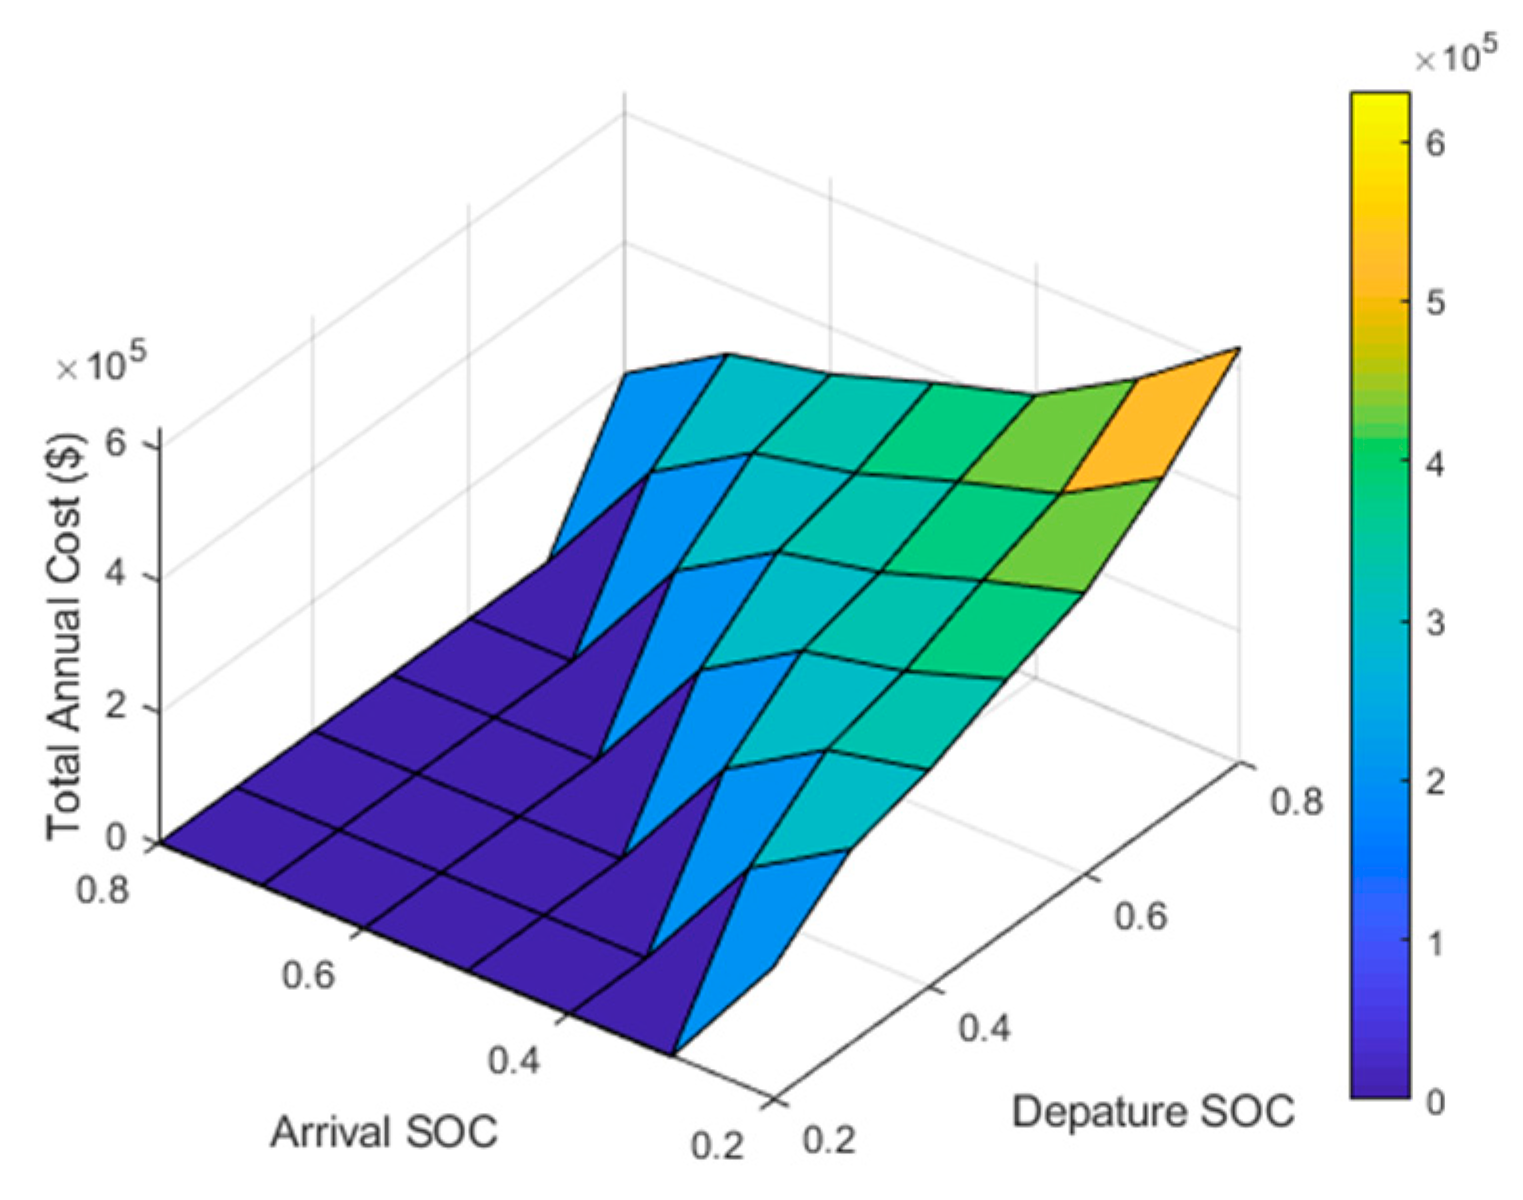
The arrival SOC and departure SOC depend on the battery energy left when each EV arrives at a car park and the energy required before each EV leaves, respectively. Thus, different arrival and departure SOCs would influence the charging demands of EVs and further influence the total annual cost. The total annual costs under different arrival SOCs and departure SOCs are given in Figure 13. The lower the arrival SOC and the higher the departure SOC, the higher the total annual cost. For the battery health of EVs, it is suggested that battery SOC be maintained between 20% and 80% [36]. Consequently, applying a 20% arrival SOC to 80% departure SOC is appropriate for a worst-case planning scenario.

6.5. Comparison of Split-Type and Integrated-Type REVCs

The comparison of two types of REVCs is undertaken in this section under different charging spaces. Under a small number of charging spaces, the equivalent annual investment cost of planning integrated-type REVCs is less than that of planning split-type REVCs, as shown in Figure 14a. However, under a large number of charging spaces, the equivalent annual investment cost of planning split-type REVCs is less than that of planning integrated-type REVCs, as illustrated in Figure 14b.
A car park with a small number of charging spaces only requires a few EVCs. Due to the technical specifications, the power rating of each split-type REVC is larger than that of each integrated-type REVC. Consequently, the number of PMs in each split-type REVC is greater than that of each integrated-type REVC. Therefore, the cost of each split-type REVC is more expensive than each integrated-type REVC. Thus, the annual investment cost of deploying split-type REVC is more costly than deploying integrated-type REVC. However, because each split-type REVC can connect more EVs, the charging resources of a split-type REVC can be shared with more EVs compared to an integrated-type REVC. Consequently, for a car park with a large number of charging spaces, relatively fewer split-type REVCs are deployed compared to integrated-type REVCs. Thus, the annual investment cost of deploying split-type REVC is less expensive than deploying integrated-type REVC.

6.6. Sensitivity Analysis for REVC Component Costs

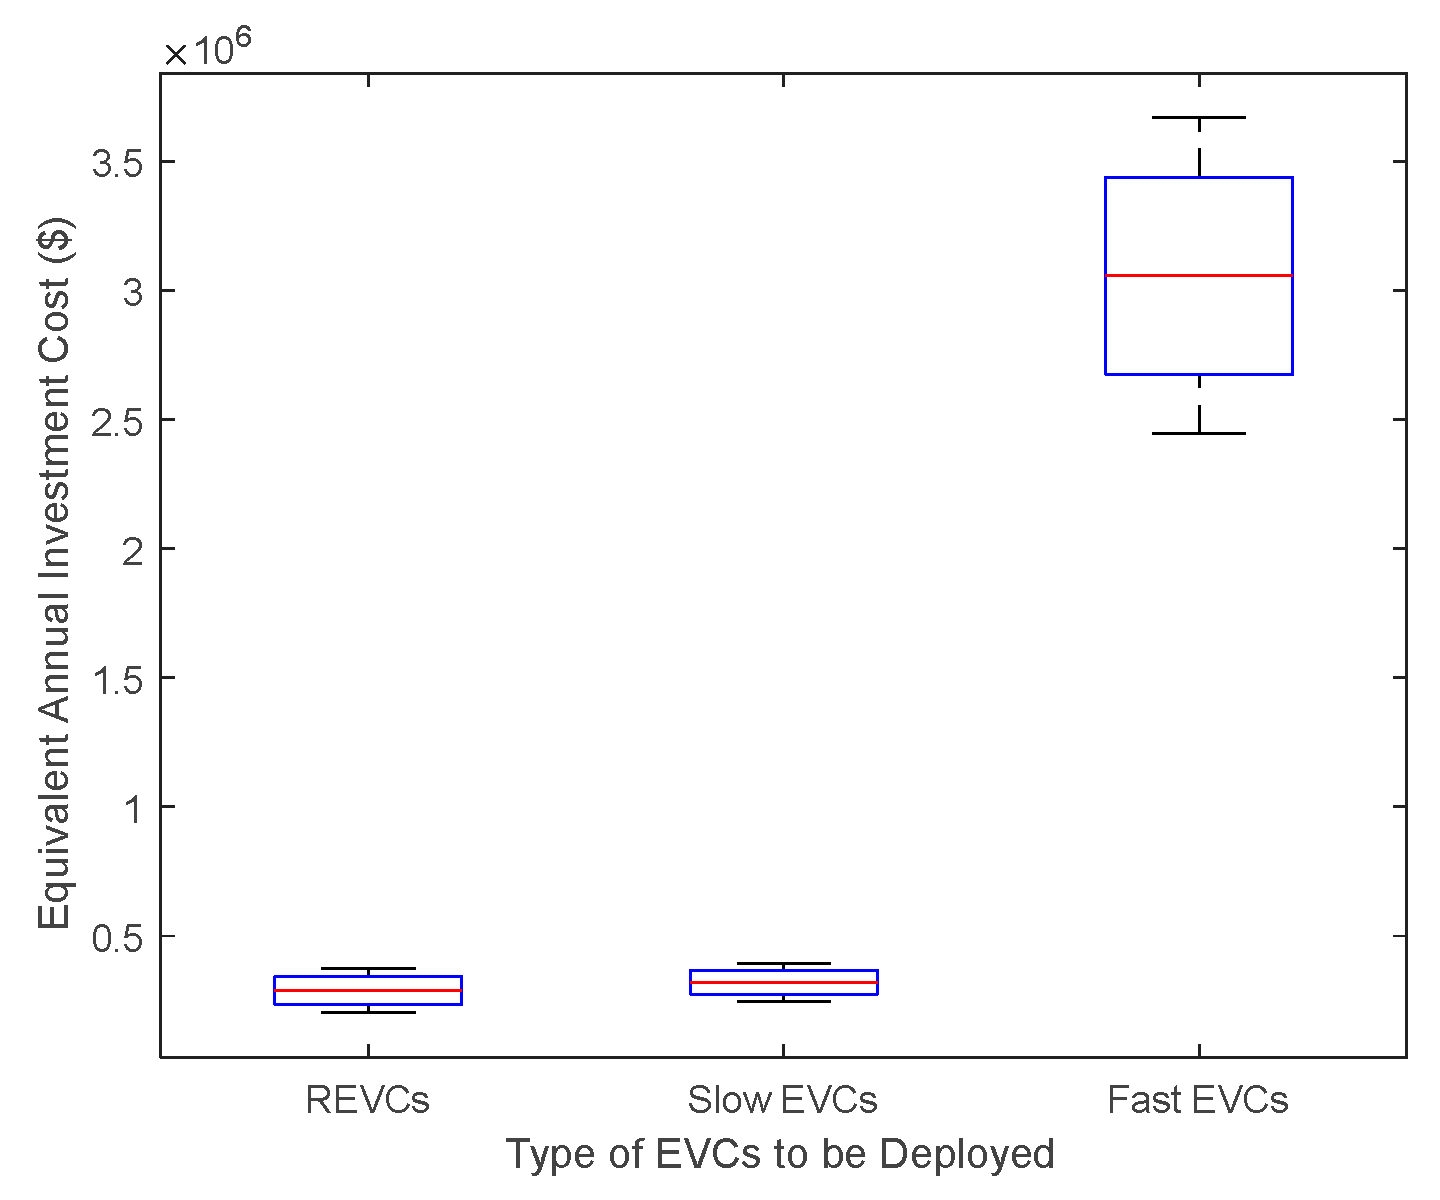
The component costs of REVCs and conventional EVCs vary depending on the manufacturers. Therefore, to evaluate the influence of the component costs on the equivalent annual investment cost of the planning, a sensitivity analysis is undertaken in this section. The main components of REVCs are PMs, CPs, and cables. The cost range for these components is presumed according to [44], shown in Table 7. The cost range for a 20 kW slow EVC is from NZD 5000 to NZD 8000. The cost range for a 100 kW fast EVC is from NZD 50,000 to NZD 75,000. To compare the equivalent annual investment costs with deploying REVCs, slow EVCs, and fast EVCs, the same scenario in Section 6.1 is applied. With the variations in the cost range, the equivalent annual investment cost of deploying REVCs is smaller than that of deploying slow or fast EVCs, as shown in Figure 15. This is because the number of REVCs to be deployed is much smaller than the other two types of EVCs, as each REVC can charge multiple EVs concurrently.

7. Conclusions

An optimal planning strategy for REVCs has been proposed in this paper. The proposed optimal planning strategy involves three stages, and an optimization model has been developed for each stage. The optimization model of the first stage determines the optimal power rating of internal PMs inside each REVC, and the optimization model of the second stage determines the optimal number and configuration of REVCs, followed by determining the optimal operation plan of REVCs from the optimization model of the third stage. To demonstrate the effectiveness of the proposed optimal planning strategy based on the optimization models, a comprehensive case study has been undertaken using realistic car parking scenarios with 400 parking spaces, electricity tariffs, and grid infrastructure costs. The results of the case study have shown that deploying REVCs by applying the proposed optimal planning strategy can reduce the total annual cost by 9% and 84%, respectively, compared to deploying other conventional types of EVCs.

Author Contributions

Conceptualization, B.S., U.K.M. and C.A.B.; methodology, B.S.; software, B.S.; validation, B.S.; formal analysis, B.S.; investigation, B.S., U.K.M. and C.A.B.; resources, B.S., U.K.M. and C.A.B.; data curation, B.S.; writing—original draft preparation, B.S.; writing—review and editing, B.S., U.K.M. and C.A.B.; visualization, B.S.; supervision, U.K.M. and C.A.B.; project administration, U.K.M.; funding acquisition, no funding. All authors have read and agreed to the published version of the manuscript.

Funding

This research received no external funding.

Data Availability Statement

The data presented in this study are available on request from the first author.

Conflicts of Interest

The authors declare no conflict of interest.

References

  1. Singh, P.P.; Wen, F.; Palu, I.; Sachan, S.; Deb, S. Electric Vehicles Charging Infrastructure Demand and Deployment: Challenges and Solutions. Energies 2023, 16, 7. [Google Scholar] [CrossRef]
  2. Aduama, P.; Al-Sumaiti, A.S.; Al-Hosani, K.H. Electric Vehicle Charging Infrastructure and Energy Resources: A Review. Energies 2023, 16, 1965. [Google Scholar] [CrossRef]
  3. Town, G.; Taghizadeh, S.; Deilami, S. Review of Fast Charging for Electrified Transport: Demand, Technology, Systems, and Planning. Energies 2022, 15, 1276. [Google Scholar] [CrossRef]
  4. Mathieu, L. Recharge EU: How Many Charge Points Will Europe and Its Member States Need in the 2020s; Transport & Environment: Brussels, Belgium, 2020. [Google Scholar]
  5. Palmer, R.; Vipond, S.; Fisher, E.; Roling, S. Progress and Insights Report 2021; Climate Group EV 100: New York, NY, USA, 2021. [Google Scholar]
  6. Song, B.; Madawala, U.; Baguley, C. A Review of Grid Impacts, Demand Side Issues and Planning Related to Electric Vehicle Charging. In Proceedings of the 2021 IEEE Southern Power Electronics Conference (SPEC), Kigali, Rwanda, 6–9 December 2021. [Google Scholar]
  7. Schettini, T.; dell’Amico, M.; Fumero, F.; Jabali, O.; Malucelli, F. Locating and Sizing Electric Vehicle Chargers Considering Multiple Technologies. Energies 2023, 16, 4186. [Google Scholar] [CrossRef]
  8. Campaña, M.; Inga, E.; Cárdenas, J. Optimal Sizing of Electric Vehicle Charging Stations Considering Urban Traffic Flow for Smart Cities. Energies 2021, 14, 4933. [Google Scholar] [CrossRef]
  9. Liu, Z.; Wen, F.; Ledwich, G. Optimal planning of electric vehicle charging stations in distribution systems. IEEE Trans. Power Del. 2013, 28, 102–110. [Google Scholar] [CrossRef]
  10. Guo, C.; Yang, J.; Yang, L. Planning of Electric Vehicle Charging Infrastructure for Urban Areas with Tight Land Supply. Energies 2018, 11, 2314. [Google Scholar] [CrossRef]
  11. Wang, X.; Shahidehpour, M.; Jiang, C.; Li, Z. Coordinated Planning Strategy for Electric Vehicle Charging Stations and Coupled Traffic-Electric Networks. IEEE Trans. Power Syst. 2019, 34, 268–279. [Google Scholar] [CrossRef]
  12. Micari, S.; Polimeni, A.; Napoli, G.; Andaloro, L.; Antonucci, V. Electric vehicle charging infrastructure planning in a road network. Renew. Sustain. Energy Rev. 2017, 80, 98–108. [Google Scholar] [CrossRef]
  13. Dong, X.; Mu, Y.; Jia, H.; Wu, J.; Yu, X. Planning of fast EV charging stations on a round freeway. IEEE Trans. Sustain. Energy 2016, 7, 1452–1461. [Google Scholar] [CrossRef]
  14. Wang, M.; Ismail, M.; Shen, X.; Serpedin, E.; Qaraqe, K. Spatial and temporal online charging/discharging coordination for mobile PEVs. IEEE Wirel. Commun. 2015, 22, 112–121. [Google Scholar] [CrossRef]
  15. Maigha; Crow, M.L. Cost-constrained dynamic optimal electric vehicle charging. IEEE Trans. Sustain. Energy 2017, 8, 716–724. [Google Scholar] [CrossRef]
  16. Gan, L.; Topcu, U.; Low, S.H. Optimal decentralized protocol for electric vehicle charging. IEEE Trans. Power Syst. 2013, 28, 940–951. [Google Scholar] [CrossRef]
  17. Mou, Y.; Xing, H.; Lin, Z.; Fu, M. Decentralized optimal demand side management for PHEV charging in a smart grid. IEEE Trans. Smart Grid 2015, 6, 726–736. [Google Scholar] [CrossRef]
  18. Kisacikoglu, M.C.; Erden, F.; Erdogan, N. Distributed control of PEV charging based on energy demand forecast. IEEE Trans. Ind. Inform. 2018, 14, 332–341. [Google Scholar] [CrossRef]
  19. Xu, Z.; Su, W.; Hu, Z.; Song, Y.; Zhang, H. A Hierarchical Framework for Coordinated Charging of Plug-In Electric Vehicles in China. IEEE Trans. Smart Grid 2016, 7, 428–438. [Google Scholar] [CrossRef]
  20. Jian, L.; Xue, H.; Xu, G.; Zhu, X.; Zhao, D.; Shao, Z.Y. Regulated Charging of Plug-in Hybrid Electric Vehicles for Minimizing Load Variance in Household Smart Microgrid. IEEE Trans. Ind. Electron. 2013, 60, 3218–3226. [Google Scholar] [CrossRef]
  21. Borlaug, B.; Yang, F.; Pritchard, E.; Wood, E.; Gonder, J. Public Electric Vehicle Charging Station Utilization in the United States. Transp. Res. Part D Transp. Environ. 2023, 114, 103564. [Google Scholar] [CrossRef]
  22. Zhang, H.; Hu, Z.; Xu, Z.; Song, Y. An Integrated Planning Framework for Different Types of PEV Charging Facilities in Urban Area. IEEE Trans. Smart Grid 2016, 7, 2273–2284. [Google Scholar] [CrossRef]
  23. Ismail, M.; Bayram, I.S.; Abdallah, M.; Serpedin, E.; Qaraqe, K. Optimal planning of fast PEV charging facilities. In Proceedings of the 2015 First Workshop on Smart Grid and Renewable Energy (SGRE), Doha, Qatar, 22–23 March 2015. [Google Scholar]
  24. Yang, Q.; Sun, S.; Deng, S.; Zhao, Q.; Zhou, M. Optimal Sizing of PEV Fast Charging Stations with Markovian Demand Characterization. IEEE Trans. Smart Grid 2019, 10, 4457–4466. [Google Scholar] [CrossRef]
  25. Yang, Z.; Huang, X.; Gao, T.; Liu, Y.; Gao, S. Real-Time Energy Management Strategy for Parking Lot Considering Maximum Penetration of Electric Vehicles. IEEE Access 2022, 10, 5281–5291. [Google Scholar] [CrossRef]
  26. Mokgonyana, L.; Smith, K.; Galloway, S. Reconfigurable Low Voltage Direct Current Charging Networks for Plug-In Electric Vehicles. IEEE Trans. Smart Grid 2019, 10, 5458–5467. [Google Scholar] [CrossRef]
  27. Zhang, H.; Hu, Z.; Xu, Z.; Song, Y. Optimal Planning of PEV Charging Station with Single Output Multiple Cables Charging Spots. IEEE Trans. Smart Grid 2019, 8, 2119–2128. [Google Scholar] [CrossRef]
  28. Chen, H.; Hu, Z.; Luo, H.; Qin, J.; Rajagopal, R.; Zhang, H. Design and Planning of a Multiple-Charger Multiple-Port Charging System for PEV Charging Station. IEEE Trans. Smart Grid 2019, 10, 173–183. [Google Scholar] [CrossRef]
  29. Vaughan, P.; Baxter, D.; Hagenmaier, C.F.; Tran, J.P.K.; Matsuno, C.T.; Eldridge, G.A.; Romano, P. Dynamic Allocation of Power Modules for Charging Electric Vehicles. U.S. Patent 010150380B2, 11 December 2018. [Google Scholar]
  30. ChargePoint Express 250 Specifications and Ordering Information. Available online: https://chargepoint.ent.box.com/v/CPE250-DS-EN-US (accessed on 27 September 2023).
  31. INFY POWER Split Type HP Fast DC Charger. Available online: https://www.infypower.com/split-type-hp-fast-dc-charger.html (accessed on 27 September 2023).
  32. ABB Electric Vehicle Infrastructure Terra High Power—GEN III. Available online: https://search.abb.com/library/Download.aspx?DocumentID=9AKK107991A9632&LanguageCode=en&DocumentPartId=&Action=Launch (accessed on 27 September 2023).
  33. SIEMENS CPC150—The 150 kW Compact Power Charge. Available online: https://assets.new.siemens.com/siemens/assets/api/uuid:c9041d4a-79fe-4e80-8b2a-439fbea5946a/broschuere-sicharge-cpc150-print.pdf (accessed on 27 September 2023).
  34. ChargePoint Express Plus. Available online: https://www.chargepoint.com/businesses/dc-stations/express-plus (accessed on 27 September 2023).
  35. SENKU 150V-1000VDC 60KW—160KW DC EV Charger. Available online: http://www.senkumachinery.com/product/-ev-car-charging-station.html (accessed on 27 September 2023).
  36. SCU EV Charging Stack EVMS EV Charging Stack (EV Power Unit + EV Charger Post). Available online: https://www.scupower.com/ev-charger/evse-ev-charging-stack/ (accessed on 27 September 2023).
  37. EVTEC Sspresso&Charge 6in1. Available online: https://www.evtec.ch/application/files/9716/1329/3826/factsheet_espressocharge_6in1_en.pdf (accessed on 27 September 2023).
  38. EVBox Troniq Modular. Available online: https://evbox.com/en/ev-chargers/troniq-modular (accessed on 27 September 2023).
  39. ChargePoint Express 250 Review: New Charger on the Block. Available online: https://www.youtube.com/watch?v=xgKo-zxGw9k (accessed on 9 October 2023).
  40. Annual Reports. Available online: https://at.govt.nz/about-us/reports-publications/annual-reports (accessed on 10 October 2023).
  41. Wang, R.; Xing, Q.; Chen, Z.; Zhang, Z.; Liu, B. Modeling and Analysis of Electric Vehicle User Behavior Based on Full Data Chain Driven. Sustainability 2022, 14, 8600. [Google Scholar] [CrossRef]
  42. Jonas, T.; Daniels, N.; Macht, G. Electric Vehicle User Behavior: An Analysis of Charging Station Utilization in Canada. Energies 2023, 16, 1592. [Google Scholar] [CrossRef]
  43. Khan, S.; Brandherm, B.; Swamy, A. Electric Vehicle User Behavior Prediction using Learning-based Approaches. In Proceedings of the 2020 IEEE Electric Power and Energy Conference (EPEC), Edmonton, AB, Canada, 9–10 November 2020. [Google Scholar]
  44. The New ChargePoint Mobile App Is Here. Available online: https://www.chargepoint.com/about/news/new-chargepoint-mobile-app-here/ (accessed on 10 October 2023).
  45. EVgo Mobile App. Available online: https://www.evgo.com/download-app/ (accessed on 10 October 2023).
  46. Mobile App. Available online: https://www.tesla.com/ownersmanual/model3/en_us/GUID-F6E2CD5E-F226-4167-AC48-BD021D1FFDAB.html (accessed on 10 October 2023).
  47. AUT Semester Dates. Available online: https://www.aut.ac.nz/study/semester-dates (accessed on 27 September 2023).
  48. Winter & Cold Weather EV Range Loss in 7000 Cars. Available online: https://www.recurrentauto.com/research/winter-ev-range-loss (accessed on 27 September 2023).
  49. Kostopoulos, E.; Spyropoulos, G.; Kaldellis, J. Real-world study for the optimal charging of electric vehicles. Energy Rep. 2020, 6, 418–426. [Google Scholar] [CrossRef]
  50. Common DC Fast Charging Curves and How to Find Yours. Available online: https://www.chargepoint.com/blog/common-dc-fast-charging-curves-and-how-find-yours (accessed on 9 October 2023).
  51. How DC Fast Charging Really Works and an Intro to Charging Curves. Available online: https://www.chargepoint.com/blog/how-dc-fast-charging-really-works-and-intro-charging-curves (accessed on 9 October 2023).
  52. Reducing EV Charging Infrastructure Costs. Available online: https://rmi.org/wp-content/uploads/2020/01/RMI-EV-Charging-Infrastructure-Costs.pdf (accessed on 27 September 2023).
  53. Rate BEVT Business Electric Vehicle Time-of-Use. Available online: https://www.alabamapower.com/content/dam/alabama-power/pdfs-docs/Rates/BEVT.pdf (accessed on 27 September 2023).
  54. Schedule GT (SC) General Service Time-of-Use. Available online: https://dms.psc.sc.gov/Attachments/Matter/0c8ffb07-d245-f293-036bd9115ebae6ad (accessed on 27 September 2023).
  55. Schroeder, A.; Traber, T. The economics of fast charging infrastructure for electric vehicles. Energy Policy 2012, 43, 136–144. [Google Scholar] [CrossRef]
  56. New Median Wage Will Apply from 27 February 2023. Available online: https://www.immigration.govt.nz/about-us/media-centre/news-notifications/new-median-wage-will-apply-from-27-february-2023 (accessed on 27 September 2023).
  57. Drivers Spend an Average of 17 Hours a Year Searching for Parking Spots. Available online: https://www.usatoday.com/story/money/2017/07/12/parking-pain-causes-financial-and-personal-strain/467637001/ (accessed on 27 September 2023).
  58. SCU EV Charger Module. Available online: https://www.scupower.com/ev-charger/ev-charger-module/ (accessed on 27 September 2023).
  59. INFY POWER Module. Available online: https://www.infypower.com/module/ (accessed on 27 September 2023).
  60. IBM ILOG CPLEX Optimization Studio. Available online: https://www.ibm.com/products/ilog-cplex-optimization-studio (accessed on 27 September 2023).
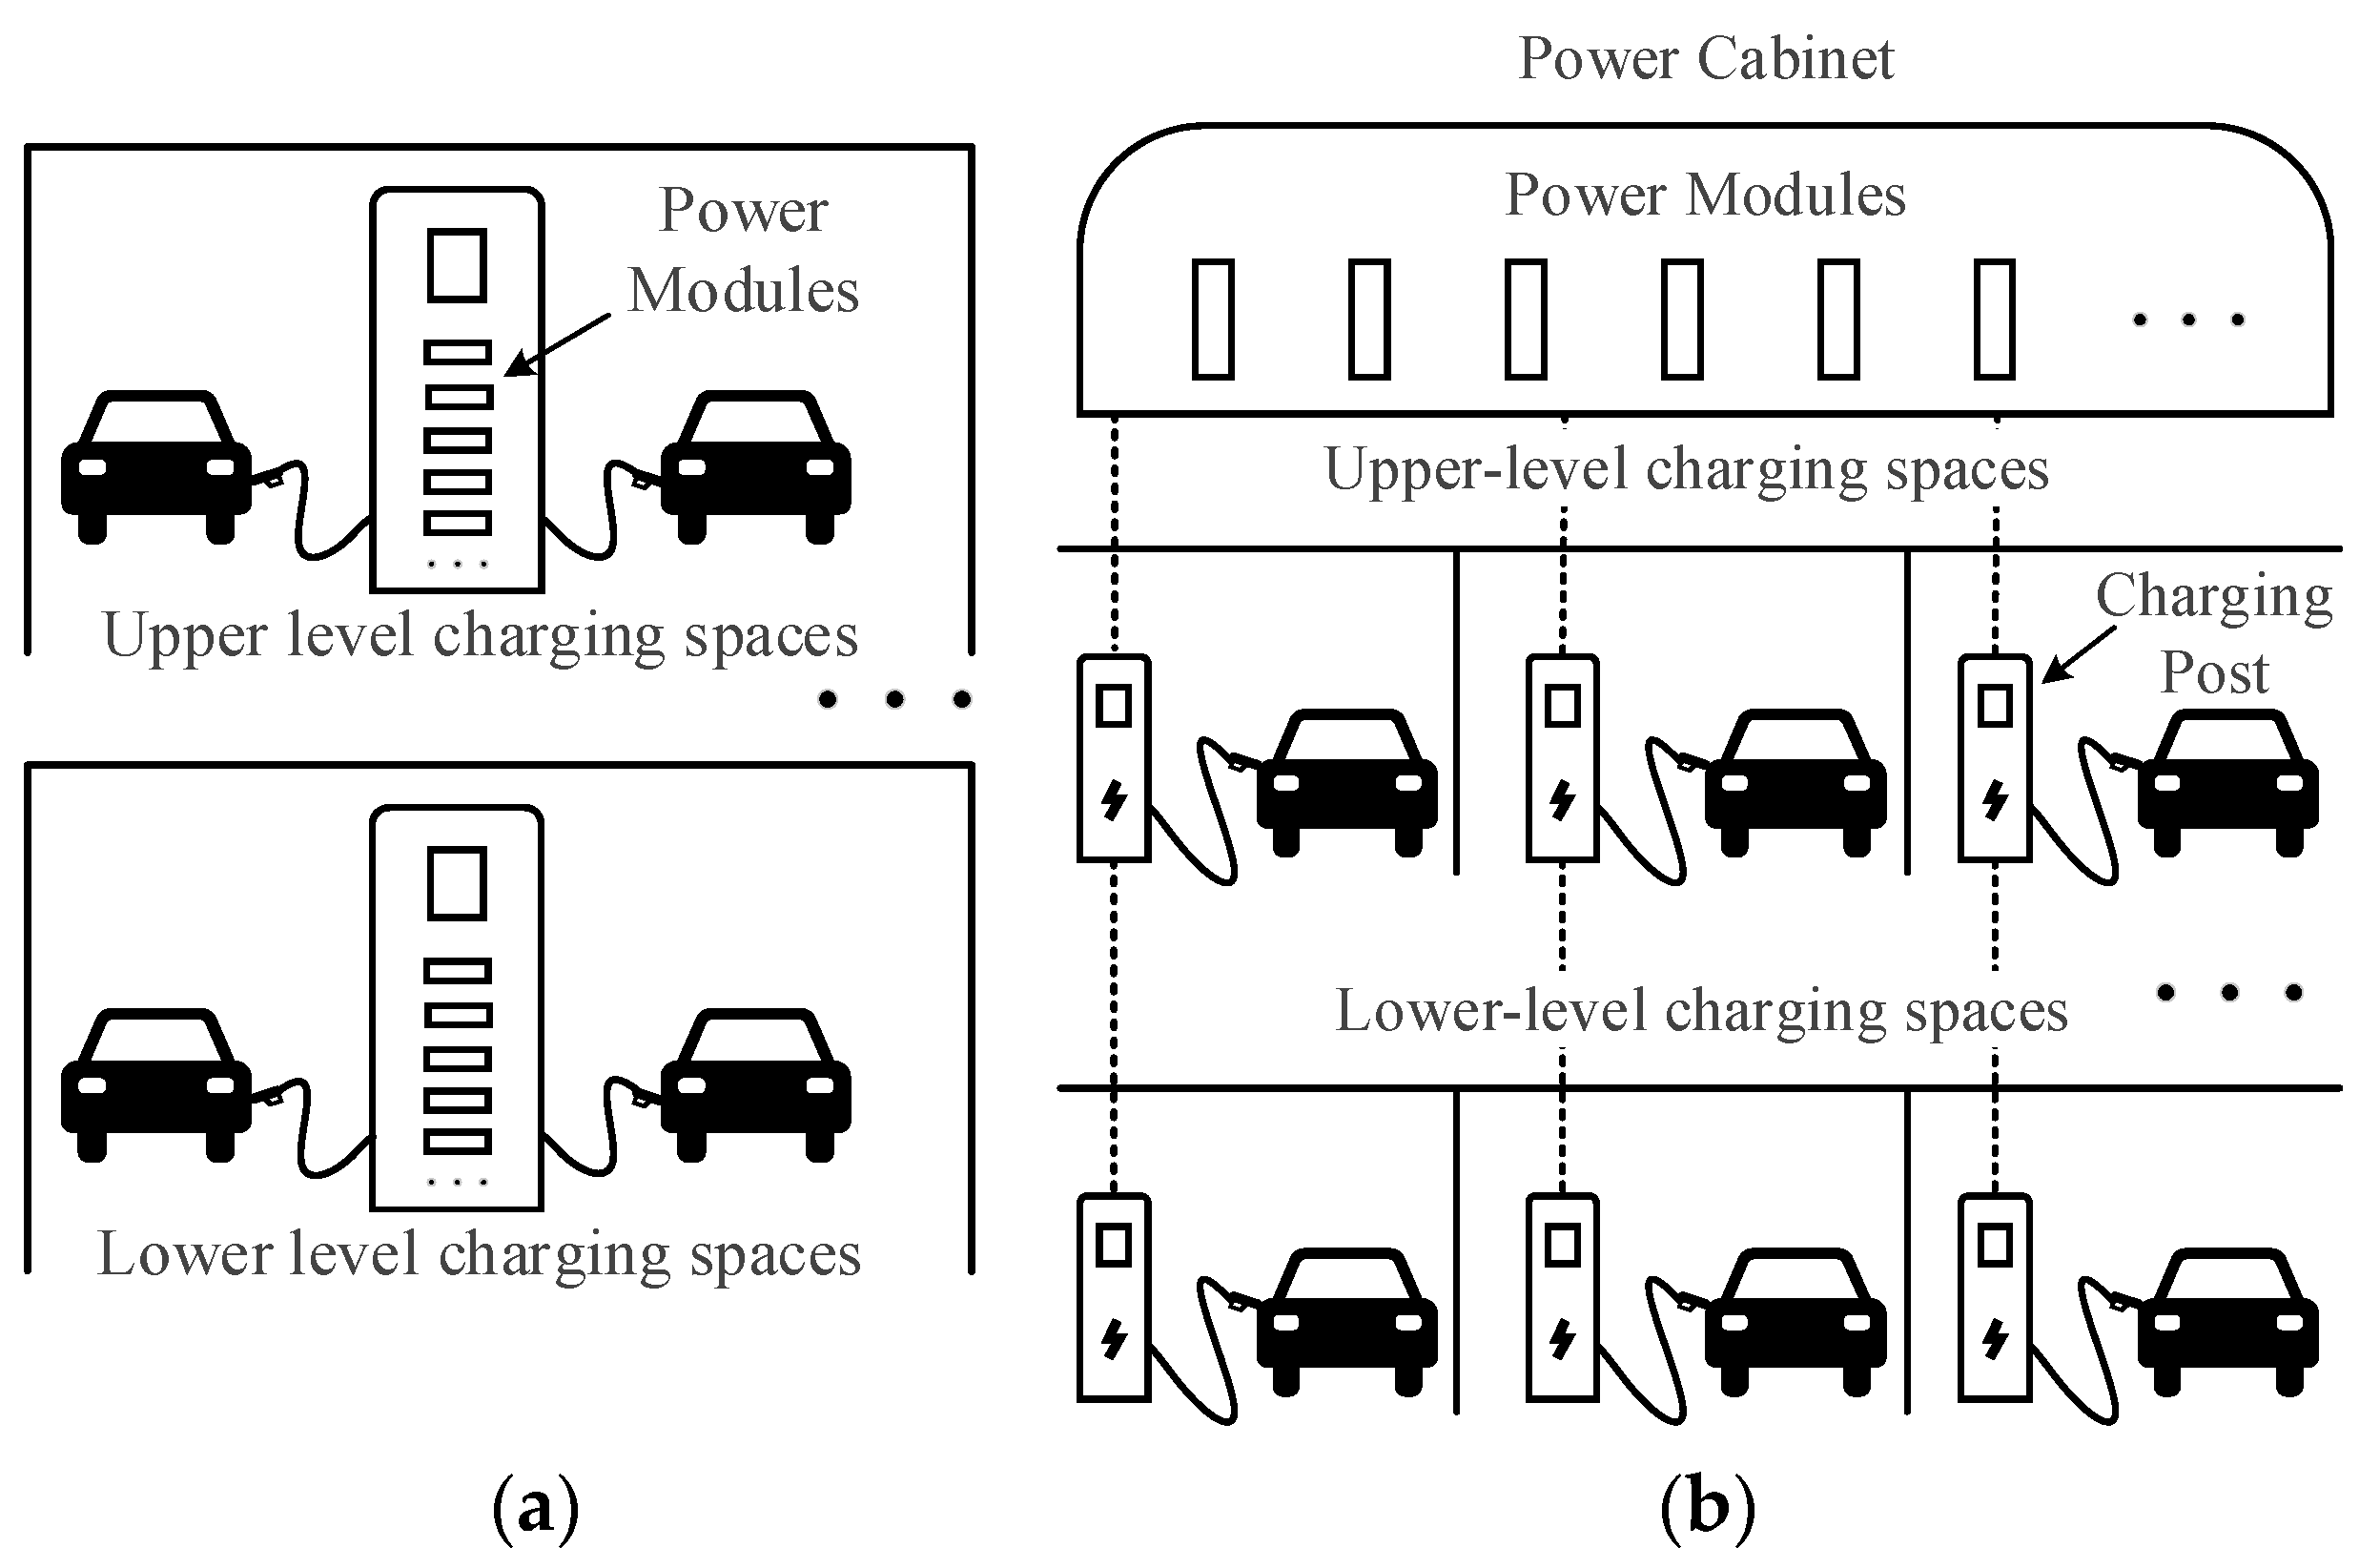
Figure 1. Schematic of (a) Integrated-type REVCs; (b) a split-type REVC.
Energies 16 07204 g001
Figure 2. Framework of the proposed three-stage optimal planning strategy.
Energies 16 07204 g002
Figure 3. Block diagram of the degree of utilization of PMs.
Energies 16 07204 g003
Figure 4. Framework for determining the operation plan.
Energies 16 07204 g004
Figure 5. Flowchart for aggregating and grouping EVs.
Energies 16 07204 g005
Figure 6. Example of parking duration for EVs.
Energies 16 07204 g006
Figure 7. Baseload of the transformer.
Energies 16 07204 g007
Figure 8. Arrival times of EVs.
Energies 16 07204 g008
Figure 9. Parking duration of EVs.
Energies 16 07204 g009
Figure 10. Charging profiles with the proposed strategy (a) a university day of the summer season; (b) a university day of the winter season; (c) a holiday day of the summer season; (d) a holiday day of the winter season.
Energies 16 07204 g010
Figure 11. Charging profiles by applying slow EVCs with uncoordinated charging (a) a university day of the summer season; (b) a university day of the winter season; (c) a holiday day of the summer season; (d) a holiday day of the winter season.
Energies 16 07204 g011
Figure 12. Charging profiles by applying conventional fast EVCs with uncoordinated charging (a) a university day of the summer season; (b) a university day of the winter season; (c) a holiday day of the summer season; (d) a holiday day of the winter season.
Energies 16 07204 g012aEnergies 16 07204 g012b
Figure 13. Total annual cost under different arrival and departure SOCs.
Energies 16 07204 g013
Figure 14. Equivalent annual investment cost comparison (a) with a small number of charging spaces; (b) with a large number of charging spaces.
Energies 16 07204 g014
Figure 15. Comparison of equivalent annual investment costs with deploying different types of EVCs.
Energies 16 07204 g015
Table 1. Comparison of REVC and conventional types of EVCs.
EVC TypeSlow EVCConventional Fast EVCREVC
AC or DCACDCDC
Number of EVs
Charged
Concurrently
11>1
FlexibilityLowLowHigh
Degree of
Resource
Utilization
LowLowHigh
Table 2. Rated battery capacity and maximum charging power.
EV TypeNissan LeafBMW i3Hyundai KonaRenault Zoe
Battery Capacity62 kWh42.2 kWh67.5 kWh54.7 kWh
Maximum Charging Power 100 kW49 kW77 kW46 kW
Table 3. Transformer and REVC parameters.
ParameterValueParameterValue
P REVC max 480 kW (split-type)160 kW (integrated-type)costcableNZD 1500
P REVC min 120 kW (split-type)100 kW (integrated-type)costotherNZD 1500
n CP max 12 (split-type)3 (integrated-type)PF0.99
n CP min 2 (either type)Cex750 kVA
cost PM kW NZD 100/kW cost transformer kVA NZD 150/kVA
costCPNZD 1500η95%
Table 4. Electricity tariffs.
Period TypeTariff (NZD/kWh)Times (Hour)
Peak0.2167(12:00~19:00]
Shoulder0.1116(10:00~12:00] and (19:00~21:00]
Off-peak0.0837(21:00~10:00]
Table 5. Degrees of utilization of PMs.
Power Rating of PMs (kW)Degree of Utilization
1087%
1538.14%
1636.875%
2073.5%
3048.74%
Table 6. Planning results.
EVC TypeREVC (Split-Type)Slow EVCFast EVCSlow EVCFast EVC
Operation MannerCoordinatedCoordinatedCoordinatedUncoordinatedUncoordinated
EVC Number30362360362360
Charging Post/cable
per EVC
121111
EVC Power Rating (kW)1202010020100
Upgraded Transformer Capacity (kVA)750 + 771750 + 771750 + 771750 + 1937750 + 5762
Equivalent Annual
Investment Cost (k NZD)
201.764245.9212445.623245.9212445.623
Equivalent Annual
Time Cost (Dissatisfaction Degree) (k NZD)
1.37001.37001.370
Annual Operation
Cost (k NZD)
102.674102.674102.674319.620986.262
Annual Cost of
Demand Charge (k NZD)
154.412154.412154.412281.515661.098
Equivalent Annual Transformer Upgrade Cost (k NZD)6.9146.9146.91439.476117.431
Total Annual Cost (k NZD)428.789471.5762672.648886.5324211.784
Table 7. Cost range for REVC components.
ComponentCost Range
Power Module100~150 (NZD/kW)
Charging Post1500~2500 (NZD)
Cable1500~3500 (NZD)
Disclaimer/Publisher’s Note: The statements, opinions and data contained in all publications are solely those of the individual author(s) and contributor(s) and not of MDPI and/or the editor(s). MDPI and/or the editor(s) disclaim responsibility for any injury to people or property resulting from any ideas, methods, instructions or products referred to in the content.