
Review of Low-Temperature Performance, Modeling and Heating for Lithium-Ion Batteries


Abstract
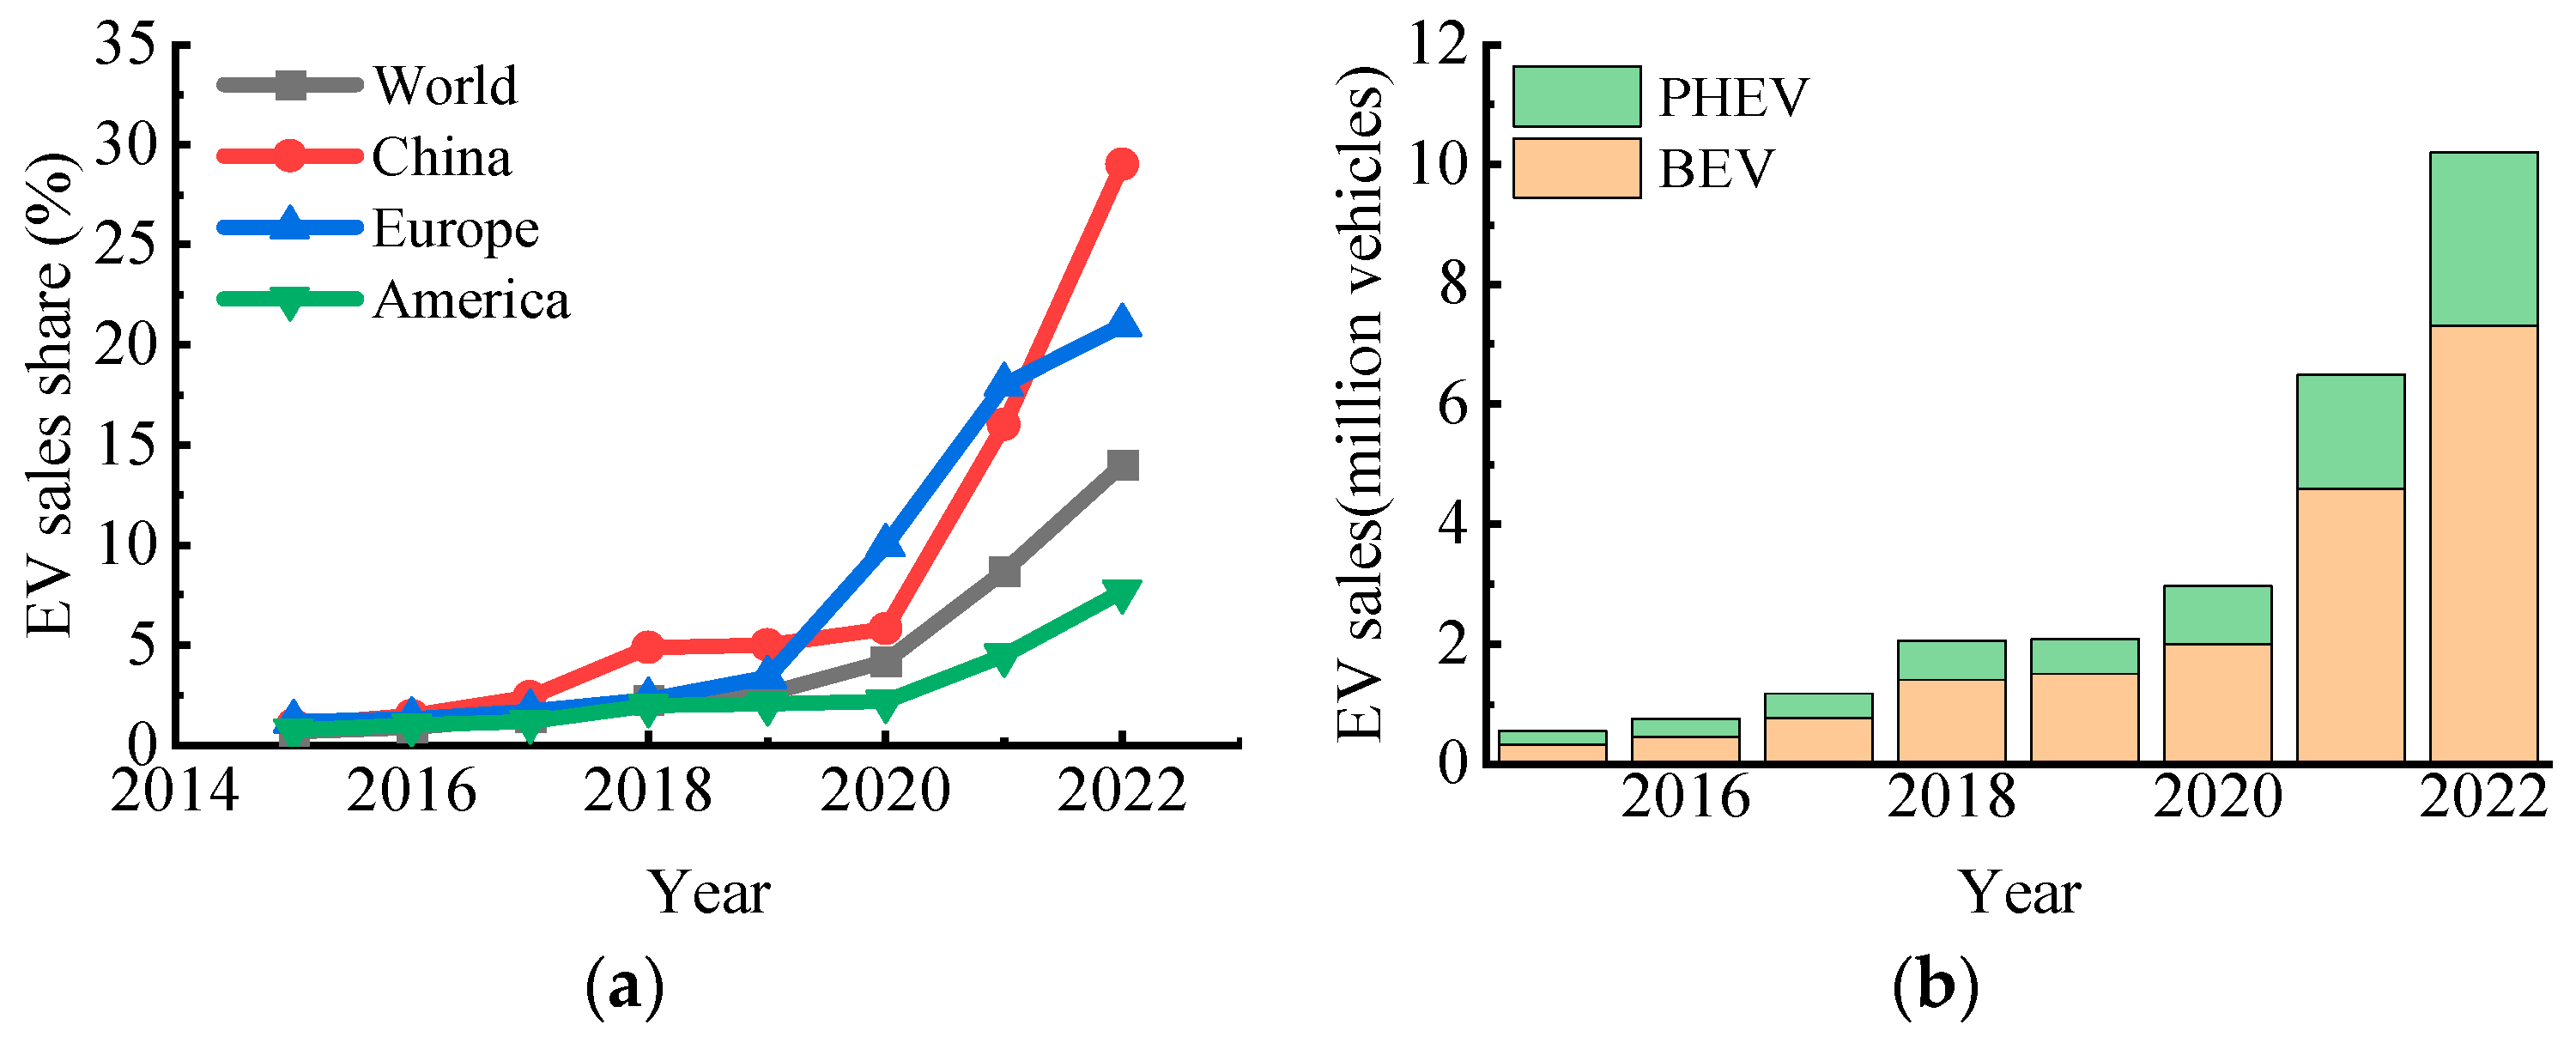
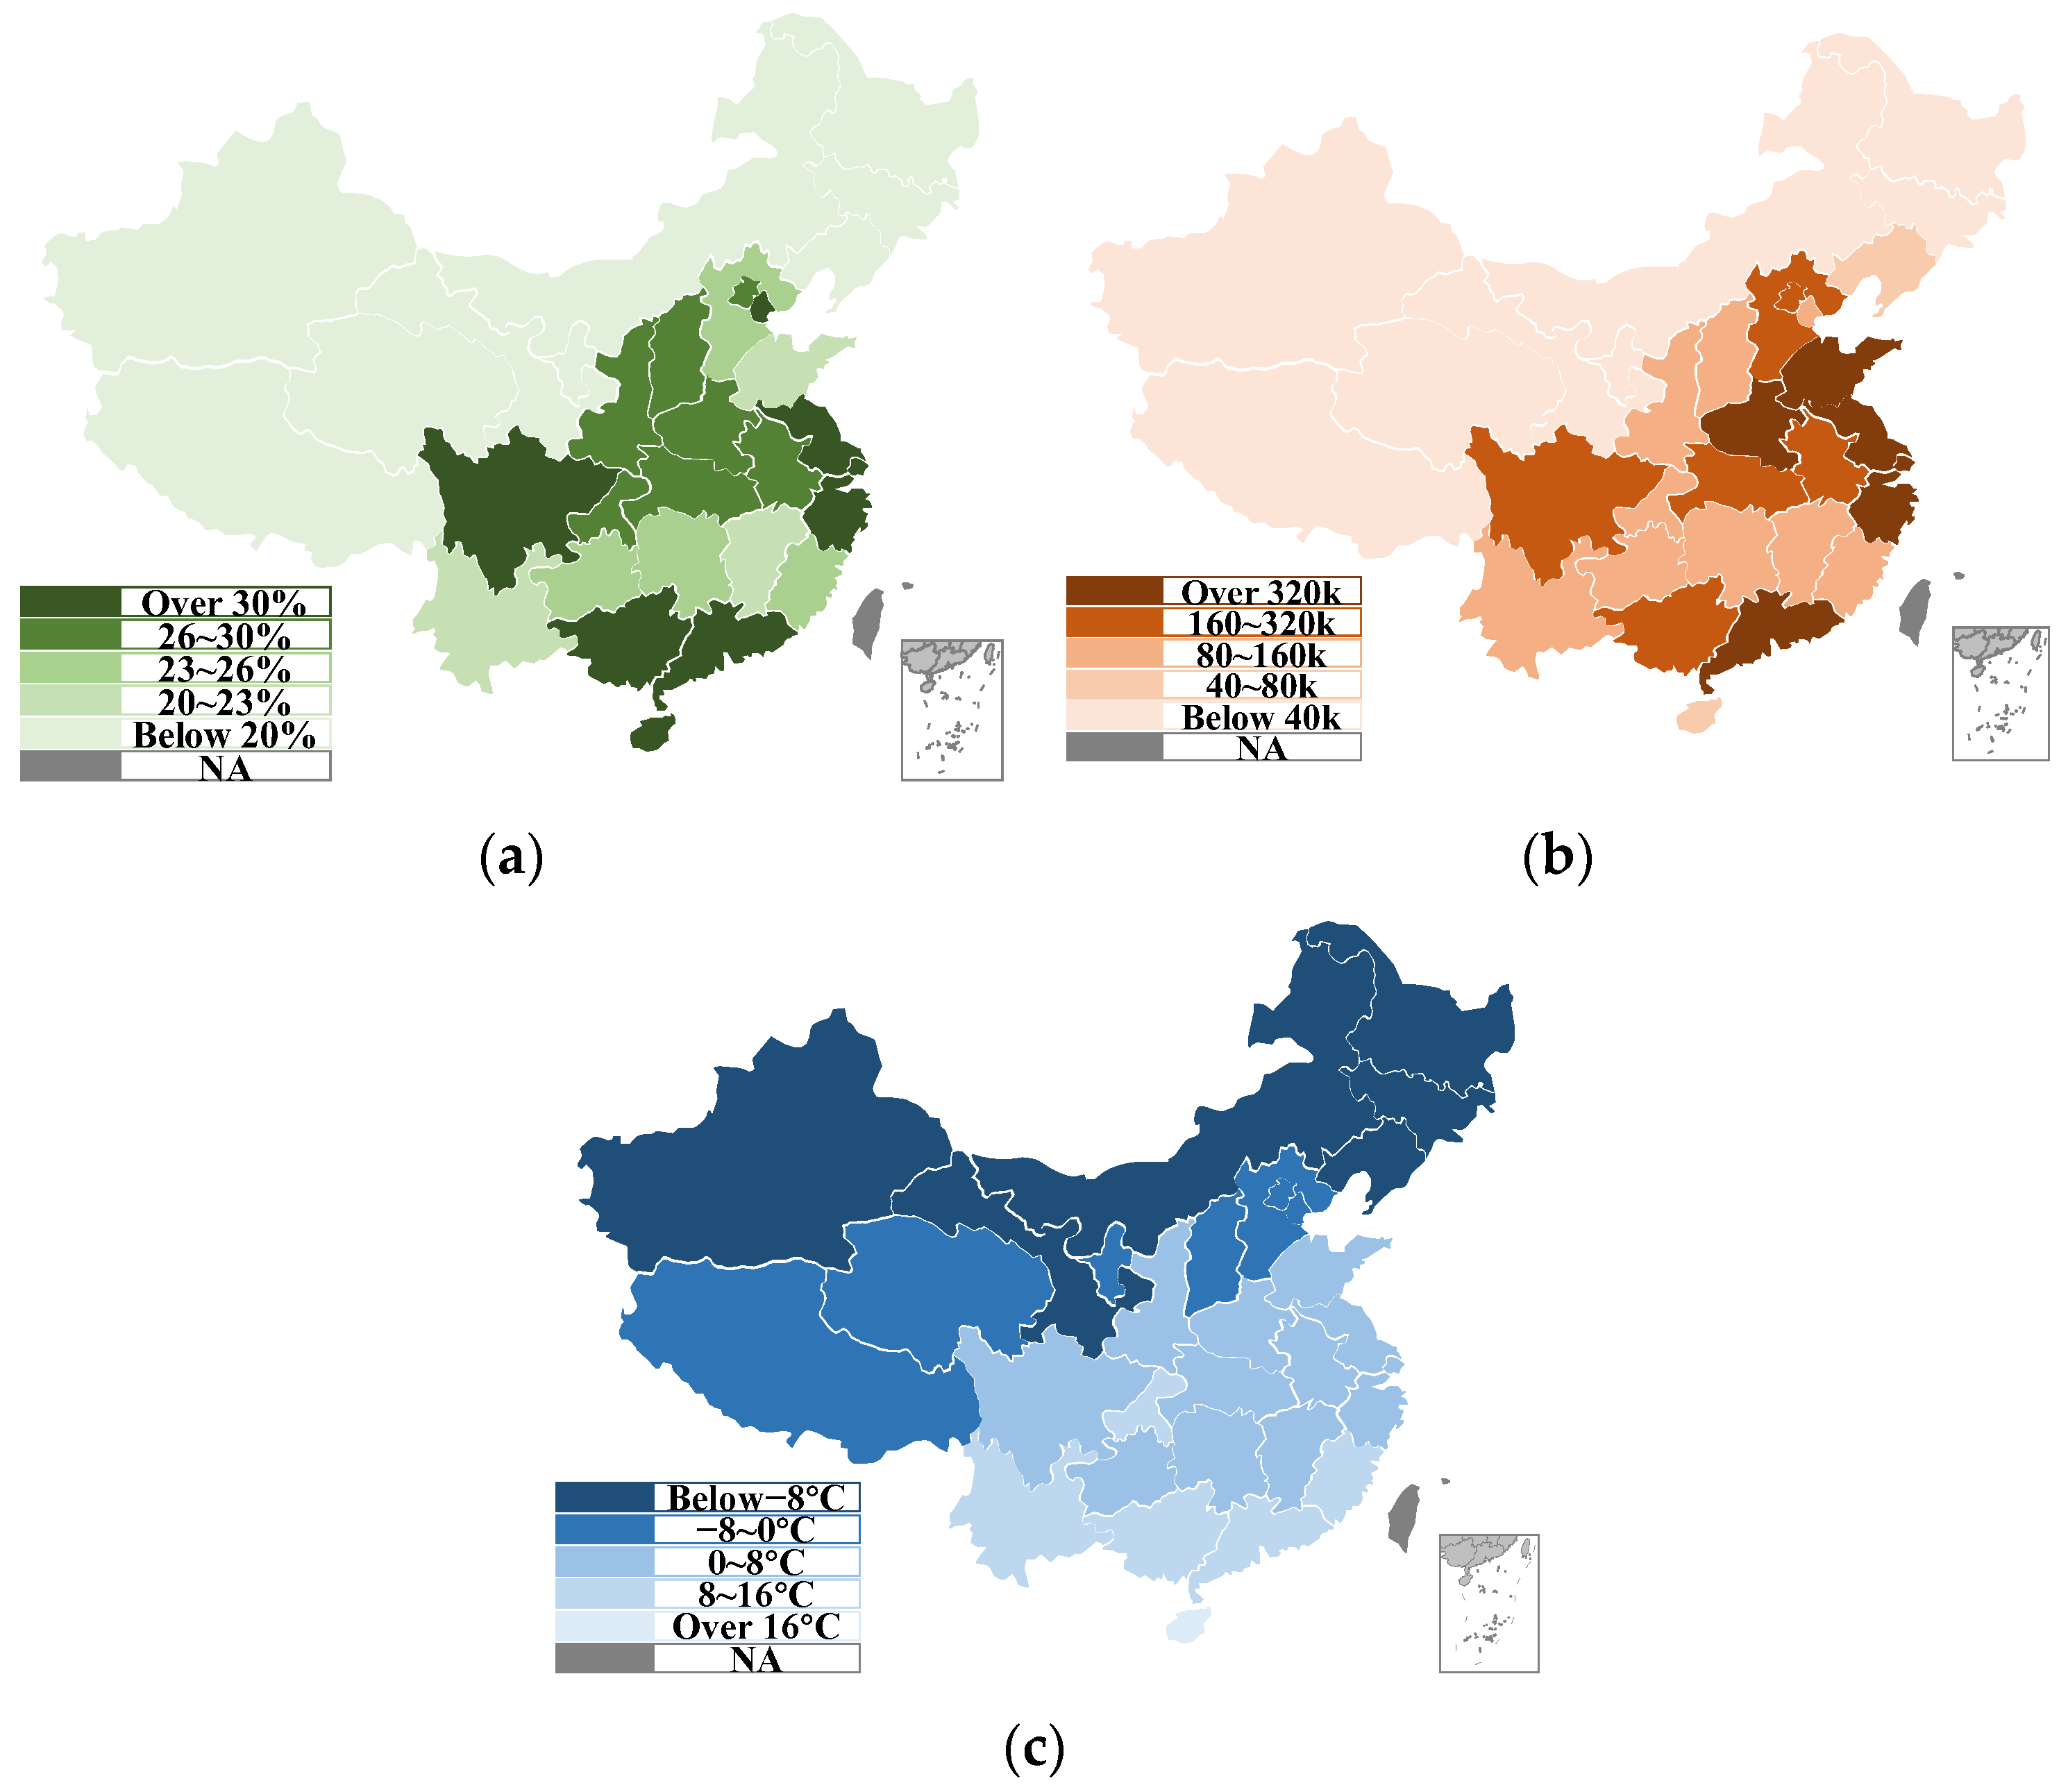
:1. Introduction
2. Low-Temperature Performance
2.1. Charging
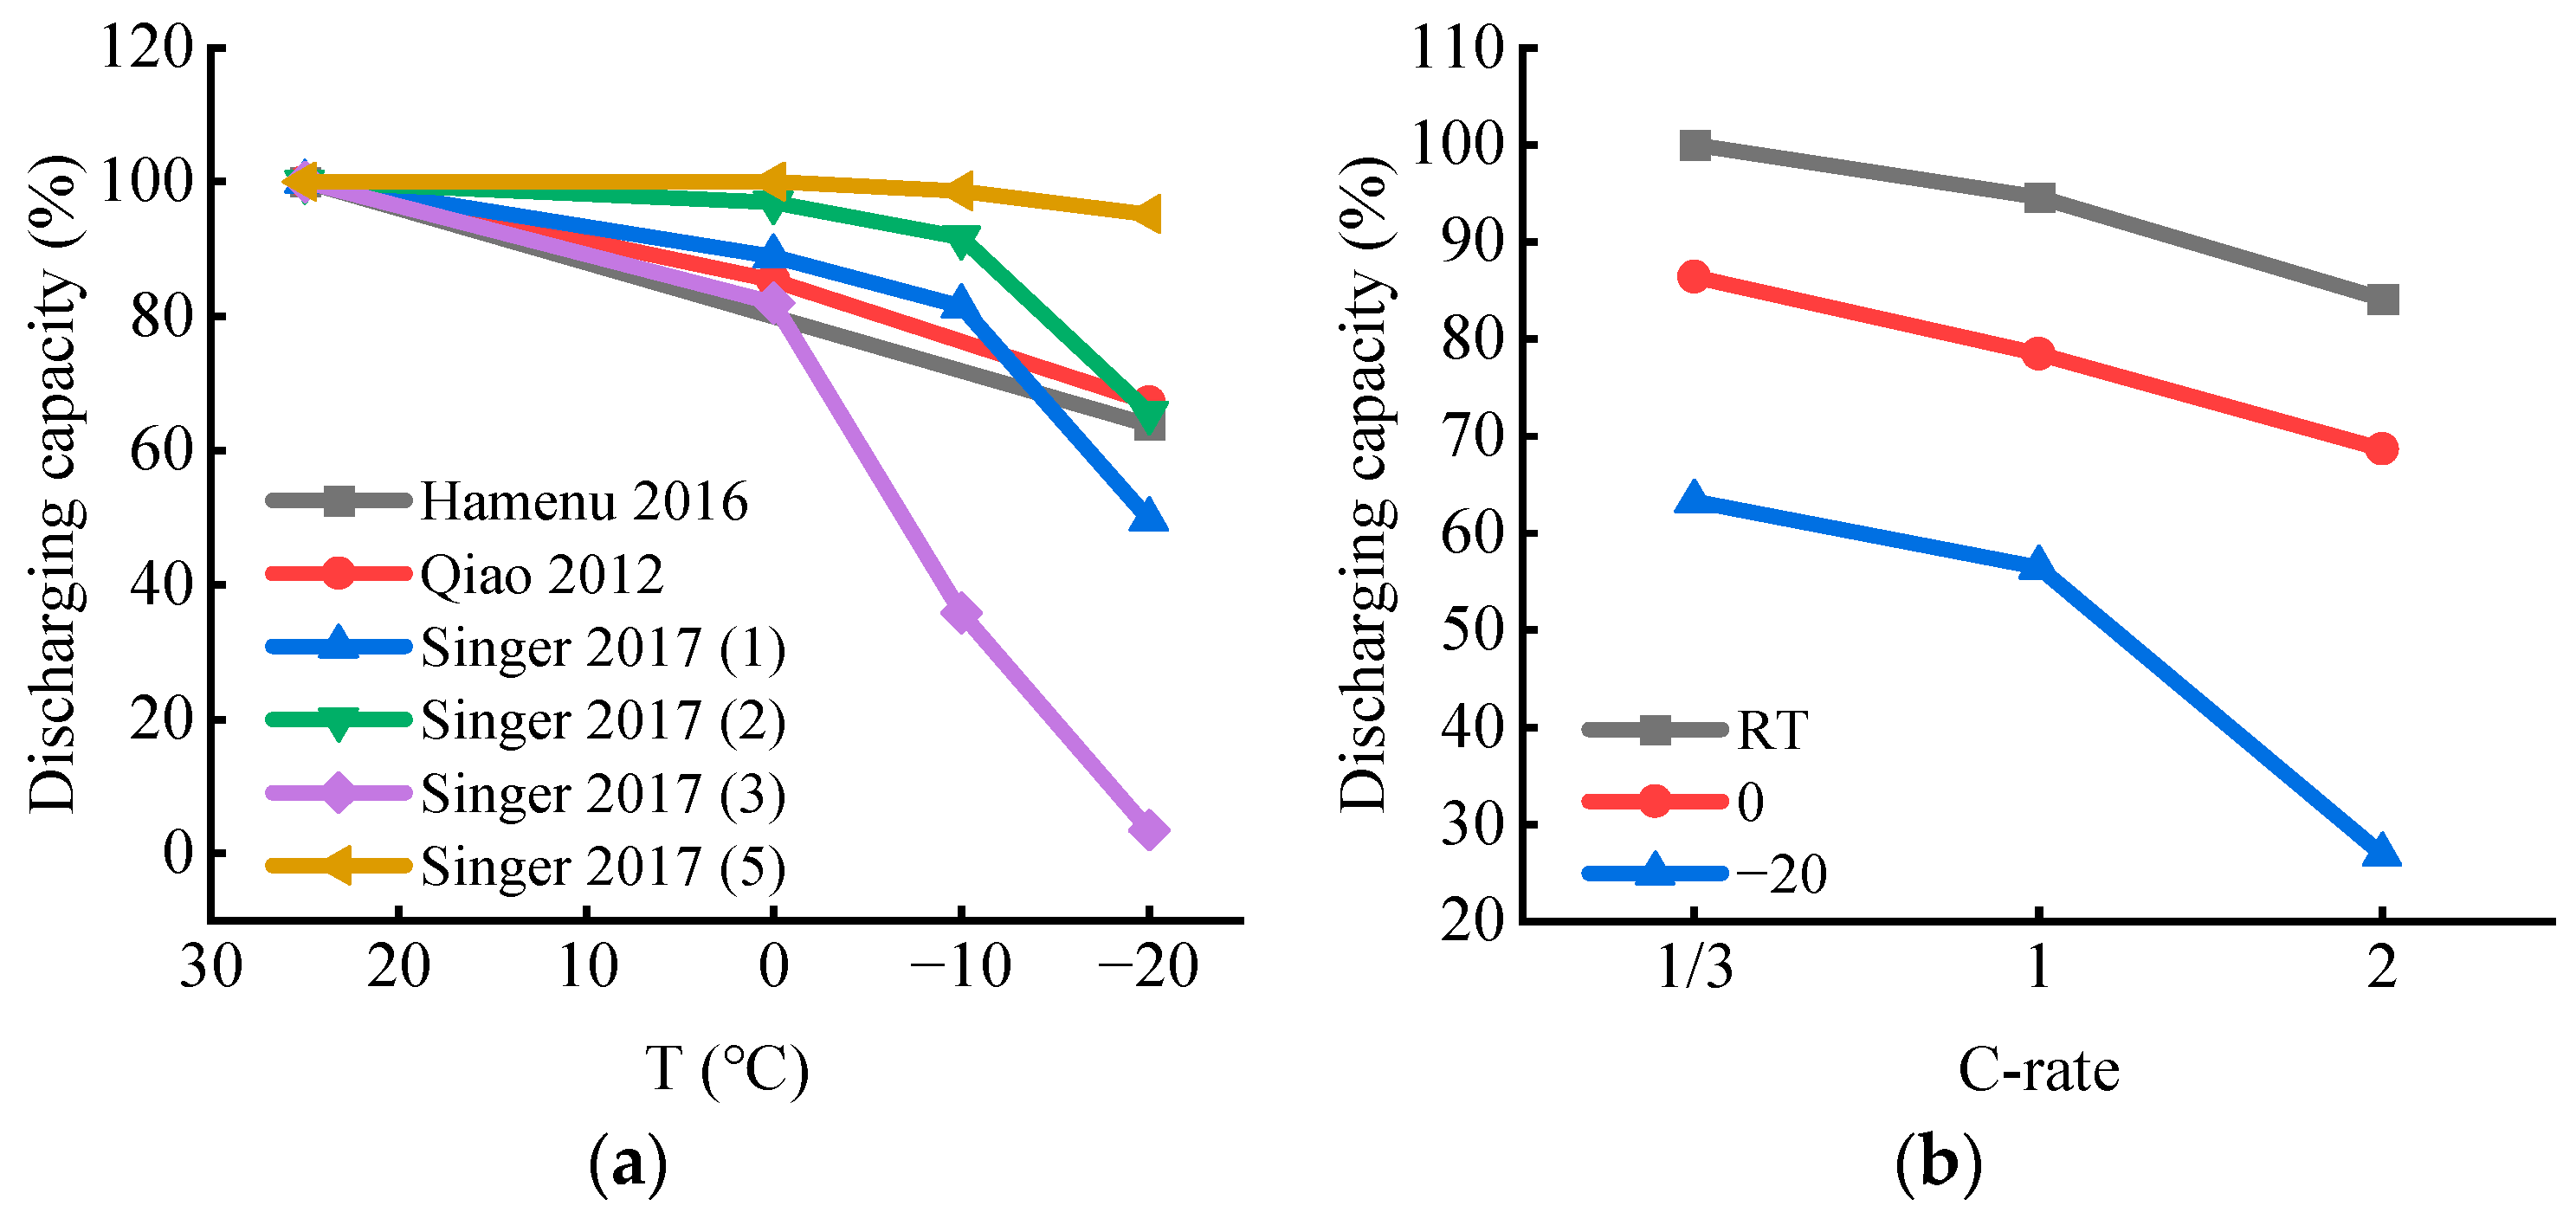
2.2. Discharging
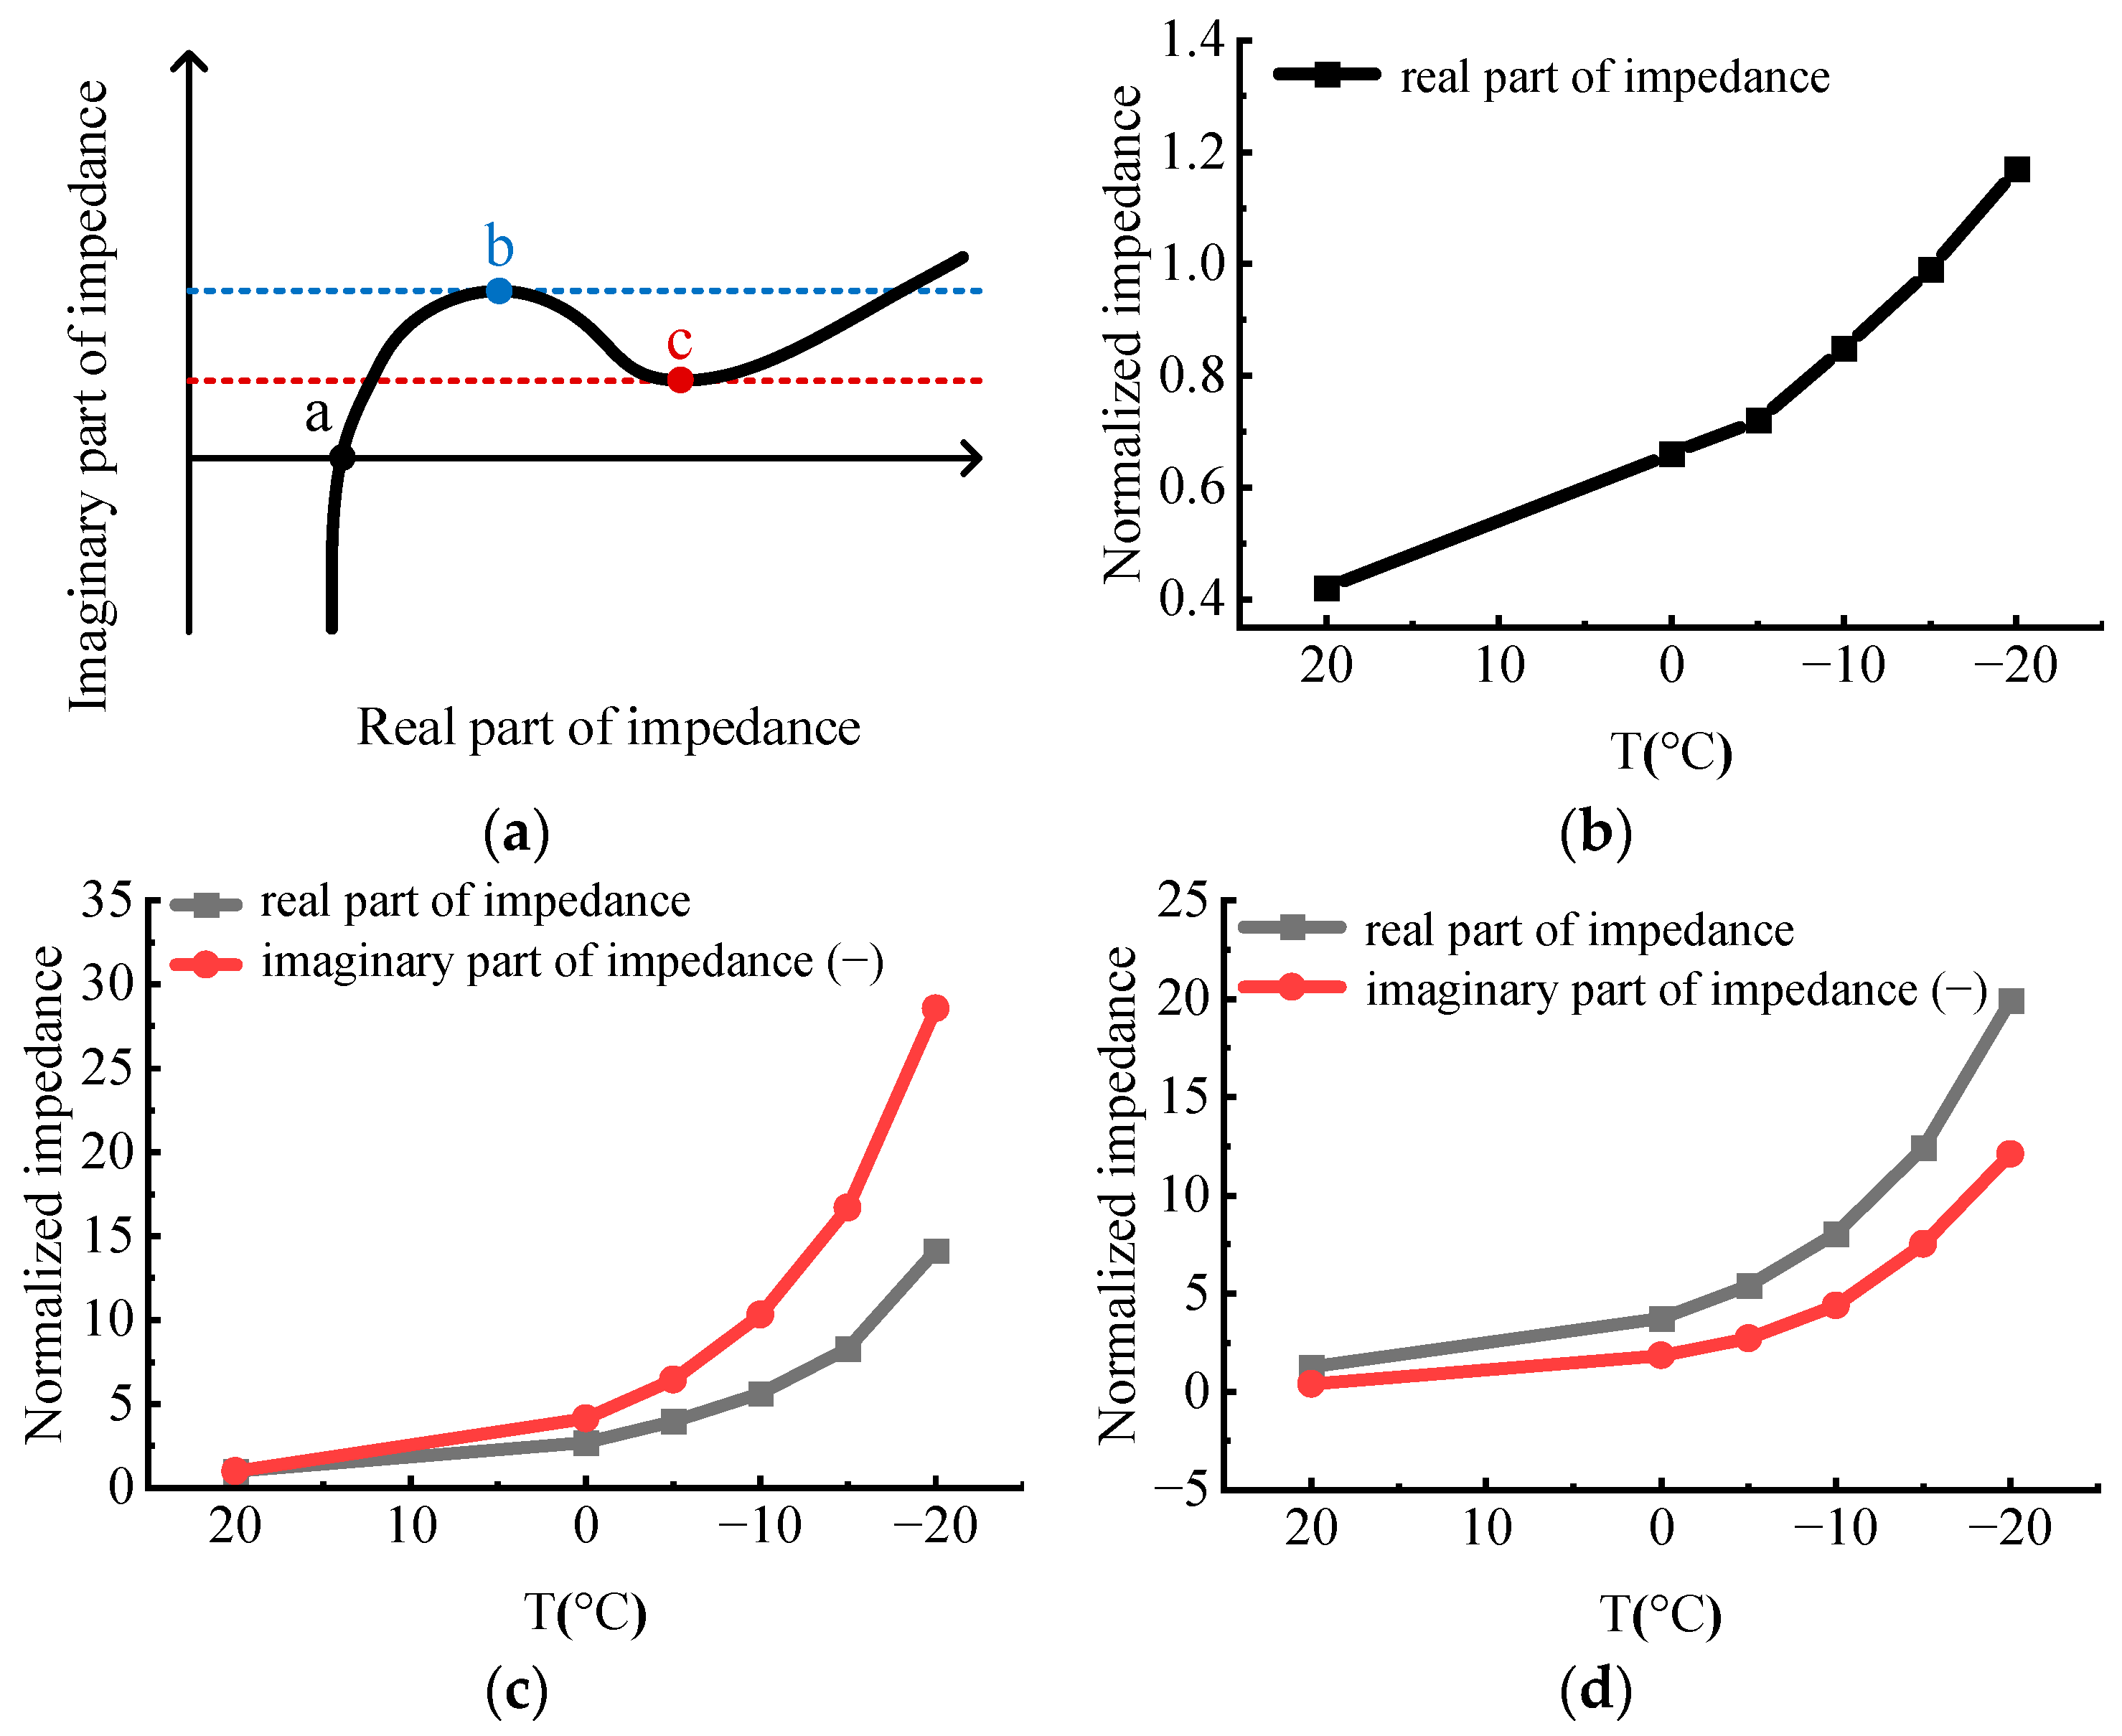
2.3. Resistance (EIS)
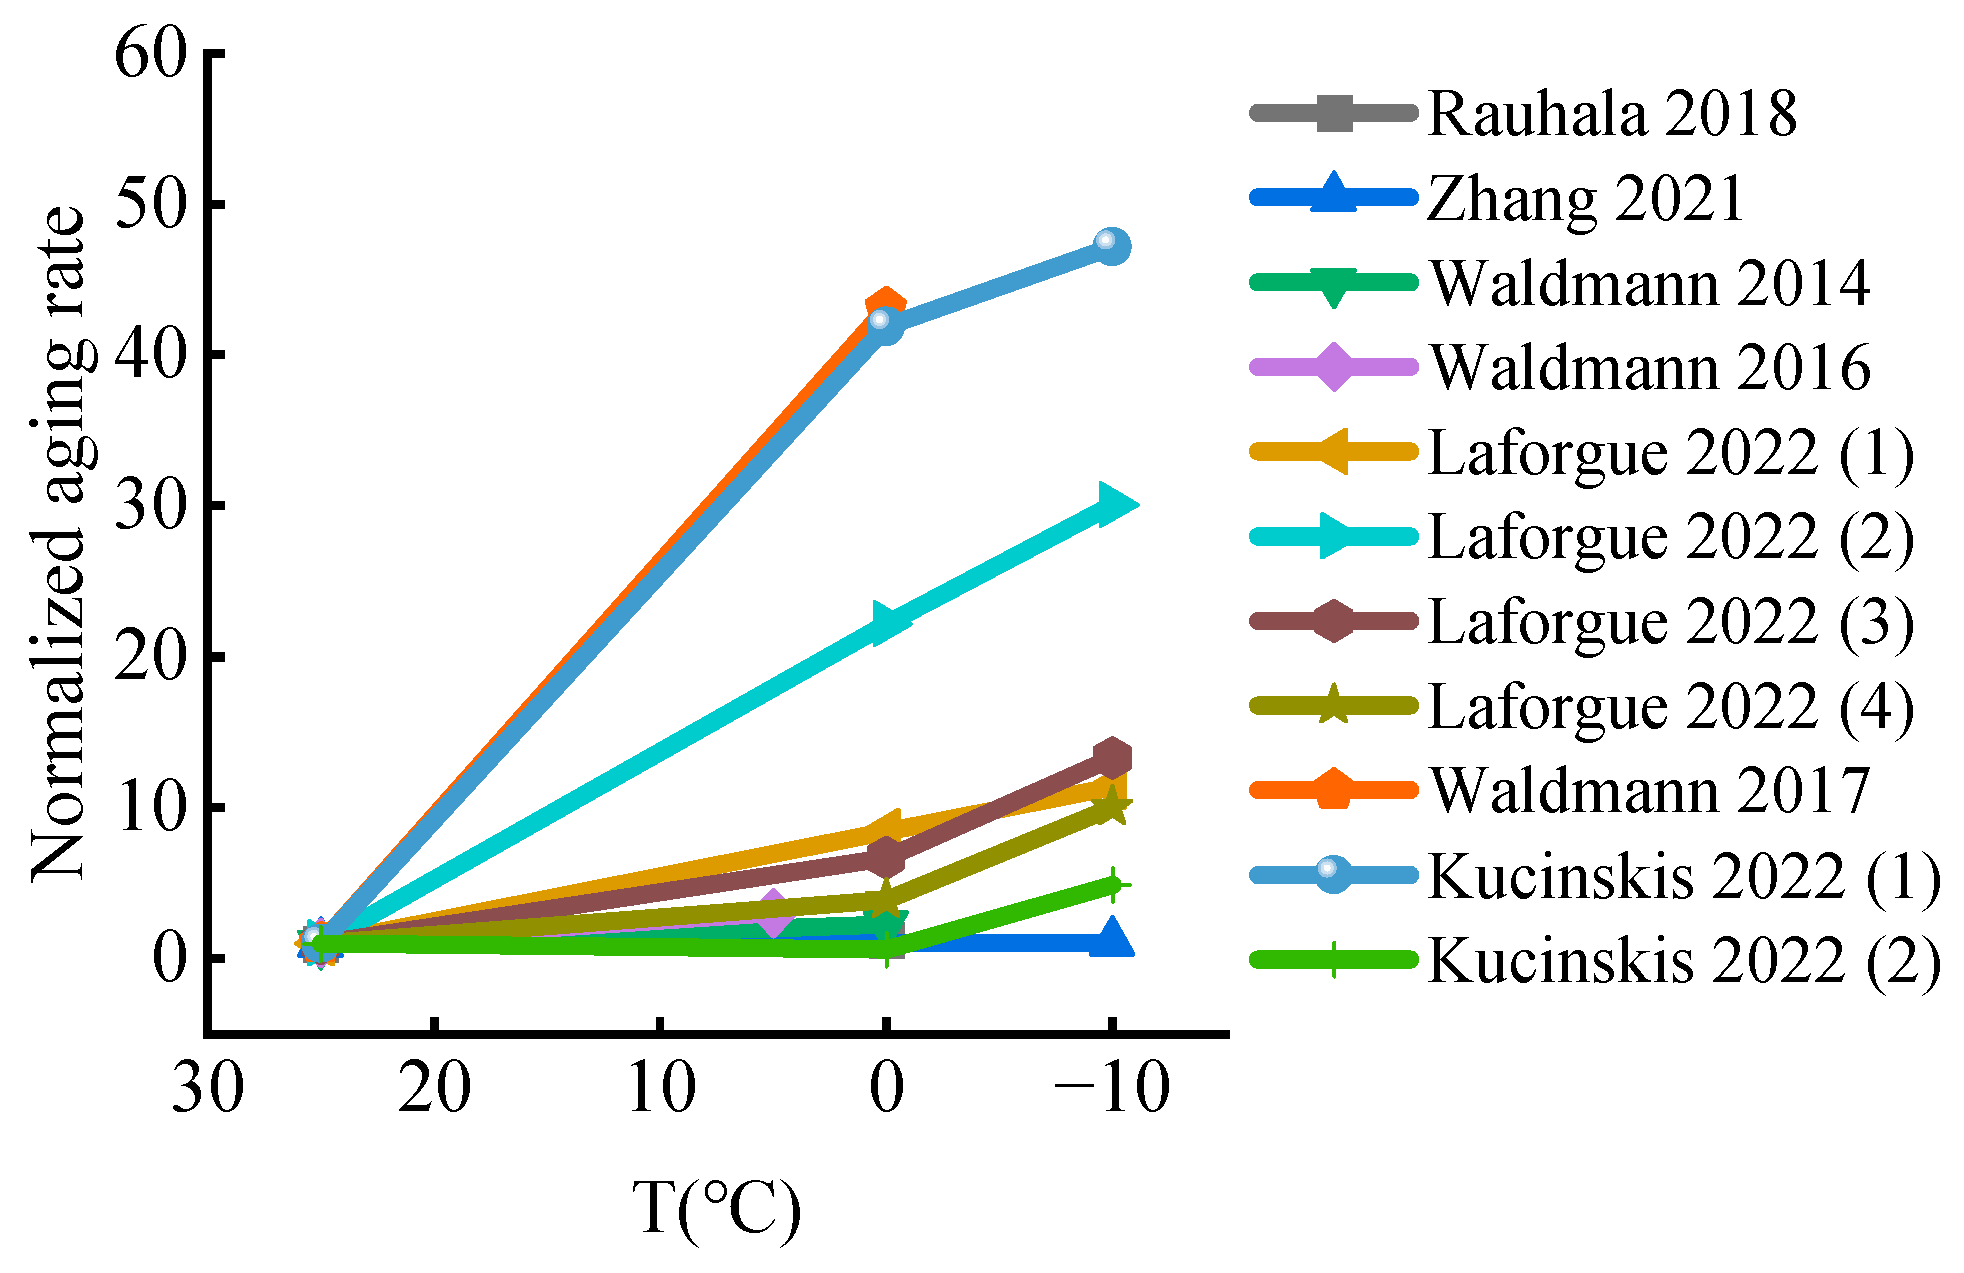
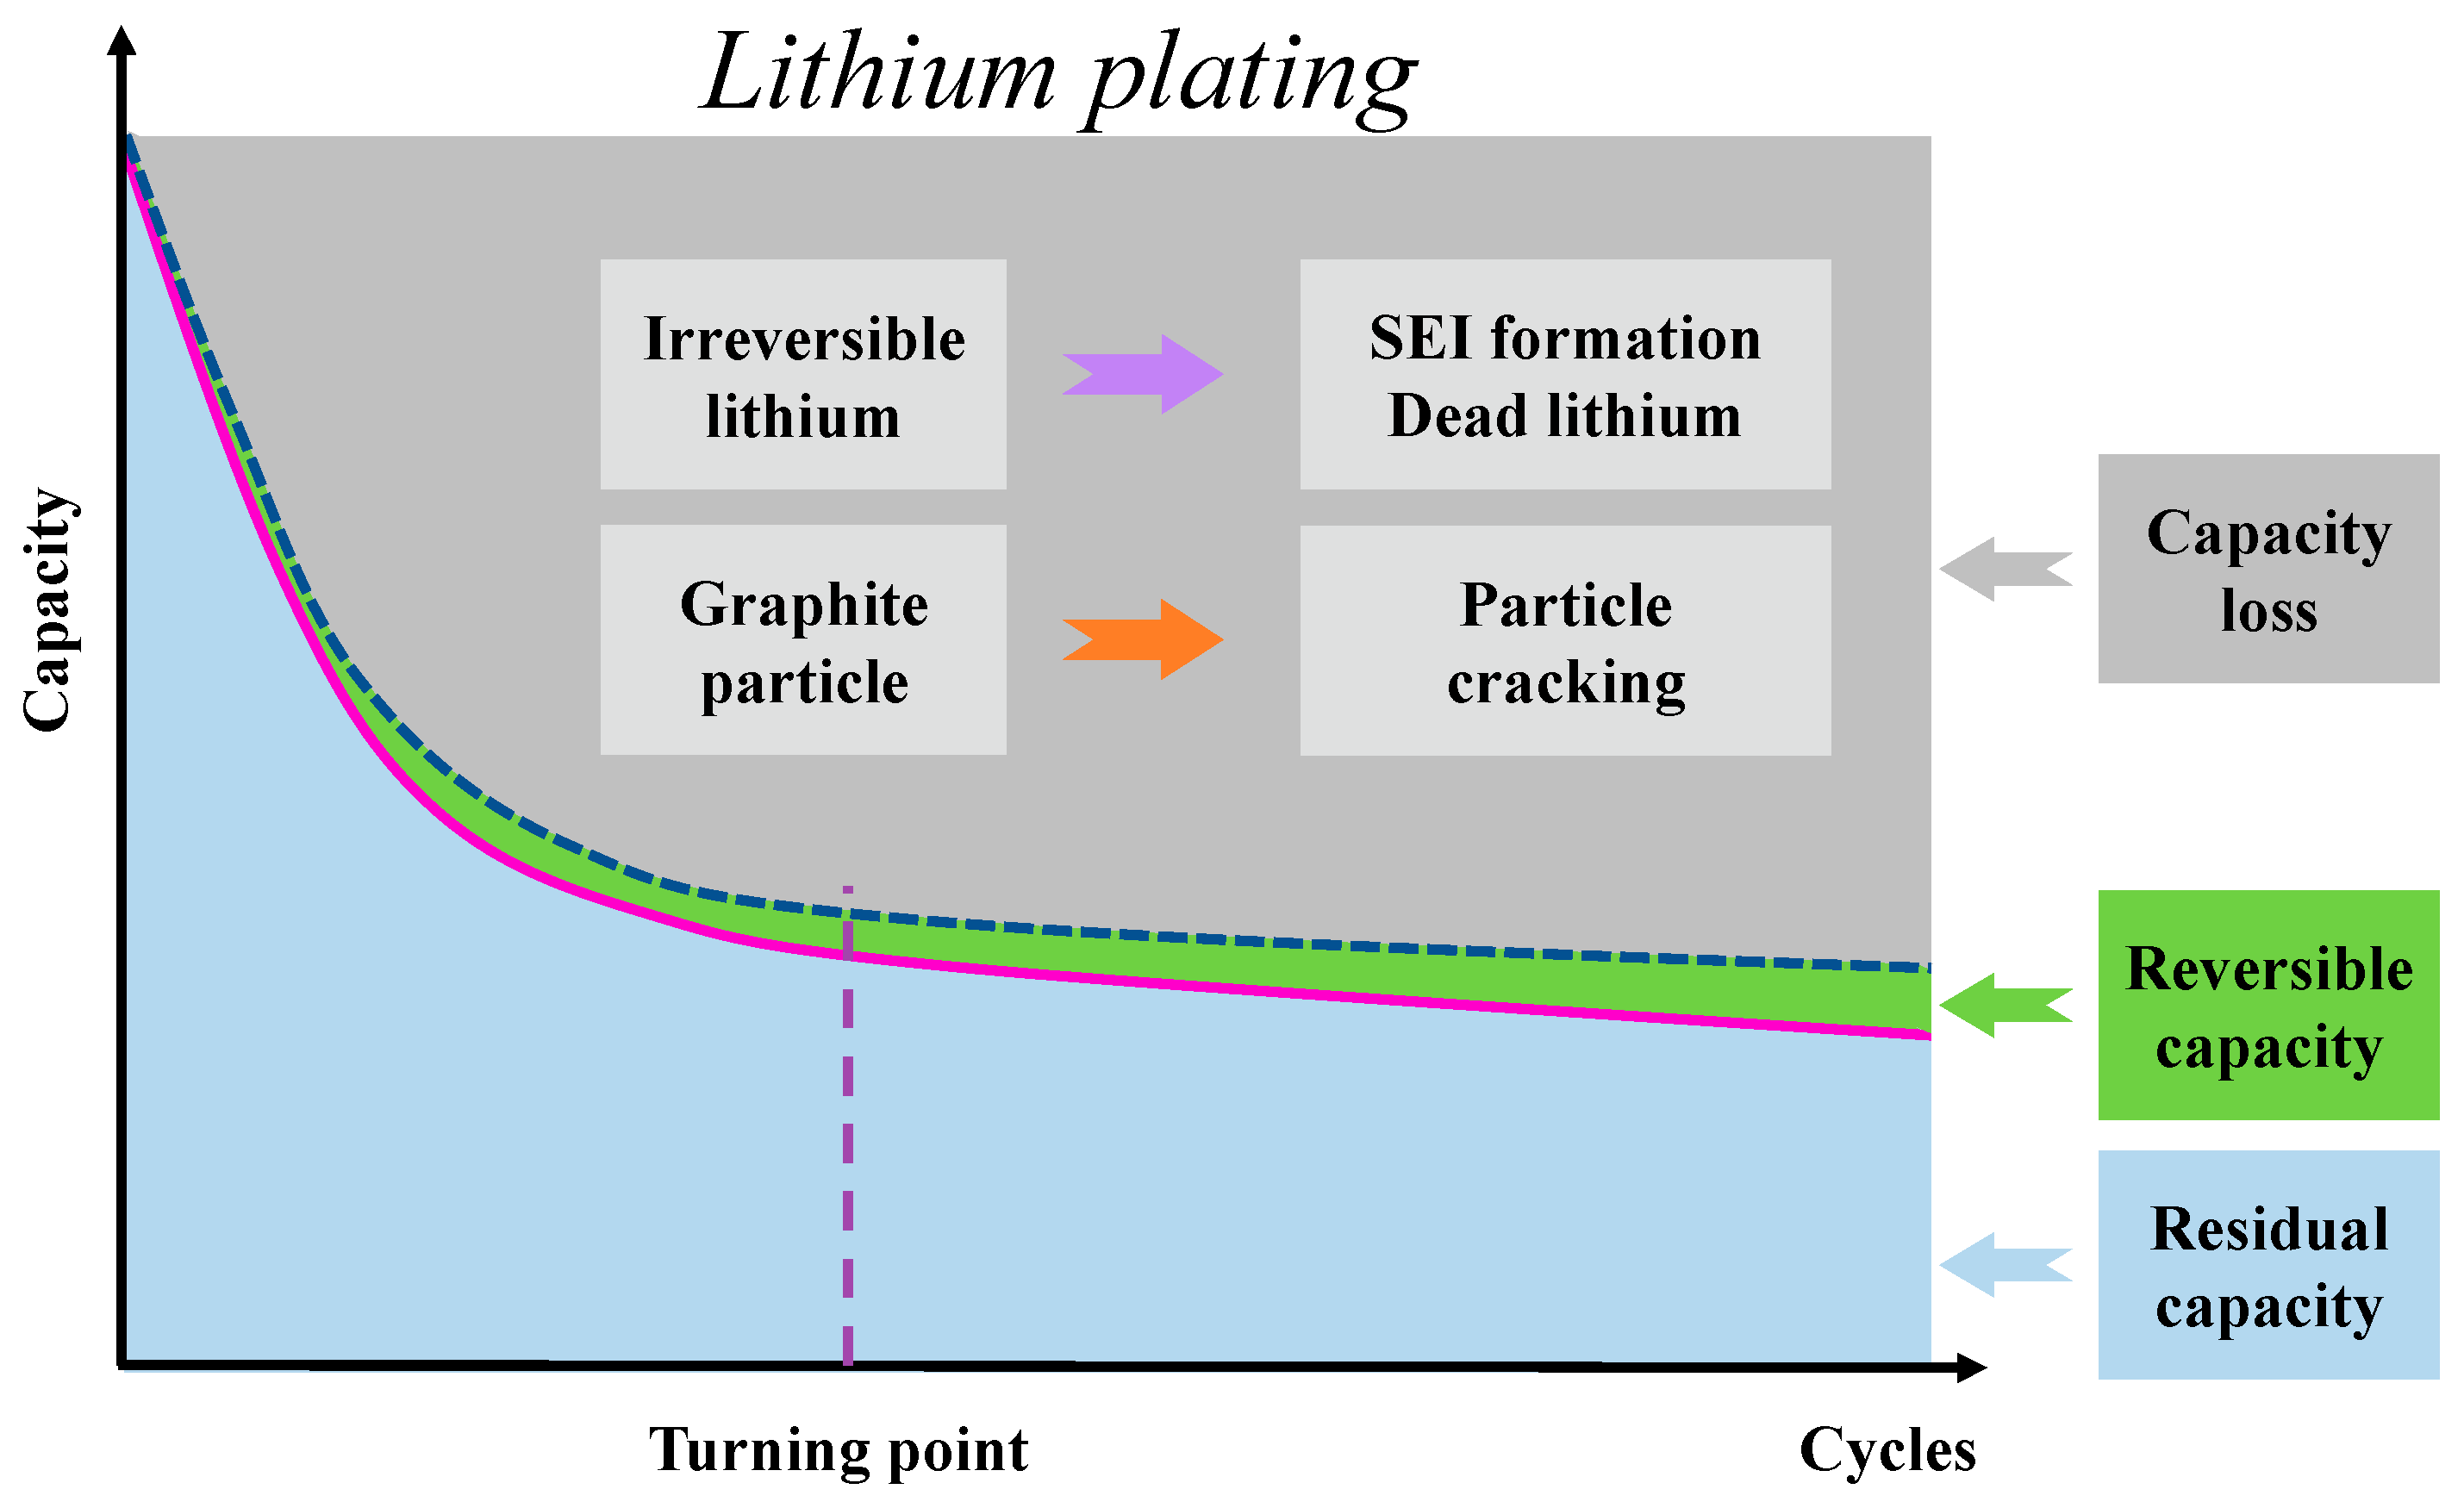
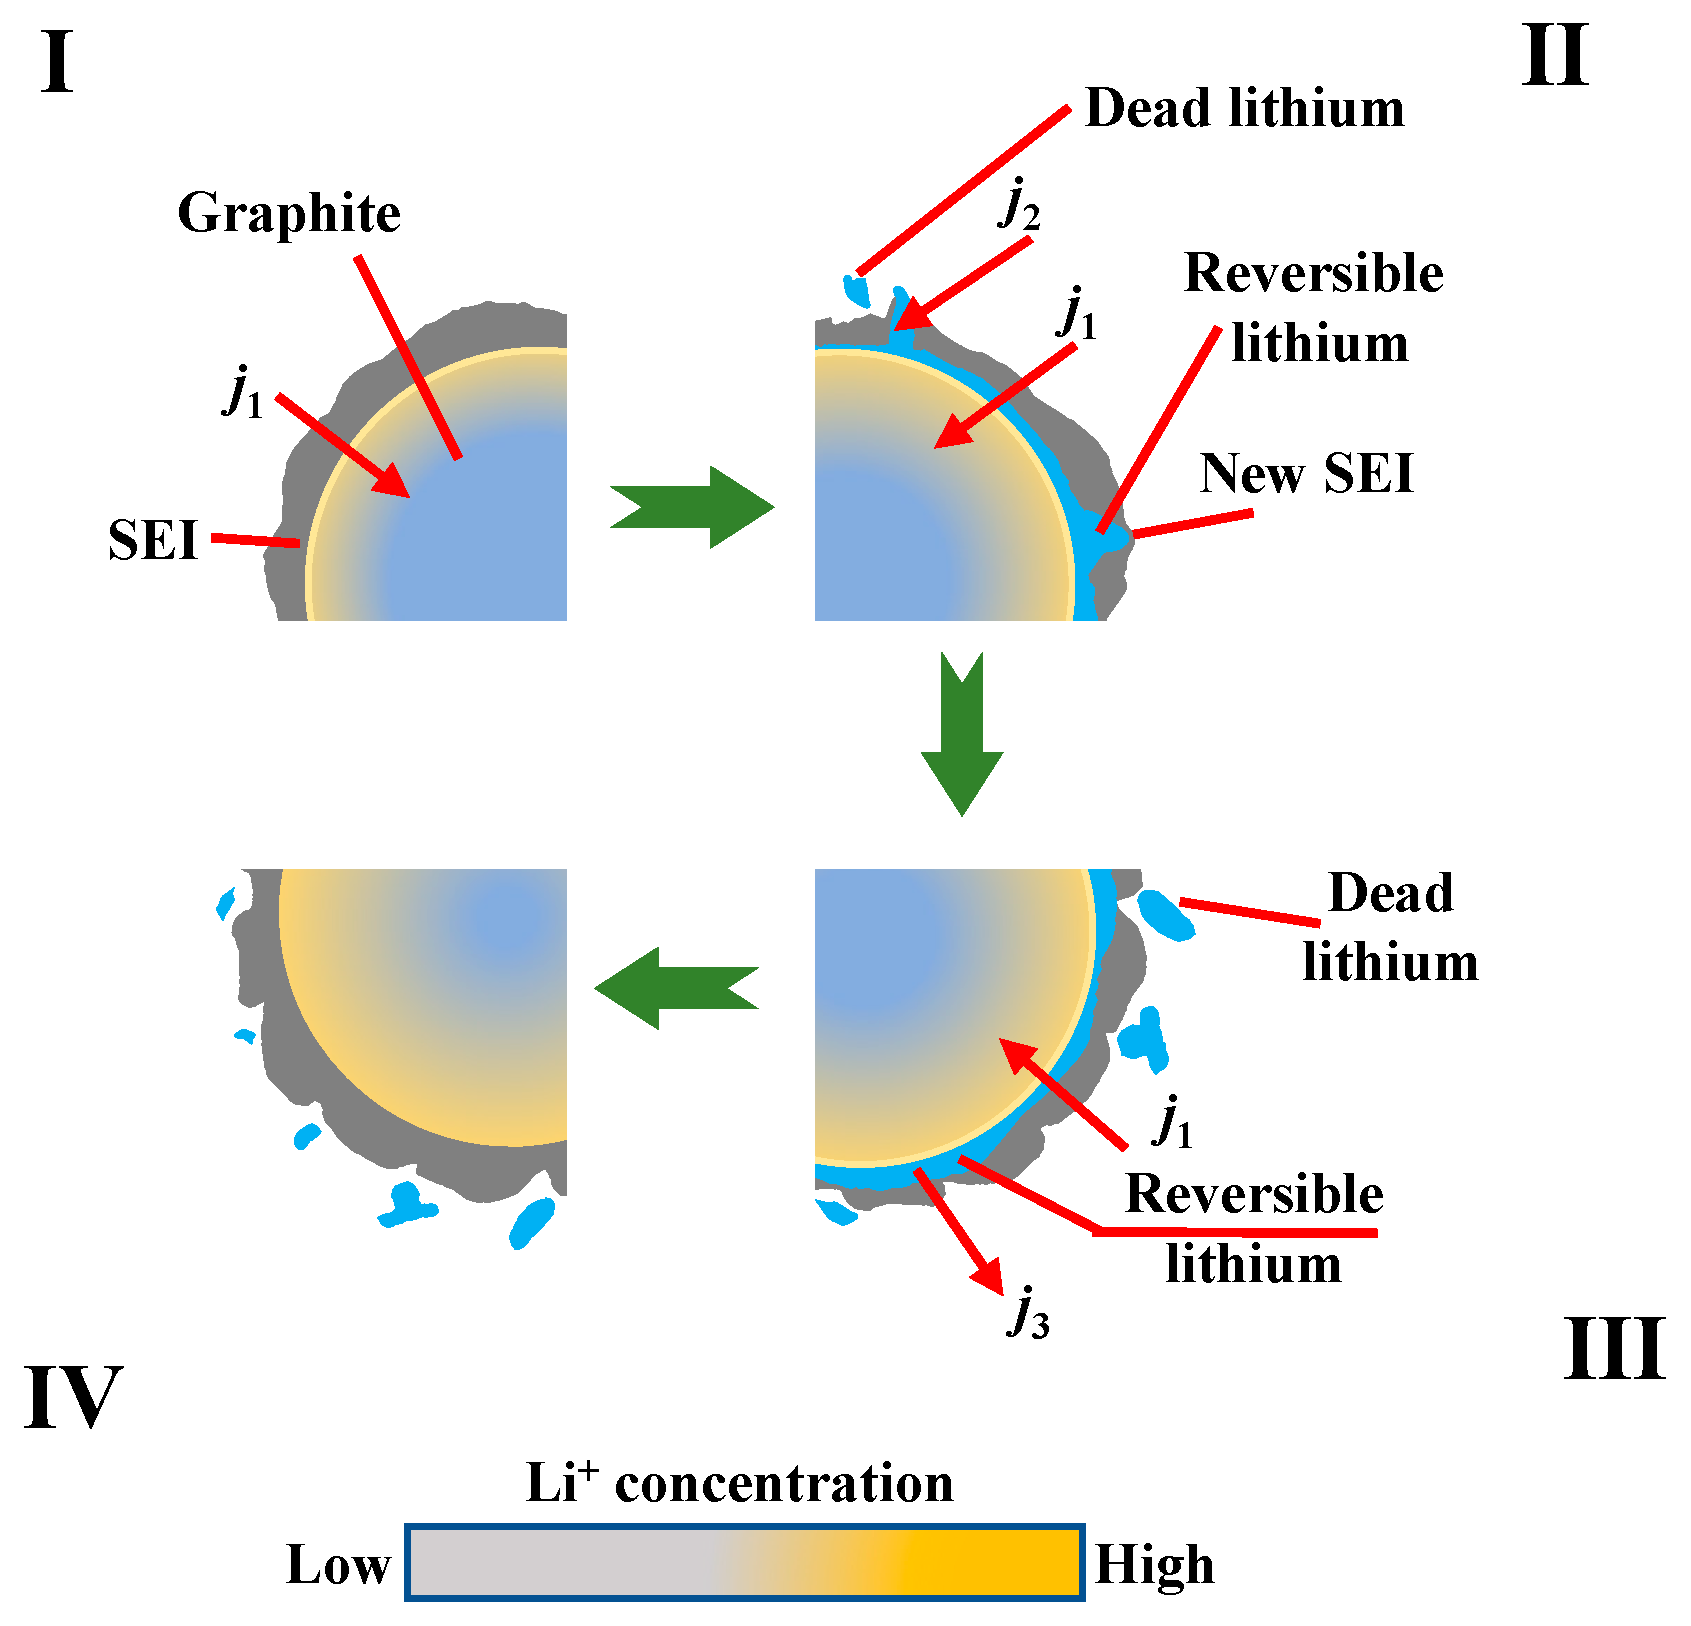
2.4. Degradation

| Nominal Capacity (Ah) | Battery Type | Material | T (°C) | Cha. C-Rate | Disch. C-Rate | Cycles at the 80% Lifetime | Aging Rate (%/Cycle) | Aging Rate in the First 100 Cycles (%/Cycle) | Ref. |
|---|---|---|---|---|---|---|---|---|---|
| 2.500 | Cylindrical 26650 | LFP | −22 | 1 (100% DOD) | 0.5 | 92 | 0.140 | 0.224 | [72] |
| 1 (80% DOD) | 99 | 0.123 | 0.202 | ||||||
| 0.5 (80% DOD) | 140 | 0.104 | 0.150 | ||||||
| 3.100 | 18650 | - | −10 | 0.2 | 0.2 | - | 0.049 | 0.060 | [66] |
| 1 | - | 0.049 | 0.059 | ||||||
| 0.5 | 0.2 | - | 0.102 | 0.113 | |||||
| 1 | 135 | 0.147 | 0.153 | ||||||
| 1 | 0.2 | 84 | 0.180 | 0.223 | |||||
| 1 | 49 | 0.340 | 0.352 | ||||||
| 2.300 | High-quality Cylindrical 26650 | LFP | RT a | 1 | - | 2594 | 0.008 | - | [56] [70] |
| 0 | 1 | - | 2072 | 0.010 | - | ||||
| −18 | 1 | - | 193 | 0.104 | - | ||||
| 37.000 | Large format Prismatic | NCM | RT a | 2 | 2 | 186 | 0.041 | 0.109 | [71] |
| −10 | 2 | 2 | 184 | 0.045 | 0.125 | ||||
| 1.500 | High-power 18650 | NCM + LMO | RT a | 1 | 1 | - | 0.013 b | - | [73] |
| 0 | 1 | 1 | - | 0.038 b | - | ||||
| −10 | 1 | 1 | - | 0.102 b | - | ||||
| −20 | 1 | 1 | - | 0.198 b | - | ||||
| 39.000 | Large format Pouch bag | NCM | RT a | - | - | - | 0.004 | 0.003 | [74] |
| 0 | - | - | - | 0.009 | 0.012 | ||||
| 16.000 | Pouch | NCM | RT a | 1 | - | - | 0.004 | - | [75] |
| 2 | - | - | 0.008 | - | |||||
| 5 | 1 | - | - | 0.012 | - | ||||
| 2 | - | - | 0.018 | - | |||||
| 3.000 | 18650 | NCM | RT a | 1/3 | 1/3 | - | 0.043 | 0.080 | [69] |
| 10 | 1/3 | 1/3 | - | 0.157 | 0.100 | ||||
| 0 | 1/3 | 1/3 | - | 0.361 | 0.300 | ||||
| −10 | 1/3 | 1/3 | - | 0.490 | 0.490 | ||||
| 2.600 | 18650 | NCA | RT a | 1/3 | 1/3 | - | 0.010 | 0.030 | |
| 10 | 1/3 | 1/3 | - | 0.017 | 0.050 | ||||
| 0 | 1/3 | 1/3 | - | 0.222 | 0.200 | ||||
| −10 | 1/3 | 1/3 | - | 0.301 | 0.320 | ||||
| 1.500 | 18650 | NCM | RT a | 1/3 | 1/3 | - | 0.003 | 0.000 | |
| 10 | 1/3 | 1/3 | - | 0.013 | 0.000 | ||||
| 0 | 1/3 | 1/3 | - | 0.020 | 0.020 | ||||
| −10 | 1/3 | 1/3 | - | 0.040 | 0.040 | ||||
| 1.100 | 18650 | LFP | RT a | 1/3 | 1/3 | - | 0.007 | 0.000 | |
| 10 | 1/3 | 1/3 | - | 0.007 | 0.000 | ||||
| 0 | 1/3 | 1/3 | - | 0.027 | 0.010 | ||||
| −10 | 1/3 | 1/3 | - | 0.070 | 0.080 | ||||
| 3.250 | 18650 | NCA | RT a | 0.5 | 0.5 | 290 | 0.062 | - | [76] |
| 0 | 0.5 | 0.5 | 3 | 2.672 | - | ||||
| 5.000 | High-energy 21700 | NCA + LNO | RT a | 0.2 | - | 662 | 0.030 | - | [57] |
| 0.4 | - | 378 | 0.053 | - | |||||
| 0.6 | - | 115 | 0.174 | - | |||||
| 15 | 0.2 | - | 332 | 0.060 | - | ||||
| 0.4 | - | 117 | 0.171 | - | |||||
| 0.6 | - | 54 | 0.370 | - | |||||
| 0 | 0.2 | - | 18 | 1.111 | - | ||||
| 0.4 | - | 9 | 2.222 | - | |||||
| 0.6 | - | 10 | 2.000 | - | |||||
| −10 | 0.2 | - | 6 | 3.333 | - | ||||
| 0.4 | - | 8 | 2.500 | - | |||||
| 11.500 | Large format | LFP | −10 | 0.1 | - | - | 0.002 | - | [7] |
| 0.25 | - | - | 0.016 | - | |||||
| 0.3 | - | - | 0.107 | - | |||||
| 0.33 | - | - | 0.185 | - | |||||
| 0.5 | - | 47 | 0.433 | - |
3. Low-Temperature Modeling
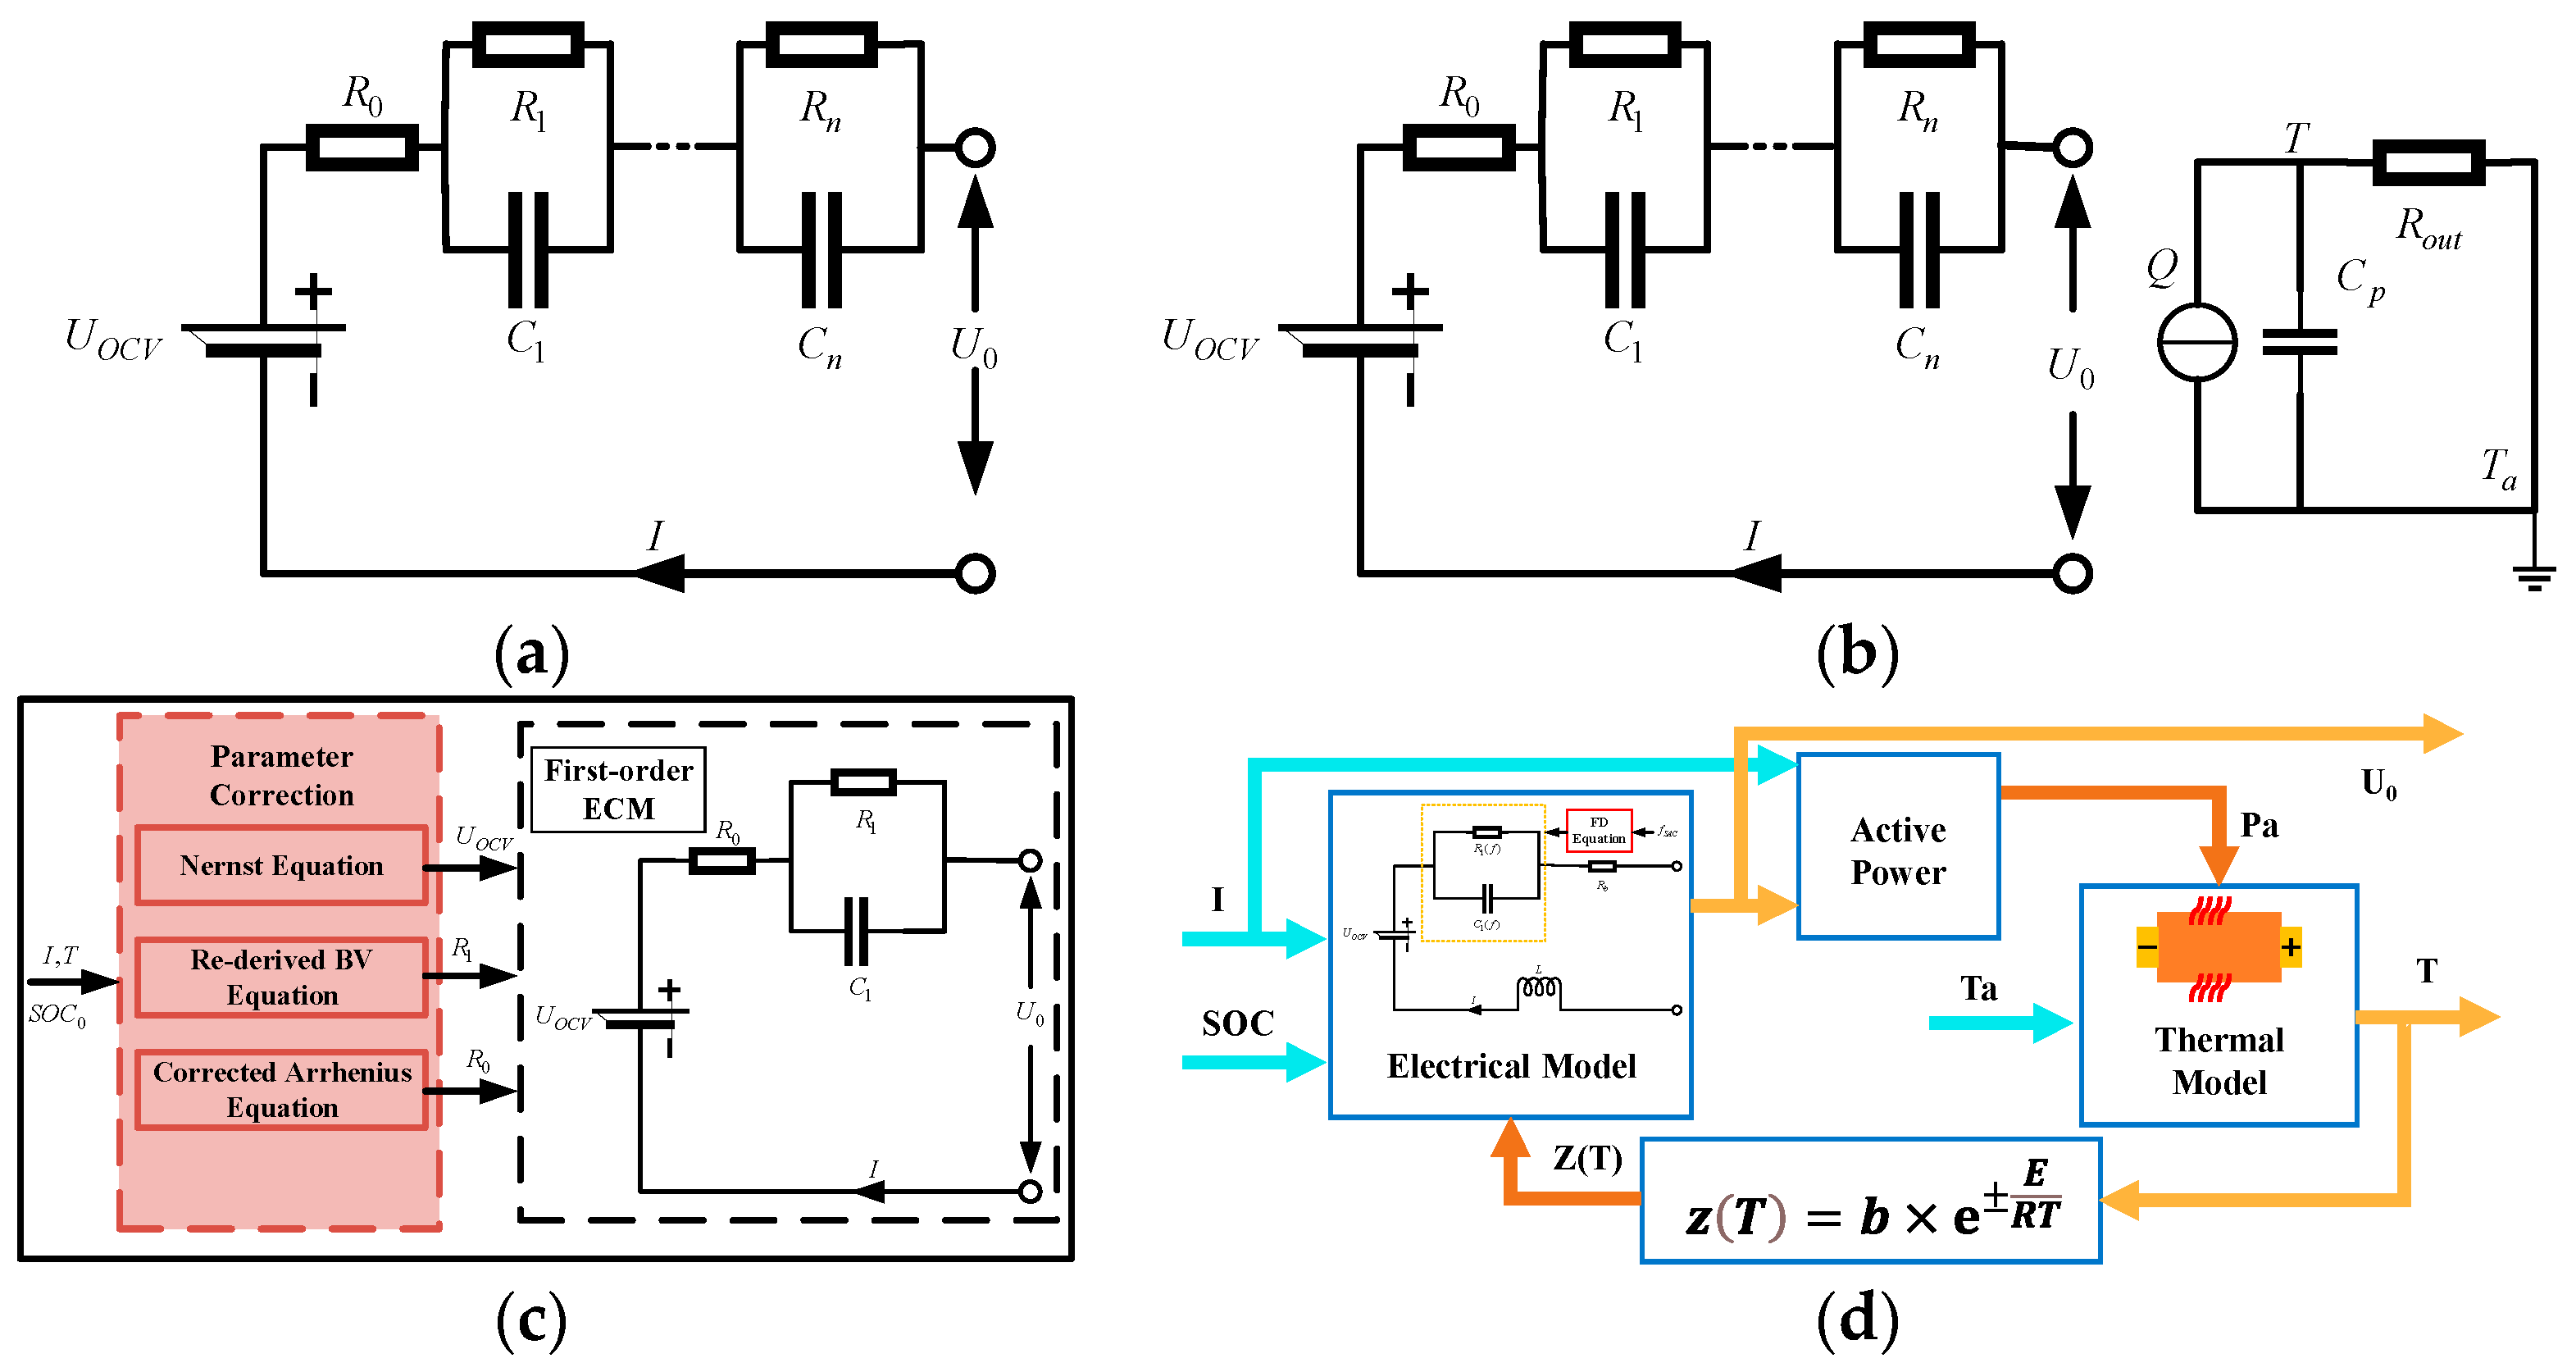
3.1. Equivalent Circuit Model (ECM)
3.2. Electrochemical Model

| Material | Model | Parameterization Conditions | Modeling Considerations | Validation Conditions | Modeling Accuracy Evaluation | Ref. | |||
|---|---|---|---|---|---|---|---|---|---|
| LCO | Figure 12c | T | −20~40 °C | −20~0 °C, 0.3 C-rate | ME 25.8~72.9 mV | SD b 7.79~15.1 mV | [85] | ||
| LCO a LNO NCM NCO LMO | Figure 12c | T | <−30 °C | Electrolyte conductivity is considered as a function of temperature and concentration. | LCO | −40 °C | RMSE | 150 mV | [84] |
| LNO | −40 °C | 110 mV | |||||||
| NCM | −40 °C | 100 mV | |||||||
| NCO | −40 °C | 130 mV | |||||||
| LMO | −30 °C | 90 mV | |||||||
| LFP | Figure 12c | T | 0~55 °C | The modeling results show that the lithium-ion concentration gradient in liquid and solid phases is greatly affected by temperature, especially at low temperatures. | [86] | ||||
| LCO | Figure 12d | T | −20~45 °C | −20~25 °C | MAE 37.8~59.3 mV | RMSE 39.9~79.2 mV | [89] | ||
| NMC | Figure 12b | T I | −25~40 °C 0.1~6 C-rate | 15 °C | RMSE 15 mV | ME 40 mV | [67] | ||
| NMC | Figure 12c | T | −5~55 °C | −5~55 °C | MAE 19.68~26.56 mV | MAE 0.0433~0.0745 °C | [87] | ||
| NMC | Figure 12b | T I | −25~40 °C 0.1~6 C-rate | 0 °C | MAE c 2.9 mV | [88] | |||
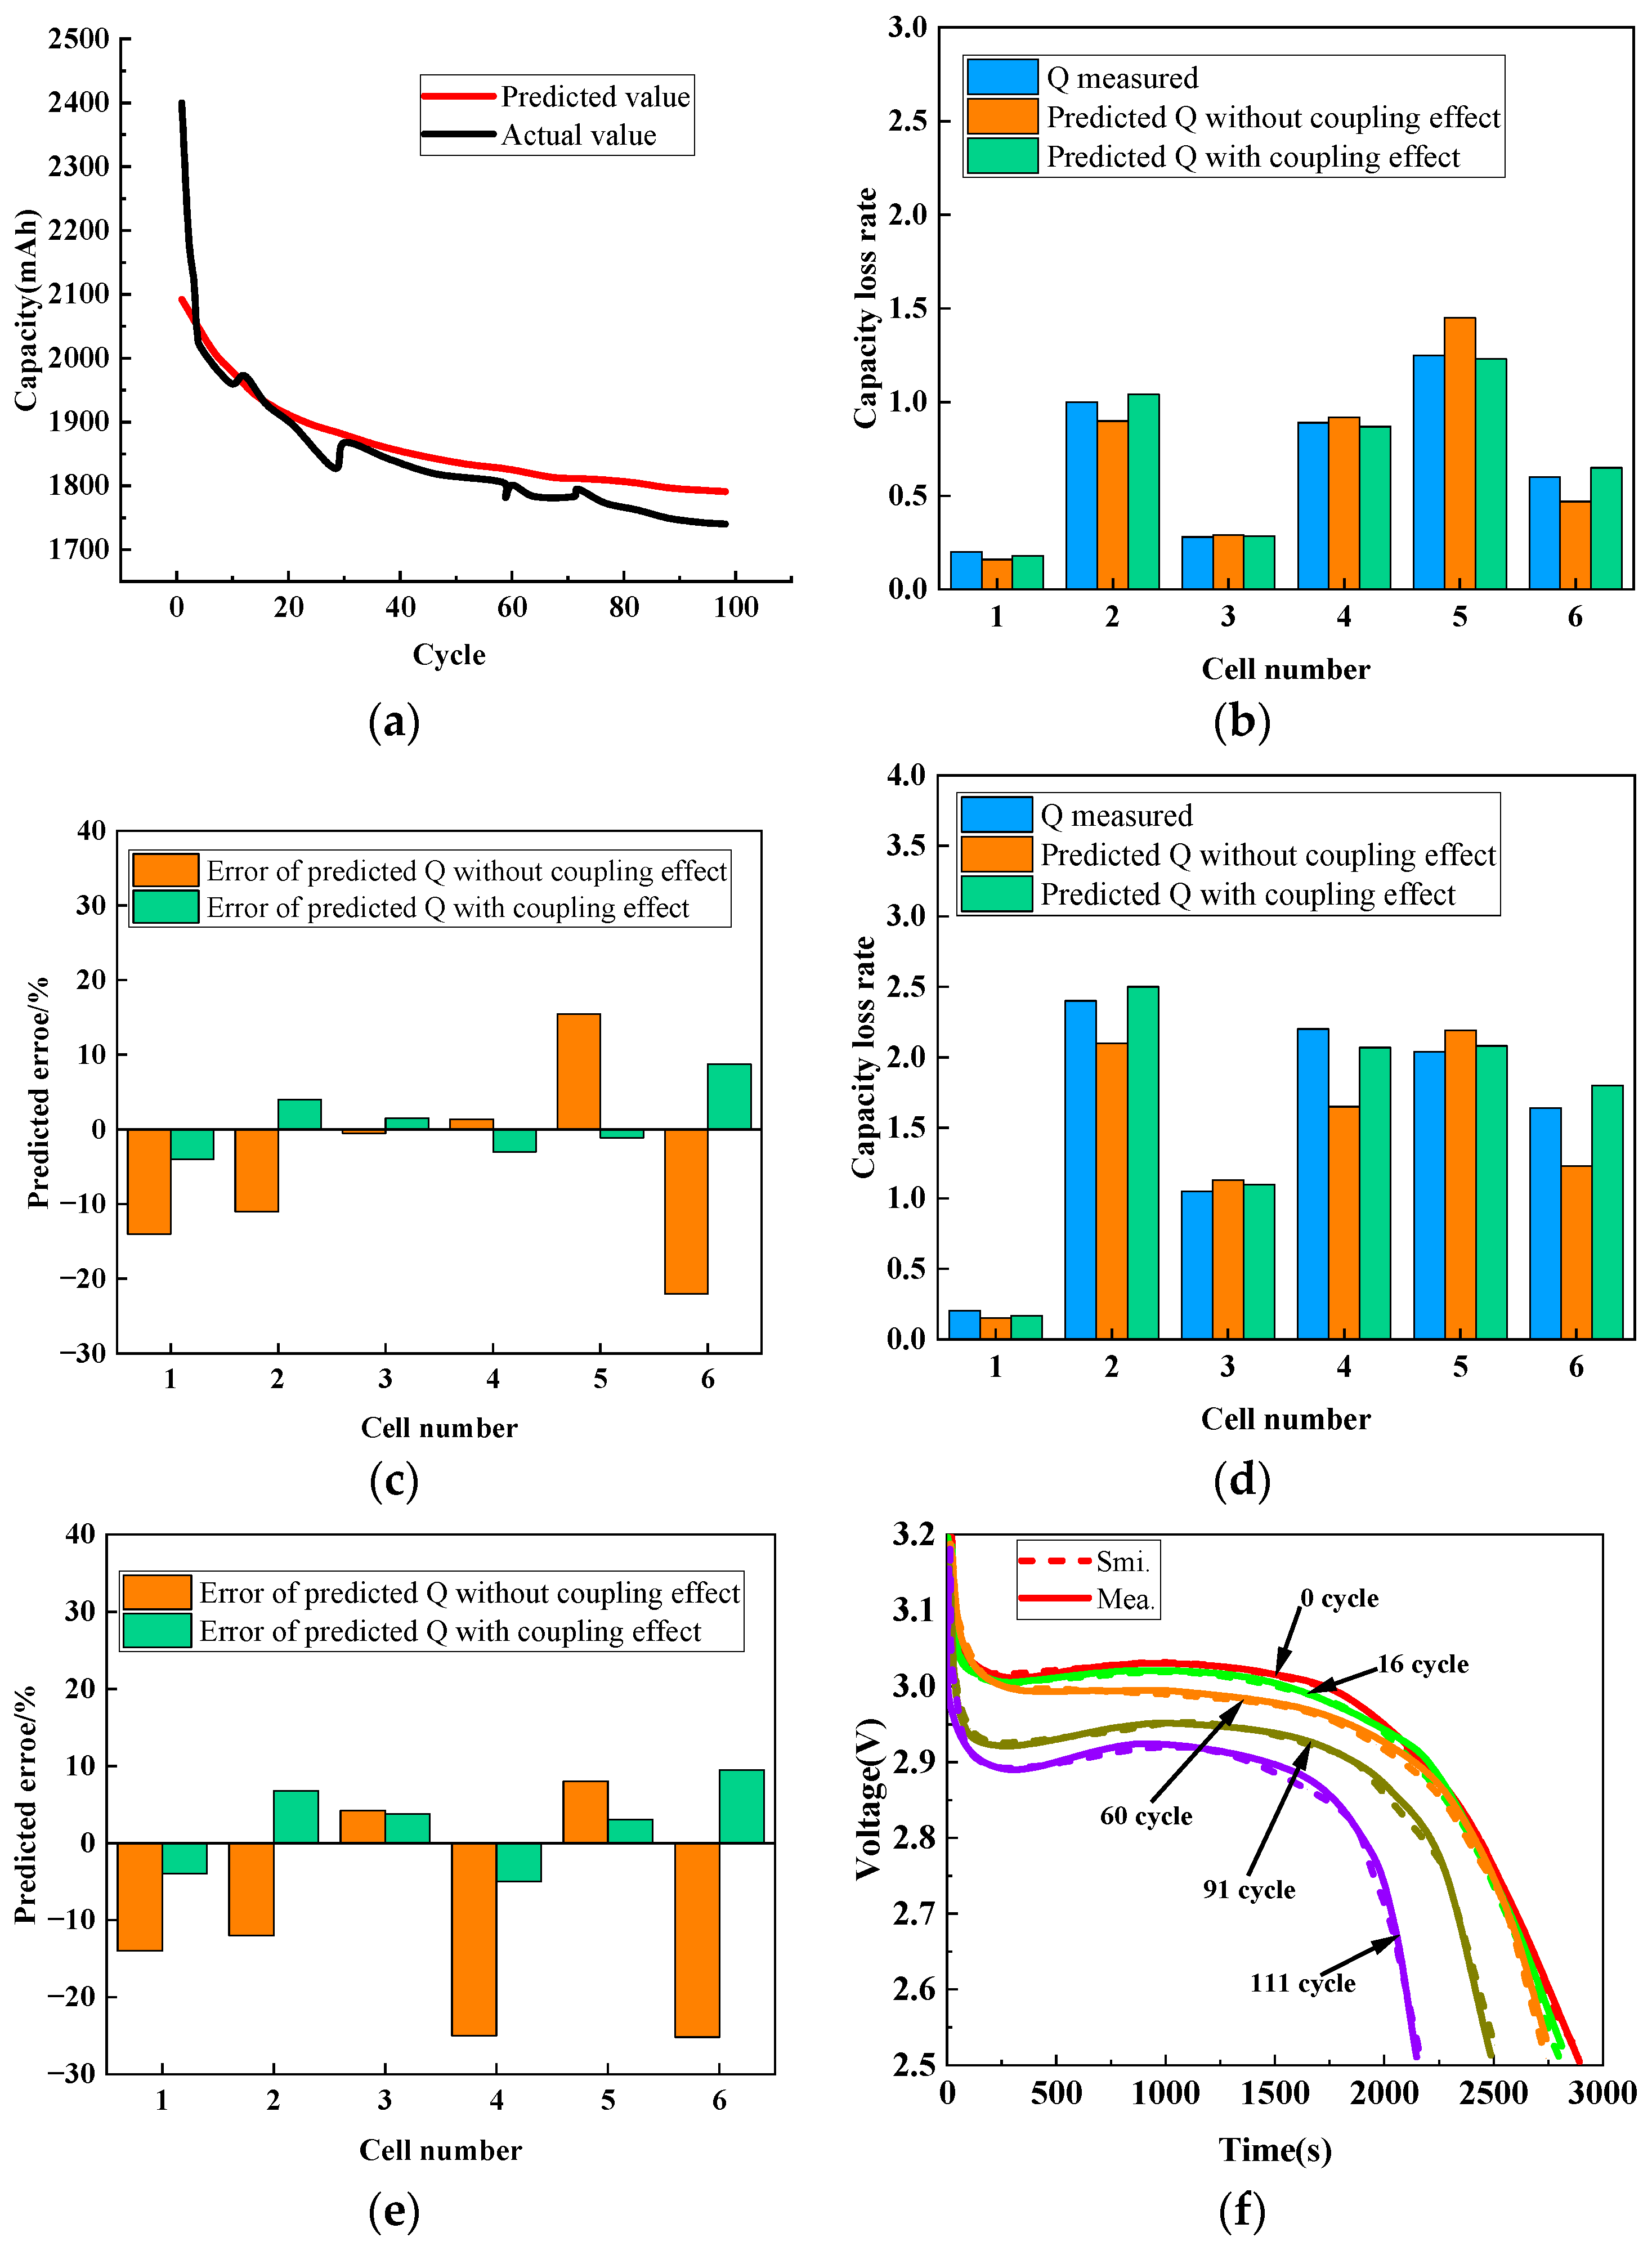
3.3. Aging Model
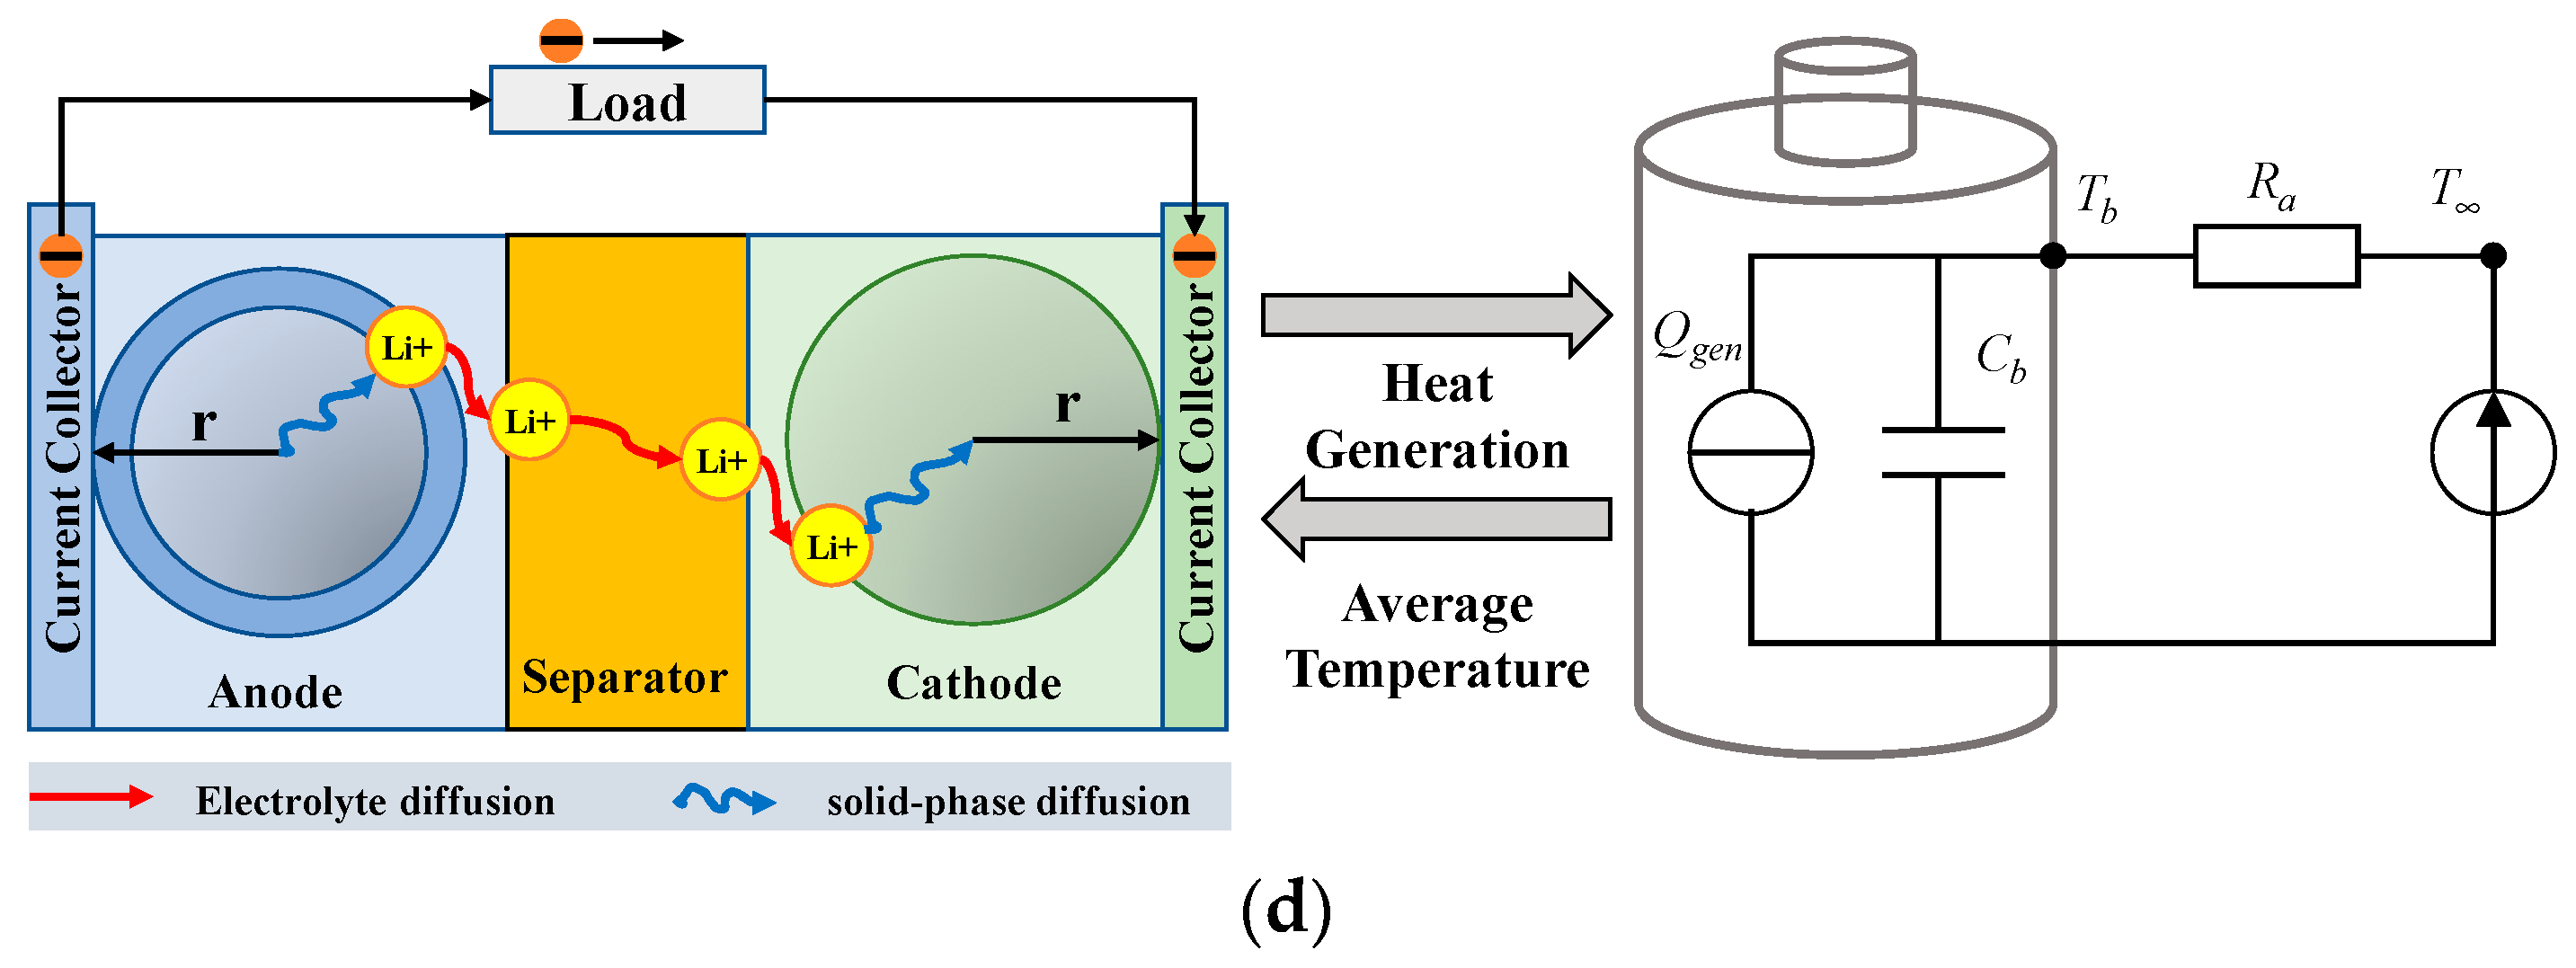
4. Low-Temperature Heating
4.1. Internal Heating
4.1.1. Current-Excited Heating
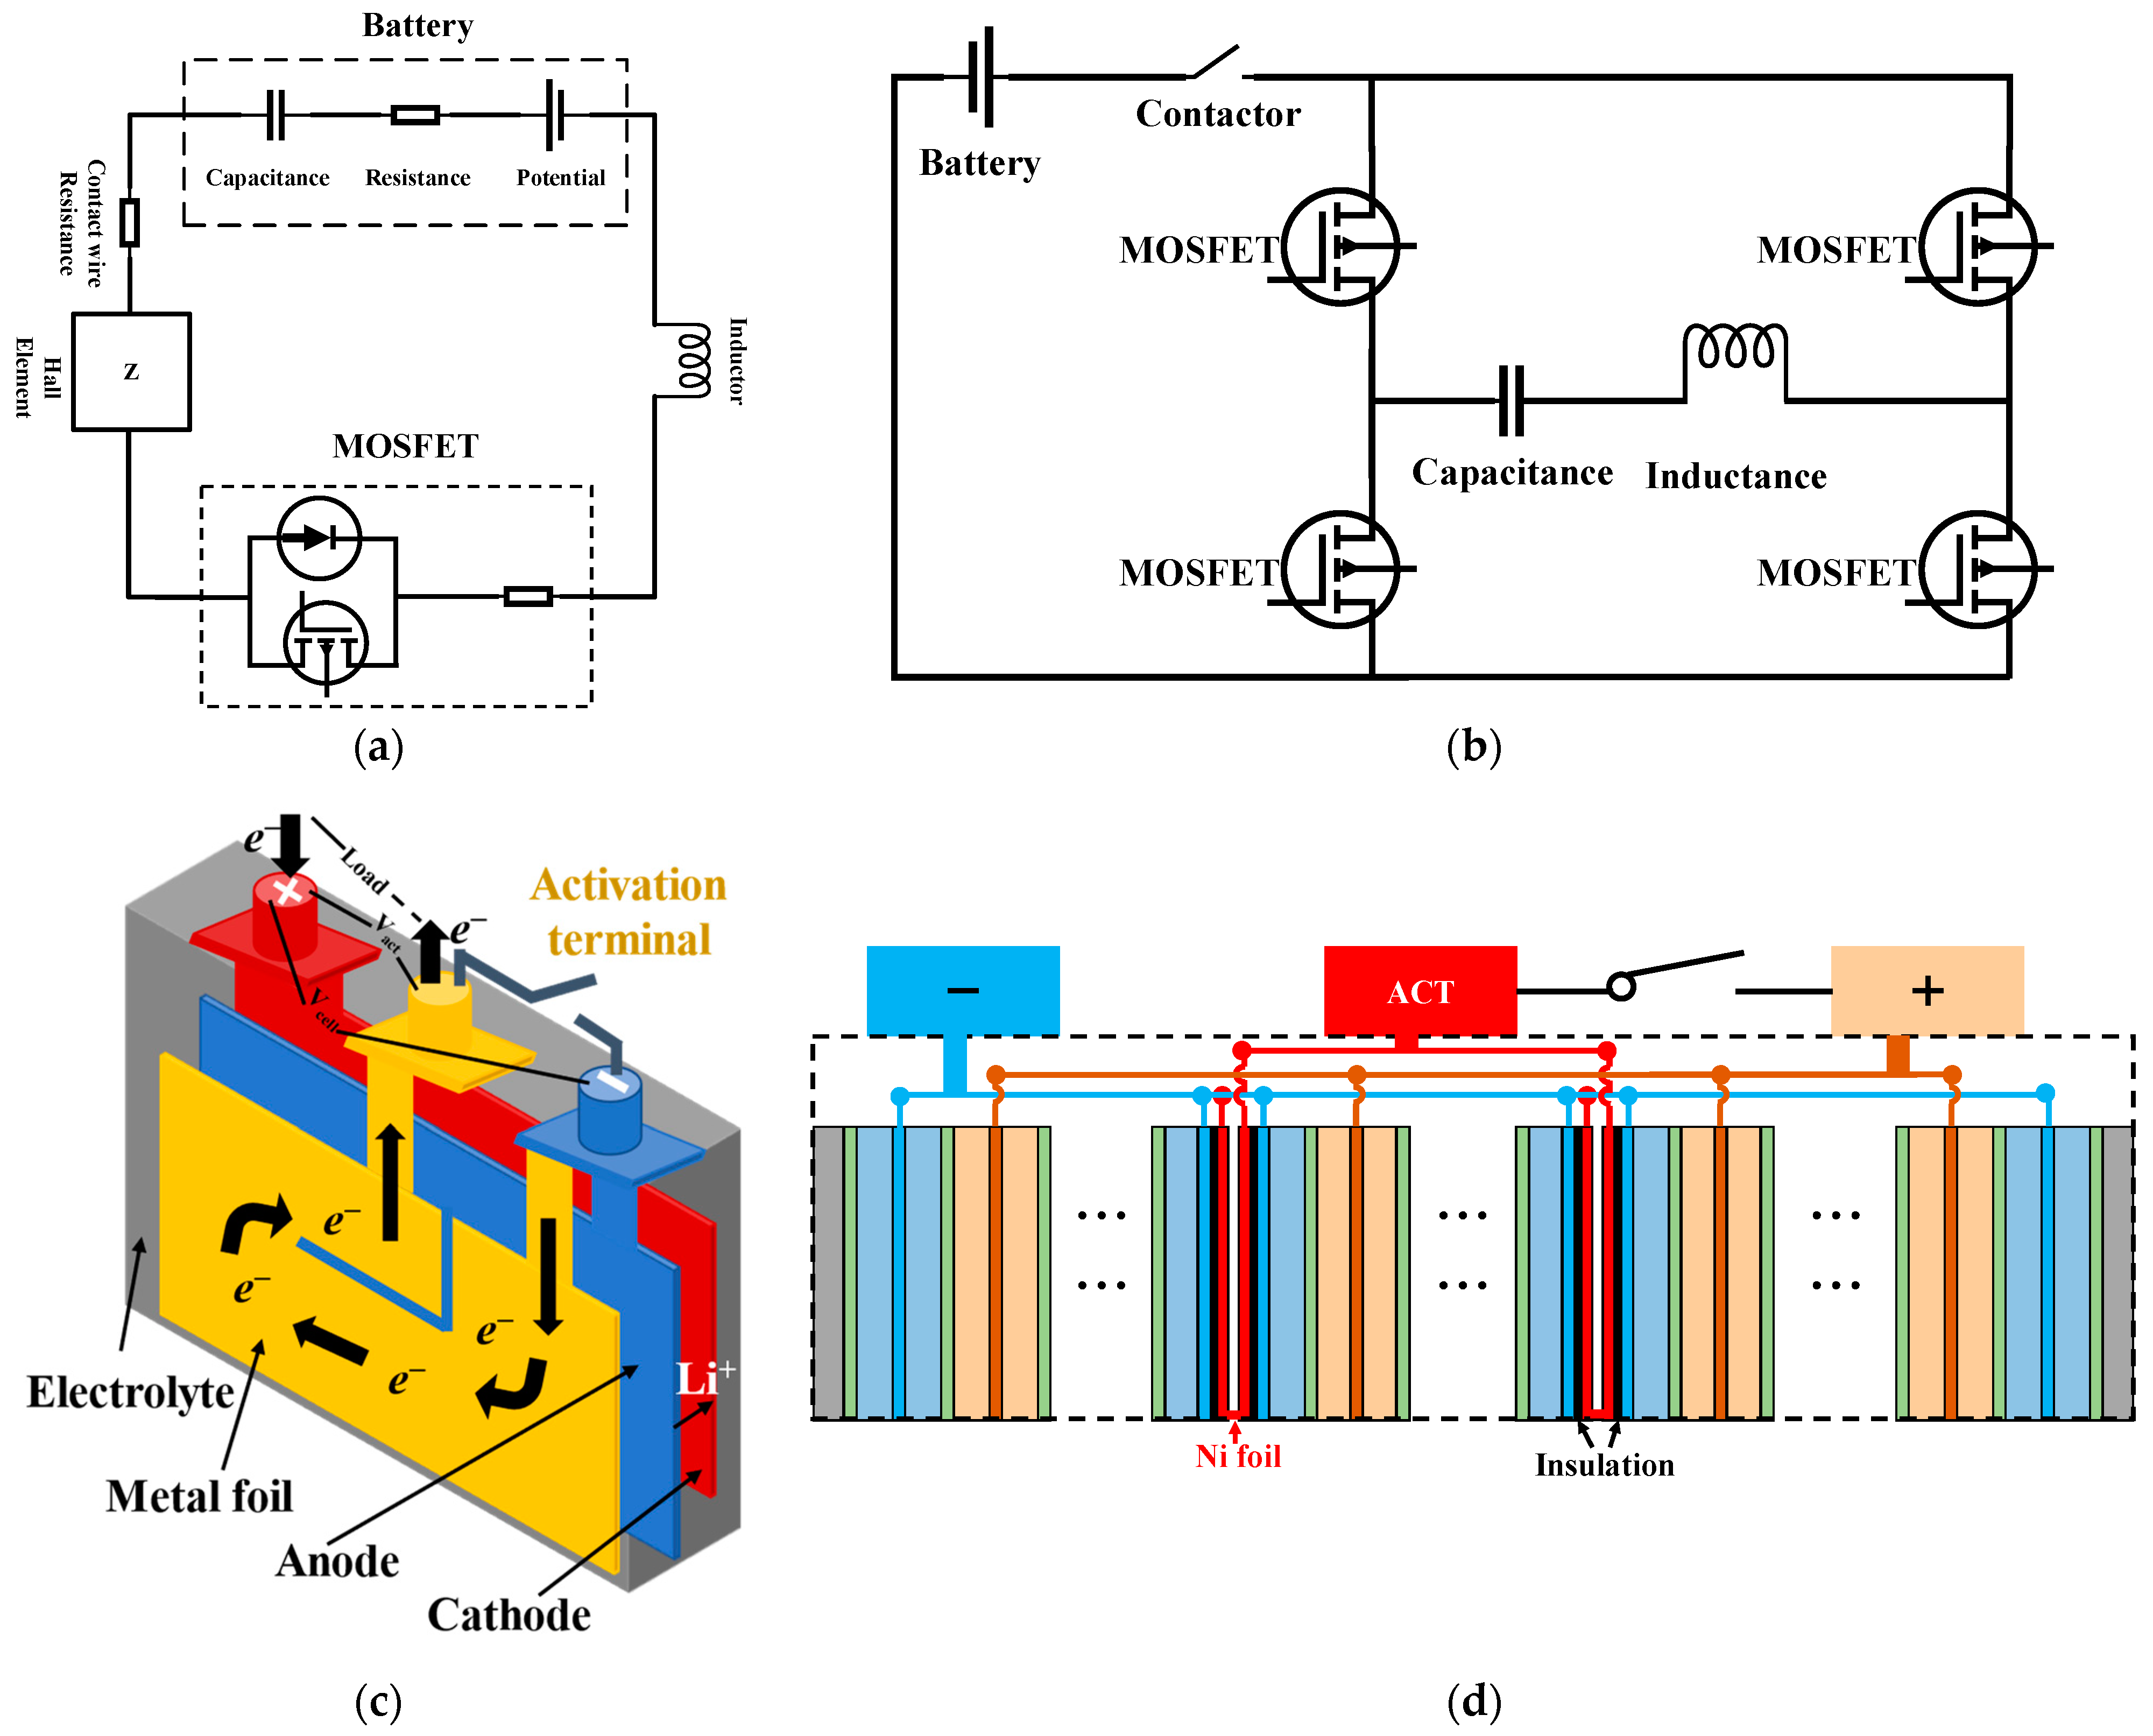
4.1.2. SHLB Heating
4.2. External Heating
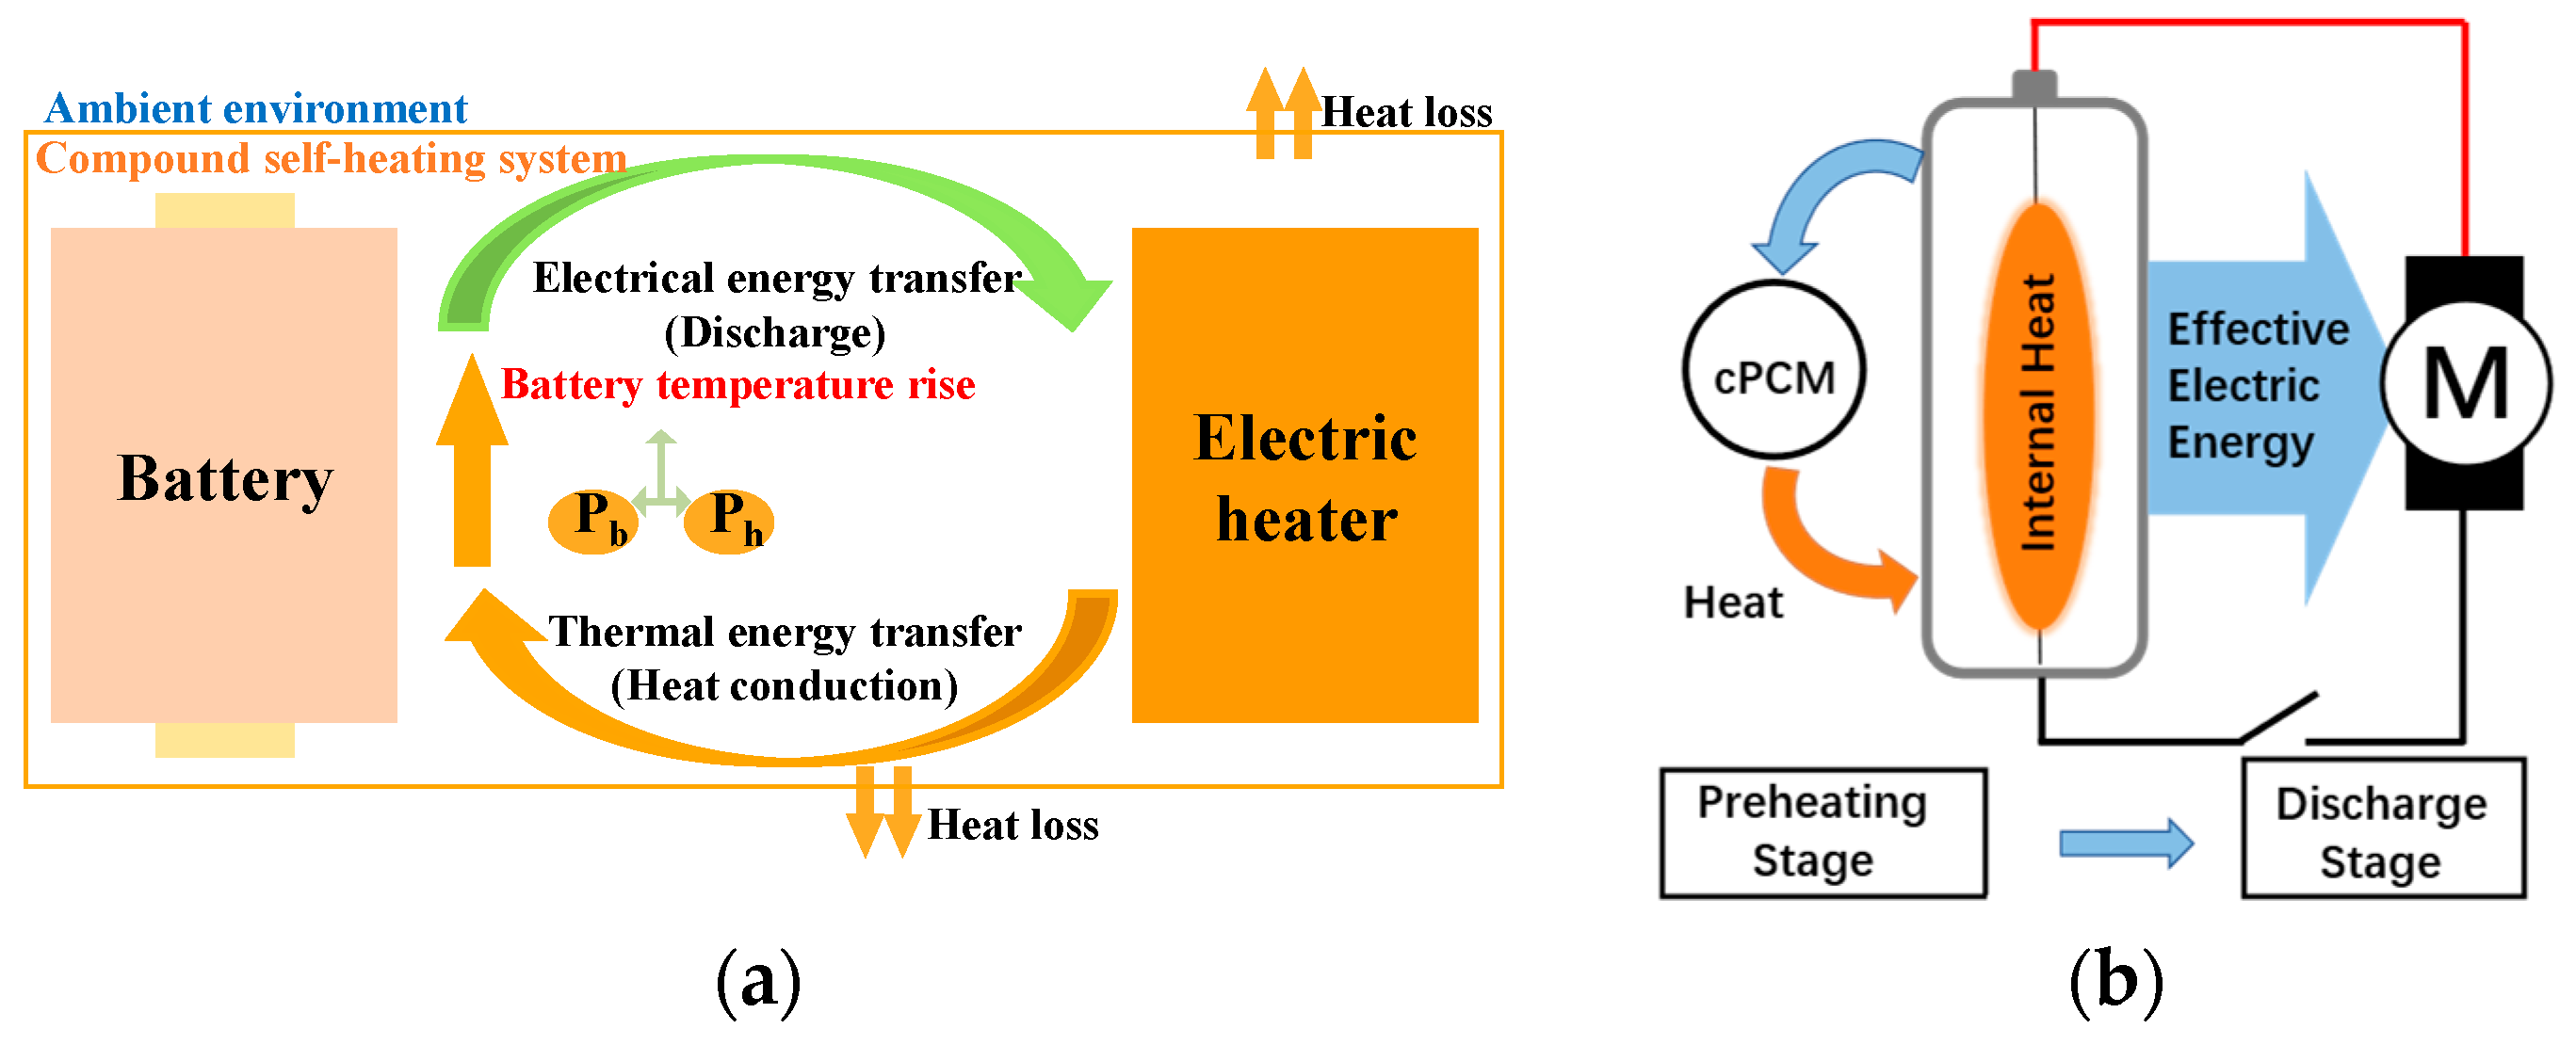
4.3. Hybrid Heating
5. Conclusions and Perspectives
Author Contributions
Funding
Data Availability Statement
Conflicts of Interest
Nomenclature
| Diffusion coefficient of Li+ in the electrolyte | |
| Diffusion coefficient | |
| Bulk diffusion coefficient of Li+ in anode | |
| Solid-phase diffusivity | |
| Reaction rate constant | |
| Reaction rate constant of anode | |
| Reaction rate constant of cathode | |
| Lumped charge transfer constant | |
| Negative electrode reaction kinetics control parameters | |
| Positive electrode reaction kinetics control parameters | |
| Positive proportional coefficient of liquid-phase diffusion | |
| Dynamic control constant of negative electrode solution-phase diffusion | |
| Steady-state control constant of negative electrode solution-phase diffusion | |
| Dynamic control constant of positive electrode solution-phase diffusion | |
| Steady-state control constant of positive electrode solution-phase diffusion | |
| Dynamic control constant of negative electrode solid-phase diffusion | |
| Dynamic control constant of positive electrode solid-phase diffusion | |
| Ohmic resistance | |
| Thermodynamic factor | |
| Ionic conductivity of the electrolyte | |
| Thermodynamic factor of the electrolyte | |
| Ionic conductivity | |
| Liquid-phase diffusion time constant | |
| Solid-phase diffusion time constant of electrodes | |
| Abbreviations | |
| AC | Alternating current |
| ACB | All-climate battery |
| AE | Average error |
| APE | Average percentage error |
| BEVs | Battery electric vehicles |
| CCD | Constant-current discharge |
| CEI | Cathode electrolyte interphase |
| CFD | Computational fluid dynamics |
| CNN-LSTM | Convolutional neural network and long short-term memory |
| cPCM | Composite phase-change materials |
| CPV | Constant polarization voltage |
| CSC | Constant sinusoidal current |
| CVD | Constant-voltage discharge |
| DC | Direct current |
| DOD | Depth of discharge |
| DV | Differential voltage |
| ECM | Equivalent circuit model |
| EIS | Electrochemical impedance spectroscopy |
| EVs | Electric vehicles |
| FUDS | Federal urban driving schedule |
| HPPC | Hybrid pulse power characteristic |
| IC | Incremental capacity |
| LCO | LiCoO2 |
| LFP | LiFePO4 |
| LIBs | Lithium-ion batteries |
| LMO | LiMn2O4 |
| LNO | LiNiO2 |
| LT | Low temperature |
| LTO | Li4Ti5O12 |
| LVP | Li3V2(PO4)3 |
| MAE | Mean absolute errors |
| MAEE | Maximum absolute estimation error |
| ME | Maximum error |
| MPE | Maximum percentage error |
| MRE | Maximum relative error |
| NA | Not available |
| NCA | LiNi1-x-yCoxAlyO2 |
| NCM | LiNi1-x-yCoxMnyO2 |
| NCMA | LiNiMnCoAlO2 |
| NCO | LiNi0.8Co0.2O2 |
| OCV | Open-circuit voltage |
| P2D | Pseudo-two-dimensional |
| PCM | Phase-change material |
| PHEVs | Plug-in hybrid electric vehicles |
| RC | Resistance and capacitance |
| RMSE | Root mean square error |
| RT | Room temperature |
| SD | Standard deviation |
| SEI | Solid electrolyte interphase |
| SHLB | Self-heating lithium-ion battery |
| SOC | State of charge |
| SP | Single particle |
| UMHP | Ultra-thin micro-heat pipe |
References
- New Energy Vehicle Industry Plan (2021–2035). Available online: https://www.ndrc.gov.cn/fggz/fzzlgh/gjjzxgh/202111/t20211101_1302487.html (accessed on 15 August 2023).
- Deal Confirms Zero-Emissions Target for New Cars and Vans in 2035. Available online: https://www.europarl.europa.eu/news/en/press-room/20221024IPR45734/deal-confirms-zero-emissions-target-for-new-cars-and-vans-in-2035 (accessed on 15 August 2023).
- FACT SHEET: President Biden Announces Steps to Drive American Leadership Forward on Clean Cars and Trucks. Available online: https://www.whitehouse.gov/briefing-room/statements-releases/2021/08/05/fact-sheet-president-biden-announces-steps-to-drive-american-leadership-forward-on-clean-cars-and-trucks/ (accessed on 15 August 2023).
- Global EV Data Explorer. Available online: https://www.iea.org/data-and-statistics/data-tools/global-ev-data-explorer (accessed on 15 August 2023).
- Zhang, S.S.; Xu, K.; Jow, T.R. Charge and discharge characteristics of a commercial LiCoO2-based 18650 Li-ion battery. J. Power Sources 2006, 160, 1403–1409. [Google Scholar] [CrossRef]
- IEA. Global EV Outlook 2019: Scaling-Up the Transition to Electric Mobility; OECD: Paris, France, 2019. [Google Scholar]
- Ouyang, M.; Chu, Z.; Lu, L.; Li, J.; Han, X.; Feng, X.; Liu, G. Low temperature aging mechanism identification and lithium deposition in a large format lithium iron phosphate battery for different charge profiles. J. Power Sources 2015, 286, 309–320. [Google Scholar] [CrossRef]
- Zhang, G.; Wei, X.; Tang, X.; Zhu, J.; Chen, S.; Dai, H. Internal short circuit mechanisms, experimental approaches and detection methods of lithi-um-ion batteries for electric vehicles: A review. Renew. Sustain. Energy Rev. 2021, 141, 110790. [Google Scholar] [CrossRef]
- Electric Vehicle Sales Leapt 55% in 2022—Here’s Where That Growth Was Strongest. Available online: https://www.weforum.org/agenda/2023/05/electric-vehicles-ev-sales-growth-2022/ (accessed on 15 August 2023).
- China Meteorological Administration. China Meteorological Yearbook 2021; China Meteorological Press: Beijing, China, 2021.
- Buidin, T.I.C.; Mariasiu, F. Battery Thermal Management Systems: Current Status and Design Approach of Cooling Technologies. Energies 2021, 14, 4879. [Google Scholar] [CrossRef]
- Xu, W.; Chan, K.W.; Or, S.W.; Ho, S.L.; Liu, M. A Low-Harmonic Control Method of Bidirectional Three-Phase Z-Source Converters for Vehicle-to-Grid Applications. IEEE Trans. Transp. Electrif. 2020, 6, 464–477. [Google Scholar] [CrossRef]
- Liu, J.; Xu, W.; Chan, K.W.; Liu, M.; Zhang, X.; Chan, N.H.L. A Three-Phase Single-Stage AC–DC Wireless-Power-Transfer Converter with Power Factor Correction and Bus Voltage Control. IEEE J. Emerg. Sel. Top. Power Electron. 2019, 8, 1782–1800. [Google Scholar] [CrossRef]
- Zhu, G.; Wen, K.; Lv, W.; Zhou, X.; Liang, Y.; Yang, F.; Chen, Z.; Zou, M.; Li, J.; Zhang, Y.; et al. Materials insights into low-temperature performances of lithium-ion batteries. J. Power Sources 2015, 300, 29–40. [Google Scholar] [CrossRef]
- Vlahinos, A.; Pesaran, A.A. Energy Efficient Battery Heating in Cold Climates. SAE Trans. 2002, 111, 826–833. [Google Scholar]
- Osmani, K.; Alkhedher, M.; Ramadan, M.; Choi, D.S.; Li, L.K.; Doranehgard, M.H.; Olabi, A.G. Recent progress in the thermal management of lithium-ion batteries. J. Clean Prod. 2023, 389, 136024. [Google Scholar] [CrossRef]
- Chen, Z.; Danilov, D.L.; Eichel, R.A.; Notten, P.H. Porous Electrode Modeling and its Applications to Li-Ion Batteries. Adv. Energy Mater. 2022, 12, 2201506. [Google Scholar] [CrossRef]
- Planella, F.B.; Ai, W.; Boyce, A.M.; Ghosh, A.; Korotkin, I.; Sahu, S.; Sulzer, V.; Timms, R.; Tranter, T.G.; Zyskin, M.; et al. A continuum of physics-based lithium-ion battery models reviewed. Prog. Energy 2022, 4, 042003. [Google Scholar] [CrossRef]
- Xu, L.; Deng, Z.; Xie, Y.; Hu, X. Review on Research Progress in High-fidelity Modeling, Parameter Identification and Lifetime Prognostics of Lithium-ion Battery. Chin. J. Mech. Eng. 2022, 58, 19–36. [Google Scholar]
- Liu, K.; Gao, Y.; Zhu, C.; Li, K.; Fei, M.; Peng, C.; Zhang, X.; Han, Q.L. Electrochemical modeling and parameterization towards control-oriented management of lithium-ion batteries. Control Eng. Pract. 2022, 124, 105176. [Google Scholar] [CrossRef]
- Cui, Z.; Dai, J.; Sun, J.; Li, D.; Wang, L.; Wang, K. Hybrid methods using neural network and Kalman filter for the state of charge estimation of lithium-ion battery. Math. Probl. Eng. 2022, 2022, 9616124. [Google Scholar] [CrossRef]
- Tian, J.; Xiong, R.; Shen, W.; Sun, F. Fractional order battery modelling methodologies for electric vehicle applications: Recent advances and perspectives. Sci. China Technol. Sci. 2020, 63, 2211–2230. [Google Scholar] [CrossRef]
- Hu, X.; Zheng, Y.; Howey, D.A.; Perez, H.; Foley, A.; Pecht, M. Battery warm-up methodologies at subzero temperatures for automotive applications: Recent advances and perspectives. Prog. Energy Combust. Sci. 2020, 77, 100806. [Google Scholar] [CrossRef]
- Wang, Y.; Zhang, X.; Chen, Z. Low temperature preheating techniques for Lithium-ion batteries: Recent advances and future challenges. Appl. Energy 2022, 313, 118832. [Google Scholar] [CrossRef]
- Lin, C.; Kong, W.; Tian, Y.; Wang, W.; Zhao, M. Heating Lithium-Ion Batteries at Low Temperatures for Onboard Applications: Recent Progress, Challenges and Prospects. Automot. Innov. 2022, 5, 3–17. [Google Scholar] [CrossRef]
- Zhu, C.; Du, L.; Guo, B.; Fan, G.; Lu, F.; Zhang, H.; Liu, K.; Zhang, X. Internal Heating Techniques for Lithium-ion Batteries at Cold Climates: An Overview for Automotive Applications. IEEE Trans. Transp. Electrif. 2022. [Google Scholar] [CrossRef]
- Ruan, H.; Barreras, J.V.; Steinhardt, M.; Jossen, A.; Offer, G.J.; Wu, B. The heating triangle: A quantitative review of self-heating methods for lithium-ion batteries at low temperatures. J. Power Sources 2023, 581, 233484. [Google Scholar] [CrossRef]
- Belgibayeva, A.; Rakhmetova, A.; Rakhatkyzy, M.; Kairova, M.; Mukushev, I.; Issatayev, N.; Kalimuldina, G.; Nurpeissova, A.; Sun, Y.K.; Bakenov, Z. Lithium-ion batteries for low-temperature applications: Limiting factors and solutions. J. Power Sources 2023, 557, 232550. [Google Scholar] [CrossRef]
- Luo, H.; Wang, Y.; Feng, Y.-H.; Fan, X.-Y.; Han, X.; Wang, P.-F. Lithium-Ion Batteries under Low-Temperature Environment: Challenges and Prospects. Materials 2022, 15, 8166. [Google Scholar] [CrossRef] [PubMed]
- Chen, X.; Gong, Y.; Li, X.; Zhan, F.; Liu, X.; Ma, J. Perspective on low-temperature electrolytes for LiFePO4-based lithium-ion batteries. Int. J. Miner. Metall. Mater. 2023, 30, 1–13. [Google Scholar] [CrossRef]
- Mei, P.; Zhang, Y.; Zhang, W. Low-temperature lithium-ion batteries: Challenges and progress of surface/interface modifications for advanced performance. Nanoscale 2023, 15, 987–997. [Google Scholar] [CrossRef]
- Su, X.; Xu, Y.; Wu, Y.; Li, H.; Yang, J.; Liao, Y.; Qu, R.; Zhang, Z. Liquid electrolytes for low-temperature lithium batteries: Main limitations, current advances, and future perspectives. Energy Storage Mater. 2023, 56, 642–663. [Google Scholar] [CrossRef]
- Hubble, D.; Brown, D.E.; Zhao, Y.; Fang, C.; Lau, J.; McCloskey, B.D.; Liu, G. Liquid electrolyte development for low-temperature lithium-ion batteries. Energy Environ. Sci. 2022, 15, 550–578. [Google Scholar] [CrossRef]
- Lin, W.; Zhu, M.; Fan, Y.; Wang, H.; Tao, G.; Ding, M.; Liu, N.; Yang, H.; Wu, J.; Fang, J.; et al. Low temperature lithium-ion batteries electrolytes: Rational design, advancements, and future perspectives. J. Alloys Compd. 2022, 905, 164163. [Google Scholar] [CrossRef]
- Zheng, Y.; Qian, T.; Zhou, J.; Liu, J.; Wang, Z.; Wang, S.; Wang, Y.; Yan, C. Advanced Strategies for Improving Lithium Storage Performance under Cryogenic Conditions. Adv. Energy Mater. 2023, 13, 2203719. [Google Scholar] [CrossRef]
- Sun, J.; Ye, L.; Zhao, X.; Zhang, P.; Yang, J. Electronic Modulation and Structural Engineering of Carbon-Based Anodes for Low-Temperature Lithium-Ion Batteries: A Review. Molecules 2023, 28, 2108. [Google Scholar] [CrossRef]
- Li, J.; Zuo, P. Research progress on low-temperature graphite anode and electrolyte optimization for lithium-ion batteries. Sci. Sin. Chim. 2022, 52, 1824–1833. [Google Scholar] [CrossRef]
- Worku, B.E.; Zheng, S.; Wang, B. Review of low-temperature lithium-ion battery progress: New battery system design imperative. Int. J. Energy Res. 2022, 46, 14609–14626. [Google Scholar] [CrossRef]
- Pang, X.; An, B.; Zheng, S.; Wang, B. Cathode materials of metal-ion batteries for low-temperature applications. J. Alloys Compd. 2022, 912, 165142. [Google Scholar] [CrossRef]
- Mennel, J.A.; Chidambaram, D. A review on the development of electrolytes for lithium-based batteries for low temperature applications. Front. Energy 2022, 17, 43–71. [Google Scholar] [CrossRef]
- Han, F.; Chang, Z.; Zhao, J.; Wang, R.; Ding, H.; Lu, S. Research progress in low-temperature discharge performance of Ni-rich ternary lithium-ion batteries. Cailiao Gongcheng 2022, 50, 1–17. [Google Scholar]
- Zhang, D.; Tan, C.; Ou, T.; Zhang, S.; Li, L.; Ji, X. Constructing advanced electrode materials for low-temperature lithium-ion batteries: A review. Energy Rep. 2022, 8, 4525–4534. [Google Scholar] [CrossRef]
- Selinis, P.; Farmakis, F. A review on the anode and cathode materials for lithium-ion batteries with improved subzero temperature performance. J. Electrochem. Soc. 2022, 169, 010526. [Google Scholar] [CrossRef]
- Na, Y.; Sun, X.; Fan, A.; Cai, S.; Zheng, C. Methods for enhancing the capacity of electrode materials in low-temperature lithium-ion batteries. Chin. Chem. Lett. 2021, 32, 973–982. [Google Scholar] [CrossRef]
- Guo, R.; Han, W. The effects of electrolytes, electrolyte/electrode interphase and binders on lithium-ion batteries at low temperature. Mater. Today Sustain. 2022, 19, 100187. [Google Scholar] [CrossRef]
- Meng, F.; Xiong, X.; Tan, L.; Yuan, B.; Hu, R. Strategies for improving electrochemical reaction kinetics of cathode materials for subzero-temperature Li-ion batteries: A review. Energy Storage Mater. 2022, 44, 390–407. [Google Scholar] [CrossRef]
- Zhang, N.; Deng, T.; Zhang, S.; Wang, C.; Chen, L.; Wang, C.; Fan, X. Critical Review on Low-Temperature Li-Ion/Metal Batteries. Adv. Mater. 2022, 34, 2107899. [Google Scholar] [CrossRef]
- Kulova, T.L.; Skundin, A.M. A critical review of electrode materials and electrolytes for low-temperature lithium-ion batteries. Int. J. Electrochem. Sci. 2020, 15, 8638–8661. [Google Scholar] [CrossRef]
- Collins, G.A.; Geaney, H.; Ryan, K.M. Alternative anodes for low temperature lithium-ion batteries. J. Mater. Chem. A 2021, 9, 14172–14213. [Google Scholar] [CrossRef]
- Hou, J.; Yang, M.; Wang, D.; Zhang, J. Fundamentals and challenges of lithium ion batteries at temperatures between −40 and 60 °C. Adv. Energy Mater. 2020, 10, 1904152. [Google Scholar] [CrossRef]
- Zhang, S.S.; Xu, K.; Jow, T.R. Electrochemical impedance study on the low temperature of Li-ion batteries. Electrochim. Acta 2004, 49, 1057–1061. [Google Scholar] [CrossRef]
- Zhang, S.S.; Xu, K.; Jow, T.R. The low temperature performance of Li-ion batteries. J. Power Sources 2003, 115, 137–140. [Google Scholar] [CrossRef]
- Zhang, S.S.; Xu, K.; Jow, T.R. Low temperature performance of graphite electrode in Li-ion cells. Electrochim. Acta 2003, 48, 241–246. [Google Scholar] [CrossRef]
- Ren, D.; Smith, K.; Guo, D.; Han, X.; Feng, X.; Lu, L.; Ouyang, M.; Li, J. Investigation of Lithium Plating-Stripping Process in Li-ion Batteries at low temperature Using an Electrochemical Model. J. Electrochem. Soc. 2018, 165, A2167. [Google Scholar] [CrossRef]
- Singer, J.P.; Birke, K.P. Kinetic study of low temperature capacity fading in Li-ion cells. J. Energy Storage 2017, 13, 129–136. [Google Scholar] [CrossRef]
- Rauhala, T.; Jalkanen, K.; Romann, T.; Lust, E.; Omar, N.; Kallio, T. Low-temperature aging mechanisms of commercial graphite/LiFePO4 cells cycled with a simulated electric vehicle load profile—A post-mortem study. J. Energy Storage 2018, 20, 344–356. [Google Scholar] [CrossRef]
- Kucinskis, G.; Bozorgchenani, M.; Feinauer, M.; Kasper, M.; Wohlfahrt-Mehrens, M.; Waldmann, T. Arrhenius plots for Li-ion battery ageing as a function of temperature, C-rate, and ageing state—An experimental study. J. Power Sources 2022, 549, 232129. [Google Scholar] [CrossRef]
- Qiao, Y.Q.; Tu, J.P.; Wang, X.L.; Gu, C.D. The low and high temperature electrochemical performances of Li3V2(PO4)3/C cathode material for Li-ion batteries. J. Power Sources 2012, 199, 287–292. [Google Scholar] [CrossRef]
- Qiu, B.; Wang, J.; Xia, Y.; Wei, Z.; Han, S.; Liu, Z. Temperature dependence of the initial coulombic efficiency in Li-rich layered Li[Li0.144Ni0.136Co0.136 Mn0.544]O2 oxide for lithium-ions batteries. J. Power Sources 2014, 268, 517–521. [Google Scholar] [CrossRef]
- Hamenu, L.; Lee, H.S.; Latifatu, M.; Kim, K.M.; Park, J.; Baek, Y.G.; Ko, J.M.; Kaner, R.B. Lithium-silica nanosalt as a low-temperature electrolyte additive for lithium-ion batteries. Curr. Appl. Phys. 2016, 16, 611–617. [Google Scholar] [CrossRef]
- Chen, K.; Li, X. Accurate determination of battery discharge characteristics—A comparison between two battery temperature control methods. J. Power Sources 2014, 247, 961–966. [Google Scholar] [CrossRef]
- Wu, G.; Li, C.; Jiao, D.; Liu, Y.; Hao, C.; Zhang, Y.; Yu, H.; Zhang, M. State of Charge Estimation for Li-Ion Battery Based on an Improved Peukert’s Equation with Temperature Correction Factor. In Proceedings of the 2016 IEEE Vehicle Power and Propulsion Conference (VPPC), Hangzhou, China, 17–20 October 2016; pp. 1–4. [Google Scholar]
- Jaguemont, J.; Boulon, L.; Dubé, Y. Characterization and Modeling of a Hybrid-Electric-Vehicle Lithium-Ion Battery Pack at Low Temperatures. IEEE Trans. Veh. Technol. 2015, 65, 1–14. [Google Scholar] [CrossRef]
- Ge, H.; Aoki, T.; Ikeda, N.; Suga, S.; Isobe, T.; Li, Z.; Tabuchi, Y.; Zhang, J. Investigating Lithium Plating in Lithium-Ion Batteries at Low Temperatures Using Electrochemical Model with NMR Assisted Parameterization. J. Electrochem. Soc. 2017, 164, A1050. [Google Scholar] [CrossRef]
- Momma, T.; Matsunaga, M.; Mukoyama, D.; Osaka, T. Ac impedance analysis of lithium ion battery under temperature control. J. Power Sources 2012, 216, 304–307. [Google Scholar] [CrossRef]
- Wu, W.; Ma, R.; Liu, J.; Liu, M.; Wang, W.; Wang, Q. Impact of low temperature and charge profile on the aging of lithium-ion battery: Non-invasive and post-mortem analysis. Int. J. Heat Mass Transf. 2021, 170, 121024. [Google Scholar] [CrossRef]
- Tippmann, S.; Walper, D.; Balboa, L.; Spier, B.; Bessler, W.G. Low-temperature charging of lithium-ion cells part I: Electrochemical modeling and experimental investigation of degradation behavior. J. Power Sources 2014, 252, 305–316. [Google Scholar] [CrossRef]
- Guo, S.; Xiong, R.; Shen, W.; Sun, F. Aging investigation of an echelon internal heating method on a three-electrode lithium ion cell at low temperatures. J. Energy Storage 2019, 25, 100878. [Google Scholar] [CrossRef]
- Laforgue, A.; Yuan, X.Z.; Platt, A.; Brueckner, S.; Perrin-Sarazin, F.; Toupin, M.; Huot, J.Y.; Mokrini, A. Comparative investigation of the impact of fast charging at low temperature on commercial Li-ion cells. J. Power Sources 2022, 524, 231071. [Google Scholar] [CrossRef]
- Omar, N.; Monem, M.A.; Firouz, Y.; Salminen, J.; Smekens, J.; Hegazy, O.; Gaulous, H.; Mulder, G.; Van den Bossche, P.; Coosemans, T.; et al. Lithium iron phosphate based battery—Assessment of the aging parameters and development of cycle life model. Appl. Energy 2014, 113, 1575–1585. [Google Scholar] [CrossRef]
- Zhang, G.; Wei, X.; Han, G.; Dai, H.; Zhu, J.; Wang, X.; Tang, X.; Ye, J. Lithium plating on the anode for lithium-ion batteries during long-term low temperature cycling. J. Power Sources 2021, 484, 229312. [Google Scholar] [CrossRef]
- Petzl, M.; Kasper, M.; Danzer, M.A. Lithium plating in a commercial lithium-ion battery—A low-temperature aging study. J. Power Sources 2015, 275, 799–807. [Google Scholar] [CrossRef]
- Waldmann, T.; Wilka, M.; Kasper, M.; Fleischhammer, M.; Wohlfahrt-Mehrens, M. Temperature dependent ageing mechanisms in Lithium-ion batteries—A Post-Mortem study. J. Power Sources 2014, 262, 129–135. [Google Scholar] [CrossRef]
- Storch, M.; Fath, J.P.; Sieg, J.; Vrankovic, D.; Krupp, C.; Spier, B.; Riedel, R. Temperature and Lithium Concentration Gradient Caused Inhomogeneous Plating in Large-format Lithium-ion Cells. J. Energy Storage 2021, 41, 102887. [Google Scholar] [CrossRef]
- Waldmann, T.; Hogg, B.I.; Kasper, M.; Grolleau, S.; Couceiro, C.G.; Trad, K.; Matadi, B.P.; Wohlfahrt-Mehrens, M. Interplay of Operational Parameters on Lithium Deposition in Lithium-Ion Cells: Systematic Measurements with Reconstructed 3-Electrode Pouch Full Cells. J. Electrochem. Soc. 2016, 163, A1232. [Google Scholar] [CrossRef]
- Waldmann, T.; Quinn, J.B.; Richter, K.; Kasper, M.; Tost, A.; Klein, A.; Wohlfahrt-Mehrens, M. Electrochemical, Post-Mortem, and ARC Analysis of Li-Ion Cell Safety in Second-Life Applications. J. Electrochem. Soc. 2017, 164, A3154. [Google Scholar] [CrossRef]
- Kamrueng, C.; Kittiratsatcha, S.; Polmai, S. A Number of RC Pairs Consideration of Electrical Equivalent Circuit Model of Li-ion Battery. In Proceedings of the 2020 6th International Conference on Engineering, Applied Sciences and Technology (ICEAST), Chiang Mai, Thailand, 1–4 July 2020; pp. 1–4. [Google Scholar]
- Das, D.; Sharma, S.; Jana, M.; Basu, S. A modified equivalent circuit model to capture low temperature effects in Li ion batteries. In Proceedings of the 2019 IEEE Transportation Electrification Conference (ITEC-India), Bengaluru, India, 17–19 December 2019; pp. 1–6. [Google Scholar]
- Zhu, J.; Knapp, M.; Darma, M.S.D.; Fang, Q.; Wang, X.; Dai, H.; Wei, X.; Ehrenberg, H. An improved electro-thermal battery model complemented by current dependent parameters for vehicular low temperature application. Appl. Energy 2019, 248, 149–161. [Google Scholar] [CrossRef]
- Chen, A.; Zhang, W.; Zhang, C.; Huang, W.; Liu, S. A Temperature and Current Rate Adaptive Model for High-Power Lithium-Titanate Batteries Used in Electric Vehicles. IEEE Trans. Ind. Electron. 2019, 67, 9492–9502. [Google Scholar] [CrossRef]
- Jiang, J.; Ruan, H.; Sun, B.; Zhang, W.; Gao, W.; Wang, L.Y.; Zhang, L. A reduced low-temperature electro-thermal coupled model for lithium-ion batteries. Appl. Energy 2016, 177, 804–816. [Google Scholar] [CrossRef]
- Fang, Y.; Zhang, Q.; Zhang, H.; Xu, W.; Wang, L.; Shen, X.; Yun, F.; Cui, Y.; Wang, L.; Zhang, X. State-of-charge estimation technique for lithium-ion batteries by means of second-order extended Kalman filter and equivalent circuit model: Great temperature robustness state-of-charge estimation. IET Power Electron. 2021, 14, 1515–1528. [Google Scholar] [CrossRef]
- Doyle, M.; Fuller, T.F.; Newman, J. Modeling of Galvanostatic Charge and Discharge of the Lithium/Polymer/Insertion Cell. J. Electrochem. Soc. 1993, 140, 1526. [Google Scholar] [CrossRef]
- Gholami, J.; Barzoki, M.F. Electrochemical modeling and parameter sensitivity of lithium-ion battery at low temperature. J. Energy Storage 2021, 43, 103189. [Google Scholar] [CrossRef]
- Wang, D.; Huang, H.; Tang, Z.; Zhang, Q.; Yang, B.; Zhang, B. A lithium-ion battery electrochemical–thermal model for a wide temperature range applications. Electrochim. Acta 2020, 362, 137118. [Google Scholar] [CrossRef]
- An, Z.; Jia, L.; Wei, L.; Dang, C.; Peng, Q. Investigation on lithium-ion battery electrochemical and thermal characteristic based on electrochemical-thermal coupled model. Appl. Therm. Eng. 2018, 137, 792–807. [Google Scholar] [CrossRef]
- Xu, S.; Wang, Y.; Shao, J.; Li, J.; Yu, Q. An electrochemical-thermal coupling model for prismatic lithium-ion batteries over wide temperature range. Appl. Therm. Eng. 2022, 217, 119282. [Google Scholar] [CrossRef]
- Remmlinger, J.; Tippmann, S.; Buchholz, M.; Dietmayer, K. Low-temperature charging of lithium-ion cells Part II: Model reduction and application. J. Power Sources 2014, 254, 268–276. [Google Scholar] [CrossRef]
- Li, C.; Cui, N.; Wang, C.; Zhang, C. Simplified electrochemical lithium-ion battery model with variable solid-phase diffusion and parameter identification over wide temperature range. J. Power Sources 2021, 497, 229900. [Google Scholar] [CrossRef]
- Liu, H.; Wang, Y.; Li, W.; Shao, F.; He, M. Decay mechanism and capacity prediction of lithium-ion batteries under low-temperature near-adiabatic condition. Inorg. Chem. Commun. 2022, 137, 109151. [Google Scholar] [CrossRef]
- You, H.; Dai, H.; Li, L.; Wei, X.; Han, G. Charging Strategy Optimization at Low Temperatures for Li-Ion Batteries Based on Multi-Factor Coupling Aging Model. IEEE Trans. Veh. Technol. 2021, 70, 11433–11445. [Google Scholar] [CrossRef]
- Jaguemont, J.; Boulon, L.; Venet, P.; Dube, Y.; Sari, A. Lithium-ion battery aging experiments at subzero temperatures and model development for capacity fade estimation. IEEE Trans. Veh. Technol. 2015, 65, 4328–4343. [Google Scholar] [CrossRef]
- Wu, X.; Chen, Z.; Wang, Z. Analysis of low temperature preheating effect based on battery temperature-rise model. Energies 2017, 10, 1121. [Google Scholar] [CrossRef]
- Ji, Y.; Wang, C.Y. Heating strategies for Li-ion batteries operated from subzero temperatures. Electrochim. Acta 2013, 107, 664–674. [Google Scholar] [CrossRef]
- Ruan, H.; Jiang, J.; Sun, B.; Su, X.; He, X.; Zhao, K. An optimal internal-heating strategy for lithium-ion batteries at low temperature considering both heating time and lifetime reduction. Appl. Energy 2019, 256, 113797. [Google Scholar] [CrossRef]
- Zhang, J.; Ge, H.; Li, Z.; Ding, Z. Internal heating of lithium-ion batteries using alternating current based on the heat generation model in frequency domain. J. Power Sources 2015, 273, 1030–1037. [Google Scholar] [CrossRef]
- Ruan, H.; Jiang, J.; Sun, B.; Zhang, W.; Gao, W.; Ma, Z. A rapid low-temperature internal heating strategy with optimal frequency based on constant polarization voltage for lithium-ion batteries. Appl. Energy 2016, 177, 771–782. [Google Scholar] [CrossRef]
- Jiang, J.; Ruan, H.; Sun, B.; Wang, L.; Gao, W.; Zhang, W. A low-temperature internal heating strategy without lifetime reduction for large-size automotive lithium-ion battery pack. Appl. Energy 2018, 230, 257–266. [Google Scholar] [CrossRef]
- Qu, Z.G.; Jiang, Z.Y.; Wang, Q. Experimental study on pulse self-heating of lithium-ion battery at low temperature. Int. J. Heat Mass Transf. 2019, 135, 696–705. [Google Scholar] [CrossRef]
- Wang, Y.; Rao, Z.; Liu, S.; Li, X.; Li, H.; Xiong, R. Evaluating the performance of liquid immersing preheating system for Lithium-ion battery pack. Appl. Therm. Eng. 2021, 190, 116811. [Google Scholar] [CrossRef]
- He, F.; Li, X.; Zhang, G.; Zhong, G.; He, J. Experimental investigation of thermal management system for lithium ion batteries module with coupling effect by heat sheets and phase change materials. Int. J. Energy Res. 2018, 42, 3279–3288. [Google Scholar] [CrossRef]
- Liu, F.F.; Lan, F.C.; Chen, J.Q.; Li, Y.G. Experimental Investigation on Cooling/Heating Characteristics of Ultra-Thin Micro Heat Pipe for Electric Vehicle Battery Thermal Management. Chin. J. Mech. Eng. 2018, 31, 179–188. [Google Scholar] [CrossRef]
- Ruan, H.; Sun, B.; Zhu, T.; He, X.; Su, X.; Cruden, A.; Gao, W. Compound self-heating strategies and multi-objective optimization for lithium-ion batteries at low temperature. Appl. Therm. Eng. 2021, 186, 116158. [Google Scholar] [CrossRef]
- Luo, M.; Lin, X.; Feng, J.; Ling, Z.; Zhang, Z.; Fang, X. Fast self-preheating system and energy conversion model for lithium-ion batteries under low-temperature conditions. J. Power Sources 2023, 565, 232897. [Google Scholar] [CrossRef]
- Xu, J.; Mei, X.; Wang, H.; Wang, J. A Hybrid Self-Heating Method for Batteries Used at Low Temperature. IEEE Trans. Ind. Inform. 2020, 17, 4714–4723. [Google Scholar] [CrossRef]
- Ruan, H.; Sun, B.; Cruden, A.; Zhu, T.; Jiang, J.; He, X.; Su, X.; Ghoniem, E. Optimal external heating resistance enabling rapid compound self-heating for lithium-ion batteries at low temperatures. Appl. Therm. Eng. 2022, 200, 117536. [Google Scholar] [CrossRef]
- Wang, C.Y.; Zhang, G.; Ge, S.; Xu, T.; Ji, Y.; Yang, X.G.; Leng, Y. Lithium-ion battery structure that self-heats at low temperatures. Nature 2016, 529, 515–518. [Google Scholar] [CrossRef]
- Yang, X.G.; Liu, T.; Wang, C.Y. Innovative heating of large-size automotive Li-ion cells. J. Power Sources 2017, 342, 598–604. [Google Scholar] [CrossRef]


| Key Words | Focus of Literature | Year | Ref. |
|---|---|---|---|
| Modeling and Optimization; Overpotential and impedance; Temperature and stress; Aging | 2022 | [17] |
| Microscale model; Doyle–Fuller–Newman model; Single-particle model; Coupled thermal–electrochemical models | 2022 | [18] |
| Reconstructed electrochemical modeling; Simplified electrochemical modeling; Thermal modeling; Electrochemical–thermal coupling modeling | 2022 | [19] |
| P2D model and simplifications; Extension of P2D model; P2D model parameterization | 2022 | [20] |
| Kalman filter-first method; Neural-network-first method | 2022 | [21] |
| Frequency-domain modelling; Time-domain modelling | 2020 | [22] |
| Key Words | Focus of Literature | Year | Ref. |
|---|---|---|---|
| Mechanisms; Potential; Maturity; Pros and cons Mutual pulse heating; Self-heating lithium-ion battery (SHLB); Alternating current (AC) heating; Convective and conductive heating; Internal self-heating | 2020 | [23] |
| Mechanisms; Potential; Pros and cons | 2022 | [24] | |
| Mechanisms; Potential; Applications; Pros and cons; | 2022 | [25] | |
| Mechanisms, Pros and cons Mutual pulse current heating; AC heating; Compound heating; All-climate-battery-based heating; | 2022 | [26] |
| Present the heating triangle to quantitatively assess self-heating methods | 2023 | [27] |
| Key Words | Focus of Literature | Year | Ref. |
|---|---|---|---|
| Battery configurations; Obtained LT performances | 2023 | [28] |
| 2022 | [29] | ||
| LiFePO4-based batteries (LFP) | 2023 | [30] |
| Surface coating; Surface doping; Solid electrolyte interphase (SEI)-forming electrolyte additives | 2023 | [31] |
| Electrolyte solvents; Additives; Lithium salts; New strategies for LT electrolyte | 2023 | [32] |
| 2022 | [33] | ||
| 2022 | [34] | ||
| Li+ Transport in Electrolyte; Desolvation Process; SEI/Cathode Electrolyte Interphase (CEI); Electrode Dynamic | 2023 | [35] |
| - | 2023 | [36] |
| - | 2022 | [37] |
| Calendar aging; Cycle aging | 2022 | [38] |
| Polyanion and oxide cathode | 2022 | [39] |
| - | 2022 | [40] |
| 2022 | [41] | ||
| Battery configurations; Obtained LT performances | 2022 | [42] |
| 2022 | [43] | ||
| Methods; Materials; Mechanisms | 2021 | [44] | |
| - | 2022 | [45] |
| LFP and Li3V2(PO4)3 (LVP) phosphate cathode materials; Layered LiCoO2 (LCO), LiNi1-x-yCoxMnyO2 (NCM) and LiNi1-x-yCoxAlyO2 (NCA) oxide cathode materials; Li- and Mn-rich oxide cathode materials | 2022 | [46] |
| - | 2022 | [47] |
| 2020 | [48] | ||
| Carbon-based anodes; Lithium metal anodes; Titanium-based anodes; Li alloying anodes; Composite anodes | 2021 | [49] |
| - | 2020 | [50] |
| Nominal Capacity (Ah) | Battery Type | Material | Charging Current | T (°C) | Charging Capacity (%) | Midpoint Voltage (Charging Capacity) (V) | Midpoint Voltage (Nominal Capacity) (V) | Ref. |
|---|---|---|---|---|---|---|---|---|
| - | Lab-made | - | 0.1 mA/cm2 | RT a | 100.00 | 0.143 | 0.143 b | [53] |
| −20 | 93.65 | 0.341 | 0.345 b | |||||
| −30 | 87.92 | 0.520 | 0.531 b | |||||
| 2.300 | High-quality Cylindrical 26650 | LFP | 0.05 C-rate | RT a | 100.00 | 3.325 | 3.327 | [56] |
| 0 | 102.64 | 3.329 | 3.331 | |||||
| −18 | 96.58 | 3.323 | 3.324 | |||||
| 5.000 | High-energy 21700 | NCA + LNO | 0.4 C-rate | RT a | 100.00 | 3.926 | 3.953 | [57] |
| 15 | 92.62 | 3.888 | 3.945 | |||||
| 0 | 88.03 | 3.956 | 4.006 | |||||
| −10 | 80.60 | 4.02 | 4.082 | |||||
| 0.100 | Lab-made Pouch | NCM | 0.5 C-rate | RT a | 100.00 | 3.748 | 3.758 | |
| 15 | 96.82 | 3.762 | 3.781 | |||||
| 5 | 96.26 | 3.813 | 3.834 | |||||
| 0 | 90.57 | 3.817 | 3.856 | |||||
| −5 | 90.07 | 3.849 | 3.888 | |||||
| −15 | 86.06 | 3.937 | 3.984 | |||||
| 24.000 | Pouch | NCM/LiC | 1/6 C-rate | −5 | 100.00 | 3.790 | 3.800 | [54] |
| 1/3 C-rate | 96.80 | 3.888 | 3.898 | |||||
| 2/3 C-rate | 93.00 | 3.976 | 3.992 | |||||
| 1 C-rate | 86.51 | 4.047 | 4.068 | |||||
| 2 C-rate | 81.53 | 4.176 | 4.200 c | |||||
| - | Lab-made | LVP | 0.1 C-rate | RT a | 100.00 | 3.953 | 3.953 b | [58] |
| 0 | 86.60 | 3.864 | 4.098 b | |||||
| −20 | 67.86 | 4.133 | 4.150 b | |||||
| 3.400 | Cylindrical | NCA/LiC | 0.1 C-rate | RT a | 100.00 | 3.710 | 3.725 | [55] |
| 0 | 88.98 | 3.754 | 3.810 | |||||
| −10 | 77.65 | 3.789 | 3.900 | |||||
| −20 | 52.70 | 3.997 | 4.180 | |||||
| 1.100 | Cylindrical | LFP/LiC | 0.1 C-rate | RT a | 100.00 | 3.324 | 3.326 | |
| 0 | 95.13 | 3.348 | 3.350 | |||||
| −10 | 87.41 | 3.386 | 3.400 | |||||
| −20 | 67.73 | 3.472 | 3.510 | |||||
| 0.130 | Pouch | LFP/LTO | 0.1 C-rate | RT a | 100.00 | 1.890 | 1.890 | |
| 0 | 76.16 | 1.904 | 1.909 | |||||
| −10 | 34.95 | 1.971 | - | |||||
| −20 | 3.51 | 2.062 | - | |||||
| 10.000 | Prismatic | LMO/LTO | 0.1 C-rate | RT a | 100.00 | 2.489 | 2.489 | |
| 0 | 98.68 | 2.487 | 2.492 | |||||
| −10 | 97.74 | 2.486 | 2.497 | |||||
| −20 | 93.97 | 2.496 | 2.502 | |||||
| - | Lab-made | NCM | 25 mA/g | RT a | 100.00 | 4.487 | 4.487 b | [59] |
| 10 | 84.50 | 4.483 | 4.523 b | |||||
| 0 | 61.78 | 4.346 | 4.560 b | |||||
| 0.140 | Coin-type 2032 | LCO | 0.1 C-rate | RT a | 100.00 | 3.734 | 3.726 | [60] |
| 0.2 C-rate | 98.59 | 3.736 | 3.730 | |||||
| 0.5 C-rate | 96.67 | 3.737 | 3.736 | |||||
| 1 C-rate | 92.29 | 3.747 | 3.760 | |||||
| 2 C-rate | 83.85 | 3.771 | 3.818 | |||||
| 0.1 C-rate | −20 | 97.15 | 3.921 | 3.917 | ||||
| 0.2 C-rate | 64.73 | 3.959 | 4.134 | |||||
| 0.5 C-rate | 50.92 | 4.050 | 4.200 c |
| Nominal capacity (Ah) | 6.000 | 0.140 | 20.000 | 100.000 | 0.023 | - | 3.400 | 1.100 | 0.130 | 10.000 | |
| Cathode | - | LCO | LFP | LFP | NCM | LVP | NCA | LFP | LFP | LMO | |
| Anode | - | - | - | - | - | - | LiC | LiC | LTO | LTO | |
| Ref. | [62] | [60] | [61] | [63] | [64] | [58] | [55] | ||||
| T (°C) | C-rate | Discharging capacity (%) a | |||||||||
| RT b | 0.1 | - | 100.00 | - | - | - | 100.00 | 100.00 | 100.00 | 100.00 | 100.00 |
| 0.2 | 100.00 c | 96.55 | 100.00 | - | - | 99.91 | - | - | - | - | |
| 0.5 | - | 92.76 | 94.77 | 100.00 | 100.00 e | 99.82 | - | - | - | - | |
| 1 | 94.65 | - | 89.86 | 97.02 | 99.03 f | 99.74 | - | - | - | - | |
| 2 | 84.10 | - | 81.93 | - | - | 99.56 | - | - | - | - | |
| 0 | 0.1 | - | - | - | - | - | 85.34 | 88.95 | 97.00 | 81.99 | 100.02 |
| 0.2 | 86.42 c | 81.54 | - | 85.08 | - | - | - | - | |||
| 0.5 | - | - | 69.10 | 78.81 | 99.07 e,g | 84.70 | - | - | - | - | |
| 1 | 78.47 | - | 57.05 | 77.15 | 98.06 f,g | 83.74 | - | - | - | - | |
| 2 | 68.64 | - | 40.89 | - | - | 82.17 | - | - | - | - | |
| −10 | 0.1 | - | - | - | - | - | - | 81.43 | 91.67 | 35.83 | 98.63 |
| 0.2 | - | - | 64.03 | - | - | - | - | - | - | - | |
| 0.5 | - | - | 47.86 | 74.50 | - | - | - | - | - | - | |
| 1 | - | - | 32.96 | 74.83 | - | - | - | - | - | - | |
| 2 | - | - | 10.46 | - | - | - | - | - | - | - | |
| −20 | 0.1 | - | 63.79 | - | - | - | 67.16 | 49.69 | 65.68 | 3.49 | 95.19 |
| 0.2 | 63.29 c,d | 51.72 | - | - | - | 61.71 | - | - | - | - | |
| 0.5 | - | 19.66 | - | 60.60 | - | 54.30 | - | - | - | - | |
| 1 | 56.50 d | - | - | 71.19 | - | 33.97 | - | - | - | - | |
| 2 | 26.88 d | - | - | - | - | 23.37 | - | - | - | - | |
| Cell No. | Cell (1) | Cell (2) | Cell (3) | Cell (4) |
|---|---|---|---|---|
| Anode | LiC | LiC | LTO | LTO |
| Cathode | NCA | LFP | LFP | LMO |
| Nominal capacity (Ah) | 3.40 | 1.10 | 0.13 | 10.00 |
| Battery type | Cylindrical | Cylindrical | Pouch | Prismatic |
| Ea,cathode (kJ/mol) | 39.6 | 38.5 | 46.3 | 10.2 |
| Ea,anode (kJ/mol) | 19.7 | 21.1 | 19.6 | 9.5 |
| fa | 0.50 | 0.45 | 0.58 | 0.07 |
| Nominal Capacity (Ah) | Battery Type | Material | SOC | T (°C) | Point a | Point b a | Point c | Ref. |
|---|---|---|---|---|---|---|---|---|
| 3.100 | 18650 | - | 0.2 C-rate d | −10 | (0.81, 0) b | (1.00, 1.00) b | (1.16, 0.50) b | [66] |
| 0.5 C-rate d | (0.95, 0) b | (1.09, 0.73) b | (1.21, 0.40) b | |||||
| 1 C-rate d | (1.15, 0) b | (1.33, 0.57) b | (1.39, 0.41) b | |||||
| - | - | NCM | 50% | 25 | (0.66, 0) | (1.00, 1.00) | (1.32, 0.14) | [67] |
| 50% | 10 | (0.81, 0) | (2.54, 4.15) | (4.19, 0.69) | ||||
| 50% | −5 | (1.23, 0) | (12.31, 28.34) | (23.83, 3.62) | ||||
| 50% | −15 | (1.23, 0) | (35.36, 85.35) | (67.96, 11.99) | ||||
| 90% | 0 | (0.96, 0) | (6.73, 14.03) | (12.30, 2.18) | ||||
| 100% | (0.96, 0) | (8.82, 17.66) | (16.81, 4.74) | |||||
| 2.300 | High-quality Cylindrical 26650 | LFP | - | RT | (0.87, 0) | (1.00, 1.00) | (1.24, 0.53) | [56] |
| 0 | (0.83, 0) | (0.94, 0.80) | (1.12, 0.50) | |||||
| −18 | (0.85, 0) | (1.01, 1.04) | (1.23, 0.59) | |||||
| 0.800 | - | - | - | 20 | (0.42, 0) | (1.00, 1.00) | (1.24, 0.40) | [65] |
| 0 | (0.66, 0) | (2.68, 4.14) | (3.71, 1.84) | |||||
| −5 | (0.72, 0) | (3.94, 6.45) | (5.39, 2.72) | |||||
| −10 | (0.85, 0) | (5.61, 10.32) | (8.05, 4.39) | |||||
| −15 | (0.99, 0) | (8.32, 16.68) | (12.43, 7.50) | |||||
| −20 | (1.17, 0) | (14.15, 28.56) | (19.91, 12.10) | |||||
| 1.000 | - | - | - | 5 | (0.23, 0) c | (1.00, 1.00) c | (1.65, 0.28) c | [68] |
| 0 | (0.26, 0) c | (1.51, 1.69) c | (2.46, 0.50) c | |||||
| −5 | (0.30, 0) c | (2.29, 3.07) c | (4.10, 0.90) c | |||||
| −10 | (0.30, 0) c | (4.00, 5.54) c | (6.82, 1.98) c | |||||
| −15 | (0.33, 0) c | (6.32, 10.14) c | (11.27, 4.65) c | |||||
| −20 | (0.36, 0) c | (11.38, 18.74) c | (19.14, 11.61) c | |||||
| 3.000 | 18650 | NCM | - | 23 f | (0.79, 0) e | (1.00, 1.00) e | (1.14, 0.48) e | [69] |
| 10 f | (1.32, 0) e | (1.62, 1.63) e | (1.86, 0.68) e | |||||
| 0 f | (1.58, 0) e | (1.93, 2.51) e | (2.39, 1.04) e | |||||
| −10 f | (1.80, 0) e | (2.29, 3.30) e | (2.85, 1.08) e | |||||
| 2.600 | 18650 | NCA | - | 23 f | (0.60, 0) e | (1.00, 1.00) e | (1.25, 0.78) e | |
| 10 f | (0.59, 0) e | (0.90, 0.67) e | (1.06, 0.48) e | |||||
| 0 f | (0.93, 0) e | (1.23, 1.00) e | (1.49, 0.37) e | |||||
| −10 f | (0.74, 0) e | (1.02, 0.90) e | (1.21, 0.29) e | |||||
| 1.500 | 18650 | NCM | - | 23 f | (0.37, 0) e | (1.00, 1.00) e | (1.66, 0.67) e | |
| 10 f | (0.37, 0) e | (1.30, 1.50) e | (2.23, 0.96) e | |||||
| 0 f | (0.37, 0) e | (1.58, 1.94) e | (2.66, 1.11) e | |||||
| −10 f | (0.37, 0) e | (1.00, 1.00) e | (1.56, 0.72) e |
| Material | Model | Parameterization Conditions | Modeling Considerations | Validation Conditions | Modeling Accuracy Evaluation | Ref. | ||||
|---|---|---|---|---|---|---|---|---|---|---|
| NCM | Figure 9b | T SOC I | −30~−10 °C 0~100% 0.1~0.5 C-rate | −30 °C, 0.1~0.5 C-rate | MPE 0.38~4.3% | APE 0.24~0.5% | [78] | |||
| LTO | Figure 9c | T SOC I | 5~45 °C 10~90% 1~4 C-rate | 5 °C, 1 C-rate | ME C 28.68 mV | ME P 4.45 mV | [80] | |||
| 5 °C FUDS Test | ME C 228.9 mV | ME P 81.7 mV | ||||||||
| NMC LCO LFP | Figure 9d | T f | −15~0.3 °C 50~5k Hz | −15~−10 °C, 50~5k Hz | MRE 1.68~2.12% | AE 13.6~26.7 mV | [81] | |||
| NMC | Figure 9b | T SOC I | −20~45 °C 10~100% 0.5~4 C-rate | −20 °C and −10 °C, 0.5~5 C-rate Disch. | RMSE < 0.1 V | [79] | ||||
| NMC | Figure 9b | T SOC | −10~55 °C 0~100% | −10 °C | RMSE | 3.98% | MAEE | 1.91% | [82] | |
| 0 °C | 2.93% | 1.27% | ||||||||
| 25 °C | 2.66% | 1.00% | ||||||||
| 45 °C | 3.00% | 0.80% | ||||||||
| LFP | Figure 9b | T SOC | −20~25 °C 0~100% | Under the real driving cycle conditions at −20 °C | AE < 3% | [63] | ||||
| Material | Working Condition | Change | Contrast Accuracy | Ref. | ||
|---|---|---|---|---|---|---|
| T | I | |||||
| NMC | −15~25 °C | - | AE | <5% | [90] | |
| NMC | −20~0 °C | 0.2~1 C-rate | ; ; ; ; ; | ME | <10% | [91] |
| LFP | −20~25 °C | - | AE CA AE CY AE R | 2.3% 3.2% 8.5% | [92] | |
| NMC | −5 °C | 1/6 C-rate | AE CL | 0.064% | [54] | |
| 1/3 C-rate | AE CL | 0.324% | ||||
| 2/3 C-rate | AE CL | 0.149% | ||||
| 1 C-rate | AE CL | 0.472% | ||||
| 2 C-rate | AE CL | 1.605% | ||||
| Heating Techniques | Battery Type | Temperature Range (°C) | Rate of Temperature Rise (°C/min) | Capacity Used | Other Key Parameters | Ref. |
|---|---|---|---|---|---|---|
| CCD heating | NCA 18650 2.60 Ah | −10.0~5.0 | 3.21 (2 C-rate) | 15.0% | - | [93] |
| −10.0~5.0 | 0.83 (1 C-rate) | 30.0% | ||||
| NCM 18650 2.20 Ah | −20.0~20.0 | 5.00 (2 C-rate) | 23.3% | - | [94] | |
| 10.00 (3 C-rate) | 20.0% | |||||
| 17.50 (4 C-rate) | 15.1% | |||||
| CVD heating | NCM 18650 2.20 Ah | −20.0~20.0 | 6.70 (2.8 V) | 23.0% | - | [94] |
| 12.00 (2.5 V) | 17.5% | |||||
| 18.60 (2.2 V) | 14.2% | |||||
| NCM Laminated 8.00 Ah | −30.0~2.1 | 18.70 (2.43 V) | 20.0% | Capacity fade 1.40% (500 cycle) 4.95% (2000 cycle) | [95] | |
| AC heating | NCA 18650 2.80 Ah | −20.0~5.0 | 1.67 | - | [96] | |
| NCM 18650 2.20 Ah | −20.0~20.0 | 30.00 (1000 Hz) | - | - | [94] | |
| 14.10 (60 Hz) | ||||||
| 8.80 (1 Hz) | ||||||
| 8.60 (0.1 Hz) | ||||||
| 7.10 (0.01 Hz) | ||||||
| CPV heating | NCM 18650 2.75 Ah | −15.4~5.6 | 3.73 | - | - | [97] |
| AC + DC heating | NCM Laminated 35.00 Ah 12 cells pack | −20.8~2.1 | 2.29 | 6.6% | Temperature gradient <1.60 °C Capacity fade 0.43% (600 cycle) | [98] |
| Pulse heating | LCO 18650 2.00 Ah | −10.0~10.0 | 6.74 | - | Capacity fade 20.00% (180 cycle) | [99] |
| Mutual pulse heating | NCM 18650 2.20 Ah | −20.0~20.0 | 11.66 (2.8 V) | 4.9% | - | [94] |
| 19.90 (2.5 V) | 5.2% | |||||
| 29.82 (2.2 V) | 5.1% | |||||
| SHLB heating | NCM ACB a cell 7.50 Ah | −20.0~0.0 | 60.00 (single) | 3.8% | Added weight 1.50% Added cost 0.04% Capacity fade 7.20% (500 cycle) | [107] |
| −30.0~0.0 | 60.00 (single) | 5.5% | ||||
| Air heating | NCM 18650 2.20 Ah | −20.0~20.0 | 11.94 (0.8 Ω 3.34 V) | 7.5% | - | [94] |
| 16.58 (0.6 Ω 3.25 V) | 7.2% | |||||
| 28.71 (0.4 Ω 3.07 V) | 6.7% | |||||
| 18650 1.50 Ah 5S3P b | −15.0~10.0 | 2.50 | - | Temperature gradient 14.49 °C | [101] | |
| PCM preheating | 18650 1.50 Ah 5S3P b | −15.0~10.0 | 0.74 | - | Temperature gradient 2.82 °C | [101] |
| Liquid preheating | Prismatic 12 cells | −28~25 | 4.18 | - | Temperature gradient <4.00 °C | [100] |
| Electric heating element heating | Pack 50.00 Ah 5P | −20.0~20.0 | 5.85 (heating film) | - | - | [102] |
| 4.78 (UMHP) | ||||||
| Hybrid heating | NCM Laminated 8.00 Ah | −30.0~2.0 | 31.13 | - | Temperature gradient 13.38 °C Capacity fade 0.79% (500 cycle) | [103] |
| NCMA c 18650 3.20 Ah 5S2P | −10.0~20.0 | 17.14 | 4.4% | Temperature gradient 3.58 °C | [104] | |
| Laminated 13.50 Ah | −20.0~0.0 | 11.22 | 4.0% | - | [105] | |
| NCM Laminated 8.00 Ah | −29.8~−2.0 | 32.49 | 10.9% | Capacity fade 1.02% (500 cycle) 3.58% (2000 cycle) Temperature gradient 14.79 °C | [106] |
Disclaimer/Publisher’s Note: The statements, opinions and data contained in all publications are solely those of the individual author(s) and contributor(s) and not of MDPI and/or the editor(s). MDPI and/or the editor(s) disclaim responsibility for any injury to people or property resulting from any ideas, methods, instructions or products referred to in the content. |
© 2023 by the authors. Licensee MDPI, Basel, Switzerland. This article is an open access article distributed under the terms and conditions of the Creative Commons Attribution (CC BY) license (https://creativecommons.org/licenses/by/4.0/).
Share and Cite
Sun, B.; Qi, X.; Song, D.; Ruan, H. Review of Low-Temperature Performance, Modeling and Heating for Lithium-Ion Batteries. Energies 2023, 16, 7142. https://doi.org/10.3390/en16207142
Sun B, Qi X, Song D, Ruan H. Review of Low-Temperature Performance, Modeling and Heating for Lithium-Ion Batteries. Energies. 2023; 16(20):7142. https://doi.org/10.3390/en16207142
Chicago/Turabian StyleSun, Bingxiang, Xianjie Qi, Donglin Song, and Haijun Ruan. 2023. "Review of Low-Temperature Performance, Modeling and Heating for Lithium-Ion Batteries" Energies 16, no. 20: 7142. https://doi.org/10.3390/en16207142
APA StyleSun, B., Qi, X., Song, D., & Ruan, H. (2023). Review of Low-Temperature Performance, Modeling and Heating for Lithium-Ion Batteries. Energies, 16(20), 7142. https://doi.org/10.3390/en16207142