Article

Influence Analysis of Runner Inlet Diameter of Hydraulic Turbine in Turbine Mode with Ultra-Low Specific Speed

1
School of Power and Mechanical Engineering, Wuhan University, Wuhan 430072, China
2
College of Energy and Power Engineering, North China University of Water Resources and Electric Power, Zhengzhou 450045, China
3
Nuclear Power Plants and Renewable Energy Sources Department, Ural Federal University, 620002 Yekaterinburg, Russia
*
Author to whom correspondence should be addressed.
Energies 2023, 16(20), 7086; https://doi.org/10.3390/en16207086
Submission received: 9 September 2023 / Revised: 5 October 2023 / Accepted: 11 October 2023 / Published: 13 October 2023
(This article belongs to the Special Issue Fault Diagnosis and Control in Renewable Power Systems)

Abstract

:
The hydraulic turbine in turbine mode (HTTM) with an ultra-low specific speed (HTTM-ULSS) has the advantages of a simplified structure, high efficiency, and good stability and has great application value in the industry. However, the influence of the runner inlet diameter (D1) on the performance of HTTM-ULSS has not yet been fully studied. Therefore, the three-dimensional models of Francis runners were established in the ultra-low specific speed range by examining D1 = 0.49 m, 0.5 m, and 0.51 m, and the two-stage hydraulic turbine models were constructed with flow passage components. Then, internal flow and energy characteristics were calculated using Fluent 16.0 software. Further, the influence of D1 on HTTM performance was studied by comparing numerical simulation results. The results show that the water head of the HTTM-ULSS can reach 540.87 m when D1 = 0.51 m, showing its powerful ability to recover the pressure energy in high-pressure water. Moreover, the head and efficiency are closely related to D1; when D1 increases, the circulation at the runner inlet increases, resulting in an enhancement in the ability to recover the water head and decreases in efficiency and in the operating range of the high-efficiency zone; with D1 increasing, the flow pattern inside the runner becomes better, but the high-pressure area of the blade increases. When selecting the D1, attention should not only be paid to the ability to recover the water head but also to the pressure of the runner blades and the internal water flow pattern.

1. Introduction

For a large amount of high residual pressure liquids in industries such as petrochemical, petroleum processing, seawater desalination, and steel metallurgy, pressure-reducing valves or orifice plates are usually used to reduce these fluids to the required low pressure, which means that large pressure energy in fluids is wasted [1,2,3,4,5,6]. To reduce energy waste, some enterprises use hydraulic turbine devices to recycle and utilize pressure energy [7,8,9]. The hydraulic turbine, as an energy recovery device, is used to achieve the goal of energy recovery by converting the pressure energy of the liquid into the rotating mechanical energy of the turbine runner [10,11,12,13,14]. At present, in the field of high residual pressure fluid recovery, reverse multi-stage pumps are often used as turbines for energy recovery [9,15,16]. However, when reverse pump turbines operate under non-design conditions, their performance decreases significantly, and they even become energy-consuming devices, resulting in secondary energy waste. In addition, due to the low energy head of the reverse pump–turbine runner stage, more stages are required to meet the usage requirements during the high residual pressure recovery process, which leads to lower overall efficiency and poor stability [17,18,19]. The HTTM-ULSS, which adopts the Francis runner with an ultra-low specific speed, can solve the above problems. Compared to the pump-type runner, under the same structural size and working conditions, the single-stage Francis runner has a strong ability to recover the pressure energy. By adopting the Francis runner, the HTTM-ULSS has fewer stages, a simpler structure, higher efficiency, and better stability [20].
At present, some scholars have conducted relevant research on the characteristics and component type selection of HTTM-ULSS using numerical simulation methods. To improve HTTM-ULSS performance, Chen [21] proposed an HTTM-ULSS runner optimization strategy based on the orthogonal experimental method and computational fluid dynamics (CFD) and further optimized the performance of the runner. The results showed that the efficiency of the optimized HTTM increased by 10.9%, the water head increased by 26.75 m, and the power increased by 646.32 kW, significantly reducing pressure loss during the residual pressure recovery process. To improve the water head, the efficiency of the optimized HTTM-ULSS was increased by 2.61%, and the flow pattern became more regular and stable. In particular, to improve the efficiency of the optimized HTTM-ULSS, the water head was increased by 185.53 m and the power by 1518.3 kW, greatly improving the ability of HTTM-ULSS to recover the pressure energy. Zhang [20] studied the influence of the number of blades on HTTM-ULSS performance, and the results showed that, compared to the traditional design method of using equal blade numbers for the first and second-stage runners, using different blade numbers for the two-stage runners can effectively avoid the superposition of pressure fluctuations and increase HTTM-ULSS hydraulic efficiency. Li [22] studied the effect of rotational speed on HTTM-ULSS performance, and the results showed that, when the flow rate is high, increasing the rotational speed widens the efficient zone of the runner, increases the inlet circulation, decreases the outlet circulation, and reduces the pressure pulsation inside the runner. Based on this result, it can be concluded that HTTM should operate at or above the rated speed.
There has been research on the selection of the flow passage components of HTTM-ULSS, but there is still a lack of research on the influence of runner geometric parameters on HTTM-ULSS performance. As an important channel component of the HTTM-ULSS, the runner’s geometric parameters such as the D1, outlet diameter, inlet height, number of blades Z, and blade inlet placement angle have a significant impact on HTTM-ULSS performance. Especially, the inlet diameter of the runner directly affects the ability of the runner to recover the pressure energy and further affects the flow pattern of the internal water and hydraulic performance of the HTTM-ULSS. A reasonable selection of the inlet diameter of the runner is of great significance for improving the performance of hydraulic turbines. Therefore, this article considers a reasonable range of D1 values within the ultra-low specific speed range (specific speed ns < 100) and takes three two-stage hydraulic turbine models with D1 = 0.49 m, 0.5 m, and 0.51 m as research objects. Fluent 16.0 simulation software [2,7] is used to conduct steady calculations on different operating conditions, and the influence of D1 on the HTTM-ULSS performance is studied.
The remainder of this paper is organized as follows. Section 2 introduces the design method of the HTTM-ULSS runner in detail. Then, the two-stage HTTM-ULSS model is constructed in Section 3. Subsequently, Section 4 introduces and verifies the numerical calculation method for the HTTM-ULSS model. Section 5 analyzes the external and internal characteristics of the HTTM-ULSS through the calculation results. Finally, the conclusions are provided in Section 6.

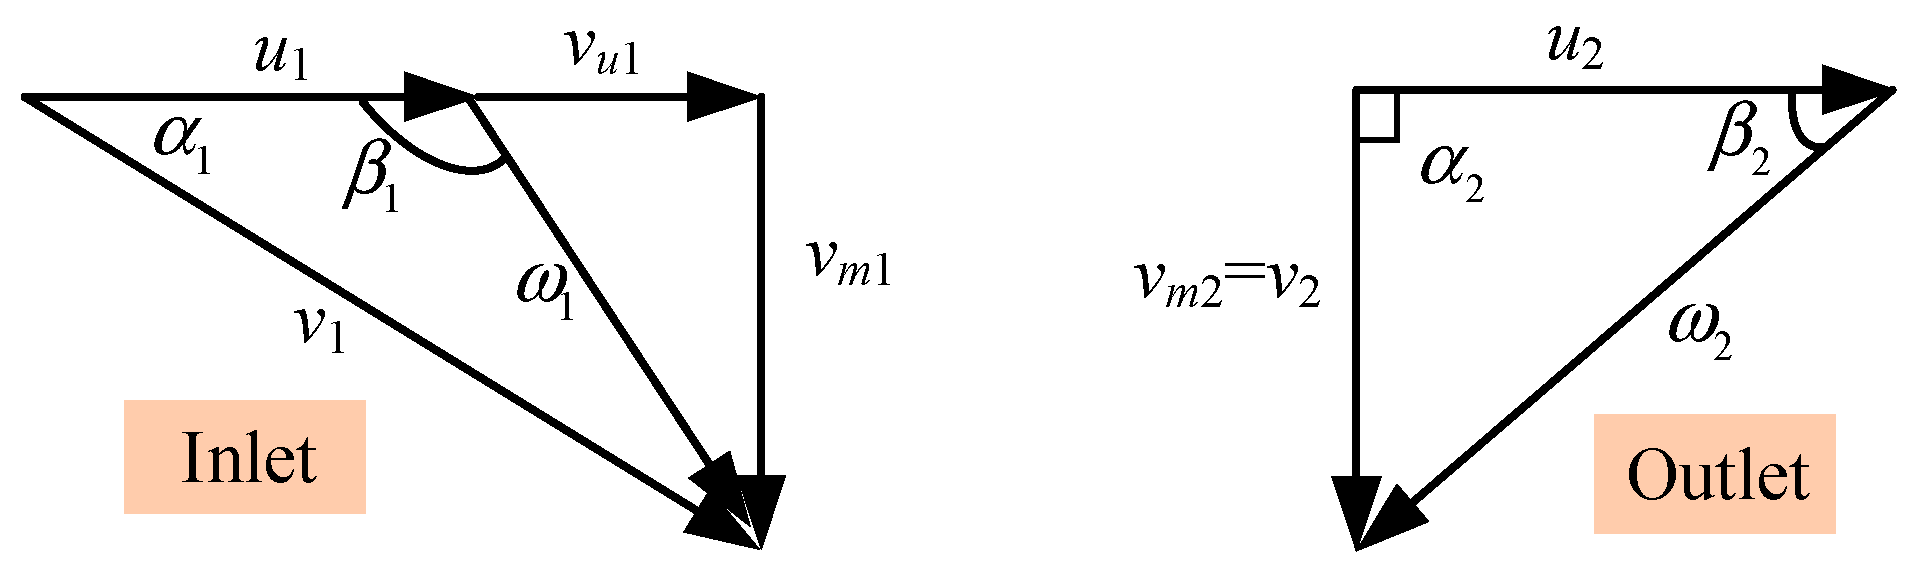
2. Theoretical Analysis

The HTTM-ULSS, which is designed according to the design theory and circulation requirement of the hydraulic turbine, contains the flow components of the first-stage guide vane, an inter-stage guide vane, two runners, and inlet and outlet chambers [21].
As for the hydraulic turbine, the effective utilization water head He satisfies Equation (1) [20]. When assuming a normal exit, Equation (1) can be expressed as Equation (2).
H e = H r η = ω 2 π g ( C 1 C 2 )
H e = ω 2 π g C 1
where Hr is the design water head; ω is the angular velocity of the runner, ω = 2πn/60, where n is the rotating speed; g is the gravitational acceleration. C1 and C2 are the water circulation at the inlet and outlet of the runner, C 1 = π D 1 v u 1 , C 2 = π D 2 v u 2 . Among them, D2 is the outlet diameter of the runner, and vu1 and vu2 are the circumferential components of the absolute water flow velocity (v1 and v2) at the runner inlet and outlet, respectively.
Equation (1) can also be expressed as Equation (3) [21]. When assuming a normal exit, Equation (3) can be simplified as Equation (4).
H r η = ω 2 π g ( u 1 v u 1 u 2 v u 2 )
H r η = 1 g u 1 v u 1
where u1 is the circumferential speed at the runner inlet and u2 is the circumferential velocity at the runner outlet.
The calculation of the blade inlet and outlet angles is the key to the design of runner blades. The angle between the tangent line of the blade airfoil bone line at the inlet edge and the circumferential direction is the inlet angle of the blade β1. The angle between the tangent of the bone line at the outlet edge and the circumference is the outlet angle of the blade β2. The inlet and outlet angles of the blades are determined by the velocity triangle of the HTTM-ULSS runner. Figure 1 shows the velocity triangle of the HTTM-ULSS runner.
According to the determined design parameters of the runner, the inlet and outlet velocity triangles can be calculated using Equations (5)–(13) [21].
D 1 = H r H r Q 11
u 1 = π D 1 n 60
v u 1 = H r η g u 1
v m 1 = Q r π D 1 B
tan α 1 = v m 1 v u 1
tan β 1 = v m 1 u 1 v u 1
u 2 = π D 2 n 60
v m 2 = v 2 = Q r π D 1 B
tan β 2 = v m 2 u 2
where Qr is the design discharge; Q11 is the unit discharge and is taken as 0.25 based on empirical data; B is the height of the runner inlet.
Three parameters need to be determined when calculating the inlet speed triangle of the runner, which are u1, vu1, and vm1. For the calculation of the outlet velocity triangle of the HTTM-ULSS runner, the outlet water flow angle α2 is assumed to be at the normal outlet and α2 = 90°, that is, only u2 and vm2 need to be calculated.
According to the velocity triangle, as D1 increases, the circumferential component vu1 of the absolute velocity of the water flow at the inlet of the runner increases, and the inlet circulation C1 of the runner increases. According to Equation (2), the water head He that the runner can utilize increases. According to Equation (1), Hr increases with the increase in He, which means that the ability of the hydraulic turbine to recover the water head increases.

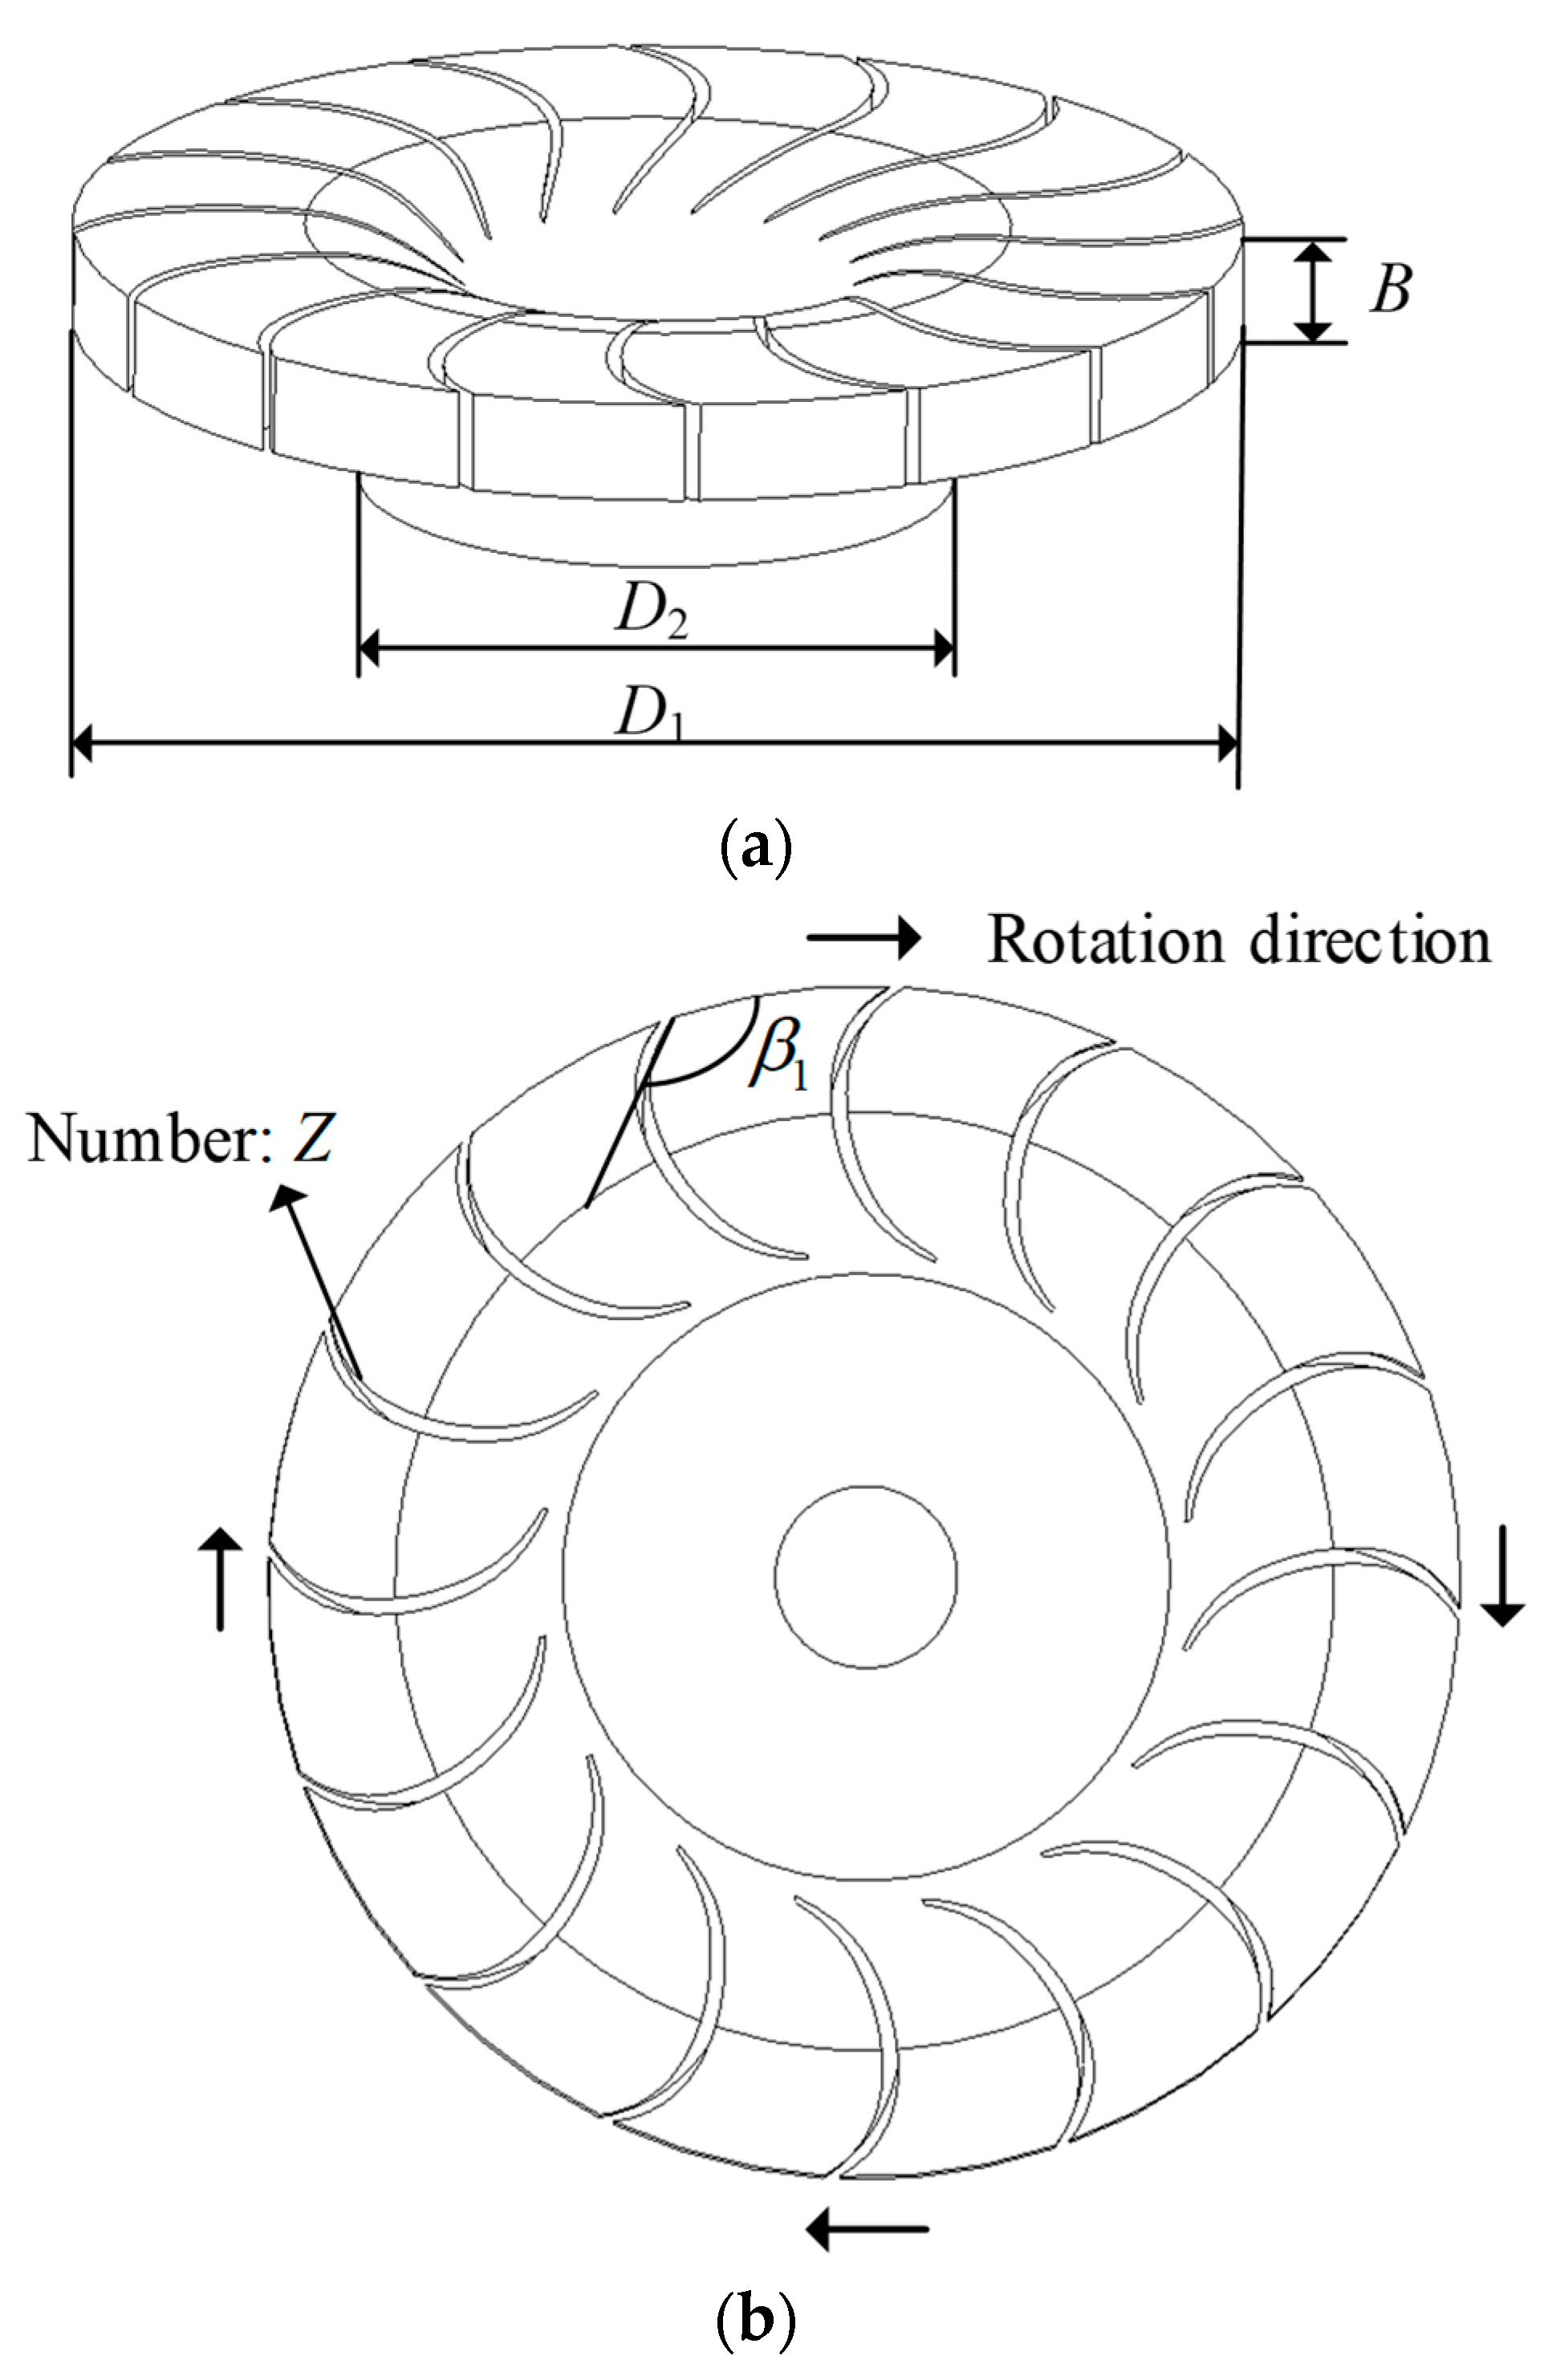
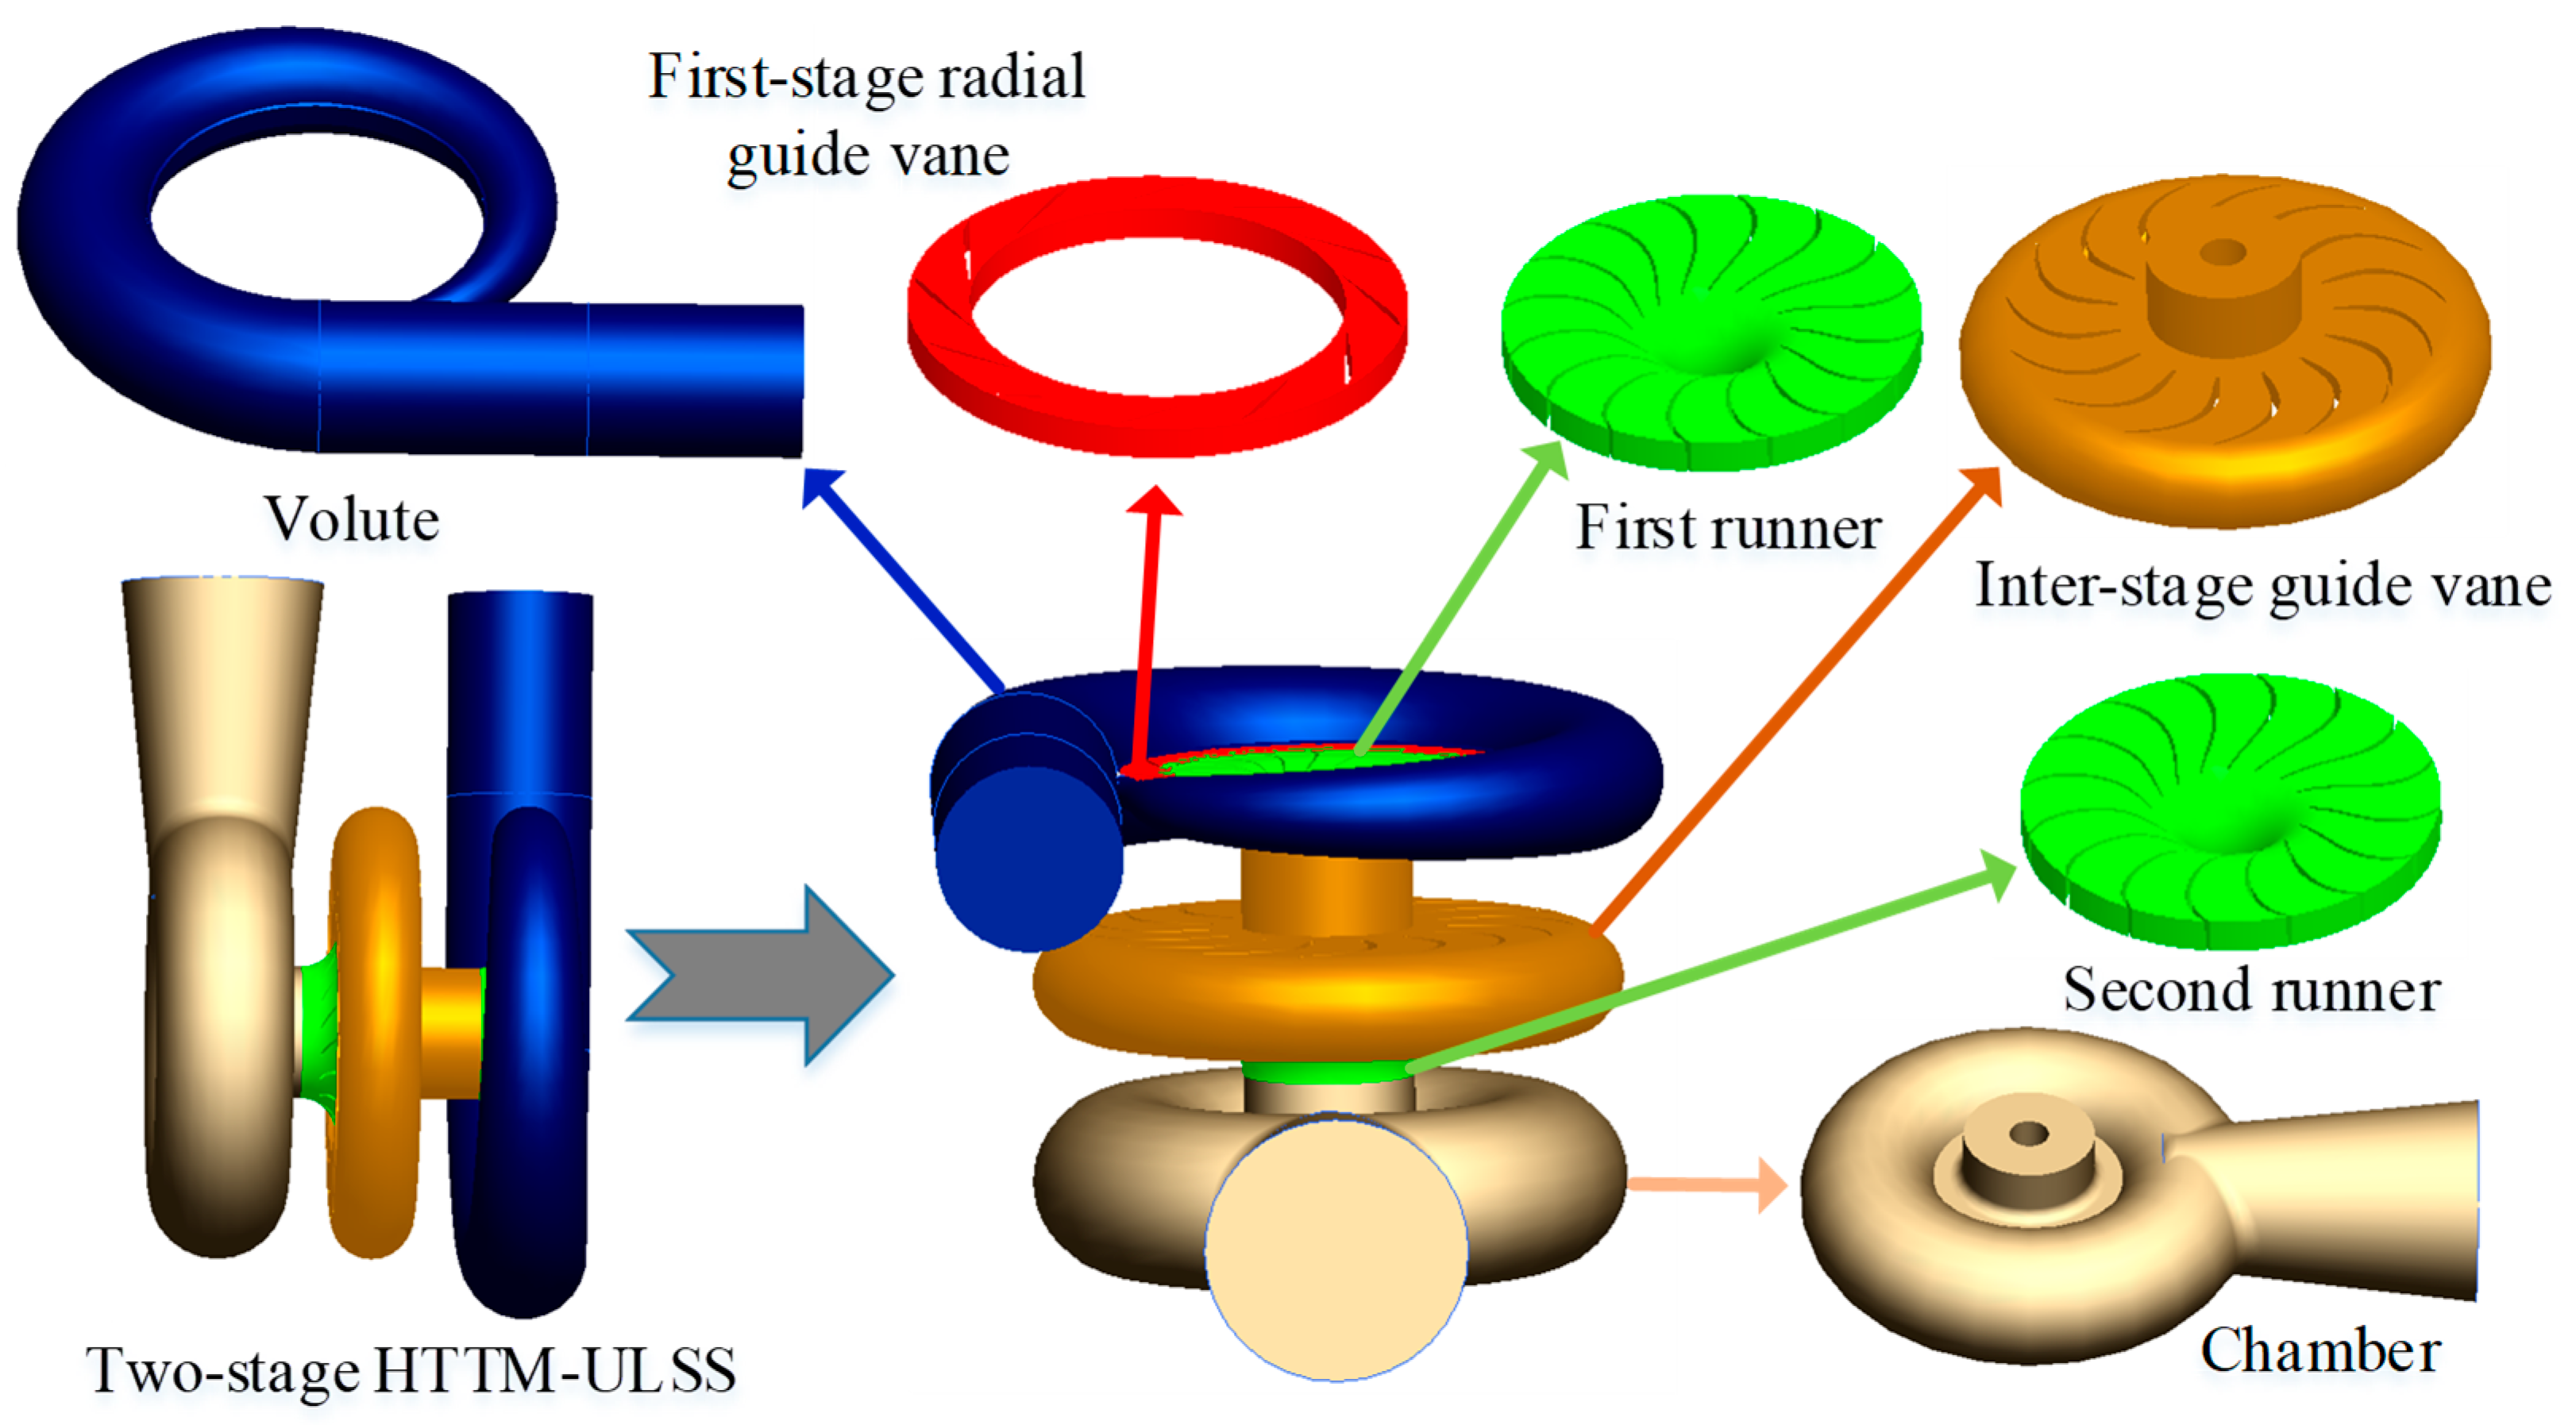
3. Computation Model

To explore the influence of different D1 on HTTM performance, a two-stage HTTM model needs to be constructed. This paper uses the runners with three D1 as the comparison, and the basic design parameters are shown in Table 1. According to Equation (14), the specific speeds ns of the three runners are calculated to be 85.6, 88.5, and 91.4, respectively. The schematic diagram of the HTTM-ULSS runner is shown in Figure 2.
n s = 3.65 n Q r H r 3 / 4
Based on Table 1, and by adopting Pro/E 5.0 software [23,24], three HTTM-ULSS runners were designed that can construct 3D models. Furthermore, the HTTM-ULSS models were constructed by combining these three runners and other flow passage components. Figure 3 shows the three-dimensional model of a two-stage HTTM-ULSS.

4. Numerical Calculation
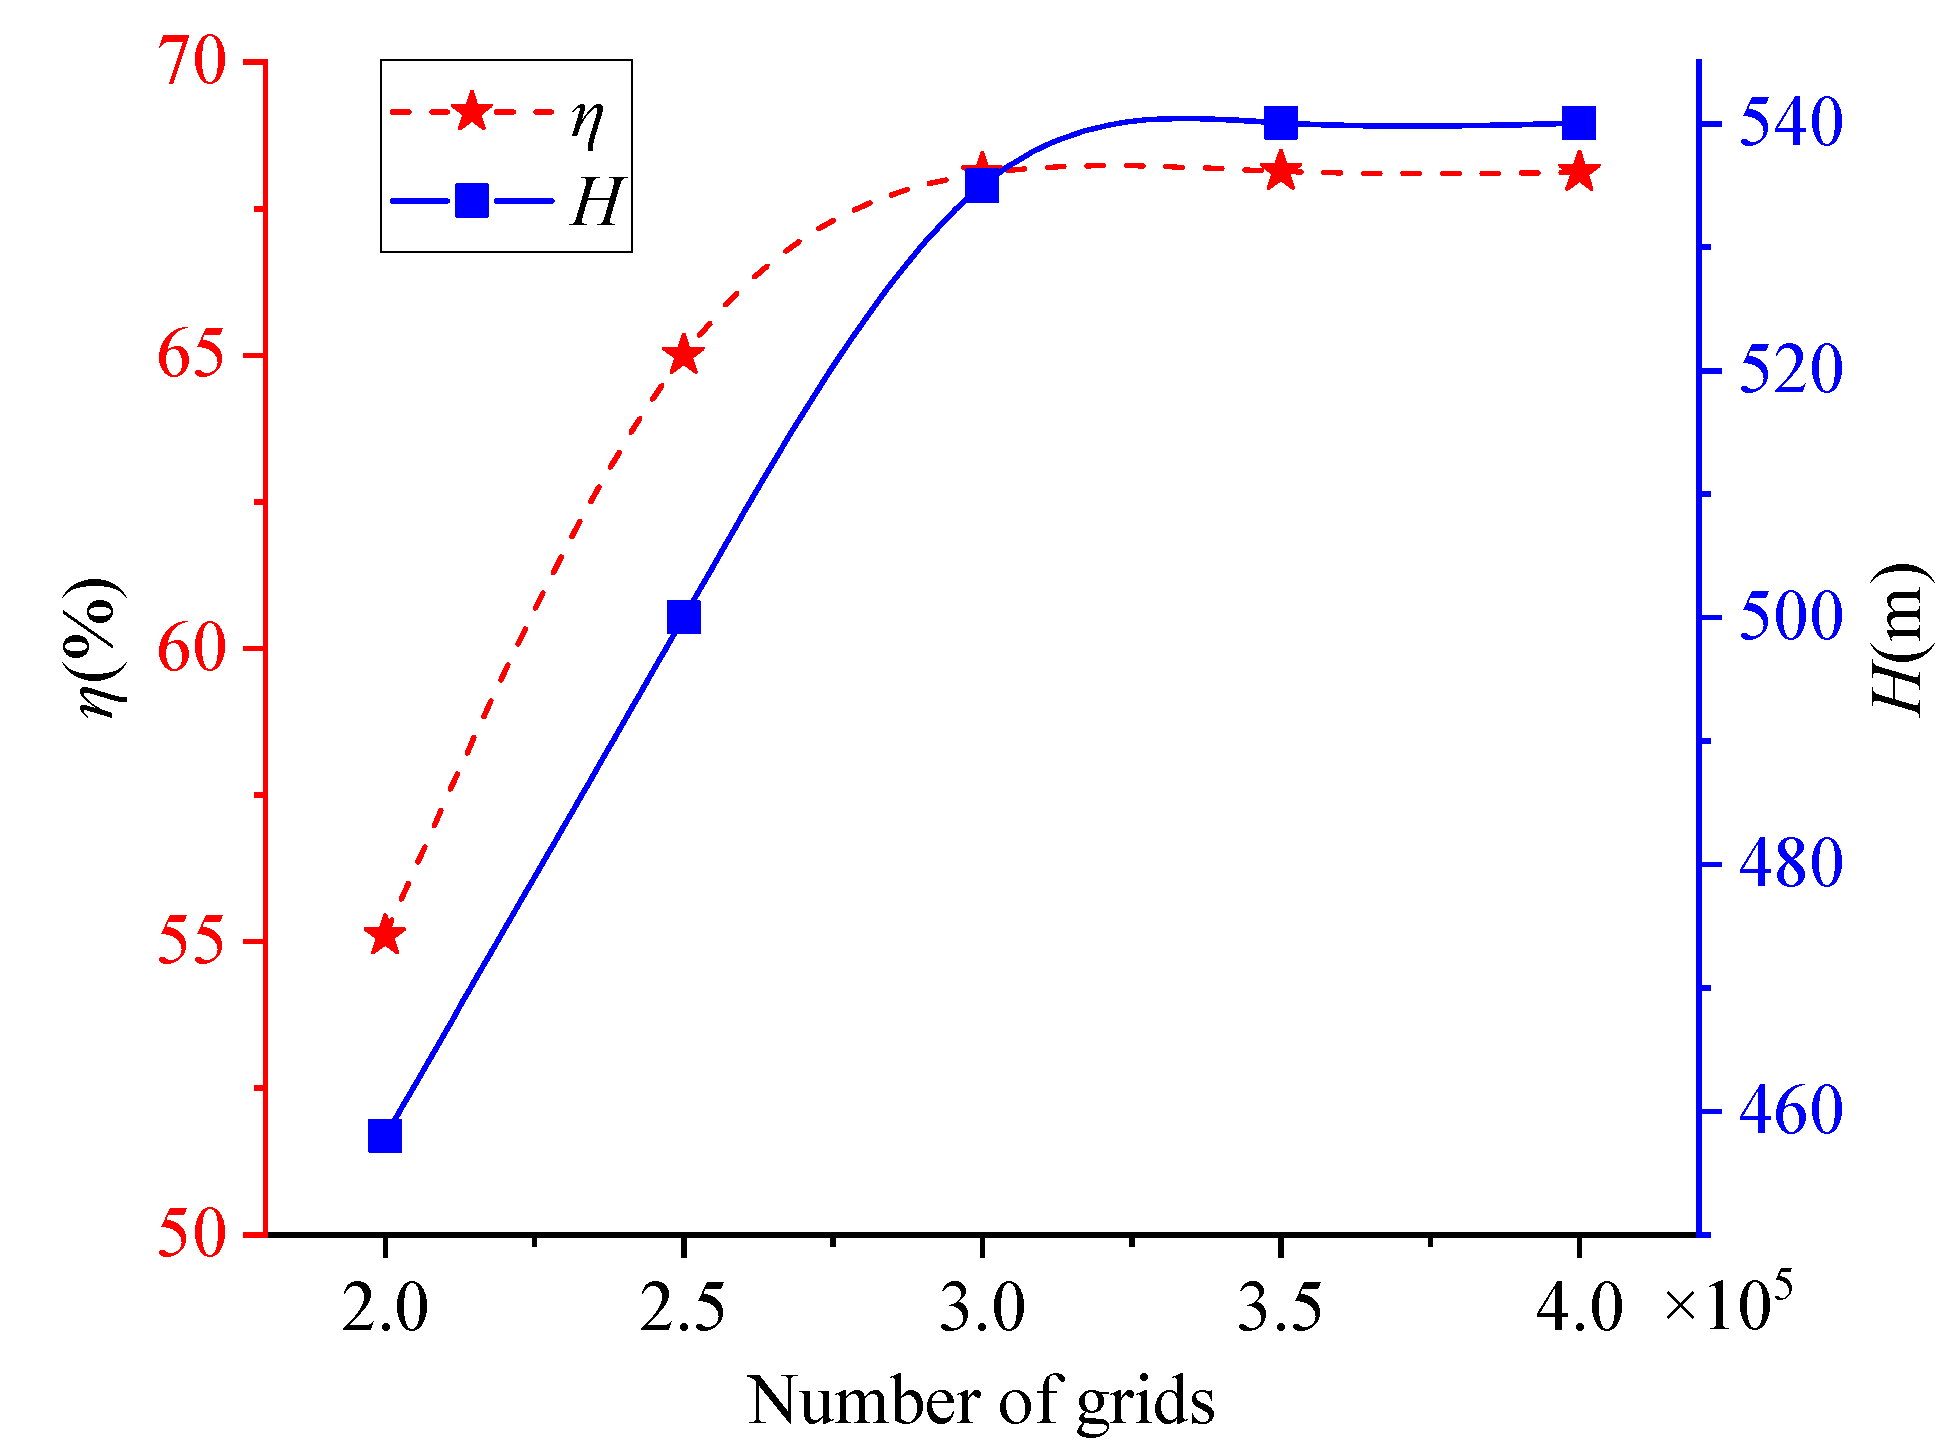
4.1. Mesh Division

The ICEM CFD 16.0 software, which is suitable for the mesh generation of complex structural models in the field of fluid mechanics, is used to mesh the three-dimensional HTTM model automatically after setting parameters such as mesh size [25,26]. Therein, the octree method is adopted to obtain the unstructured HTTM mesh model. Figure 4 shows the HTTM mesh model, where the mesh quality of each part is above 0.3, which ensures the accuracy of the numerical simulation.
The mesh number has an impact on the numerical calculation results but has little impact when the mesh number is sufficient. To determine the appropriate mesh number, this paper uses five mesh numbers to perform numerical calculations on the HTTM-ULSS model with D1 = 0.51 m and takes the water head H (m) and efficiency η (%) under rated operating conditions as comparative parameters. Figure 5 shows the mesh sensitivity result of the HTTM-ULSS model. From Figure 5, it can be seen that, as the mesh number increases, the water head and efficiency curves of the HTTM-ULSS gradually increase and begin to flatten out when the mesh number reaches 3 million. When the mesh number reaches 3.5 million, increasing the mesh number has a relatively small impact on the water head and efficiency, with both fluctuating within 0.3%. Therefore, this paper aims to reduce the impact of the mesh number on the numerical calculation results by increasing the mesh number in each HTTM-ULSS model to 3.5 million.

4.2. Boundary Conditions and Performance Parameter Calculation

Before using Fluent 16.0 simulation software [22,27] to calculate HTTM performance parameters, it is necessary to set the boundary conditions of the HTTM model. For inlet conditions, the velocity value is set in the direction perpendicular to the volute inlet. The inlet velocities v of the three HTTMs with D1 of 0.49 m, 0.5 m, and 0.51 m can be obtained using Equation (15), which are 13.8 m/s, 14.6 m/s, and 15.4 m/s, respectively. For the outlet conditions, the outlets of the three outlet chambers are all set as pressure-free outlets, i.e., the total pressure at the outlet of the draft tube Pout = 0 pa. For the fixed wall condition, this paper adopts the non-slip boundary; for the dynamic static interface, this paper adopts the dynamic static coupling surface. Other detailed parameter settings related to visual effects can be found in references [28,29,30]. H, η, and output P (kW) are key performance indicators for the HTTM-ULSS that can be used to compare the hydraulic performance of different HTTM-ULSS models and are calculated using Equations (16)–(18) [21].
v = Q A
H = P in P out ρ g
η = M ω ρ g Q H × 100 %
P = 2 π n M 60
where Q represents the working discharge of the hydraulic turbine; A is the inlet area of the volute; Pin is the total inlet pressure of the volute; ρ is the density of the liquid to be recovered; M is the shaft torque (N·m).
When calculating HTTM-ULSS performance parameters, the mass conservation and momentum conservation are adopted as the governing equation without considering the small heat exchange, and the finite volume method is used to discretize the mass conservation and momentum conservation and the standard k-ε turbulence model is selected [21]. Specifically, to obtain high computational accuracy, the solving convergence rate is set to 10−4 and the calculation step size is 1000 [21].

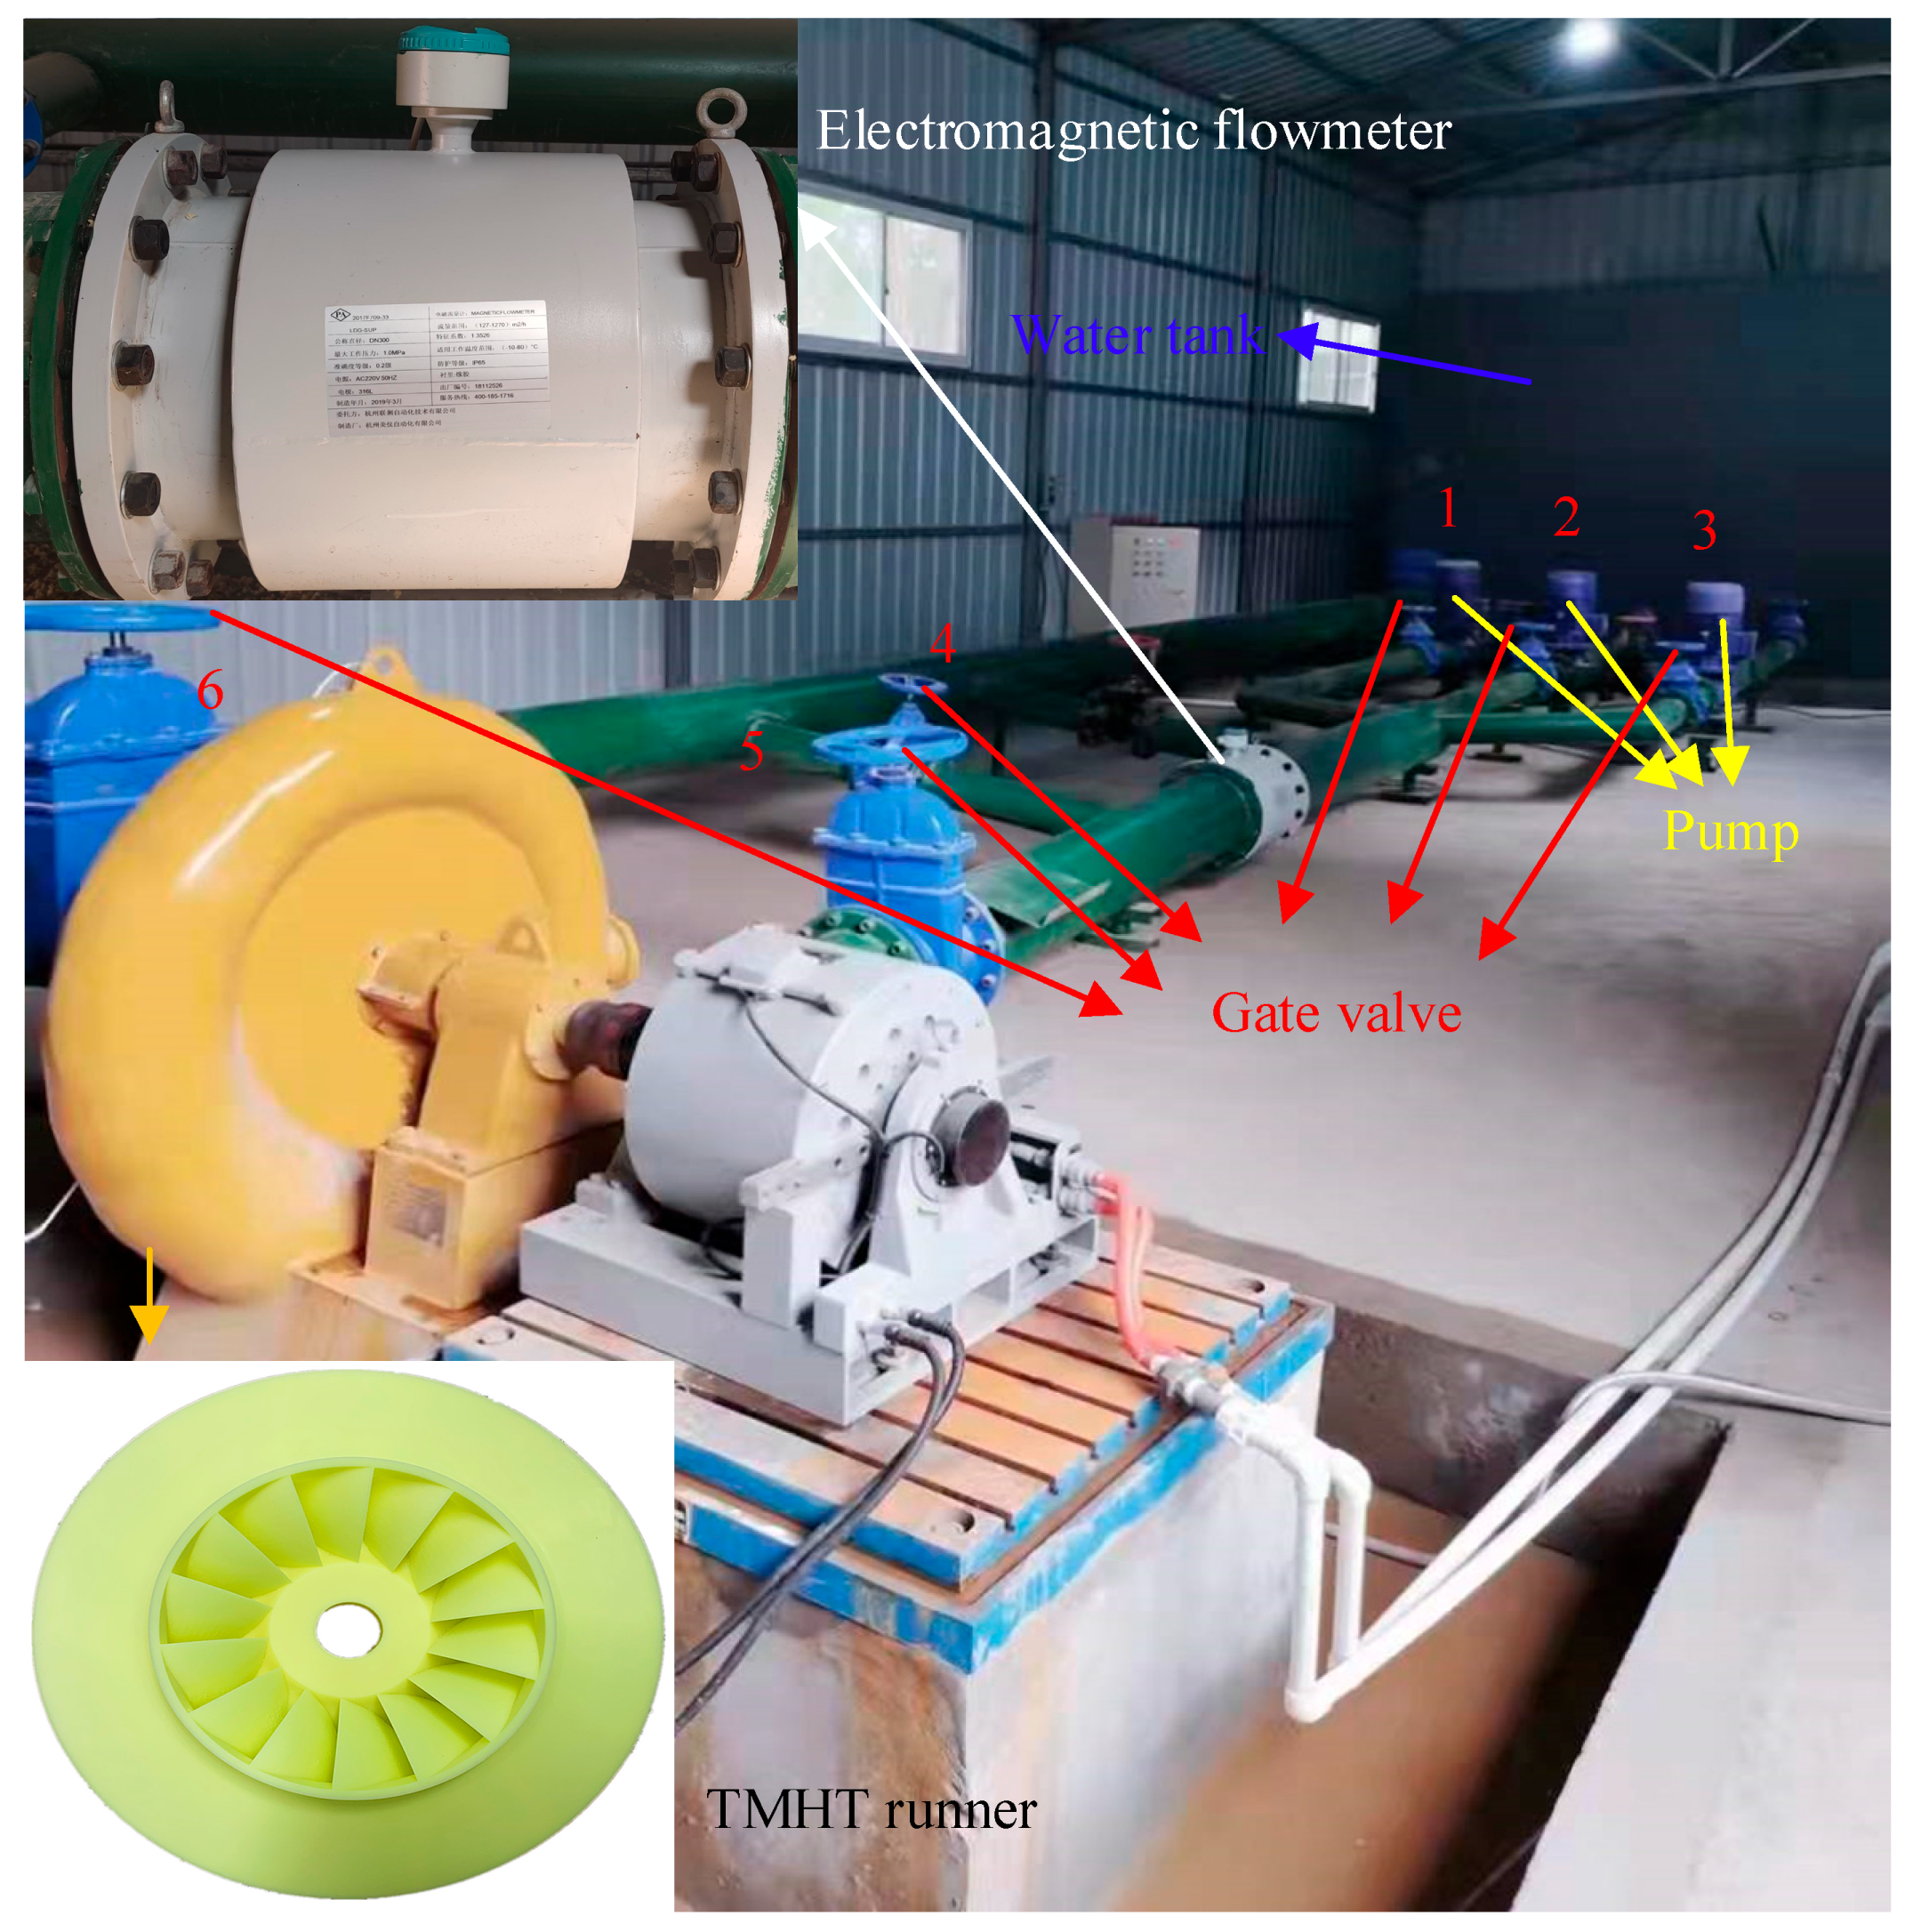
4.3. Test Verification

To verify the reliability of the numerical simulation, the external characteristic of a single-stage runner with 14 blades was tested. Figure 6 shows the test bench, where three booster pumps were used to provide the high inlet pressure of the hydraulic turbine; moreover, a dynamometer was adopted to measure the torque and rotational speed, and pressure sensors were installed at the inlet and outlet to measure the inlet and outlet pressure. The speed of the hydraulic turbine was 1500 r/min [21]. Through this bench, the H, η, and P of the single-stage runner can be obtained. Figure 7 shows the comparison results between the simulated data and test data. As shown in Figure 7, the change trends of the performance parameters in the test and numerical simulation of the hydraulic turbine are consistent. Since the numerical simulation did not consider mechanical loss and leakage, the hydraulic results obtained from the test results are slightly lower, which is consistent with the real-world situation. Overall, the error between the test result and the numerical simulation result is relatively small, indicating that the numerical calculation method used in this paper is reliable.

5. Analysis of Calculation Results

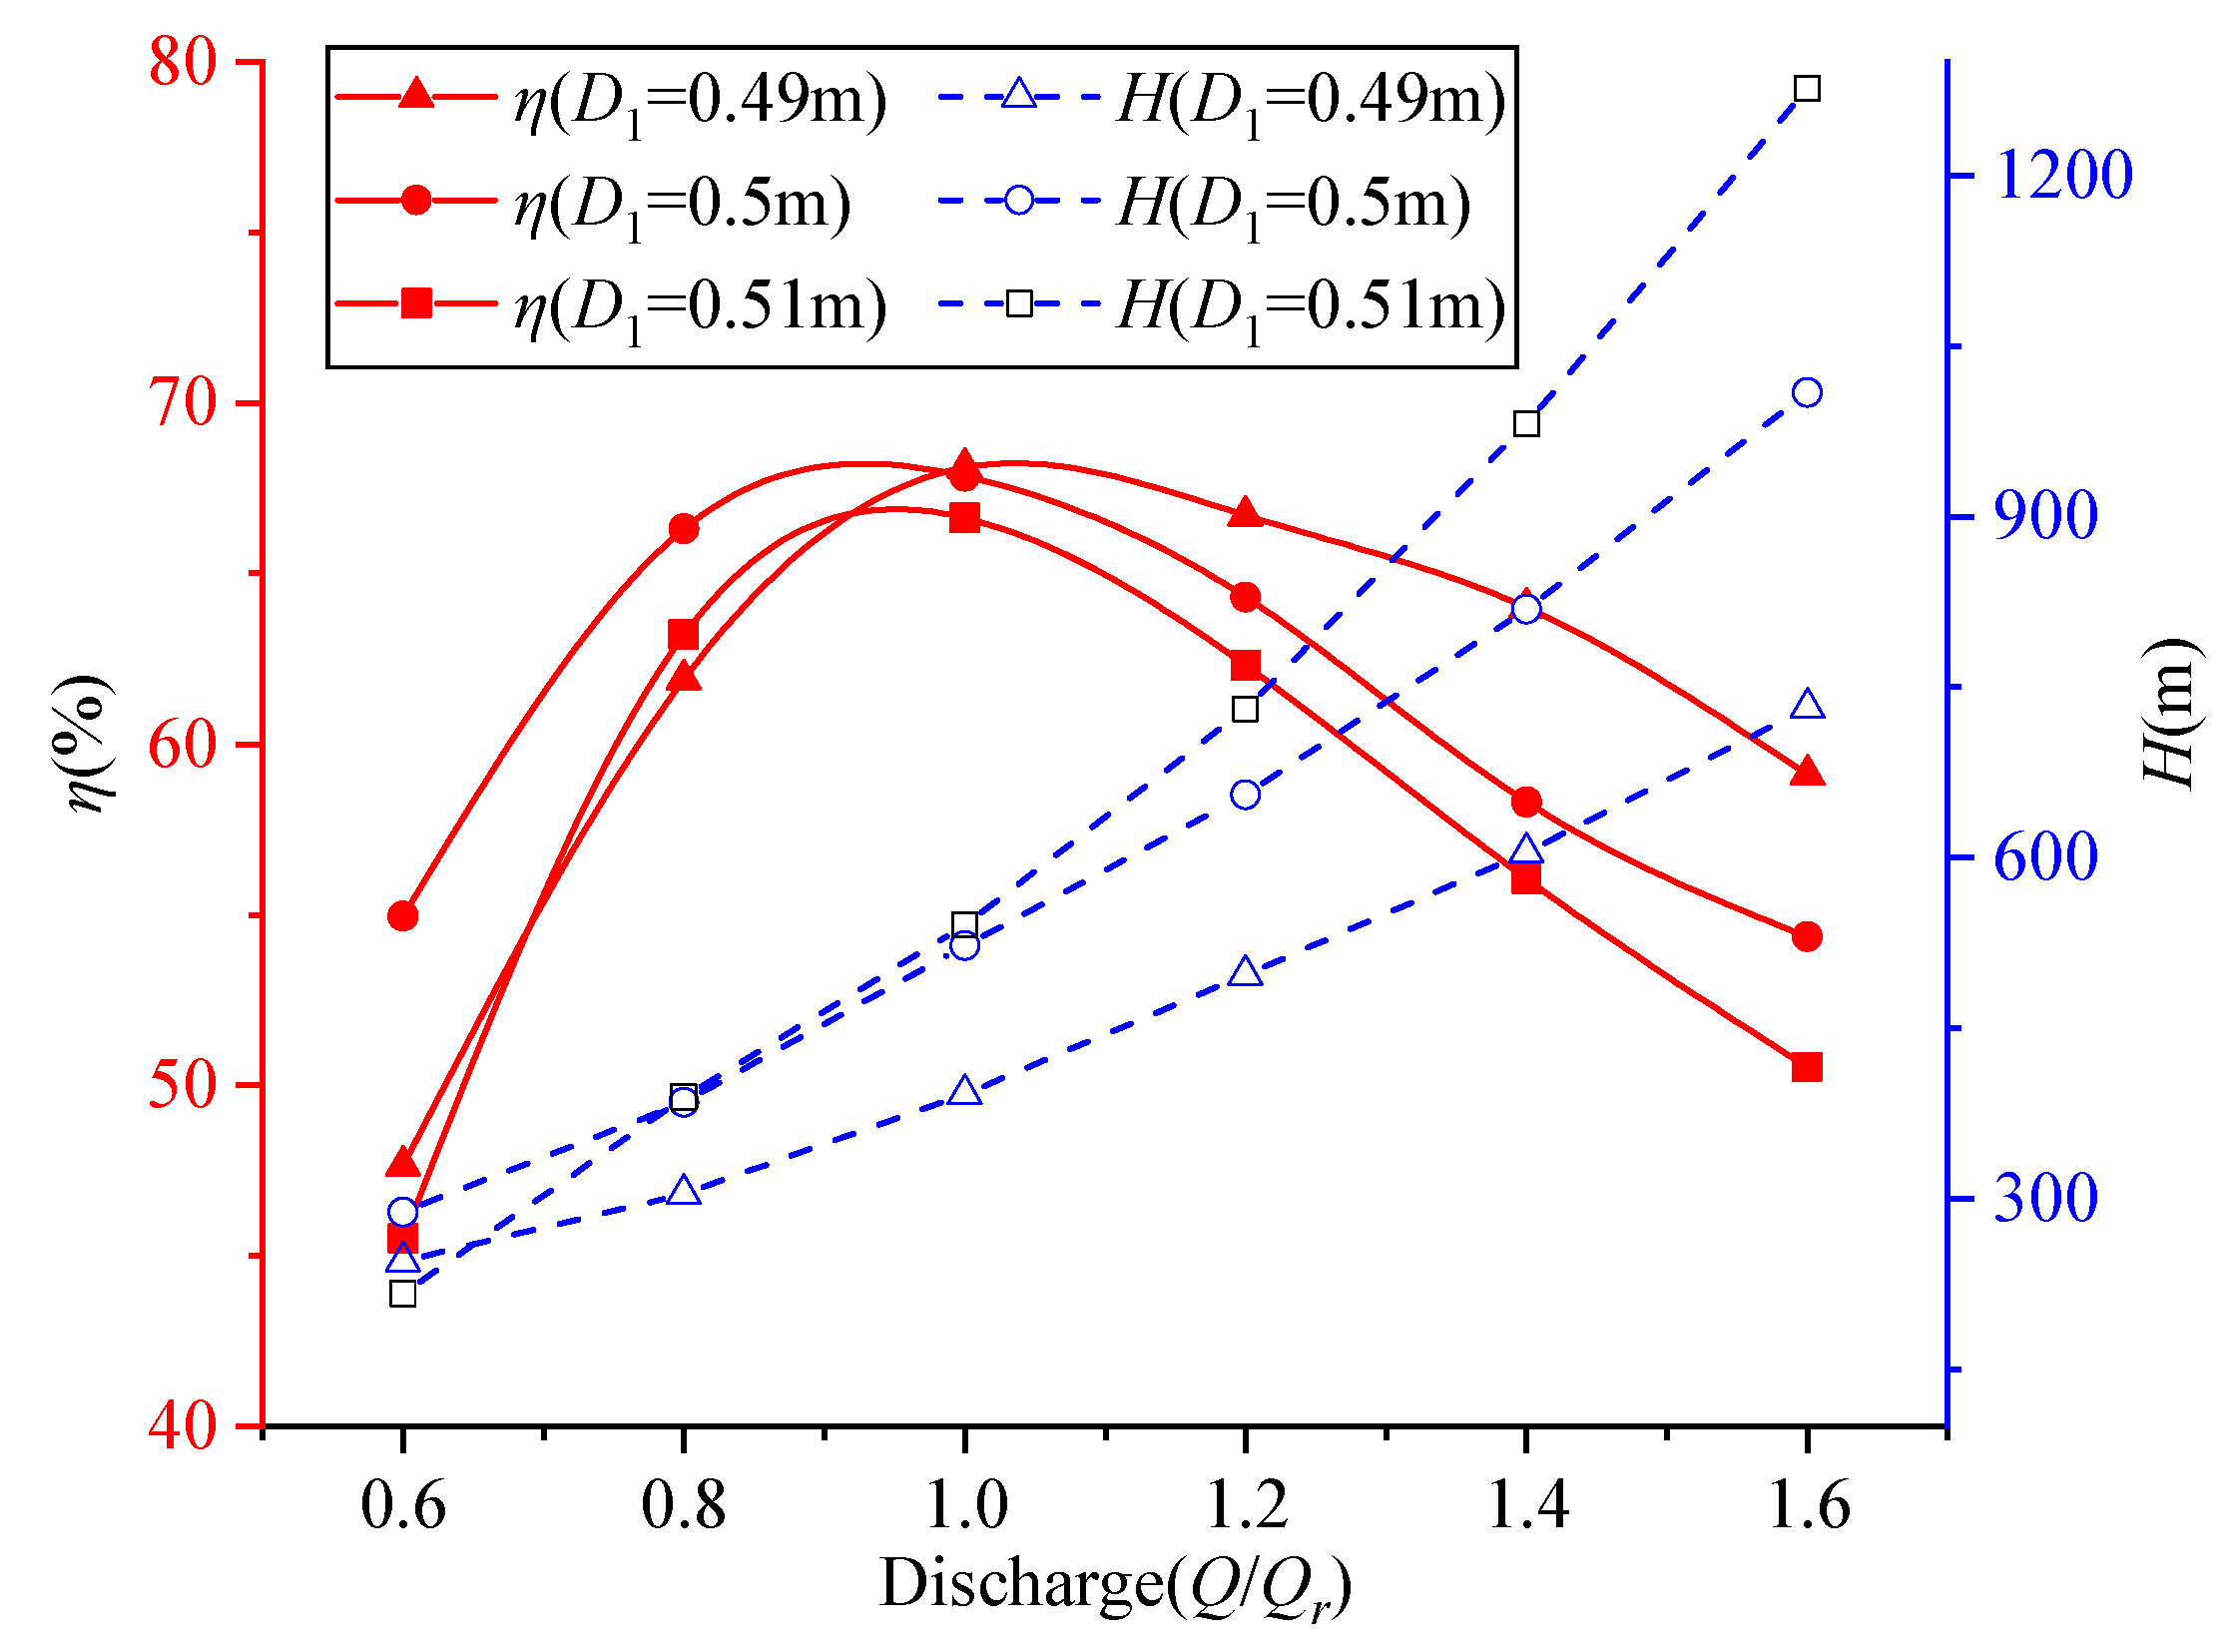
5.1. External Characteristic

The numerical simulation results of the rated operating conditions are shown in Table 2. From Table 2, it can be seen that the rated discharge Qr of the HTTM-ULSS increases with the increase in D1, and the H and P also increase with the increase in D1; η decreases with the increase in D1; by using the runner with an ultra-low specific speed, the HTTM can recover a higher water head and has a larger output, which can greatly reduce the stages of the hydraulic turbine, thereby simplifying the HTTM structure.
It is more practical to analyze and compare the impact of D1 on HTTM performance under multiple operating conditions. Therefore, this paper adopts six operating conditions, namely, Q = 0.6 Qr, Q = 0.8 Qr, Q = Qr, Q = 1.2 Qr, Q = 1.4 Qr, and Q = 1.6 Qr, for numerical calculation. The relationship between the H, η, and D1 is shown in Figure 8, and the relationship between the water head loss of runners ZH, P, and D1 is shown in Figure 9. From Figure 8, it can be seen that, under the same discharge, the total H is related to the D1, and the H increases with an increase in D1, which is consistent with Equation (2), indicating the rationality of the numerical calculation results to a certain extent; the association between η and discharge (η = F(Q)) exhibits a parabolic configuration in which exists an optimal operating point; the η decreases when deviating from the optimal operating condition; the η at different discharges is related to D1; when D1 = 0.49 m, the η is higher at the rated discharge, and the HTTM has a wider efficient zone. The larger the D1, the greater the H at the highest efficiency point but the narrower the high-efficiency zone. Therefore, when the working conditions change frequently, the smaller D1 runner should be selected; moreover, when the working conditions remain fixed, the larger D1 runner should be selected. Figure 9 shows that, when D1 is constant, as the discharge increases, the ZH initially reduces and increases subsequently and there is a minimum value; when the discharge is small, the ZH decreases with an increase in D1; when the discharge is large, as the discharge gradually increases, the ZH increases with an increase in D1. At the rated operating point, the larger the D1, the smaller the ZH, and the greater the P, which is more conducive to the recovery of high residual pressure fluid.

5.2. Internal Flow Pattern of the Runner

To study the influence of D1 on the internal flow field of the HTTM, this paper analyzes and compares the internal characteristics of runners with different D1 under design conditions.

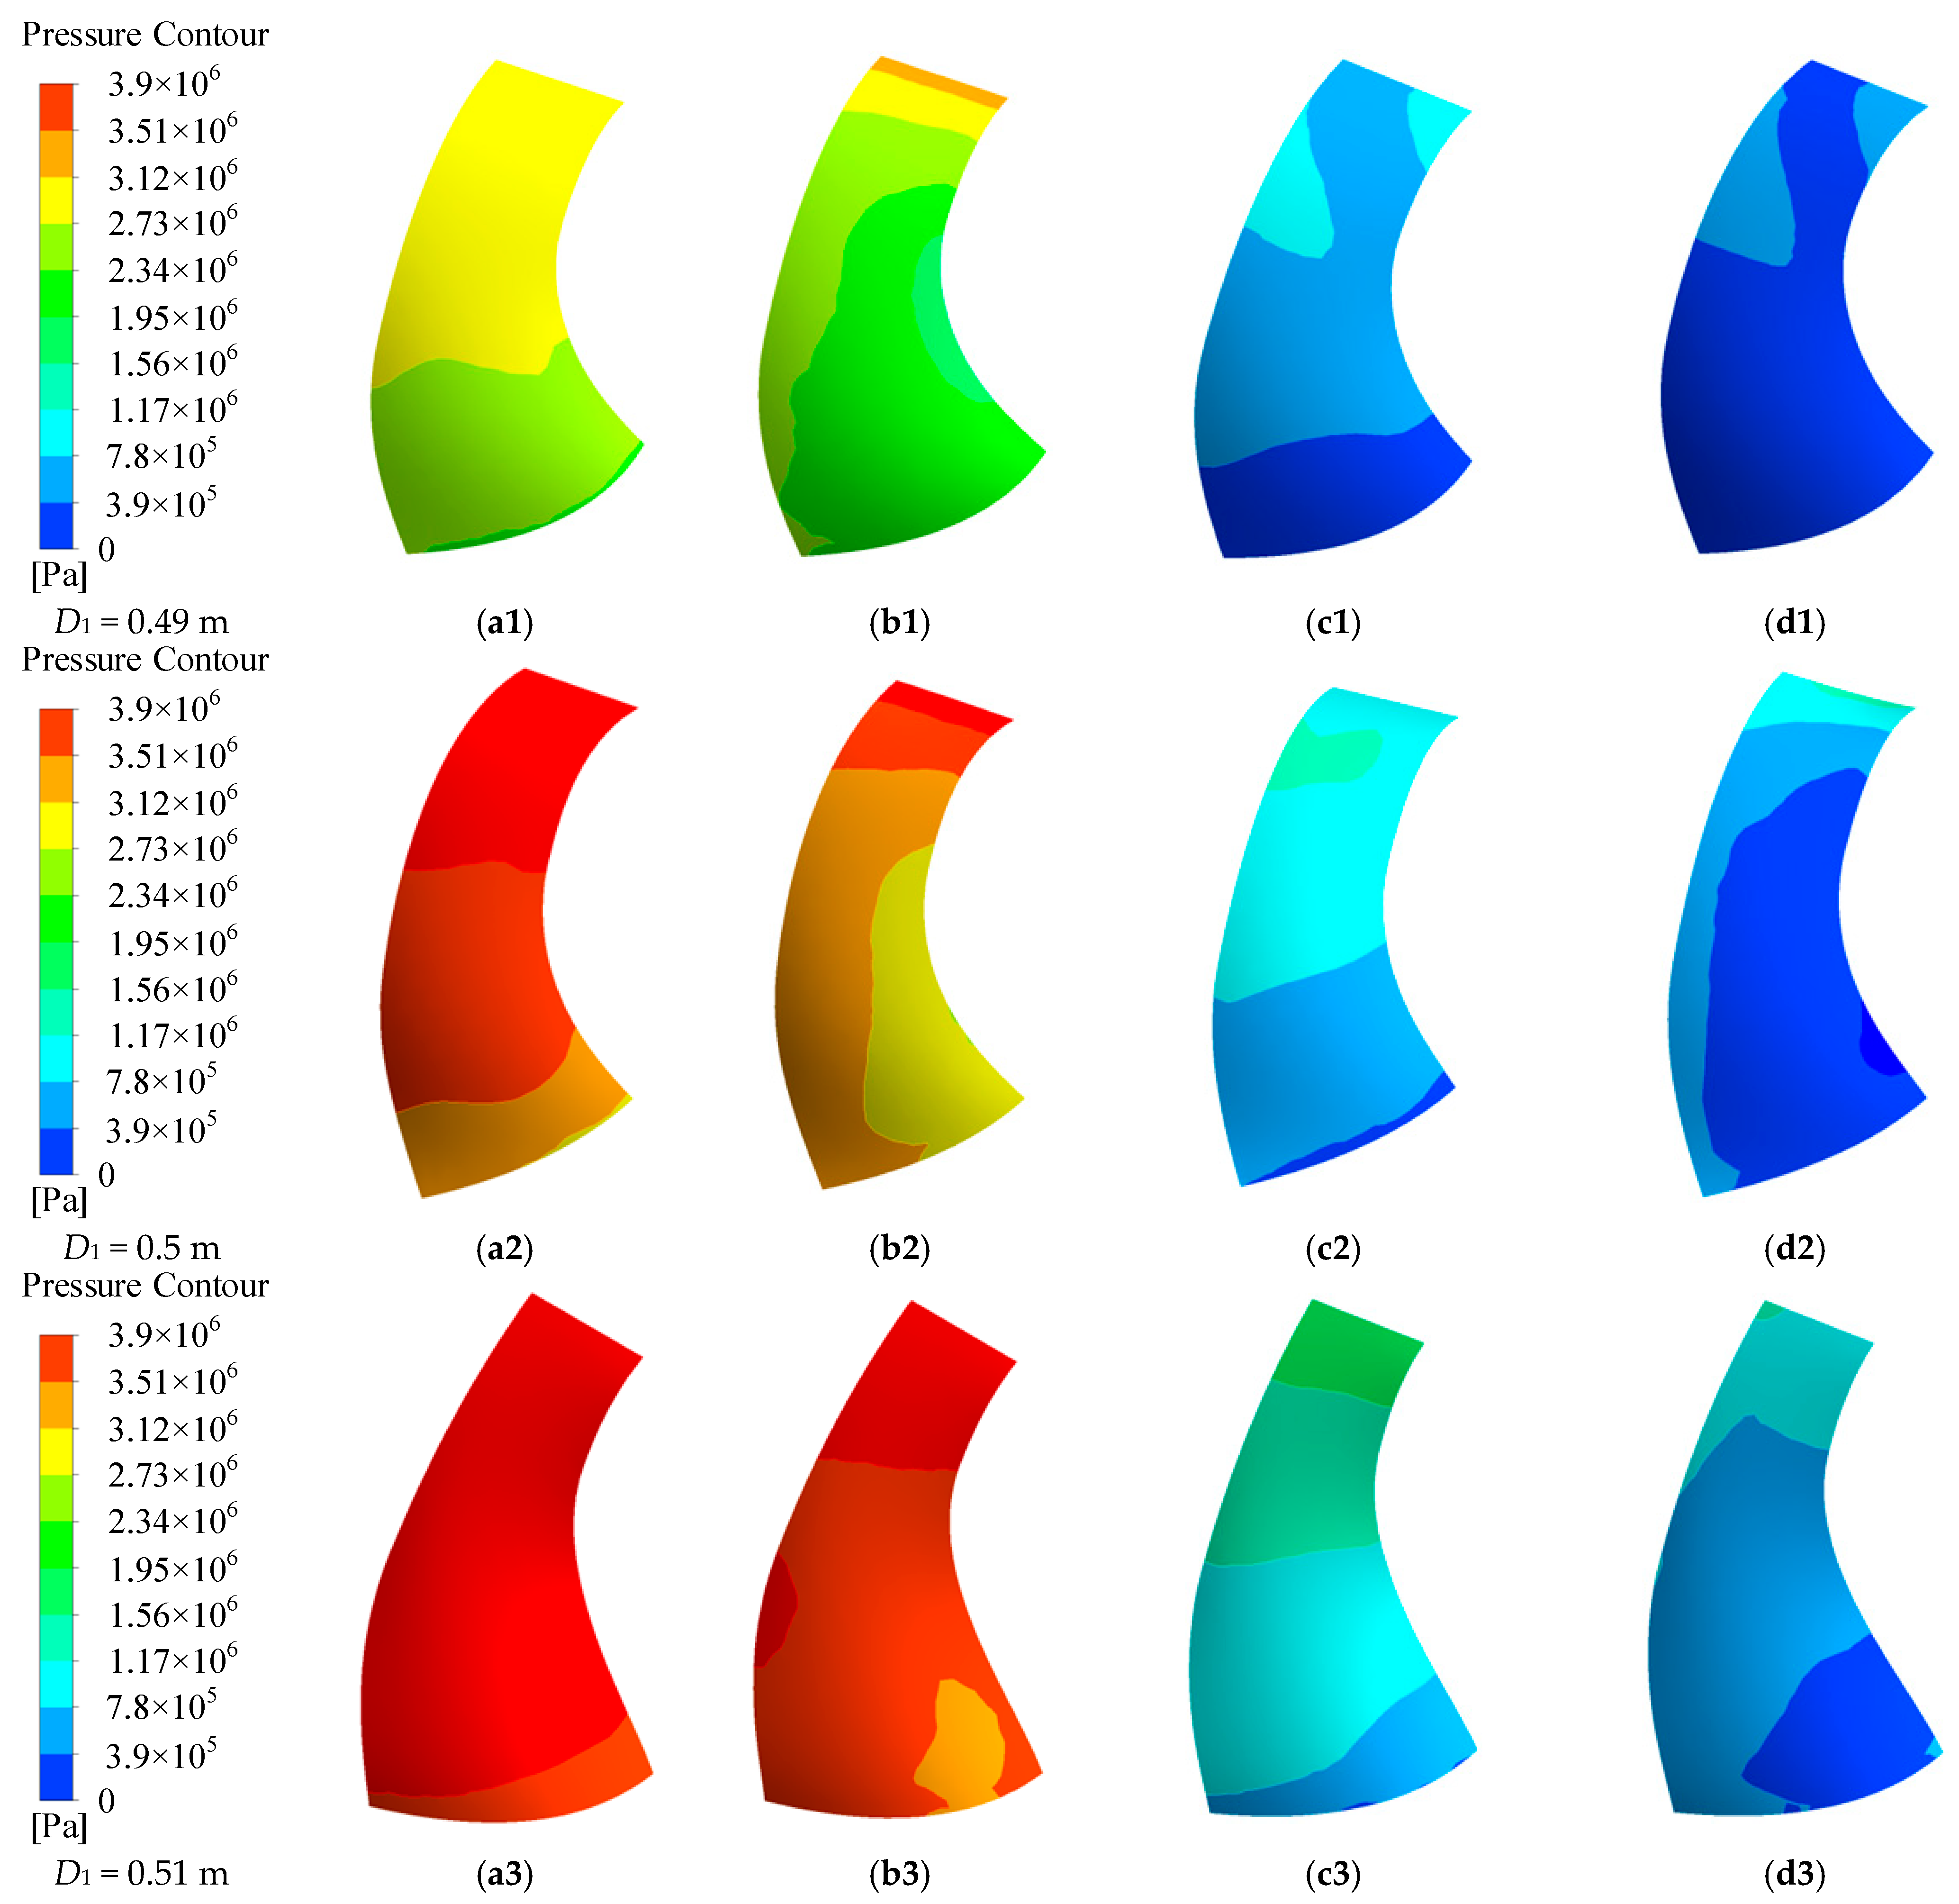
5.2.1. Pressure Distribution of Runner Blades

Figure 10 shows the pressure cloud maps of runner blades at the first and second stages. As depicted in Figure 10, the inlet pressure on the working surface typically surpasses the pressure on the blade’s backside, aligning with the fundamental principles of blade-type fluid machinery. Pressure gradually diminishes along the working surface from the inlet to the outlet and gradually escalates along the blade’s backside from the interior to the exterior. At the blade’s outlet on the working surface, a minor, low-pressure region emerges; meanwhile, a substantial low-pressure area occurs near the inner and outlet regions of the blade’s backside. This occurrence is attributed to the pronounced curvature of the runner blade with an exceptionally low ns. Within the middle section of the blade’s pronounced curvature on the rear side, a portion of the low-pressure zone emerges due to the relatively high flow velocity of water in this region, signifying substantial kinetic energy within the water flow. In accordance with the Bernoulli equation, the pressure energy at this juncture is comparatively diminished, facilitating the formation of a low-pressure zone.

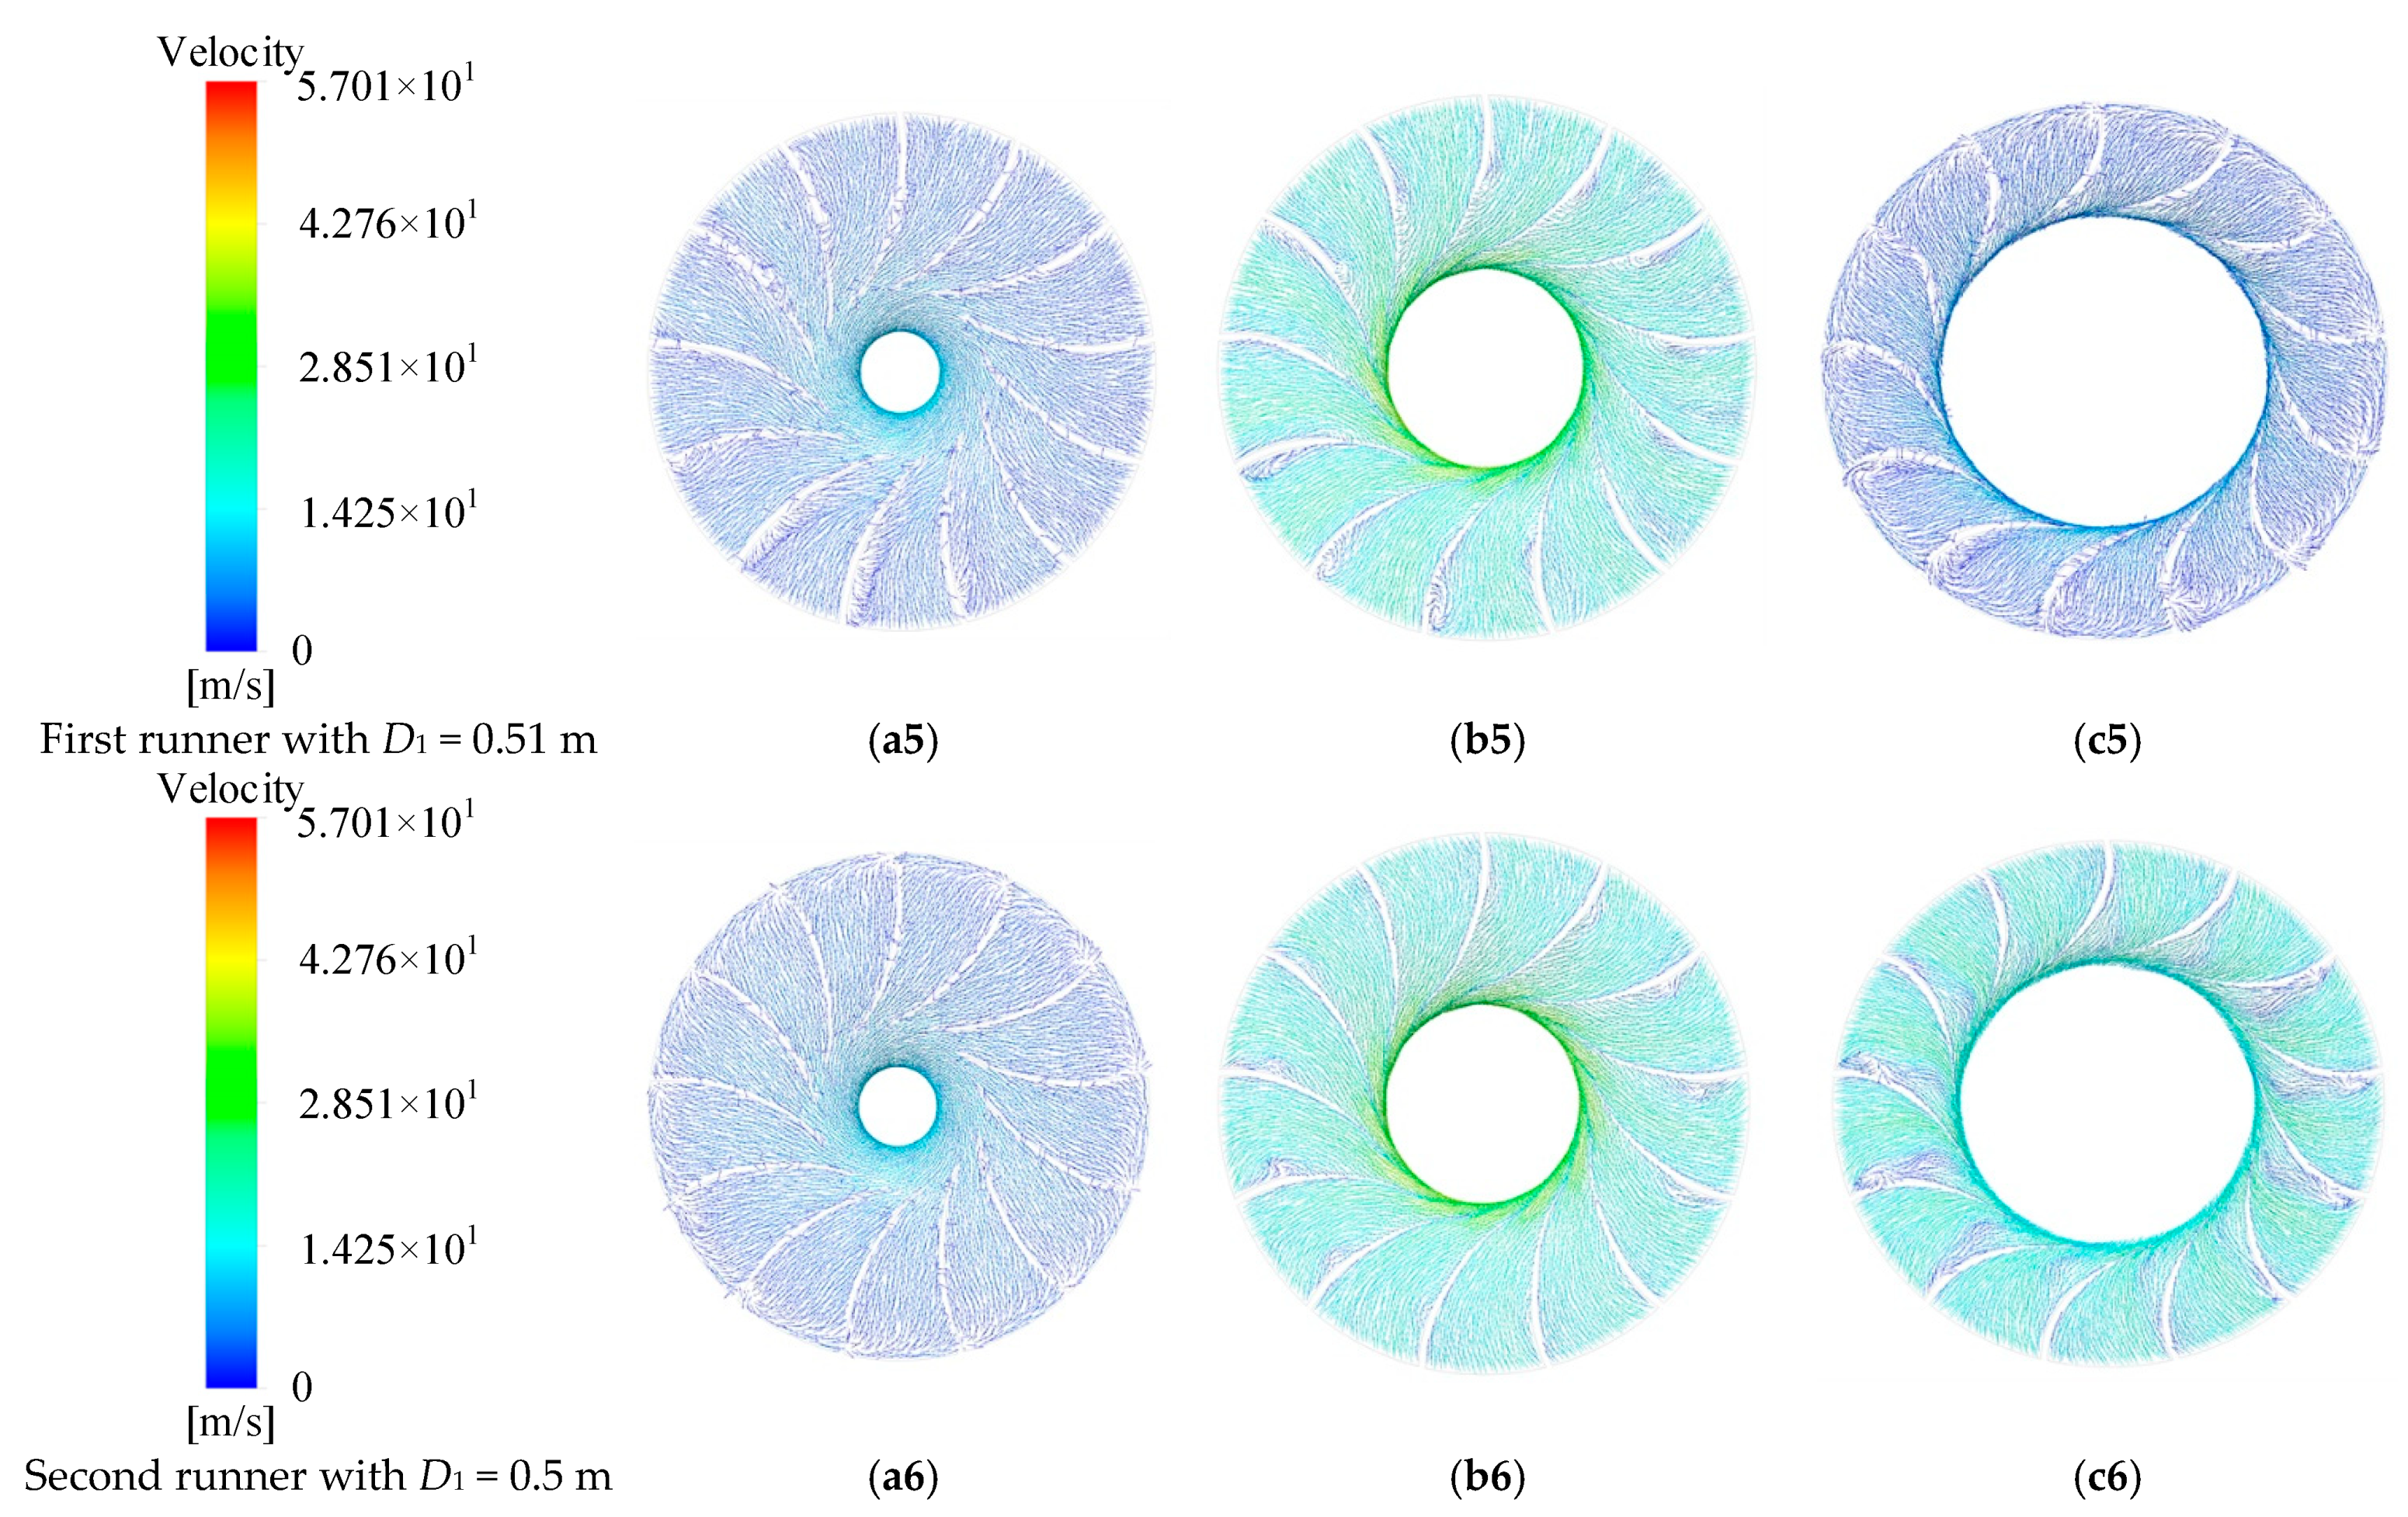
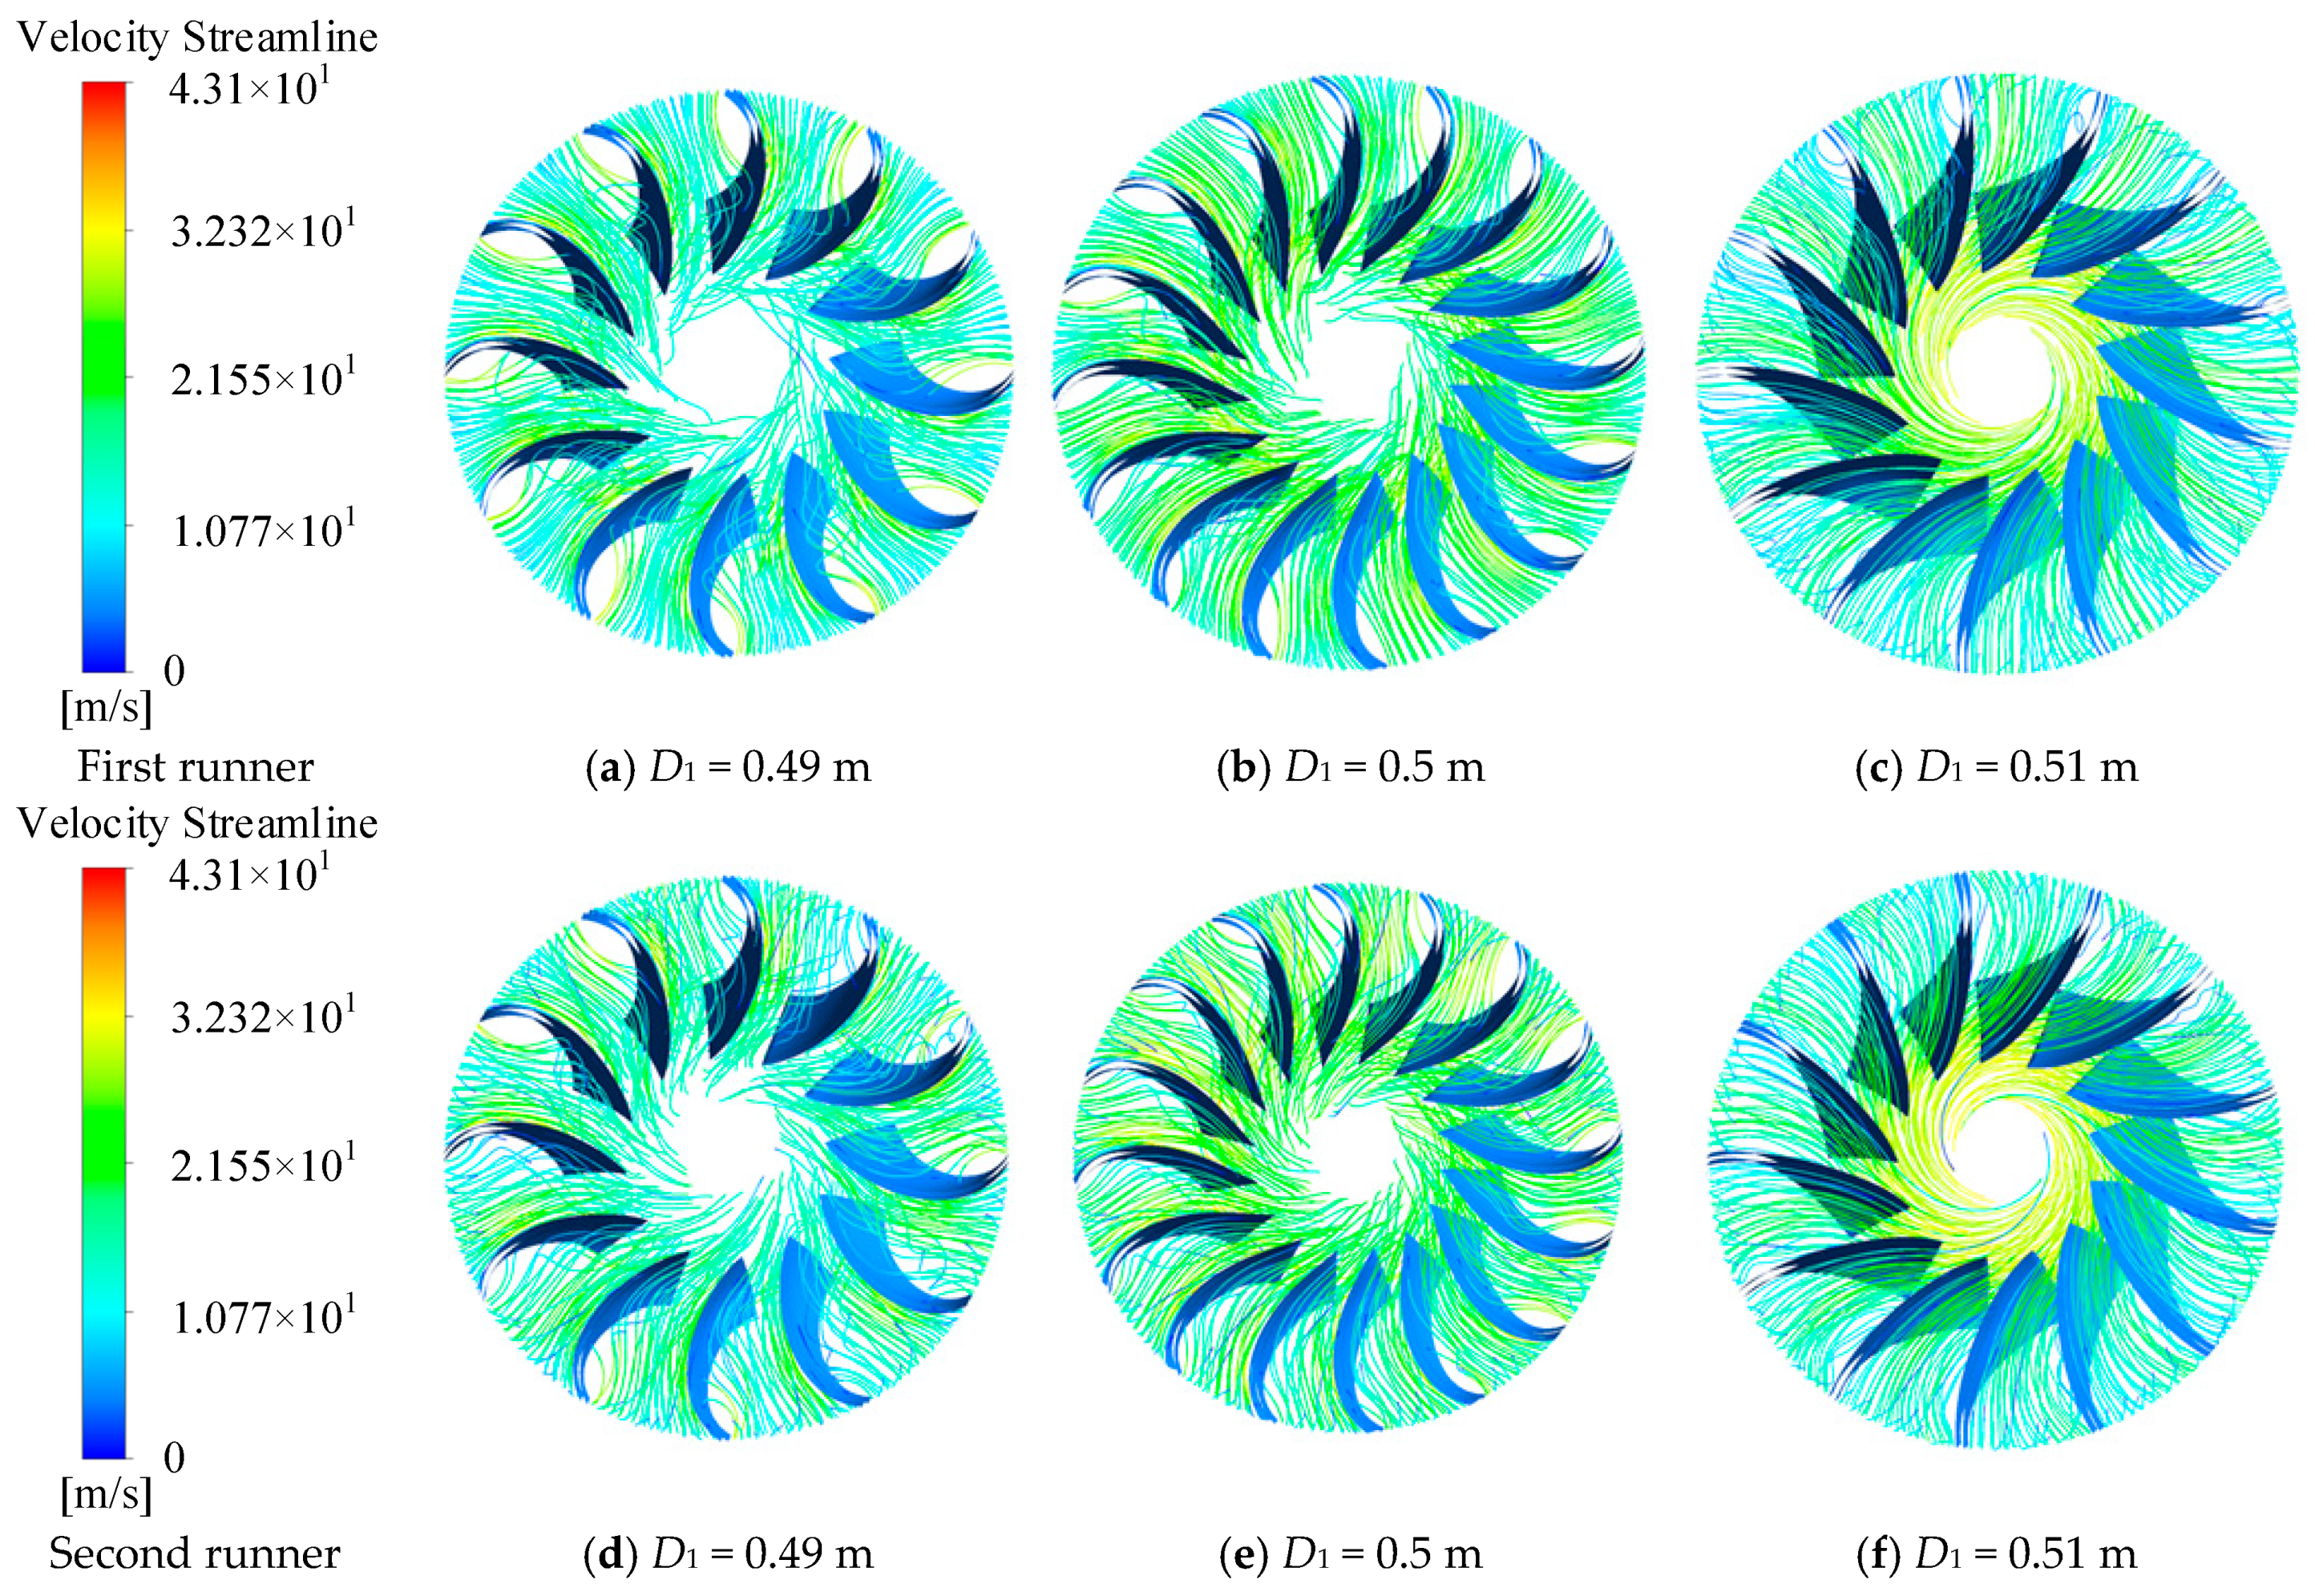
5.2.2. Internal Flow Field of the Runner

Figure 11 shows the streamlines within the first-stage and second-stage runners. As depicted in Figure 11, for runners with diameters of 0.49 m, 0.5 m, and 0.51 m, the streamline distribution pattern remains largely consistent. Nonetheless, the flow behavior of water within the first-stage runner exhibits greater smoothness compared to that within the second-stage runner. This disparity arises from increased turbulence in the inter-stage guide vanes following a sharp 180° turn, thereby influencing the flow pattern within the second-stage runner. Figure 12 shows the streamline of the guide vane. As depicted in Figure 11, a larger D1 corresponds to smoother streamlines. Specifically, the runner with D1 = 0.49 m exhibits the highest number of vortices and maximum intensity, while the runner with D1 = 0.51 m features relatively smoother streamlines with fewer vortices. Notably, the streamlines within the inter-blade channels display irregular distribution. An intriguing observation is the detachment phenomenon occurring at the blade’s leading edge. This phenomenon arises due to the velocity direction of water deviating from the blade’s orientation as it traverses the blade’s bend.
Based on the simulation results of the flow field, the velocity vector distribution maps near the crown, middle, and lower rings of the first-stage and second-stage runners with different D1 values are shown in Figure 13. The following pattern is shown in Figure 13:
(1)
When D1 is small, there is a phenomenon of detachment at the blade front, and this is because the smaller D1, the greater the degree of blade bending. When water flows through the blade bending, detachment occurs, causing the direction of velocity to be inconsistent with the direction of the blade;
(2)
When D1 is large, the water flow velocity is relatively high in the middle of the blade with a large curvature at the back, which means the kinetic energy of the water flow is relatively high. According to the Bernoulli equation, the pressure energy at this location is relatively low, and even a low-pressure zone can be formed, as shown in Figure 10. Compared with the pressure distribution maps of the runner blades, the velocity and pressure are consistent, reflecting the movement of water in the flow channel and the changes in pressure energy and kinetic energy;
(3)
The larger the D1, the greater the inlet flow velocity of the runner, the greater the kinetic energy of the water, and the higher the H.
Figure 13. Velocity vector distribution of runners with different D1. (a1a6) Near the crown. (b1b6) Middle. (c1c6) Near the lower ring.
Energies 16 07086 g013aEnergies 16 07086 g013b

6. Conclusions

This paper takes different inlet diameters to establish the three-dimensional runner models, and, in conjunction with other flow components, constructs a two-stage HTTM-ULSS. Fluent 16.0 simulation software is used to calculate the internal flow and energy characteristics of the HTTM-ULSS. Some main findings are listed below:
(1)
At the rated discharge, compared to D1 = 0.49 m, when D1 increases to 0.51 m, the efficiency only decreases by 1.48% and the head increases by 148.73 m, indicating a significant improvement in the ability of HTTM-ULSS to recover the water head;
(2)
The inlet diameter D1 of the runner is a key factor affecting HTTM-ULSS performance. The larger the D1, the lower the efficiency, the higher the water head, and the greater the output of the HTTM under rated operating conditions;
(3)
When D1 is large, the water head of a hydraulic turbine increases, but the increase in runner water head loss is very significant at large discharge, seriously affecting the efficiency of the hydraulic turbine to recover the water head. Therefore, the selection of runner diameter needs to consider whether the hydraulic turbine often operates under variable conditions;
(4)
As D1 increases, the fluid flow inside the runner becomes smoother, but the high-pressure area of the runner blades increases. To recover more pressure energy and maintain structural stability for the hydraulic turbine, further force analysis of the runner blades is needed to determine a reasonable D1.
This paper only verifies the rationality of the CFD-based numerical simulation method using a single-stage hydraulic turbine, and experimental verification of the two-stage HTTM-ULSS needs to be carried out in the future.

Author Contributions

Conceptualization, J.C.; Methodology, J.C.; Formal analysis, J.C.; Writing—original draft, J.C.; Supervision, Y.Z., D.L. and Z.X.; Writing—Review and Editing, Y.Z., X.C., D.L. and Z.X.; Project administration, Y.Z. and Z.X.; Validation, L.Z.; Data curation, X.C. All authors have read and agreed to the published version of the manuscript.

Funding

This research was funded by the Hubei Provincial Natural Science Foundation of China (Grant No. 2022CFD165), the Fundamental Research Funds for the Central Universities (Grant No. 2042022kf1022), and the National Natural Science Foundation of China (Grant No. 51979204 and 52309111).

Data Availability Statement

Some or all data, models, or codes that support the findings of this study are available from the corresponding author upon reasonable request.

Conflicts of Interest

The authors declare no conflict of interest.

Nomenclature

Heeffective utilization water head
Hrdesign water head
ωangular velocity of the runner
nrotating speed of the runner
ggravitational acceleration
C1 and C2water circulation at the inlet and outlet of the runner
D1inlet diameter of the runner
D2outlet diameter of the runner
Znumber of the runner blades
vu1 and vu2circumferential components of the absolute water flow velocity at the runner inlet and outlet
u1circumferential speed at the runner inlet
u2circumferential velocity at the runner outlet
β1inlet angle of the runner blade
β2outlet angle of the runner blade
Qrdesign discharge
Q11unit discharge
Bheight of the runner inlet
α2the outlet water flow angle
nsspecific speed
Hwater head
ηefficiency
Pouttotal pressure at the outlet of the draft tube
Poutput of the hydraulic turbine
Qworking discharge
Ainlet area of the volute
Pintotal inlet pressure of the volute
ρdensity of water
Mshaft torque

References

  1. Bayatloo, M.; Koohizadhikoei, R.; Ghorani, M.M.; Riasi, A.; Hamzehnava, G. Performance improvement of a pump running as turbine for energy recovery considering the effects of polymer additives: An experimental study. Sustain. Energy Technol. Assess. 2023, 57, 103232. [Google Scholar] [CrossRef]
  2. Bozorgasareh, H.; Khalesi, J.; Jafari, M.; Gazori, H.A. Performance improvement of mixed-flow centrifugal pumps with new impeller shrouds: Numerical and experimental investigations. Renew. Energy 2021, 163, 635–648. [Google Scholar] [CrossRef]
  3. Wang, H.; Wang, J.; Gong, R.; Shang, C.; Li, D.; Wei, X. Investigations on Pressure Fluctuations in the S-Shaped Region of a Pump–Turbine. Energies 2021, 14, 6683. [Google Scholar] [CrossRef]
  4. Yang, Z.; Liu, Z.; Cheng, Y.; Zhang, X.; Liu, K.; Xia, L. Differences of Flow Patterns and Pressure Pulsations in Four Prototype Pump-Turbines during Runaway Transient Processes. Energies 2020, 13, 5269. [Google Scholar] [CrossRef]
  5. Chen, J.; Zheng, Y.; Liu, D.; Du, Y.; Xiao, Z. Quantitative stability analysis of complex nonlinear hydraulic turbine regulation system based on accurate calculation. Appl. Energy 2023, 351, 121853. [Google Scholar] [CrossRef]
  6. Chen, H.; Zhou, D.; Kan, K.; Guo, J.; Zheng, Y.; Binama, M.; Xu, Z.; Feng, J. Transient characteristics during the co-closing guide vanes and runner blades of a bulb turbine in load rejection process. Renew. Energy 2021, 165, 28–41. [Google Scholar] [CrossRef]
  7. Cantini, G.; Salvadori, S. Numerical Characterization of the Performance Curve of a Regenerative Pump-as-Turbine. J. Eng. Gas Turbines Power 2021, 143, 051001. [Google Scholar] [CrossRef]
  8. Chen, X.; Lai, X.; Gou, Q.; Song, D. Effect of guide vane profile on the hydraulic performance of moderate low-specific-speed Francis turbine. J. Mech. Sci. Technol. 2023, 37, 1289–1300. [Google Scholar] [CrossRef]
  9. Nasir, A.; Dribssa, E.; Girma, M.; Madessa, H.B. Selection and Performance Prediction of a Pump as a Turbine for Power Generation Applications. Energies 2023, 16, 5036. [Google Scholar] [CrossRef]
  10. Jianguo, D.; Chang, G.; Adu, D.; Darko, R.; Khan, M.A.S.; Antwi, E.O. Numerical Simulation and Computational Flow Characterization Analyses of Centrifugal Pump Operating as Turbine. Complexity 2021, 2021, 9695452. [Google Scholar] [CrossRef]
  11. Ghorani, M.M.; Haghighi, M.H.S.; Maleki, A.; Riasi, A. A numerical study on mechanisms of energy dissipation in a pump as turbine (PAT) using entropy generation theory. Renew. Energy 2020, 162, 1036–1053. [Google Scholar] [CrossRef]
  12. Suh, J.-W.; Kim, S.-J.; Yang, H.-M.; Kim, M.-S.; Joo, W.-G.; Park, J.; Kim, J.-H.; Choi, Y.-S. A Comparative Study of the Scale Effect on the S-Shaped Characteristics of a Pump-Turbine Unit. Energies 2021, 14, 525. [Google Scholar] [CrossRef]
  13. Marini, G.; Di Menna, F.; Maio, M.; Fontana, N. HYPER: Computer-Assisted Optimal Pump-as-Turbine (PAT) Selection for Microhydropower Generation and Pressure Regulation in a Water Distribution Network (WDN). Water 2023, 15, 2807. [Google Scholar] [CrossRef]
  14. Wang, K.; Wang, S.; Meng, P.; Wang, C.; Li, Y.; Zheng, W.; Liu, J.; Kou, J. Strategies employed in the design and optimization of pump as turbine runner. Renew. Energy 2023, 216. [Google Scholar] [CrossRef]
  15. Kan, K.; Zhao, F.; Xu, H.; Feng, J.; Chen, H.; Liu, W. Energy performance evaluation of an axial-flow pump as turbine under conventional and reverse operating modes based on an energy loss intensity model. Phys. Fluids 2023, 35, 015125. [Google Scholar] [CrossRef]
  16. Kocak, E.; Karaaslan, S.; Gil Andrade-Campos, A.; Yucel, N. Energy recovery using pumps as turbines in water supply systems: A case study. Proc. Inst. Civ. Eng.—Water Manag. 2022, 175, 273–285. [Google Scholar] [CrossRef]
  17. Qi, B.; Zhang, D.; Zhang, Q.; Wang, M.; Fall, I. Numerical Simulation on the Influence of Rotating Speed on the Hydraulic Loss Characteristics of Desalination Energy Recovery Turbine. Shock. Vib. 2021, 2021, 9995046. [Google Scholar] [CrossRef]
  18. Souza, D.E.S.; Mesquita, A.L.A.; Blanco, C.J.C. Pressure Regulation in a Water Distribution Network Using Pumps as Turbines at Variable Speed for Energy Recovery. Water Resour. Manag. 2023, 37, 1183–1206. [Google Scholar] [CrossRef]
  19. Su, W.-T.; Li, X.-B.; Xia, Y.-X.; Liu, Q.-Z.; Binama, M.; Zhang, Y.-N. Pressure fluctuation characteristics of a model pump-turbine during runaway transient. Renew. Energy 2021, 163, 517–529. [Google Scholar] [CrossRef]
  20. Zhang, L.H.; Li, Y.P.; Zhang, Z.C.; Chen, J.B.; Chen, D.X. Influence of blade number on performance of multistage hydraulic turbine in turbine mode. Energy Sci. Eng. 2022, 10, 903–917. [Google Scholar] [CrossRef]
  21. Chen, J.; Zheng, Y.; Zhang, L.; He, G.; Zou, Y.; Xiao, Z. Optimization of geometric parameters of hydraulic turbine runner in turbine mode based on the orthogonal test method and CFD. Energy Rep. 2022, 8, 14476–14487. [Google Scholar] [CrossRef]
  22. Li, Y.; Zhang, L.; Chen, J.; Zhang, Z.; Jia, K.; Feng, K.; Wang, X. Influence of rotational speed on performance of low specific speed hydraulic turbine in turbine mode. Adv. Mech. Eng. 2022, 14. [Google Scholar] [CrossRef]
  23. Yang, F.; Li, Z.; Lv, Y.; Li, J.; Zhou, G.; Nasr, A. Numerical Analysis of Flow Characteristics in Impeller-Guide Vane Hydraulic Coupling Zone of an Axial-Flow Pump as Turbine Device. J. Mar. Sci. Eng. 2023, 11, 661. [Google Scholar] [CrossRef]
  24. Yang, F.; Li, Z.; Yuan, Y.; Lin, Z.; Zhou, G.; Ji, Q. Study on vortex flow and pressure fluctuation in dustpan-shaped conduit of a low head axial-flow pump as turbine. Renew. Energy 2022, 196, 856–869. [Google Scholar] [CrossRef]
  25. Yang, S.; Li, P.; Lu, Z.; Xiao, R.; Zhu, D.; Lin, K.; Tao, R. Comparative evaluation of the pump mode and turbine mode performance of a large vaned-voluted centrifugal pump. Front. Energy Res. 2022, 10, 1003449. [Google Scholar] [CrossRef]
  26. Yang, S.; Li, P.; Tao, R.; Zhang, F.; Xiao, R.; Liu, W.; Wang, F. Investigate the full characteristic of a centrifugal pump-as-turbine (PAT) in turbine and reverse pump modes. Eng. Appl. Comput. Fluid Mech. 2023, 17, 2246527. [Google Scholar] [CrossRef]
  27. Gomaa, M.R.; Ahmed, M.; Rezk, H. Temperature distribution modeling of PV and cooling water PV/T collectors through thin and thick cooling cross-fined channel box. Energy Rep. 2022, 8, 1144–1153. [Google Scholar] [CrossRef]
  28. Gao, Y.; Liu, H.; Guo, G.; Lin, Y.; Gu, Y.; Ni, Y. Effect of cavitation evolution on power characteristics of tidal current turbine. Phys. Fluids 2023, 35, 013307. [Google Scholar] [CrossRef]
  29. Li, W.-G. Vortex Pump as Turbine for Energy Recovery in Viscous Fluid Flows With Reynolds Number Effect. J. Fluids Eng. 2022, 144, 065121. [Google Scholar] [CrossRef]
  30. Wang, Y.F.; Zhang, F.; Chen, K.; Hong, F.; Yuan, S.Q. Influence of cavitation on energy loss in a side channel pump at different flow rates. Phys. Fluids 2023, 35, 065121. [Google Scholar] [CrossRef]
Figure 1. Velocity triangle of the HTTM-ULSS runner.
Energies 16 07086 g001
Figure 2. Schematic diagram of the HTTM-ULSS runner: (a) Three-dimensional perspective. (b) Ariel perspective.
Energies 16 07086 g002
Figure 3. Three-dimensional model of a two-stage HTTM-ULSS.
Energies 16 07086 g003
Figure 4. HTTM-ULSS mesh model.
Energies 16 07086 g004
Figure 5. Mesh sensitivity result.
Energies 16 07086 g005
Figure 6. Experimental test platform.
Energies 16 07086 g006
Figure 7. Numerical simulation and test results.
Energies 16 07086 g007
Figure 8. Relationship between H, η, and D1.
Energies 16 07086 g008
Figure 9. Relationship between ZH, P, and D1.
Energies 16 07086 g009
Figure 10. Pressure distribution of runner blade with different D1. (a1a3) Working face of first runner. (b1b3) Back face of first runner. (c1c3) Working face of second runner. (d1d3) Back face of second runner.
Energies 16 07086 g010
Figure 11. Streamline diagrams of runners with different D1.
Energies 16 07086 g011
Figure 12. Flow line diagrams of guide vane.
Energies 16 07086 g012
Table 1. Design parameters of three runners.
ParameterValueParameterValue
β1 (°)140B (m)0.052
D2 (m)0.26n (r/min)1500
D1 (m)0.49, 0.5 and 0.51Qr (m3/s)0.8
Table 2. Calculation results under rated operating conditions.
D1/(m)Qr (m3/s)H/(m)η/(%)P/(kW)
0.490.88392.1468.102315.68
0.50.93522.7167.843105.95
0.510.99540.8766.623486.75
Disclaimer/Publisher’s Note: The statements, opinions and data contained in all publications are solely those of the individual author(s) and contributor(s) and not of MDPI and/or the editor(s). MDPI and/or the editor(s) disclaim responsibility for any injury to people or property resulting from any ideas, methods, instructions or products referred to in the content.

