Abstract
The output of wind power and photovoltaic power is random, fluctuating and intermittent, and a direct grid connection will result in the reduction of power generation income and a great fluctuation in the power grid’s connection. The addition of hydropower stations can reduce the above problems. Therefore, this paper first introduces and analyzes a typical application scenario of a water–wind–light combined power generation system. Then, a multi-objective optimization model is established, considering the two objectives of maximizing the joint generation and minimizing the system’s power fluctuation. Third, the adaptive fractional order calculus strategy is introduced, and a multi-objective pigeon swarm algorithm, which can adaptively adjust the fractional order according to the location information of a flock, is proposed. Finally, an optimization simulation is carried out. The simulation results show that the improved multi-objective pigeon swarm algorithm has better optimization accuracy. It provides a reference for the future implementation of hydropower stations, and the surrounding wind and photoelectric field joint dispatching strategy.
1. Introduction
“Double carbon” is a strategy responding to the problems of rapid global climate change, energy scarcity and ecological and environmental damage, including efforts to reduce the consumption of fossil energy and vigorously develop new types of clean energy [1,2,3]. Carbon dioxide emissions are on track to peak by 2030, and work is currently underway towards achieving carbon neutrality by 2060 [4]. The proposal of “carbon peak and carbon neutral” clean energy, mainly hydropower, wind power and photovoltaic power generation, has welcomed unprecedented development opportunities. Hence, water–wind–light complementary dispatching has become an important direction for the future of energy development [5,6,7].
The existing research on hydropower and wind–solar complementary power generation systems mainly focuses on capacity allocation and optimal dispatching [8]. The capacity allocation of the new energy complementary power generation system is mostly a multi-objective problem due to more factors being involved, such as system stability, the economy, environmental benefits, and so on [9,10,11]. At the same time, the capacity of a system often needs to consider the problem of a system optimization scheduling strategy. Optimization scheduling also typically involves multiple high-dimension decision variables; time and space coupling; the constraints of complex and various large-scale, nonlinear planning problems; and is also affected by uncertain factors such as wind, light and runoff stochasticity [12,13,14]. Therefore, how to coordinate a system’s capacity configuration, optimize the scheduling operation and formulate a reasonable capacity allocation scheme are the key and difficult points of such problems.
Wang et al. [15] proposed a multi-objective evolution algorithm based on Pareto optimal space, NDWA-GA and PCA for the capacity optimization allocation of a multi-energy complementary system. The correctness and effectiveness of the proposed method can be verified via a comparison with the traditional multi-objective optimization algorithm. Zhang et al. [16] put forward the three screening principles of capacity configuration to reveal techno–economic interactions. It uses the bundled system capacity configuration model of the northwest, which involves a practical engineering case exploration, and verifies the bundled system’s technical and economic interactions. And it provides important theoretical support for selecting technical and economic indicators, as well as for capacity configuration. Lei et al. [17] put forward the establishment of the whole life cycle cost and unit power cost as a goal of the water–wind–light storage system capacity optimization method in the northwest region. For example, using the HOMER software to solve the optimization problem allowed the optimal capacity configuration results to be obtained. The results showed that the complementary system helped to reduce the cost of power generation and improve the power supply stability. Dong et al. [18] established investment cost, environmental protection and power supply quality as the indexes of a multi-objective optimization model. And the optimization effect of the multi-objective sparrow search algorithm was improved by introducing the Levy flight strategy to enhance the multi-objective sparrow search algorithm based on the local optimal ability. The results verify that disturbance and niche optimization technology improved the effectiveness of the multi-objective sparrow search algorithm. Yang et al. [19] proposed an optimization model of a two-layer landscape capacity configuration (including the planning layer and the operation layer) based on the dynamic regulation constraints of the system. It minimizes the investment and operation costs of the hybrid system, as well as minimizing the dynamic source and load tracking coefficient, and constructs a coordinated and optimized scheduling scheme. The results show that the proposed method, considering the above factors, has better performance in adapting to power fluctuations. Plus, it improves the capacity configuration accuracy of renewable energy, and reduces the abandoned wind volume of renewable energy. Yalcinoz et al. [20] proposed an improved multi-objective particle swarm optimization (IMOPSO) algorithm to solve the multi-objective environmental economic load scheduling problem, with a functional shrinkage factor and a functional inertial weight. It is applied to MEED problems considering wind energy, ramp limits, the embargo area, emission pollution, transmission loss and valve point effects. The test results show that IMOPSO produces better running outcomes than the comparative multi-objective optimization algorithm. Omar et al. [21] used a new algorithm based on a novel hybrid ant colony–particle swarm optimization technique, which shows that multi-target particle swarm algorithms have better performance in improving STATCOM tuning for grid code compliance. Meng et al. [22] established an optimal configuration model of wind/light/hydrogen/storage capacity, and introduced the Tent chaos mapping initialization population to improve the multi-target particle swarm algorithm. The location of leaders and followers is updated based on the adaptive spiral search strategy. The effectiveness of the algorithm is verified using the test function, and the improved multi-objective salp swarm algorithm (IMOSSA) is used to obtain the capacity configuration scheme. Kang et al. [23] established a scenery-complementary hydrogen energy storage system operation optimization model, using an adaptive simulation annealing particle swarm algorithm to solve the problem. The model can reduce the waste of wind and solar energy, and realize the system to minimize the cost of running by adjusting the power purchased from the grid, as well as the battery charge and discharge power, under the time-sharing price mechanism. Behera et al. [24] compared constriction factor-based particle swarm optimization (CFBPSO) with PSO, improved PSO and the red deer algorithm (RDA). This obtained the optimal economic and emission scheduling level, as well as an optimal solution for the renewable energy hybrid power generation system, which is composed of thermal, wind and solar generators, when the dynamic load changes within a day. He et al. [25] proposed a kind of wind-complementary power generation system, composed of heat storage, a battery, hydrogen storage and a pumped storage quantitative technical and economic comparison method. The results show that the strength Pareto evolution algorithm and the multi-target particle group optimization algorithm have good performance for capacity optimization problems. Hu et al. [26] proposed a new, multimodal, multi-objective pigeon-inspired optimization (MMOPIO) algorithm, combining self-organization mapping (SOM) and improved PIO. It establishes a good neighborhood relationship for improved PIO, and simplifies the structure of standard PIO by merging the parameters. The test results show the superiority of MMOPIO over five state-of-the-art multi-objective optimization algorithms in solving the multi-modal, multi-objective optimization problem. Wang et al. [27] proposed an improved high-level target navigation PIO (HTNPIO) and an LMS-ELS probability to balance the exploration and utilization. It compares HTNPIO with 15 other PIO and advanced heuristic algorithms, based on IEEE CEC2017 benchmark problems and five real-world optimization problems. The results show that the HTNPIO algorithm beats all competitors at CEC2017 benchmark problems, including the super-competitive LSHADE. And they are also extremely competitive in dealing with real-world problems. Most of the methods used to study the water–wind–light multi-objective capacity allocation and complementarity problems in the above literature are multi-objective particle swarm optimization algorithms, although there are problems, such as the narrow search range and low optimization accuracy. The pigeon swarm algorithm can improve the problem of the above particle swarm optimization algorithm. The memory attribute of fractional calculus can change the position state information of a current individual in a flock using the historical trajectory information in the iterative calculation process, thereby improving the optimization performance of the algorithm. At present, there is no report on the multi-objective optimization of the fractional order pigeon swarm algorithm in the water–wind–light complementary system.
The main contributions of this paper are as follows: The output characteristics of a typical water–wind–light combined system are analyzed. A multi-objective optimization model considering the maximum power generation as well as minimizing the system power fluctuation is established. According to the positional information of pigeons, the fractional order is adaptively adjusted, and an adaptive fractional order multi-objective pigeon swarm optimization algorithm is proposed. Finally, the improved multi-objective pigeon swarm algorithm, the multi-objective pigeon swarm algorithm and the multi-objective particle swarm algorithm are simulated. The effectiveness and superiority of the improved pigeon swarm algorithm are verified.
2. Multi-Objective Model for Optimal Scheduling
2.1. Analysis of the Water–Wind–Light Complementary Principle
Wind, light and water, as the most easily developed and utilized energy sources in renewable energy, have developed rapidly in recent years, and are not only widely used in microgrids, but the proportion of wind and photovoltaic power generation in large power grids is also increasing year by year. However, due to the random, intermittent and fluctuating characteristics of wind and photovoltaic power generation, large-scale independent grid connections often cannot meet the requirements of a large grid, and it is necessary to have a power supply with a rapid adjustment ability to compensate and adjust in order to meet the requirements of the grid connection. At present, the most widely used is the joint operation of hydroelectric power generation. The use of hydroelectric units has the ability to quickly start and stop, adjust its output and complement wind power and photovoltaic output, which can not only effectively solve the problem of new energy grid absorption but also ensure the safe and stable operation of the grid. In addition, wind power, photovoltaic power and hydropower are usually connected to the power grid through the same grid-connected connection line. The operation control strategy is unified and optimized for a hybrid system, and even has an integrated system control strategy, which shows new characteristics that are completely different from hydropower stations, photovoltaic power stations or wind farms. A power generation system operating in this way has many advantages, including better power output characteristics, maximizing the overall benefits of the integrated power generation system through the use of novel control strategies, etc. The principles of the water–wind–light integrated power generation system are shown in Figure 1.
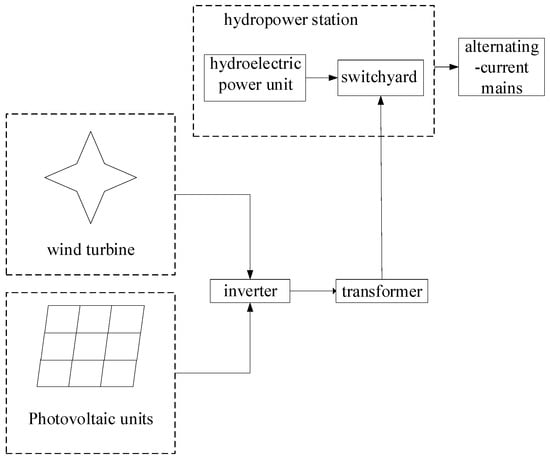
Figure 1.
Water–wind–light complementary plant.
2.2. Forecast of Renewable Energy Generation Capacity
In this paper, the convolutional neural network is used to predict the output power of the landscape [28]. It uses a small number of parameters to extract the relationships between the data, and then combines them to form high-level data features, with a strong data feature extraction ability. A typical convolutional neural network mainly includes an input layer, a hidden layer (convolutional layer, pooling layer, full connection layer) and an output layer. Its specific structure is shown in Figure 2.
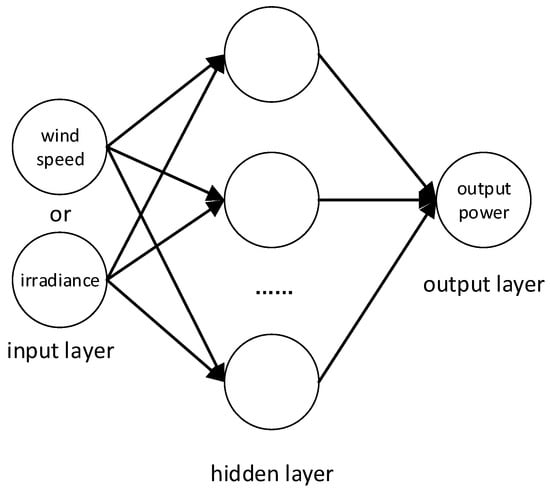
Figure 2.
A convolutional neural network structure diagram.
The input layer inputs the irradiance and wind speed. The convolution layer mainly performs the convolution operation, which is the operation between the feature graph of the previous layer and the convolution kernel. Then, the new feature matrix is obtained using the specific activation function, and the expression ability of the model is enhanced through the convolution layer. The mathematical expression for the convolution operation is as follows [29]:
where N is the number of layers in the network; is the -th feature graph of the N-th convolutional layer; is an activation function; is the total number of neurons in the previous layer; is the -th feature diagram of the network transmitted from the previous layer; is the weight matrix of the corresponding convolution kernel; and is a bias matrix.
In this paper, two factors with strong correlations between wind speed and irradiance are considered in the solar power generation prediction due to the magnitude of difference in the parameters and the value difference being relatively large. Therefore, the wind speed, irradiance and historical landscape power values are normalized to map between [–1, 1]. The normalization formula is as follows [29]:
where is the minimum value of the variable and is the maximum value of the variable.
2.3. Constraint Condition
- (1)
- Storage capacity constraints:where and are, respectively, the maximum and minimum values of the reservoir capacity; is the water storage capacity of the reservoir at the end of period t-th.
- (2)
- Output constraints of hydropower station units:where and represent the minimum and maximum output of the hydropower station, respectively; is the output of the hydropower station at the end of period t-th.
- (3)
- Water balance constraint:where is the reservoir storage capacity of the t-th period; is the flow of the reservoir of the -th period; is the generated flow of the reservoir in the -th period; is the abandoned water quantity of the reservoir in the t period; and is a time interval.
2.4. Net Residual System Load
The difference between the load demand of the water and wind complementary system, and the photovoltaic and wind power output, is the net load of the system. The description of the overall characteristics of the net load uses the daily average net load according to the characteristics of the system net load. The average daily net load can reflect the overall level of the daily net load, according to the following formulas:
where is the net load of the mixed system at the -th time; is the mixed system load requirement of the -th time; and are, respectively, the -th time of the photovoltaic and wind output powers; and is the average daily net load of the hybrid system.
2.5. Objective Function
This paper involves two competing objective functions: the maximum power generation and the minimum output power fluctuation.
- (1)
- Maximum power generation
The day is divided into 96 periods, with every 15 min being a time point; the maximum power generation of the water–wind–light complementary power generation system is the following target function:
where , and are the photoelectric output, wind power output and hydroelectric-generated set output of the -th time; is the total number of intervals in the time range; is the number of hydraulic generator sets; and is a time interval.
- (2)
- Minimum output power fluctuation
In this paper, the Wang-Mei index is used to reflect the volatility of the output power [30]. This index quantifies the power output fluctuation of the system using the rotation angle and standard deviation. As shown in Figure 3, for each moment, there is a rotation angle reflecting the degree of power change at that moment. According to the Wang-Mei index, the minimum output power fluctuation of the water–wind–light complementary power generation system is taken as the following objective functions:
where is the total number of time intervals; and is the total output power of the water–wind–light complementary power generation system at time t and time t+ 1; is the standard deviation of the ; is the rotation angle of the ; and is the gradient between the and the .
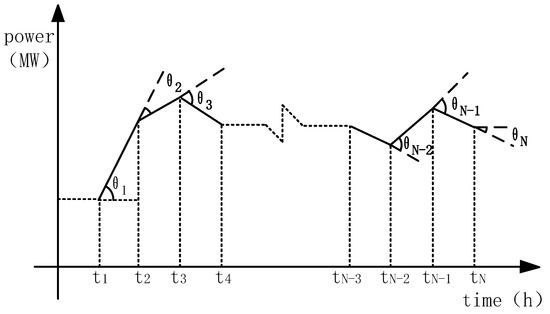
Figure 3.
Schematic diagram of the rotation angle, with the Wang−Mei index as the indicator.
3. The Solved Algorithm
3.1. Multi-Objective Pigeon-Inspired Optimization (MOPIO) Algorithm
The pigeon-inspired optimization (PIO) algorithm simulates the pigeon homing behavior-designed intelligent optimization algorithm. It designs a map and compass operator and landmark operator phased guide on pigeons’ individual flight by simulating the pigeon homing process of special navigation behavior. PIO has the characteristics of concise principles and being easy to implement. Compared with other algorithms, it has the obvious advantages of relatively simple calculation and relatively strong robustness. To solve the multi-target optimization problem, a multi-target pigeon swarm optimization algorithm based on the Pareto sorting mechanism and merging operators has emerged. At present, MOPIO has been successfully applied to solving multi-target optimization problems such as multi-UAV target searching and the fuzzy production scheduling problem [31,32,33].
3.1.1. Sorting Mechanism of Pareto
The ranking mechanism of Pareto consists of a non-dominant ranking operator and a crowding distance operator. First, individuals from a pigeon flock are divided into unequal non-dominance ranks based on inter-individual dominance relationships and fast non-dominance ordering. The set of non-dominated solutions for the current population consists of individuals that are located in the first rank. The crowding distance operator is reused to calculate the crowding distance between individuals in different non-dominance classes; individuals are then sorted again based on the size of the crowding distance. After the above two operators are completed, the individual pigeon is divided into different sets according to their non-dominant level, and the individuals in the set are arranged in descending order according to the size of the crowding distance. The flow of the ranking mechanism of Pareto is shown in Figure 4.
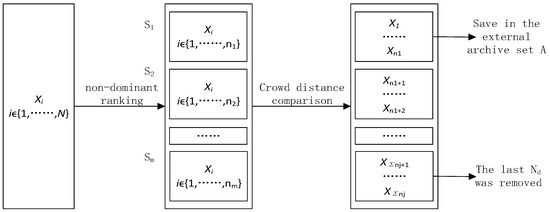
Figure 4.
Process of Pareto sorting.
After the Pareto sorting is finished, the non-dominant solution set of the current population can be deposited into the external archive set. The last individual with the maximum non-dominance rank and minimum crowding distance will be removed.
3.1.2. Consolidation Operator
MOPIO uses a map operator, a compass operator and a landmark operator to obtain a merged operator, in order to update the individual speed and position of the pigeon group. The formula for the merged operator is as follows:
where and respectively represent the number of populations after the -th iteration and the number of individuals to be removed for each generation; -max represents the maximum number of iterations; represents the speed of ; tr is a transition factor; is the global optimal position of the current population; and is the central position of the non-dominant solution set of the previous generation; the calculation formula is provided as follows:
where is the position of the i-th individual in the previous generation of the non-dominant solution concentration; is the size of the non-dominant solution set.
3.2. Multi-Objective Fractional Pigeon-Inspired Optimization (MOFPIO) Algorithm
The Adaptive Fractional Calculus Strategy
- (1)
- Fractional calculus
Fractional calculus, namely, the integral and differentiation of order as fractions, is an extension of traditional calculus and is widely used in digital image processing and digital signal processing due to its memory. There are many definitions of fractional calculus, and the commonly used G-L (Grunwald–Letnikov) definition is used here [34]. Assuming the existence of continuously derivable functions of within the interval of , then the first derivative of is
where is the increment on the interval of . The n derivative of the available function is further derived from the above equation.
where n ∈ N. The -order fractional expression defined by G-L is as follows:
where is the gamma function.
According to Equation (17), an approximate differential expression for the -order integral of signal is defined by G-L as the following:
- (2)
- Pigeon flock algorithm for fractional optimization
The original pigeon flock algorithm has the disadvantage of a slow convergence speed and it easily falls into the local optimum. In order to improve the global search ability, the fractional strategy is introduced into the pigeon flock algorithm. The algorithm substitutes the fractional calculus strategy into the speed update formula of the original pigeon flock algorithm. It uses the heritability and memory of the fractional calculus strategy to improve the original pigeon flock to fall into the local optimum. It also can effectively improve the convergence speed of the pigeon flock algorithm. Taking only the first four terms of Formula (18), the updated formula of the fractional pigeon flocking algorithm is as follows:
where is the location of the updated former cluster and is the current location before the update.
Since the fractional order has a large effect on the algorithm, the fixed fractional order cannot be achieved, so the fractional order can be adaptively adjusted according to the velocity and position information of the pigeon flock. The average distance between pigeon and the other pigeons is calculated as follows:
where is the total number of pigeons, and is a space dimension. The evolutionary factor is
where is the average of the global optimal distance of the flock from the other pigeons, the maximum mean distance between the pigeons is and the minimum value is when R∈[0, 1]. When the fractional order is , the algorithm works the best, so this can be dynamically adjusted according to the following equation:
4. Water–Wind–Light Complementary Optimization
4.1. Population Initialization
For the multi-objective problem, the power output of the unit in each scheduling cycle should be regarded as the decision variable of the individual population. Therefore, in the multi-target pigeon group algorithm, the population size is , where each individual contains a -dimensional decision variable, and the initialized population form is as follows:
where is the number of generator sets; is the number of scheduling cycles; and is generated randomly between the upper and lower limits of its output.
4.2. Algorithm Process
A flowchart of the improved pigeon flock algorithm is shown in Figure 5. The process for solving multi-objective problems is shown as follows:
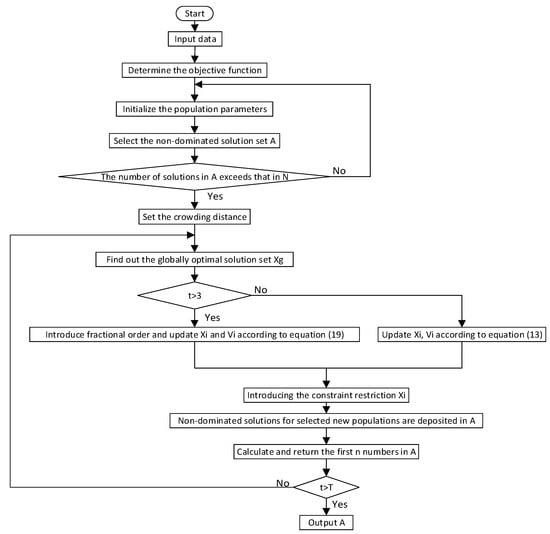
Figure 5.
Flowchart of the improved pigeon flock algorithm.
Step 1: Initializing the population, including the population size , position , speed , individual history optimal , and the number of iterations .
Step 2: Initializing an external archive set , finding the non-dominated solution set of the initial population using the Pareto sorting mechanism, and depositing it in .
Step 3: Repeating steps 1–2 until the number of non-dominant solutions in reaches the set point, and jumping out of the loop.
Step 4: Using the Pareto ranking mechanism to rank the external archive set , selecting the appropriate global optimal for each individual separately from , and calculating the central value of the initial population.
Step 5: When n ≤ 3, the speed and position are updated according to Equation (13). When , the fractional parameter of the current population is calculated, and the new is calculated according to Equation (19), and its speed and position are updated via substitution using Equation (13).
Step 6: Finding the non-dominant solution set of the current population and combining it into the external archive set , sorting the external archive set using the Pareto sorting mechanism, and keeping the first individuals as the Pareto-optimal solution set of the current generation.
Step 7: Making ; if , return to step 4; otherwise, stop running and output the Pareto-optimal solution set.
5. Scenario Setting
In this paper, the landscape power generation system of a river basin in Xinjiang is taken as an example to verify and analyze the optimal dispatching model established above. The complementary system includes one hydropower station, a wind farm and a photovoltaic power station. The maximum output of the hydropower station is 720 MW and the minimum output is 60 MW. The hydropower station has a daily regulation capacity, a rated head of 68 m and a rated flow of 405 m3/s. The maximum capacity of the wind farm is 800 MW. The rated power of a single fan is 2 MW, and the maximum capacity of the photovoltaic power station is 1000 MW. Two typical days (a typical summer scene day and a typical winter scene day) were selected for analysis. The input and output data sizes are all 1 × 96, that is, the daily data with a time scale of 15 min. The wind power, photovoltaic power and load curves are shown in Figure 6. The correlation coefficient of the prediction results is 0.9954, the root mean square error (RMSE) is 1.6378, the average absolute error (MAE) is 1.3585 and the prediction error is small.
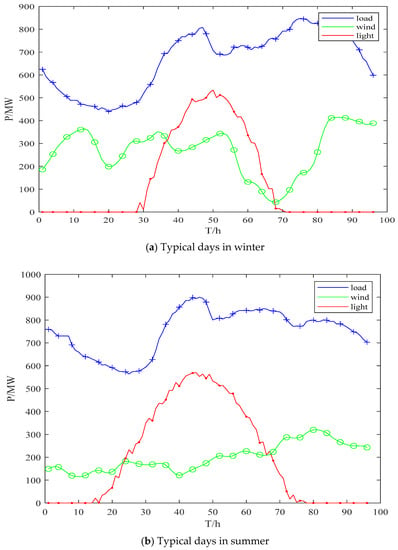
Figure 6.
Wind power, photovoltaic power and load curve.
As can be seen in Figure 6, in one day in this region, the load is smallest in the early morning, and the output of wind power is large in the night and early morning. The peak of the photovoltaic power generation in both summer and winter is at noon, and the photovoltaic output peaks at night and in the early morning. The output of the two kinds of renewable energy has certain complementary characteristics in terms of time.
6. Experimental Verification
6.1. Pareto Solution Set Analysis
The MOFPIO, the MOPIO, and the MOPSO are used to solve the multi-objective model of the water–wind–light complementary power generation system. The Pareto-optimal solution set that was obtained consists of three objective functions in two scenarios. In each scenario, the Pareto set of all three algorithms contains 50 solutions. The resulting Pareto-optimal solution set is shown in Figure 7. In the figure, f1 is the power generation and f2 is the output fluctuation.
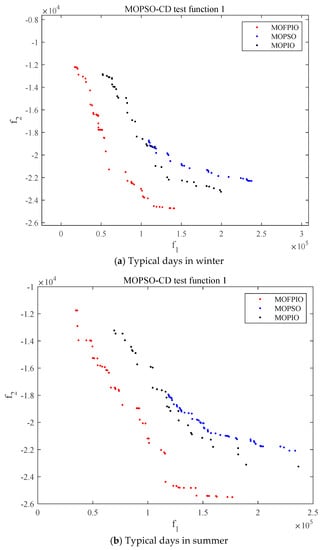
Figure 7.
Pareto−optimal solution set under two objective functions.
As can be seen in Figure 7, the improved pigeon swarm algorithm is closer to the objective function value, and the optimal solution set in each scenario has the same changing trend. One of the two targets increases and the other decreases, which reflects the conflicting relationship between the objective functions. The difference between each scene is found to be in the form of the value range of the objective functions; the adaptive values of the target functions are counted in different scenarios. The results of the three strategies in the different scenarios are shown in Table 1.

Table 1.
Target function adaptation values in different scenarios.
As can be seen in Table 1, the search range for the of MOFPIO is about 12,000–25,000 MW. The search range of MOPIO is about 13,000–23,000 MW. And the search range of MOPSO is about 18,000–22,000 MW. It shows that the search range of MOFPIO is similar to that of MOPIO, which is significantly larger than that of MOPSO. The MOPIO algorithm has a better global search capability. For the , the minimum values obtained by the MOFPIO algorithm are 34,676.793 MW and 17,148.577 MW, respectively, in summer and winter, and the maximum values are 141,018.920 MW and 176,687.155 MW, respectively. The results are less than the other two algorithms under the same conditions, showing the better optimization accuracy of the MOFPIO algorithm. So, MOFPIO has excellent optimization performance.
6.2. Results of the Optimization Calculation
Figure 8 presents the results of the water–wind–light independent power generation and joint scheduling. As can be seen in the figure, after the complementary optimization scheduling of water–wind–light, the total power generation is 8.4722 million kWh. The hydraulic power generation is 4.5668 million kWh, accounting for 53.90% of the total power generation. The hydraulic power generation and photovoltaic power generation are 1.9242 million kWh and 1.9812 million kWh, accounting for 22.71% and 23.38% of the total power generation. It can be seen from the comparison of the separate output and the combined output that the output of the former hydropower fluctuates greatly with the time scale, while the output of the latter fluctuates less and greatly absorbs the solar energy.

Figure 8.
Comparison before and after joint water–wind–light scheduling.
In order to study the complementary characteristics of the water–wind–light complementary optimization system, the individual output of each power supply is compared with the complementary output of the combined hydropower station. The degree of the intraday output fluctuation is also calculated. The complementarity index is given as the following equation:
where is the average value of the total output of hydropower; is the total output of hydropower at time ; is the number of daily scheduling cycles, and the value is 96.
The calculation results of Equation (24) are shown in Table 2. It can be seen in Table 2 that the independent operation of hydropower, wind power and photovoltaic power generation fluctuates greatly, and the fluctuation decreases significantly after complementary operation. The output standard deviations of MOPSO, MOPIO and MOFPIO in winter after water–wind–light complementary operation are reduced by 31.8%, 35.6% and 50.2%, respectively. The output standard deviations of MOPSO, MOPIO and MOFPIO in summer after operation are reduced by 14.7%, 34.1% and 84.5%, respectively, which are better than that of a single operation, indicating that the fluctuation of the system is significantly reduced after participating in the optimal scheduling. Among them, the water–wind–light output fluctuation suppression effect based on MOFPIO is the best, which can effectively suppress the fluctuation value of wind power.

Table 2.
Comparison of the fluctuation value of hydropower output.
Figure 9 compares the total output value of hydropower on different typical days under the three methods. As can be seen in Figure 9, the MOPSO method has the most volatility, followed by the MOPIO method. The hydropower output fluctuation of the MOFPIO method is significantly lower than that of the other two methods. A small output fluctuation is conducive to the regulation of hydropower units. The typical hydropower output fluctuation in winter is larger than that of the typical days in summer, and the typical hydropower output in summer is relatively stable. The comparison results of the different scheduling strategies are shown in Figure 10.
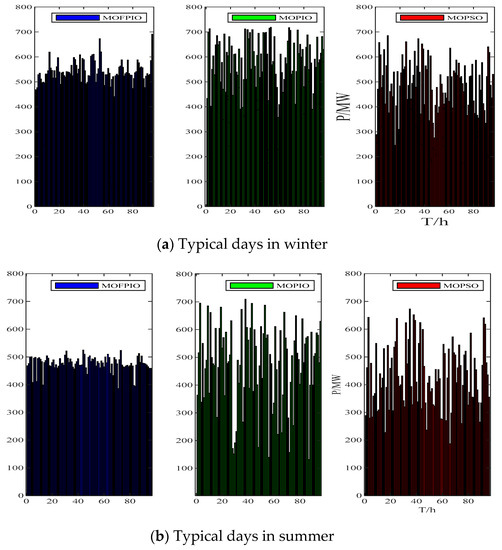
Figure 9.
Comparison diagrams of the hydropower output of different schemes.
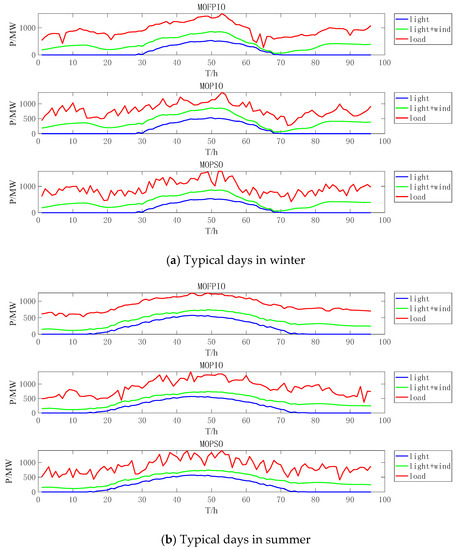
Figure 10.
Total output of the system under different scheduling strategies.
As can be seen in Figure 10, the total output fluctuation of the MOFPIO method is the smallest, followed by the MOPIO method and the MOPSO method. The three algorithms have the same effect over the two typical days because the hydropower output fluctuation of the typical winter day is larger than that of the typical summer day. Therefore, the total output fluctuation of the typical winter system is larger than that of the typical summer system, and MOFPIO method optimization scheduling can increase the stationarity of the load.
7. Conclusions
This paper focused on the multi-objective optimal scheduling of a water–wind–light combination complementary system. A multi-objective optimization model for maximizing power generation and minimizing system power fluctuation was established, and an adaptive fractional order multi-objective pigeon swarm optimization algorithm was proposed. Through simulation experiments, it was compared with the existing MOPSO and MOPIO methods. The results showed that the output fluctuation of the system was significantly reduced after the joint scheduling of the complementary system. Compared with the single operation, the output fluctuation of the combined system was reduced by 50.2% in winter and 84.5% in summer. Compared with MOPSO, the MOFPIO algorithm proposed in this paper had a wider output range. The output range obtained by MOFPIO was 12,000–24,000 MW, and the range of traditional MOPSO was 18,000–22,000 MW. Compared with MOPIO, the improved MOPIO scheduling strategy reduced the fluctuation by 41.1% under the condition of a similar output. The improved scheduling method had a better effect and better optimization accuracy. The effectiveness of the proposed multi-objective pigeon swarm optimization algorithm based on the adaptive fractional calculus strategy for water–wind–light joint optimal scheduling was verified, which also provides a broader solution for the water–wind–light complementary system.
Author Contributions
Conceptualization, B.W.; methodology, K.W., P.G. and M.L.; software, K.W. and N.D.; validation, J.W., J.L., M.L. and B.W.; funding acquisition, B.W. All authors have read and agreed to the published version of the manuscript.
Funding
This research was funded by the Shaanxi Province Key Research and Development Plan (Number 2021NY-181), the coordinates scientific research projects of State Power Investment Corporation Limited (Number TC2020SD01), and the National Natural Science Foundation of China (Numbers 51909222 and 51509210).
Data Availability Statement
Not applicable.
Conflicts of Interest
The authors declare no conflict of interest.
References
- Jiang, Q.; Yin, Z. The optimal path for China to achieve the “Dual Carbon” target from the perspective of energy structure optimization. Sustainability 2023, 15, 10305. [Google Scholar] [CrossRef]
- Wang, Z.; Lv, X.; Xiu, J.; Li, D.; Cheng, Q.; Li, M. Optimal dispatch of integrated energy system under “Double Carbon” target. J. Phys. Conf. Ser. 2023, 2527, 012028. [Google Scholar] [CrossRef]
- Jiang, P.; Zhang, H.; Li, M.; Zhang, Y.; Gong, X.; He, D.; Liu, L. Research on the structural optimization of the clean energy industry in the context of dual carbon strategy—A case study of Sichuan province, China. Sustainability 2023, 15, 2993. [Google Scholar] [CrossRef]
- Ma, J.; Huang, S. Research on China’s renewable energy policy system under the background of “Dual Carbon”. E3S Web Conf. 2023, 369, 02006. [Google Scholar] [CrossRef]
- Lei, K.; Chang, J.; Wang, X.; Guo, A.; Wang, Y.; Ren, C. Peak shaving and short-term economic operation of hydro-wind-PV hybrid system considering the uncertainty of wind and PV power. Renew. Energy 2023, 215, 118903. [Google Scholar] [CrossRef]
- Xiong, H.; Mònica, E.; Poul, A. Multi-objective optimization of a hydro-wind-photovoltaic power complementary plant with a vibration avoidance strategy. Appl. Energy 2021, 301, 117459. [Google Scholar] [CrossRef]
- Ponnuru, S.; Kumar, R.; Swaroopan, N. Intelligent control and power management of wind-solar integration of renewable energy sources using microgrid. Mater. Today Proc. 2020, 45, 2323–2328. [Google Scholar] [CrossRef]
- Chao, M.; Lu, L. Optimal capacity configuration of hydro-wind-PV hybrid system and its coordinative operation rules considering the UHV transmission and reservoir operation requirements. Renew. Energy 2022, 198, 637–653. [Google Scholar]
- Poonam, S.; Manjaree, P.; Laxmi, S. Multi-objective optimal sizing of hybrid micro-grid system using an integrated intelligent technique. Energy 2023, 269, 126756. [Google Scholar]
- Wang, X.; Bie, Z.; Liu, F.; Kou, Y.; Jiang, L. Bi-level planning for integrated electricity and natural gas systems with wind power and natural gas storage. Int. J. Electr. Power Energy Syst. 2020, 118, 105738. [Google Scholar] [CrossRef]
- Zhu, J.; Chen, L.; Wang, X.; Yu, L. Bi-level optimal sizing and energy management of hybrid electric propulsion systems. Appl. Energy 2020, 260, 114134. [Google Scholar] [CrossRef]
- Mohammad, A.; Reza, S. Achieving sustainability and cost-effectiveness in power generation: Multi-objective dispatch of solar, wind, and hydro units. Sustainability 2023, 15, 2407. [Google Scholar]
- Kamel, O.; Abdelaziz, A.; Diab, A. Damping oscillation techniques for wind farm DFIG integrated into inter-connected power system. Electr. Power Compon. Syst. 2020, 48, 1551–1570. [Google Scholar] [CrossRef]
- Daqaq, F.; Kamel, S.; Ouassaid, M.; Ellaia, R.; Agwa, A.M. Non-dominated sorting manta ray foraging optimization for multi-objective optimal power flow with wind/solar/small- hydro energy sources. Fractal. Frac. 2022, 6, 194. [Google Scholar] [CrossRef]
- Wang, Y.; Liu, J. Optimal capacity allocation of wind-light-water multi-energy complementary capacity based on improved multi-objective optimization algorithm. Front. Energy Res. 2023, 10, 1115769. [Google Scholar]
- Zhang, X.; Campana, P.; Bi, X.; Egusquiza, M.; Xu, B.; Wang, C.; Egusquiza, E. Capacity configuration of a hydro-wind-solar-storage bundling system with transmission constraints of the receiving-end power grid and its techno-economic evaluation. Energy Convers. Manag. 2022, 270, 116177. [Google Scholar] [CrossRef]
- Lei, Y.; Xu, J.; Pan, L.; Sun, D. Research on capacity allocation optimization of a wind-photovoltaic-hybrid-battery power generation system with multi-energy complementary. E3S Web Conf. 2022, 358, 01039. [Google Scholar] [CrossRef]
- Dong, J.; Dou, Z.; Si, S.; Wang, Z.; Liu, L. Optimization of capacity configuration of wind–solar–diesel–storage using improved sparrow search algorithm. J. Electr. Eng. Technol. 2022, 17, 1–14. [Google Scholar] [CrossRef]
- Yang, H.; Yu, Q.; Liu, J.; Jia, Y.; Yang, G.; Ackom, E.; Dong, Z.Y. Optimal wind-solar capacity allocation with coordination of dynamic regulation of hydropower and energy intensive controllable load. IEEE Access 2020, 8, 110129–110139. [Google Scholar] [CrossRef]
- Yalcinoz, T.; Krzysztof, R. Multi-objective environmental-economic load dispatch considering generator constraints and wind power using improved multi-objective particle swarm optimization. Adv. Electr. Comput. Eng. 2020, 20, 3–10. [Google Scholar] [CrossRef]
- Kamel, O.; Diab, A.; Do, T.; Mossa, M.A. A novel hybrid ant colony-particle swarm optimization techniques based tuning STATCOM for grid code compliance. IEEE Access 2020, 8, 41566–41587. [Google Scholar] [CrossRef]
- Gaojun, M.; Yanwen, D.; Pau, G.; Linlin, Y.; Wenyi, T. Multi-objective capacity optimization configuration of independent wind-photovoltaic- hydrogen-battery system based on improved MOSSA algorithm. Front. Energy Res. 2023, 10, 1077462. [Google Scholar] [CrossRef]
- Chen, K.; Peng, H.; Gao, Z.; Zhang, J.; Chen, P.; Ruan, J.; Wang, Y. Day-ahead operation analysis of wind and solar power generation coupled with hydrogen energy storage system based on adaptive simulated annealing particle swarm algorithm. Energies 2022, 15, 9581. [Google Scholar] [CrossRef]
- Behera, S.; Behera, S.; Barisal, A.K.; Sahu, P. Dynamic economic emission dispatch of thermal-wind-solar system with constriction factor-based particle swarm optimization algorithm. World J. Eng. 2020, 18, 217–227. [Google Scholar] [CrossRef]
- He, Y.; Guo, S.; Zhou, J.; Wu, F.; Huang, J.; Pei, H. The quantitative techno-economic comparisons and multi-objective capacity optimization of wind-photovoltaic hybrid power system considering different energy storage technologies. Energy Convers. Manag. 2021, 229, 113779. [Google Scholar] [CrossRef]
- Hu, Y.; Wang, J.; Liang, J. A self-organizing multimodal multi-objective pigeon-inspired optimization algorithm. Sci. China Informat. Sci. 2019, 62, 070206. [Google Scholar] [CrossRef]
- Wang, H.; Zhao, J. A novel high-level target navigation pigeon-inspired optimization for global optimization problems. Appl. Intell. 2022, 53, 14918–14960. [Google Scholar] [CrossRef]
- Wang, Y.; Fu, Y.; Sun, L.; Xue, H. Ultra-short-term prediction model of photovoltaic power generation based on chaos-RBF neural network. Power Syst. Technol. 2018, 42, 1110–1116. [Google Scholar]
- Yao, Q.; Wang, Y.; Yang, Y. Range estimation of few-shot underwater sound source in shallow water based on transfer learning and residual CNN. J. Syst. Eng. Electron. 2023, 34, 839–850. [Google Scholar] [CrossRef]
- Wang, X.; Mei, Y.; Cai, H.; Cong, X. A new fluctuation index: Characteristics and application to hydro-wind systems. Energies 2016, 9, 114. [Google Scholar] [CrossRef]
- Yuan, G.; Duan, H. Robust control for UAV close formation using LADRC via sine-powered pigeon-inspired optimization. Drones 2023, 7, 238. [Google Scholar] [CrossRef]
- Zheng, Z.; Duan, H.; Deng, Y. Extended search pigeon-inspired optimized MPPT controller for solar quadcopter. Aircr. Eng. Aerospace Technol. 2023, 95, 706–714. [Google Scholar] [CrossRef]
- Fu, X.; Chan, F.; Niu, B.; Chung, N.S.; Qu, T. A multi-objective pigeon inspired optimization algorithm for fuzzy production scheduling problem considering mould maintenance. Sci. China Informat. Sci. 2019, 62, 70202. [Google Scholar] [CrossRef]
- Li, G.; Liu, Y.; Deng, X. A prediction method based on fractional order displacement for dynamic multi-objective optimization. ISA Transact. 2022, 130, 163–176. [Google Scholar] [CrossRef] [PubMed]
Disclaimer/Publisher’s Note: The statements, opinions and data contained in all publications are solely those of the individual author(s) and contributor(s) and not of MDPI and/or the editor(s). MDPI and/or the editor(s) disclaim responsibility for any injury to people or property resulting from any ideas, methods, instructions or products referred to in the content. |
© 2023 by the authors. Licensee MDPI, Basel, Switzerland. This article is an open access article distributed under the terms and conditions of the Creative Commons Attribution (CC BY) license (https://creativecommons.org/licenses/by/4.0/).