1. Introduction
Traditional energies have played a significant role as an energy source in recent decades. However, their utilization has inevitably contributed to a range of climate change issues. With the gradual lifting of COVID-19 pandemic-related restrictions imposed by many countries [
1], global carbon emissions are expected to increase in the foreseeable future, heightening the criticality of global climate governance [
2]. However, clean energy can alleviate the adverse impact of industrialization on low-carbon development and more effectively address climate-related problems [
3]. Consequently, numerous countries, including China, have begun optimizing their energy mix and promoting the adoption of clean energy [
4].
The Chinese government has recognized the importance of promoting the development of natural and social capital as a crucial part of its development strategy for the future [
5]. However, China’s clean energy market is in its early stage of development and requires significant investments and technological innovation [
6]. Therefore, it is necessary to study whether and how the clean energy sector can provide investors with sensible asset allocation and portfolio strategies.
Investors and policymakers with an environmental consciousness have a keen interest in understanding the heterogeneity across different segments of the clean energy sector, mitigating financial risks, and examining the role and transmission pathways between clean energy markets and other financial markets. However, to the best of our knowledge, there are limited studies that systematically analyze the spillover effects between clean energy markets, emerging green bonds, technology stocks, gold, and traditional energy assets. Moreover, it is valuable and practical to consider extreme volatility, as research has shown that extreme volatility deserves special attention when examining market risk contagion characteristics for investors [
7]. For instance, events such as the Russian-Ukrainian conflict have led to shifts in the correlation of financial assets [
8]. The COVID-19 pandemic has also had a substantial impact on stock market performance, surpassing the effects of past crises, including the 2008 financial crisis [
9]. Companies, including many in the energy sector in China, have suffered significant losses [
10], and there may be potential changes in the risk aversion of underlying assets [
11]. It has been observed that, during the COVID-19 pandemic, the correlation between clean energy indices and conventional energy increased, but clean energy assets can still act as risk diversifiers [
12]. However, there is a lack of research on the specific performance and risk management measures under major contingencies such as COVID-19 and the Russia–Ukraine conflict.
To address the aforementioned research gap, this study aimed to investigate the movements of asset portfolios involving clean energy and other financial assets before and after the COVID-19 pandemic and, thus, provides valuable insights into the performance and risk management strategies of clean energy investments in the context of major contingencies. Additionally, due to the stricter COVID-19 protection measures implemented by the Chinese government compared to other countries, studies utilizing Chinese data may yield distinct findings compared to those relying on data from other nations.
The main objectives of this study were to provide insights into addressing some key questions in the field of clean energy investment and risk management: (1) Can other financial markets diversify risk for clean energy markets and identify the pathways through which risk is transmitted? (2) What are the major differences, compared to other assets, in the effectiveness of green financial markets, particularly green bonds, in hedging risk? (3) What is the heterogeneity of the hedging effect of different financial assets on various types of clean energy? (4) How is the role of risk diversification evolving over time?
The rest of this paper is organized as follows.
Section 2 reviews the literature.
Section 3 outlines the methodologies.
Section 4 presents the data and preliminary analysis.
Section 5 reports the empirical results.
Section 6 concludes the paper.
2. Literature Review
In current research on clean energy, portfolio construction with other financial assets has been explored as a means to hedge risks and secure returns. These assets include oil prices [
13], natural gas [
14], the VIX index [
15], the VXXLE index [
16], carbon assets [
17], and gold [
18]. By diversifying the portfolio, investors aim to mitigate the risk associated with clean energy investments. Furthermore, the introduction of the green bonds market has brought about additional opportunities for risk management. Studies suggest a low or even negative correlation between green bonds and clean energy markets, indicating that green bonds can provide protection against price volatility in clean energy markets [
19]. Moreover, green bonds have demonstrated higher average returns in comparison to traditional bonds [
20], making them increasingly popular among investors. This trend presents new opportunities for clean energy investors to improve their risk management practices.
Research has already explored the relationship between the clean energy market and other financial markets. For instance, a study [
21] found that green bonds serve the purpose of promoting portfolio diversification and act as a shock absorber for clean energy assets. Another study [
22] observed that a strong positive correlation between technology and clean energy stocks and that higher technology stock returns generate interest in clean energy stocks. The research in [
18] compared the hedge function of gold and crude oil for clean energy, concluding that gold is relatively weaker than crude oil in mitigating risks during extreme market volatility. While the United States primarily relies on oil as its main traditional energy source, China depends on coal power to fulfill more than two-thirds of its energy demand. The research conducted by [
23] indicated that there is a significant two-way volatility spillover effect between traditional energy markets such as the coal power market and clean energy stocks in China. However, the existing literature primarily focuses on examining the relationship between a single financial asset and the overall clean energy index, with limited studies exploring the connections between multiple financial markets and clean energy markets.
Currently, the green bonds market and clean energy markets have experienced rapid growth in terms of scope and depth. Exploring the interaction between green bonds and clean energy markets holds significant implications for investors and policymakers with environmental preferences. Scholars have studied the spillover effects within this system and found that green bonds exhibit fewer spillover effects compared to other factors. For example, the authors of [
24] revealed that green bonds serve as the primary recipients of shocks, as opposed to global solar, global wind, and carbon prices. A study [
21] discovered that both the green bond index and the global clean energy index act as net recipients of short-term and long-term shocks. Furthermore, research indicates that the impact of green bonds on the clean energy market is greater than the reverse influence. For instance, with causal market-related data, the research in [
25] found that the upward spillover from green bonds to the clean energy market is more significant than the downward spillover. However, in either the Granger causality of risk or the MVMQ-CAViaR model, the excessive spillovers from clean energy to the green bonds market are not significant, which implies that the green bonds market can serve as an emerging option to diversify clean energy portfolio risk.
The increasing interconnectedness among energy sub-sectors, markets, and industries has made the global new energy sector susceptible to the rapid diffusion of market information and associated risks during severe unexpected events, such as the COVID-19 pandemic. Consequently, these events can disrupt pre-existing network structures [
26]. Therefore, it is crucial for clean energy investors and policymakers to comprehend the risk–return profile of clean energy investments, as well as the potential time-varying characteristics and risk aversion properties [
27]. Under extreme market conditions, green bonds led to short-term growth in the clean energy sector and exerted an increasingly positive influence following the outbreak of the COVID-19 pandemic [
28]. The research in [
22] argued that the relationship between technology stocks and clean energy may differ during extreme market conditions, suggesting that technology stocks could provide opportunities for portfolio diversification. During a pandemic, a study [
29] observed a significant difference in the correlation between market returns in the traditional energy sector and the corresponding producer stock indices. Furthermore, it was found that gold prices had a significant positive impact on clean energy stocks in both the short-term and long-term during the COVID-19 pandemic [
30]. However, there is a scarcity of systematic studies examining the dynamic correlation and network structures between the clean energy market and the major financial markets. Furthermore, China’s stringent pandemic control strategies have resulted in divergent impacts compared to other countries, creating a research gap in this field.
Additionally, most of the existing studies on clean energy utilize composite indices and fail to account for the heterogeneity among different clean energy assets. Furthermore, there is a dearth of research examining the correlation between clean energy and financial assets, while simultaneously comparing various financial assets. Additionally, given China’s unique pandemic control policies and clean energy landscape, conducting relevant studies assumes greater significance.
The study contributes to the existing literature in three main ways: (1) It uncovers the heterogeneity in the size and direction of spillover effects across different clean energy markets. This provides valuable insights for asset allocation strategies under different investment conditions. (2) The study confirms the weak spillover effects between the clean energy market and the green bonds market, indicating that green bonds and the gold market serve similar functions as risk-averse assets. (3) In addition to time–frequency domain analysis, the study employed asymmetric analysis and dynamic analysis. By using the COVID-19 outbreak as a reference point, it investigated the risk spillover effects across different economic environments and time periods, shedding light on the risk transmission pathways in the spillover network.
This research helps to enhance portfolio construction for investors, increase social capital investment in the clean energy sector, and promote the development of green industries. Moreover, it provides valuable insights for policymakers to improve the effectiveness of climate policies by appropriately funding climate and sustainability projects.
4. Data and Descriptive Analysis
According to the Statistical Classification of Energy Conservation and Environmental Protection Clean Industries issued by the National Bureau of Statistics of China, the clean energy industry consists of eight sectors: nuclear power industry, wind energy industry, solar energy industry, biomass energy industry, hydropower industry, smart grid industry, other clean energy industries, and traditional energy clean and efficient utilization industry. Additionally, the traditional energy clean and efficient utilization industry are represented by waste-to-energy. The energy efficiency business of contract energy management is used to represent other clean energy sectors. To assess the overall performance of clean energy, the WIND series index (the data source is
https://www.wind.com.cn/ accessed on 7 July 2022) was adopted considering the time span, index authority, and recognition. The green financial market is represented by green bonds, which are primarily represented by the CSI-China Green Bond Index. Other markets are represented as follows: the high technology sector is represented by the CSI Technology 50 Strategy Index, the traditional energy market by the CSI Energy Futures Index, and the gold market by the Shanghai Gold Index (refer to
Table 1). All price data used in the analysis are daily closing prices, spanning from 5 January 2015 to 30 June 2022, resulting in 1822 observations for each market and 21,864 observations for the 12 markets. In the empirical analysis, the return series is computed with Equation (
19):
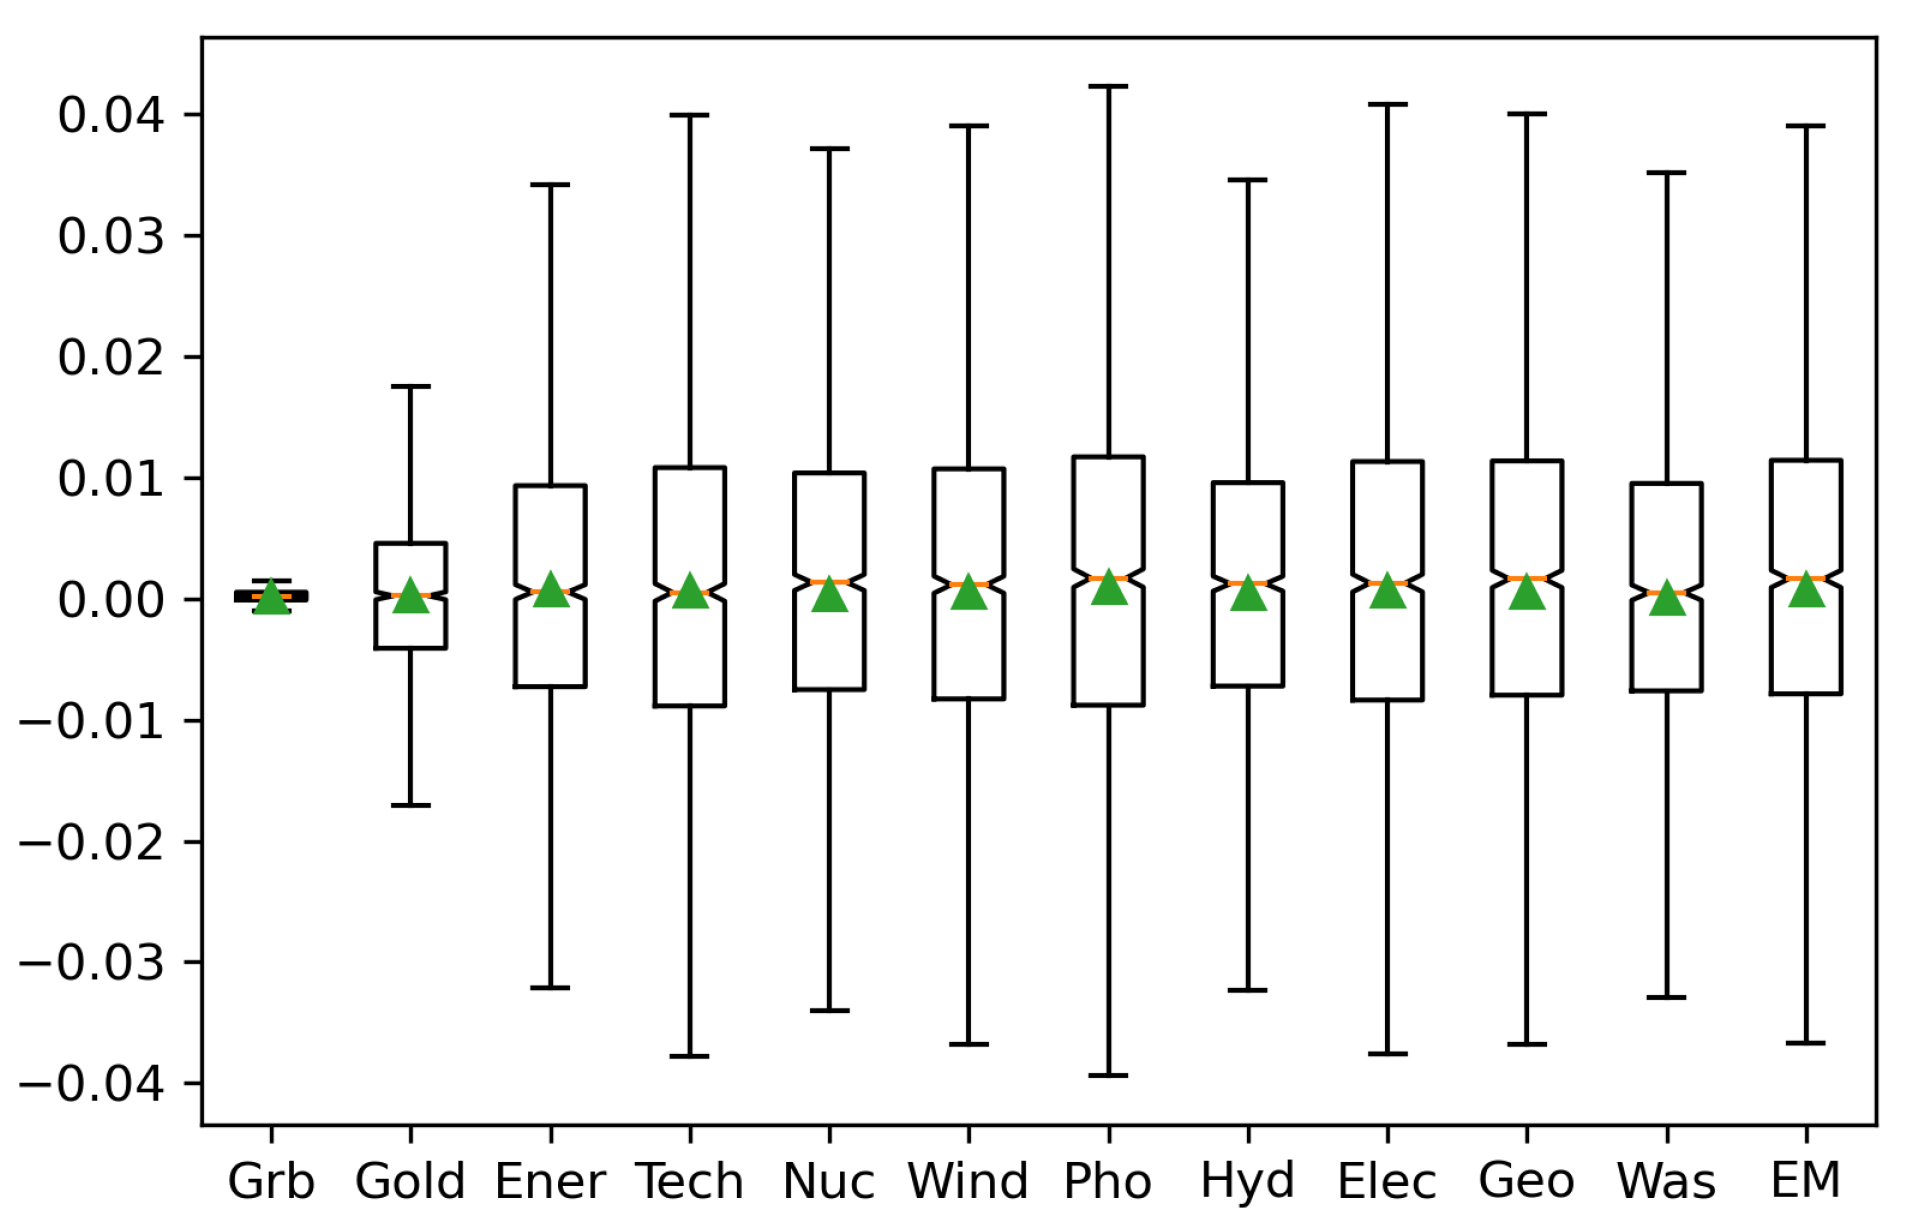
Figure 1 depicts the descriptive statistical analysis of each market return (details are shown in
Table A1 in
Appendix). With the exception of Was, all markets show positive means close to zero. The standard deviations of Pho and Wind are 0.0222 and 0.0212, respectively, indicating strong fluctuations in these two major variables. Although gold, the traditional safe-haven asset, exhibits a low standard deviation of 0.008491, green bonds have a significantly lower standard deviation of 0.0009. The kurtosis values of all series are at a high level, implying the existence of a spiky distribution. Regarding skewness, except for Gold and Pho, most market returns are negatively skewed. Furthermore, Jarque–Bera’s test rejects the null hypothesis that none of the variables follow a normal distribution. The Dickey–Fuller (ADF) test indicates that all variables are stationary series at the
level of significance.
6. Conclusions
6.1. Summary of This Research
The main objective of this paper was to examine the spillover effects and risk transmission dynamics between clean energy markets, the green bonds market, and other financial markets. The analysis took into account the impact of the COVID-19 pandemic and the Russian–Ukrainian conflict and investigated both static and dynamic spillover effects. To achieve this, the paper utilized the Diebold and Yilmaz spillover index model to analyze the static spillover effects among different markets. The model allows for an assessment of the interdependencies and contagion risks between clean energy equities, green bonds, and other financial assets. Furthermore, the study employed rolling time windows to capture the dynamic nature of spillovers. This approach enabled us to observe how the spillover effects evolve over time and potentially identify periods of heightened risk transmission. In addition, the Baruník and Křehlík spillover model, based on the frequency domain, was employed to investigate the spillover effects in the short, medium, and long terms. This analysis provides insights into the different time horizons over which risk is transmitted between the markets under consideration. Lastly, the paper employed spillover network analysis to compare the direction and strength of risk transmission changes during three split periods. This approach allows for a more-detailed examination of the risk transmission channels and can help identify key markets and assets that play significant roles in the spillover network.
6.2. Key Findings
- (a)
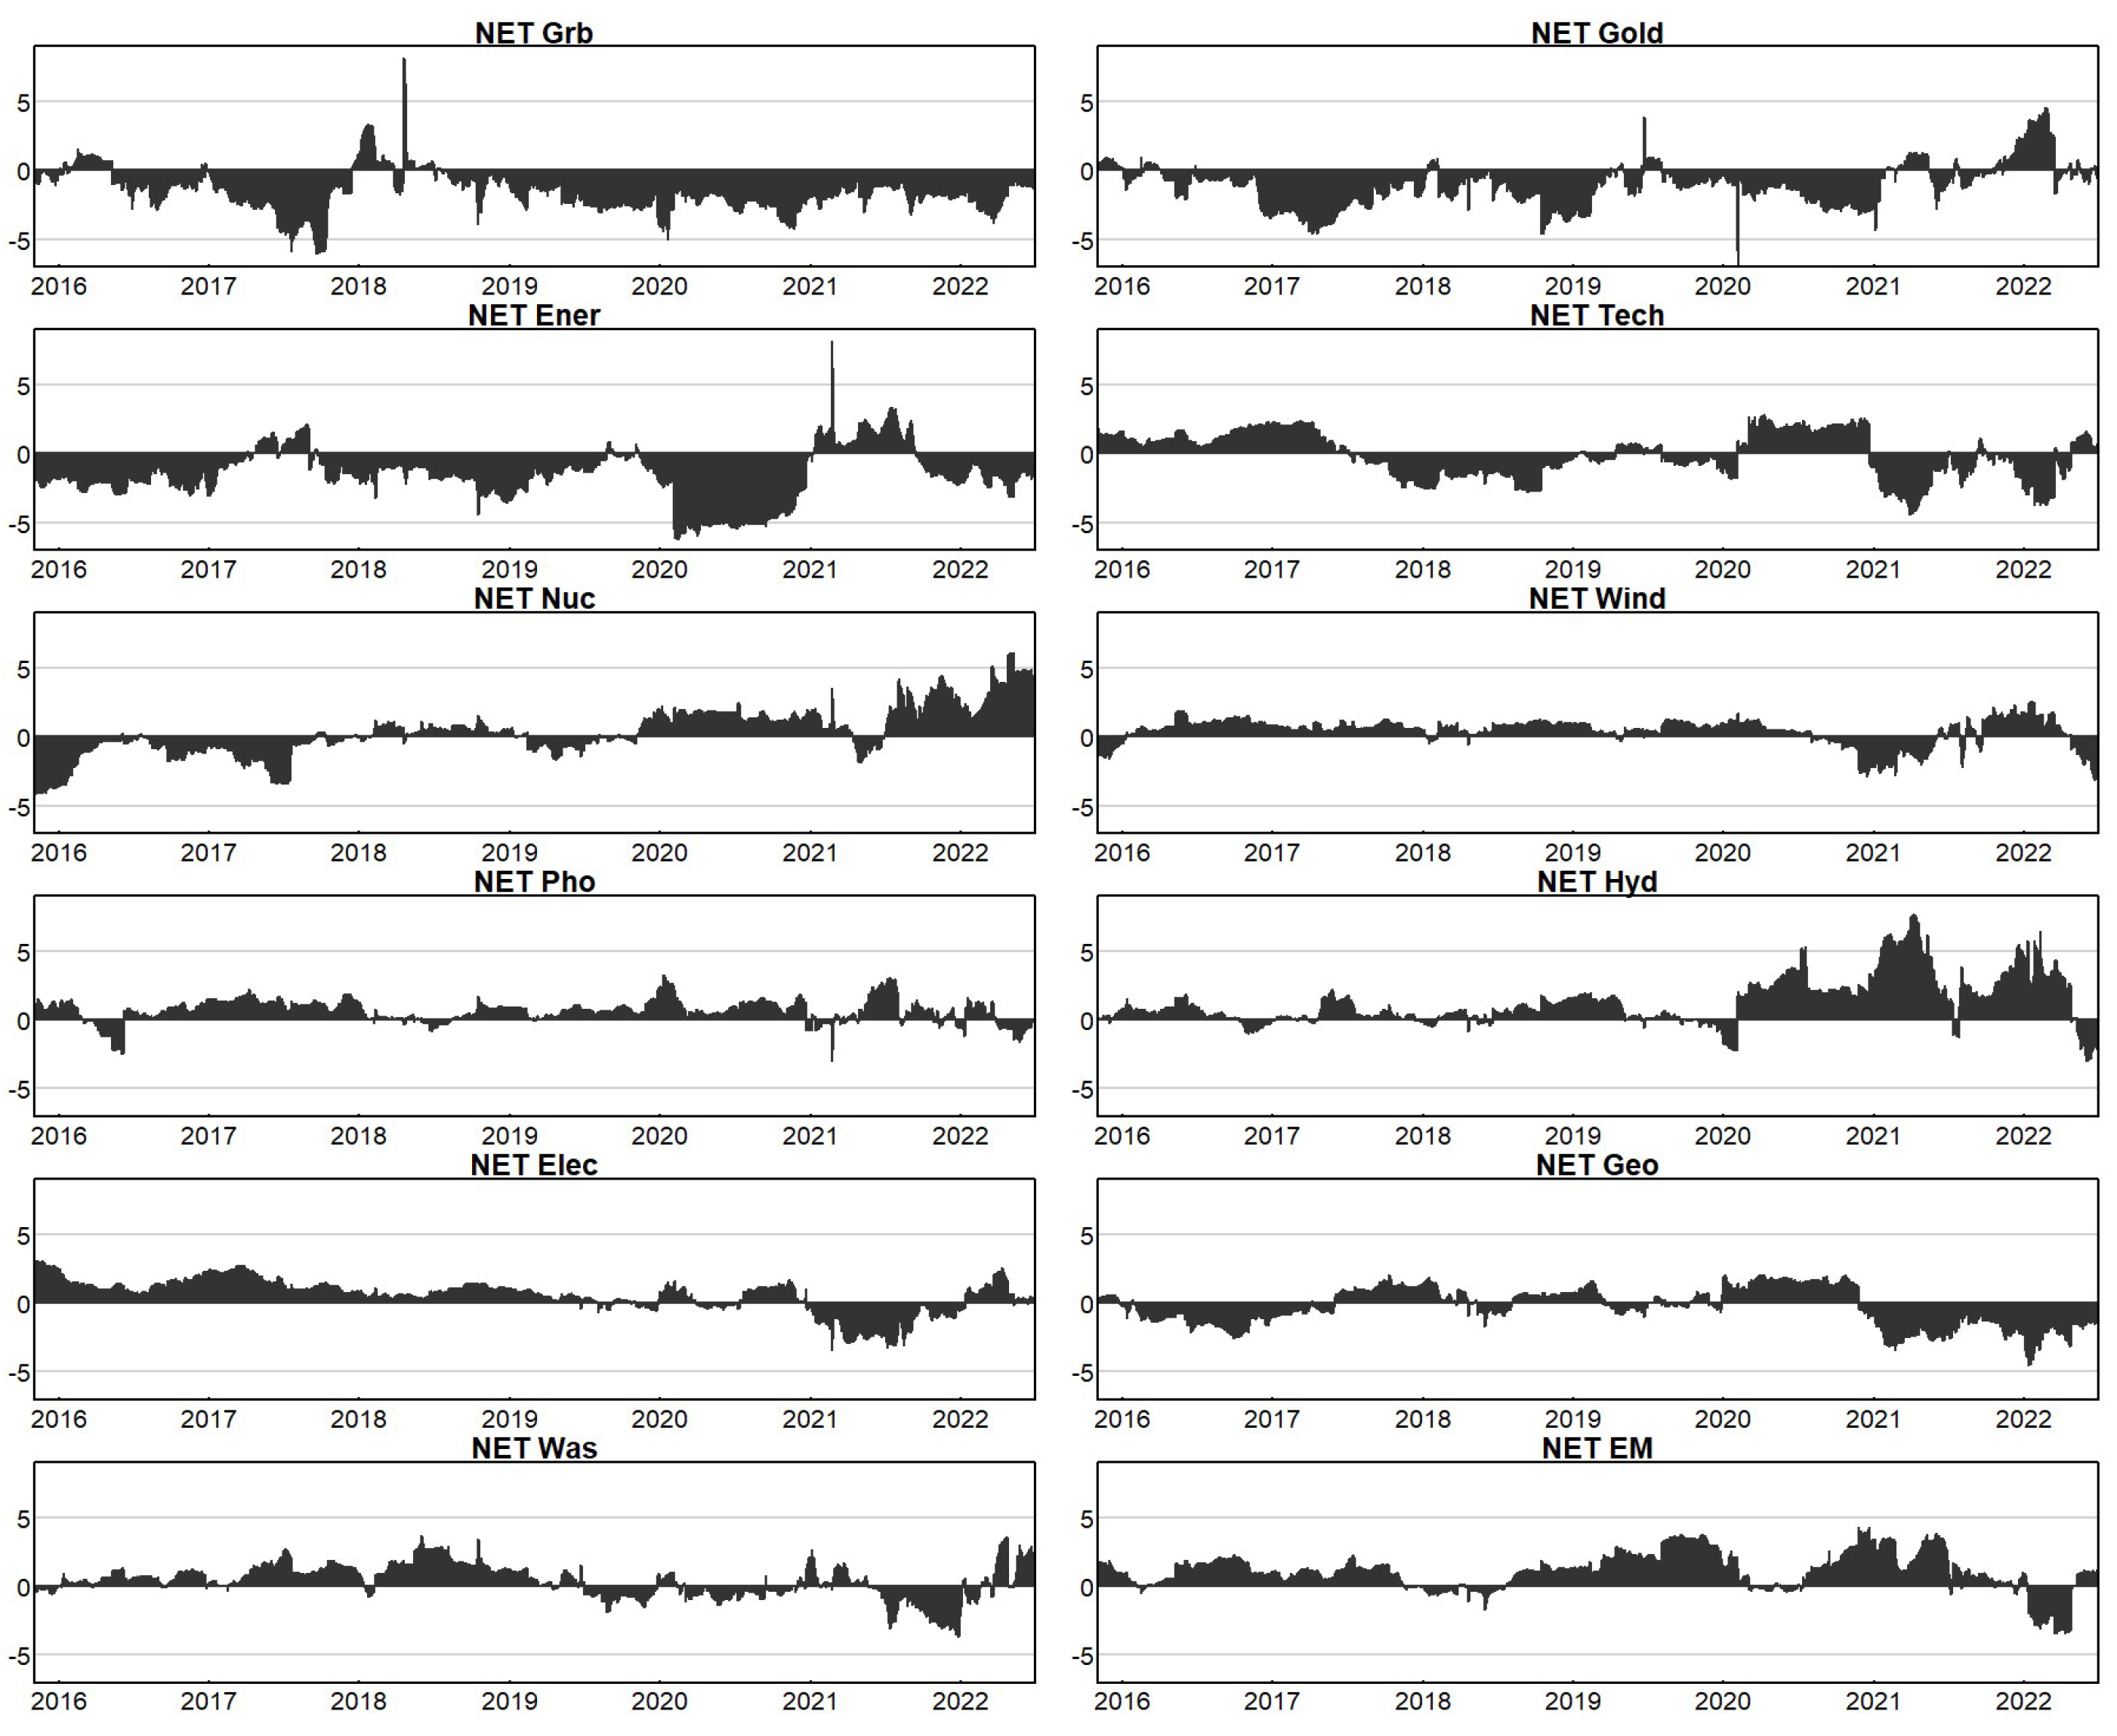
Static spillover effects: The analysis revealed that there is significant heterogeneity in the direction and magnitude of the net spillover effects among clean energy assets. Among them, smart grids exhibit the largest net spillover effect (18.64), indicating the strong influence on other markets and susceptibility to external shocks. The analysis highlighted the roles of the photovoltaic (−17.44) and green bonds markets (−24.63) as major receivers of spillover effects, implying that they tend to absorb risk from other markets rather than transmit it. Furthermore, the net spillover of the green bonds market is lower than other financial markets, indicating its potential contribution to risk diversification within the system.
- (b)
Frequency domain spillover analysis: This analysis revealed that the spillover effect of long-term volatility (71.3) is significantly greater than that of short- (65.57) and medium-term (65.95) spillovers. In the short and medium terms, gold exhibited the lowest connectedness with other clean energy assets. This implies that gold may have a lower degree of correlation and dependence on the performance of clean energy markets during these time periods. As a result, choosing gold as a hedging asset in extreme cases could be a more-sensible strategy compared to green bonds.
- (c)
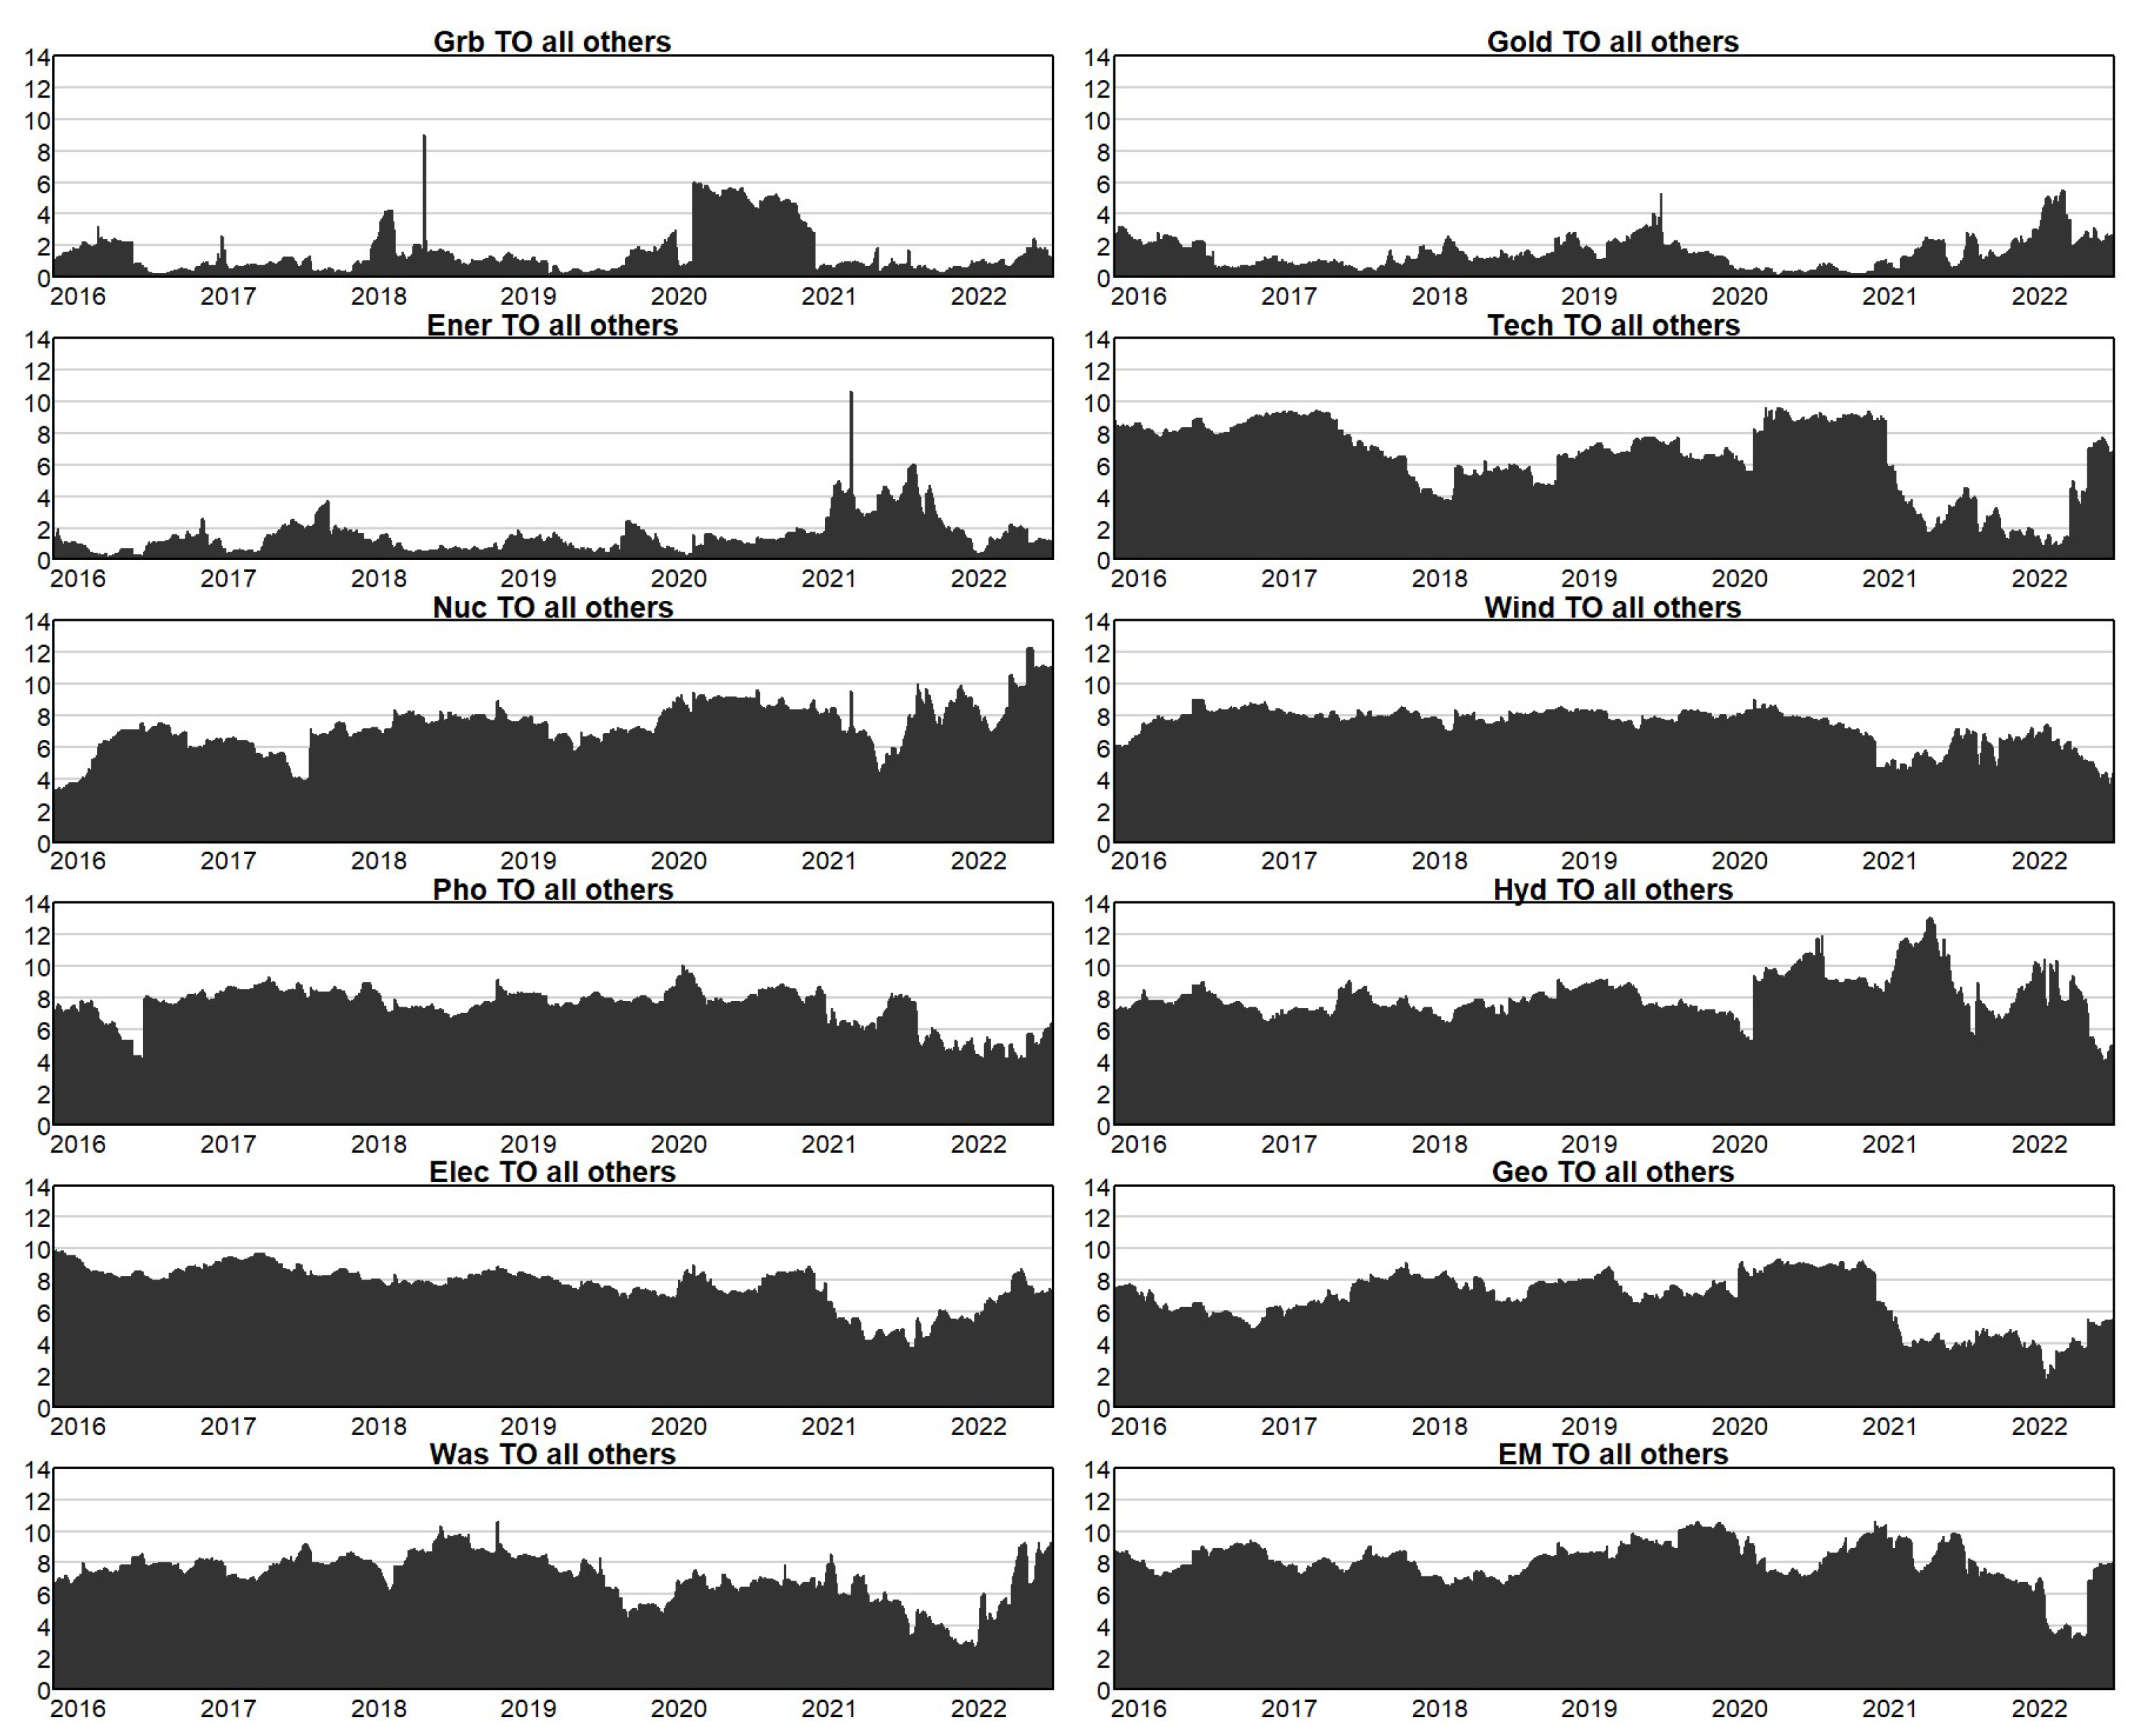
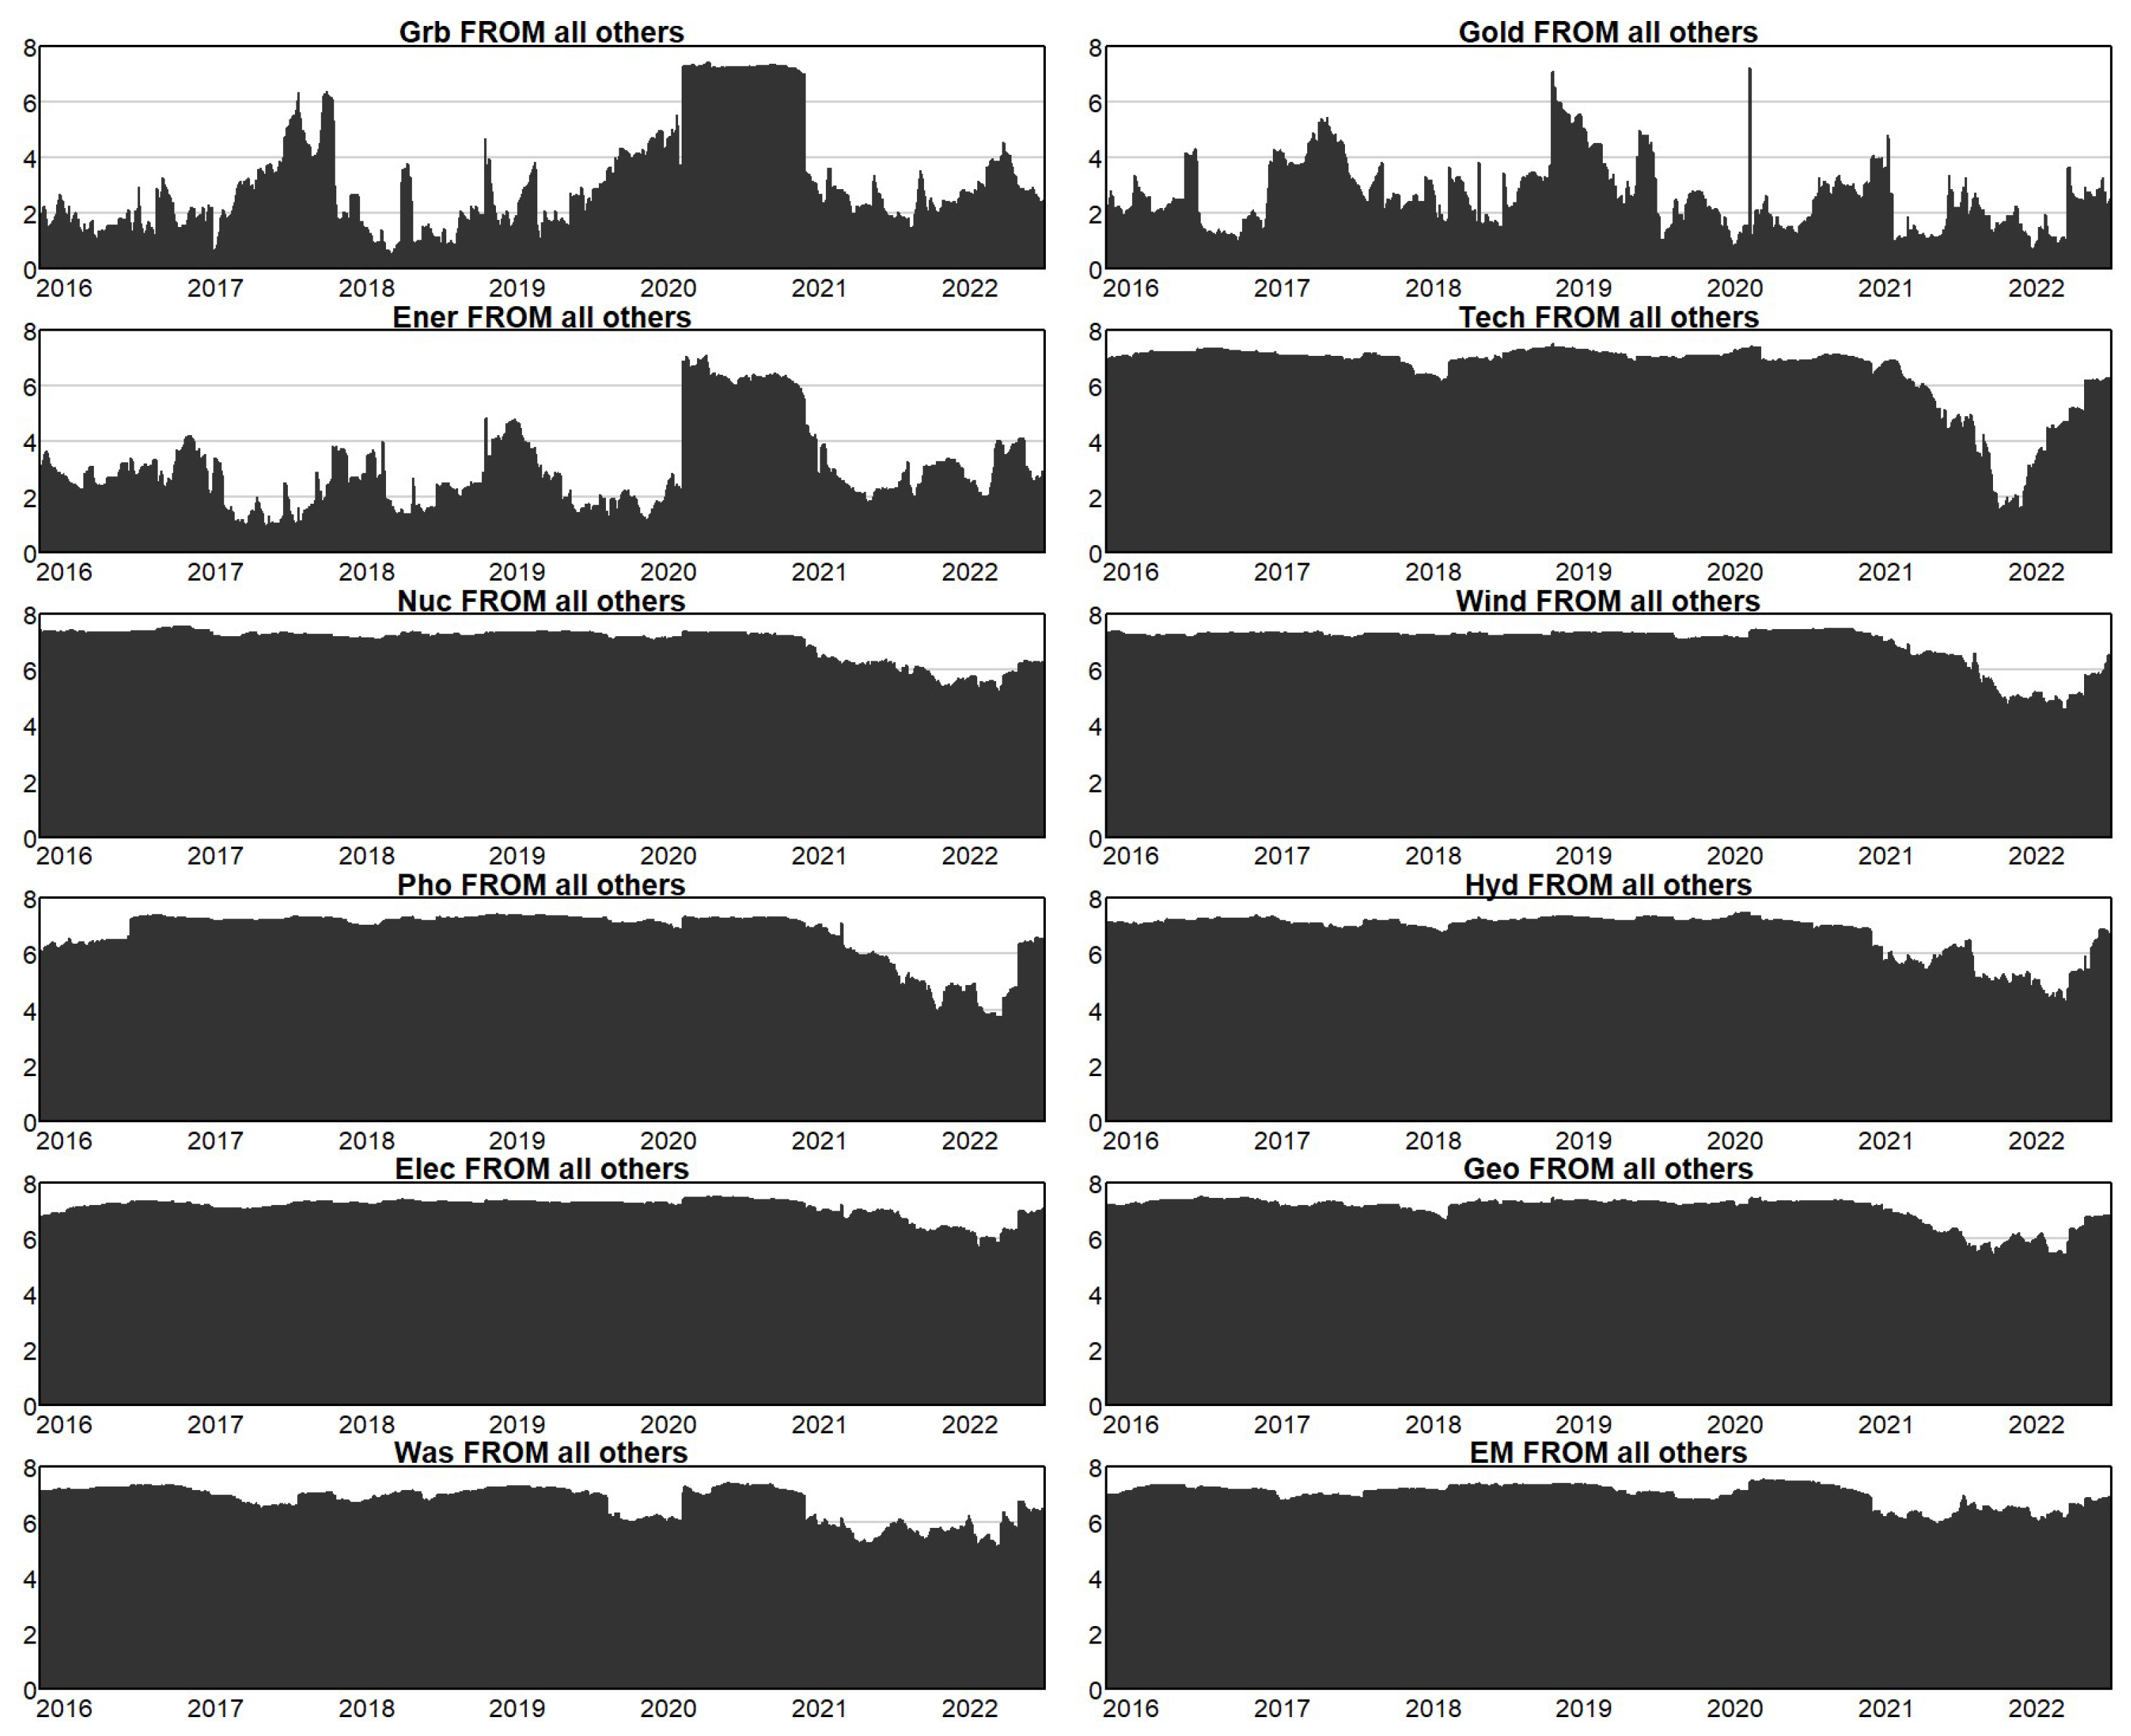
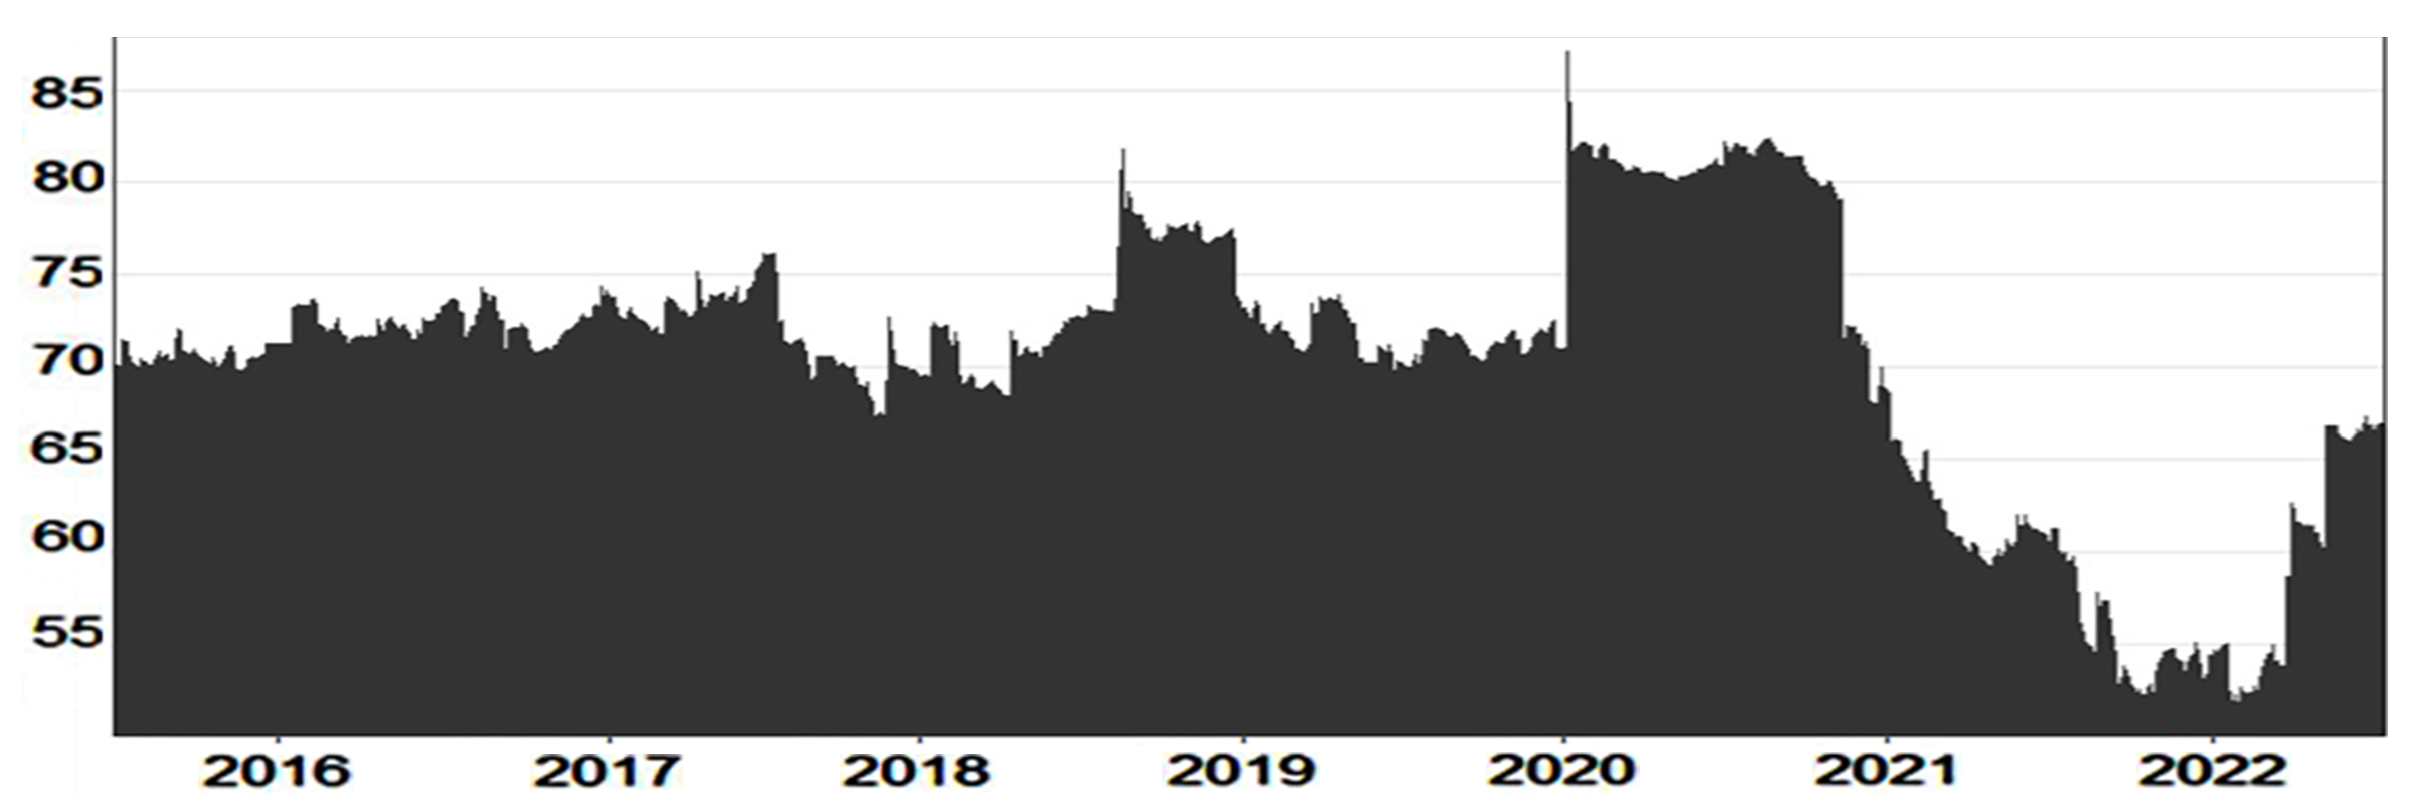
Dynamic spillover effects: This research found that the spillover effects between the markets fluctuated over time, indicating changing levels of risk transmission. The results suggested that combining clean energy assets with other financial assets in a portfolio may not be practical during periods of heightened risk and market volatility. This is because the negative spillover effects of financial assets tend to increase under such conditions (from −2.09, −0.04, −8, −6.8 to −9.36, −12.14, −6.37, −18.02, respectively). In particular, the analysis highlighted the roles of green bonds in spreading the risk from clean energy assets (0.02, 0.02, 0.03, 0.01, 0.02, 0.01, 0.01, 0.02) when the market environment is positive and gold in spreading the risk from clean energy assets (0.11, 0.08, 0.17, 0.06, 0.12, 0.08, 0.04, 0.08) when the market environment is negative.
- (d)
Special events shock: Since the COVID-19 pandemic, financial markets have become more exposed to shocks, leading to a notable increase in risk spillovers compared to clean energy markets. Specifically, the net spillover from nuclear energy has increased since 2020, becoming the largest transmitter of risk in the system. The directions of risk spillovers from gold and photovoltaics shifted from negative to positive, indicating a change in their relationship with other markets. Similarly, wind energy transitioned from being a transmitter of risk to a recipient. These findings highlight the importance of considering the changing dynamics and direction of risk spillovers in different markets, especially during periods of significant events.
- (e)
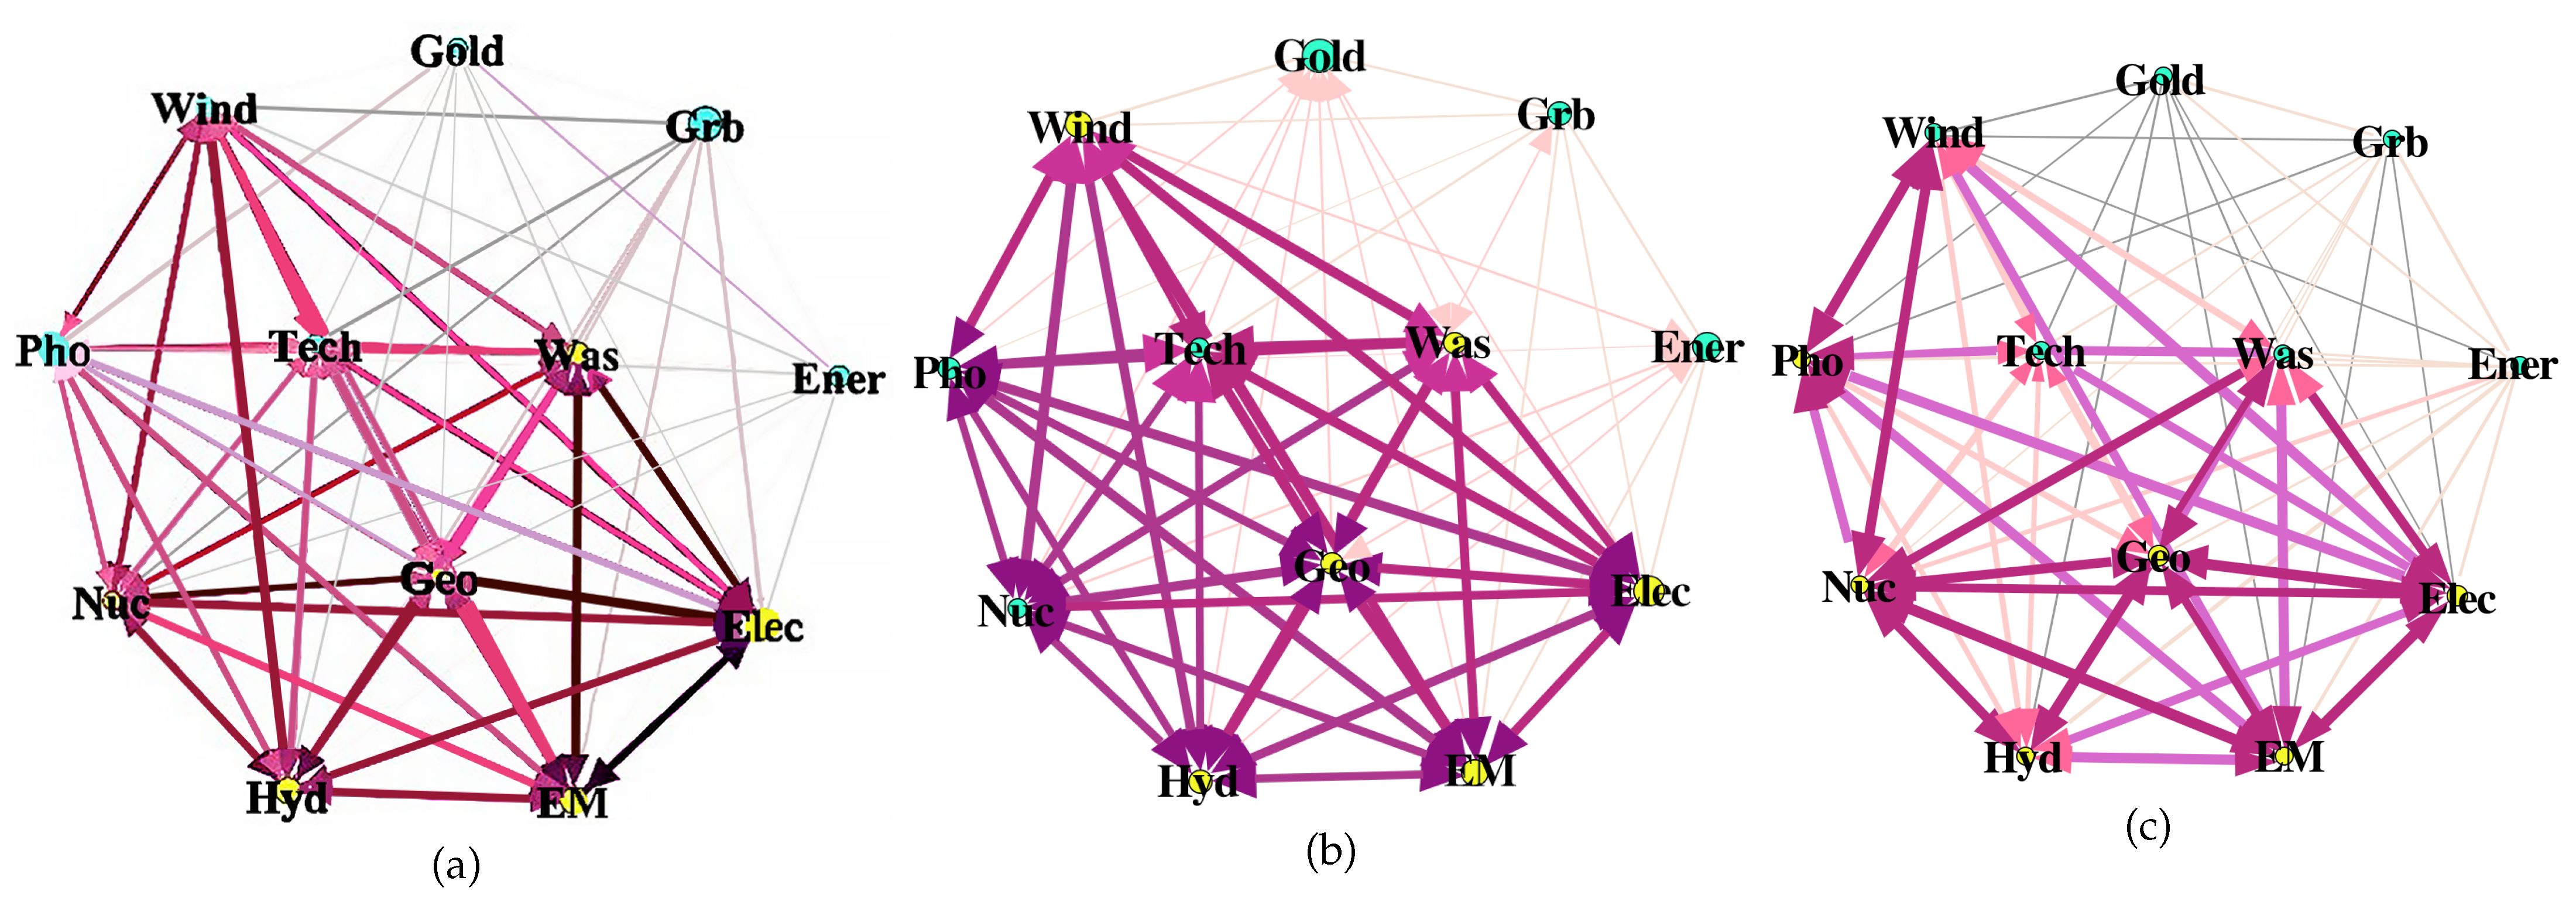
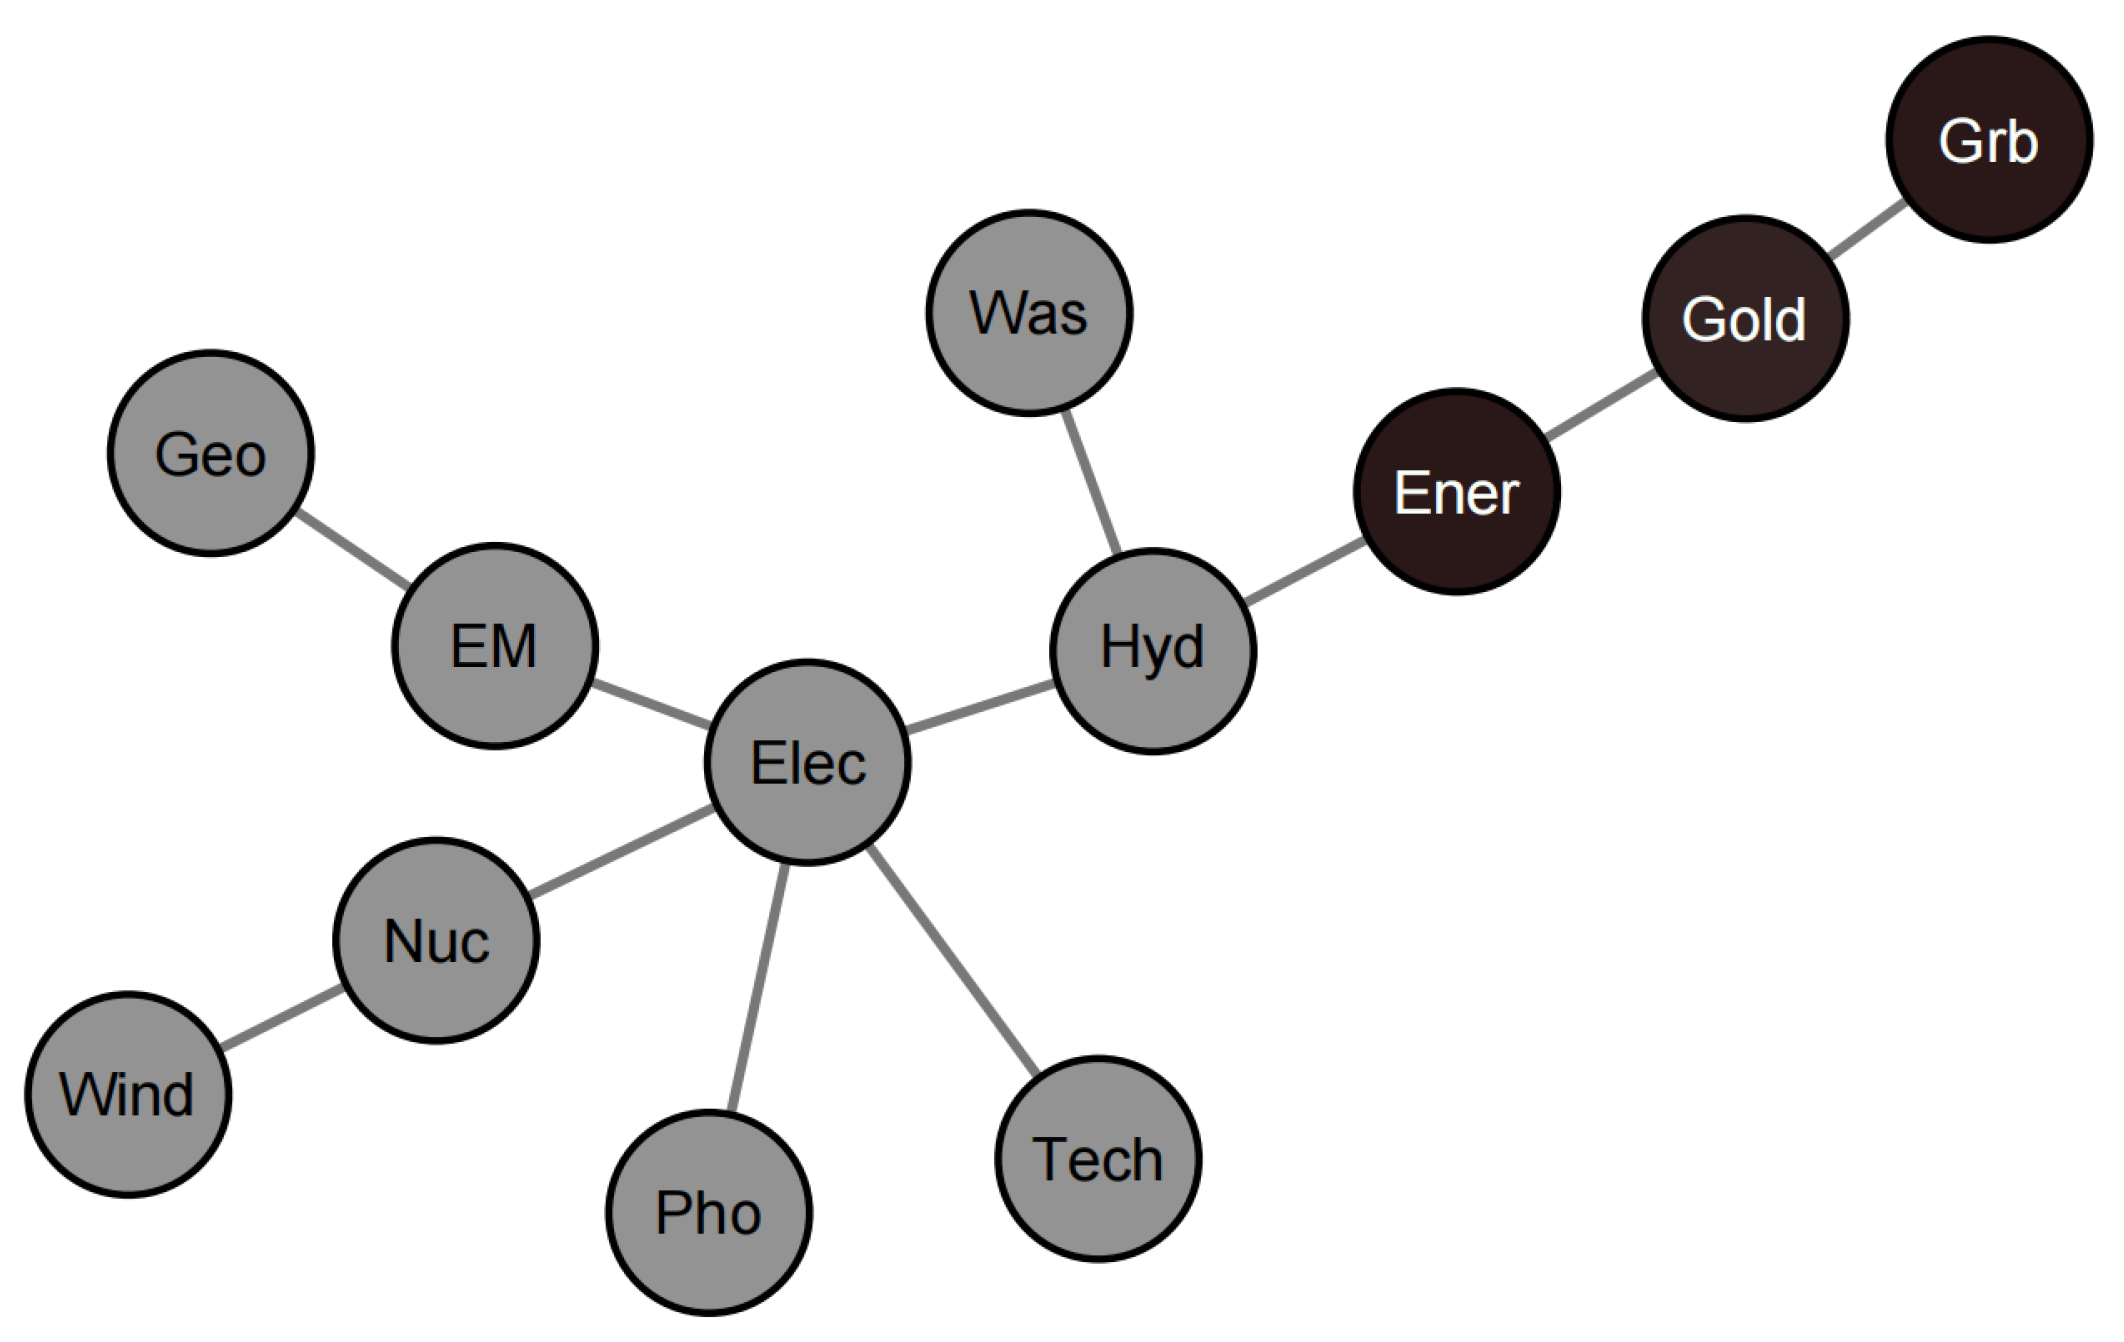
Spillover network analysis: This analysis indicated that financial assets generally exhibit low correlations with clean energy assets. It was observed that the correlations were more evenly distributed before the COVID-19 pandemic. However, after the pandemic, there were significant variations in the band color and width across markets, indicating that the correlation structure of the system became more uneven and heterogeneous. The MST analysis suggested that gold, green bonds, and traditional energy shared a relatively lower level of correlation with clean energy assets. This finding supports the notion that these financial assets can act as diversification tools in an investment portfolio, providing a hedge against the risks associated with clean energy assets.
6.3. Recommendations
For investors, it is advised not to include an excessive number of clean energy assets in portfolios simultaneously due to the strong co-movements within the clean energy markets in both normal and extreme circumstances. It is crucial to carefully consider the spillover effects of clean energy markets when constructing portfolios. Green bonds can be a suitable choice for diversification purposes within the clean energy sector. During periods of heightened risk, gold can serve as a prudent strategy due to its risk-averse nature and potential to act as a hedge.
For policymakers, photovoltaics and green bonds represent a viable instrument for achieving environmental sustainability objectives due to their strong ability of absorbing risk from other markets. Therefore, policymakers should prioritize the development and promotion of green financial markets, taking into account the uncertainties associated with extreme market conditions. Appropriate environmental policies should be proposed to strengthen the smart grids market due to its strong influence on other markets and its susceptibility to external shocks. Additionally, policymakers should be flexible to make corresponding adjustments due to the changing dynamics of risk spillovers in the markets, especially in the face of special events.
6.4. Limitations and Future Research
Firstly, this study focused on markets in China. It will provide extensive inspiration with evidence from other states’ markets. Secondly, this study investigated the impact of the COVID-19 pandemic and the Russian–Ukrainian conflict on the risk spillovers. In future research, as time passes, it will derive robust and practical insights by including more special events. Thirdly, for comparison purposes, it will be valuable to conduct similar analysis using other techniques, such as planar maximum filter graph method and planar maximally filtered graph method.
