Article

Experimental Studies on Preheating Combustion Characteristics of Low-Rank Coal with Different Particle Sizes and Kinetic Simulation of Nitrogen Oxide

1
Institute of Engineering Thermophysics, Chinese Academy of Sciences, Beijing 100190, China
2
University of Chinese Academy of Sciences, Beijing 100049, China
*
Author to whom correspondence should be addressed.
Energies 2023, 16(20), 7078; https://doi.org/10.3390/en16207078
Submission received: 27 August 2023 / Revised: 7 October 2023 / Accepted: 9 October 2023 / Published: 13 October 2023
(This article belongs to the Special Issue Optimization of Efficient Clean Combustion Technology)

Abstract

:
Low-rank coal, accounting for 45% of the global coal reserves, is easier to use in terms of realizing ignition and stable combustion due to its relatively high levels of volatile content. But the problem of low-rank coal combustion is that its NO formation is in the range of 300–600 mg/m3, which makes the emission’s meeting of the environmental regulation quite difficult or uneconomic. Preheating combustion was a prospective combustion technology which involved preheating in a circulating fluidized bed (CFB) first and then combustion in a combustor for preheated fuel. With three particle sizes (0–0.355 mm, 0–0.5 mm, and 0–1 mm), some experiments were carried out in a 30 kW test rig. The results showed that, in the CFB preheating, a particle size of 0–1 mm had the highest coal-gas heating value due to a long residence time. The release of species in the CFB preheating always followed the order H > N > C > S. For preheated fuel combustion, a particle size of 0–0.355 mm showed the fastest combustion velocity, with the highest temperature point near the nozzle. For all three particle sizes, the combustion of preheated fuel showed a uniform temperature distribution with a small temperature difference. The lowest NO emission was 105 mg/m3 for the particle size of 0–0.5 mm. A GRI-Mech 2.11 mechanism was used to simulate the formation of NO with different influencing factors, such as temperature, oxygen concentration, and secondary-air ratio. There was a good agreement between the experimental data and the simulation’s results. The simulation showed that the NO formation could be further decreased with an optimal secondary-air ratio. This investigation provides support for the basic understanding of preheating-combustion technology and potential industrial applications in the future.

1. Introduction

Low-rank coal is a universal and important fossil fuel currently being widely used in coal-firing plants, and accounting for 45% of the global coal reserves [1]. One of the characteristics of low-rank coal itself is that it has a relatively high volatile content of over 20%, and this is why low-rank coal is easier to use in terms of realizing stable combustion, even with a low load condition. However, the problem is that the NOx formation amount is still in the range of 300–600 mg/m3, even given the use of elements of advanced low-NOx combustion technology such as air-staging, flue gas recirculation, and a low-NOx burner [2,3,4], resulting in the increase of de-nitration costs to meet the pollutant emission standards. For instance, in China, the NOx emission limitation is 50 mg/m3 for coal-firing power plants, making it the strictest emission standard in the world. More urgently, with the increase of renewable forms of energy power such as wind power and photovoltaic power, those coal-firing plants often need to run at a relatively low load to increase the use of renewable energy power, which makes it more difficult to meet the ultra-low NOx emission standard. Therefore, the question of how to reduce NOx formation by controlling the combustion process has been an important direction for investigation, especially in China [5,6,7].
For low-rank coal combustion, the volatile element is quickly released with the conversion of volatile-N into HCN and NH3 [8,9,10]. The following oxidation of HCN, NH3, and char-N is the main reason for the formation of NOx. As for conventional combustion technology, air-staging has been widely used, with a reduction zone first and an oxidation zone following [11,12]. In the reduction zone, partial HCN and NH3 could be converted into N2 to reduce the ultimate NOx emission. However, the extent of the conversion of fuel-N into N2 is obviously not enough. As for conventional combustion, pulverized coal was injected into a furnace directly, with volatile release, ignition, and combustion in the same single facility, which could limit the conversion of fuel-N into N2.
Against this background, a new idea was proposed by the Institute of Engineering Thermophysics, Chinese Academy of Sciences in 2010 [13], with pulverized coal firstly being preheated in a circulating fluidized bed (CFB), followed by combustion in a combustor, i.e., preheating combustion. The largest difference between this novel method and conventional combustion is that the preheating combustion was fully separated by two different facilities, with a reduction atmosphere and an oxidation atmosphere, respectively. As is well known, CFB has some significant advantages, with excellent gas–solid mixing, uniform temperature distribution, and extensive fuel adaptability [14,15]. Under the conditions of CFB within the reducing atmosphere, the fuel-N could have a higher conversion ratio into N2, forming the basis for reducing NOx formation by the combustion process control itself. Investigations by Su et al. [16] and Ding et al. [17] showed that the conversion ratio of fuel-N into N2 was higher than 50% in the CFB. However, particle size is an important parameter affecting combustion and the release and transformation of fuel-N. Also, the reaction path of NO for preheated fuel combustion has been almost completely previously unmentioned.
Investigations by Saha [18] found that large particle-size coal (250–355 μm) had lower CO emissions and higher NO emissions compared to those of small particle-size coal (53–125 μm). This study attributed the 15% increase in NO emissions for the large particle size to a relatively low NO-reburning ability. In fact, it is extremely difficult to make a clear judgement on the question due to the mutual effects of CO and NO. Sung et al. [19] performed some experimental studies on coal combustion with mean particle sizes of 52, 73, 102, and 107 μm, and the results showed that the flame temperature with a mean particle size of 52 μm was higher than that for a particle size of 107 μm. The NO emission decreased by 20% with an increase in mean particle size from 46 μm to 118 μm, with a different tendency compared to that established in investigations by Saha et al. As to preheating combustion, the effect of particle size on combustion and emissions needs to be further studied and elucidated.
Hu et al. [20] evaluated the error-function value for fuel combustion under both N2 and CO2 atmospheres and concluded that the mechanism of PG2018 was relatively accurate for predicting fuel–NO formation compared to other mechanisms, including KONNOV 0.6, GRI-Mech 2.11, GRI-Mech 3.0, USC-2.11NOx, Polimi, and PG2009. Cellek [21] adopted the GRI-Mech 2.11 mechanism to calculate combustion products for CH4/H2, and the results indicated that the error within the experiments and calculations was in an acceptable range. Some investigations showed that, in a reduction zone with a lower temperature, the GRI-Mech 2.11 mechanism was more accurate than other mechanisms [22].
In this work, we conducted an experimental study of low-rank coal with different particle sizes, analyzed the basic characteristics of preheating combustion, and carried out the kinetic simulation of NO formation with respect to different factors, providing some support for the development and application of preheating-combustion technology in the future.

2. Experiment

2.1. Experimental Apparatus

Experiments were carried out in a 30 kW preheated-combustion test rig, as shown in the diagram in Figure 1, which consisted of a circulating fluidized bed (CFB) preheater, a down-fired combustor (DFC), and an auxiliary system.
The CFB was composed of a riser, a cyclone, and a loop seal, with pulverized coal fed via a screw feeder. Primary air was supplied from the bottom of the riser to fluidize the bed material, keeping the chemical reaction constant to retain a bed temperature in the range of 800–950 °C without any other auxiliary heating. Due to the primary air amount being far lower than that of the stoichiometric air needed for theoretical combustion, a strong reducing atmosphere was present in the CFB, along with some combustion and gasification reactions. In the process of preheating, pulverized coal was converted into coal gas and preheated char, i.e., preheated fuel. Through a connection tube between the CFB and the DFC, the preheated fuel was blown into the DFC with the secondary air at the top and the tertiary air 1200 mm below. The flue gas was finally discharged into the air after cleaning and disposal.
The riser for the CFB was 70 mm in diameter and 1500 mm in height. The DFC was 260 mm in diameter and 3000 mm in height. Both the CFB and the DFC were made with heat-resistant alloy steel. An electric heating device was set at the outside of the test rig for the purpose of starting up this device easily.
Air staging was used for the preheated fuel combustion to reduce NOx emission. There were two zones in the DFC: one was the reduction zone in the range between secondary air and tertiary air, and the other was the oxidation zone located in the range from the tertiary air to the exit.

2.2. Fuel Characteristics

Ayouqi lignite from China, a typical low-rank coal, was used in this experiment; its proximate and ultimate analyses are shown in Table 1 below. Among them, the volatile content was 37.93%, obviously higher than that of ordinary types of coal.
Three particle sizes (0–0.355 mm, 0–0.5 mm, and 0–1 mm) were used to investigate the influence of particle size on preheating combustion characteristics, as shown in Figure 2.

2.3. Experimental Conditions

The experimental conditions are listed in Table 2, with three cases designed with different particle sizes.
In Table 2, λ C F B is the air ratio of the CFB, λ R e is the air ratio of the reducing zone of the DFC, and λ is the excess air coefficient in this system. These definitions could be described as:
λ C F B = V P r / V S t o i c
λ R e = ( V P r + V S e ) / V S t o i c
λ = ( V P r + V S e + V T e ) / V S t o i c
where V S t o i c is the air flow rate with stoichiometric complete combustion; V P r , V S e , and V T e are the air flow rates of primary air, secondary air and tertiary air, respectively.

2.4. Sample Analysis Methods

One sampling point was at the outlet of the CFB for the addition of preheated fuel, including coal gas and preheated char. The coal gas, including CO, CO2, H2, and CH4, was analyzed online by a portable analyzer (Gasboard-3100P, Hubei Ruiyi Automatic Control System Co., Ltd., Wuhan, China) with an accuracy of 1%. HCN and NH3 in the coal gas were analyzed offline by a mass spectrum analyzer using a sampling bag.
In the CFB preheating, with a hypothesis that the ash content would remain unchanged, the conversion ratio from raw coal to preheated fuel for each component could be calculated as follows [23]:
C X = 1     A 1 X 2 A 2 X 1
where A 1 is the ash content in semi-coke, A 2 is the ash content in preheated char, X 1 is component X content in semi-coke, and X 2 is component X content in preheated char.
In the DFC, five sampling ports were arranged for extracting flue gas into an online analyzer (GASMET FTIR DX-4000, Gasmet Technologies Oy, Vantaa, Finland) to detect the concentrations of CO2, NO, NO2, N2O, NH3, and HCN. The concentration of oxygen could be detected by an online CrO analyzer installed at the exit of the test rig.

3. Experimental Results and Analyses

3.1. CFB Preheating

Due to the primary air amount being far lower than that of the stoichiometric air needed for theoretical combustion, the preheating involved a process of partial combustion and gasification with the conversion of raw coal to coal gas and preheated char, i.e., preheated fuel.

3.1.1. The Conversion of Lignite to Coal Gas

Figure 3 shows the coal-gas composition and average temperature, with three particle sizes, for cases one to three.
As shown in Figure 3, the CO, H2, and CH4 content levels in the coal gas first decreased and then increased with the increase in the particle size, and the trend of change in CO2 was the opposite. When the particle size was 0–1 mm, compared with the other two particle sizes, the content levels of CO, H2 and CH4 were the highest, which was attributed to a relatively long residence time in the CFB due to the larger particle size. The content levels of CO, H2 and CH4 were the lowest with a particle size of 0–0.5 mm, corresponding to the highest preheating temperature in the CFB. The increased temperature was due to the intensification of some combustion reactions or the dampening of some gasification reactions.
The main chemical reactions in the CFB include [24]:
R 1 :   C   +   O 2 C O 2 Δ H = 395.1   k J / m o l
R 2 :   C   +   1 / 2 O 2 C O Δ H = 113.2   k J / m o l
R 3 :   C O   +   1 / 2 O 2 C O 2 Δ H = 281.1   k J / m o l
R 4 :   H 2   +   1 / 2 O 2 H 2 O Δ H = 249.0   k J / m o l
R 5 :   C H 4   +   2 O 2 C O 2 + 2 H 2 O Δ H = 802.6   k J / m o l
R 6 :   C   +   C O 2 2 C O Δ H = + 166.9   k J / m o l
R 7 :   C   +   H 2 O H 2 + C O Δ H = + 135.5   k J / m o l
R 8 :   C O   +   H 2 O C O 2 + H 2 Δ H = 31.5   k J / m o l
R 9 :   C O   +   3 H 2 C H 4 + H 2 O Δ H = 227.6   k J / m o l
For particle sizes of 0–0.5 mm, in the process of CFB preheating, reactions R6 and R7 tend to be somewhat weaker compared to those associated with particle sizes of 0–0.355 mm and 0–1 mm. The temperature variations were the results of comprehensive effects given particle size, specific area, and residence time.
In the three cases, the CO concentration was lower than that of the CO2, meaning CO/CO2 < 1. It was due to this fact that the reducing atmosphere in the CFB was not strong enough to make gasification reaction predominant at the condition of λ C F B = 0.51. Some previous investigations showed CO/CO2 > 1 at the condition of λ C F B < 0.3 [25].

3.1.2. The Conversion of Lignite to Preheated Char

Table 3 gives the proximate and ultimate analyses of preheated char for three particle-size conditions. Using an ash-balance method, the conversion ratio of different species in the lignite could be calculated.
It can be seen from Table 3 that with increased particle size, the release rate of volatile materials decreased, and the release rate of fixed carbon and hydrogen at first slightly increased, and then decreased. The larger the particle size, the longer it took to complete the reaction. The release of all species followed the order H > N > C > S, with the fastest rate being the H release rate and the slowest the S release rate. Ding et al. [17] also performed an experimental study in a 30 kW facility with bituminous coal as fuel, and the results indicated that the trend of species release, including C, H, and N, was in agreement with the present findings.
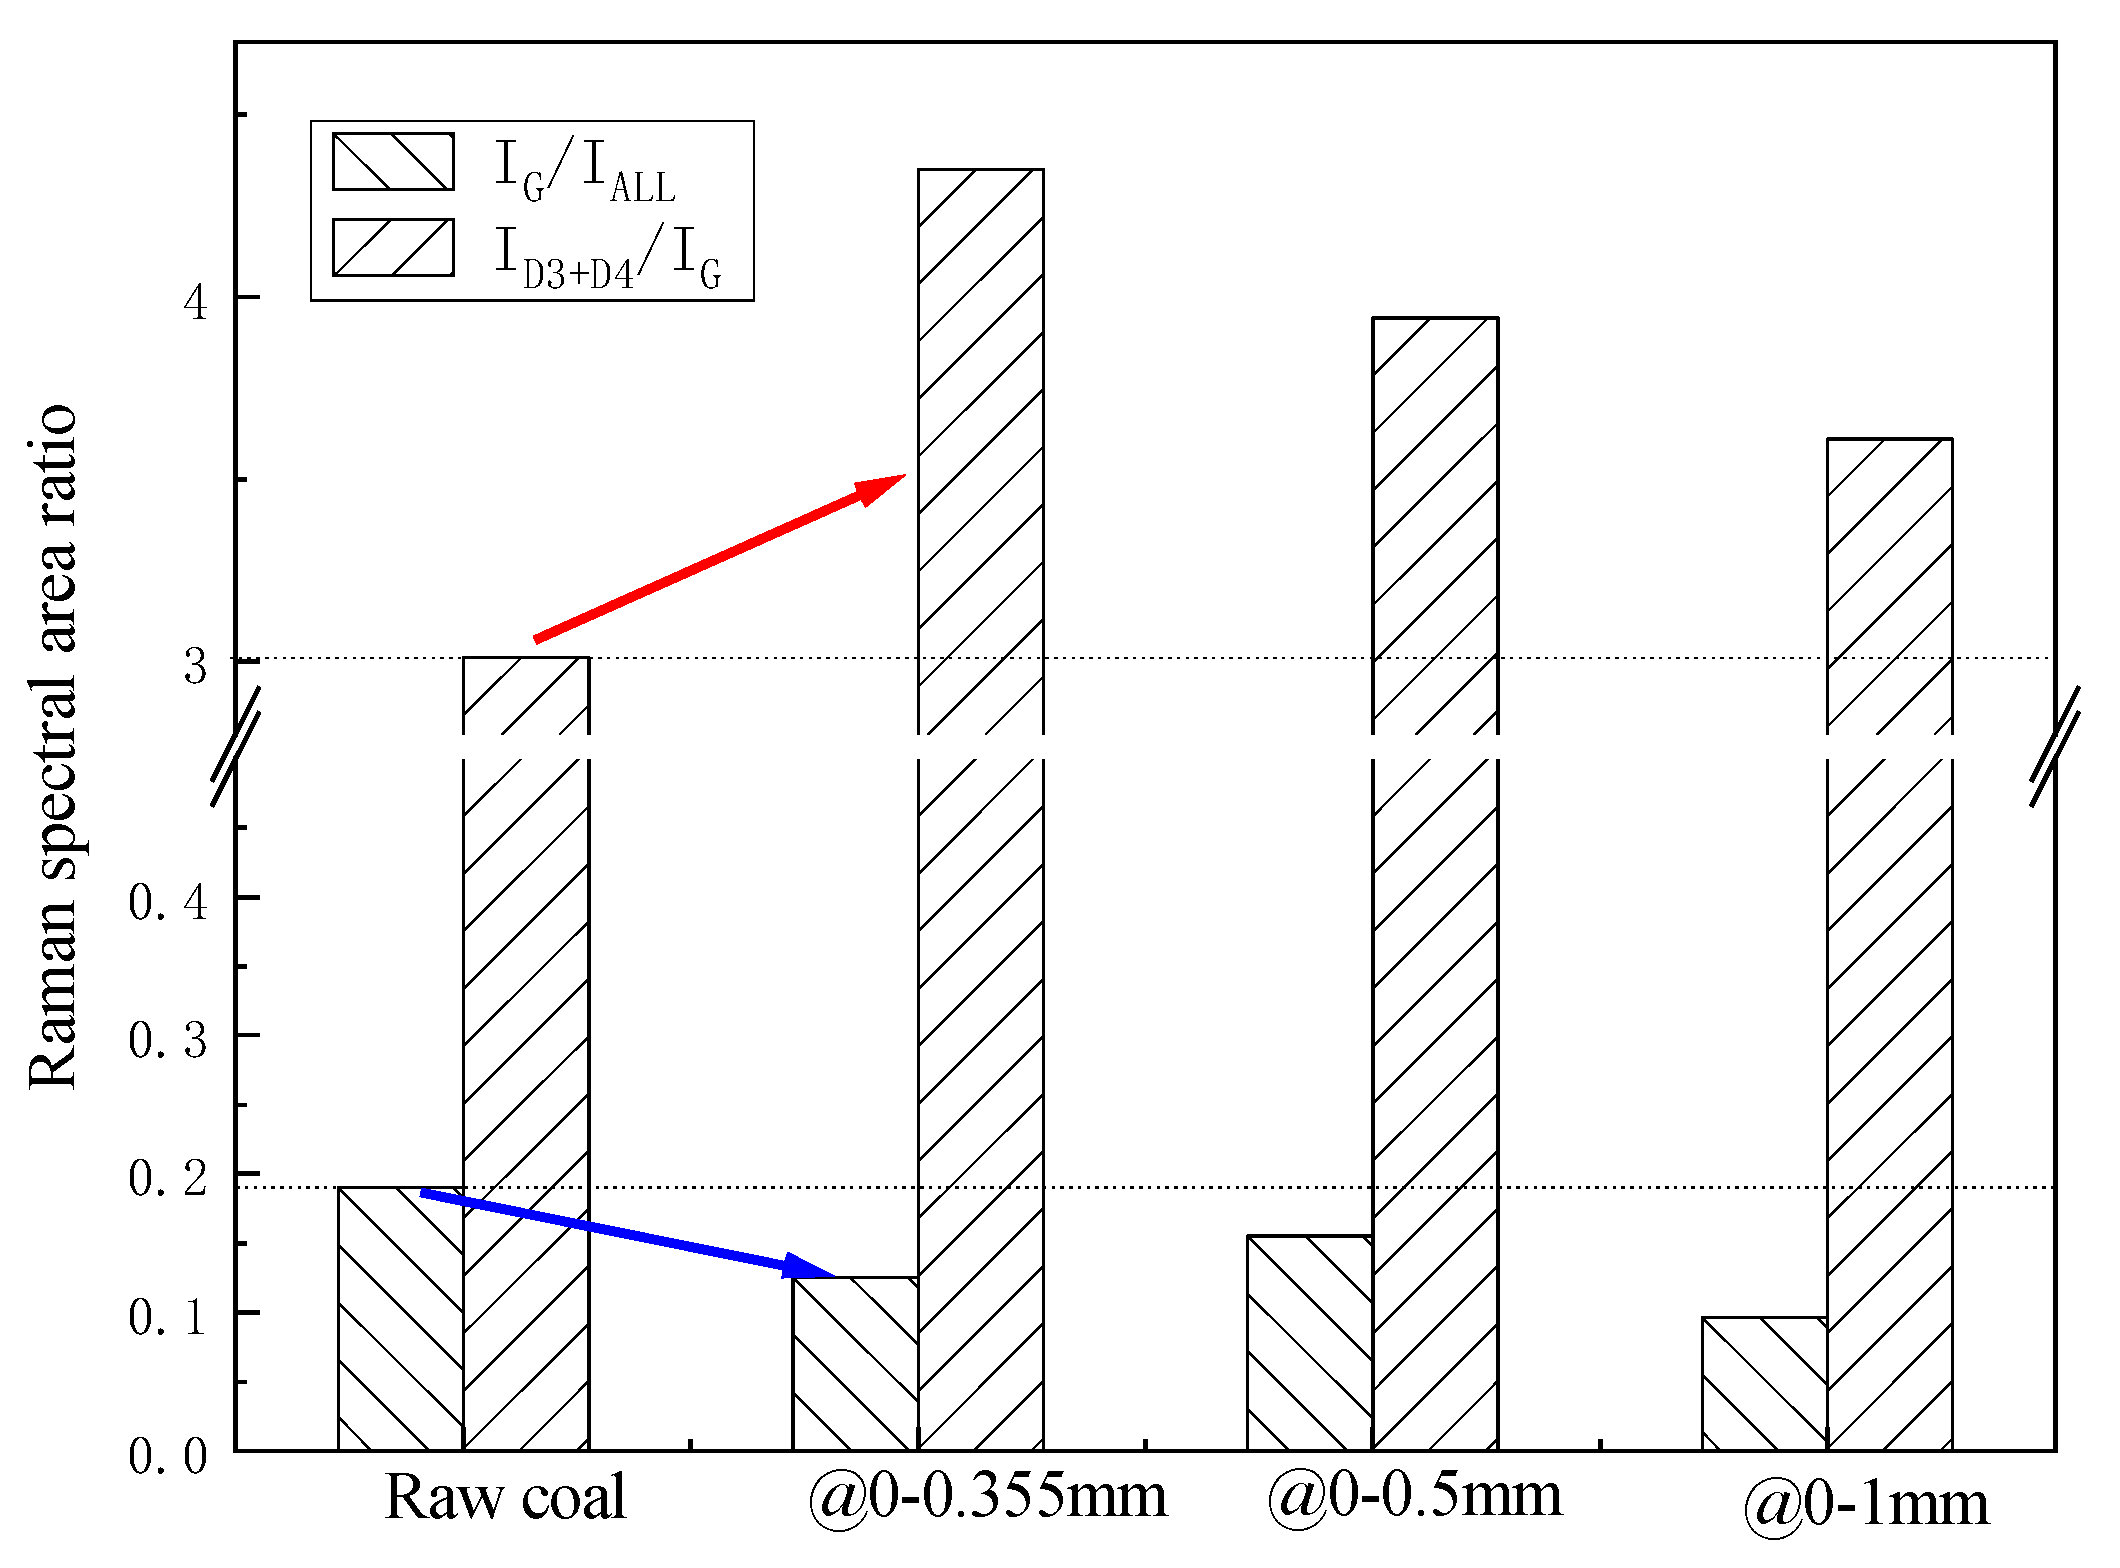
The Raman spectrum analyzer, with a laser scanning range of 800–2000 μm and a wavelength of 532 nm, was used to test raw coal and preheated char [26]. After peak fitting and processing the test results using professional peak-splitting software (Peakfit 4.0 and Origin 8.0), the ratios of fitted peak areas are shown in Figure 4.
As can be seen from Figure 4, compared with the raw coal, the IG/IALL of the three preheated chars decreased, and the ratio of ID3+D4/IG increased. According to the interpretation of the area ratio of the Raman spectrum [27], the results showed that the carbon-structure order of preheated char was lower than that of raw coal, and the reaction activity was greater than that of raw lignite. The preheated char with particle sizes of 0–0.355 mm contained the most active sites, followed by those with sizes of 0–0.5 mm and 0–1 mm, meaning that the smaller particle size was beneficial for the promotion of fuel modification.

3.2. Combustion Characteristics of Preheated Fuel

Preheated fuel containing coal gas and preheated char flowed into the DFC to realize complete combustion. In cases one to three, the secondary air was injected into the DFC by a devised nozzle, and tertiary air was injected into the DFC at a point 1200 mm below.
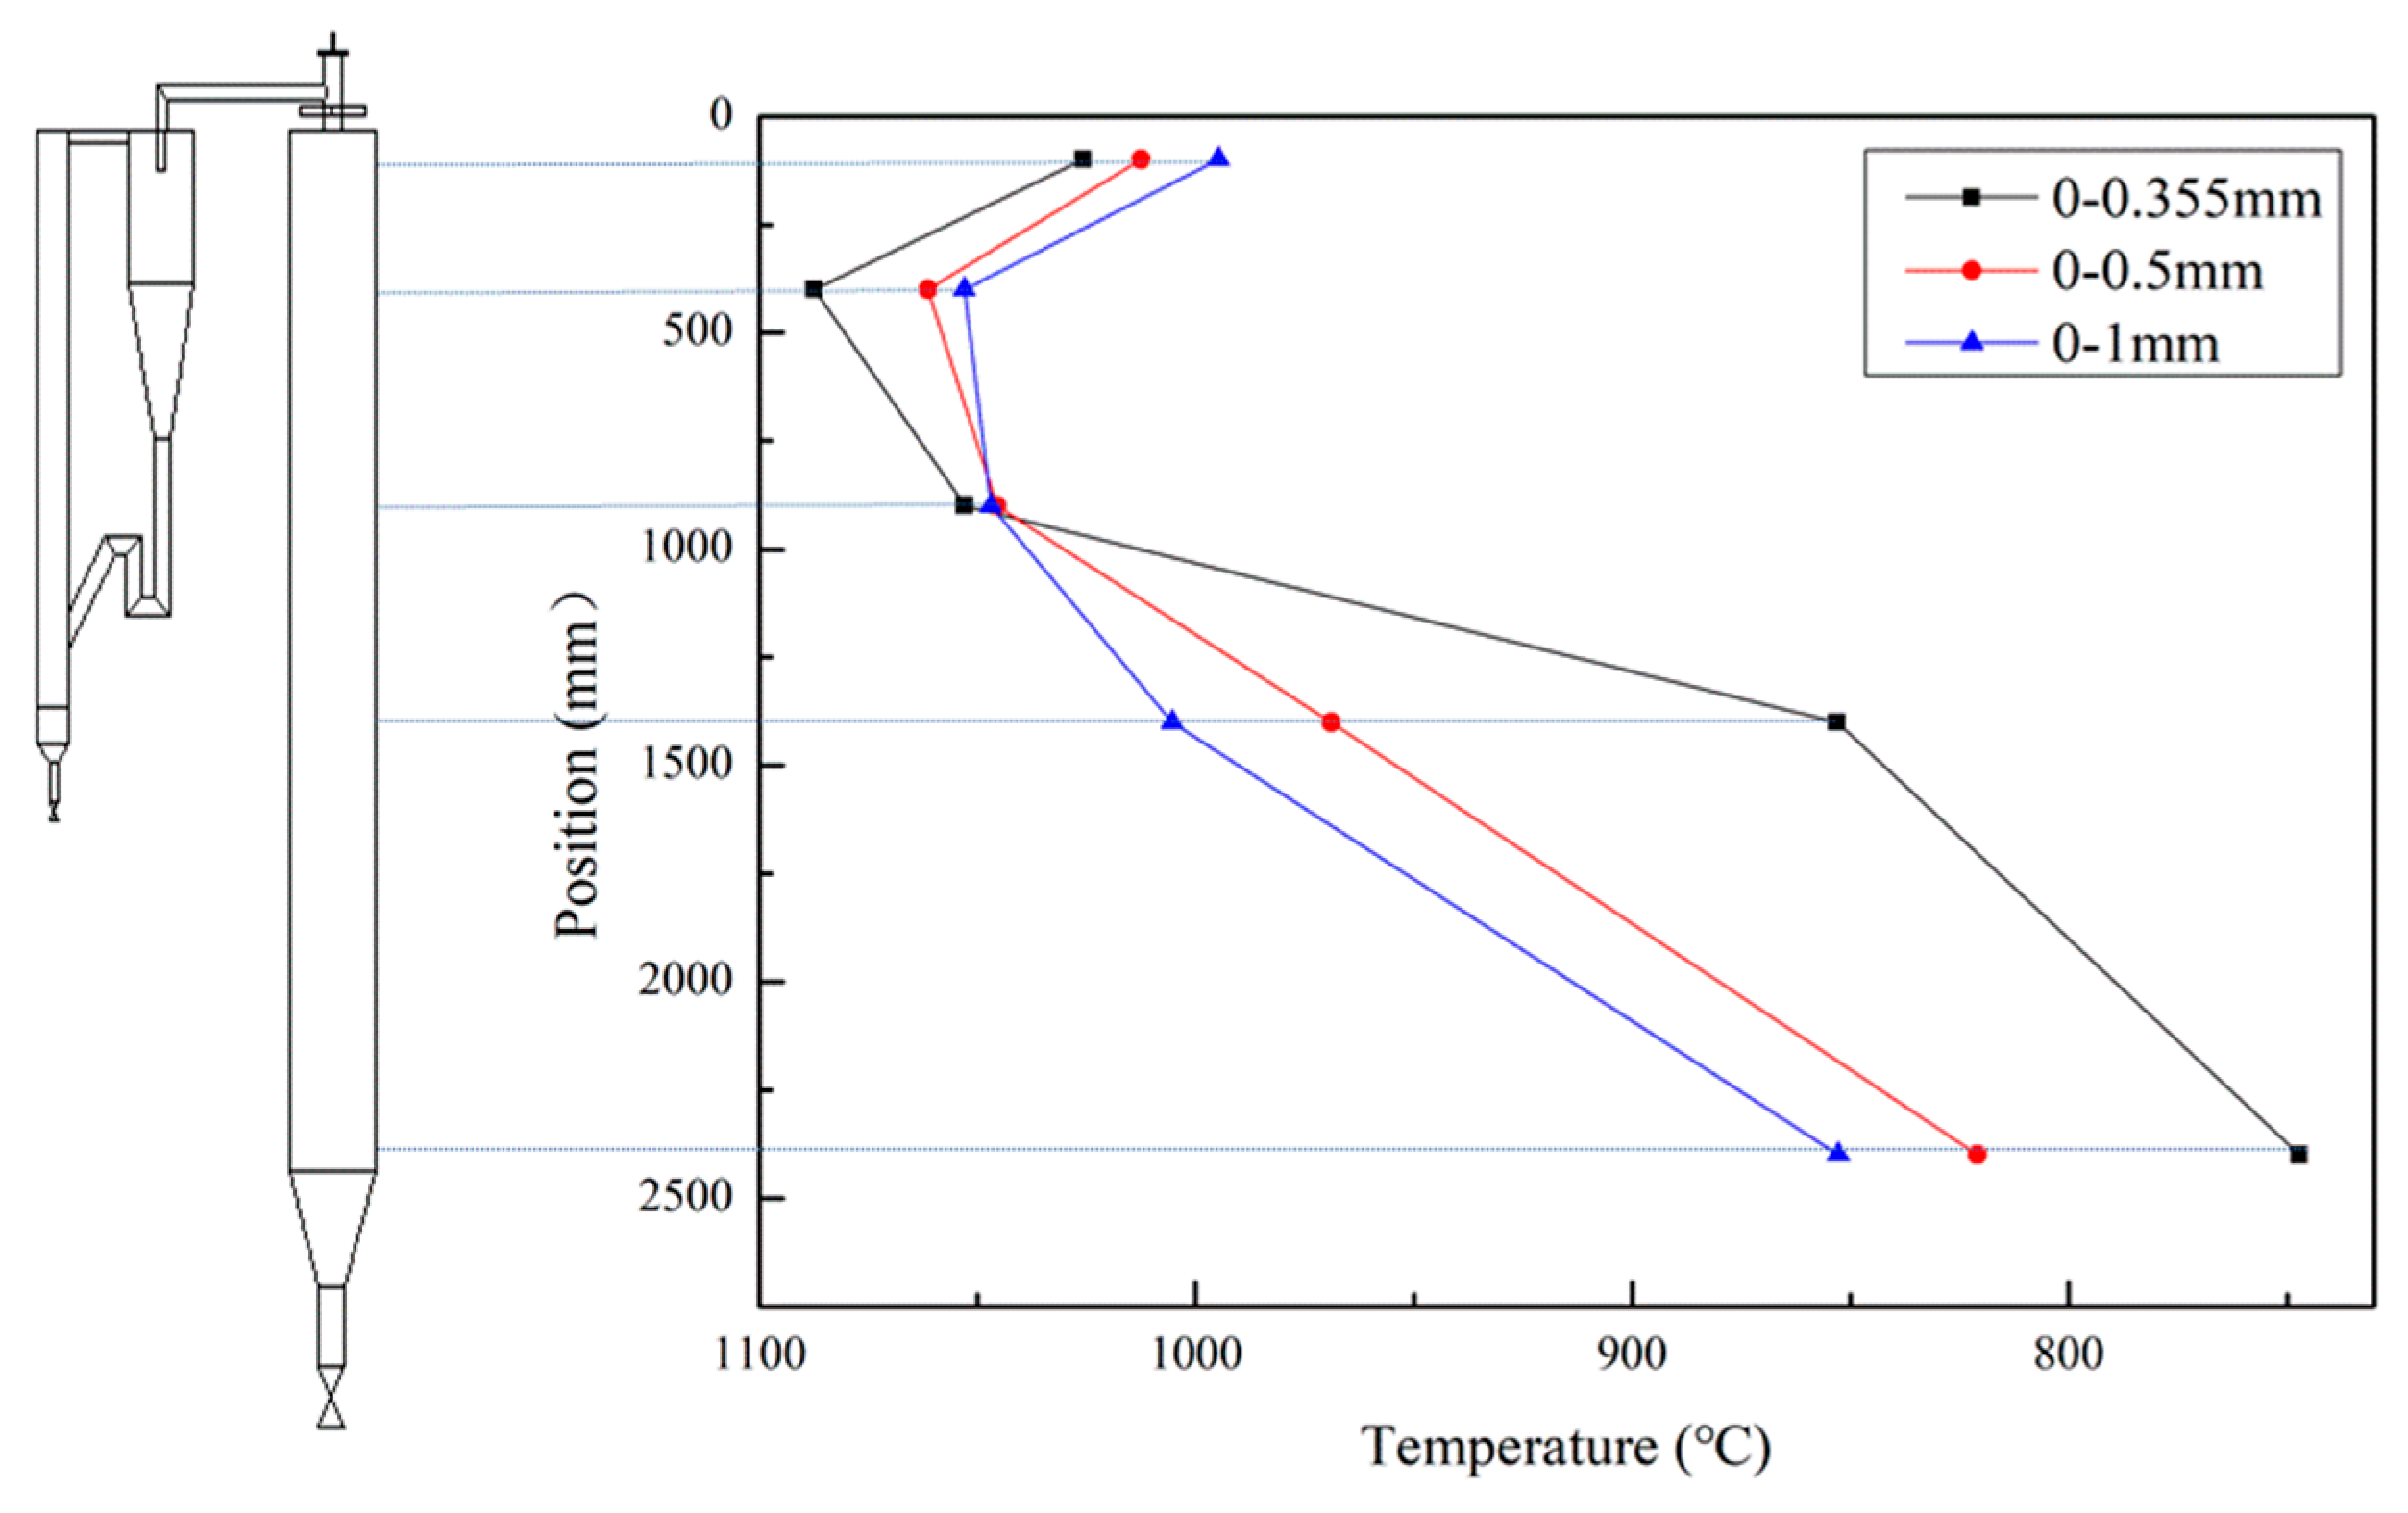
The temperature distributions for preheated fuel combustion with different particle sizes are shown in Figure 5.
For all three samples of preheated fuel, the highest temperature point occurred at 400 mm below the top of the combustor, showing a fast combustion reaction when preheated fuel was mixed with secondary air. The highest combustion temperature for a particle size of 0–0.355 mm was about 100 ℃ higher than that for a particle size of 0–1 mm, which was due to the large particle surface area, the excellent mixing of fuel with oxygen, and the better modification of preheated fuel. After 400 mm, the temperatures for samples with a particle size of 0–0.355 mm showed a quick decrease compared to those for other particle sizes, which is consistent with an earlier combustion and heat release at the upper part of the DFC. Under the three particle-size conditions, the inlet temperatures of preheated fuel were all above 800 °C, and the temperature differences were lower than 300 °C, showing a mild combustion state, which is well-known as a feature of advanced low-NOx-combustion technology.
The carbon contents in the fly ash in cases one to three were below 6%, and the combustion efficiencies higher than 98%.

3.3. The Conversion Process of Fuel-N and NO Emission

3.3.1. The Conversion of Fuel-N in the Preheating

In the CFB preheating, a strong reducing atmosphere existed in the whole circuit, including riser, cyclone, and loop seal. Because the preheating temperature was higher than 800 °C, partial-fuel-N released was converted into HCN, NH3, or N2. The conversion ratio of fuel-N into N2 was related to coal type, preheating temperature, and primary air ratio.
A schematic diagram of the conversion of fuel-N into N2 in the CFB preheating is drawn in Figure 6. Path one is relevant to homogenous reduction with CH4/H2/CO and N-containing species like HCN, NH3, and NO, etc., and paths two and three are relevant to heterogeneous reaction with char and N-containing species on the outer surface of a particle and in the inner pore of a particle, respectively.
The conversion ratios of fuel-nitrogen into coal-gas-N and char-N are given in Figure 7. In the coal gas, the N-containing gases only included nitrogen and NH3. However, HCN was not detected in cases one to three, which was a typical difference in some thermogravimetric experimental results for some coal types and incorporated in some basic hypotheses used in Fluent simulation [28]. The reason for the lack of HCN in the coal gas was related to the nitrogen morphology in the lignite and the condition of the fluidized preheating.
As can be seen from Figure 7, during the preheating process of lignite with particle sizes of 0–0.355 mm and 0–0.5 mm, the ratio of fuel-N into N2 was higher than the corresponding value of 0–1 mm. However, the ratio of fuel-N to NH3 for samples with a particle size of 0–1 mm was the highest. The reason for the highest conversion ratio of fuel-N to N2 being reached with a particle size of 0–0.5 mm was the latter’s correspondence to the highest preheating temperature in the CFB.

3.3.2. NO Formation in the DFC

Figure 8 shows the gas distribution curve along the axis of the DFC in three cases. Before the injection of tertiary air, the CO concentration in the reduction zone was a little higher, corresponding to the lowest NO concentration. After the injection of tertiary air, the CO concentration quickly dropped, but this coincided with a fast increase in NO. In the process of preheated fuel combustion, some precursors, like HCN, were formed and transformed. As can be seen from Figure 8, particle size had little influence on the distribution characteristics of CO, NO, N2O, HCN, and NH3.
The ultimate NO and CO emissions with the three particle sizes are shown in Figure 9. The NO emission was in the range of 105~120 mg/m3, which was 50% lower than that of conventional combustion. And the conversion ratio of fuel-N into NO was 2.04%, 1.91%, and 3.6% for cases one to three, respectively.

3.4. The Kinetic Simulation of NO

To explore some reaction mechanisms, the detailed chemical kinetic modeling approach was performed using Chemkin Pro 4.5 software. The Perfectly Stirred Reactor (PSR) and GRI-Mech 2.11 mechanisms were chosen to simulate the combustion process of preheated fuel in the down-fired combustor [29]. The composition of the preheated fuel containing coal gas and preheated char had been sampled and analyzed in the above experiment. In this simulation, the preheated fuel was from samples with a particle size of 0–0.5 mm; the compositions are given in Figure 3 and Table 3. Also, λ R e was 0.87 and λ was 1.2 in this system, with the conditions listed in Table 2.

3.4.1. The Influence of Temperature on NO in the Reduction Zone

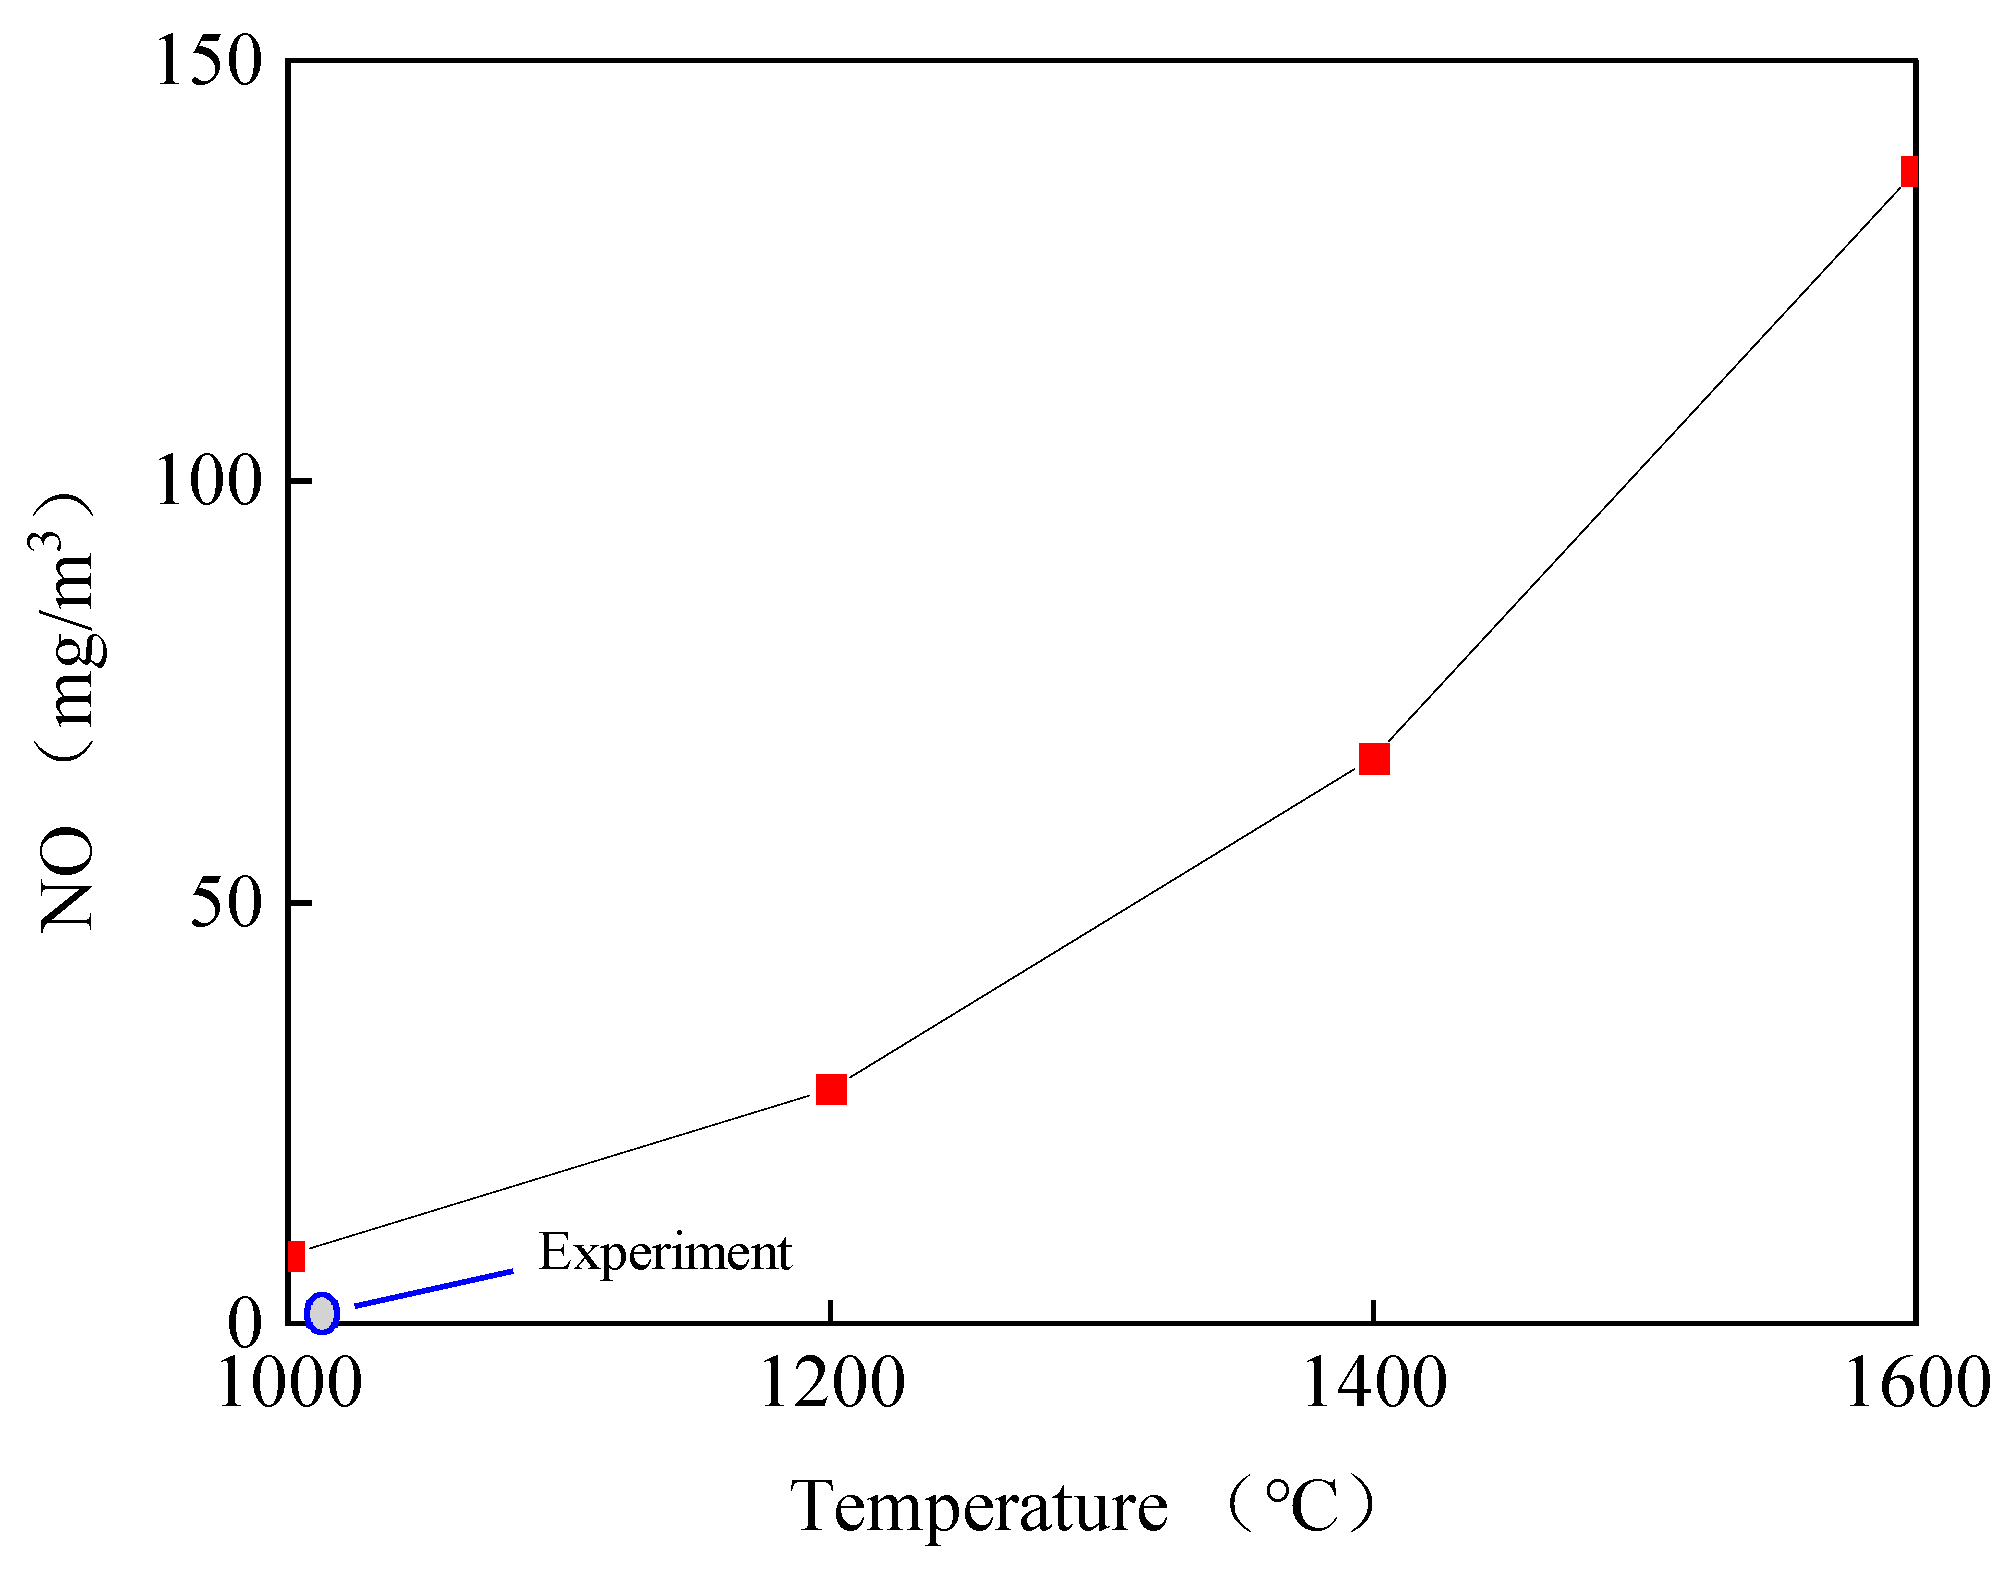
In order to investigate the influence of the temperature of the reduction zone on NO, four different temperatures (1000 °C, 1200 °C, 1400 °C, and 1600 °C) were chosen to calculate NO formation; the results are shown in Figure 10.
It was clearly seen that, even in the reduction zone, the increase in temperature promoted the formation of NO, which was not optimal for the reduction of NOx emission in the subsequent combustion. As is well known, low-temperature combustion, like moderate and intense low-oxygen-dilution combustion, is an advanced technology used to reduce NOx emissions. In this experiment, the NO concentration was approximately zero in the reduction zone, as shown in Figure 8, and the simulation result was only 8 mg/m3, in good agreement with those of the experiments.
The most sensitive reactions for NO formation in the reduction zone were N + OH <=> NO + H and N + NO <=> N2 + O, as shown in Figure 11, even with different temperature conditions in the reduction zone. It could also be concluded that, except for the reaction of C + O2 <=> O + CO at a temperature of 1000 °C, the sensitivity of some of the main reactions at different temperatures were similar in the reduction zone, with the λ R e at 0.87.
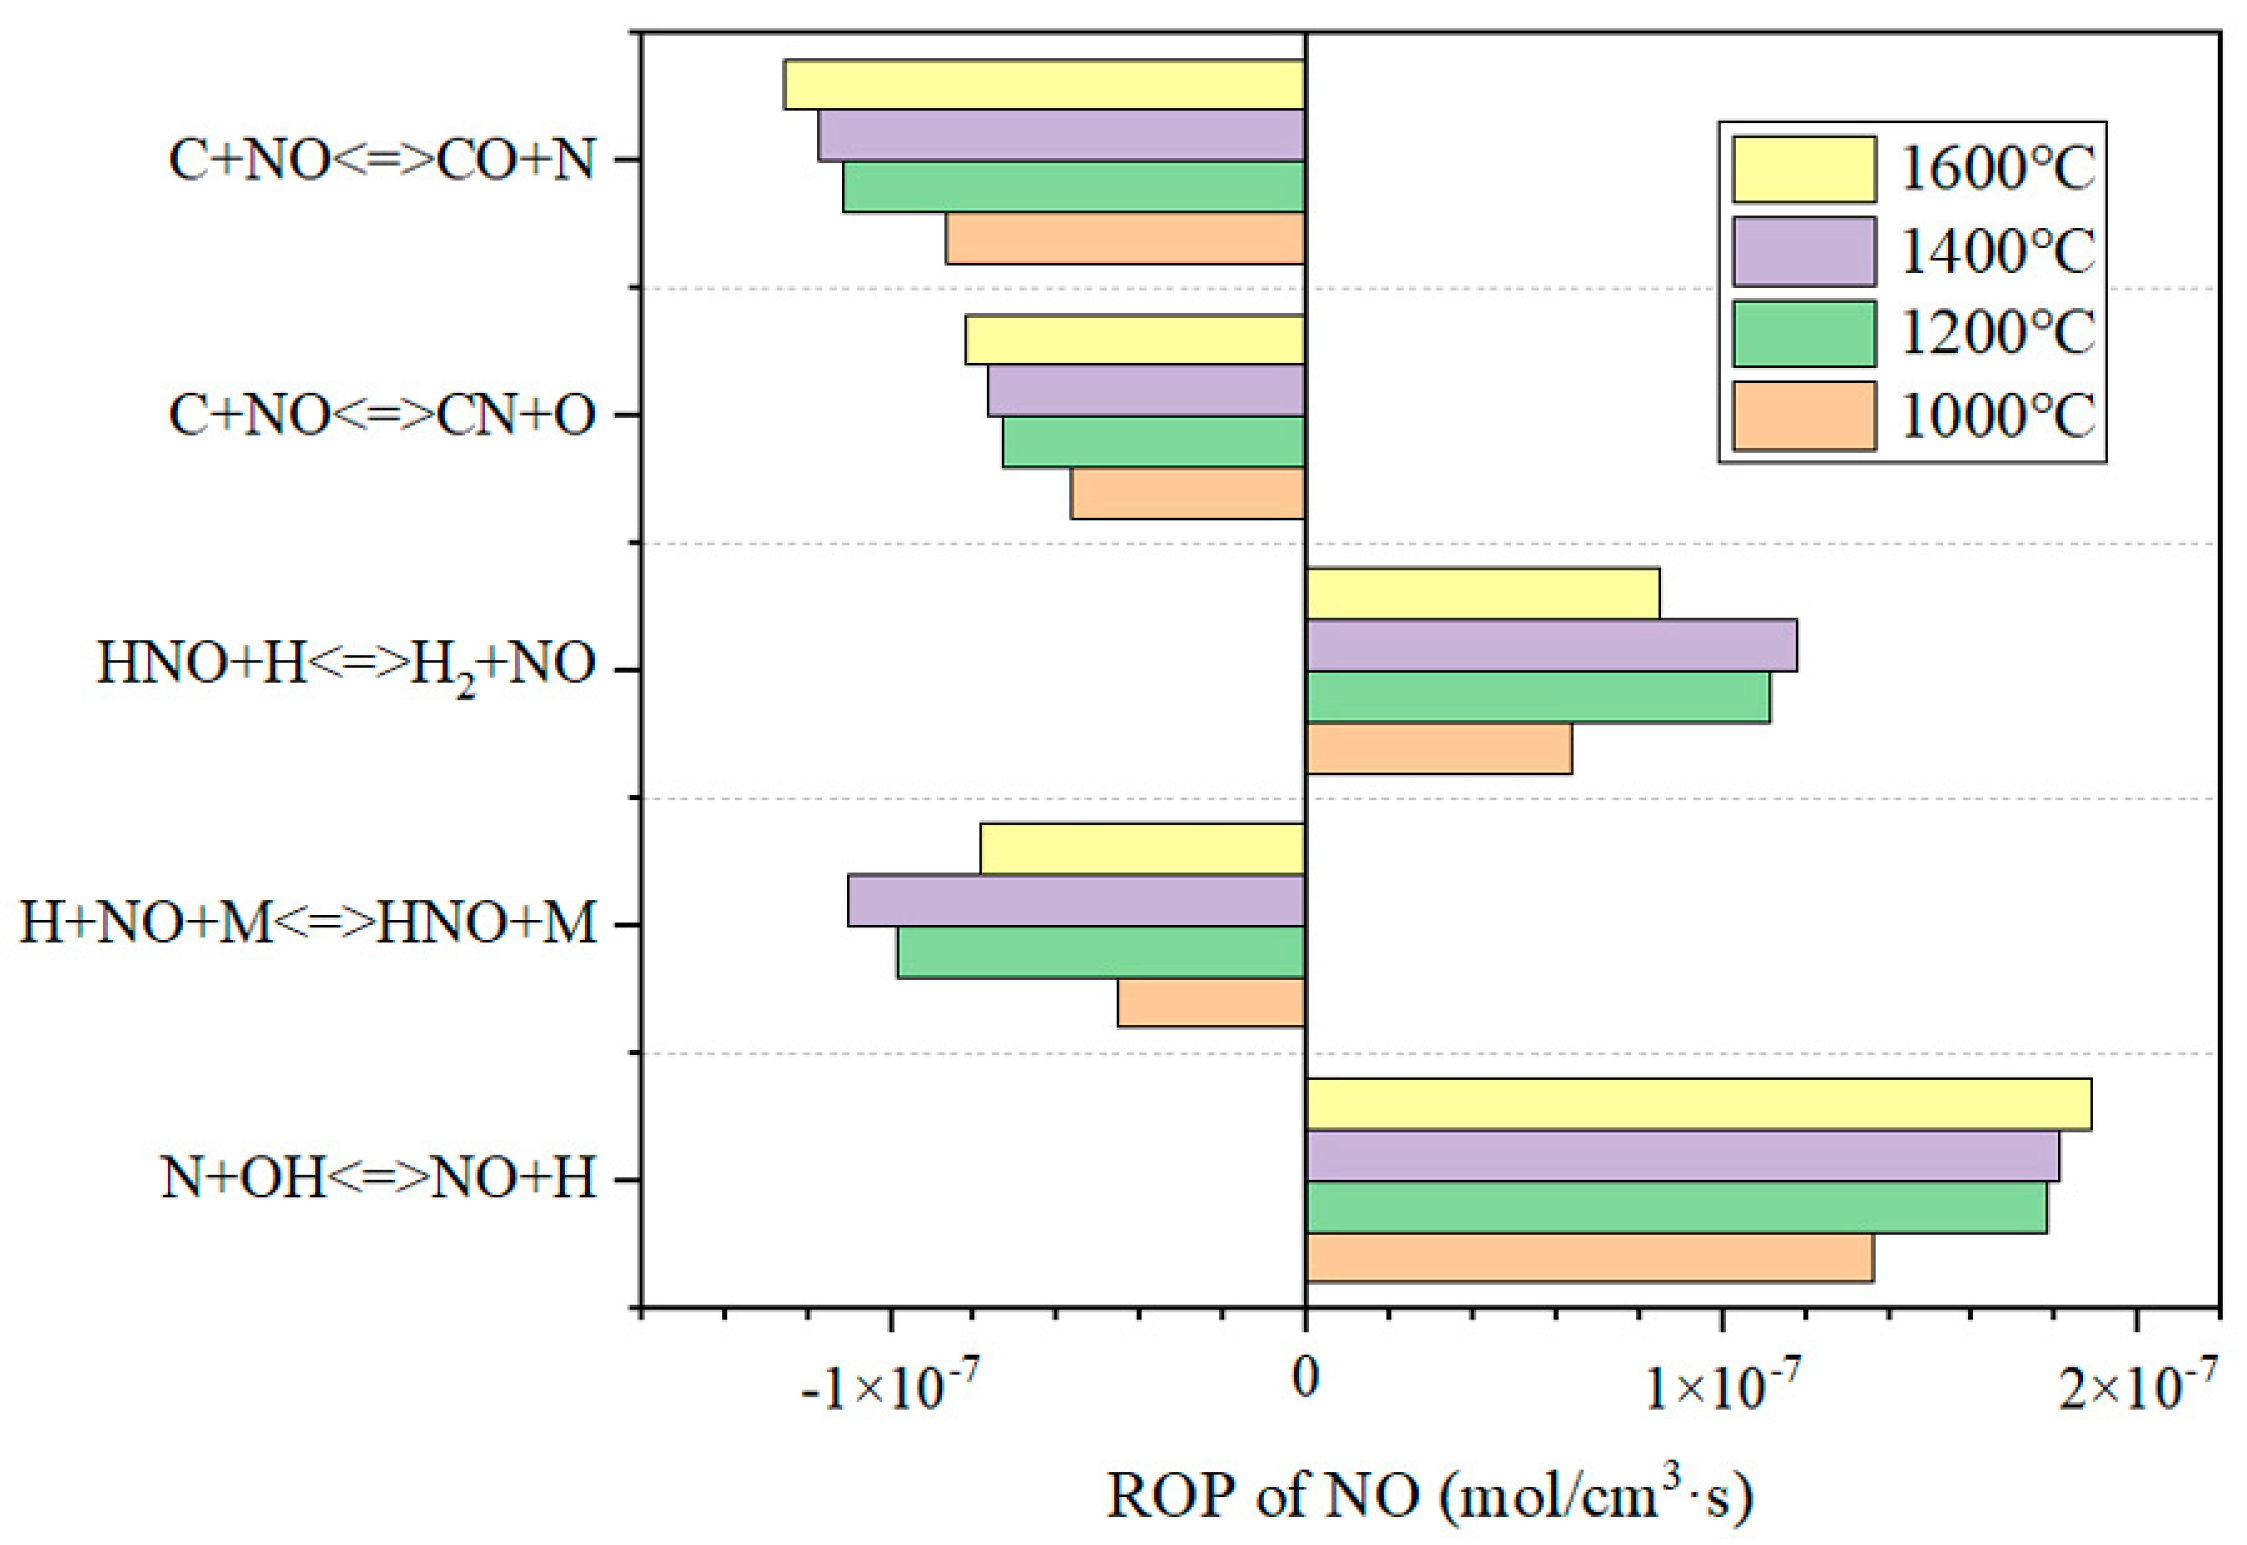
The rate of production (ROP) of NO is given in Figure 12, with the maximum NO generation being from the reaction N + OH <=> NO + H and the maximum NO consumption being from the reaction C + NO <=> CO + N. Also, the incidence of these two reactions increased proportionally to increases in the temperature.

3.4.2. The Influence of Oxygen Concentration on NO in the Reduction Zone

In order to analyze the influence of the O2/N2 ratio in the secondary air on NO formation, four ratios (10/90, 21/79, 30/70, and 40/60) were selected as the simulation conditions. The NO formation in the reduction zone, as shown in Figure 13, had little variation with different oxygen concentrations in secondary air with a reduction atmosphere in the reduction zone.
In the reduction zone, decreasing the oxygen concentration of the secondary air was not a good measure for reducing NOx emission, based on this simulation’s results.
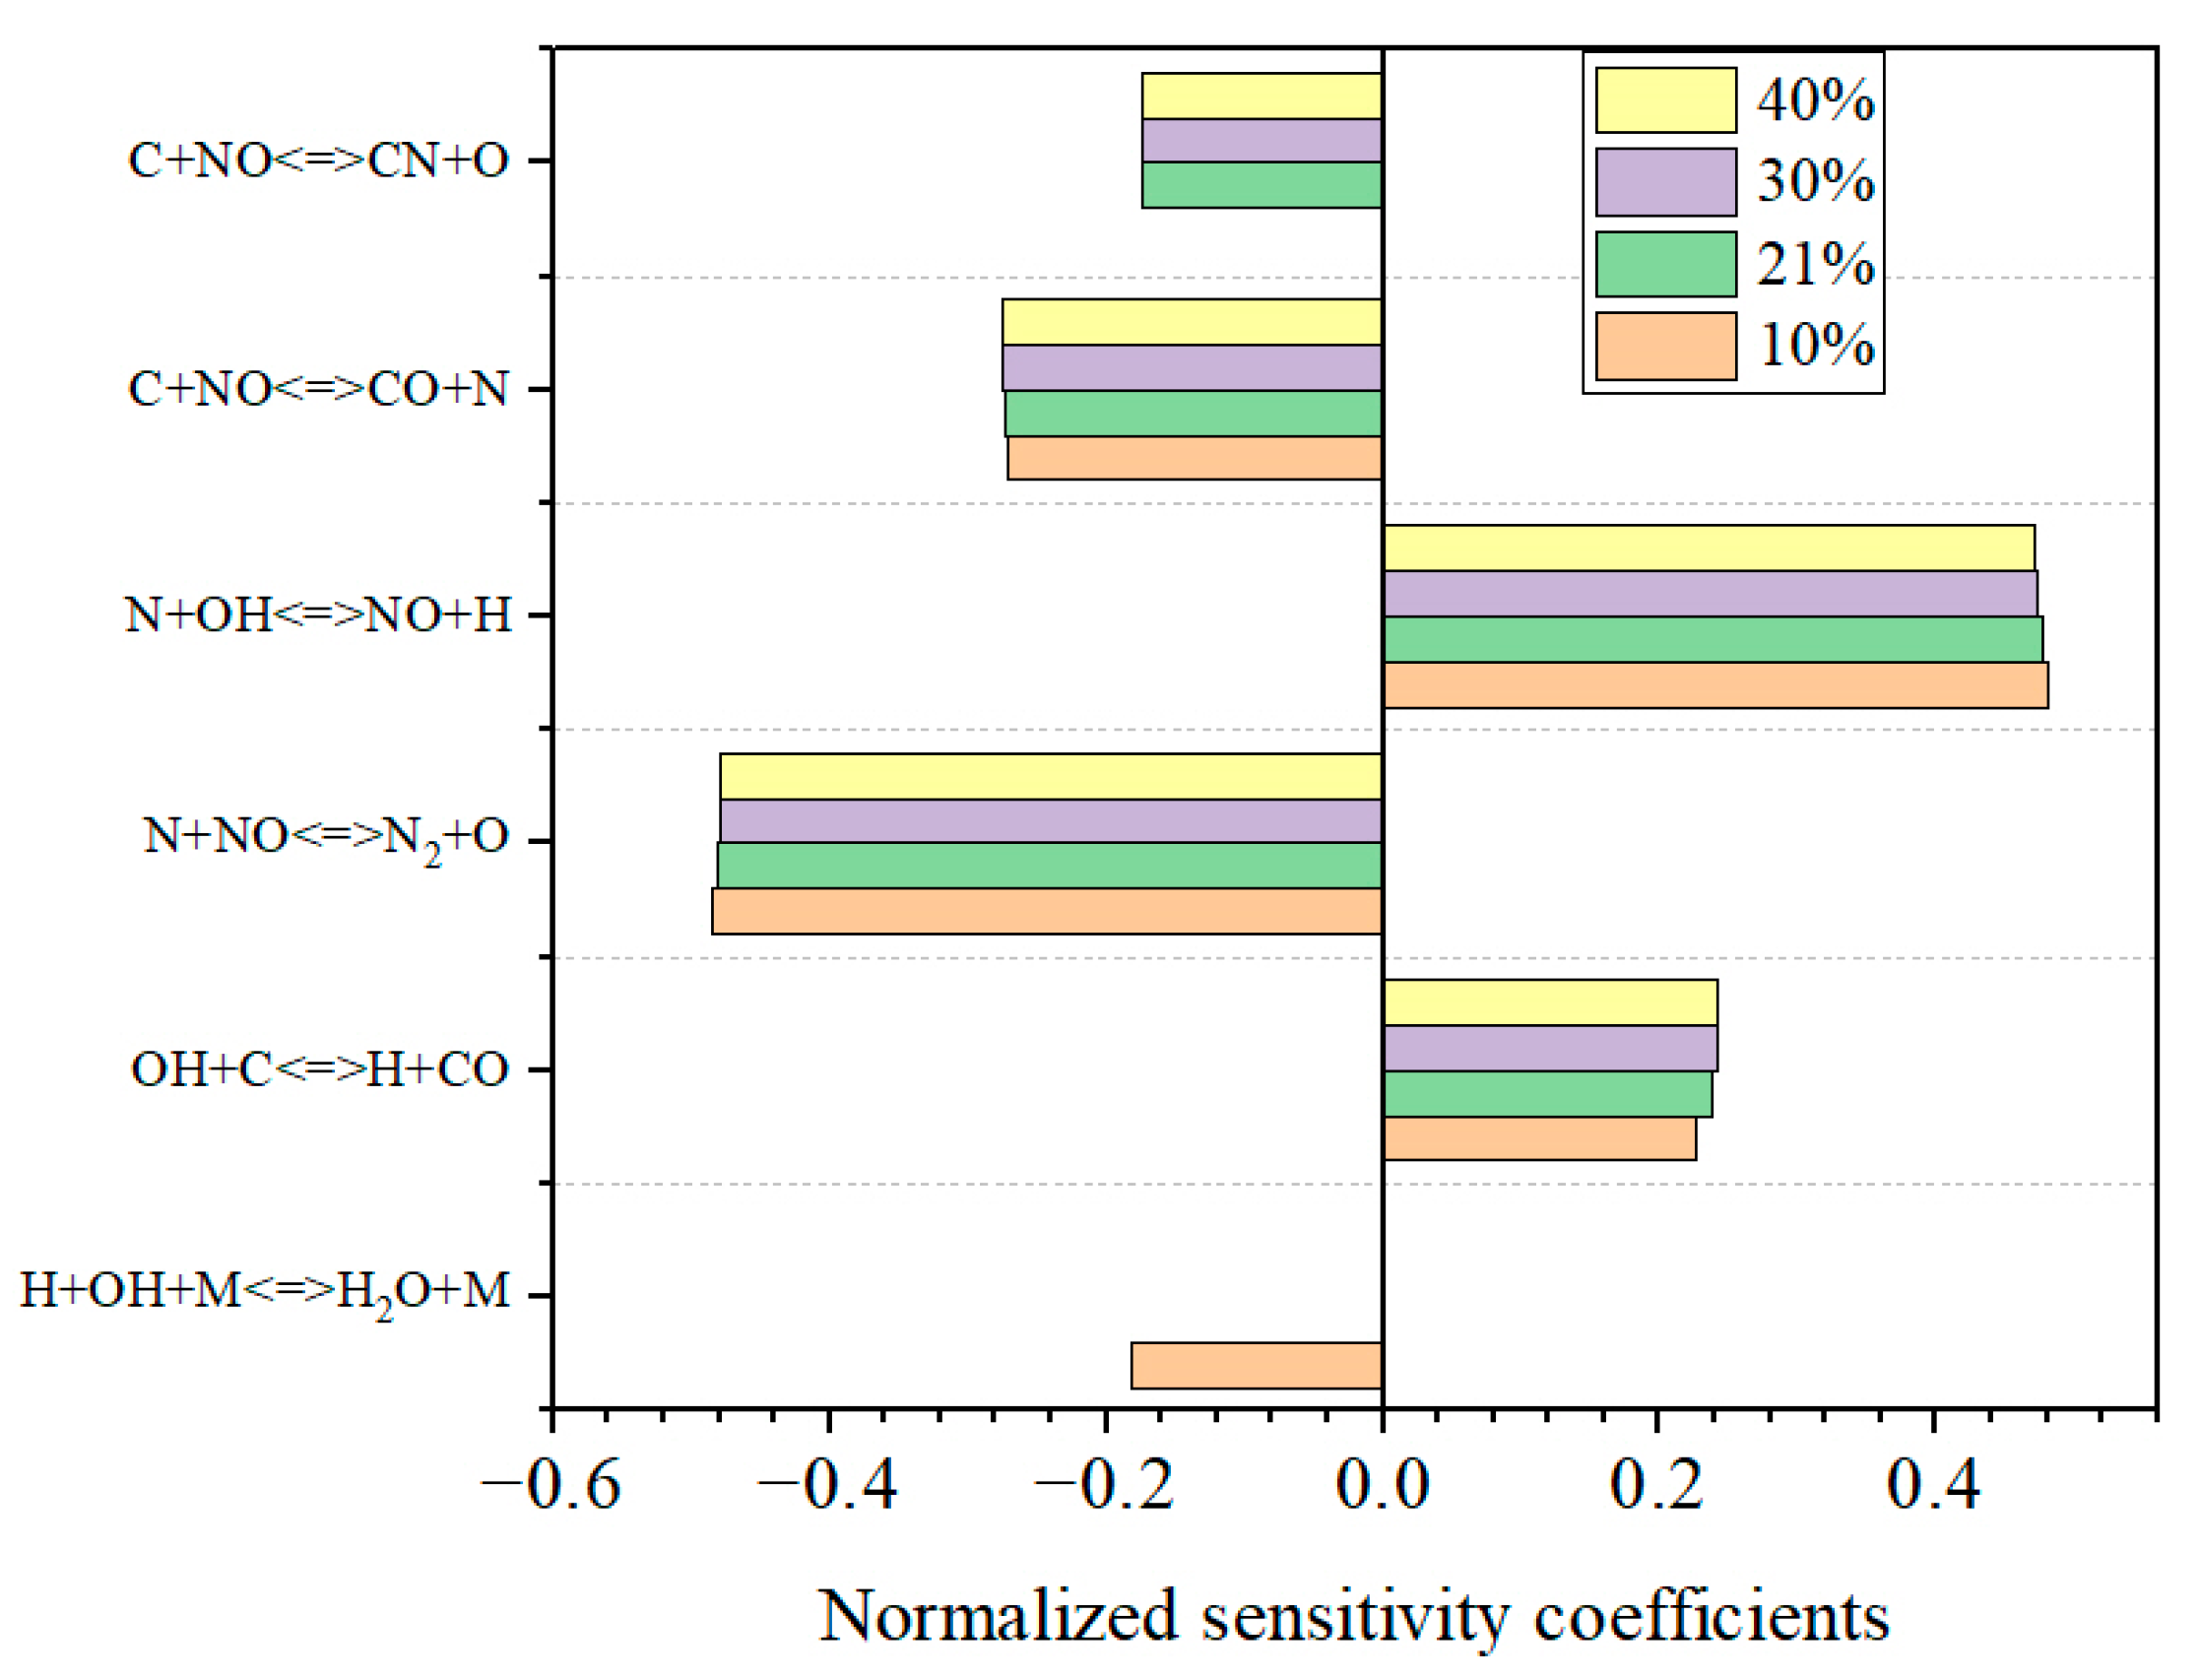
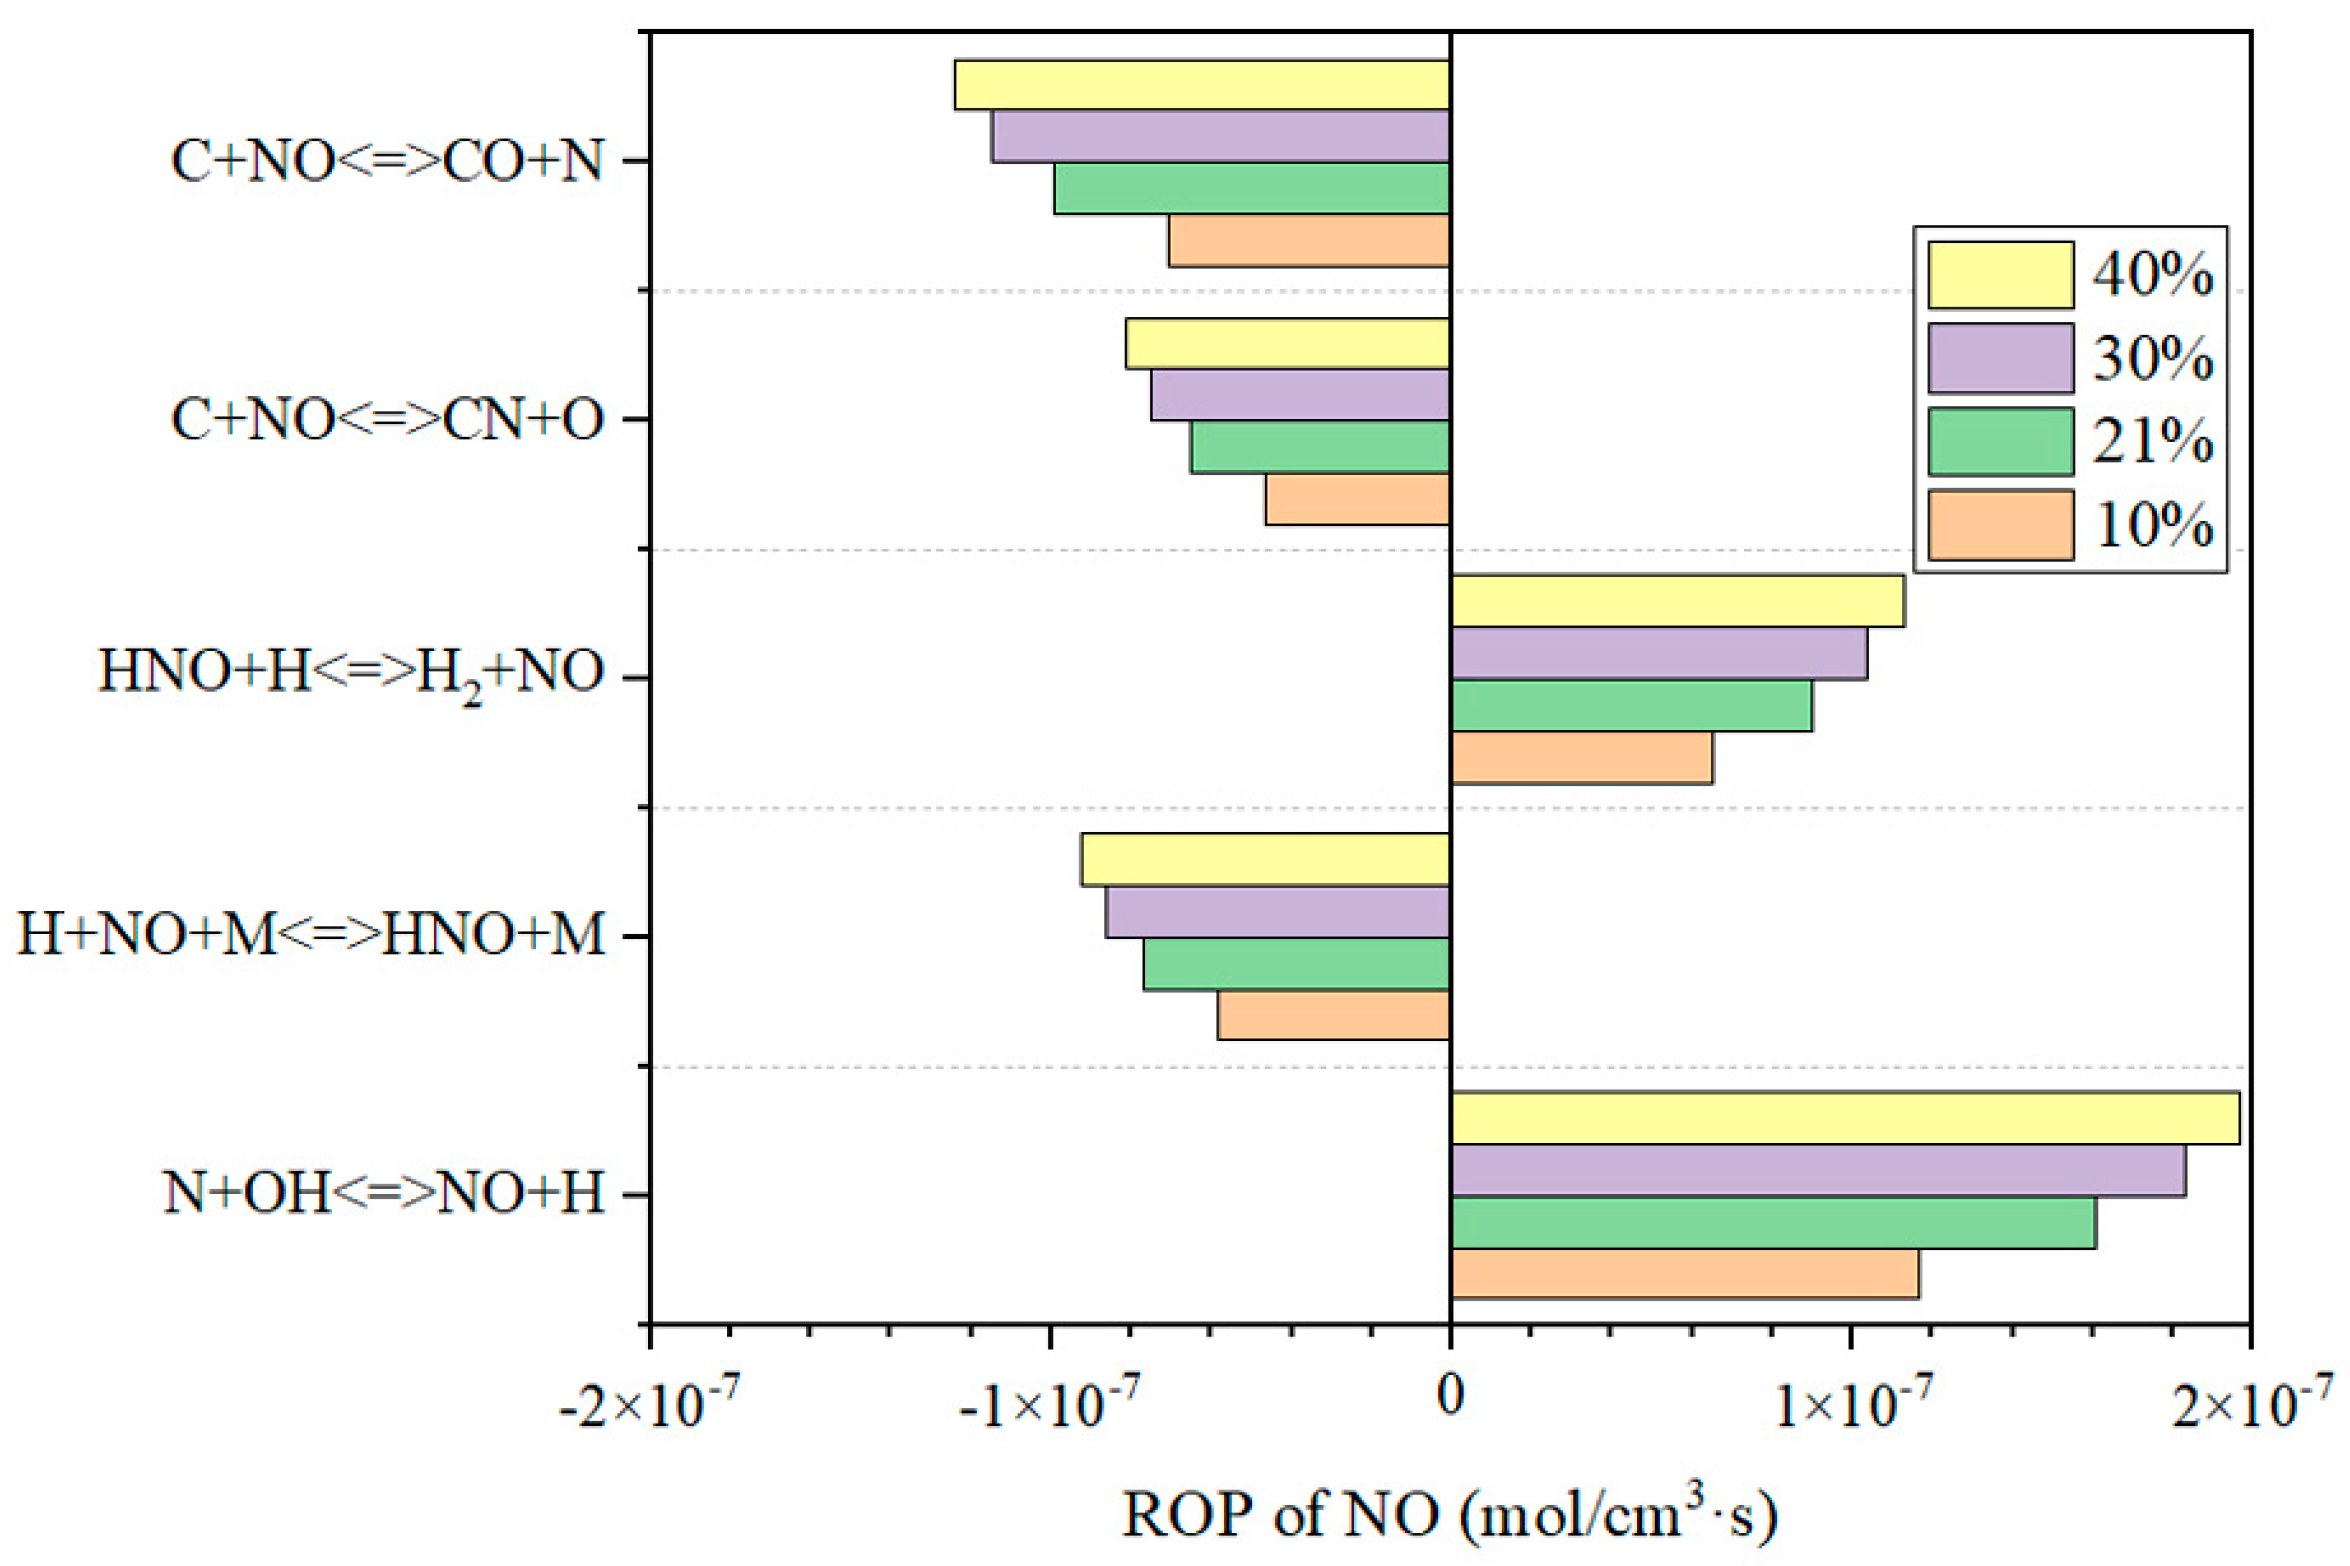
Figure 14 shows the sensitivity coefficients of the main reactions in NO formation or decomposition. In the reduction zone, the variation of oxygen concentrations had almost no effect on the sensitivity coefficients of different reactions, except as to the reaction of H + OH + M <=> H2O + M. As can be seen from Figure 15, increasing the oxygen concentration promoted both the formation of N + OH <=> NO + H and the decomposition of C + NO <=> CO + N, exactly similar to the influence of temperature.

3.4.3. The Influence of Air-Staging on NO Emission

The ratio of secondary air to total air had an important effect on the ultimate NO emission. For investigating the secondary-air ratio, five λ R e , i.e., 0.7, 0.8, 0.9, 1.0, and 1.2 were set, which represented a transition of atmospheres, from reducing to oxidizing, in the reduction zone.
The relationship between NO emission and the secondary-air ratio is shown in Figure 16. It can be concluded that in cases in which the reduction zone was in an oxygen-rich environment, the NO emission was quite large. The lowest NO emission was achieved with a secondary-air ratio of 0.9 for preheated fuel combustion. Also, in cases in which the reduction zone was in a strongly oxygen-absent environment, the conditions were similarly unfavorable for the reduction of NOx emission. The comparison of the simulation results with the experimental data showed a good agreement.
Figure 17 shows the ROP of NO in the reduction zone and the oxidation zone with different secondary-air ratios. It was clearly seen that the NO formation was mainly in the oxidizing atmosphere. So, in cases in which the secondary-air ratio was small, this means that more fuel-N will make the conversion into NO in the subsequent oxidation zone, after tertiary air injection. An appropriate secondary-air ratio is very important for the control of the amount of NO formation, both in the reduction zone and in the oxidation zone.
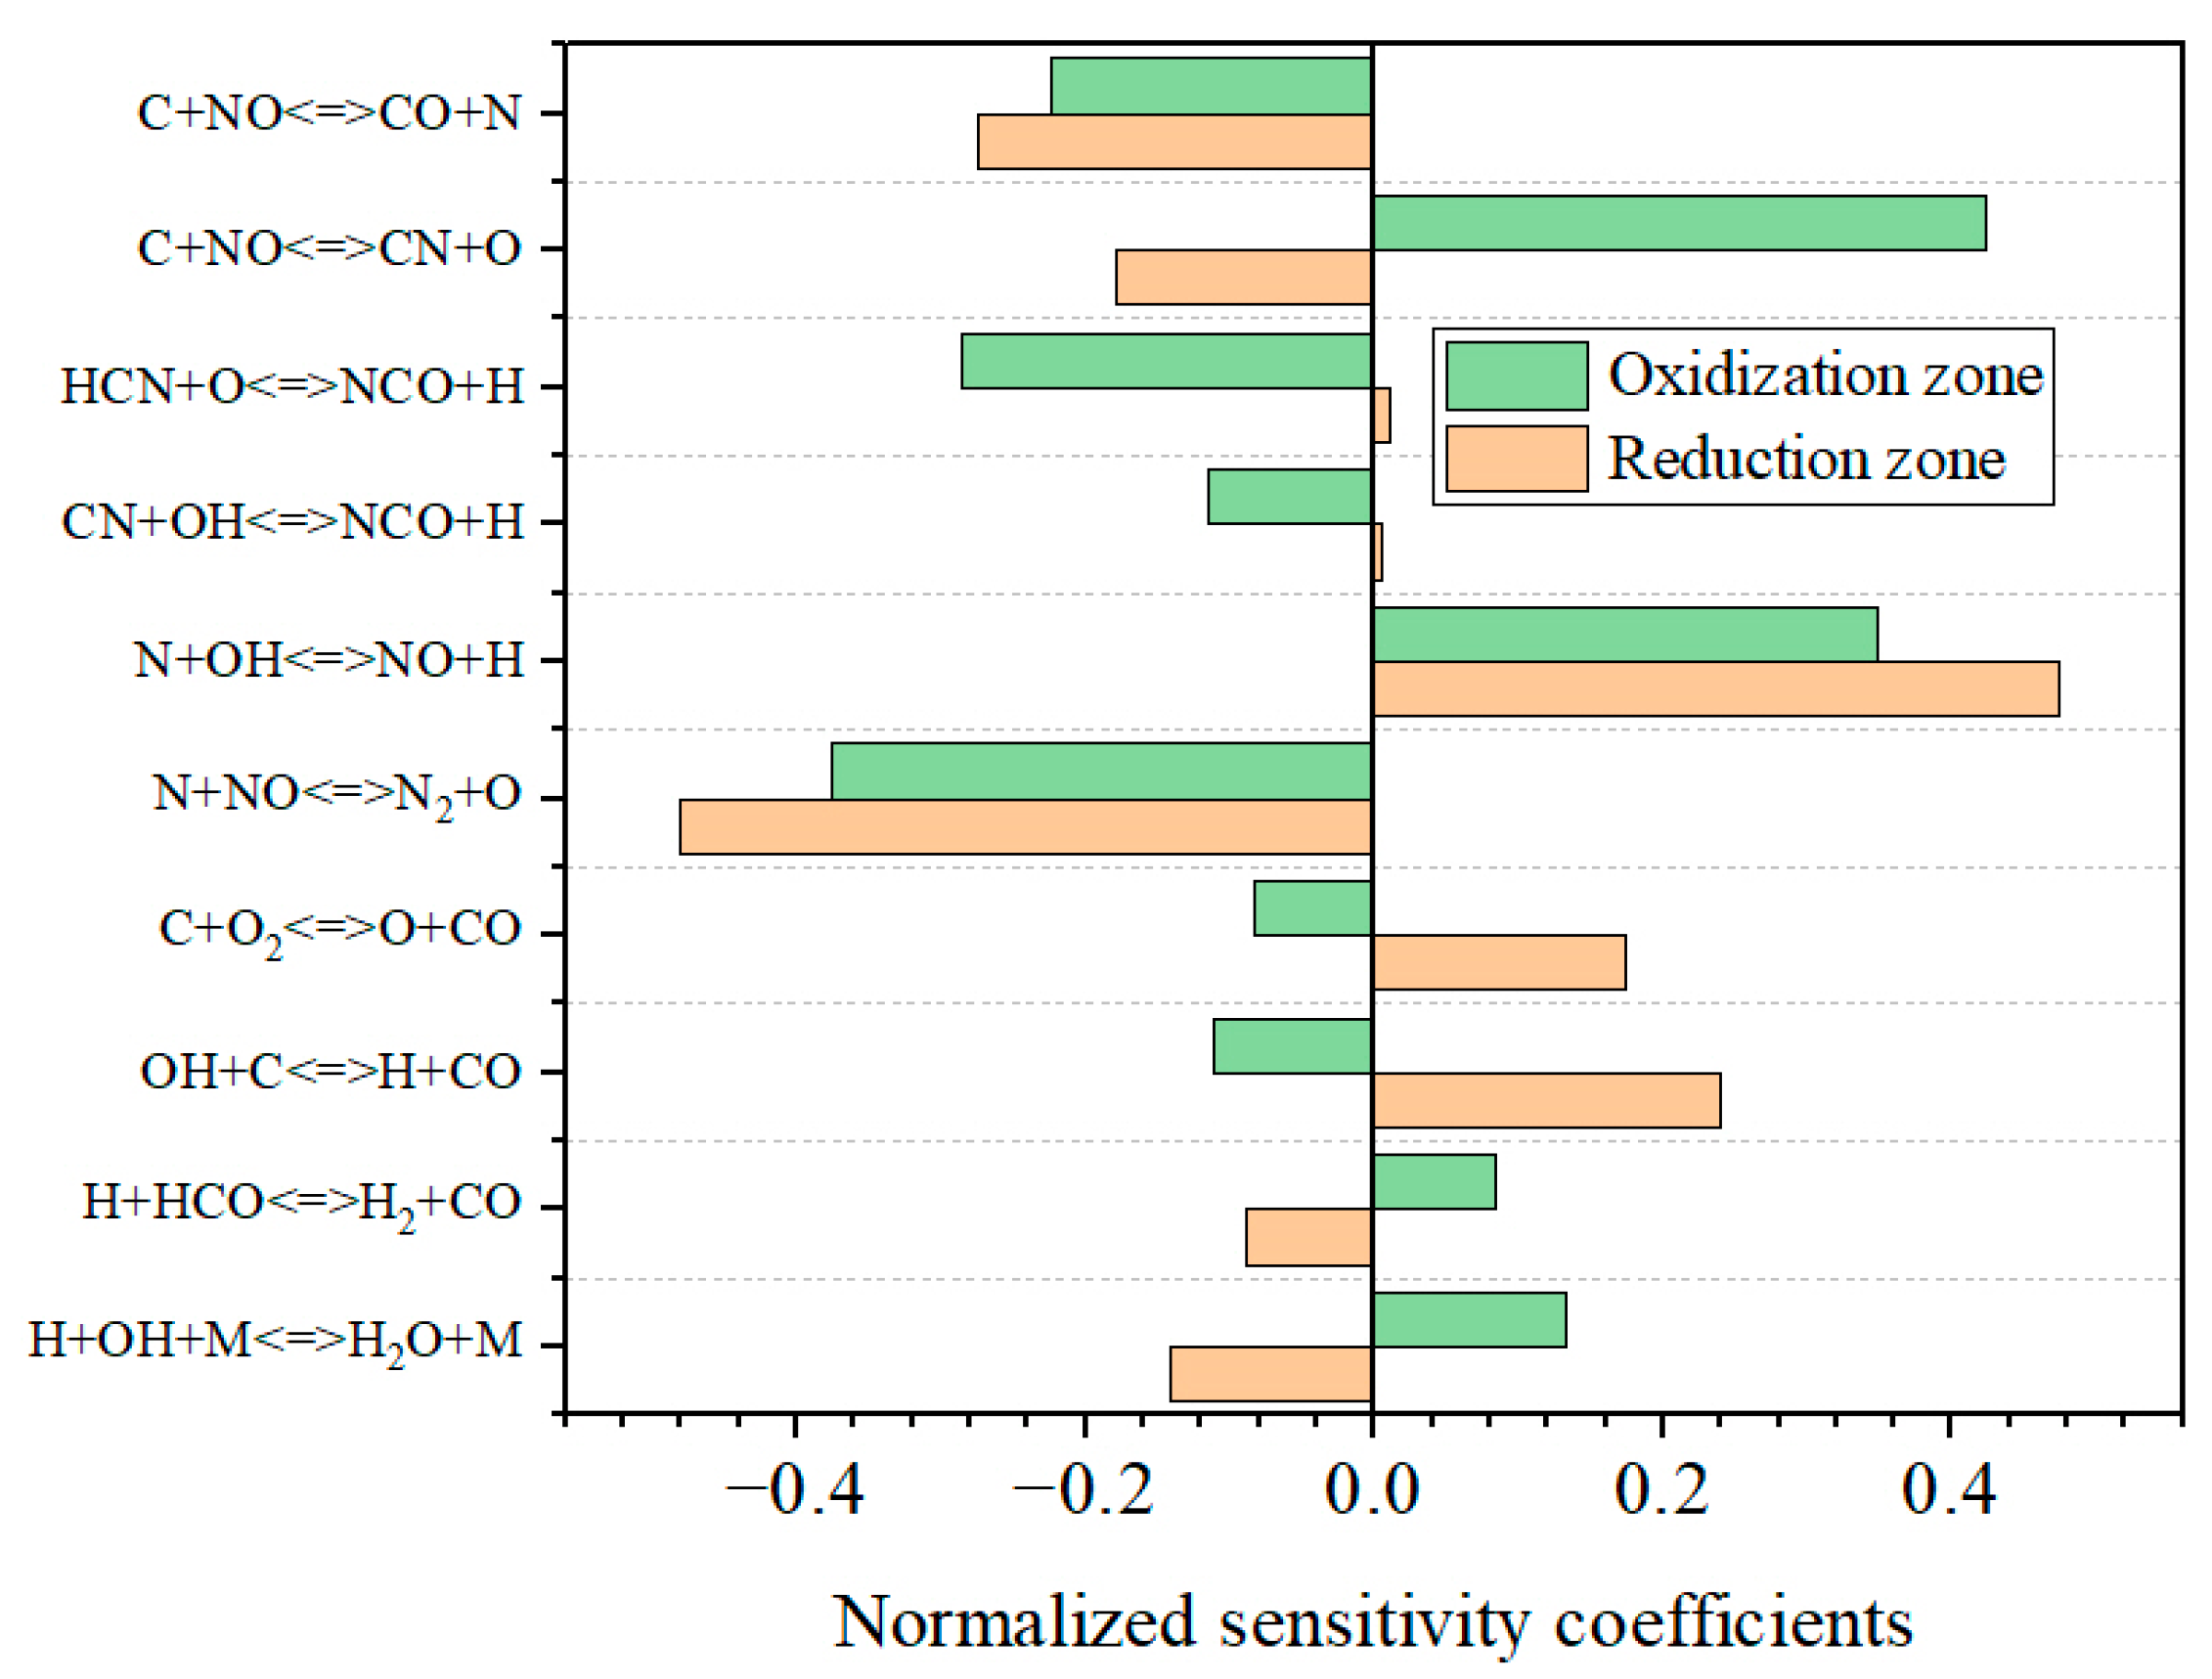
For the case with the lowest NO emission, the sensitivity coefficients of different reactions in the reduction zone and oxidation zone are shown in Figure 18. In the reduction zone, the most sensitive reactions were N + OH <=> NO + H and N + NO <=> N2 + O. And in the oxidation zone, the most sensitive reactions were C + NO <=> CN + O and N + NO <=> N2 + O.

4. Conclusions

The combustion experiments with lignite were carried out in a 30 kW test rig with different particle size conditions, and a kinetic simulation of NO formation was also performed. Some conclusions are as follows.
(1)
With a primary air-equivalence ratio of 0.51 in the CFB, the ratio of CO/CO2 in the coal gas was lower than 1, meaning a partial combustion and gasification reaction happened in the CFB preheating. A larger particle size resulted in relatively higher CO and H2 content levels in the coal gas due to the long residence time. The release of different species for all three particle sizes followed the order H > N>C > S in the CFB preheating. Compared to raw coal, the reaction activity of preheated char intensified, forming a condition beneficial for the subsequent highly efficient combustion.
(2)
After preheating, the samples with a fine particle size showed a fast combustion reaction near the secondary air nozzle and had the highest combustion temperature, 1080 ℃, at 400 mm below the nozzle. The largest combustion temperature for a particle size of 0–0.355 mm was about 100 ℃ higher than that for a particle size of 0–1 mm. The fast combustion reaction for a particle size of 0–0.355 mm was mainly due to the large particle-surface area, an excellent mixing of fuel with oxygen, and the preheated fuel modification itself. For the three particle sizes, the temperature distributions in the DFC were uniform, with a lower temperature difference, and the combustion efficiencies were over 98%.
(3)
There were three conversion paths for fuel-N into N2 in the CFB preheating: the first was a homogenous reduction with coal gas and N-containing species, the second was a heterogeneous reduction with char and N-containing species in an inner pore of the particle, and the third was a heterogeneous reduction with char and N-containing species on the outside of the particle. The largest conversion ratio of fuel-N into N2 in the CFB preheating was 52.64% for a particle size of 0–0.5 mm, corresponding to the lowest NO emission in this system. A large particle size produced more NH3, but with the lowest conversion ratio of fuel-N into N2.
(4)
In the reduction zone of the DFC, CO was the main species, with tiny amounts of HCN, NH3 and NO, and in the oxidation zone, CO continuously decreased and NO rapidly increased. The effect of the particle size on NO was negligible. The ultimate NO emission was in the range of 105~120 mg/m3, more 50% lower than that of conventional combustion.
(5)
The mechanism of GRI-Mech 2.11 was applied to the kinetic simulation of NO in this preheating combustion system. Three parameters, namely, temperature, oxygen concentration, and secondary-air ratio, were varied to analyze NO-formation variations. The results showed that there was good agreement between the experiment and the simulation, illustrating the validity of the mechanism. The simulation results showed that the best secondary-air ratio was 0.9, with the lowest NO emission, 61 mg/m3.

Author Contributions

Kinetic simulation, J.Z. (Jianguo Zhu); Experiments and analysis, J.Z. (Jiahang Zhang); Data comparison, J.L. All authors have read and agreed to the published version of the manuscript.

Funding

This research was funded by the Strategic Priority Research Program of the Chinese Academy of Sciences, grant number XDA29010100.

Acknowledgments

This work was supported by the project of the Strategic Priority Research Program of the Chinese Academy of Sciences.

Conflicts of Interest

The authors declare no conflict of interest.

References

  1. Gao, M.; Cheng, C.; Miao, Z.; Wan, K.; He, Q. Physicochemical properties, combustion kinetics and thermodynamics of oxidized lignite. Energy 2023, 268, 126657. [Google Scholar] [CrossRef]
  2. Hees, J.; Zabrodiec, D.; Massmeyer, A.; Hatzfeld, O.; Kneer, R. Experimental investigation into the influence of the oxygen concentration on a pulverized coal swirl flame in oxy-fuel atmosphere. Fuel 2019, 240, 64–74. [Google Scholar] [CrossRef]
  3. Jeon, M.; Lee, E.; Kim, M.; Jegal, H.; Park, S.; Chi, J.; Baek, S.; Lee, J.; Keel, S. Nitric oxide (NO) and nitrous oxide (N2O) emissions during selective non-catalytic reduction and selective catalytic reduction processes in a pulverized coal/ammonia co-fired boiler. J. Environ. Chem. Eng. 2023, 11, 109398. [Google Scholar] [CrossRef]
  4. Lv, Z.M.; Xiong, X.H.; Tan, H.Z.; Wang, X.B.; Liu, X.; Rahman, Z. Experimental investigation on NO emission and burnout characteristics of high-temperature char under the improved preheating combustion technology. Fuel 2022, 313, 122662. [Google Scholar] [CrossRef]
  5. Kuang, M.; Wang, J.L.; Wang, X.; Zhao, X.J.; Chen, Y.Y.; Du, L. In-furnace flow field, coal combustion and NOx emission characteristics regarding the staged-air location in a cascade-arch down-fired furnace. J. Energy. Inst. 2021, 98, 259–270. [Google Scholar] [CrossRef]
  6. Su, K.; Ouyang, Z.; Ding, H.; Wang, W.; Zhang, J.; Wang, H.; Zhu, S. Experimental investigation on effect of external circulation system on preheating characteristics of pulverized coal. Energy 2023, 278, 127781. [Google Scholar] [CrossRef]
  7. Li, L.; Cheng, L.; Wang, B.; Ma, Z.; Zhang, W. Experimental study on the effect of limestone on SO2 and NO emission characteristics during coal/coke combustion. J. Energy. Inst. 2023, 111, 101403. [Google Scholar] [CrossRef]
  8. Xu, M.; Tu, Y.; Zhou, A.; Xu, H.; Yu, W.; Li, Z.; Yang, W. Numerical study of HCN and NH3 reduction in a two-stage entrained flow gasifier by implementing MILD combustion. Fuel 2019, 251, 482–495. [Google Scholar] [CrossRef]
  9. Wu, C.Y.; Tree, D.; Baxter, L. Reactivity of NH3 and HCN during low-grade fuel combustion in a swirling flow burner. Proc. Combust. Inst. 2007, 31, 2787–2794. [Google Scholar] [CrossRef]
  10. Schafer, S.; Bonn, B. Hydrolysis of HCN as an important step in nitrogen oxide formation in fluidised combustion. Part 1. Homogeneous reactions. Fuel 2000, 79, 1239–1246. [Google Scholar] [CrossRef]
  11. Yuan, Z.; Chen, Z.; Bian, L.; Li, Z. Influence of over-fired air location on gas-particle flow characteristics within a coal-fired industrial boiler under radial air staging. Energy 2023, 283, 128617. [Google Scholar] [CrossRef]
  12. Xiang, J.; Li, M.; Sun, L.; Lu, J.; Sun, X. Comparison of nitrogen oxide emissions from boilers for a wide range of coal qualities. Int. J. Therm. Sci. 2000, 39, 833–841. [Google Scholar] [CrossRef]
  13. Wang, J.; Zhu, J.; Lu, Q. Experimental study on combustion characteristics and NOx emissions of pulverized anthracite preheated by circulating fluidized bed. J. Therm. Sci. 2011, 20, 355–361. [Google Scholar] [CrossRef]
  14. Liang, B.; Bai, H.; Tan, B.; Fu, L.; Bai, D. Experimental investigation of circulating fluidized bed combustion of dry powders of coal slime. Fuel 2023, 348, 128566. [Google Scholar] [CrossRef]
  15. Ge, C.; Li, S.; Wang, L. Current investigation status of oxy-fuel circulating fluidized bed combustion. Fuel 2023, 342, 127699. [Google Scholar] [CrossRef]
  16. Ding, H.; Ouyang, Z.; Su, K.; Wang, W.; Zhang, J.; Wang, H.; Zhu, S. Experimental research on effects of multi-layer injection of the high-temperature preheated pulverized coal on combustion characteristics and NOx emission. Fuel 2023, 347, 128424. [Google Scholar] [CrossRef]
  17. Ding, H.; Ouyang, Z.; Shi, Y.; Chen, R.; Zhang, Z.; Zhu, S.; Lyu, Q. Effects of the T-abrupt exit configuration of riser on fuel properties, combustion characteristics and NOx emissions with coal self-preheating technology. Fuel 2023, 337, 126860. [Google Scholar] [CrossRef]
  18. Saha, M.; Dally, B.; Medwell, P.; Chinnici, A. Effect of particle size on the MILD combustion characteristics of pulverized brown coal. Fuel. Process. Technol. 2017, 155, 74–87. [Google Scholar] [CrossRef]
  19. Sung, Y.; Moon, C.; Eom, S.; Chor, G.; Kim, D. Coal-particle size effects on NO reduction and burnout characteristics with air-staged combustion in a pulverized coal-fired furnace. Fuel 2016, 182, 558–567. [Google Scholar] [CrossRef]
  20. Hu, P.; Li, P.; Wang, K.; Li, W.; Guo, J.; Liu, L.; Liu, Z. Evaluation, development, and application of a new skeletal mechanism for fuel-NO formation under air and oxy-fuel combustion. Fuel. Process. Technol. 2020, 199, 106256. [Google Scholar] [CrossRef]
  21. Cellek, M. Flameless combustion investigation of CH4/H2 in the laboratory-scaled furnace. Int. J. Hydrogen Energy. 2020, 45, 35208–352226. [Google Scholar] [CrossRef]
  22. Pan, H.; Geng, S.; Yang, H.; Zhang, G.; Bian, H.; Liu, Y. Influence of H2 blending on NOx production in natural gas combustion: Mechanism comparison and reaction routes. Int. J. Hydrogen Energy. 2023, 48, 784–797. [Google Scholar] [CrossRef]
  23. Ding, H.; Ouyang, Z.; Zhang, X.; Zhu, S. The effects of particle size on flameless combustion characteristics and NOx emissions of semi-coke with coal preheating technology. Fuel 2021, 297, 120758. [Google Scholar] [CrossRef]
  24. Liang, C.; Wang, X.; Lyu, Q. Experimental investigation on fluidized modification in gasification of preheated coal using oxygen and steam. Fuel 2021, 304, 121375. [Google Scholar] [CrossRef]
  25. Zhang, Z.; Zhu, J.; Shi, Y.; Wang, T. Gas generation characteristics of Shenmu bituminous coal in fluidized preheating. Clean Coal Technol. 2023, 29, 149–154. [Google Scholar] [CrossRef]
  26. Zhang, Y.; Zhu, J.; Lyu, Q.; Liu, J.; Zhang, J. Experimental study on the effect of preheating temperature on the modification of pulverized coal through a circulating fuidized bed. J. Therm. Anal. Calorim. 2022, 150, 9591–9601. [Google Scholar] [CrossRef]
  27. Sheng, C. Char structure characterized by Raman spectroscopy and its correlations with combustion reactivity. Fuel 2007, 86, 2316–2324. [Google Scholar] [CrossRef]
  28. Wang, J.; Zheng, K.; Singh, R.; Lou, H.; Hao, J.; Wang, B.; Chen, F. Numerical simulation and cold experiment research of a low-NOx combustion technology for pulverized low-volatile coal. Appl. Therm. Eng. 2017, 114, 498–510. [Google Scholar] [CrossRef]
  29. Liu, Y.H.; Liu, J.Z.; Lyu, Q.G.; Zhu, J.G.; Zhang, X.Y.; Zhang, J.H.; Cao, X.Y. Comparison of oxy-fuel preheated combustion characteristics of high- and low-volatility carbon-based fuels. Fuel 2022, 330, 125583. [Google Scholar] [CrossRef]
Figure 1. Diagram of a 30 kW preheated-combustion test rig.
Energies 16 07078 g001
Figure 2. Particle size distribution curve.
Energies 16 07078 g002
Figure 3. Coal-gas composition and preheating temperature with different particle sizes.
Energies 16 07078 g003
Figure 4. Raman spectrum area distribution with different samples (“@” means preheated char at different particle sizes).
Energies 16 07078 g004
Figure 5. Temperature distributions of preheated fuel combustion along the axis of the DFC.
Energies 16 07078 g005
Figure 6. The reaction paths of fuel-N into N2 in the CFB preheating.
Energies 16 07078 g006
Figure 7. Distributions of fuel-N conversion in CFB preheating.
Energies 16 07078 g007
Figure 8. The gas distribution curves along the axis of the DFC.
Energies 16 07078 g008
Figure 9. The NO and CO emissions with different particle sizes.
Energies 16 07078 g009
Figure 10. The relationship of NO to temperature.
Energies 16 07078 g010
Figure 11. The sensitivity coefficients of the main reactions on NO formation with different tempratures.
Energies 16 07078 g011
Figure 12. The ROP of NO in the reduction zone.
Energies 16 07078 g012
Figure 13. The relationship between NO and oxygen concentrations.
Energies 16 07078 g013
Figure 14. The sensitivity coefficients of the main reactions on NO formation with different oxygen concentrations.
Energies 16 07078 g014
Figure 15. The ROP of NO in the reduction zone with varying oxygen concentrations.
Energies 16 07078 g015
Figure 16. The relationship between NO emission and different secondary-air ratios.
Energies 16 07078 g016
Figure 17. The ROP of NO with different secondary-air ratios.
Energies 16 07078 g017
Figure 18. The sensitivity coefficients of the main reactions on NO formation with different atmospheres.
Energies 16 07078 g018
Table 1. The proximate and ultimate analyses of lignite.
ItemProximate Analysis (wt.%)Ultimate Analysis (wt.%)Low Heating Value (MJ/kg)
MadAadVadFCadCadHadNadSadQnet,ad
Data6.1810.9837.9344.9156.64.10.750.2823.13
Note: “ad” represents the “air-dry basis”.
Table 2. Experimental conditions.
ItemCase OneCase TwoCase Three
Feeding rate (kg/h) 3.574.083.64
λ C F B 0.510.510.51
λ R e 0.890.870.83
λ 1.201.201.20
Particle size (mm)0–0.3550–0.50–1
Table 3. Proximate analysis, ultimate analysis, and conversion ratio of preheated char.
ItemProximate Analysis (wt.%)Ultimate Analysis (wt.%)
MadAadVadFCadCadHadNadSad
0–0.355 mm4.5928.618.5258.2861.211.670.660.61
0–0.5 mm4.9428.89.2357.0461.631.370.750.59
0–1 mm5.7426.949.7257.5960.071.330.700.54
Conversion ratio (%)
@ 0–0.355 mm71.50/91.4350.2358.5184.4266.2116.41
@ 0–0.5 mm69.51/90.7251.6158.5387.3161.9219.72
@ 0–1 mm62.12/89.6147.7256.7286.8262.0121.45
Note: “@” means preheated char at different particle sizes.
Disclaimer/Publisher’s Note: The statements, opinions and data contained in all publications are solely those of the individual author(s) and contributor(s) and not of MDPI and/or the editor(s). MDPI and/or the editor(s) disclaim responsibility for any injury to people or property resulting from any ideas, methods, instructions or products referred to in the content.