Abstract
At present, electrified railroads with complex road conditions are facing the problems of the existence of a single power supply method, the deterioration in power quality, and the difficulty in recycling regenerative braking energy. In order to improve the above problems, this paper establishes a traction power supply system containing photovoltaic units, proposes an optimized compensation model for the RPC (railroad power conditioner), and improves the particle swarm algorithm for solving the reference value of RPC compensation power. First, the structure of the RPC-based traction photovoltaic power generation system and the establishment of the integrated energy management strategy of the system are constructed. Then, the back-to-back converter compensation model with power quality index parameter constraints is established, which establishes the optimization function with the objectives of minimizing the negative sequence current, maximizing the power factor, and minimizing the RPC compensation power, as well as establishes constraints on the active converter capacity and three-phase voltage imbalance. Then, the particle swarm algorithm for solving the RPC compensation power reference value is improved, specifically in the original PSO by introducing dynamically changing inertia weights and learning factors. This not only solves the problem of the single power supply and realizes the nearby consumption of photovoltaic units in the traction system, but also realizes the recycling of regenerative braking energy and the coordinated control of the traction photovoltaic power generation system, improves the power quality of the system, and meets the demand of the RPC for real-time control. In order to verify the effectiveness of the optimized compensation model established in this paper and improve the convergence of the particle swarm algorithm for solving the RPC compensation power reference value, a simulation model of the traction PV power generation system is established in MATLAB/Simulink, and a real-time simulation is carried out to verify it based on the preset working condition data. The results show that the RPC optimization compensation model developed in this paper can coordinate the control system energy flow and improve the system power quality (the power factor increases and the negative sequence current decreases). The improved particle swarm algorithm is more convergent.
1. Introduction
High-speed railroad rolling stock trains have a high power, small departure interval, and high traveling density, thus leading to a high power consumption of high-speed railways. Usually, the traction power load of high-speed railroads accounts for about 80~90% of its total energy consumption [1,2,3]. Considering the fact that traction energy consumption accounts for the largest proportion of the total energy consumption of the railroad system, the application of photovoltaic power generation technology in the traction power supply is key to reduce the energy consumption of railroad systems and realize the low-carbon operation of the railroad [4]. Responding to the national call for “clean power consumption near the city” [5], it not only makes full use of sunlight resources, but also relieves the pressure on the external power grid. In high-speed railroads, only about 45% of the regenerative energy can be consumed by the traction power supply arm on the rolling stock; the remaining regenerative braking energy will be returned to the electric power system without any compensation, which will bring certain economic losses to the railroad operation department [6]. Especially for electrified railroads with complex road conditions, the frequent waste of braking energy and power quality problems become more prominent. This makes the operation control design of a PV access system of great significance.
At present, back-to-back structures are mostly used in domestic and international schemes for PV access to AC heterophase traction power supply systems [7,8]. Compared to PV single-phase/three-phase access methods, PV back-to-back access methods are better adapted. The back-to-back structure of the RPC realizes the bidirectional transfer of active power between and phases and the dynamic compensation of reactive power and harmonics through the coordinated control of the four-quadrant operating state of the two converters [9,10,11], which is better controllable and improves the power quality to a certain extent. It also facilitates the realization of the operational control of the system. Therefore, in this paper, a photovoltaic power generation system for traction based on the RPC with a back-to-back structure is investigated.
In order to realize its dynamic absorption of photovoltaic energy and effective transfer of braking energy between phases, most of the previous research [12,13,14] has only discussed the energy management and operation control of the photovoltaic traction system under loaded traction conditions, However, the simplified control of system operation under braking conditions makes it difficult to cope with complex road sections with frequent braking. And there has been no analysis of power quality issues.
From the perspective of integrated energy management, established studies [15] have proposed an energy management strategy that considers regenerative braking energy transfer, but the RPC has a high demand capacity, which will limit its utilization at scale.
Therefore, from the perspective of practical engineering, it is of great significance to realize the optimal compensation effect in a limited capacity range [16], and then realize the reasonable transfer of regenerative braking energy and power quality improvement.
Most of them use the minimum RPC compensation power as the optimization objective [16,17]; the three-phase voltage imbalance, the power factor, and other power quality index parameters as the inequality constraints; and the converter capacity, power conservation, etc., as the equation constraints, from which a series of different optimization mathematical models can be established and then based on the optimization algorithm for real-time solving.
For multidimensional nonlinear constraint formulations, it was difficult to satisfy the dual demands of search speed and accuracy using earlier analytic methods [10] and enumerative methods [18]. Therefore, it is crucial to use some intelligent algorithms with strong optimization seeking ability and good convergence. A study [19] utilized the Sequential Quadratic Programming (SQP) algorithm as an effective method for solving nonlinear constrained problems, which has a very strong local search capability, but its global search capability is weak and sensitive to the initial value, which may not necessarily find the truly optimal solution when used alone. In order to adapt to the multi-dimensional strongly coupled time-varying control in the optimized compensation model, a robust and linguistically convenient fuzzy control has been used [20]. However, the control design is not yet systematic enough to define control objectives. Differential evolutionary algorithms [21] have also been used to solve for the optimal compensated power reference, but like other population-based algorithms, they suffer from premature convergence and insufficient local search capability.
In order to adapt to the complex working conditions, the braking energy can be transferred accurately in real time and the power quality can be improved. The PSO algorithm has been used in previous studies [22]. The particle swarm algorithm has a fast approximation of the optimal solution and can effectively optimize the system parameters, but suffers from premature convergence and insufficient local search capability. However, in order to improve the global and local search capability and to alleviate the premature convergence problem of the PSO algorithm, this paper improves the commonly used PSO algorithm in solving the reference value of the optimal compensation model of the railroad power regulator.
In summary, in order to make the inter-phase braking energy transfer reasonable and accurate, and improve power quality, it is necessary to improve the compensation model of the RPC and the calculation algorithm of the reference value of compensation power. Therefore, this paper first gives the topology of the traction PV power generation system based on the back-to-back RPC, and then establishes the existing integrated energy management strategy considering the braking energy transfer according to the literature [15]. Then, the back-to-back converter compensation model with power quality index parameter constraints is established, followed by the improvement in the particle swarm algorithm for solving the RPC compensation power reference value. Finally, the feasibility of the optimized compensation model and the optimized RPC compensation power reference value solving algorithm are simulated and analyzed based on various typical operating conditions.
2. System Structure and Energy Flow Patterns
2.1. System Topology
The main topology of the PV traction system is shown in Figure 1, which mainly consists of a PV generator, back-to-back converter, DC/DC converter, and each transformer. Firstly, the 220 kV power system is connected to the two-phase traction network through the v/v wiring traction transformer. Then, the back-to-back converter adopts two sets of single-phase four-quadrant converters, with the DC side connected to the common capacitor, and the AC side filtered and then connected to both sides of the 27.5 kV traction feeder through the step-down transformer to form a symmetrical back-to-back structure. Finally, the photovoltaic unit is connected to the common capacitor through a DC/DC converter. The control unit coordinates and controls each converter according to the real-time operating conditions to realize the dynamic distribution of PV energy between the two phases on the one hand to ensure the precise consumption of PV energy, and on the other hand, to realize the purpose of efficient utilization of energy by controlling the braking energy between phases and the reasonable transfer of asymmetric traction active power.
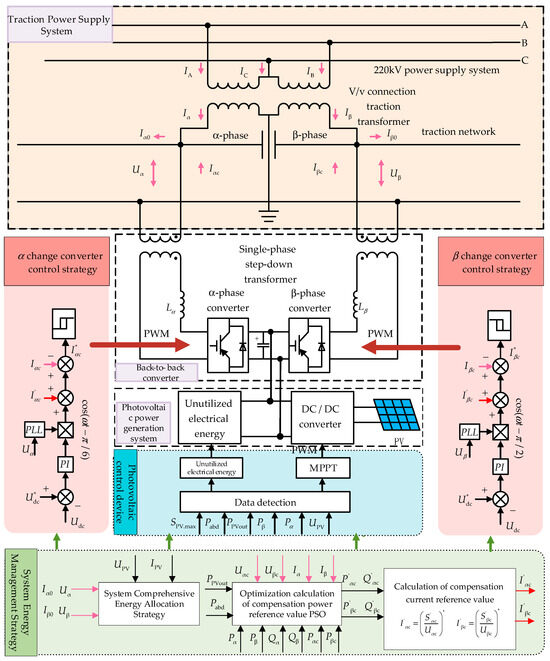
Figure 1.
Photovoltaic power generation system for traction. The black arrow refers to the control orientation inside the control strategy. The pink arrows refer to the parameters of the traction power supply system (input to the control of the converter and to the energy management module). The red arrows are the reference values (for input into the converter) obtained from the integrated energy control of the system, the optimization of the compensation model and the current transformer. The green arrows are the inputs to the system from the integrated energy management module. The brown arrow is the PWM modulation.
2.2. Control System Structure
As shown in Figure 1, the control part of the PV power generation system for traction mainly consists of the main system controller, the PV unit controller, and the -phase/-phase converter controller. In the main controller of the system, based on the detected real-time voltage and current data of the traction side/photovoltaic side, the integrated energy management module of the system firstly calculates the traction load power / and the target output value of the photovoltaic power generation unit to the outside world, , and the unused power . Then, using the back-to-back converter optimization compensation model, the PSO calculation is used to obtain the compensation power reference value () of the phase converter, and the compensation current reference value is obtained by using the compensation current calculation equation.
Among the MPPT control in the PV power unit controller, PV duty cycle perturbation control is used in this paper. The -phase/-phase converter coordinates the control of the back-to-back converter and the two power arms to carry out reasonable power transfer according to the reference value of the compensation current, realizing the comprehensive compensation of power quality and ensuring a high comprehensive utilization rate of energy. The two converters adopt a voltage–current double closed-loop system, and the DC side voltage is coordinated and controlled by the two converters. Due to the phase difference between the two phases, the converter in this paper adopts the current hysteresis loop comparative control method to ensure that it has faster dynamic response characteristics.
2.3. System Energy Flow Patterns
Four typical working conditions’ energy flow patterns of traction PV power generation systems under the action of PV units are analyzed as follows. Since the active energy , output from the traction side is mainly used to compensate for the residual deficit of energy in the left and right phase supply arms, it can be treated negligibly in the analysis.
As shown in Figure 2a, the two power supply arms are in the traction state, the PV unit can dynamically allocate the load energy according to the real-time monitoring of the two power supply arms, and if there is still residual energy, it will be processed through the recovery unit. State of single-phase-traction, single-phase braking: The -phase supply arm is set as the traction load and the -phase supply arm is set as the braking load. As shown in Figure 2b, the system as a whole is in a state of traction. In this case, the braking energy of the A-phase power supply arm can provide electrical energy for the B-phase power supply arm, the shortfall is supplemented by solar energy, and the remaining solar energy is recovered by the energy recovery unit. As shown in Figure 2c, the system as a whole is in a braked state. In this case, only the traction load power from the -phase supply arm provides the residual power for the -phase supply arm. The electricity generated by the photovoltaic unit is processed through an energy recovery unit. As shown in Figure 2d, the two power supply arms are in braking mode, and it is set that the braking load of the -phase power supply arm is smaller than that of the -phase power supply arm, at which time the -phase power supply arm transfers braking energy to the -phase power supply arm.
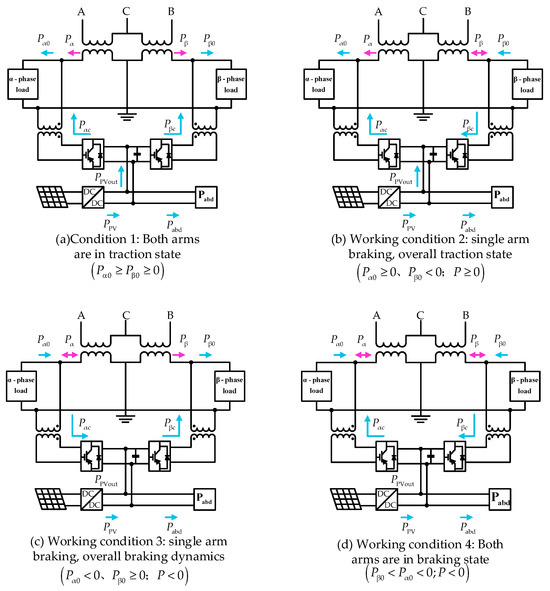
Figure 2.
Energy control mode of the system during the effective output period of photovoltaics. The blue arrow in the figure refers to the energy flow, the red arrow refers to the system energy (mainly involved in the balance of power transfer, the analysis of the simplification of its treatment).
Corresponding to the four typical working conditions, in the PV not-out-of-power time period (PV power generation unit is in idle mode), the PV power generation unit no longer produces PV power, constrained in the converter compensation power only by the back-to-back converter involved in the control of the two arms of the asymmetry of the traction power of the reasonable transfer, in order to reduce the degree of load imbalance between the phases.
In this case, the traction load of the -phase supply arm is set to be greater than the traction load of the -phase supply arm according to the PV no-output period shown in Figure 2a. Then, under the converter capacity constraint (as in Equation (1)), the active energy will be transferred from the -phase supply arm, which has a smaller traction load, to the -phase supply arm.
As shown in Figure 2b during the PV no-output period, the braking load energy of the -phase power supply arm is first transferred to the -phase power supply arm, and if the transferred braking energy is not sufficient to improve the inter-phase load imbalance, the -phase power supply arm also transfers part of the active power to the -phase power supply arm, subject to the constraints of Equation (1). For the two cases shown in Figure 2c,d, the energy transfer pattern in the PV non-power period is similar to that in the PV power period, where the two phases transfer the braking energy between the phases under the capacity constraint of the converter. Similarly, other similar working conditions can be analyzed.
Combined with the operating analysis of the working conditions, the energy management strategy is developed according to the literature [15], and the target output value and the unutilized PV power of the PV power unit’s external output are obtained.
3. Optimized Compensation Model
There are many power quality issues due to PV access to PV power systems for traction use. In order to alleviate such problems, this paper focuses on considering some optimized compensation of negative sequence current/power factor/reactive power in the traction power supply system. The compensation principle is shown in the literature [23]. It is not repeated in this paper.
3.1. Optimizing the Objective Function
Given that the back-to-back converter only needs to achieve the optimization of power quality compensation, under the premise of ensuring the normal power supply of PV power generation units, its optimization objective is to maximize instantaneous power factor A on the system side after PV access, and minimize negative sequence current B. The parameters are pre-neutralized in order to avoid the influence of the order of magnitude on the optimization results, as shown in Equation (2).
The RPC compensation power optimization objective is shown in Equation (3)
In Equation (2), is the maximum negative sequence current corresponding to the three-phase voltage imbalance limit on the system side, which is used as the reference value for normalization, is the instantaneous power factor on the system side after the PV is connected, and is the negative sequence current. In Equation (3), min P is the minimum value of the RPC compensated power, and and are the -phase-converter-compensated power and the -phase-converter-compensated power, respectively.
3.2. Constraint Condition
① Active constraint:
② Three-phase voltage unbalance constraints:
where is the rated line voltage on the three-phase grid side and is the short-circuit capacity of the power supply.
③ -phase/-phase converter capacity constraints:
where and are the maximum capacities of the -phase/-phase converter, and are the active powers compensated by the converter, and and are the reactive powers compensated by the converter, respectively.
3.3. Relationship between Power Quality Parameters and Converter Compensation Power
① Before PV connection, the system negative sequence current is
The negative sequence current of the system after PV connection is
Note that
② Before PV access, the system power factor is
After PV access, the system power factor is
Note that
4. Compensated Power Reference PSO Algorithm Improvement
- (1)
- Import of real-time data from the traction/photovoltaic side: voltage and current are detected in real-time by the -phase/-phase power supply arms (, , , ), active and reactive power is output from the two power supply arms (, , , ), compensated power from the two-phase converter (, , , ) is detected in real-time, active power is output from the photovoltaic unit to the two-phase converter , and the corresponding power reference value is obtained from the energy management unit.
- (2)
- Initializing the particle population: set the population size m and iteration number n, create an array of particle structures, randomly initialize the particle position x, randomly initialize the particle velocity v, initialize the individual particle optimal solution position pbest to infinity, and initialize the individual particle optimal position to its initial position. Initialize the group optimal position gbest.
- (3)
- Entering the PSO main loop introduces dynamically adjusted inertia weights A, dynamically adjusted self-awareness factors B, and social factors C. The formulas introduced are as follows:Dynamic weighting is 0.9~0.4Self-awareness factor is 2~2.5Social factor is 2~2.5.
The improved PSO algorithm in this paper introduces dynamically adjusted inertia weights and learning factors. At the beginning of the iteration, the inertia weights are larger to encourage global search, and the learning factor is smaller to avoid falling into the local optimum too quickly. As the number of iterations increases, the inertia weights decrease to encourage local search, and the learning factor increases to encourage the particles to search toward the individual optimum and global optimum, which is a strategy that helps to balance the needs of global search and local search.
- (4)
- Calculate particle fitness f according to the objective function in Section 3.1.
- (5)
- Update the current optimal position of the particle and the optimal position of the group according to the fitness. If the value of the current position function is less than the individual optimal position, then update the individual optimal position; if the value of the current position function is less than the global optimal, then update the global optimal position.
- (6)
- Update the velocity and position of the particles in conjunction with the particle iteration formula according to the constraints given in Section 3.2. The particle iteration formula is as follows:where is the dth dimensional component of the flight velocity vector of particle i in the kth iteration; is the dth dimensional component of the position vector of particle i in the kth iteration; and are the individual and population learning factors, respectively; and are independent random numbers with values in the range [0, 1]; and is the inertia weight.
- (7)
- When the maximum number of iterations is reached, the improved particle swarm algorithm iteration is exited. At this point, the optimal compensation power reference is converted to a current reference.
5. Simulation Results
In order to verify the effectiveness of the optimization control method proposed in this paper, a joint simulation model of the PV power generation system for traction as shown in Figure 1 is constructed, and the main system parameters are shown in Table 1. The rectifier merging time into the traction network is set to 0.2 s. Standard test conditions (temperature , irradiance ) are used for the external operating conditions. In order to enable the traction load to realize arbitrary time period waveform reproduction under preset working conditions, a power-following load model is adopted in this paper. Considering that the PV installed relative to the traction load is small, in the preset two-arm operation conditions, in order to facilitate the observation of the first preset smaller load values, comparative analysis of the algorithm before and after the improvement in the active reactive power situation is carried out, as well as comparative analysis of the system before and after the control of the relevant power quality changes.

Table 1.
Parameters of mnemonic major system.
5.1. Active Compensation Energy Simulation
Based on Figure 2, during the effective output period of the photovoltaic system, four typical operating conditions are selected for analysis. The back-to-back converter is set to standby mode before 0.2 s and starts integrating into the traction network after 0.2 s. And after being integrated into the traction network, the photovoltaic energy is almost evenly transmitted to both arms without the control strategy. That is, both -phase and -phase inverters externally output 0.5 WM. The analysis after adding control strategies is carried out in the following text. , , and are all approximate values, and the black curve represents the simulation effect of the PSO algorithm, while the colored curve represents the simulation effect of the improved PSO algorithm.
When the PV unit is out of power, in the absence of a control strategy, the PV power is nearly averaged to deliver active power to both arms, i.e., 0.5 MW. When the PV unit is not producing power, in the absence of a control strategy, both phases of the converter are in standby mode, i.e., the active output is 0 MW. Based on the four preset typical working conditions, Figure 3 shows the active energy transfer diagram under the condition that the PV unit is active, and Figure 4 shows the active energy transfer diagram when the PV unit is not active. , , and in the figure are approximations, the black curve is the simulation effect of the PSO algorithm, and the color curve is the simulation effect of the improved PSO algorithm.
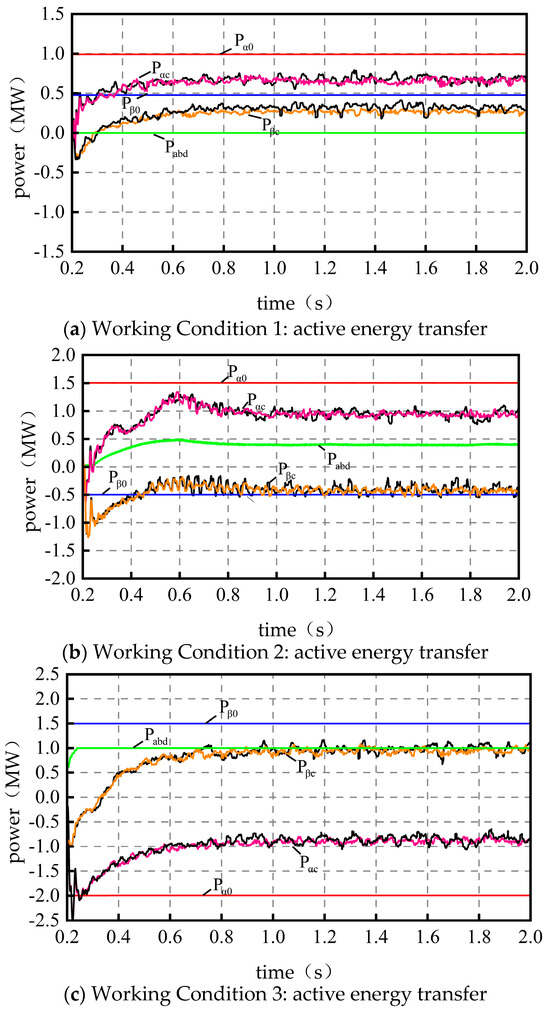
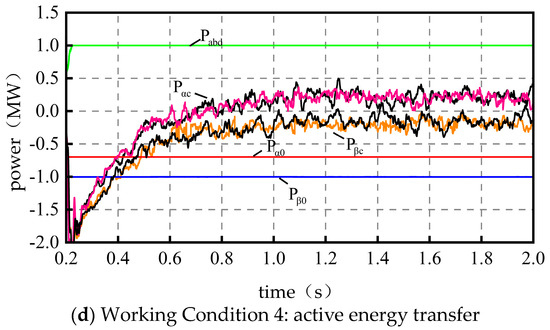
Figure 3.
Photo-voltaic output.
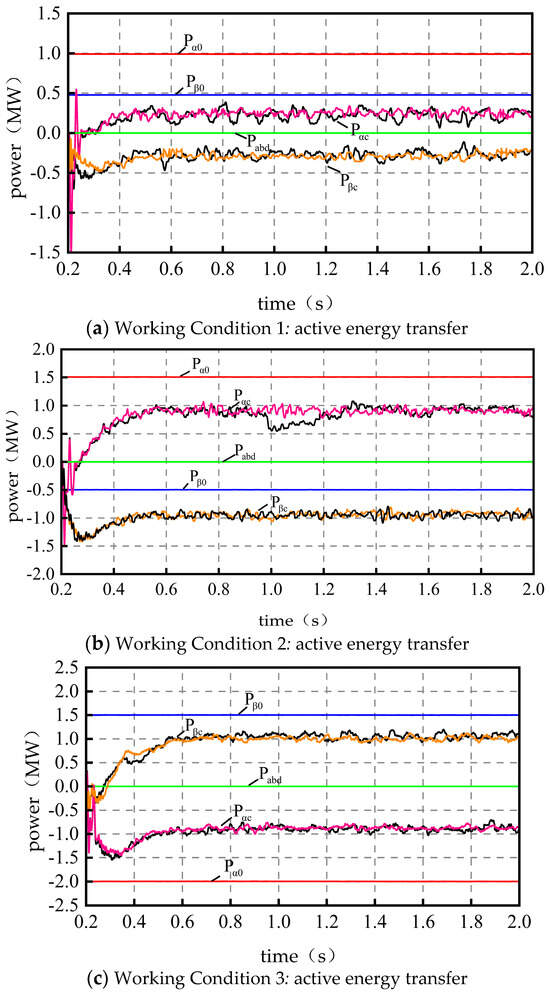
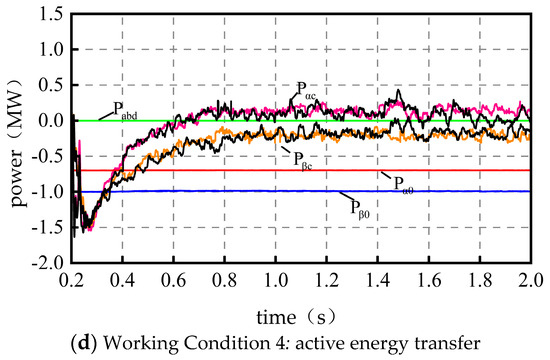
Figure 4.
No-output from PV.
- (1)
- ① Both arms are in a traction state. The -phase traction load power is set to and the -phase traction load power is set to . The simulation results are shown in Figure 3a. The -phase converter is able to effectively track the load variations of both arms, i.e., it actively distributes more PV power to the -phase arm with a larger load, and after the stabilization of and in the figure, the unutilized PV power, , basically satisfies the energy transfer relationship (the power difference is due to the system losses and the measurement error). ② Single-arm-braking single-arm traction and the overall traction state. and are set. The simulation results are shown in Figure 3b. The -phase braking power priority from the -phase converter transfer is (in this case, all -phase braking power is transferred, and excess energy is transferred from the grid to supplement) because the transfer of braking energy is still not enough to supply energy for the -phase traction loads, and the insufficient part of the photovoltaic power generation unit with the supply in this case ()—that is, the photovoltaic unit to provide a 0.51 MW of electricity, and —basically meets the energy transfer relationship. ③ Single-arm-braking single-arm traction and the overall braking dynamic. and are set. The simulation results are shown in Figure 3c. The -phase braking power is transferred from the -phase converter to . The PV power unit no longer transmits power to the outside world, i.e., (the power difference is caused by the system loss and the measurement error) and . ④ Both arms are in braking mode. and are set. The simulation results are shown in Figure 3d. The photovoltaic unit no longer delivers power to the traction load, and only the -phase braking power is transferred through the back-to-back converter to reduce the asymmetry of the two arms, i.e., and .
- (2)
- ① Both arms are in the traction state, and the simulation results are shown in Figure 4a. The back-to-back converter starts to merge into the traction network at 0.2 s. and , i.e., part of the active power is transferred from the -phase traction feeder to the -phase through the back-to-back converter. ② Single-arm-braking single-arm traction and the overall traction state. The simulation results are shown in Figure 4b. and , that is, on the basis of the -phase, all braking energy is transferred to the -phase feeder in order to improve the inter-phase load imbalance, and part of the active power from the -phase feeder is then transferred to the -phase. ③ Single-arm-braking single-arm traction. The whole arm is in braking mode. The simulation results are shown in Figure 4c. and , i.e., the braking energy of phase is partially transferred to phase . ④ Both arms have braking dynamics and the simulation results are shown in Figure 4d. Only the -phase braking power is transferred through the back-to-back converter for energy transfer to minimize the asymmetry of loads in both arms, i.e., and .
- (3)
- The improved PSO algorithm for solving the reference value of compensated power converges better. This enables the RPC to obtain a more accurate and stable power reference value during the control process, which in turn enables the system to operate stably, and can effectively realize the dynamic distribution between PV power, traction load power, and unused power.
5.2. Reactive Compensation Energy Simulation
PV under conventional control strategies usually only outputs active power to the outside world, and if it is not an appropriate reactive power compensation, its access will degrade the traction power system power factor [13]. It is important to compensate the system reactive power under the constraints of the monthly average power limit of the power sector. The reactive power compensation also requires the RPC to be regulated, and further, the power reference value must be optimally calculated.
Before the system is controlled, both converters do not compensate reactive power externally, i.e., (). Based on the four typical operating conditions, Figure 5 shows the reactive power compensation diagram with the PV unit acting under the established control strategy, and Figure 6 shows the reactive power compensation diagram with the PV unit not acting under the established control strategy. Similar to the active simulation diagram, and in the figure are approximate values, the black curve is the simulation effect of the PSO algorithm, and the color curve is the simulation effect of the improved PSO algorithm. Reactive power metering is performed through reverse-feeding and positive-counting.
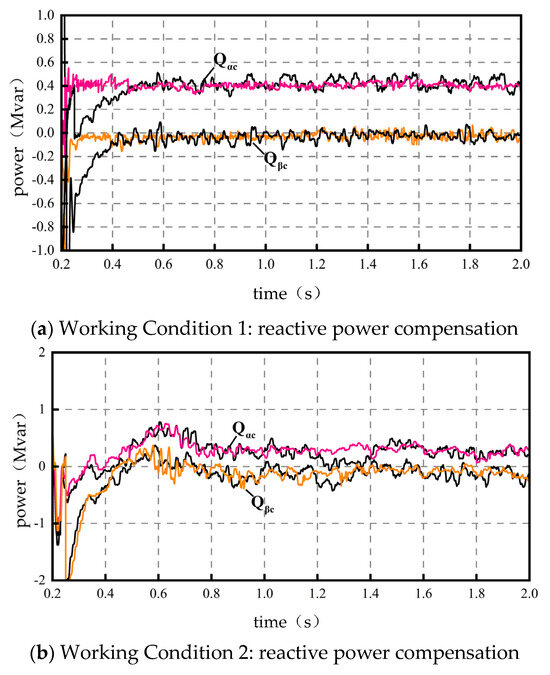
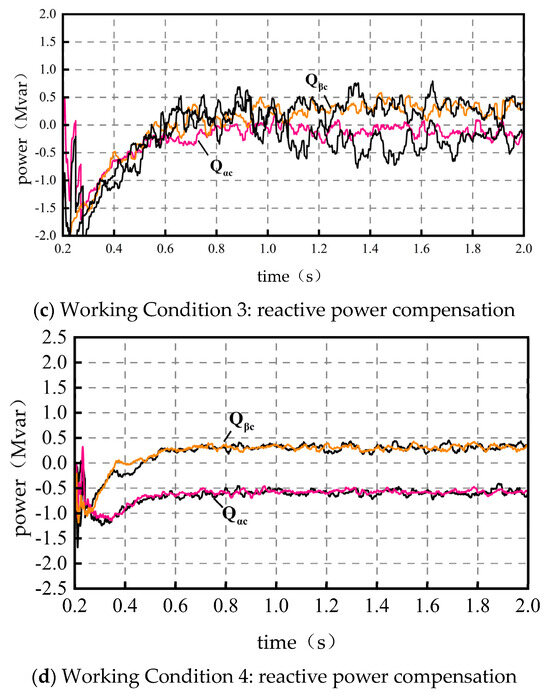
Figure 5.
Photo-voltaic output.
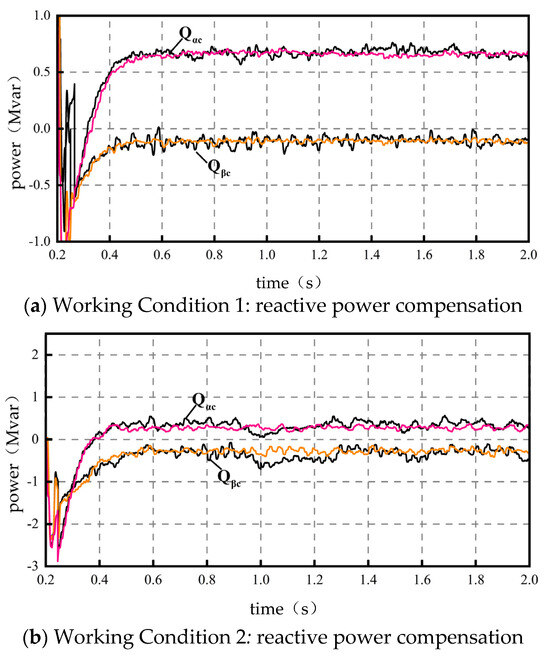
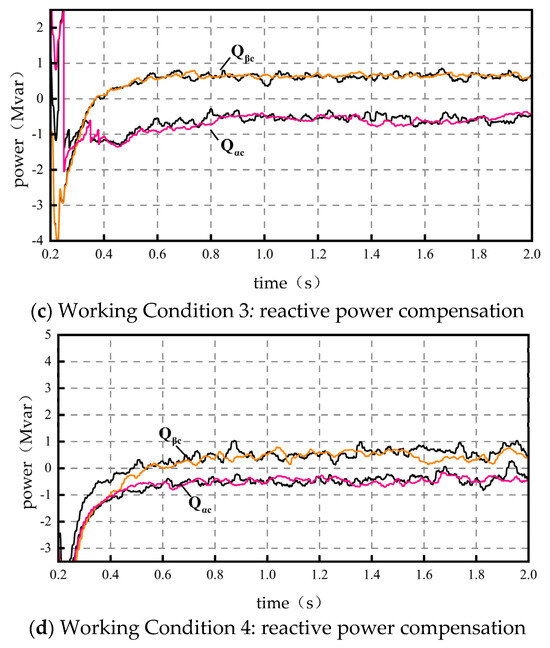
Figure 6.
No-output from PV.
- (1)
- Corresponds to Section 5.1 in the case of PV output. Case 1: Two-phase converter with some reactive power compensation. and . ② Condition 2: Phase load is in the braking state, which is equivalent to emitting reactive power. In this case, the phase converter absorbs reactive power , realizing the function of reactive power compensation. In this case, . ③ Condition 3: and . Negative values are analyzed as in Condition 2. ④ Condition 4: and .
- (2)
- In the case of no PV output, Case 1: and . Case 2: and . Case 3: and . Case 4: and . Meanwhile, the improved PSO algorithm results in better convergence of the solution.
Combining the data above, the back-to-back converter provides some reactive power compensation relative to the no-optimization control reactive power case (). This in turn leads to an improvement in power factor. The following simulation diagrams can be seen, and the optimization of the PSO algorithm leads to a more stable convergence of the reactive power compensated by the RPC.
5.3. Power Factor and Negative Sequence Current Change Simulation
Based on the four preset typical working conditions, it is set that the system has no control strategy before 0.7 s, and the system is controlled by the strategy after 0.7 s. Figure 7 and Figure 8 show the relevant power quality changes on the system side before and after joining the control, respectively. The red curve is the change in system power factor, and the blue curve is the change in system negative sequence current.
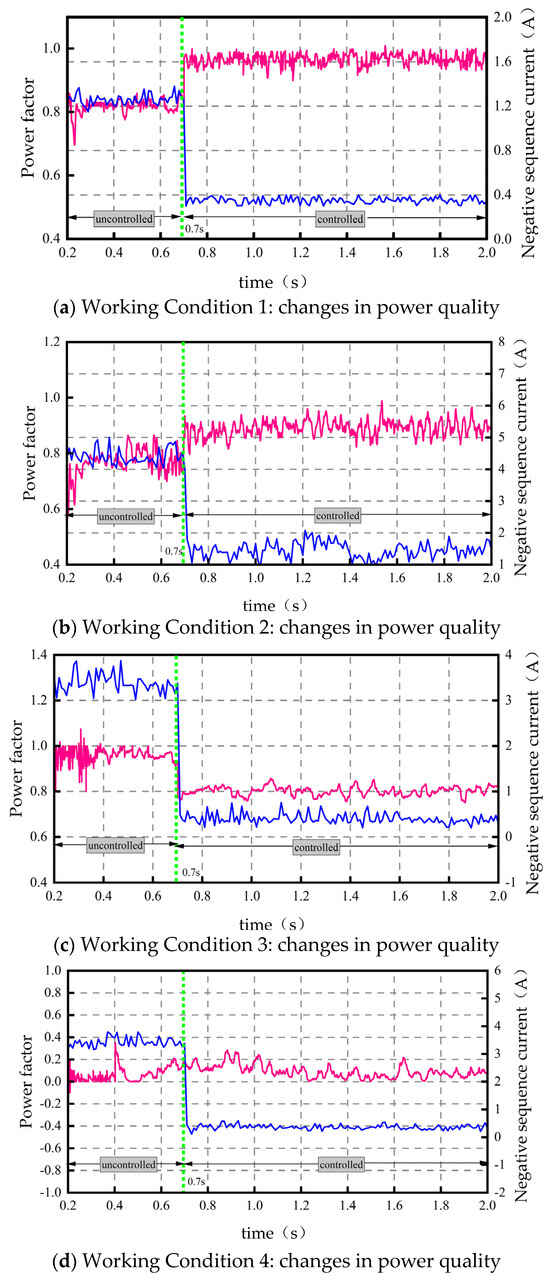
Figure 7.
Photo-voltaic output.
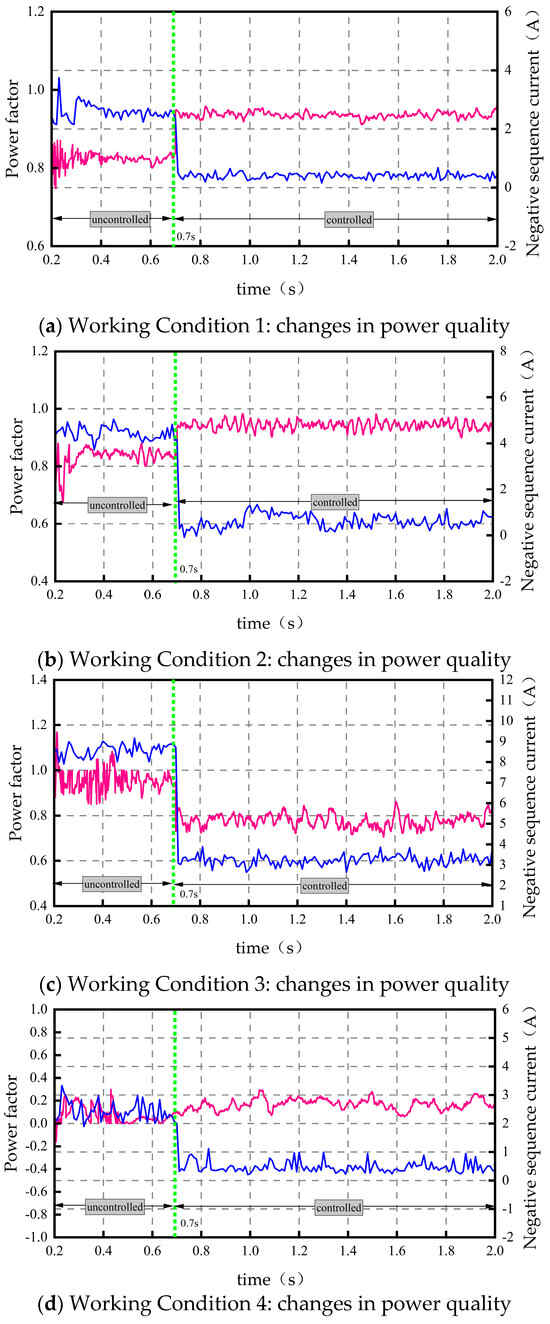
Figure 8.
No-output from PV.
Figure 7 shows the power quality changes (power factor and negative sequence current) before and after joining the control of the four working conditions under the conditions of the role of the PV unit specific changes combined with the following table.
The negative sequence current and power factor variation data of Figure 7 and Figure 8 are combined to develop the following tables (Table 2, Table 3, Table 4 and Table 5). And the data in the table are approximate.
Table 2.
Change in power factor.
Table 3.
Change in power factor.
Table 4.
Change in negative sequence current.
Table 5.
Change in negative sequence current.
Figure 8 kind of graph shows the variation of power quality (negative sequence current and power factor) before and after joining the control for the four working conditions under the condition that the photovoltaic unit does not function. Specific changes are summarized in Table 4 and Table 5.
For both Case 1 and Case 2 (with and without PV action), the power factor of the system improves due to the compensation of reactive power. Due to the dynamic distribution of the PV power, for the power system side, this corresponds to a reduction in the load imbalance in both arms and consequently to a reduction in the negative sequence currents. The total power quality improvement is good. This increase in power factor contributes to the stability of the power system.
This can be seen by combining the active, reactive, and power factor simulation plots for Case 3 (photovoltaic action and photovoltaic inactivity): Due to the braking power transfer, and directly in the traction phase for the secondary consumption, the power system side is equivalent, further reducing the active output. However, at the same time, the converter for the reactive power compensation is limited by the converter compensation capacity once the degree of active decline is greater than the degree of reactive power compensation. In other words, there will be an instantaneous power factor that cannot be effectively improved.
PF = 0 before and after the optimization control of working condition 4 (photovoltaic action and photovoltaic inactivity), which is caused by the back-feeding non-counting of the active part in the measurement of PF and the limited degree of reactive power compensation of the converter. The above changes can still effectively reduce the negative sequence current on the system side, improve the power factor, and achieve the purpose of improving the power quality on the traction side.
With the above simulation graphs and data change table, it can be seen that the optimized system improves power quality in general (the power factor increases and the negative sequence currents decrease).
A summary of the above results follows. From the perspective of comprehensive energy utilization, through the optimization of the compensation model and power reference value, and then through the control of the RPC, to achieve the near-consumption of PV power, there should be more real-time, stable, and reasonable use of inter-phase braking energy so that the system has a certain amount of reactive power compensation capacity, to improve the comprehensive energy utilization of the system. From the perspective of improving the quality of power analysis, there is an overall improvement in the system’s power factor. From the perspective of power quality improvement, the overall power factor of the system is improved, the negative sequence current is reduced, and the effect of the improvement in system power quality is good. From the analysis of improved models and algorithms, the system constraints are strengthened to improve the power quality of the system and the algorithm is improved to improve the convergence of the results of the calculation of the power reference value. From the analysis of the perspective of long-term operation, based on the stable reference value, the RPC can stably compensate for the inter-system energy flow, which in turn improves the service life and capacity of RPC utilization.
However, this paper considers neither the PV installed capacity nor the optimization problem of RPC capacity, so this aspect will be addressed in future research.
6. Conclusions
In order to solve the issues of the single complicated railroad power supply and regenerative braking energy waste, and improve the system power quality, in this paper, the photovoltaic system and traction system are first connected through the back-to-back converter, the compensation model of the back-to-back converter is optimized according to the total system energy management strategy, and the compensation model constrains the power factor and negative sequence current, which then improves the power quality of the system. And the calculation algorithm for finding the power reference value is improved. Then, the converter dynamically allocates the braking energy between phases according to the reference value through double closed-loop control. The comprehensive energy utilization efficiency and economic benefits of the system are further improved.
Synthesizing the results of the above analysis leads to the following conclusion. The improved optimization model and algorithm in this paper improve the real-time convergence of the power reference value calculation, which in turn enables the RPC to better dynamically allocate the PV power according to the reference value and realize inter-phase braking energy transfer. The back-to-back optimization compensation model can effectively improve the system and average power factor, reduce its negative sequence current, and achieve the purpose of improving the power quality of the traction side on a long time scale.
Limited to the length of this paper, this paper focuses on the analysis of the RPC compensation model and algorithm. In the practical application, it should be combined with meteorological resources, system economics, and other factors to rationally optimize the configuration of the installed capacity of photovoltaic power generation units and improve the comprehensive benefits of converters, which will also be the focus of future research.
In order to build a low-carbon and conservation-oriented society, it is of great significance to design the relevant control work between railroads and utilize new energy generation in the future development of railroads.
- Idea: In order to realize access to the traction power supply system of the photovoltaic unit near the consumption, take into account the power quality improvement effect of the traction power supply system as well as train regenerative braking energy recycling in real time. This paper designs a traction photovoltaic power generation system in the railroad power regulator as a breakthrough. The railroad power regulator through the system energy control module is calculated using the reference value to act as a coordinated distributed power supply and traction system energy transfer capacity, in order to improve the convergence of the system’s compensation power reference value more. This paper begins to optimize the RPC compensation model and PSO algorithm given in the original literature, so that, through a more accurate reference value, the braking energy is better recycled using photovoltaic power, in addition to the compensation model achieving a certain degree of power quality improvement effect.
- The chapters of this paper contain the following: abstract; 1. introduction; 2. topology, control structure, and energy flow mode of PV power generation system for traction; 3. the optimized railroad power regulator compensation model; 4. the improvement in the PSO algorithm; 5. simulation results; and 6. conclusions. Since the energy management strategy is specified in the literature [13], energy management is not included as a section in the article. I go over the strategy in a brief and concise manner in Section 2 (the added parts are marked in yellow).
- Compared with the previous literature, this paper optimizes the compensation model and improves the PSO algorithm to improve the convergence of the power reference. In this way, the railroad power regulator can realize the energy flow, regenerative braking energy transfer between phases, and PV power dissipation more accurately in real time according to the reference value. It also improves the negative sequence current and power factor.
Author Contributions
Software, H.Y.; Data curation, H.Z.; Writing—original draft, Y.G.; Writing—review & editing, Y.G.; Supervision, C.D. All authors have read and agreed to the published version of the manuscript.
Funding
This research received no external funding.
Conflicts of Interest
The authors declare no conflict of interest.
References
- Wu, X.; Li, Y.; Liu, J. Comparative analysis of railway energy consumption between China and other countries. Sci. Technol. Rev. 2016, 34, 313–317. [Google Scholar]
- Ren, J.; Zhang, Q.; Liu, F. Analysis of factors affecting traction energy consumption of electric multiple unit trains based on data mining. J. Clean. Prod. 2020, 262, 121374. [Google Scholar] [CrossRef]
- Zhang, H.; Jia, L.; Wang, L.; Xu, X. Energy consumption optimization of train operation for railway systems: Algorithm development and real-world case study. J. Clean. Prod. 2019, 214, 1024–1037. [Google Scholar] [CrossRef]
- Chen, W.; Wang, X.; Li, Q.; Han, Y.; Wang, W. Review on the development status of PV power station accessing to traction power supply system for rail transit. Power Syst. Technol. 2019, 43, 3663–3670. (In Chinese) [Google Scholar]
- Dent, C.M. China’s renewable energy development: Policy, industry and business perspectives. Asia Pac. Bus. Rev. 2015, 21, 26–43. [Google Scholar] [CrossRef]
- Chen, J.; Zhao, Y.; Wang, M.; Wang, K.; Huang, Y.; Xu, Z. Power Sharing and Storage-Based Regenerative Braking Energy Utilization for Sectioning Post in Electrified Railways. IEEE Trans. Transp. Electrif. 2023. [Google Scholar] [CrossRef]
- Wu, M.; Wang, W.; Deng, W.; Chen, H.; Dai, C.; Chen, W. Back-to-back PV generation system for electrified railway and its control strategy. In Proceedings of the 2017 IEEE Transportation Electrification Conference and Expo, Asia-Pacific (ITEC Asia-Pacific), Harbin, China, 7–10 August 2017; pp. 1–6. [Google Scholar]
- Shu, Z.; Xie, S.; Li, Q. Single-phase back-to-back converter for active power balancing, reactive power compensation, and harmonic filtering in traction power system. IEEE Trans. Power Electron. 2010, 26, 334–343. [Google Scholar] [CrossRef]
- Ma, F.; Luo, A.; Xu, X.; Xiao, H.; Wu, C.; Wang, W. A simplified power conditioner based on half-bridge converter for high-speed railway system. IEEE Trans. Ind. Electron. 2013, 60, 728–738. [Google Scholar] [CrossRef]
- Babu, A.; Sreejaya, P. Reduced rating railway power conditioners in co-phase traction and traditional traction system. In Proceedings of the 2015 International Conference on Control Communication & Computing India, Trivandrum, India, 19–21 November 2015; pp. 291–296. [Google Scholar]
- Perin, I.; Nussey, P.F.; Cella, U.M.; Tran, T.V.; Walker, G.R. Application of power electronics in improving power quality and supply efficiency of AC traction networks. In Proceedings of the 2015 IEEE 11th International Conference on Power Electronics and Drive Systems, Sydney, NSW, Australia, 9–12 June 2015; pp. 1086–1094. [Google Scholar]
- Wu, M.; Dai, C.; Deng, W.L.; Gao, Y.; Chen, H.B.; Chen, W. Back-to-back PV generation system and its control strategy for electrified railway. Power Syst. Technol. 2018, 2, 541–547. [Google Scholar]
- Wu, M.; Gao, Y.; Deng, W.; Dai, C.; Chen, W. Study of PV generation application on AC powered traction system. In Proceedings of the 2017 Chinese Automation Congress (CAC), Jinan, China, 20–22 October 2017; pp. 1641–1646. [Google Scholar]
- Deng, W.; Dai, C.; Guo, A.; Shi, F.; Han, C.; Wu, M.; Xue, C. Harmonic interaction influence of PV generation system accessing to traction power supply system and its adaptability analysis. Electr. Power Autom. Equip. 2019, 39, 181–189. [Google Scholar]
- Deng, W.; Dai, C.; Zhang, H.; Zhang, L.; Li, M.; Wu, Z. Research on comprehensive optimization control method for traction photovoltaic generation system of complex electrified railway. Proc. CSEE 2020, 40, 5849–5865. (In Chinese) [Google Scholar]
- Roudsari, H.M.; Jalilian, A.; Jamali, S. Flexible fractional compensating mode for railway static power conditioner in a V/v traction power supply system. IEEE Trans. Ind. Electron. 2018, 65, 7963–7974. [Google Scholar] [CrossRef]
- Luo, P.; Huang, Q.; Li, S.; Chen, Y.; Zhou, G.; Luo, L.; Zhang, Z. Negative Sequence Current and Reactive Power Comprehensive Optimizing Control of V/v Connected Traction Substations. IEEE Trans. Power Electron. 2017, 31, 200–212. [Google Scholar]
- Ma, Q.; Tan, L.; Luo, P. Optimal negative-sequence compensation of hybrid power-quality management system for v/v traction substation. Electr. Power Autom. Equip. 2017, 37, 128–132. [Google Scholar]
- Zhang, D.; Zhang, Z.; Wang, W.; Yang, Y. Negative sequence current optimizing control based on railway static power conditioner in V/v traction power supply system. IEEE Trans. Power Electron. 2016, 31, 200–212. [Google Scholar] [CrossRef]
- Cao, Y.; Ma, L.; Zhang, Y. Application of fuzzy predictive control technology in automatic train operation. Clust. Comput. 2019, 22, 14135–14144. [Google Scholar] [CrossRef]
- Chellaswamy, C.; Krishnasamy, M.; Balaji, L.; Dhanalakshmi, A.; Ramesh, R. Optimized railway track health monitoring system based on dynamic differential evolution algorithm. Measurement 2020, 152, 107332. [Google Scholar] [CrossRef]
- Jiang, Y.; Wang, W.; Jiang, X.; Zhao, L.; Cao, Y. Capacity optimization of railway static power conditioner based on particle swarm optimization. Power Electron. 2019, 53, 31–33. (In Chinese) [Google Scholar]
- Deng, W.; Dai, C.; Chen, W.; Zhang, H. Research progress of railway power conditioner. CSEE 2020, 40, 4640–4655. (In Chinese) [Google Scholar]
Disclaimer/Publisher’s Note: The statements, opinions and data contained in all publications are solely those of the individual author(s) and contributor(s) and not of MDPI and/or the editor(s). MDPI and/or the editor(s) disclaim responsibility for any injury to people or property resulting from any ideas, methods, instructions or products referred to in the content. |
© 2023 by the authors. Licensee MDPI, Basel, Switzerland. This article is an open access article distributed under the terms and conditions of the Creative Commons Attribution (CC BY) license (https://creativecommons.org/licenses/by/4.0/).