Article

Analysis of the Impact of Photovoltaic Curtain Walls Replacing Glass Curtain Walls on the Whole Life Cycle Carbon Emission of Public Buildings Based on BIM Modeling Study

1
Engineering Laboratory for Energy System Process Conversion & Emission Control Technology of Jiangsu Province, School of Energy and Mechanical Engineering, Nanjing Normal University, Nanjing 210023, China
2
Zhenjiang Institute for Innovation and Development, Nanjing Normal University, Zhenjiang 212016, China
*
Author to whom correspondence should be addressed.
Energies 2023, 16(20), 7030; https://doi.org/10.3390/en16207030
Submission received: 7 September 2023 / Revised: 6 October 2023 / Accepted: 8 October 2023 / Published: 10 October 2023
(This article belongs to the Section B: Energy and Environment)

Abstract

:
The construction industry plays a crucial role in achieving global carbon neutrality. The purpose of this study is to explore the application of photovoltaic curtain walls in building models and analyze their impact on carbon emissions in order to find the best adaptation method that combines economy and carbon reduction. Through a carbon emissions calculation and economic analysis of replacing photovoltaic curtain walls on a large public building in Zhenjiang, China, the results showed that after replacing glass curtain walls with photovoltaic curtain walls, the carbon emissions during the construction operation stage decreased by 30.74%, but the carbon emissions during the production and transportation stage of building materials increased by 10.48%. The carbon emissions throughout the entire life cycle of the building have been reduced by 20.99%. This indicates that photovoltaic curtain wall technology has the potential to reduce building carbon emissions. Further promoting the development of production technology and sales routes for photovoltaic curtain walls and accelerating the improvement of carbon trading systems can further improve the carbon emission reduction effect of buildings. This study provides practical reference for public buildings in similar areas and guidance for reducing carbon emissions in the future.

1. Introduction

Due to the ongoing escalation of global climate change, the greenhouse effect is intensifying, leading to a host of environmental challenges. Extensive research conducted by the IPCC confirms that human activities are responsible for the surge in carbon emissions, which is the primary driver of global temperature elevation. As one of the three major energy-consuming sectors, the construction industry assumes a critical role in the pursuit of global carbon neutrality [1]. The United Nations Environment Program (UNEP) released the 2021 Global Construction Industry Status Report, revealing that in 2020, final energy consumption related to construction and operation represented 36% of global energy usage. Furthermore, the global construction industry and energy-related carbon dioxide emissions accounted for 37% of overall emissions during the same period [2]. China, as the largest greenhouse gas emitter worldwide, released more than 11.9 billion tons of carbon dioxide in 2021, accounting for 33% of global carbon dioxide emissions [3]. China has explicitly announced its objective of attaining carbon peak by 2030 and carbon neutrality by 2060 in an effort to gradually achieve net-zero carbon dioxide emissions [4]. According to the 2023 China Building Energy Efficiency Annual Development Research Report, the carbon emissions generated from building operations in China reached 2.2 billion tons of CO2 in 2021. Additionally, the total carbon emissions associated with civil building construction amounted to 1.6 billion tons of CO2, accounting for 38% of the overall emissions [5]. The construction industry in China holds immense potential and plays a pivotal role in realizing the country’s carbon neutrality objectives. It is also instrumental in meeting global targets for carbon emissions reduction [6]. Among all categories of buildings, public and commercial structures exhibit the highest potential for carbon emissions [7]. The life cycle assessment (LCA) of carbon emissions in buildings aims to address the global warming caused by greenhouse gas emissions by means of assessing the CO2 equivalent emissions throughout the entire life cycle of buildings [8]. Examining the comprehensive life cycle carbon emissions of public buildings holds significant importance in achieving the dual carbon objectives.
Presently, numerous studies focus on analyzing carbon emissions across the complete life cycle of buildings. Nevertheless, conducting a thorough assessment of full life cycle carbon emissions is a challenging and time-intensive endeavor. It demands extensive information for formulating a bill of quantities (BoQ) and determining the appropriate set of data for life cycle assessment [9]. Consequently, certain scholars have conducted research on streamlining the process of data collection for LCA [10,11]. The integration of building information model (BIM) and life cycle assessment (LCA) serves as a solution to overcome these challenges. It simplifies data collection and enhances the efficiency of LCA application by automating the creation of bill of quantities. The application of BIM in the entire life cycle of buildings has been recognized in some studies [12,13]. Antón et al. [14] highlighted the two powerful methods of BIM and LCA. Shafiq et al. [15] used BIM to conduct a carbon footprint assessment of a low rise office building in Malaysia. Peng [16] simplified the process of acquiring information and conducted carbon emissions calculations for the entire life cycle of buildings by employing Ecotect and BIM. Abanda et al. [17] introduced a BIM-based system designed to automate the calculation of carbon dioxide emissions for building carbon dioxide assessments. Yang et al. [18] put forward a BIM-based LCA methodology to investigate the carbon footprint of residential buildings, comparing greenhouse gas emissions across various stages and building materials. The operational stage constituted 69% of the total greenhouse gas emissions, whereas the production of building materials accounted for 24%. Bueno et al. [19] leveraged BIM and integrated it with existing applications like Autodesk Revit to develop a combined approach of life cycle assessment (LCA) and BIM for early design phase evaluation. Panteli et al. [20] provided a comprehensive overview of the applications of BIM in the realm of intelligent buildings and emphasized the significance of interoperability between BIM and LCA. Lu et al. [21] proposed a framework for carbon emission analysis that utilizes BIM and life cycle assessment. They validated this framework by conducting a case study on a hospital in Anhui Province, analyzing the carbon emission characteristics of hospital buildings throughout their life cycle. However, due to the varying levels of carbon emissions caused by different types of buildings [22], research on public buildings cannot be ignored.
In present times, the use of glass curtain walls in modern architecture has witnessed a surge, owing to the progress of urbanization. Glass curtain walls offer the benefits of being lighter in weight and possessing higher transparency levels [23]. Consequently, the substitution of conventional concrete walls with glass curtain walls can significantly reduce the overall weight of buildings and result in cost savings for basic engineering [24]. As a result, the use of glass curtain walls in buildings is becoming increasingly prevalent. Various countries have now established stricter guidelines for energy conservation and emission reduction. To reduce the carbon emissions of buildings, more and more research efforts are being directed towards photovoltaic curtain walls. Photovoltaic technology has the capability to generate cleaner and low-carbon energy [25]. The photovoltaic technology based on exterior walls improves the energy performance of buildings by converting solar energy into electricity, achieving dual functional integration of solar power generation and building curtain walls [26]. In addition, photovoltaic curtain walls also have good aesthetics and environmental friendliness, making them widely used in the construction field. Examples include colored solar panels in Denmark [27], Building-integrated Photovoltaics (BIPV) walls in Italy [28], and the Ekoviikki Sustainable City Project in Finland [29].
Currently, research on photovoltaic curtain walls is still in its early stages, primarily centered around the performance evaluation of such systems. Tang et al. [30] proposes innovative single- and dual-inlet ventilation PV curtain wall systems (SVPV and DVPV) to address overheating and save energy in air conditioning. Xiong et al. [31] develops a power model for Photovoltaic Curtain Wall Array (PVCWA) systems in building complexes and identifies optimal configurations for mitigating shading effects, providing valuable insights for the application of PVCWA systems in buildings. Tang et al. [32] proposed the Photovoltaic Double-Glazing Ventilated Curtain Wall (PV-DVF) system, which solves the problems of overheating and cold heat compensation, significantly saves electricity, and exhibits an excellent energy-saving performance. Fan et al. [33] evaluated the carbon emissions of photovoltaic curtain walls and found that orientation, position, inclination angle, shadow, and seasonal changes can affect emissions. However, their analysis did not consider the integration of these curtain walls with buildings. The applications of glass curtain walls and photovoltaic curtain walls in buildings are becoming increasingly common. BIM-based LCA is a method used to evaluate the carbon emissions of buildings throughout their life cycle. It enables the analysis and assessment of the carbon emissions from buildings.
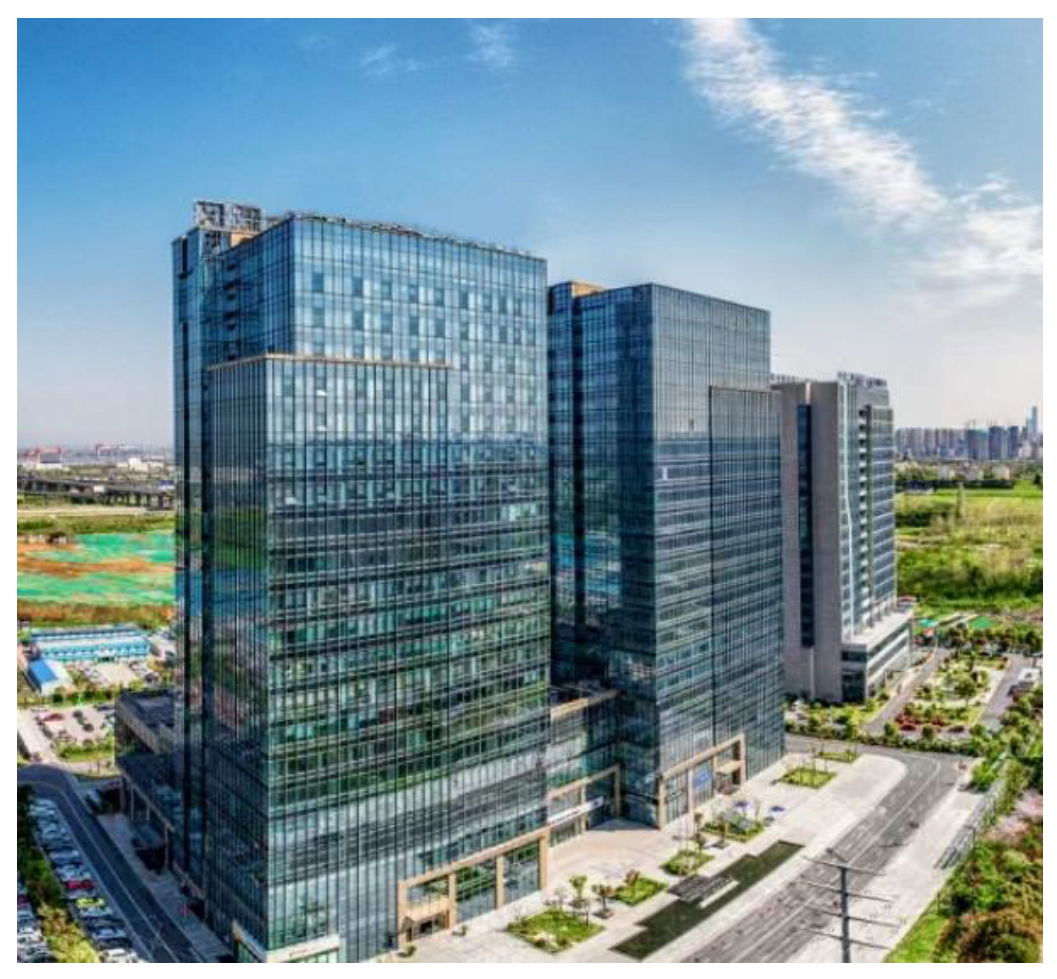
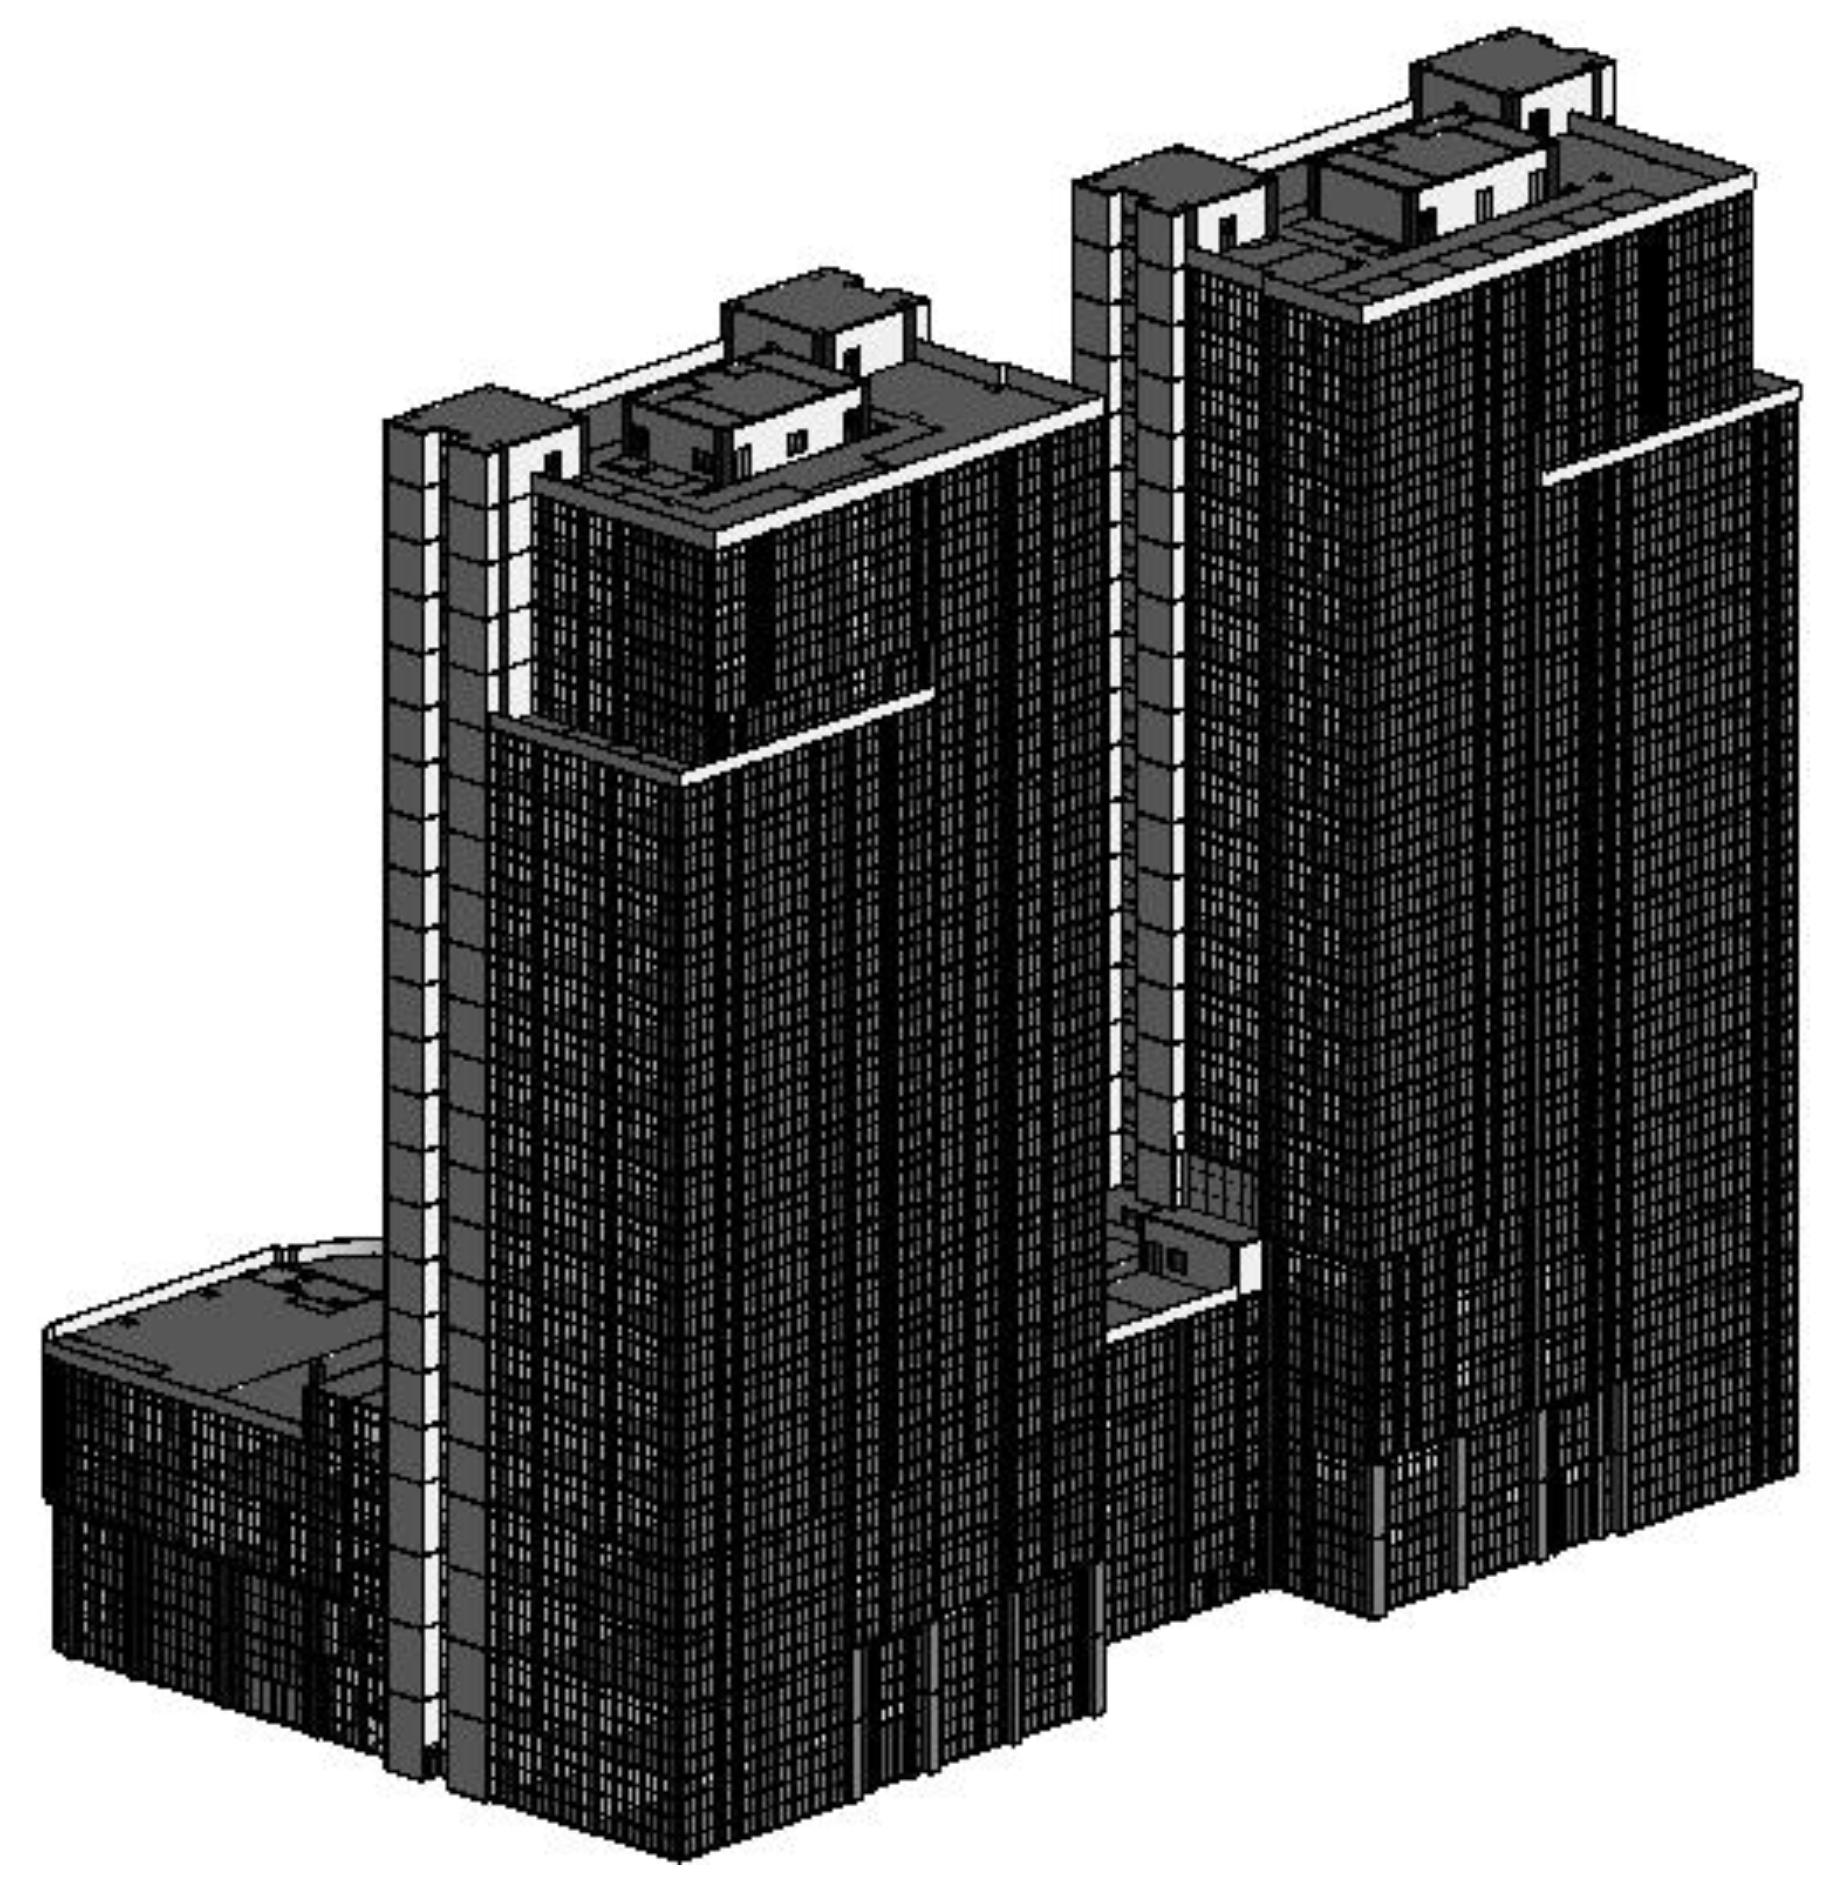
Currently, while there are numerous analyses available on carbon emissions throughout the entire life cycle of buildings, they primarily focus on calculating carbon emissions within the buildings themselves. However, there remains a lack of comparative analysis between traditional glass curtain walls and photovoltaic curtain walls, specifically used in large-scale public buildings regarding their respective carbon emissions. By using the LCA method based on BIM to evaluate and analyze photovoltaic curtain walls, its advantages in carbon emissions can be objectively measured, and reference can be provided for architects and designers in the early design stage to choose more environmentally friendly and energy-saving building materials and technologies. This article aims to establish a BIM-based framework utilizing the process analysis method for assessing carbon emissions across the entire life cycle of buildings. By focusing on a 22-story large public building located in Zhenjiang City, Jiangsu Province, China, this study will systematically analyze the impact of substituting glass curtain walls with photovoltaic curtain walls on carbon emissions throughout the building’s life cycle. The findings will serve as valuable references for future endeavors to reduce carbon emissions.
The research organization of this article is as follows: Section 2 introduces the research methods and framework. Section 3 provides the analysis results of carbon emissions and carbon reduction. Section 4 discusses the research and its limitations and provides suggestions. The fifth section summarizes the conclusion of this article.

2. Methods and Framework

LCA has three broad methods: process-based, economic input–output, and hybrid. Among them, process-based methods account for the majority of research in the field of construction technology due to their systematic, accurate, detailed analysis and compliance with industry standards [34]. This article presents an enhanced framework for analyzing building carbon emissions using BIM-LCA based on the process analysis method. The framework is applied to a large public building for quantitative research. The study comprises four main modules: (1) delineating system boundaries, (2) collecting data and constructing the building model, (3) calculating building carbon emissions, and (4) economic and carbon reduction analysis. The specific framework for building carbon emissions analysis based on BIM-LCA is illustrated in Figure 1.

2.1. Delineating System Boundaries

Buildings consume resources and energy throughout their life cycle. When conducting a comprehensive life cycle analysis, it is essential to establish system boundaries and divide them accordingly. According to NS-EN 15804:2012+A2:2019 standard [35], the complete life cycle of a building includes the processes of material production, transportation, construction, operational stage, and demolition at the end of its life. These stages cover the entire process from raw material production to final waste disposal. Based on previous research [36], this article divides the building life cycle and sets system boundaries. The entire life cycle of a building is divided into four stages: production and transportation of building materials, construction, operation of buildings, and demolition of buildings. The specific boundary division is shown in Figure 2.

2.2. Data Collection and Building Model Construction

Data collection is crucial for establishing subsequent models and calculating and analyzing carbon emissions from buildings. This article divides data collection into four main categories based on the entire life cycle of buildings: building information, building materials, building transportation, and building energy consumption. Building information comprises fundamental details about buildings, such as floor area, ceiling height, doors and windows, walls, and geographical location. This information aids in model establishment and subsequent analysis. The data sources for calculating carbon emissions throughout the entire life cycle of buildings typically include building documents and news interviews. Building materials include the quantity, type, and corresponding carbon emission coefficient of raw materials. This information typically comes from various sources, such as BIM models, LCA databases, construction documents, and literature. Construction transportation refers to the distance and method of transporting building materials from the manufacturer to the construction site, which can be obtained through construction documents, interviews, and maps. Building energy consumption includes the energy consumed by equipment during the construction and operation stages of the building.
The combination of BIM and LCA helps to address the limitations of traditional life cycle assessment, so the construction of the model is crucial. BIM is defined as a data repository that transfers data throughout the entire carbon emission process of a building’s life cycle through the establishment of a model. It not only describes the three-dimensional geometric shape of the building, but also contains a large amount of non-geometric information, such as spatial relationships, material lists, prices, and other related information [37]. The BIM model encompasses visualization, coordination, simulation, optimization, and graphic representation, throughout the entire life cycle of buildings. The Level of Development (LOD) is a protocol that provides fundamental guidance on BIM information, with the information’s completeness varying based on the intended purpose of the BIM model. In addition, most current papers on BIM-based LCA methods lack a declaration of LOD [12,38]. The lack of clear and unified LOD definitions will have an impact on building modeling and accurate LCA calculations [39]. Creating a LOD enables the specification of precise content requirements for BIM model elements within a specified timeframe, effectively addressing the issue of insufficient requirement information in projects [40]. The LOD framework consists of five levels, namely LOD 100, LOD 200, LOD 300, LOD 400, and LOD 500 [41]. These levels encompass the entire project life cycle, starting from conceptualization to completion and facility management.
The case of this study is a large public building that has been completed and put into use, so LOD 500 was used to create a BIM model. The building is located in Zhenjiang, Jiangsu Province, China, and belongs to the hot summer and cold winter climate zone. The structural form is a frame structure, and the building function is an office building. The engineering overview of the building is shown in Table 1. According to Table 1, the total construction area of the building is 64,272.38 square meters, covering an area of 4463.67 square meters. The building has 22 floors, with 3 partial floors. The building height is 98.4 m, and the design service life is 50 years.
The BIM modeling method is a process of building and managing building projects through digitization and collaboration. In BIM modeling, various software tools are used to create and edit building models, among which Revit 2018 is a commonly used BIM modeling software. Revit is a professional BIM modeling software developed by Autodesk. It provides a rich set of tools and functions for creating, editing, and managing building models. The process of BIM modeling usually includes the following steps: determining LOD and developing unified modeling standards; model creation using BIM software to establish the geometric shape of the building model; parametric design to automatically adjust the size, relevance, and attributes of the model by setting parameters and constraint conditions; data input, embedding data into the model; output and extract data for analysis based on the BIM model. Figure 3 illustrates the architectural model diagram of the case studied in this article.

2.3. Calculation and Economic Analysis of Building Carbon Emissions

2.3.1. Building Carbon Emissions

According to the system boundaries divided in 2.1, carbon emissions are calculated separately at each stage. The time range for LCA calculation of a building is 50 years. The carbon emission calculation method is mainly based on the carbon emission factor method, with carbon dioxide equivalent (CO2-eq) as the accounting unit for carbon emissions [31,36]. The functional unit used in LCA is kgCO2-eq.
In the stage of material production and transportation, carbon emissions mainly refer to the carbon emissions generated during the process of obtaining or producing raw materials required for building materials from the collection site, transporting them from the collection site to the manufacturing factory, and transporting finished products from the manufacturing factory to the construction site. The specific calculation is shown in Formula (1).
C 1 = i = 1 n M i × ( M F i + D i T F i )
In the formula: C1 is the carbon emissions during the production and transportation stages of building materials, kgCO2-eq; Mi is the usage of the i-th type of building material; MFi is the carbon emission factor of the i-th building material, kgCO2-eq /unit of building material quantity; Di is the transportation distance (km) using the i-th type of building material; TFi is the carbon emission factor for the i-th type of building material under transportation, kgCO2-eq/ (t·km). According to GB/T 51366-2019 [42], when the actual transportation distance of building materials is unknown, the default transportation distance for concrete is 40 km, and the default transportation distance for other building materials should be 500 km.
The construction stage includes the carbon emissions generated by the oil and electricity consumption of various mechanical equipment during the construction process, from project commencement to project completion acceptance. The carbon emissions during the construction stage should be calculated using the following formula.
C 2 = i = 1 n E i × E F i
In the formula: C2 is the carbon emissions during the construction stage, kgCO2-eq; Ei is the usage of the i-th energy source, kWh or kg; EFi is the i-th carbon emission factor that consumes energy, kgCO2-eq /unit of building materials.
The carbon emissions during the operational stage of a building encompass the carbon emissions generated by the energy consumption of building equipment systems, as well as equipment updates such as maintenance and component replacements. The building equipment systems include heating, ventilation, and air conditioning (HVAC), domestic hot water, lighting, elevator operations, and solar PV systems, among others. In addition, when solar photovoltaic system components reach the end of their useful life, such as solar panels, they may need to be replaced. The specific calculation is illustrated in Formula (3).
C 3 = i = 1 n E i × E F i × y + C 1
In the formula: C3 is the carbon emissions during the operational stage of a building, kgCO2-eq; Ei is the usage of the i-th energy source, kWh or kg; EFi is the i-th carbon emission factor that consumes energy, kgCO2-eq /unit of building materials; y is the service life of the building, in years; C 1 is the carbon emissions generated by component replacement.
The carbon emissions during the demolition stage of a building consist of the carbon emissions generated by manual demolition and the carbon emissions resulting from the energy consumption of small-scale demolition machinery and equipment. However, because the building is still in use and the engineering data is not readily available, this article relies on previous research and utilizes empirical formulas for calculations [43].
C 4 = A × 0.06 X + 2.01
In the formula: C4 is the carbon emissions during the demolition stage of a building, kgCO2-eq; A is the building area, m2; X is the number of floors above ground in a building.
The energy emission factors of electricity use depend on the mode of electricity production. Based on the average carbon emission factor of the regional power grid announced by the National Development and Reform Commission, the research building in this article is located in East China, with a carbon emission factor of 0.7035 kgCO2-eq/kWh.

2.3.2. Economic Analysis

In practical applications of architecture, economic considerations should also be considered, including the benefit–cost ratio (BCR) and static incremental investment payback period (SIPP) of the project. The service life of photovoltaic curtain walls is 25 years. The assumptions for life cycle cost (LCC) calculation include equipment procurement costs, operation and maintenance costs, energy costs, repair and replacement costs, etc. These assumptions can be adjusted based on specific projects. The calculation formula is as follows:
N B C R = M 0 M 1
In the formula: NBCR represents the cost-effectiveness ratio of the project; M0 denotes the full life cycle benefits of the project without considering the time value; M1 represents the cost increment before and after the project renovation. When NBCR > 1, it indicates that the project renovation is economically feasible, meaning the income benefit of the project exceeds the investment cost. Moreover, the higher the NBCR value, the greater the profitability of the project.
The calculation formula for the static incremental investment payback period (SIPP) is as follows:
T S I P P = M 1 M 2
In the formula: TSIPP is the static incremental investment payback period of the project; M1 is the cost increment before and after the project renovation; M2 is the annual net income of the project.

3. Results

3.1. Carbon Emissions in the Entire Life Cycle of Buildings

3.1.1. Material Production and Transportation Stage

This stage encompasses the carbon emissions associated with the main building materials required for construction. These emissions are generated during the manufacturing process by the manufacturer and during transportation from the manufacturer to the construction site. By utilizing the BIM model presented in Figure 3, the list of building materials can be derived. Applying the carbon emission factor method, the total carbon emissions during the production and transportation stages of building materials amount to 39,567.18 tCO2-eq. Among these, building materials production accounts for 38,730.93 tCO2-eq, while building materials transportation accounts for 836.25 tCO2-eq. The specific details are provided in Table 2 and Table 3.
The transportation mainly includes heavy diesel truck transportation (with a load capacity of 46 t) and a carbon emission factor of 0.057 kgCO2-eq/ (t·km); heavy duty gasoline truck transportation (with a load capacity of 10 t/18 t), with a carbon emission factor coefficient of 0.104 kgCO2-eq/(t·km). Based on the data presented in Table 2 and Table 3, it can be inferred that building material production contributes to 97.89% of the total carbon emissions in this stage, whereas building material transportation accounts for 2.11%. Among the building materials, steel bars, concrete, aerated concrete blocks, and glass curtain walls are identified as the major contributors to carbon emissions during the production process, collectively representing 95.95% of the total emissions in building material production. The remaining materials constitute approximately 4.05% of the emissions.

3.1.2. Construction Stage

This stage examines the carbon emissions resulting from energy consumption during the construction process, with the calculation timeframe spanning from the start of construction to project completion. The construction activities for this building primarily involve earthworks, steel reinforcement engineering, and concrete engineering. Various equipment was used, such as crawler bulldozers, crawler single bucket hydraulic excavators, steel bar straighteners, steel bar cutting machines, steel bar bending machines, DC arc welding machines, butt welding machines, welding rod drying boxes, concrete leveling machines, concrete conveyors, etc. Table 4 provides an overview of the energy consumption and corresponding carbon emissions associated with these construction activities.

3.1.3. Operational Stage

This stage focuses on the carbon emissions resulting from energy consumption by various equipment during the operational stage of the building. The primary energy source used during the building’s operation is electricity, and there is no provision for a hot water supply system or renewable energy system. The energy consumption systems considered during the operational process include HVAC systems, lighting, elevator systems (including sockets), and other related equipment. The building is situated in Zhenjiang City, which falls within the hot summer and cold winter climate zone. When estimating carbon emissions resulting from electricity consumption in buildings, it is recommended to utilize the average carbon emission factor provided by the National Development and Reform Commission for the regional power grid. For the East China region, where the building is located, the average carbon emission factor is 0.7035 kgCO2-eq/kWh. Considering a building’s lifespan of 50 years and based on actual circumstances, the carbon emission factor method will be employed to calculate carbon emissions during the operational stage. The electricity consumption and carbon emissions during the operational stage of the building are shown in Table 5.

3.1.4. Demolition Stage

The carbon emissions in this stage result from the energy and power consumption of mechanical equipment used during the demolition process. Due to limited data availability, empirical formulas were utilized to estimate the carbon emissions during the demolition stage, resulting in a total of 214.03 tCO2-eq.

3.2. Analysis of Carbon Emissions throughout the Entire Life Cycle of Buildings

Based on the carbon emissions of the four stages outlined in Section 3.1, it is possible to determine the overall carbon emissions throughout the building’s entire lifespan. Analysis of the carbon emissions across all stages reveals that the total carbon dioxide emissions over the entire life cycle of the building amount to 172,829.01 tCO2-eq. The highest carbon emissions occur during the operational stage, accounting for 76.07% of the total emissions, with the production and transportation stage of building materials representing the second highest source of emissions at 22.89%. Specific data and analysis results can be found in Table 6 and Figure 4.

3.3. Carbon Emission Reduction Analysis

As demonstrated in Section 3.2, the operational stage contributes the highest percentage of carbon emissions throughout the entire life cycle. Thus, controlling carbon dioxide emissions during this stage is the most direct and effective approach to reduce overall carbon emissions of buildings. In this section, the case building will incorporate photovoltaic curtain walls, replacing the existing glass curtain wall, in order to systematically analyze and compare the impact of photovoltaic curtain walls on the carbon emissions of the entire building life cycle. The objective is to minimize carbon emissions to the greatest extent possible. A summary of the steps involved in the entire analysis process is presented in the form of a flowchart to assist design and construction managers in understanding the overall methodology. The analysis process of carbon emission reduction is shown in Figure 5.

3.3.1. Economic Analysis of Replacing Glass Curtain Walls with Photovoltaic Curtain Walls

According to the research conducted by Zhu [44] and Wang [45], this study adopted a grid-connected photovoltaic system with a thin film (CdTe) panel as the photovoltaic module, which is connected to the municipal power grid through a grid-connected inverter, with a conversion efficiency of up to 85%. Among them, the selected thin film battery products have good weak light performance and can stably generate electricity under low light intensity conditions in winter. CdTe material exhibits excellent full spectrum absorption, thus exhibiting high power generation efficiency under low light conditions in the morning and evening. This characteristic enables the photovoltaic curtain wall to achieve reasonable power generation allocation and takes into account the needs of efficiency and transparency, so this specific material was chosen. The carbon dioxide emissions per square meter of photovoltaic curtain wall during the material production stage are approximately 197 kg. The estimated lifespan of these photovoltaic modules is around 25 years. Based on the provided information, replace the curtain walls on the four facades of the building. According to simulation calculations, the annual power generation of the four facades is shown in Table 7.
According to the characteristics of photovoltaic modules, the attenuation rate of photovoltaic modules is around 2% in the first year, and the average annual attenuation rate from the following year is around 0.6%. The output efficiency of the modules in 25 years is not less than 80%. The total power generation of the four facade photovoltaic curtain walls during their life cycle is shown in Table 8.
Based on Table 7 and Table 8, the annual and total power generation data for the photovoltaic curtain walls on different facades can be obtained. The south facade’s photovoltaic curtain wall has the highest power generation capacity, with a cumulative power generation of 17,730.42 MWh over a 25-year period. The installation area of the photovoltaic curtain wall on the south facade is about 1.08 times that of the north facade, but the power generation is about twice that of the north facade. This is because the equivalent peak sunshine hours on the south facade are large, and the south facade has longer periods of sunshine, so the annual power generation on the north facade is only 390,990 kWh. The power generation capacity of the photovoltaic curtain walls on the east and west facades are similar to each other. In practical building applications, the replacement of photovoltaic curtain walls should also take economic factors into consideration, including the cost-effectiveness ratio (BCR) and static incremental investment payback period (SIPP) of the project. According to the calculation of the Engineering Cost Association [46], the cost of thin film photovoltaic curtain walls represented by cadmium telluride modules is increased by approximately 1200 to 1400 yuan per square meter compared to traditional glass curtain walls. This article selects 1300 yuan for calculation. The revenue can be calculated based on the commercial electricity price of 0.7740 yuan/kWh. M0 represents the full life cycle benefits of the project without considering time value; M1 is the cost increment before and after the project renovation; M2 is the annual net income of the project. According to Formulas (5) and (6), the calculation results are shown in Table 9.
Based on the information provided in Table 9, it can be concluded that BCR for the east, west, and south facades is greater than 1. This indicates that installing photovoltaic curtain walls on these facades is economically feasible, as the investment can be recovered within the life cycle of the project. Among these facades, the south facade exhibits the highest BCR, making it the most economically viable option. On the other hand, the BCR of the north facade is less than 1, which means that the economy of installing photovoltaic curtain walls on this facade is not good, as the investment will not be recoverable within its life cycle. Therefore, the building will opt to install photovoltaic curtain walls on its east, west, and south facades, replacing the glass curtain walls of the original structure. The carbon reduction analysis is as follows.

3.3.2. Analysis of the Impact of Photovoltaic Curtain Walls on Carbon Emissions throughout the Whole Life Cycle of Buildings

This study replaces the glass curtain walls on the east, west, and south facades of the original building with photovoltaic curtain walls. The comparative analysis chart showcasing the before and after replacement of the curtain wall is illustrated in Figure 6. Throughout the entire life cycle of a building, the replacement of photovoltaic curtain walls primarily affects the carbon emissions during the operational stage of the building and the production and transportation stages of building materials. Table 10 provides a comparison of the carbon emissions of building curtain walls during the production and transportation stages of building materials before and after the replacement of curtain walls. The service life of the building is 50 years, of which the service life of the photovoltaic curtain wall is 25 years. Therefore, two carbon emission calculations for the production and transportation stages of the building materials of the photovoltaic curtain wall are required throughout the entire service period.
Referring to Table 10, the replacement of glass curtain walls on the east, west, and south facades with photovoltaic curtain walls during the building’s entire life cycle results in a net increase of 4145.19 tons of carbon emissions in the production and transportation stages of building materials. This is due to higher energy consumption during the production process of photovoltaic curtain walls, which leads to an increase in carbon emissions.
The primary function of photovoltaic curtain walls is to harness renewable solar energy and generate clean, low-carbon electric power for the building’s operational stage, thereby reducing carbon emissions during its use. This is achieved by utilizing the power generated from solar energy to meet the energy demands of the building, resulting in a significant decrease in carbon emissions during its operational lifespan. According to Figure 7, the clean electricity produced by photovoltaic curtain walls is used in the operational stage of buildings to reduce the demand for electricity from the power grid. After replacing it with a photovoltaic curtain wall, 31% of the energy required during the operation stage can be supplied through the photovoltaic curtain wall, thereby reducing the acquisition of electricity from the grid.
According to Table 11, the replacement of conventional curtain walls with photovoltaic curtain walls is estimated to reduce carbon emissions by 40,419.34 t during the building’s operational stage. This indicates that the application of photovoltaic curtain walls can significantly decrease the carbon emissions of the building during its use.
Based on Figure 8, the carbon emissions of a photovoltaic curtain wall building vary across different stages. Compared to Figure 4, the replacement with photovoltaic curtain walls results in a 30.74% reduction in carbon emissions during the building’s usage phase, while the carbon emissions during the construction and transportation of building materials increase by 10.48%. Considering the entire life cycle of the building, there is a 20.99% decrease in overall carbon emissions, equivalent to a reduction of 36,274.15 tons of carbon emissions. This demonstrates the significant decarbonization effect of applying photovoltaic curtain walls.
According to the comparison in Figure 9, there is a significant difference in carbon emissions between photovoltaic curtain wall buildings and traditional glass curtain wall buildings. Compared to glass curtain wall buildings, photovoltaic curtain wall buildings reduce carbon emissions by 564.38 kgCO2-eq per square meter of building area. This is mainly due to the fact that photovoltaic curtain walls can provide clean power and achieve carbon reduction during the operation phase of the building.

3.3.3. Sensitivity Analysis

Sensitivity analysis is one of the important steps in evaluating the feasibility and risks of photovoltaic curtain wall projects. By changing key parameters such as the cost of photovoltaic curtain walls and the efficiency of solar panels, it is possible to simulate the economic benefits of a project under different circumstances and help decision makers better understand the potential risks and benefits of the project. In order to deeply explore the impact of photovoltaic curtain wall costs and solar panel efficiency on project feasibility, we used the Morris method for sensitivity analysis. In the analysis, we set the variation range of factors that may affect the feasibility, such as the cost of photovoltaic curtain walls and the efficiency of solar panels, to ±5% and ±10%. The analysis results are detailed in the table below (Table 12). Through this sensitivity analysis, we can have a more comprehensive understanding of the impact of project parameters on its economic benefits in order to make more informed decisions.
After analyzing the cost of photovoltaic curtain walls, it was found that as the cost increases, the cost-effectiveness ratio of each facade gradually decreases, especially for the west facade. The cost-effectiveness ratio drops to 0.99, which means that the project’s revenue is less than the input cost, resulting in the photovoltaic curtain wall not meeting the installation requirements and deteriorating economic efficiency. Meanwhile, with the changes in the cost of photovoltaic curtain walls, the cost–benefit ratio of each facade varies between −9.09% and 11.11%. In addition, after analyzing the efficiency of solar panels, it was found that as the efficiency of solar panels increases, the cost-effectiveness ratio of each facade gradually increases. However, when the efficiency of solar panels decreases by 10%, the original cost-effectiveness ratio of the east and west facades is reduced to less than 1, which cannot meet the economic requirements of installation.

3.3.4. Carbon Trading Analysis of Photovoltaic Curtain Walls

By replacing traditional glass curtain walls on the east, west, and south facades of a building with photovoltaic curtain walls, an annual carbon reduction of approximately 808.39 t can be achieved. According to the research findings announced by Fudan University’s Center for Sustainable Development Studies in August 2023, the expected carbon trading price is projected to be 58.10 yuan per ton. As a result, the annual carbon offset value generated by the building’s photovoltaic system is estimated to be around 47,000 yuan. This indicates that the static incremental investment payback period for the photovoltaic project will decrease, as shown in Table 13. Although the specific implementation details of carbon trading in photovoltaic systems have not been fully determined, this study can provide reference for future research and implementation.
According to the data in Table 12, if carbon trading is carried out for the carbon reduction of photovoltaic curtain walls, the annual income of the project will not only include power generation income, but also carbon emission trading rights income. Therefore, this will shorten the static incremental investment payback period of the project and further promote the development of photovoltaic curtain walls.

4. Discussion

4.1. Discussion of Methods and Results

The BIM model integrates the physical and graphical information of buildings and has the characteristics of visualization, coordination, simulation, optimization, and graphic representation, which can run through the entire life cycle of the building. This article is based on the process analysis method to construct a BIM-based framework for analyzing carbon emissions throughout the entire life cycle of buildings. Using a 22-story large public building in Zhenjiang City, Jiangsu Province, China as an example, the impact of replacing glass curtain walls with photovoltaic curtain walls on carbon emissions throughout the entire life cycle of the building is systematically evaluated.
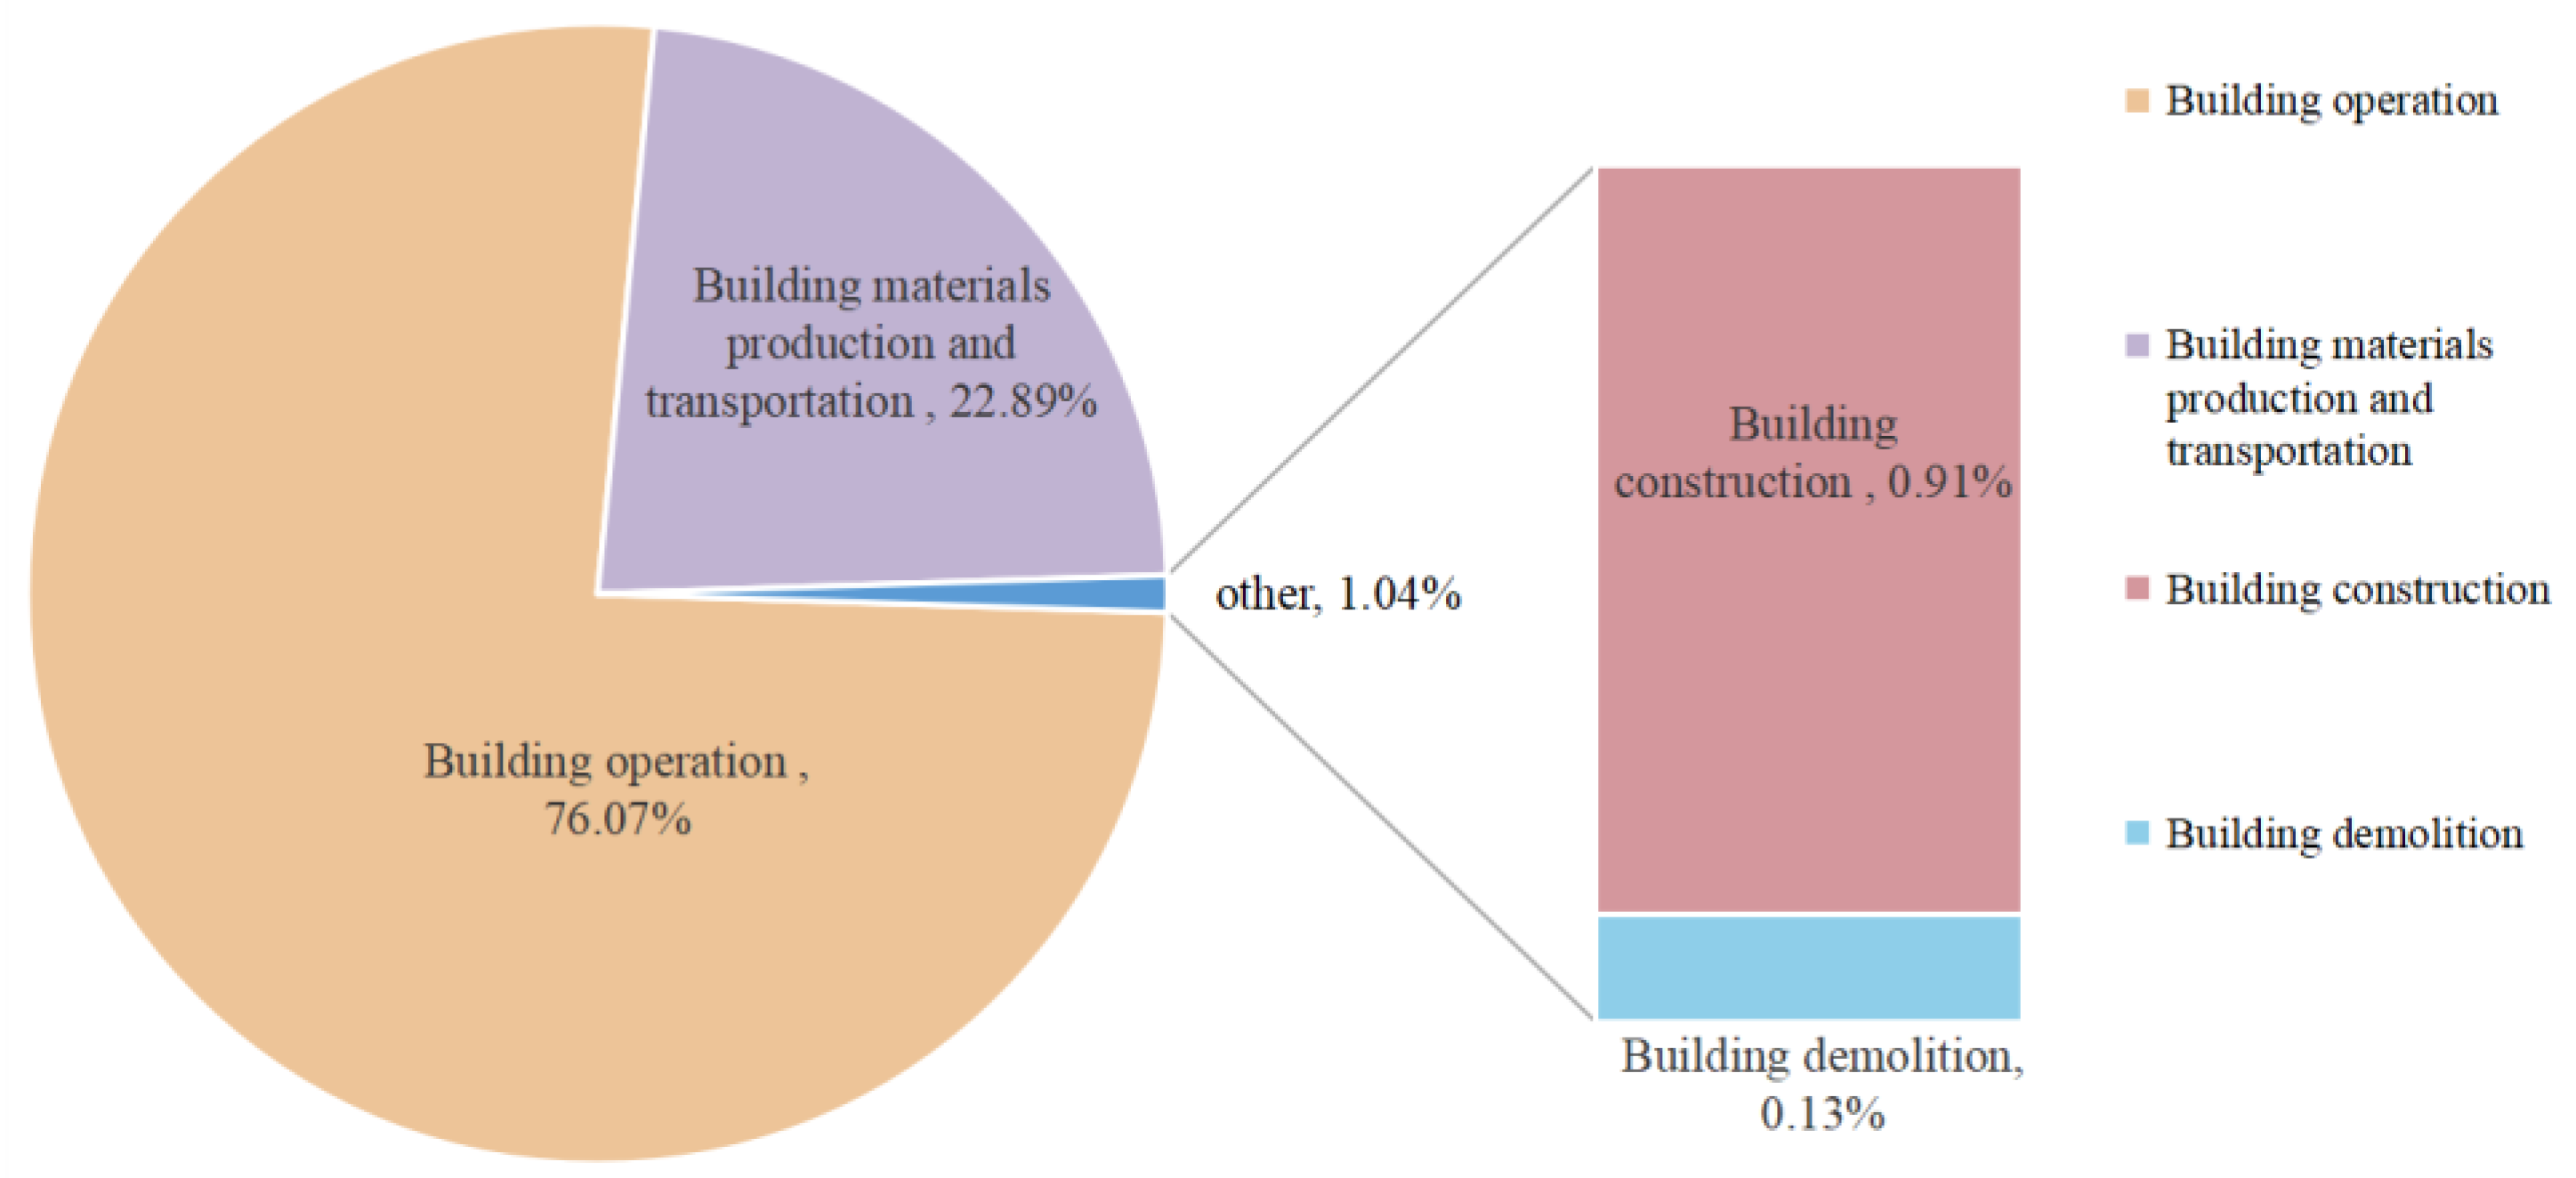
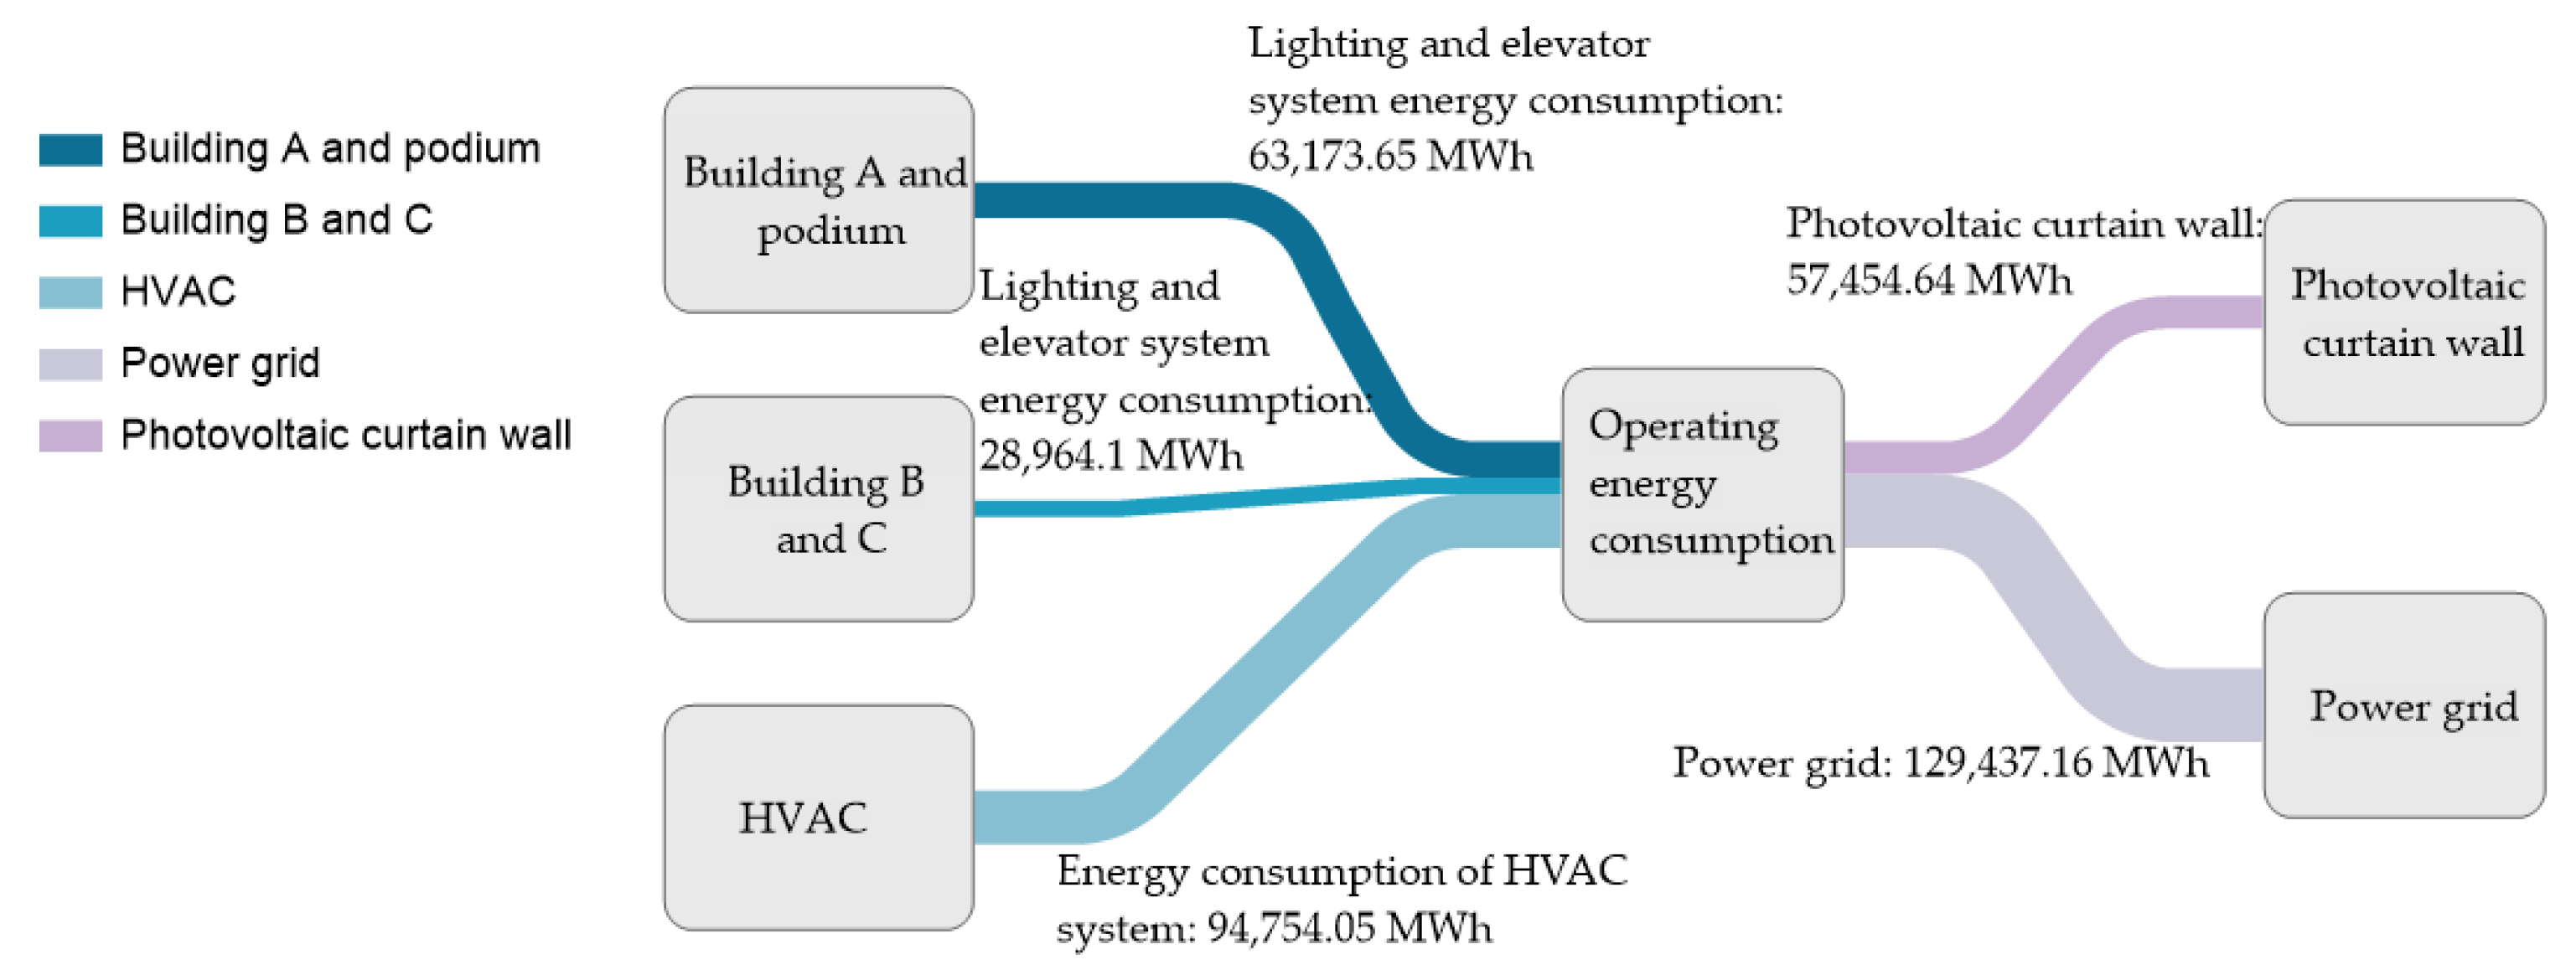
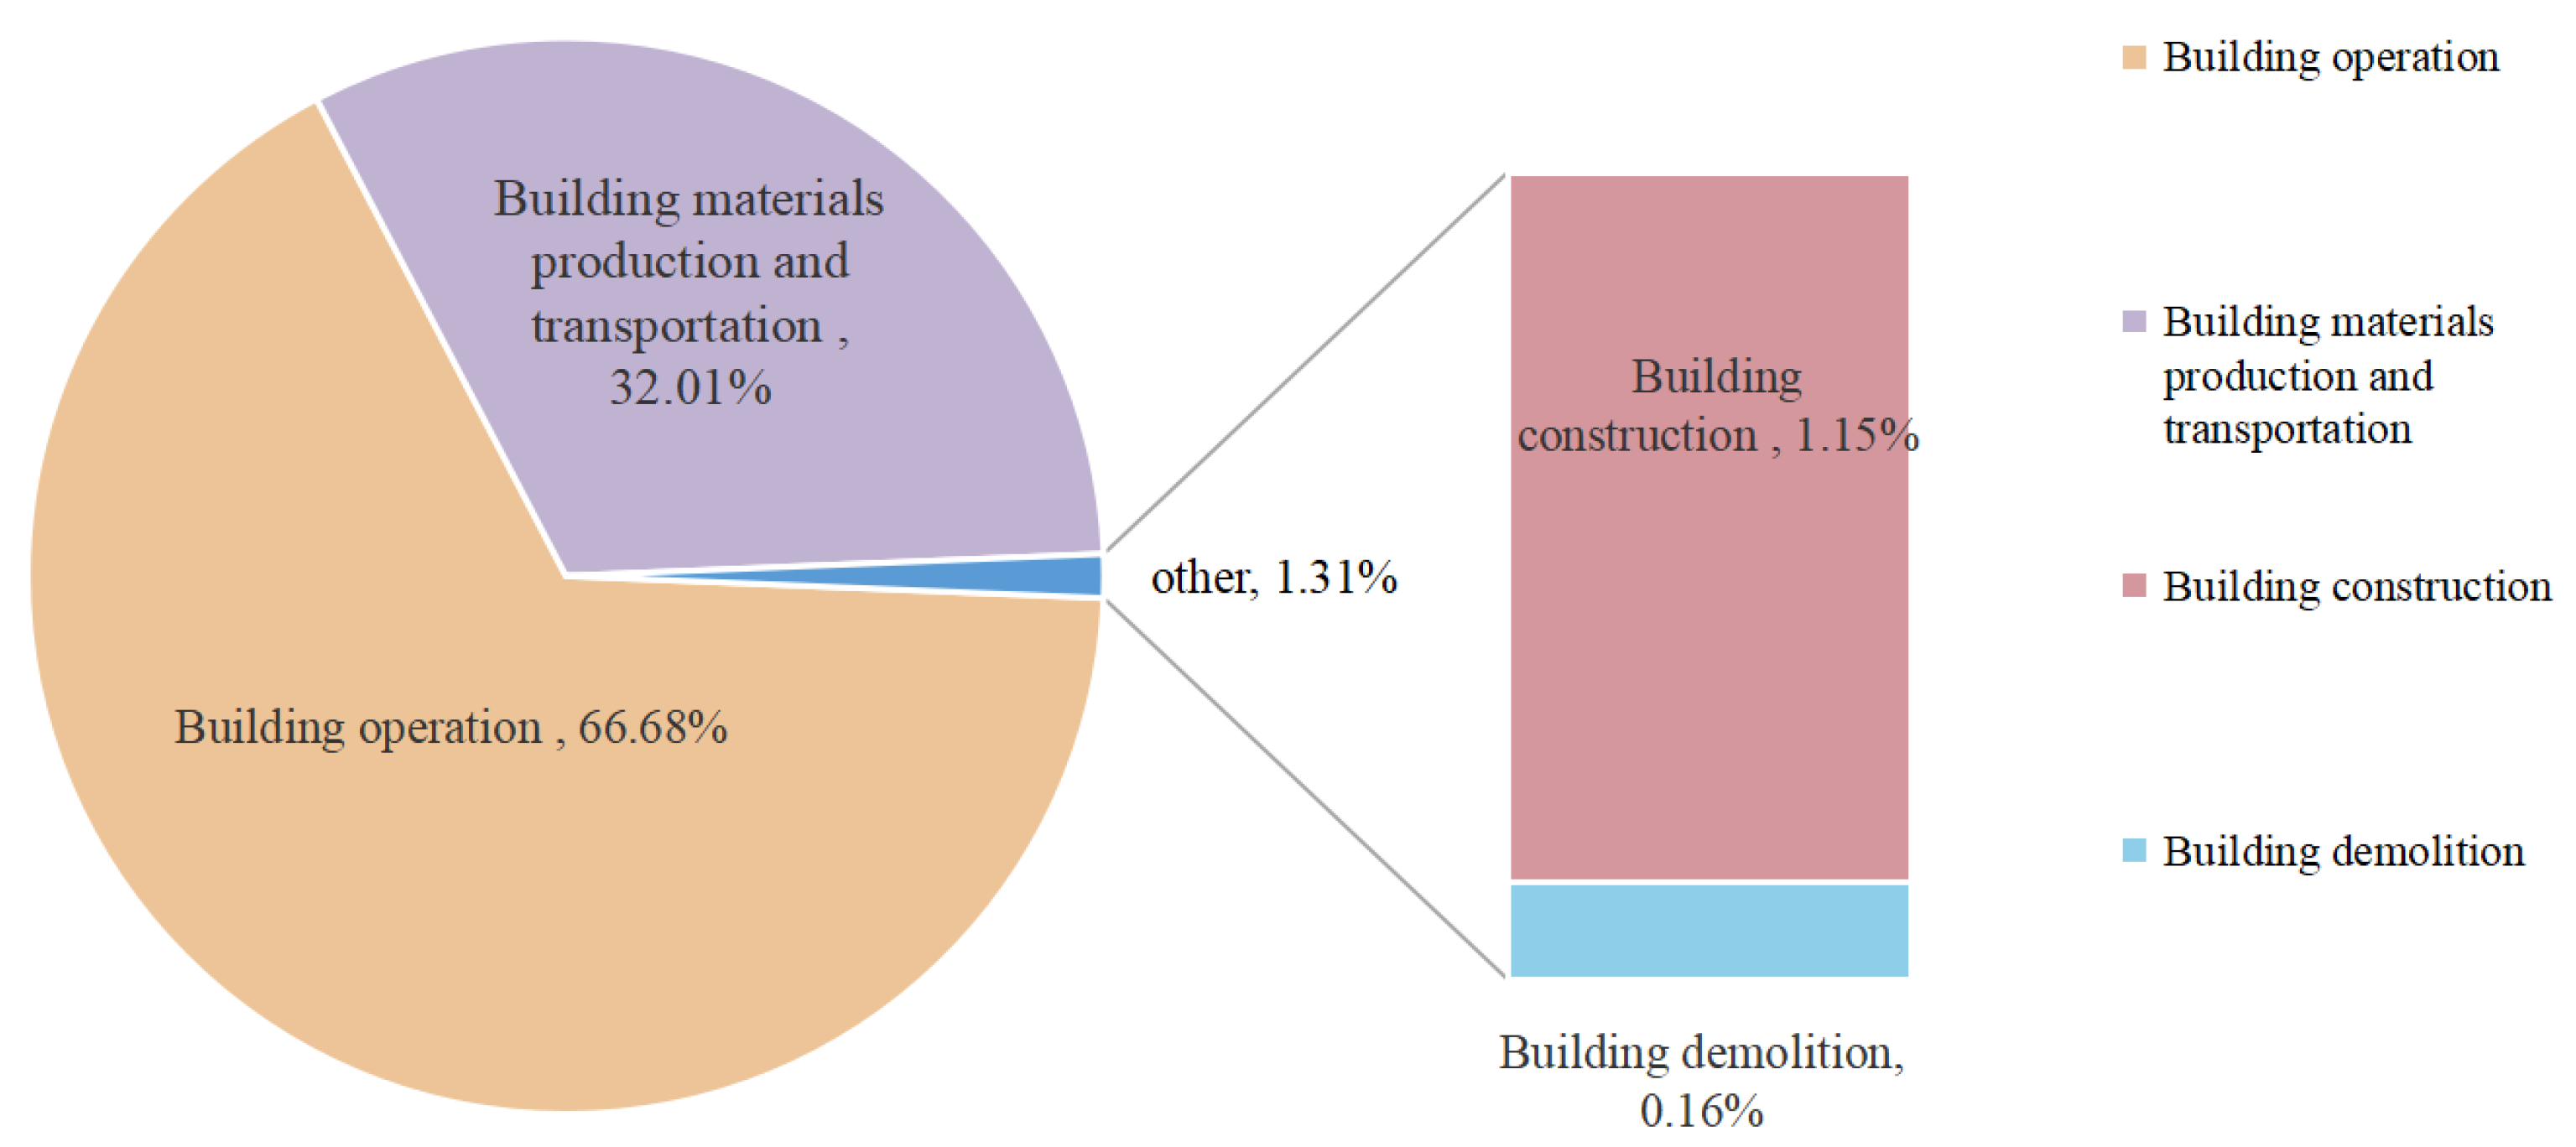
By analyzing the carbon emissions throughout the entire life cycle of buildings, the proportion of carbon emissions during the production and transportation stages of building materials is 22.89%, 0.91% during the construction stage, 76.07% during the operational stage, and 0.13% during the demolition stage. Among them, the proportion of carbon emissions during the operational stage is the highest, and compared with some previous studies on the proportion of carbon emissions during the operation stage [16,47], the results are similar to the results of this study in terms of the emission ratio during the operation stage (78.0–85.4%). According to the results, public buildings have the greatest potential for carbon reduction during the operation stage.
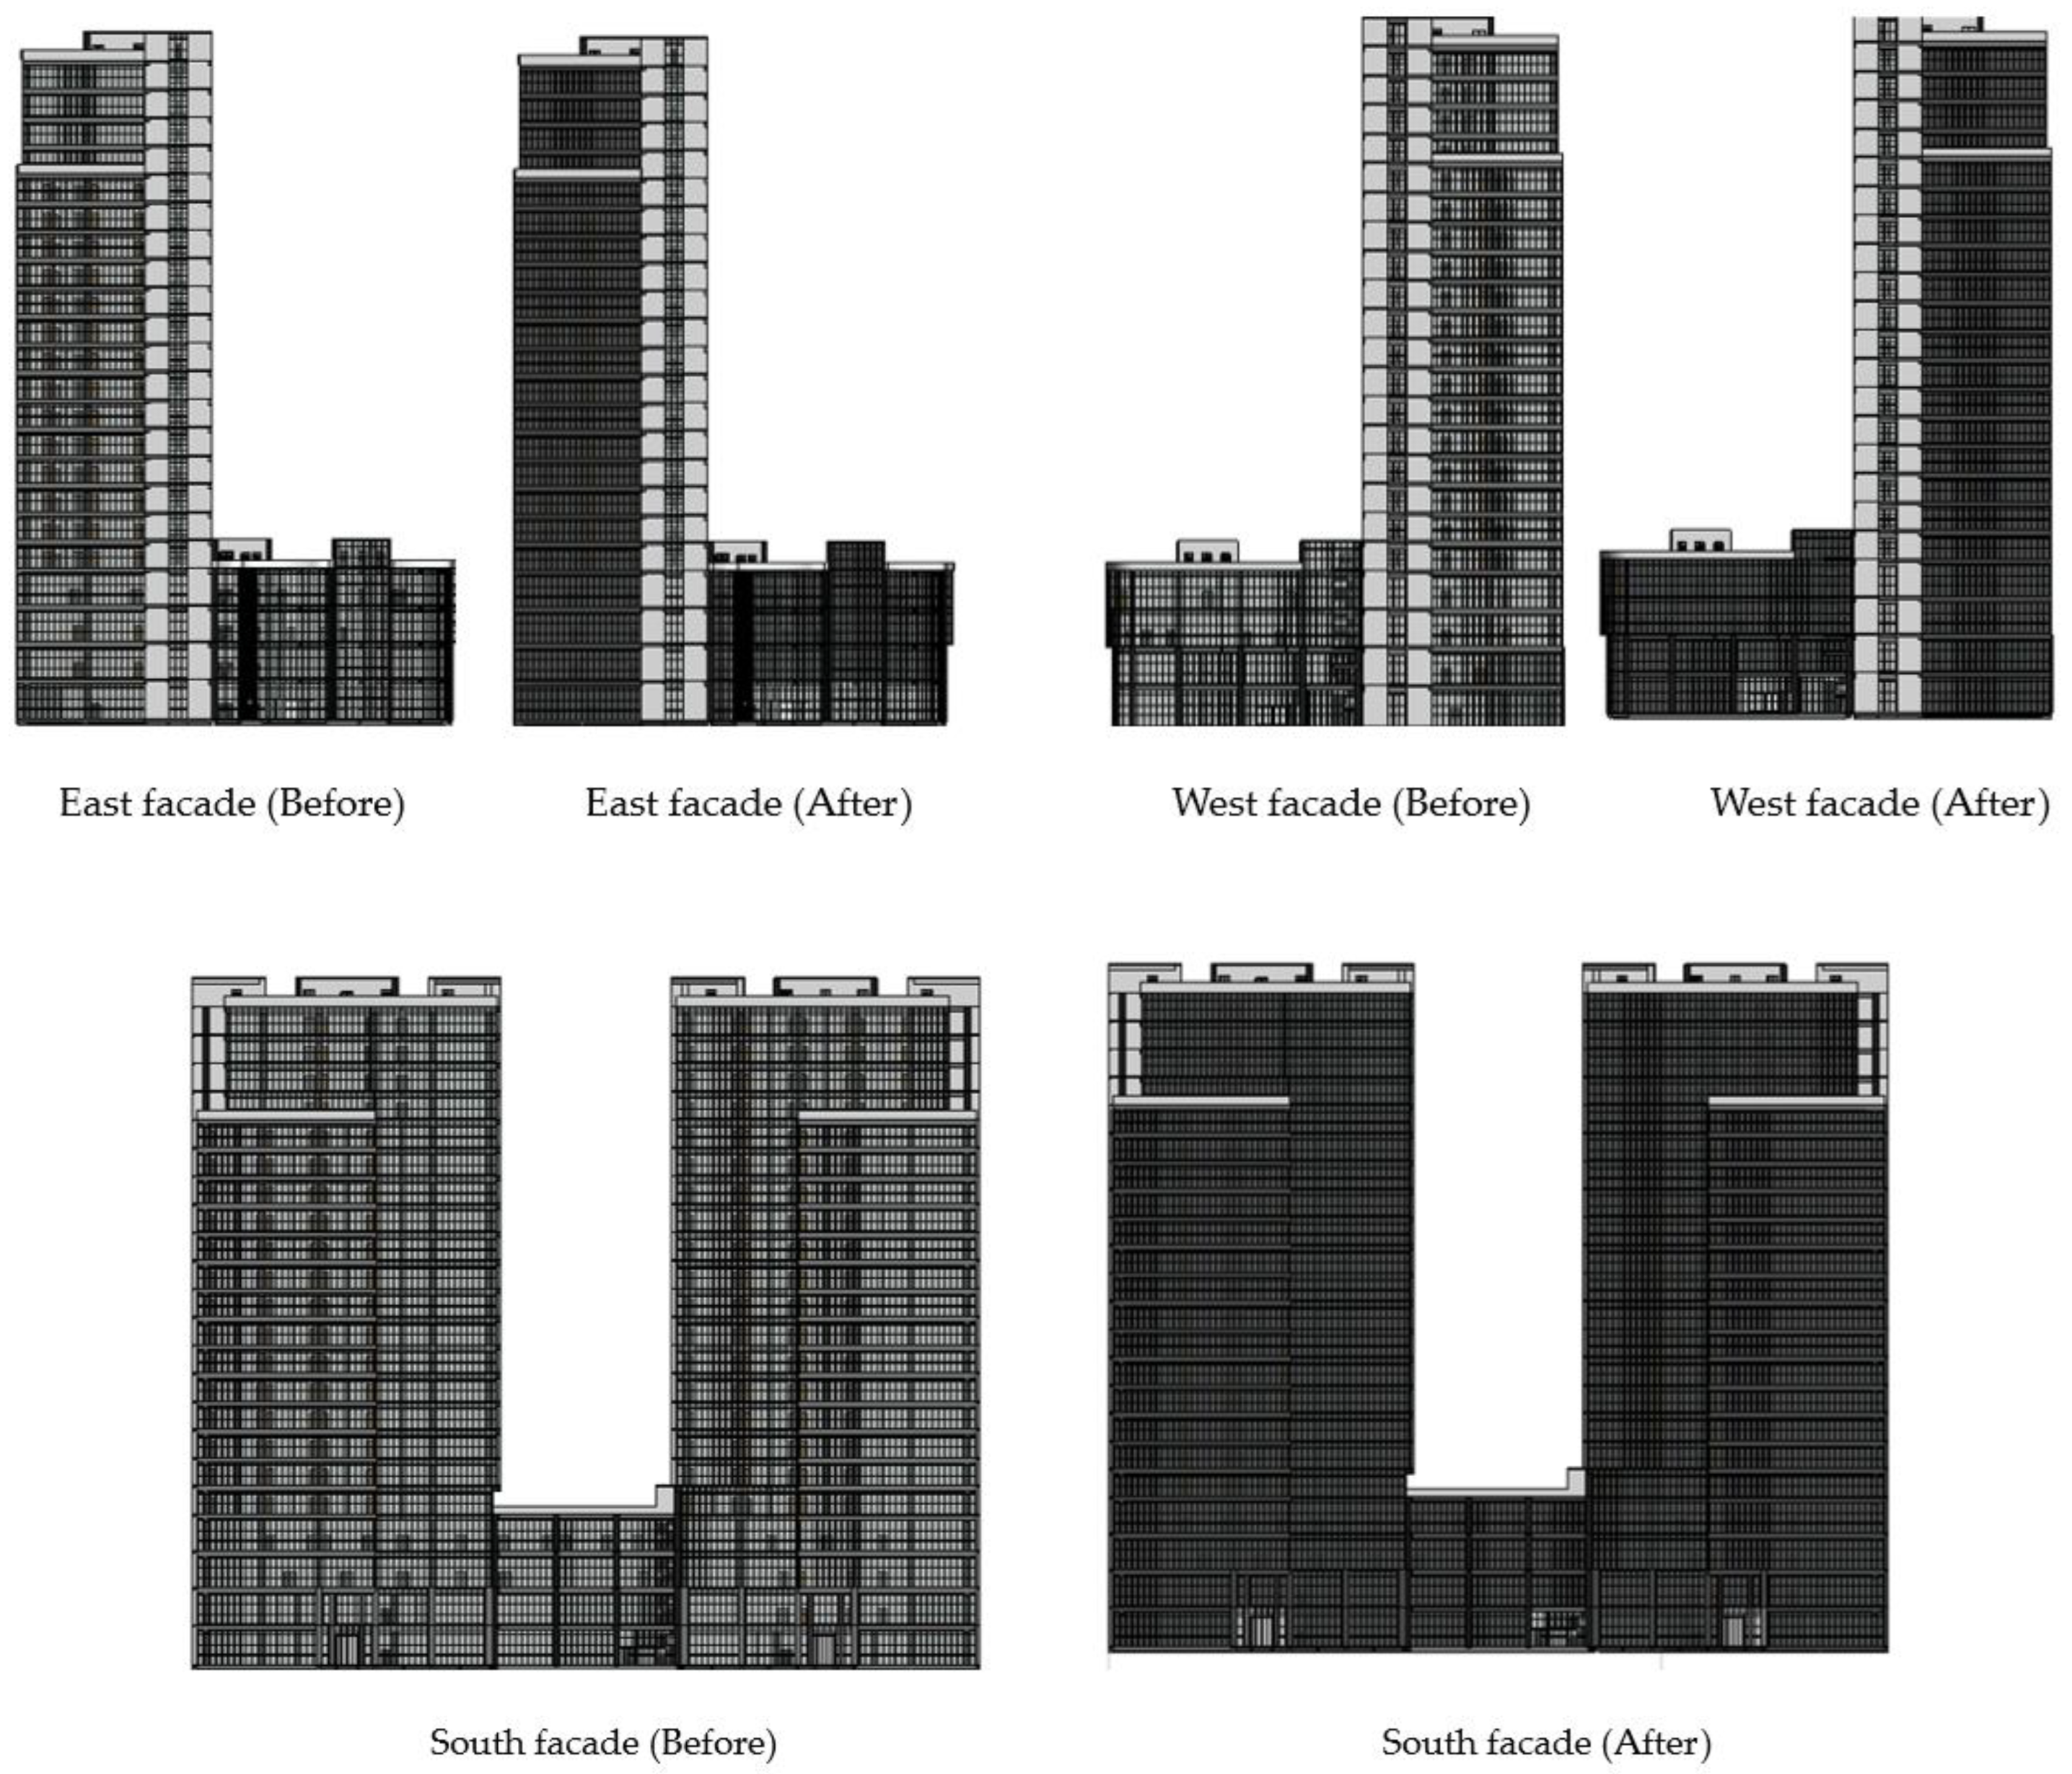
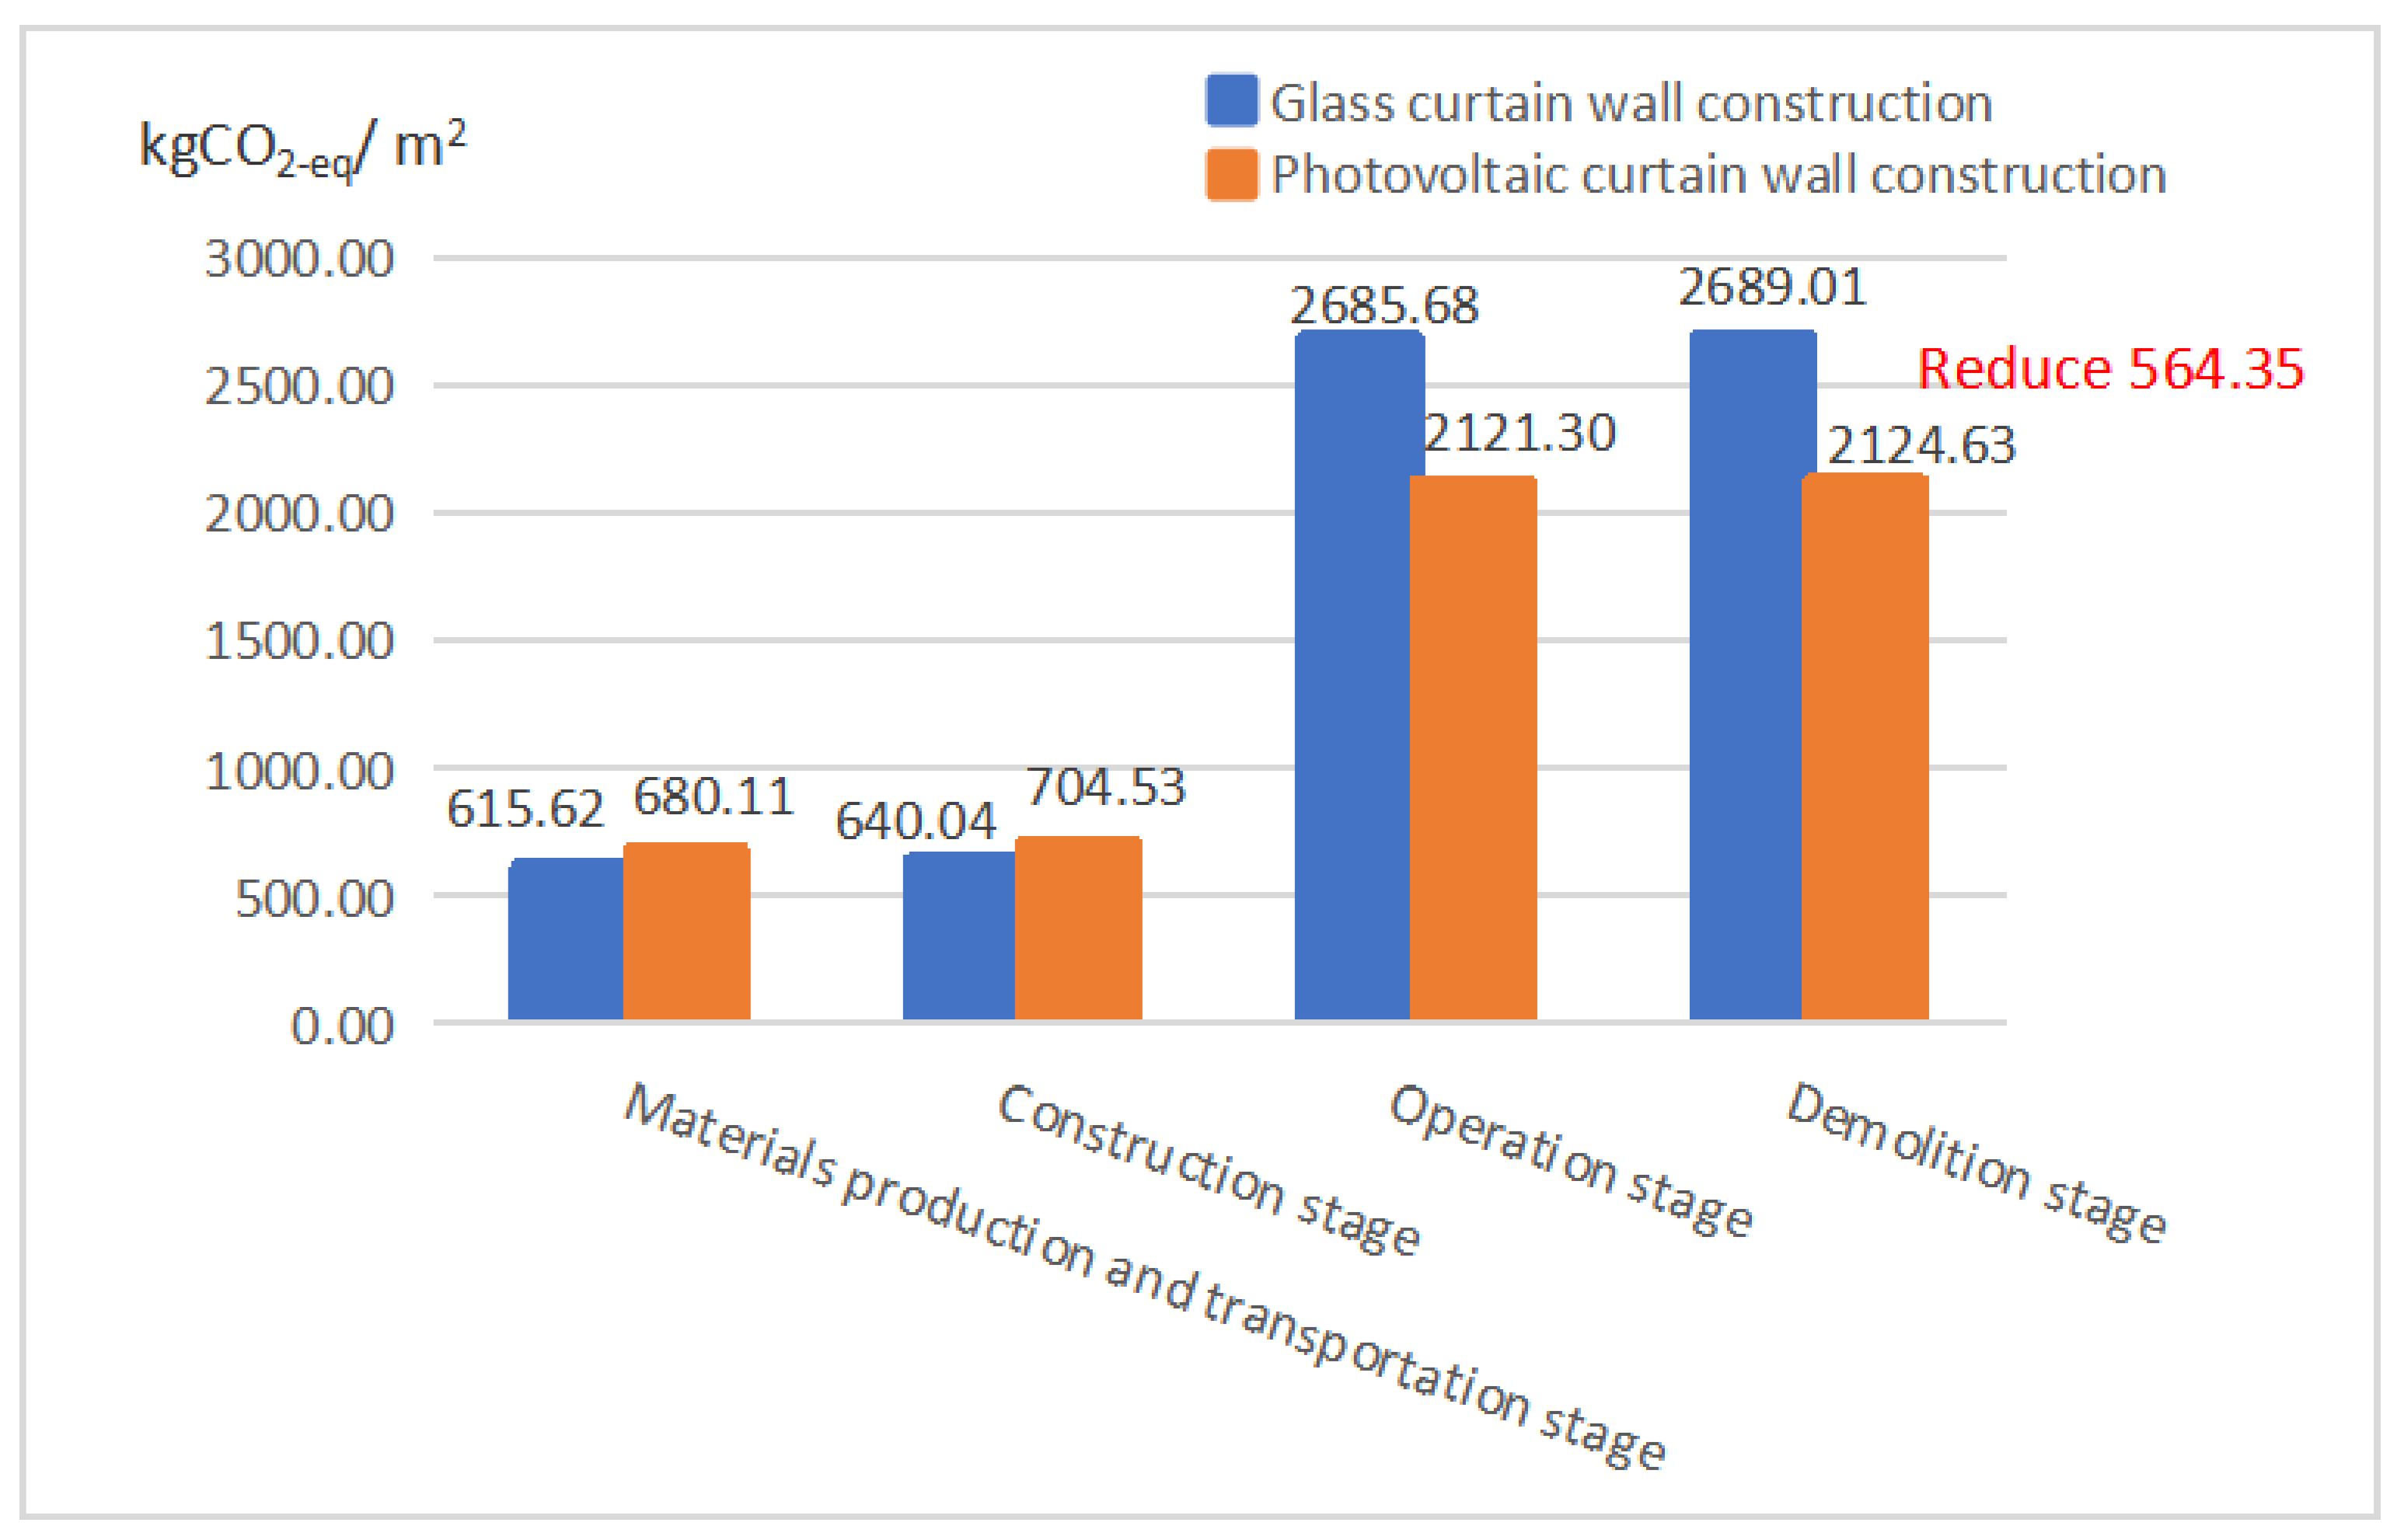
In order to minimize carbon emissions to the greatest extent possible, we chose to use photovoltaic curtain walls in the case building to replace the existing glass curtain walls and evaluated the impact of photovoltaic curtain walls on the entire life cycle carbon emissions of the building through systematic analysis and comparison. On the premise of ensuring economic feasibility, we applied photovoltaic curtain walls to the east, west, and south facades of the original building. This curtain wall replacement measure led to changes in the proportion of carbon emissions at various stages, with a decrease of 30.74% in the carbon emissions during the operational stage of the building and an increase of 10.48% in the carbon emissions during the production and transportation stages of building materials. Overall, the total carbon emissions throughout the entire building life cycle have decreased by 20.99%. Compared with previous research [48], the carbon reduction effect of alternative photovoltaic curtain wall solutions is achievable.

4.2. Limitation

Due to our focus on a 22-story large public building, it may not fully represent other types and sizes of buildings. So, there may be certain limitations. On the other hand, our analysis mainly focuses on the impact of replacing glass curtain walls with photovoltaic curtain walls on carbon emissions. Other factors such as energy supply systems and material selection may also have significant impacts on carbon emissions, but they were not considered in this study. Therefore, we need to be cautious in interpreting the results and be aware of these limitations.
The implementation of building-integrated photovoltaic technology faces challenges such as the contradiction between lighting and power generation, technical costs and efficiency, building design and planning requirements, and space and support facility requirements [49]. Among them, the contradiction between lighting and power generation needs to balance photovoltaic power generation and indoor lighting when designing and implementing BIPV systems. The issues of technological cost and efficiency still exist. Although building-integrated photovoltaic technology has made significant progress, its price and efficiency are still higher than traditional non-integrated photovoltaic technology. In addition, building-integrated photovoltaics must match the appearance and structure of the building, which may limit the freedom of designers and architects, and installing building-integrated photovoltaic systems requires additional space and support facilities, increasing the cost of the building.
The implementation of building-integrated photovoltaic technology needs to consider the grid connection and carbon trading issues of photovoltaic systems. In terms of grid connection, it is necessary to establish connection and access protocols with the power grid to ensure the safety, stability, and reliable output of electricity. In addition, photovoltaic system operators can also participate in the carbon trading market, sell the generated carbon reduction emissions, and obtain economic returns. In the field of grid connection and carbon trading, there will be challenges and norms in electricity market regulation, grid connection policies, and carbon trading market mechanisms. Therefore, the implementation of building-integrated photovoltaic technology requires cooperation with relevant departments and markets to ensure smooth grid connection of photovoltaic systems and participation in carbon trading activities.

4.3. Suggestion

The use of photovoltaic curtain walls is of great significance to reducing building carbon emissions. However, its development still faces some challenges and there is room for improvement. Given the limitations and assumptions of existing research methods, as well as the scope of future work, we propose the following suggestions to promote the further development of building-integrated photovoltaic technology and ensure it plays a greater role in reducing carbon emissions.
Firstly, expanding the scope of research is an important way to improve the comprehensiveness of research results. More research should be conducted on buildings of different types and sizes to obtain more accurate and comprehensive results. Secondly, introducing more factors such as energy supply systems and material selection can more accurately assess the carbon emissions of building-integrated photovoltaic systems.
In terms of technological improvement, efficient and low-cost photovoltaic curtain wall materials and components should be continuously developed to improve photovoltaic power generation efficiency and take into account the lighting needs of buildings. At the same time, intelligent light control technology should be developed to make it more compatible with building-integrated photovoltaic systems.
In addition, in the architectural design process, the implementation of integrated photovoltaic systems in buildings should be taken into account to ensure that the system matches the appearance and structure of the building and to maximize the freedom of architects and designers.
At the same time, it is suggested to consider the adoption of more flexible and adaptable policies in grid connection and carbon trading. This can incentivize building owners to install building-integrated photovoltaic systems, by providing them with appropriate subsidies and rewards.
Finally, it is recommended to explore research methods for the integration of building-integrated photovoltaic systems with other building energy systems. This integration aims to enhance energy utilization and management efficiency.
Through these suggestions, we aim to promote the development of the construction industry towards a low-carbon direction, achieve the transformation of clean energy, and make greater contributions to sustainable development.

5. Conclusions

This study aims to analyze the impact of replacing glass curtain walls with photovoltaic curtain walls on the carbon emissions of public buildings throughout their entire life cycle based on BIM technology and aims to find the best adaptation method that combines economy and carbon reduction. By taking a large public building as an example, introducing photovoltaic curtain walls into the building model, and conducting carbon emission analysis based on economy, the following conclusions are drawn: Firstly, the carbon emissions of glass curtain wall buildings are mainly concentrated in the operation stage of the building, accounting for 76.07% of the total emissions, followed by the production and transportation stage of building materials, accounting for 22.89%. Secondly, the south facade photovoltaic curtain wall has the best power generation performance, while the power generation performance of the east and west facades is similar. The installation of photovoltaic curtain walls on the south, east, and west facades is economically feasible and can recover costs during the life cycle of the building; The installation economy of the north facade is poor, and the cost cannot be recovered. After sensitivity analysis of the cost of photovoltaic curtain walls and the efficiency of solar panels, it was found that as the cost increases, the economy of photovoltaic curtain walls gradually deteriorates, and improving the efficiency of solar panels can improve the cost-effectiveness ratio of each facade. The carbon emissions from buildings mainly come from the production and transportation stage of building materials (32.01%) and the operational stage (66.08%). Finally, replacing glass curtain walls with photovoltaic curtain walls resulted in a 30.74% reduction in carbon emissions during the construction operation stage, while carbon emissions during the production and transportation stage of building materials increased by 10.48%. Compared with glass curtain wall buildings, photovoltaic curtain wall buildings have reduced carbon emissions by 20.99%, that being 564.38 kgCO2-eq/m2, throughout their entire life cycle.
In summary, this study provides a comprehensive discussion and analysis of carbon reduction throughout the entire life cycle of public buildings and the application of photovoltaic curtain walls and proposes targeted recommendations. These research results have implications and contributions for academic research and practical applications in related fields.

Author Contributions

Conceptualization, M.L. and C.L.; methodology, M.L.; software, M.L.; validation, M.L., C.L. and H.X.; formal analysis, M.L. and Z.Z.; investigation, M.L. and C.Z.; resources, M.L. and C.B.; data curation, M.L. and Y.L.; writing—original draft preparation, M.L.; writing—review and editing, M.L., C.L. and H.X.; visualization, M.L.; supervision, M.L.; project administration, M.L., C.L. and H.X.; funding acquisition, C.L. and H.X. All authors have read and agreed to the published version of the manuscript.

Funding

This research was funded by the Natural Science Research of Jiangsu Higher Education Institutions of China (22KJB480006).

Data Availability Statement

Some or all data, models, or code that support the findings of this study are available from the corresponding author upon reasonable request.

Conflicts of Interest

The authors declare no conflict of interest.

References

  1. Li, R.; Yu, Y.; Cai, W.; Liu, Q.; Liu, Y.; Zhou, H. Interprovincial differences in the historical peak situation of building carbon emissions in China: Causes and enlightenments. J. Environ. Manag. 2023, 332, 117347. [Google Scholar] [CrossRef] [PubMed]
  2. 2021 Global Status Report for Buildings and Construction. Available online: https://globalabc.org/resources/publications/2021-global-status-report-buildings-and-construction (accessed on 12 July 2023).
  3. Global Energy Review: CO2 Emissions in 2021. Available online: https://www.iea.org/reports/global-energy-review-co2-emissions-in-2021-2 (accessed on 12 July 2023).
  4. Zhao, X.; Ma, X.; Chen, B.; Shang, Y.; Song, M. Challenges toward carbon neutrality in China: Strategies and countermeasures. Resour. Conserv. Recycl. 2022, 176, 105959. [Google Scholar] [CrossRef]
  5. 2023 Annual Development Research Report on Building Energy Efficiency in China. Available online: https://mp.weixin.qq.com/s/UAtLkZSyFtAAEdCIXjD9oA (accessed on 12 July 2023).
  6. Cheng, M.; Lu, Y.; Zhu, H.; Xiao, J. Measuring CO2 emissions performance of China’s construction industry: A global Malmquist index analysis. Environ. Impact Assess. Rev. 2022, 92, 106673. [Google Scholar] [CrossRef]
  7. You, K.; Yu, Y.; Cai, W.; Liu, Z. The change in temporal trend and spatial distribution of CO2 emissions of China’s public and commercial buildings. Build. Environ. 2023, 229, 109956. [Google Scholar] [CrossRef]
  8. Chau, C.K.; Leung, T.M.; Ng, W.Y. A review on Life Cycle Assessment, Life Cycle Energy Assessment and Life Cycle Carbon Emissions Assessment on buildings. Appl. Energy 2015, 143, 395–413. [Google Scholar] [CrossRef]
  9. Zabalza Bribián, I.; Aranda Usón, A.; Scarpellini, S. Life cycle assessment in buildings: State-of-the-art and simplified LCA methodology as a complement for building certification. Build. Environ. 2009, 44, 2510–2520. [Google Scholar] [CrossRef]
  10. Malmqvist, T.; Glaumann, M.; Scarpellini, S.; Zabalza, I.; Aranda, A.; Llera, E.; Díaz, S. Life cycle assessment in buildings: The ENSLIC simplified method and guidelines. Energy 2011, 36, 1900–1907. [Google Scholar] [CrossRef]
  11. Soust-Verdaguer, B.; Llatas, C.; García-Martínez, A. Simplification in life cycle assessment of single-family houses: A review of recent developments. Build. Environ. 2016, 103, 215–227. [Google Scholar] [CrossRef]
  12. Soust-Verdaguer, B.; Llatas, C.; García-Martínez, A. Critical review of bim-based LCA method to buildings. Energy Build. 2017, 136, 110–120. [Google Scholar] [CrossRef]
  13. Eleftheriadis, S.; Duffour, P.; Mumovic, D. BIM-embedded life cycle carbon assessment of RC buildings using optimised structural design alternatives. Energy Build. 2018, 173, 587–600. [Google Scholar] [CrossRef]
  14. Antón, L.Á.; Díaz, J. Integration of Life Cycle Assessment in a BIM Environment. Procedia Eng. 2014, 85, 26–32. [Google Scholar] [CrossRef]
  15. Shafiq, N.; Nurrudin, M.F.; Gardezi, S.S.S.; Kamaruzzaman, A.B. Carbon footprint assessment of a typical low rise office building in Malaysia using building information modelling (BIM). Int. J. Sustain. Build. Technol. Urban Dev. 2015, 6, 157–172. [Google Scholar] [CrossRef]
  16. Peng, C. Calculation of a building’s life cycle carbon emissions based on Ecotect and building information modeling. J. Clean. Prod. 2016, 112, 453–465. [Google Scholar] [CrossRef]
  17. Abanda, F.H.; Oti, A.H.; Tah, J.H.M. Integrating BIM and new rules of measurement for embodied energy and CO2 assessment. J. Build. Eng. 2017, 12, 288–305. [Google Scholar] [CrossRef]
  18. Yang, X.; Hu, M.; Wu, J.; Zhao, B. Building-information-modeling enabled life cycle assessment, a case study on carbon footprint accounting for a residential building in China. J. Clean. Prod. 2018, 183, 729–743. [Google Scholar] [CrossRef]
  19. Bueno, C.; Pereira, L.M.; Fabricio, M.M. Life cycle assessment and environmental-based choices at the early design stages: An application using building information modelling. Archit. Eng. Des. Manag. 2018, 14, 332–346. [Google Scholar] [CrossRef]
  20. Panteli, C.; Kylili, A.; Fokaides, P.A. Building information modelling applications in smart buildings: From design to commissioning and beyond A critical review. J. Clean. Prod. 2020, 265, 121766. [Google Scholar] [CrossRef]
  21. Lu, K.; Jiang, X.; Tam, V.W.; Li, M.; Wang, H.; Xia, B.; Chen, Q. Development of a carbon emissions analysis framework using building information modeling and life cycle assessment for the construction of hospital projects. Sustainability 2019, 11, 6274. [Google Scholar] [CrossRef]
  22. Ramesh, T.; Prakash, R.; Shukla, K.K. Life cycle energy analysis of buildings: An overview. Energy Build. 2010, 42, 1592–1600. [Google Scholar] [CrossRef]
  23. Mao, R.; Duan, H.; Gao, H.; Wu, H. Characterizing the Generation and Management of a New Construction Waste in China: Glass Curtain Wall. Procedia Environ. Sci. 2016, 31, 204–210. [Google Scholar] [CrossRef]
  24. Feng, C.; Ma, F.; Wang, R.; Zhang, L.; Wu, G. The operation characteristics analysis of a novel glass curtain wall system by using simulation and test. J. Build. Eng. 2022, 51, 104311. [Google Scholar] [CrossRef]
  25. Matic, D.; Roset Calzada, J.; Todorovic, M.S. Renewable energy sources-integrated refurbishment approach for low-rise residential prefabricated building in Belgrade, Serbia. Indoor Built Environ. 2016, 25, 1016–1023. [Google Scholar] [CrossRef]
  26. Yu, G.; Yang, H.; Yan, Z.; Kyeredey Ansah, M. A review of designs and performance of façade-based building integrated photovoltaic-thermal (BIPVT) systems. Appl. Therm. Eng. 2021, 182, 116081. [Google Scholar] [CrossRef]
  27. Sun, H.; Heng, C.K.; Tay, S.E.R.; Chen, T.; Reindl, T. Comprehensive feasibility assessment of building integrated photovoltaics (BIPV) on building surfaces in high-density urban environments. Sol. Energy 2021, 225, 734–746. [Google Scholar] [CrossRef]
  28. Alim, M.A.; Tao, Z.; Hassan, M.K.; Rahman, A.; Wang, B.; Zhang, C.; Samali, B. Is it time to embrace building integrated Photovoltaics? A review with particular focus on Australia. Sol. Energy 2019, 188, 1118–1133. [Google Scholar] [CrossRef]
  29. Ghosh, A. Potential of building integrated and attached/applied photovoltaic (BIPV/BAPV) for adaptive less energy-hungry building’s skin: A comprehensive review. J. Clean. Prod. 2020, 276, 123343. [Google Scholar] [CrossRef]
  30. Tang, Y.; Ji, J.; Xie, H.; Zhang, C.; Tian, X. Single- and double-inlet PV curtain wall systems using novel heat recovery technique for PV cooling, fresh and supply air handling: Design and performance assessment. Energy 2023, 282, 128797. [Google Scholar] [CrossRef]
  31. Xiong, W.; Deng, X.; Liu, Z.; Liu, R.; Wu, Z.; Zhang, L. Sustainability and efficient use of building-integrated photovoltaic curtain wall array (BI-PVCWA) systems in building complex scenarios. Energy Build. 2022, 276, 112477. [Google Scholar] [CrossRef]
  32. Tang, Y.; Ji, J.; Wang, C.; Xie, H.; Ke, W. Combining photovoltaic double-glazing curtain wall cooling and supply air reheating of an air-conditioning system: Energy-saving potential investigation. Energy Convers. Manag. 2022, 269, 116097. [Google Scholar] [CrossRef]
  33. Fan, W.; Zhang, J.; Zhou, J.; Li, C.; Hu, J.; Hu, F.; Nie, Z. LCA and Scenario Analysis of Building Carbon Emission Reduction: The Influencing Factors of the Carbon Emission of a Photovoltaic Curtain Wall. Energies 2023, 16, 4501. [Google Scholar] [CrossRef]
  34. Fenner, A.E.; Kibert, C.J.; Woo, J.; Morque, S.; Razkenari, M.; Hakim, H.; Lu, X. The carbon footprint of buildings: A review of methodologies and applications. Renew. Sustain. Energy Rev. 2018, 94, 1142–1152. [Google Scholar] [CrossRef]
  35. NS-EN 15804:2012+A2:2019; Sustainability of Construction Works—Environmental Product Declarations—Core Rules for the Product Category of Construction Products. European Committee for Standardization: Brussels, Belgium, 2019.
  36. Gan, V.J.L.; Deng, M.; Tse, K.T.; Chan, C.M.; Lo, I.M.C.; Cheng, J.C.P. Holistic BIM framework for sustainable low carbon design of high-rise buildings. J. Clean. Prod. 2018, 195, 1091–1104. [Google Scholar] [CrossRef]
  37. Azhar, S. Building Information Modeling (BIM): Trends, Benefits, Risks, and Challenges for the AEC Industry. Leadersh. Manag. Eng. 2011, 11, 241–252. [Google Scholar] [CrossRef]
  38. Teng, Y.; Xu, J.; Pan, W.; Zhang, Y. A systematic review of the integration of building information modeling into life cycle assessment. Build. Environ. 2022, 221, 109260. [Google Scholar] [CrossRef]
  39. Naneva, A.; Bonanomi, M.; Hollberg, A.; Habert, G.; Hall, D. Integrated BIM-Based LCA for the Entire Building Process Using an Existing Structure for Cost Estimation in the Swiss Context. Sustainability 2020, 12, 3748. [Google Scholar] [CrossRef]
  40. Latiffi, A.A.; Brahim, J.; Mohd, S.; Fathi, M.S. Building Information Modeling (BIM): Exploring Level of Development (LOD) in Construction Projects. Appl. Mech. Mater. 2015, 773–774, 933–937. [Google Scholar] [CrossRef]
  41. Level of Development Specification for Building Information Model. Available online: https://bimforum.org/lod/ (accessed on 19 July 2023).
  42. GB/T 51366-2019; Standard for Building Carbon Emission Calculation. Ministry of Housing and Urban-Rural Development of the People’s Republic of China: Beijing, China, 2019.
  43. Zhang, Y.S. Assessment of Carbon Dioxide and Carbon Reduction in the Life Cycle of Buildings. Master’s Thesis, National Cheng Kung University, Taiwan, China, 2002. [Google Scholar]
  44. Zhu, B.L. Research on Low-Carbon Design of Building-Integrated Photovoltaics (BIPV)—A Casestudy of Suzhou. Master’s Thesis, Suzhou University of Science and Technology, Suzhou, China, 2022. [Google Scholar]
  45. Wang, Z. Investigation of Life Cycle Carbon Emission Assessment and Low-Carbon Design Method of High-Rise Buildings. Ph.D. Thesis, Harbin Institute of Technology, Harbin, China, 2021. [Google Scholar]
  46. Analysis of the Cost of Photovoltaic Curtain Walls in Chengdu in 2022. Available online: https://mp.weixin.qq.com/s/ZmL3-W-S7Pyu6HgcRp7IbQ (accessed on 11 August 2023).
  47. Cho, S.-H.; Chae, C.-U. A Study on Life Cycle CO2 Emissions of Low-Carbon Building in South Korea. Sustainability 2016, 8, 579. [Google Scholar] [CrossRef]
  48. Xia, B.; Li, X. Analysis and comparison on the potential of low-carbon architectural design strategies. Sustain. Comput Inform. Syst. 2019, 21, 204–211. [Google Scholar] [CrossRef]
  49. Hong, M.; Feng, C.; Xu, Z.; Zhang, L.; Zheng, H.; Wu, G. Performance study of a new type of transmissive concentrating system for solar photovoltaic glass curtain wall. Energy Convers. Manag. 2019, 201, 112167. [Google Scholar] [CrossRef]
Figure 1. Building Carbon Emission Analysis Framework Based on BIM-LCA.
Energies 16 07030 g001
Figure 2. Boundary Definition of Building Life Cycle.
Energies 16 07030 g002
Figure 3. Building Model Drawing.
Energies 16 07030 g003
Figure 4. Carbon emissions at all stages of the entire life cycle of buildings.
Energies 16 07030 g004
Figure 5. Carbon emission reduction analysis process.
Energies 16 07030 g005
Figure 6. Before and After: Curtain Wall Facade with PV System.
Energies 16 07030 g006
Figure 7. Photovoltaic curtain wall power generation.
Energies 16 07030 g007
Figure 8. Carbon emissions at all stages of the entire life cycle of photovoltaic curtain wall buildings.
Energies 16 07030 g008
Figure 9. Comparison of carbon emissions between glass curtain wall buildings and photovoltaic curtain wall buildings.
Energies 16 07030 g009
Table 1. Overview of Construction Engineering.
Physical Building DrawingsTypeDescribe
Energies 16 07030 i001LocationZhenjiang, Jiangsu
Floor area (m2)4463.67
Total building area (m2)64,272.38
Number of building floors (floors)22
Building height (m)98.4
Design service life (years)50
Main structural typesFrame structure
Table 2. Carbon emissions from building materials production.
MaterialConsumptionUnitCarbon Emissions (tCO2-eq)Proportion
Aerated concrete block10,166.38m32958.427.64%
Concrete26,785.61m37232.1118.67%
Curtain wall25,499.33m22906.927.51%
Wood233.74m37.010.02%
Glass562.58m247.260.12%
Coal gangue solid brick86.59m31.970.01%
Rebar10,283.58t24,063.5862.13%
Coating1681.84t1513.65 3.91%
Total--38,730.93100%
Table 3. Carbon emissions from the production and transportation of building materials.
Carbon EmissionsProduction of Building MaterialsTransportation of Building MaterialsTotal
tCO2-eq38,730.93 836.25 39,567.18
Table 4. Carbon emissions from building construction.
EngineeringEnergyConsumptionUnitCarbon Emissions (tCO2-eq)
Earthworkdiesel oil3369.18kg10.43
Reinforcement workselectricity760,625.05 kWh535.10
Concrete Workelectricity1,455,422.90 kWh1023.89
Total1569.42
Table 5. Carbon emissions during the operational stage of the building.
Building BlockEnergy Consumption TypeEnergyAEC (kWh) *ACE (tCO2-eq/Year) **Total (tCO2-eq)Proportion
Block A and podium buildingLES ***electricity 1,263,473888.85 44,442.66 33.80%
Buildings B and CLESelectricity579,282407.52 20,376.24 15.50%
The entire buildingHVACelectricity1,895,0811333.1966,659.4750.70%
Total--3,737,8362629.57131,478.38100%
* AEC stands for annual energy consumption. ** ACE stands for Annual carbon emissions. *** LES stands for lighting and elevator systems (incl. sockets).
Table 6. Carbon emissions throughout the entire life cycle of buildings.
StageCarbon Emissions (tCO2-eq)Annual Carbon Emissions per Square Meter of Building (kgCO2-eq/m2·Year)Proportion
Building materials production and transportation39,567.1812.3122.89%
Building construction1569.420.490.91%
Building operation131,478.3840.91 76.07%
Building demolition214.030.07 0.13%
Total172,829.0153.78100%
Table 7. Annual power generation of photovoltaic curtain walls on different facades of buildings.
Building FacadeArea (m2)Power Generation (MWh/Year)Power Generation (kWh/m2·Year)
east facade3106.20254.0081.77
west facade2855.24231.7381.16
south facade8900.70783.1587.99
north facade8265.68390.9947.30
Table 8. Estimated total power generation in 25 years.
Building FacadePower Generation (MWh)
east facade5750.45
west facade5246.45
south facade17,730.42
north facade8852.00
total37,579.32
Table 9. BCR and SIPP of photovoltaic curtain walls.
Building FacadeArea (m2)M0M1M2NBCRTSIPP
east facade3106.204,450,849.13 4,038,062.60 178,033.97 1.10 22.68
west facade2855.24 4,060,752.47 3,711,815.90 162,430.10 1.09 22.85
south facade8900.77 13,723,343.95 11,570,995.80 548,933.76 1.19 21.08
north facade8265.68 6,851,445.89 10,745,385.30 274,057.84 0.64 39.21
Table 10. Comparison of carbon emissions during material production and transportation stages before and after the replacement of building curtain walls.
PeriodCurtainArea (m2)Carbon Emission Factors for Building Materials Production (kgCO2-eq/m2)Carbon Emission Factors for Building Materials Transportation
(kgCO2-eq/t·km)
Carbon Emissions (tCO2-eq)
Before replacementCurtain wall25,499.33114.000.1042979.85
After replacementPhotovoltaic curtain wall14,862.21197.00 0.1045881.99
Curtain wall10,637.12114.000.1041243.05
Difference +4145.19
Table 11. Carbon reduction of photovoltaic curtain walls during the operation stage.
Power Generation PartArea (m2)Power Generation (kWh/Year)Electricity Carbon Emission Factor (kgCO2-eq/kWh)Annual Carbon Reduction (kgCO2-eq/Year)Total Carbon Reduction (tCO2-eq)
east facade photovoltaic curtain wall3106.20230,018.040.7035161,817.698090.88
west facade photovoltaic curtain wall2855.24 209,858.010.7035147,635.11 7381.76
south facade photovoltaic curtain wall8900.77 709,216.740.7035498,933.98 24,946.70
Total 40,419.34
Table 12. Analysis of the impact of the cost of photovoltaic curtain walls and the efficiency of solar panels on the feasibility of photovoltaic curtain walls on each façade.
Influence FactorBuilding Facade−10%−5%05%10%
BCR
Cost of photovoltaic curtain walleast facade1.221.16 1.10 1.05 1.00
west facade1.221.15 1.09 1.04 0.99
south facade1.321.25 1.19 1.13 1.08
north facade0.710.67 0.64 0.61 0.58
Relative change rate11.11%5.26%0−4.76%−9.09%
Solar panel efficiencyeast facade0.991.05 1.10 1.16 1.21
west facade0.981.04 1.09 1.15 1.20
south facade1.071.13 1.19 1.25 1.30
north facade0.570.61 0.64 0.67 0.70
Relative change rate−10.00%−5.00%05.00%10.00%
Table 13. Static incremental investment payback period for photovoltaic curtain walls on each facade.
Building FacadeM1Power Generation (kWh/Year)Annual Carbon Reduction (kgCO2-eq/Year)M2TSIPP
east facade4,038,062.60 230,018.04 161.82 187,435.57 21.54
west facade3,711,815.90 209,858.01 147.64 171,007.70 21.71
south facade11,570,995.80 709,216.74 498.93 577,921.82 20.02
Disclaimer/Publisher’s Note: The statements, opinions and data contained in all publications are solely those of the individual author(s) and contributor(s) and not of MDPI and/or the editor(s). MDPI and/or the editor(s) disclaim responsibility for any injury to people or property resulting from any ideas, methods, instructions or products referred to in the content.

