Abstract
For lignite intense regions such as the case of Western Macedonia (WM), the production and utilization of green hydrogen is one of the most viable ways to achieve near zero emissions in sectors like transport, chemicals, heat and energy production, synthetic fuels, etc. However, the implementation of each technology that is available to a respective sector differs significantly in terms of readiness and the current installation scale of each technology. The goal of this study is the provision of a transition roadmap for a decarbonized future for the WM region through utilizing green hydrogen. The technologies which can take part in this transition are presented, along with the implementation purpose of each technology, and the reasonable extension that each technology could be adopted in the present context. The WM region’s limited capacity for green hydrogen production leads to certain integration scenarios, with regards to the required hydrogen, electrolyzer capacities, and required power, whereas an environmental assessment is also presented for each scenario.
1. Introduction
The world is currently experiencing a profound transformation with regards as to how energy is generated, transformed, stored, and used across diverse applications. There is a growing concern about the transition towards a society where energy no longer contributes to climate change and local pollution, and instead fossil fuels are replaced with renewable energy sources (RES). The Paris Agreement has been adopted by 196 countries with the target of reducing greenhouse gas emissions and limiting global warming below 2 °C by 2050 [1]. To reach climate neutrality, countries must commit to a timely decarbonization in the energy sector that also includes the lignite phase-out. Lignite-intensive regions, such as the Western Macedonia region, must overcome significant technological, economic, and social challenges in their transition towards a low-carbon economy. In the revised National Energy and Climate Plan (NECP), the Greek Government is committed to the decommission all lignite-fired power plants by 2028 [2]. Consequently, WM is urged to rapidly adapt to the phasing-out of coal. This poses a substantial challenge in terms of transforming the WM region’s economy from its almost complete lignite dependency into other, diversified economic activities. Simultaneously, it is critical to safeguard social cohesion and future prospects for the local communities [3,4].
The European (as well as the Greek) energy transition is underway with renewable hydrogen being a key component in this transition. Hydrogen is a versatile, clean, and flexible energy vector, capable of becoming a suitable medium to enable the large-scale RES integration in various industrial, residential, and commercial activities. Fuel cells and hydrogen (FCH) technologies already exist and are mature for deployment in most segments, such as transportation, heating, power generation, and as feedstock for industrial applications. There are many ways of producing hydrogen, but the sustainability of each method is governed by the utilized feedstock and energy source, which are mostly dictated by region specific aspects. For example, hydrogen can be produced via coal gasification under high pressures and temperatures to form synthesis gas; a mixture comprising mainly CO and H2 [5]. Coal gasification has never been deployed in Greece and its large-scale implementation would require significant infrastructure investments regarding carbon capture, utilization, and storage. The large economic impact along with the imminent phase-out of coal, renders this option unfavorable against alternatives. The most common, and widely implemented hydrogen production process is natural gas (NG) steam reforming. Synthesis gas is produced by processing natural gas with high-temperature steam, and subsequently, through the water gas shift reaction, additional hydrogen is generated. Hydrogen from reformed natural gas using steam accounts for most of the hydrogen produced globally.
The main investigated renewable hydrogen production process is electrolysis. Electrolysis involves the use of electrochemical devices (known as water electrolyzers) to separate water molecules into hydrogen and oxygen by applying an electrical current. In this process, purified water is introduced to the system and subsequently directed towards the electrodes via bipolar plates and porous transport layers. At the electrode, the water is split into oxygen and hydrogen, with the ions (typically H+ or OH−) crossing though the liquid or solid membrane electrolyte. The membrane or diaphragm situated between the two electrodes is critical for keeping the produced gases (hydrogen and oxygen) separated and preventing their mixing. Electrolyzer designs are categorized into low- and high-temperature devices. Low-temperature electrolysis can be implemented with either a polymer electrolyte membrane (PEM) (50–80 °C) or alkaline electrolyzers (70–90 °C). Due to material requirements, PEM stacks are more expensive than alkaline electrolyzers [6]. Both PEM and alkaline electrolyzers have compact and simple system designs but PEM technology has a higher performance efficiency. On the other hand, alkaline designs are very reliable, achieving lifetimes of over 30 years. High-temperature electrolysis is used with solid oxide electrolyzer cells (SOEC) (700–850 °C). SOECs can be coupled with heat-producing technologies for higher system efficiencies and produce high-quality waste heat that can be exploited resulting in efficiencies that can often surpass 100%. Additionally, solid oxide cells are reversible, meaning that they can operate both as a fuel cell and an electrolyzer. On the downside, SOECs demonstrate faster degradation and shorter lifetimes. SOECs are today deployed at the kW-scale, although some current demonstration projects reached 1 MW. There are also additional renewable hydrogen production processes such as photoelectrochemical and photocatalytic H2 production that present promising results but are currently at lower technological readiness levels for large scale deployment in the WM region [7,8,9]. Overall, water electrolysis technologies are currently deployed in demonstration as well as large-scale industrial projects and are expected to significantly increase their efficiencies and reduce the associated costs in the short- and medium-term [6,10].
The intermittency of renewable energy sources (solar, wind) is an obstacle to continuously producing green hydrogen and would require a reliable and cost-efficient energy storage system [11]. Several energy storage technologies exist including pumped hydro storage, compressed-air energy storage, electrochemical storage, mechanical energy storage, and thermal energy storage [12]. Their classification varies in terms of discharge time of each technology, the scale in which they can be deployed, and their short-term or long-term storage capabilities. The readily available and mature storage solution, in terms of implementation for the WM region, is pressurized storage tanks where hydrogen is either in gas or liquid form (liquefaction). The produced hydrogen from the renewable-powered electrolysis can be used either as a fuel for transport, displacing oil in light vehicles, railways, and marine applications, or as a feedstock for industrial applications. An alternative potential use of the produced hydrogen is its conversion into methane by exploiting the CO2 emissions from the nearby power plants. Figure 1 gives a schematic representation of the sections coupled under the use of hydrogen, their main medium of energy storage and transfer, and sectors that use it as their feedstock.
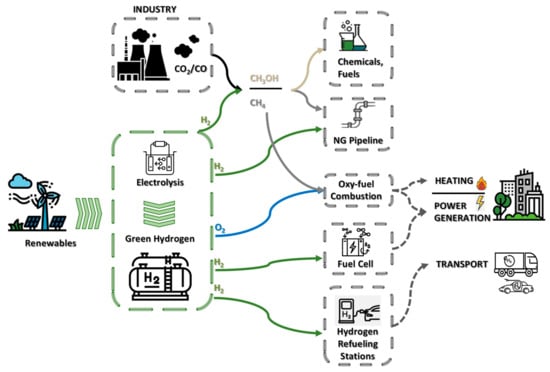
Figure 1.
Overview of sectors available for green hydrogen adoption.
There have been studies that envisioned pathways to decarbonize WM. Renewable energy is believed to be the key element in the transition to a decarbonized future for areas like WM. The decommissioning of 4.3 GW of lignite power plants in the region by 2028 will result in a huge power generation gap [13], that is necessary to be filled by another environmentally friendly generation technology [14]. The high solar potential of the region (1365 kWh/kWp), in combination with vast areas of open-pit lignite mines that will cease operation in the nearby future, indicate that solar photovoltaics (PV) will be the main technology for a carbon-free, power generation. Specifically, a study that includes the region of Western Macedonia [15], shows that the mining area suitable for PV installations (91.8 km2) can house a PV capacity of 8.1 GW. The deployed electricity grid infrastructure of the area can at least cover a capacity of 4.3 GW, equal to the combined capacity of operating and shut down lignite power plants of the region. The difference between the potential deployment of PVs and the existing exploitation capabilities reveals the potential for additional technologies being implemented in the region to maximize the utilization of solar power. Currently, there are approximately 0.46 GW of installed and operating photovoltaics connected to the grid in the Western Macedonia precinct [16]. However, the intermittent nature of solar power is not favorable in terms of management of power sources distribution and requires the integration of energy storage to mitigate the lack of power during the night and the uneven production during the day.
The identification and evaluation of potential measures and actions mainly on a regional level, has been the result of efforts to promote the just transition of WM to a coal-free era. For instance, circular economy practices that integrate PV parks, biomass, and waste derived fuels for heat production were investigated in [17]. Water resource management (which is not explicitly tackled in any climate change plan so far) is another topic that is examined in [18]. Overall, studies focus on the rehabilitation of the mining surface area, the spatial planning of the area, and the finding of alternative use cases for carbon [19,20]. The socio-economic impact of the suggested interventions in the area is assessed in order to understand public awareness and acceptance is towards the post-lignite era [21]. Finally, there is also the opinion that the schedule for delignifying the WM region should be postponed for the years past 2028, because it is deemed inevitable according to the actions of the “Just Transition Plan” to have a marginalized and degraded area if the closing of lignite-fired plants is completed expeditiously [17].
Due to the pressing need for economic diversification and decarbonization, the emerging concept of hydrogen valleys that involves the establishment of integrated hydrogen ecosystems that encompass hydrogen production, storage, distribution, and utilization has been brought forward. It is the next step scale-wise after a series of pilot/demo projects that the Clean Energy Partnership and the European Commission endorsed [22]. Hydrogen valleys are envisaged as an important milestone towards the wider implementation of a hydrogen economy. The hydrogen valleys could range from small-scale (0.3–0.5 kt/y) to large-scale hydrogen valleys (>4 kt/y). Since the capital and operating expenses of the proposed solutions are exceeding the state-of-the-art and currently employed fossil-based technologies, the EU has prioritized the funding of the creation and operation of several hydrogen valley projects across Europe. Their goal is to cover and implement green hydrogen uses across its full value chain but also with a clear regional scope around existing infrastructure. Currently, there is a number of hydrogen valley projects under development in Europe and worldwide. The first hydrogen valley in Europe is “H2 Energy Applications in Valley Environments for Northern Netherlands (HEAVENN)” [23]. HEAVENN aims to create a regionally integrated energy system in the northern Netherlands by consolidating multiple hydrogen sectors. This involves merging 13 significant hydrogen projects in the region, encompassing both local and imported green hydrogen production. Industrial, commercial, and residential uses demonstrate the practical applications of fuel cell and hydrogen technologies. The goal is to showcase the viability of hydrogen for transportation, energy, and industrial purposes, thus establishing a comprehensive value chain for hydrogen deployment in the region. In Greece, there are currently two hydrogen valleys under development: (i) the “Crete-Aegean Hydrogen Valley: Crave-H2” focusing on power, mobility, and industrial applications of hydrogen in the island of Crete; and (ii) the TRIERES valley centered around the Motor Oil refinery in the regions of Western Greece, Peloponnese, and Attica.
With the current momentum that hydrogen is gaining, and the flexibility that it offers with multiple exploitation options (transport sector, ammonia feedstock, heat and energy production, synthetic fuels, etc.), it represents a viable pathway to follow for the decarbonization of the sectors that require hydrogen [24]. Solar energy is the source that feeds the electrolyzer with green electricity, according to the maximum available space in the WM region for PV installations. The scope of this study is to provide a roadmap for the transition of WM to a decarbonized future through exploiting green hydrogen production powered by solar energy and pre-assess the required capacities and energetic requirements of these technologies. Its aim is to present which technologies can take part in this transition, the implementation purpose of each technology and to what reasonable extension each technology will be adopted.
Section 2 gives an overall presentation of the already deployed assets in the area, the strategic efforts that are currently being put into hydrogen infrastructures and outlines the available hydrogen production technologies. Section 3 presents the scenarios associated with the development of each technology and gives a generic description of each technology involved alongside its technical constraints and characteristics. Section 3 also presents an assessment of every scenario and its potential deployment in the region with respect to the required electrolysis and hydrogen requirements, the environmental footprint of the investigated technologies as well as potential efficiency improvements. Finally, Section 4 presents the future perspectives and challenges of this work, whereas Section 5 presents the key conclusions of this research.
2. Emerging Technology Scenarios for the Western Macedonia Region
In this section, the investigated hydrogen uses relevant for the Western Macedonia region are covered by integration scenarios of every technology investigated. A general description as well as the technical details of each solution are presented. The main aspect that the scenarios are utilizing in this study is the existing relevant infrastructure that is established in mainland Greece and is presented in Figure 2. The Greek energy production mix is, in general, dependent on natural gas since most of the base power plants are combined cycle plants [25]. The price volatility, predominantly of EU natural gas [26], alongside Greece’s dependance on it, has brought forward the need for re-opening formerly closed lignite plants or postponing the closure of others. This means that the situation presented in Figure 2 with regards to lignite plants can shift in the short term.
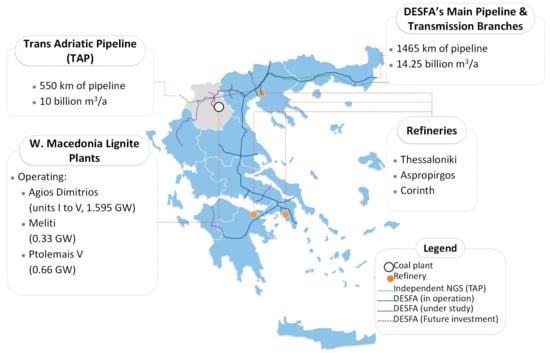
Figure 2.
Overview of plants, refineries, and gas transmission networks related to this study.
Data regarding the technology characteristics, the respective costs, and limitations that are involved during deployment and operation of the units are presented. Every subsection refers to the individual implementation of the technologies under consideration. The implementation of each technology is not exclusive; they can be deployed simultaneously and to different scales to cover the needs of multiple sectors and uses. The main constraint for the implementation of individual or multiple technologies at once, is the maximum available area in WM for PV installations, which according to the study in [14], is approximately 8.1 GW.
Considering that the natural gas infrastructure and, in particular, the Trans-Adriatic Pipeline (TAP) crosses WM, operating from the Greek border with Turkey to southern Italy, the production and the consequent injection of methane or even hydrogen in the pipelines represents a reasonable option for exploiting assets of the region. According to the demand forecasts of the Greek national natural gas grid operator (DESFA) for the next decade that are part of its ten-year development plan 2023–2032 [27], new pipeline infrastructure will be added to its portfolio that will be 100% hydrogen-ready and an injection of hydrogen will also be demonstrated. TAP’s current operational capacity is 10 billion cubic meters annually (bcm/y) and is expected to increase up to 20 bcm/y through upcoming additions and modifications [28]. On the other hand, DESFA’s network operating capacity is around 14 bcm/y. Overall, expanding Greece’s gas network infrastructure to accommodate hydrogen injection aligns with the transition towards a sustainable and low-carbon energy future, offering a viable pathway for WM to achieve its climate and energy goals.
2.1. Hydrogen for Electricity Generation/Storage
A fuel cell utilizes the chemical energy stored in hydrogen or another fuel to generate electricity in a clean and efficient manner. When hydrogen is used as a fuel, electricity, water, and heat are the only products. Fuel cells are unique in terms of the variety of their potential applications due to their modular operation and the different scales to which they can be applied; they can provide power for systems as large as utility power stations and as small as laptop computers. Fuel cells have diverse applications across transportation, material handling as well as stationary, portable, and emergency backup power applications. They offer numerous advantages when compared with conventional combustion-based technologies, currently used in many power plants and passenger vehicles. Fuel cells demonstrate higher attained efficiencies than combustion engines, with efficiencies that could reach up to 80%. They also exhibit lower emissions than combustion engines since hydrogen fuel cells emit only water; there are no carbon dioxide emissions and air pollutants that create smog and cause health problems at the point of operation. Also, fuel cells present lower noise levels as they have fewer moving parts [29].
There are several limitations regarding power generation by hydrogen fuel cells, ranging from the readiness of technologies, the need for storage for decentralized plants, and the availability of a fuel distribution network for centralized ones. The most crucial one is the cost of investment. Recent technological advances and demonstration projects have lowered the cost of hydrogen applications, and it is expected that the cost will be even lower in the upcoming years [30]. With costs decreasing and the existence of a growing demand for low-carbon alternatives, H2 fuel cells are considered a sustainable and promising option for WM to exploit renewable energy production. The integration of hydrogen storage facilities would be necessary, with capacities depending on the time that the fuel cell is required to run at its nominal power (4 to 12 h of run time). Hydrogen storage in tanks offers a medium- to long-term storage capability.
2.2. Hydrogen Used for Transportation Purposes (Cars and Buses of the Region)
As the market share of renewable generation is increased, vehicles powered by electricity become more and more attractive due to their ability to exploit renewable energy efficiently. These zero and low emission vehicles can be either battery electric vehicles, plug-in hybrid electric vehicles, or hydrogen fuel cell vehicles (FCV). Based on the NECP, the Greek Government aims to have almost 30% of the newly added vehicles as electric by 2030. Since hydrogen is the focus of this study, it is considered that FCVs are the dominant technology for electric vehicles in the WM region.
Fuel cell electric vehicles use an electric motor that is powered by a fuel cell that converts hydrogen into electricity. The propulsion system is often coupled with a battery as an additional power source to increase the vehicle’s overall capability and efficiency. Compared with conventional internal combustion engines, FCVs have a higher efficiency, quieter operation and the only emissions being produced are water vapor and air. They exhibit similar refueling time to that of a conventional vehicle and have a similar driving range. The most common fuel cell technology used in FCVs is PEM. Major automobile manufacturers are gradually introducing a limited yet expanding range of FCVs to the public, in conjunction with the capacity of the developing infrastructure in the specific market/region. A typical example of a commercial hydrogen car is the Toyota Mirai [31]. Fuel cell buses are also present in commercial markets but mainly in demonstration projects [32].
In the case of WM where no infrastructure is currently present for hydrogen refueling stations (HRS), having many privately-owned hydrogen cars injected to the overall fleet would render the design of a HRS network difficult due to the stochastic nature of the car routes. On the other hand, public transport vehicles (city and intercity buses) have pre-determined suburban and long-distance routes and the kilometers that they travel daily do not exceed certain ranges. This fact helps with the design of the HRS network since a level of uncertainty is taken out of the design framework. The result for the region would be the replacement of the public transport fleet with fuel cell buses (total size or segments of the fleet) and the integration of as many fuel cell cars as the infrastructure can withstand relevant to the production and refueling capacity capabilities of the HRS network.
2.3. Hydrogen Transportation to Refineries
Crude oil is dominating the energy landscape and will continue to do so in the coming years. However, due to the current energy transition, refineries are pressured to reduce carbon emissions and achieve carbon neutrality. This fact, in combination with the rise of electrification and the increased international competition, intensifies the pressure on the European refineries. As the demand for carbon-containing products will persist and even grow in the coming years, refineries must prioritize to reduce emissions and stay competitive at the same time [33]. Refineries are among the highest industrial hydrogen consumers. Processes such as hydrocracking and hydrotreatment are utilizing hydrogen in vast amounts for the removal of the contained heteroatoms in several petroleum fractions such as nitrogen and sulphur. It is estimated that 33% of the total global hydrogen demand is consumed by refineries and 20% of the refinery’s emissions are associated with hydrogen production (mostly by natural gas), meaning that significant emissions can be avoided if employing green hydrogen production technologies. Hydrogen is mostly produced internally through the cracking of hydrocarbons or the reforming of natural gas (internally or bought from external sources). It is estimated that a maximum of 50% of the used hydrogen is bought externally from natural gas reforming whereas the rest is derived from internal processes [10].
The replacement of the NG-derived hydrogen with renewable hydrogen produced by electrolysis would not require the modification of existing refinery processes and therefore require minimum infrastructure modification investments. It requires, however, the transportation of the produced renewable hydrogen from the production site in Western Macedonia to the respective refinery location. The employed transportation option largely depends on the transported hydrogen amounts, transportation distance, and costs [34]. This option would completely or partially avoid the purchase of externally produced NG-derived hydrogen as well as avoid the associated direct and indirect carbon emissions.
2.4. Hydrogen Injection into the Natural Gas Pipeline
The European gas grid is an important asset in the energy strategy of Europe. Natural gas imported from non-EU countries has been flowing uninterrupted to EU countries to fulfil the energy needs of the continent. However, recent events (Russia’s invasion of Ukraine, interruption of global supply chain) have led to the EU reconsidering its objectives as well as accelerating the energy priorities in Europe. Green hydrogen is a strategic priority of the European green deal and the existing gas grid could serve as a potential storing and transportation medium of renewable hydrogen [35].
Renewable hydrogen injection in the natural gas grid has been proposed in several past works and is currently under investigation. Due to the lack of an extensive hydrogen transportation infrastructure, the gas grid could serve as a means of storing intermittent renewable energy in the form of hydrogen into the grid and transport it to the end-users with minimum losses (0.7% for gas grid vs. 2–6% for electricity grids) [36]. Hydrogen injection will also reduce the associated greenhouse gas (GHG) emissions of the gas end-use [37]. On the other hand, challenges regarding the upper H2 blending limits for certain end-uses [38], safety and practical issues (hydrogen embrittlement, leakage and gas measurements) [37,39], cost considerations as well as lack of a catholic national and international regulatory framework are issues that need to be resolved before the large-scale implementation of this option.
Based on a recent EU report, the actual gas grid is able to accept up to 10% vol. hydrogen, whereas after minimum modification, this limit can be increased to 20% blending [35]. These limits, however can, vary based on the end-use of the gas [38,40,41]. The exact determination of the upper limits for blending would require a detailed analysis of the used equipment and specifications across the complete value chain—from the pipelines to the storage tanks and end-uses. There is currently no general EU consensus/framework for the upper hydrogen blending limits; those limits can vary based on the employed country [42]. Greece has currently no existing regulatory framework for hydrogen blending in natural gas grid. However, based on DESFA, apart from the composition, there are certain quality specifications of the transmitted natural gas grid in the grid (Wobbe index, gross calorific value, relative density) (Table 1) [43]. Hydrogen injection affects the thermodynamic properties of the natural gas—H2 blend, which must be taken into consideration during the injection as well as during policymaking.

Table 1.
Natural gas quality specifications of the Greek natural gas grid (DESFA).
The end-use of the mixture could either be conducted in its blended form in commercial, industrial, or residential applications, and/or recovered and used in its pure form. The latter requires the consideration of additional hydrogen recovery techniques such as pressure swing adsorption, membranes, or electrochemical hydrogen compressors [44,45,46].
2.5. Methanation of Carbon Emissions from Nearby Power Plants of Methane into Pipelines
The power plants of the regions which are operating mainly with coal—lignite and secondly by natural gas, are the major CO2 emitters of the region. Even if all the lignite plants are shut down and converted to natural gas or biomass-fired plants, carbon emissions will continue to be an environmental burden, although in lower amounts than previously. Carbon dioxide could provide a valuable carbonaceous feedstock that could be used for the production of added-value chemicals and fuels. A viable solution is the methanation of the carbon dioxide emissions from the nearby lignite and/or natural gas power plants using renewable hydrogen produced by electrolysis.
Methanation is an exothermic process targeting the production of substitute natural gas (SNG) by combining CO and CO2 with the addition of H2 at the required stoichiometries. The simplicity and high efficiency of the methanation process have been critical factors in adopting this technology for converting waste feedstocks such as biomass [47,48] and energy-intensive industrial emissions [49,50] into methane. The primary reactions for the production of methane from syngas include [45]:
CO(g) + 3H2(g) → CH4(g)+ H2O(g) ΔH0 = −206 kJ/molCO
CO2(g) + 4H2(g) → CH4(g) + 2H2O(g) ΔH0 = −165 kJ/molCO2
CO2(g) + H2(g) → CO(g) + H2O(g) ΔH0 = +41 kJ/molCO2
Methane, as a product, has an already established market in industrial uses, residential heating, transportation, and/or power applications. Natural gas can be stored and transported as compressed natural gas (CNG) or as liquefied natural gas (LNG). One potential use of the produced methane from the CO2 emissions would be the injection in the existing natural gas infrastructure in order to by-pass possible implications of hydrogen injection into the grid [51]. For the Western Macedonia case, natural gas can either be used within the region or injected into the gas grid networks in the area.
2.6. Methanol Synthesis of Carbon Emissions from Nearby Power Plants
In the face of the current energy transition plan, there are many discussions on alternative carbon-containing molecules, that could partially replace or even substitute in the long-term, the fossil-derived carbon. Methanol (MeOH, CH3OH) due to its favorable chemical structure and properties, is investigated as an alternative solution to the current fossil-based products. It is a colorless water-soluble liquid with an octane number of 113 and a density half of that of gasoline. Methanol is already a vital component in the chemical industry serving as feedstock to produce chemicals such as formaldehyde, acetic acid, and olefins. It is also investigated as a potential fuel component, as a stand-alone fuel, in a blend with gasoline, for the production of biodiesel or in the form of methyl tert-butyl ether (MTBE) or dimethyl ether (DME) [52]. MeOH is also liquid at ambient conditions, which simplifies its storage and transportation, compared with other potential gaseous fuels, such as hydrogen [53]. This characteristic enables easy transportation through pipelines and storage in existing fueling stations, often requiring little or no modifications to existing infrastructures. Thanks to those favorable properties and its cleaner combustion characteristics, methanol has gained increased attention as a sustainable fuel in the aviation and marine industry [52,54].
Presently, the main method for producing methanol is covered with fossil-derived synthesis gas (natural gas and coal) that after H2/CO ratio adjustment is catalytically processed at 50–100 bar and temperatures between 200 and 300 °C (temperatures required for the activation of the employed catalyst) [55]. Gas-phase methanol synthesis is based on the following two reactions and reaction (3) [49]:
CO(g) + 2H2(g) → CH3OH(g) ΔH0 = −90 kJ/molCO
CO2(g) + 3H2(g) → CH3OH(g) + H2O(g) ΔH0 = −49 kJ/molCO2
The global methanol market was 98 Mt of methanol produced in 2019, which is expected to reach 135,000 kt in 2027 [56]. However, to avoid the related carbon emissions during the syngas generation, the carbon feedstock, and the added hydrogen, should be derived by renewable sources. In this case, the carbon feedstock is derived by the power plants of the region and the added renewable hydrogen by water electrolysis.
2.7. Methanation of Carbon Emissions and Using SNG for Oxyfuel Combustion
The combustion of fossil fuels such as natural gas or lignite results in the emissions of enormous amounts of CO2 into the atmosphere. The generated CO2 has to be captured with an efficient and economical way in order to comply with the set environmental regulations. However, the majority of those capture techniques are either not technologically mature or too expensive, which raises further the cost of CO2 if it is to be used as a chemical feedstock [57].
Oxy-fuel combustion is a process where methane is combusted using pure oxygen instead of air [58]. To regulate the temperature and avoid extreme temperatures in the system, part of the generated CO2 (and not nitrogen) is recycled back to the reactor. This process entails several advantages compared with the state-of-the-art, air-fueled technologies. These include the generation of a flue gas that contains mainly CO2 and water, which is easily separated and captured thus avoiding the use of expensive carbon capture techniques. Additional advantages include the reduction in the size of the flue gas conditioning equipment, no required space for the post-combustion capture equipment, and lower environmental impact and emissions compared with other carbon capture technologies and power production processes [59].
The main challenge of this technology is the energy required in the air separation unit (ASU) to produce pure oxygen that is used for combustion [60,61]. In this case, pure oxygen is a by-product of electrolysis, which can be theoretically utilized in oxy-combustion processes. This eliminates the energy penalty and the associated costs of the ASU by utilizing the by-product oxygen from electrolysis [62].
Overall, oxy-fuel combustion can represent a promising cleaner solution for capturing CO2 emissions from energy-intensive sectors, such as the power plants of the WM region. In this case, it is assumed that the carbon emissions for the Ptolemaida V power plant are used for methanation using renewable hydrogen to produce synthetic natural gas that will be used for power production. The by-product oxygen will be used as the main combustion medium; thus, eliminating the costs for air separation. Since within the next years the retrofitting or shutdown of the Ptolemaida V power plant is not currently planned, the oxy-combustion process could represent a versatile and environmentally friendlier solution for the inter-sector coupling between carbon-intensive industries (i.e., power plants or other carbon-emitting industries), the renewable hydrogen economy as well as potential end-users from the residential and industrial sectors.
3. Integration Assessment and Environmental Footprint of the Emerging Technologies
In this section, the deployment of the technologies is assessed based on the needs and scale of the region. This section involves the estimation of the required electrolyzer capacities to satisfy fully, as well as to a certain extent, the green hydrogen needs of the region. This will result in an overview/mapping of the deployment of the different solutions with respect to the current state and applicable scales of each technology. To secure the necessary energy for hydrogen production via electrolysis, the case of PV installations is considered. PV capacities up to 2 GW (feasible capacity for WM) are assumed to dedicate their production to produce hydrogen. The annual amount of hydrogen production per case is shown in Table 2. To carry out the study, the assumption that the electrolyzer for hydrogen production operates with a capacity factor of 0.5 and an efficiency of 60%.
Table 2.
Amount of hydrogen produced and the required electrolyzer capacity per case of installed PV capacity.
Another aspect that is covered in this section, is the evaluation of GHG emissions from the operation of the most prominent hydrogen technologies that could take part in the energy transition of Western Macedonia. All the operational parameters of the hydrogen technologies are covered. The infrastructure, equipment production, chemicals, and materials (except electricity and fossil fuels) as well as the disposal of generated wastes are considered outside the scope of the investigation.
Hydrogen production, storage, compression, transportation, and distribution are considered as different processes in this analysis. However, many of these processes are required in most of the cases studied. To create a base for comparison [63,64,65,66], the GHG emissions of the above processes are presented in Figure 3. In this analysis, the input–output data are sourced from both the relevant literature and the Ecoinvent 3.6 database, which is integrated into the life-cycle analysis software SimaPro version 9.1 PhD. These data have been adapted to align with the specific hydrogen systems being investigated. The analysis is carried out assuming PV electricity as the source of the power required for the processes.
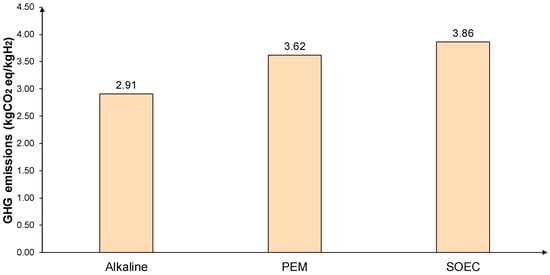
Figure 3.
GHG emissions in kgCO2 eq/kgH2 of hydrogen generation with PV as the power source.
Regarding green hydrogen production, the electrolyzer technologies considered are alkaline, PEM, and SOEC. Based on its maturity and lower GHG emissions, alkaline electrolysis is selected as the technology adopted in this study for all cases. Hydrogen storage pressure and form can also vary depending on the use case.
Figure 4 considers the GHG emissions of hydrogen compression/liquefaction for transportation/distribution, storage, and use for refueling purposes. The investigated options involve hydrogen gas compression at 20, 350, and 700 bar, and liquid form in cryogenic storage at −253 °C and at atmospheric pressure. Hydrogen transportation/distribution through gas pipelines is assumed at 20 bar and 70 bar, and when transported by trucks, hydrogen is in liquid form. When the refueling of vehicles is considered, buses require 350 bar of pressure (with a pressure lift up to 440 bar) and cars require 700 bar (with a pressure lift up to 880 bar) [67].
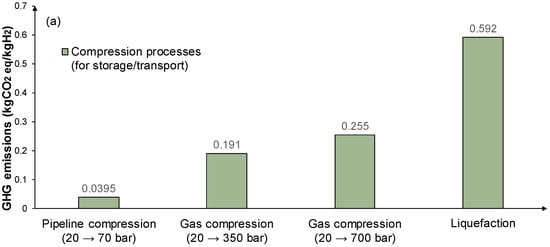
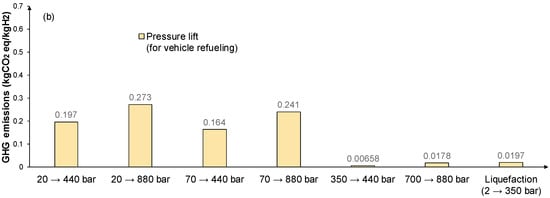
Figure 4.
GHG emissions in kgCO2 eq/kgH2 of hydrogen compressions process for (a) storage/transport; and (b) vehicle refueling processes with PV as the power source.
3.1. Hydrogen for Electricity Generation/Storage
Currently, the total installed and operating capacity of lignite power plants in WM is 2585 GW. This capacity is set to be nullified by the end of 2028 based on the NECP. Fuel cell systems are dispatchable, meaning that they can be a source of electricity that can be programmed to operate on demand, depending on the grid’s needs. PV plants are the prevailing option in WM to cover the power production gap that will be created by 2028.
In the case of PVs, fuel cells can play the role of shifting the peak power production of PVs towards night hours. As an example, the daily production curves of 0.5–2 GW PV plants are shown in Figure 5. In the same figure, the fuel cell production curves are shown with dashed lines of the same color to their respective PV couple. Part of the produced hydrogen by the PV can be used to produce power during the hours with no sun. This process establishes fuel cells as a complementary technology to the PV, meaning that these two technologies can have a level power production curve when operating in conjunction with each other. The resulting hydrogen demand for the operation of various fuel cell module sizes depending on the installed PV capacity is presented in Table 3. The demand assumes an average 14 h of fuel cell operation daily. Larger PV installations naturally translate to larger fuel cell sizes in order to produce a curve as flat as possible.
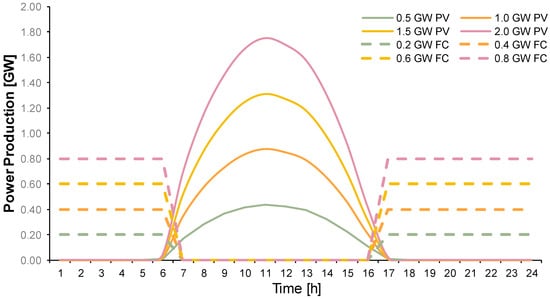
Figure 5.
Fuel cell operation (dashed lines) to shift PV production (continuous lines) to hours with no sun.
Table 3.
Required hydrogen quantity to sustain fuel cell power outputs for 14 h.
In the framework of this study, GHG emissions from fuel cells are not present. However, the overall GHG emissions do not refer only to the power generation but also to the process of H2 production. Assuming that hydrogen is produced in close proximity to the fuel cell plant so that no distribution or compression is required, then the GHG emissions associated with electricity generation by fuel cells are the production emissions which are 2.9 kgCO2 eq/kgH2.
3.2. Hydrogen for Transportation Sector
Greece’s overall car fleet is 5.5 million cars [2]. Based on the country’s population, the average car number per capita is around 0.53. This means that the WM region with a population of around 300,000 has approximately 171,000 cars. As for the public transport fleet of buses in the region, it is estimated, based on the accommodated passengers, that it has a size of around 300 buses. In this case study, depending on the injection percentage of hydrogen vehicles in the overall fleet, the resulting demand in hydrogen and electrolyzer capacity is calculated and presented in Table 4.
Table 4.
Required electrolyzer capacity to satisfy various fleet size hydrogen needs.
The results indicate that the complete automotive fleet (cars and buses combined) would require ~0.22 GW of electrolyzer capacity (in the case of 100% injection hydrogen fueled vehicles). The corresponding demand of each injection case needs to be covered by a number of hydrogen refueling stations that must be distributed spatially along key strategic locations that will serve the needs of public transport but also private H2 car owners. HRSs can either have hydrogen production on-site by an integrated water electrolysis system or have stored hydrogen delivered to them. The second option could prove more economically viable in this case, considering that hydrogen production capitalizes on the economy of scale, and it would be more efficient to produce it in large, centralized plants than in decentralized stand-alone systems. Overall, the processes that are involved in vehicle refueling are hydrogen production and compression. Compression is assumed at 440 bar for buses and 880 bar for cars. The GHG emissions, taking into account Figure 3 and Figure 4, are 3.097 kgCO2 eq/kgH2 for buses, and 3.173 kgCO2 eq/kgH2 for cars.
3.3. Hydrogen for Transportation to Refineries
The produced hydrogen via electrolysis in WM could be transported to locations and industries in the wider radius, where hydrogen is consumed in larger amounts. For small-scale applications, trucks and trains transporting hydrogen in liquefied or compressed form are suitable. For large-scale applications (as in the studied work), pipeline transportation is the preferred option [64]. The current required pressures for pipeline transportation are between 10 and 30 bar and the associated costs vary based on the different pipe diameters, the operating pressures, and the fluid velocity. Indicative costs are between 500 and 800 k€/km for the installation of new hydrogen pipelines [65,66].
The closest nearby refinery is in Thessaloniki operated by Hellenic Petroleum (HELPE), a member of the HELLENiQ Energy Group, the largest petrochemical and energy company in Greece. Other refineries are in the Attica region (Aspropyrgos) and in Corinth with a distance of over 500 km from the Ptolemaida region. Table 5 shows the major refineries in Greece and the estimated hydrogen demands based on a reference scale of 50 kt annual hydrogen demand for a refining capacity of 10,400 kt/y. It is also assumed that a maximum 50% of the hydrogen demands are covered by Steam Methane Reforming, whereas the rest of the hydrogen is produced as a by-product of refining applications [68]. In the current calculations, it is assumed that the hydrogen derived and/or externally purchased from natural gas is completely replaced with green hydrogen from electrolysis. With regards to Table 2, for the total hydrogen demand for all three refineries (41.7 kt/y) to be fulfilled, the produced hydrogen from the energy output of a 1.5 GW PV would be borderline insufficient. Based on the current numbers, to fulfil the demands of all three refineries, 77% of the produced hydrogen from the energy output of a 2 GW PV plant would be consumed.
Table 5.
HELPE refineries and hydrogen demands.
Assuming that the pure hydrogen will be transported in gaseous form through the pipelines, no compression is needed (current required pressures 10–30 bar). The pressure drop for pipeline transportation of pure hydrogen is insignificant for pipelines up to 200 km [69]. For the Aspropyrgos and Corinth refineries (490 and 480 km, respectively), a compression point might be needed in the 250 km mark, depending on the flowrate and the pipeline diameter. Results for hydrogen generation and storage are the same as in Figure 4. The GHG emissions for hydrogen compression from 10→20 bar (which is the average for pipeline transportation) is 0.00789 kgCO2 eq/kgH2. Overall, the GHG emissions include also hydrogen production resulting in 2.97789 kgCO2 eq/kgH2.
3.4. Injection of Hydrogen in the Natural Gas Grid
The Trans-Adriatic Pipeline has a current capacity of 10 bcm natural gas per year, which is expected to increase to 20 bcm per year. Also, DESFA’s pipeline capacity of 14.25 bcm of natural gas per year is considered. In this case, it is assumed that hydrogen produced in the WM region could be injected into both pipeline networks. Due to the lack of a regulatory framework, two blending cases are assumed: 10% and 20% vol. blending. In both cases, it is assumed that the mixture blend fulfils the necessary quality requirements for transmission/distribution and end-use. Table 6 shows the respective amounts of hydrogen injection into the networks of DESFA and TAP. In both cases, it is assumed that hydrogen is injected at an average pressure of 50 bar. DESFA’s future expanded network will add another 14.25 bcm per year with 10 or 20% blending of hydrogen.
Table 6.
Total H2 production from PV as blending fraction in TAP’s and DESFA’s networks.
For the 10 bcm/y natural gas flowrate case, the TAP is able to absorb 82 kt/y for 10% vol. blending and 164 kt/y for 20% vol. blending. For the future modifications (20 bcm/y) approximately, up to 328 kt/y can be injected in the TAP (20% vol. blending). Respectively, DESFA’s pipeline could accommodate up to 234 kt/y of hydrogen (20% vol. blending). Of course, it is obvious that even in the highest PV capacity scenario of 2 GW, the produced hydrogen from electrolysis would amount to 6.6% blending ratio of TAP and 4.61% hydrogen blending for the DESFA network, respectively. In order to cover the total allowed quantity of hydrogen for both blending cases, higher capacities of electrolysis and PV would be required, which would prove restrictive based on the current state. Nevertheless, with respect to the key position of renewable hydrogen in the current EU energy transition, the utilization of the existing natural gas grid could serve as a renewable energy storage and provide a solution to the hydrogen logistics problem (at least in the short-term) across the interconnected EU countries.
Assuming a 10% vol. injection of hydrogen into the natural gas grid, no initial compression and depending on the pipeline diameter, the hydrogen/methane blend can be transported for 30 to 60 km due to the pressure drop. For higher initial pressure (70 bar) a compression station is needed every ≈110 km. The use of the injected hydrogen can be achieved in the form of a mixture with natural gas or as clean hydrogen by itself, through dedicated recovery techniques. The respective environmental footprint for each of the separation processes is 1.32, 0.83, and 0.26 kgCO2 eq/kgH2. The GHG emissions associated with the injection of H2 in TAP or DESFA involve only the production process of H2. Emissions must be added for the separation process if clean hydrogen is required as output from TAP or DESFA. Overall, if membrane separation is also considered, the GHG emissions are calculated as 3.159 kgCO2 eq/kgH2.
3.5. Hydrogen for Converting CO2 Emissions from Nearby Plants
When conversion of CO2 emissions is the goal, there are two main processes that offer a solution that involves hydrogen as a feedstock and the process product is utilized in WM: methanation and methanol synthesis. As reference plant, the lignite power unit and the amount of CO2 emissions of Ptolemaida V are considered, whereas a range of 2000–8000 h/y of operation are assumed.
3.5.1. Methanation of CO2 Emissions from Ptolemaida V
Table 7 illustrates the CO2 emissions from each case and the required hydrogen for methanation by assuming 10% hydrogen excess during methanation.
Table 7.
CO2 emissions of Ptolemaida V and required H2 for methanation.
Converting the complete amount to methane of the Ptolemaida V emissions, would require the output of more than 6 GW of PV installations to be used for electrolysis for 2000 operating hours and over 24 GW for 8000 operating hours. Those calculated scenarios, of course, are restricted based on the current state-of-the-art and hydrogen production scale. In the realistic case of a total installed capacity in the WM of 2 GW, 9 to 36% of the total H2 demands depending on the operating hours could be substituted by green hydrogen.
Overall, for the methanation of carbon emissions from nearby plants, two main processes are considered to have a significant environmental impact, CO2 capture and the methanation process itself. The later methane injection to the pipelines requires only the compression stage that is shown in Figure 3. Overall, from capturing the CO2, converting it to methane, and injecting it as methane in pipeline gas networks the environmental footprint of the processes involved is 338 kgCO2 eq/tCO2 for CO2 capture, 0.022 kgCO2 eq/kgSNG for methanation, and 0.0395 kgCO2 eq/kgH2 for pipeline compression for injection from 20 to 70 bar.
3.5.2. Methanol Synthesis of CO2 Emissions from Ptolemaida V
In this section, the CO2 emissions from the Ptolemaida V power plant are used for methanol synthesis through the addition of renewable hydrogen. In this case, it is assumed that hydrogen is added in a stoichiometric ratio and approximately 60% of the CO2 is converted to methanol through the employment of novel methanol reactor technologies and optimized conditions [70]. Table 8 shows the results of the methanol synthesis option for WM.
Table 8.
Carbon dioxide and hydrogen demands used for methanol synthesis.
For the case of 2000 operating hours per year with lignite as the main fuel used in Ptolemaida V unit, approximately 100 kt/y of hydrogen is required, whereas for 8000 operating hours, approximately 400 kt/y are required. The produced methanol quantity ranges from 320 to 1290 kt/y. In the realistic case of a total installed capacity in the WM of 2 GW, 13.5 to 54% of the total H2 demands depending on the operating hours could be substituted by green hydrogen. Overall, capturing the CO2, and converting it to methanol, has an environmental footprint due to the processes involved. In particular, methanol synthesis has a footprint of 0.0836 kgCO2 eq/kgMeOH.
Considering the current state-of-the-art of electrolysis and methanol synthesis from off-gases, this investigated technology case could prove restrictive for the higher applied capacities. Nevertheless, the investigation of lower production capacities with respect to the current technological readiness as well as market demand of the methanol product (with potential upscaling in the future) could be of particular interest to the region due to the projected increased market and various uses of methanol in the EU. Methanol is also investigated as a potential hydrogen carrier form that could be used to transport hydrogen at large distances [71].
3.6. Potential Efficiency Improvements
SOEC Waste Heat for District Heating (DH)
Except for the electrochemical energy that is harnessed from hydrogen utilization processes, there is also the possibility of waste heat recovery. The SOEC technology offers the possibility of exploiting high quality waste heat that, in the case of WM, can be integrated with the existing DH plants. Currently, three DH plants operate in the region with a total thermal power capacity of 0.29 GW and an energy output of 560 GWh annually. In the WM region, heating is required for 6 to 8 months within a year [72], and a capacity factor of 0.4 is expected for the DH plants. Assuming the same basis as the other integration scenarios, the required energy source for WM’s heating needs would be a PV installation as presented in Table 2. The only difference would be that electrolysis would be performed at high temperatures using SOECs. For SOECs, waste heat that can be recovered accounts for 15 to 20% of the total power input [73]. The worst-case recovery at 15% is adopted for this study. Table 9 depicts the fraction of the total heating required that the integration of SOECs with PVs could serve by recovering the waste heat available. A total of 20 to 80% of the total heating energy needs could be covered in the case of SOEC integration with PV from 0.5 to 2.0 GW.
Table 9.
SOEC capacity which is required to satisfy WM’s heating loads.
4. Future Perspectives and Challenges
Figure 6 illustrates the capacity range (kt) that the deployment of each technology requires in terms of hydrogen amounts as well as electrolysis requirements for the deployment scenarios that were investigated in this work. It is important to understand that in the overall WM, the PV capacity that can be installed is limited due to spatial constraints as mentioned in Section 2. Consequently, this puts an upper constraint on the hydrogen amount that can be produced via renewable energy. Assuming that H2 production units start being built immediately, it will take several years to achieve the maximum capacity of the WM region which can be around 8.1 GW with a production of 210 kt H2/y. In addition, electrolysis capacity demands (GW) far exceed the current readiness for deployment of electrolysis plants worldwide.
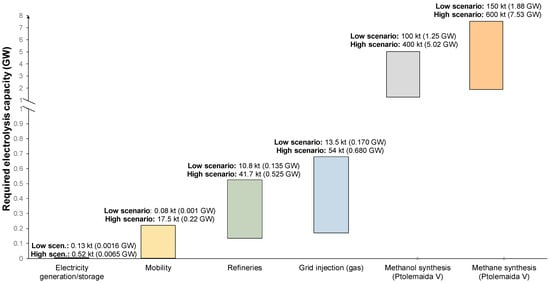
Figure 6.
Required electrolysis capacity and annual hydrogen demand of the investigated technologies.
However, the maximum capacity of PV production and, subsequently, H2 production in the region is sufficient to cover the amount of hydrogen required for several scenarios. On the other hand, in the case of capturing the CO2 emissions from lignite power plants, the H2 required for methanation exceeds the maximum production capacity that can be achieved in the short-term. For example, converting only one unit in WM (Ptolemaida V) requires 3 to 12 times more hydrogen than what can be produced via the deployment of 2 GW of PV plants for dedicated H2 production. In other words, if CO2 capture is conducted at full-scale, there is not enough development of hydrogen production technologies to satisfy the electrolysis needs to utilize that CO2 for methanol/methanation.
There are several challenges and risks associated with the creation of large hydrogen ecosystems considering the current market situation and state-of-the-art. For instance, there is a lack of suppliers and mass demand for hydrogen end-uses. Hydrogen vehicles (such as cars) are currently at a minuscule percentage of the total vehicle fleet, whereas the same is also valid for hydrogen refueling stations. Furthermore, the large-scale integration of hydrogen into hard-to-abate industrial sectors could prove a challenge since they have to operate continuously. To that end, for RES-powered electrolyzers, the intermittency of solar energy must include resilient and cost-efficient energy and hydrogen storage systems. Other challenging aspects include convincing the general public of the importance of hydrogen and renewable energy projects, which could prove a challenge especially to an economy formerly based on lignite power plants. The added-value of hydrogen mega-projects can be demonstrated through the creation of employment opportunities in the region, the public demonstration of zero-emissions vehicles, and public transportation means as well as the related environmental and health benefits. Finally, for the establishment of innovative and large-scale hydrogen projects, political and legislative support is needed, which could facilitate several barriers related to regulations, funding, licensing, and citizen engagement.
5. Conclusions
This study provided a roadmap for the transition of WM to a decarbonized future with the use of renewable hydrogen. In particular, hydrogen was investigated in a variety of mature and readily deployable technologies for this transition such as hydrogen utilization for mobility purposes, as refineries feedstock, gas grid injection, heat/electricity generation as well as for added value chemicals production (methane and methanol). The results of the assessment offer a clear indication of the potential that each technology embodies and its respective deployment horizon. A phase-out of lignite is necessary to allow enough time for hydrogen technologies to catch up and be further upgraded so that CO2 utilization from industries can be implemented on a large scale. As a result, short term solutions for H2 utilization that require 0.0016–0.68 GW of electrolysis capacity (i.e., H2 for transportation, refineries’ feedstock, gas grid injection, heat and electricity generation/storage) will build the H2 production capacity that is required to start utilizing CO2 (i.e., methane and methanol synthesis) for medium to long term horizons. The synthesis of methane and methanol processes for the available CO2 in WM require an electrolysis capacity in the range of 1.25–7.53 GW which is restrictive considering the deployment scale of electrolyzers at the moment and the investigated case study. Nevertheless, smaller-scale applications of the utilization of carbon emissions cannot be ruled out and depending on the deployment case, could provide significant economic, environmental, energetic, and societal advantages.
Author Contributions
Conceptualization, A.K., M.B., G.K. and K.P.; methodology, A.K., M.B., G.K. and K.P.; software, A.K., M.B. and G.K.; validation, A.K., M.B., G.K. and K.P.; formal analysis, A.K. and M.B.; investigation, A.K., M.B. and G.K.; resources, A.K., M.B., G.K. and K.P.; data curation, A.K., M.B. and G.K.; writing—original draft preparation, A.K. and M.B.; writing—review and editing, A.K., M.B. and K.P.; visualization, A.K. and M.B.; supervision, K.P.; project administration, K.P. All authors have read and agreed to the published version of the manuscript.
Funding
This research received no external funding.
Data Availability Statement
All relevant data are presented in this paper.
Conflicts of Interest
The authors declare no conflict of interest.
References
- Salvia, M.; Reckien, D.; Pietrapertosa, F.; Eckersley, P.; Spyridaki, N.A.; Krook-Riekkola, A.; Olazabal, M.; De Gregorio Hurtado, S.; Simoes, S.G.; Geneletti, D.; et al. Will Climate Mitigation Ambitions Lead to Carbon Neutrality? An Analysis of the Local-Level Plans of 327 Cities in the EU. Renew. Sustain. Energy Rev. 2021, 135, 110253. [Google Scholar] [CrossRef]
- Ministry of the Environment and Energy Hellenic Government. National Plan for Energy and the Climate; Hellenic Republic: Athens, Greece, 2019. [Google Scholar]
- Ziouzios, D.; Karlopoulos, E.; Fragkos, P.; Vrontisi, Z. Challenges and Opportunities of Coal Phase-out in Western Macedonia. Climate 2021, 9, 115. [Google Scholar] [CrossRef]
- Tranoulidis, A.; Sotiropoulou, R.E.P.; Bithas, K.; Tagaris, E. Decarbonization and Transition to the Post-Lignite Era: Analysis for a Sustainable Transition in the Region of Western Macedonia. Sustainability 2022, 14, 10173. [Google Scholar] [CrossRef]
- Ju, H.K.; Badwal, S.; Giddey, S. A Comprehensive Review of Carbon and Hydrocarbon Assisted Water Electrolysis for Hydrogen Production. Appl. Energy 2018, 231, 502–533. [Google Scholar] [CrossRef]
- Taibi, E.; Blanco, H.; Miranda, R.; Carmo, M. Green Hydrogen Cost Reduction: Scaling up Electrolysers to Meet the 1.5 °C Climate Goal; International Renewable Energy Agency: Abu Dhabi, United Arab Emirates, 2020. [Google Scholar]
- Zhang, J.; Mück-Lichtenfeld, C.; Studer, A. Photocatalytic Phosphine-Mediated Water Activation for Radical Hydrogenation. Nature 2023, 619, 506–513. [Google Scholar] [CrossRef] [PubMed]
- Tian, X.; Guo, Y.; An, W.; Ren, Y.-L.; Qin, Y.; Niu, C.; Zheng, X. Coupling Photocatalytic Water Oxidation with Reductive Transformations of Organic Molecules. Nat. Commun. 2022, 13, 6186. [Google Scholar] [CrossRef] [PubMed]
- Al-Senani, G.M.; Zayed, M.; Nasr, M.; Ali, S.S.; Shaban, M.; Mohamed, F. Flexible Electrode Based on PES/GO Mixed Matrix Woven Membrane for Efficient Photoelectrochemical Water Splitting Application. Membranes 2023, 13, 653. [Google Scholar] [CrossRef]
- Hydrogen Council. Hydrogen Scaling Up: A Sustainable Pathway for the Global Energy Transition; Hydrogen Council: Brussels, Belgium, 2017. [Google Scholar]
- Osman, A.I.; Mehta, N.; Elgarahy, A.M.; Hefny, M.; Al-Hinai, A.; Al-Muhtaseb, A.H.; Rooney, D.W. Hydrogen Production, Storage, Utilisation and Environmental Impacts: A Review. Environ. Chem. Lett. 2022, 20, 153–188. [Google Scholar] [CrossRef]
- Rahman, M.M.; Oni, A.O.; Gemechu, E.; Kumar, A. Assessment of Energy Storage Technologies: A Review. Energy Convers. Manag. 2020, 223, 113295. [Google Scholar] [CrossRef]
- European Commission. Greece Is First Balkan Country to Announce a Coal Phase-out Date. The Revolution Has Already Started in Western Macedonia|News|CORDIS|. Available online: https://cordis.europa.eu/article/id/413274-greece-is-first-balkan-country-to-announce-a-coal-phase-out-date-the-revolution-has-already-s (accessed on 8 November 2022).
- Ministry of the Environment and Energy Hellenic Government Greece. Just Transition Development Plan of Lignite Areas; Ministry of the Environment and Energy Hellenic Government Greece: Athens, Greece, 2020. [Google Scholar]
- Bódis, K.; Kougias, I.; Taylor, N.; Jäger-Waldau, A. Solar Photovoltaic Electricity Generation: A Lifeline for the European Coal Regions in Transition. Sustainability 2019, 11, 3703. [Google Scholar] [CrossRef]
- Administrator of RES and Guarantees of Origin DAPEEP. RES & CHP Monthly Information Report—May 2022; DAPEEP: Piraeus, Greece, 2022. (In Greek) [Google Scholar]
- Zervas, E.; Vatikiotis, L.; Gareiou, Z. Proposals for an Environmental and Social Just Transition for the Post-Lignite Era in Western Macedonia, Greece. In IOP Conference Series: Earth and Environmental Science; IOP Publishing: Bristol, UK, 2021; Volume 899, p. 012049. [Google Scholar]
- Farmaki, P.; Tranoulidis, A.; Kouletsos, T.; Giourka, P.; Katarachia, A. Mining Transition and Hydropower Energy in Greece—Sustainable Governance of Water Resources Management in a Post-Lignite Era: The Case of Western Macedonia, Greece. Water 2021, 13, 1878. [Google Scholar] [CrossRef]
- Francis, P.; Karlopoulos, E.; Roumpos, C.; Koykoyzas, N. Energy Transition and the Future of Lignite Mining in the Region of Western Macedonia, Greece. In Proceedings of the 10th International Conference Coal, Zlatibor, Serbia, 13–16 October 2021. [Google Scholar]
- Lazoglou, M.; Serraos, K. Climate Change Adaptation through Spatial Planning: The Case Study of the Region of Western Macedonia. IOP Conf. Ser. Earth Environ. Sci. 2021, 899, 012021. [Google Scholar] [CrossRef]
- Karasmanaki, E.; Ioannou, K.; Katsaounis, K.; Tsantopoulos, G. The Attitude of the Local Community towards Investments in Lignite before Transitioning to the Post-Lignite Era: The Case of Western Macedonia, Greece. Resour. Policy 2020, 68, 101781. [Google Scholar] [CrossRef]
- H2Valleys. H2 Valley Map. Available online: https://h2v.eu/hydrogen-valleys (accessed on 2 June 2023).
- Cnubben, P.; Homan, N.; Abheiden, A.; Durenkamp, J. From HEAVENN to Sustainable Hydrogen Valleys; New Energy Coalition: Groningen, The Netherlands, 2022. [Google Scholar]
- Fuel Cells and Hydrogen Joint Undertaking. Hydrogen Roadmap Europe: A Sustainable Pathway for the European Energy Transition; Fuel Cells and Hydrogen Joint Undertaking: Brussels, Belgium, 2019; ISBN 9789292463328. [Google Scholar]
- IPTO. Data. Available online: https://www.admie.gr/en/market/market-statistics/detail-data (accessed on 13 January 2023).
- EU Natural Gas—2023 Data—2010–2022 Historical—2024 Forecast—Price—Quote. Available online: https://tradingeconomics.com/commodity/eu-natural-gas (accessed on 17 January 2023).
- National Natural Gas Transmission System Operator. Draft Development Plan of the National Natural Gas System 2023–2032; DESFA: Athens, Greece, 2023. [Google Scholar]
- Trans Adriatic Pipeline (TAP). Available online: https://www.tap-ag.com/ (accessed on 28 August 2023).
- Sharaf, O.Z.; Orhan, M.F. An Overview of Fuel Cell Technology: Fundamentals and Applications. Renew. Sustain. Energy Rev. 2014, 32, 810–853. [Google Scholar] [CrossRef]
- Baba, M.A.; Labbadi, M.; Cherkaoui, M.; Maaroufi, M. Fuel Cell Electric Vehicles: A Review of Current Power Electronic Converters Topologies and Technical Challenges. In IOP Conference Series: Earth and Environmental Science; IOP Publishing Ltd.: Bristol, UK, June 2021; Volume 785. [Google Scholar]
- Toyota EU. Second Generation Toyota Mirai. Still Zero Emissions. Available online: https://www.toyota-europe.com/news/2020/new-mirai-concept (accessed on 29 August 2023).
- Post, M.; Eudy, L. BC Transit Fuel Cell Bus Project Evaluation Results: Second Report; National Renewable Energy Laboratory: Golden, CO, USA, 2014. [Google Scholar]
- Bampaou, M.; Panopoulos, K.D.; Seferlis, P.; Voutetakis, S. Evaluation of Novel Hydrogen Integration Options in Bio-Oils Introduction to Petrochemical Refineries. Energy 2022, 254, 124353. [Google Scholar] [CrossRef]
- Demir, M.E.; Dincer, I. Cost Assessment and Evaluation of Various Hydrogen Delivery Scenarios. Int. J. Hydrogen Energy 2018, 43, 10420–10430. [Google Scholar] [CrossRef]
- Felice, D.M. Blending Hydrogen from Electrolysis into the European Gas Grid A Joint Modelling Assessment of the European Power and Gas Systems with METIS; Joint Research Centre, European Commission: Luxembourg, 2022. [Google Scholar] [CrossRef]
- GRTgaz. Technical and Economic Conditions for Injecting Hydrogen into Natural Gas Networks; INIS: Paris, France, 2019. [Google Scholar]
- Quarton, C.J.; Samsatli, S. Should We Inject Hydrogen into Gas Grids? Practicalities and Whole-System Value Chain Optimisation. Appl. Energy 2020, 275, 115172. [Google Scholar] [CrossRef]
- Leicher, J.; Schaffert, J.; Cigarida, H.; Tali, E.; Burmeister, F.; Giese, A.; Albus, R.; Görner, K.; Carpentier, S.; Milin, P.; et al. The Impact of Hydrogen Admixture into Natural Gas on Residential and Commercial Gas Appliances. Energies 2022, 15, 777. [Google Scholar] [CrossRef]
- Dell’Isola, M.; Ficco, G.; Moretti, L.; Jaworski, J.; Kułaga, P.; Kukulska-zając, E. Impact of Hydrogen Injection on Natural Gas Measurement. Energies 2021, 14, 8461. [Google Scholar] [CrossRef]
- Ogden, J.; Jaffe, A.M.; Scheitrum, D.; McDonald, Z.; Miller, M. Natural Gas as a Bridge to Hydrogen Transportation Fuel: Insights from the Literature. Energy Policy 2018, 115, 317–329. [Google Scholar] [CrossRef]
- Connelly, E.; Penev, M.; Milbrandt, A.; Roberts, B.; Gilroy, N.; Melaina, M. Resource Assessment for Hydrogen Production; U.S. Department of Energy Office of Scientific and Technical Information: Washington, DC, USA, 2020. [Google Scholar]
- Neacsa, A.; Eparu, C.N.; Stoica, D.B. Hydrogen–Natural Gas Blending in Distribution Systems—An Energy, Economic, and Environmental Assessment. Energies 2022, 15, 6143. [Google Scholar] [CrossRef]
- National Natural Gas System Operator (DESFA). Natural Gas Quality Specifications. Available online: https://www.desfa.gr/en/regulated-services/transmission/pliroforisimetaforas-page/natural-gas-quality-specification (accessed on 29 August 2023).
- Nordio, M.; Rizzi, F.; Manzolini, G.; Mulder, M.; Raymakers, L.; Van Sint Annaland, M.; Gallucci, F. Experimental and Modelling Study of an Electrochemical Hydrogen Compressor. Chem. Eng. J. 2019, 369, 432–442. [Google Scholar] [CrossRef]
- Yang, S.I.; Choi, D.Y.; Jang, S.C.; Kim, S.H.; Choi, D.K. Hydrogen Separation by Multi-Bed Pressure Swing Adsorption of Synthesis Gas. Adsorption 2008, 14, 583–590. [Google Scholar] [CrossRef]
- Schorer, L.; Schmitz, S.; Weber, A. Membrane Based Purification of Hydrogen System (MEMPHYS). Int. J. Hydrogen Energy 2019, 44, 12708–12714. [Google Scholar] [CrossRef]
- Schildhauer, T.J.; Biollaz, S.M.A. Synthetic Natural Gas from Coal and Dry Biomass, and Power-to-Gas Applications; John Wiley & Sons, Inc.: Hoboken, NJ, USA, 2016; ISBN 9781119191339. [Google Scholar]
- Koytsoumpa, E.I.; Karellas, S.; Kakaras, E. Modelling of Substitute Natural Gas Production via Combined Gasification and Power to Fuel. Renew. Energy 2019, 135, 1354–1370. [Google Scholar] [CrossRef]
- Bampaou, M.; Panopoulos, K.; Seferlis, P.; Voutetakis, S.; Matino, I.; Petrucciani, A.; Zaccara, A.; Colla, V.; Dettori, S.; Annunziata Branca, T.; et al. Integration of Renewable Hydrogen Production in Steelworks Off-Gases for the Synthesis of Methanol and Methane. Energies 2021, 14, 2904. [Google Scholar] [CrossRef]
- Bampaou, M.; Panopoulos, K.; Seferlis, P.; Sasiain, A.; Haag, S.; Wolf-zoellner, P.; Lehner, M.; Rog, L.; Rompalski, P.; Kolb, S.; et al. Economic Evaluation of Renewable Hydrogen Integration into Steelworks for the Production of Methanol and Methane. Energies 2022, 15, 4650. [Google Scholar] [CrossRef]
- Romeo, L.M.; Cavana, M.; Bailera, M.; Leone, P.; Peña, B.; Lisbona, P. Non-Stoichiometric Methanation as Strategy to Overcome the Limitations of Green Hydrogen Injection into the Natural Gas Grid. Appl. Energy 2022, 309, 118462. [Google Scholar] [CrossRef]
- Irena and Methanol Institute. Innovation Outlook: Renewable Methanol; Irena and Methanol Institute: Abu Dhabi, United Arab Emirates, 2021. [Google Scholar]
- Basile, A.; Dalena, F. Methanol: Science and Engineering; Elsevier: Amsterdam, The Netherlands, 2017; ISBN 9780444640109. [Google Scholar]
- Breuer, J.L.; Scholten, J.; Koj, J.C.; Schorn, F.; Fiebrandt, M.; Samsun, R.C.; Albus, R.; Görner, K.; Stolten, D.; Peters, R. An Overview of Promising Alternative Fuels for Road, Rail, Air, and Inland Waterway Transport in Germany. Energies 2022, 15, 1443. [Google Scholar] [CrossRef]
- Schittkowski, J.; Ruland, H.; Laudenschleger, D.; Girod, K.; Kähler, K.; Kaluza, S.; Muhler, M.; Schlögl, R. Methanol Synthesis from Steel Mill Exhaust Gases: Challenges for the Industrial Cu/ZnO/Al2O3 Catalyst. Chem. Ing. Tech. 2018, 90, 1419–1429. [Google Scholar] [CrossRef]
- Nestler, F.; Krüger, M.; Full, J.; Hadrich, M.J.; White, R.J.; Schaadt, A. Methanol Synthesis—Industrial Challenges within a Changing Raw Material Landscape. Chem. Ing. Tech. 2018, 90, 1409–1418. [Google Scholar] [CrossRef]
- Raho, B.; Colangelo, G.; Milanese, M.; de Risi, A. A Critical Analysis of the Oxy-Combustion Process: From Mathematical Models to Combustion Product Analysis. Energies 2022, 15, 6514. [Google Scholar] [CrossRef]
- Stanger, R.; Wall, T.; Spörl, R.; Paneru, M.; Grathwohl, S.; Weidmann, M.; Scheffknecht, G.; McDonald, D.; Myöhänen, K.; Ritvanen, J.; et al. Oxyfuel Combustion for CO2 Capture in Power Plants. Int. J. Greenh. Gas Control 2015, 40, 55–125. [Google Scholar] [CrossRef]
- Jurado, N.; Darabkhani, H.G.; Anthony, E.J.; Oakey, J.E. Oxy-Fuel Combustion for Carbon Capture and Sequestration (CCS) from a Coal/Biomass Power Plant: Experimental and Simulation Studies. In Progress in Clean Energy, Volume 2: Novel Systems and Applications; Springer: Cham, Switzerland, 2015; pp. 177–192. ISBN 9783319170312. [Google Scholar]
- García-Luna, S.; Ortiz, C.; Carro, A.; Chacartegui, R.; Pérez-Maqueda, L.A. Oxygen Production Routes Assessment for Oxy-Fuel Combustion. Energy 2022, 254, 124303. [Google Scholar] [CrossRef]
- Kotowicz, J.; Michalski, S.; Brzeczek, M. The Characteristics of a Modern Oxy-Fuel Power Plant. Energies 2019, 12, 5574. [Google Scholar] [CrossRef]
- Yadav, S.; Mondal, S.S. A Review on the Progress and Prospects of Oxy-Fuel Carbon Capture and Sequestration (CCS) Technology. Fuel 2022, 308, 122057. [Google Scholar] [CrossRef]
- Candelaresi, D.; Valente, A.; Iribarren, D.; Dufour, J.; Spazzafumo, G. Comparative Life Cycle Assessment of Hydrogen-Fuelled Passenger Cars. Int. J. Hydrogen Energy 2021, 46, 35961–35973. [Google Scholar] [CrossRef]
- Timmerberg, S.; Kaltschmitt, M. Hydrogen from Renewables: Supply from North Africa to Central Europe as Blend in Existing Pipelines—Potentials and Costs. Appl. Energy 2019, 237, 795–809. [Google Scholar] [CrossRef]
- Saadi, F.H.; Lewis, N.S.; McFarland, E.W. Relative Costs of Transporting Electrical and Chemical Energy. Energy Environ. Sci 2018, 11, 469–475. [Google Scholar] [CrossRef]
- Schoots, K.; Rivera-Tinoco, R.; Verbong, G.; van der Zwaan, B. Historical Variation in the Capital Costs of Natural Gas, Carbon Dioxide and Hydrogen Pipelines and Implications for Future Infrastructure. Int. J. Greenh. Gas Control 2011, 5, 1614–1623. [Google Scholar] [CrossRef]
- Bouwkamp, N.; Burgunder, A.; Casey, D.; Elgowainy, A.; Fisher, L.; Merritt, J.; Miller, E.; Petitpas, G.; Rohatgi, A.; Rustagi, N.; et al. Hydrogen Delivery Technical Team Roadmap; U.S. DRIVE Partnership: Washington, DC, USA, 2017. [Google Scholar]
- Dolci, F. Green Hydrogen Opportunities in Selected Industrial Processes Workshop Summary Report; Publications Office of the European Union: Luxembourg, 2019. [Google Scholar] [CrossRef]
- Włodek, T.; Łaciak, M.; Kurowska, K.; Węgrzyn, Ł. Thermodynamic Analysis of Hydrogen Pipeline Transportation—Selected Aspects. AGH Drill. Oil Gas 2016, 33, 379. [Google Scholar] [CrossRef]
- Bampaou, M.; Haag, S.; Kyriakides, A.S.; Panopoulos, K.D.; Seferlis, P. Optimizing Methanol Synthesis Combining Steelworks Off-Gases and Renewable Hydrogen. Renew. Sustain. Energy Rev. 2023, 171, 113035. [Google Scholar] [CrossRef]
- Cui, J.; Aziz, M. Techno-Economic Analysis of Hydrogen Transportation Infrastructure Using Ammonia and Methanol. Int. J. Hydrogen Energy 2023, 48, 15737–15747. [Google Scholar] [CrossRef]
- Centre for Renewable Energy Sources and Saving. Heating Degree Day (HDD) Map of Greece. Available online: https://geodata.gov.gr/dataset/khartes-bathmoemeron-thermanses-tes-elladas (accessed on 7 November 2022).
- Zhao, Y.; Xue, H.; Jin, X.; Xiong, B.; Liu, R.; Peng, Y.; Jiang, L.; Tian, G. System Level Heat Integration and Efficiency Analysis of Hydrogen Production Process Based on Solid Oxide Electrolysis Cells. Int. J. Hydrogen Energy 2021, 46, 38163–38174. [Google Scholar] [CrossRef]
Disclaimer/Publisher’s Note: The statements, opinions and data contained in all publications are solely those of the individual author(s) and contributor(s) and not of MDPI and/or the editor(s). MDPI and/or the editor(s) disclaim responsibility for any injury to people or property resulting from any ideas, methods, instructions or products referred to in the content. |
© 2023 by the authors. Licensee MDPI, Basel, Switzerland. This article is an open access article distributed under the terms and conditions of the Creative Commons Attribution (CC BY) license (https://creativecommons.org/licenses/by/4.0/).