Article

Hydrothermal Carbonization of Sewage Sludge: New Improvements in Phosphatic Fertilizer Production and Process Water Treatment Using Freeze Concentration

1
Institute of Natural Resource Sciences, Zurich University of Applied Sciences (ZHAW), Campus Grüental, CH-8820 Wädenswil, Switzerland
2
Institute of Chemistry and Biotechnology, Zurich University of Applied Sciences (ZHAW), Campus Reidbach, CH-8820 Wädenswil, Switzerland
3
School of Engineering, Zurich University of Applied Sciences (ZHAW), CH-8401 Winterthur, Switzerland
*
Author to whom correspondence should be addressed.
Energies 2023, 16(20), 7027; https://doi.org/10.3390/en16207027
Submission received: 3 April 2023 / Revised: 23 May 2023 / Accepted: 26 May 2023 / Published: 10 October 2023
(This article belongs to the Special Issue Hydrothermal Carbonization II)

Abstract

:
In recent years, promising developments in the hydrothermal carbonization (HTC) of sewage sludge, as well as the potential to reclaim phosphorus and nitrogen, have emerged. In this study, the HTC of digested sewage sludge (DSS) was investigated for the downstream production of heavy metal (HM)-free fertilizer and the use of freeze concentration (FC) as a novel technology for process water treatment. To obtain clean fertilizer, phosphatic acid extracts were first treated with ion-exchange resins to remove dissolved HM, as well as phosphorus precipitating agents (i.e., aluminum and iron). Over 98% of the aluminum (Al) and 97% of the iron (Fe) could be removed in a single treatment step. The purified extract was then used for the precipitation of HM-free struvite crystals, with P-recovery rates exceeding 89%. Process water (PW) makes up the largest share of the two main HTC-products (i.e., hydrochar and PW) and is very rich in organic compounds. Compared to evaporation or membrane separation, FC is a promising technology for concentrating solutes from PW. Separation experiments resulted in the recovery of over 90% of the dissolved compounds in the concentrate. In our study, the concentrate was later utilized as an ammonium source for struvite precipitation, and the subsequent aerobic digestion of the remaining ice water resulted in an 85% reduction in chemical oxygen demand (COD) in 15 days.

1. Introduction

Both the price and availability of plant fertilizers are crucial for the global food market. Phosphate rock will become more expensive to mine in the future, as accessible sources are depleted over the next 100 to 300 years [1,2,3]. Countries without phosphate rock deposits (whether of sedimentary or igneous origin) have to pay market prices for this essential resource [4,5], which can be affected by global crises that cause short-term increases in prices. The price of phosphate rock increased ten-fold and the price of diammonium phosphate and triple superphosphate more than quadrupled during the housing crisis of 2008, while during the COVID-19 pandemic and the war in Ukraine, the price of all three commodities nearly quadrupled once again [6]. However, the principles of the circular economy could be employed to decrease dependency on foreign resources and, at the same time, increase the value of locally available sources, such as phosphorus present in sewage sludge (SS). To achieve this goal of substituting (and reducing) imported phosphorous fertilizer, new regulations in Switzerland and Germany require phosphorus to be recovered from SS by 2026 and 2029, respectively [7,8]. In Switzerland, in accordance with the enforcement aids published by the Federal Office for the Environment (BAFU), the first goal of this recovery has been set at 50%, which will be gradually increased in line with technological developments [9].
Hydrothermal carbonization (HTC) is a promising process for SS treatment and nutrient recovery, having the following advantages: (i) wet feedstock can be treated directly; (ii) it improves the dewaterability of the sludge and, therefore, needs less thermal energy for preliminary drying prior to incineration [10,11]; (iii) the acidification for phosphorus recovery can be achieved during the wet stage, either before or after the HTC process [11,12,13,14], which renders the rewetting of dry fly ash in thermochemical processes unnecessary; and (iv) most of the nitrogen in SS is captured in the process water and thus preserved for recovery [15]. Over the last two decades, numerous studies have been conducted into the HTC of SS, which were, in particular, related to the optimal treatment parameters for hydrochar production, nutrient recovery, energy demand, and toxicity. Less attention has been given to the usage and characterization of process water (PW), with research into the treatment of PW mostly focusing on membrane filtration, anaerobic and/or aerobic digestion of organic compounds, or the possible recycling of PW in the HTC process [13,16,17,18,19,20].
Preliminary results from our study of DSS show a total organic carbon (TOC) content in HTC-PW of 21,545 ± 681 ppm (n = 6) [21]. This high level of organic content must be diluted when aerobic treatment is involved. However, for the recovery of valuable compounds that are only available in small quantities, additional concentration is necessary to be economically feasible. Freeze concentration was evaluated as a new possible treatment step for increasing the concentration of the PW either for recovery of the target compounds, or for the reuse as a carbon source in the HTC process. To the authors’ knowledge, no data have yet been published on the topic of PW treatment through freeze concentration (FC). FC is a form of melt crystallization that can be used in different applications, such as in: (i) the food industry to produce high value concentrates; (ii) wastewater treatment plants to remove hazardous compounds, in preparing toxic or volatile compounds for incineration; (iii) biogas plants to retrieve organic and inorganic compounds for reuse; or (iv) for the desalination of drinking water [22,23,24,25,26,27,28]. In the food industry, more traditionally used technologies, such as membrane concentration or thermal evaporation, can cause a loss of both flavor and aroma during this process, as well as a reduction in valuable heat-labile bioactive compounds [23,26,29]. FC works at low temperatures, preserves volatile compounds in the concentrate, and reduces corrosion in chemical waste streams [24,26]. In addition, with a latent heat of fusion of 334 kJ/kg water, the energy requirement for water removal using FC is lower than that needed for thermal evaporation, which requires a latent heat of evaporation of 2256 kJ/kg [26,30]. There are two global companies that build industrial-scale plants: GEA Group AG (Düsseldorf, Germany) and Sulzer (Winterthur, Switzerland).
FC can be divided in three types of processes: (i) block freeze concentration (BFC), where the solution is completely frozen and subsequently thawed to recover the concentrate; (ii) progressive freeze concentration (PFC), which is more advanced than BFC and involves an ice crystal being grown on a crystallizer wall, meaning that the concentrate can be easily separated; and (iii) suspension freeze concentration (SFC), which is the most advanced and expensive technology (in terms of both investment and operation) and involves small ice crystals being grown in a suspension and subsequently separated via additional washing steps [24]. Based on preliminary lab scale experiments using PFC and SFC setups, BFC was chosen for this study, as it is simple to set up and operate, making it easily reproducible on a lab scale. According to Petzold et al. [23], a process efficiency rate of over 90% should be achievable with this technique. The other methods were both difficult to operate and time consuming, resulting in higher variability in the separated products and lower volumes of cleaned water.
Struvite precipitation is often performed in P-recycling studies, even though such slow-release fertilizers are often viewed critically by farmers. The advantages of this class of fertilizer are reduced nutrient losses and longer availability in plants [31]. Furthermore, according to Vogel et al. [32], there are no significant differences between struvite and triple super phosphate (TSP) in neutral and acidic soils when growing maize in pots. Therefore, this fertilizer class can be considered as a potential alternative to fast-release fertilizers in slightly acidic soils. Another alternative would be to produce phosphoric acid, which can be used as a platform chemical for various products (e.g., fertilizers (80% of total demand), flame retardants, detergents, intermediates or chemical reagents) [33]. In Germany, the most widely sold form of mineral fertilizer is diammonium phosphate (DAP), which has 56.5% market share, followed by three-component fertilizer containing nitrogen, phosphorus and potassium (NPK), which has 15% share, NP fertilizer (8.5%), phosphorus-potassium (PK) fertilizer (7.5%), TSP and monoammonium phosphate (MAP), each with a 5% share, and single super phosphate (SSP), which has 2% share [34]. Compared to the German market, the global fertilizer market is split as follows: 51% DAP and MAP, 26% NPK, 6% SSP, 4% TSP and 13% others [35]. Fertilizers may also contain important macronutrients, like calcium (Ca), magnesium (Mg), sulfur (S) and potassium (K), as well as small quantities of micronutrients, like boron (B), chlorine (Cl), copper (Cu), iron (Fe), manganese (Mn), zinc (Zn), nickel (Ni) and molybdenum (Mo), that are essential for plant health [36]. To achieve a high degree of recycling, phosphorus must be recovered efficiently and refined into platform chemicals or plant-available fertilizers. Phosphoric acid (PA) is an essential component of the production of DAP and MAP, and the recovery of PA will be examined in this study. As an alternative to DAP and MAP, a slow-release fertilizer will also be investigated.
The main objectives of this study are, firstly, to purify acidic leaching extracts to produce a sustainable recycled fertilizer and, secondly, to investigate a low energy process for enhanced process water treatment. To produce a clean fertilizer, phosphatic acid extracts will first be treated with ion-exchange resins to remove dissolved heavy metals (HM) and recover phosphorus precipitants, like aluminum (Al) and iron (Fe). For the PW treatment, freeze concentration, which is a process widely used in the beverage industry to concentrate liquid foods (e.g., fruit juice, coffee, tea, wine), will be examined as a novel method for recovering solutes. Subsequently, the aerobic biodegradability of the purified ice water will be tested.

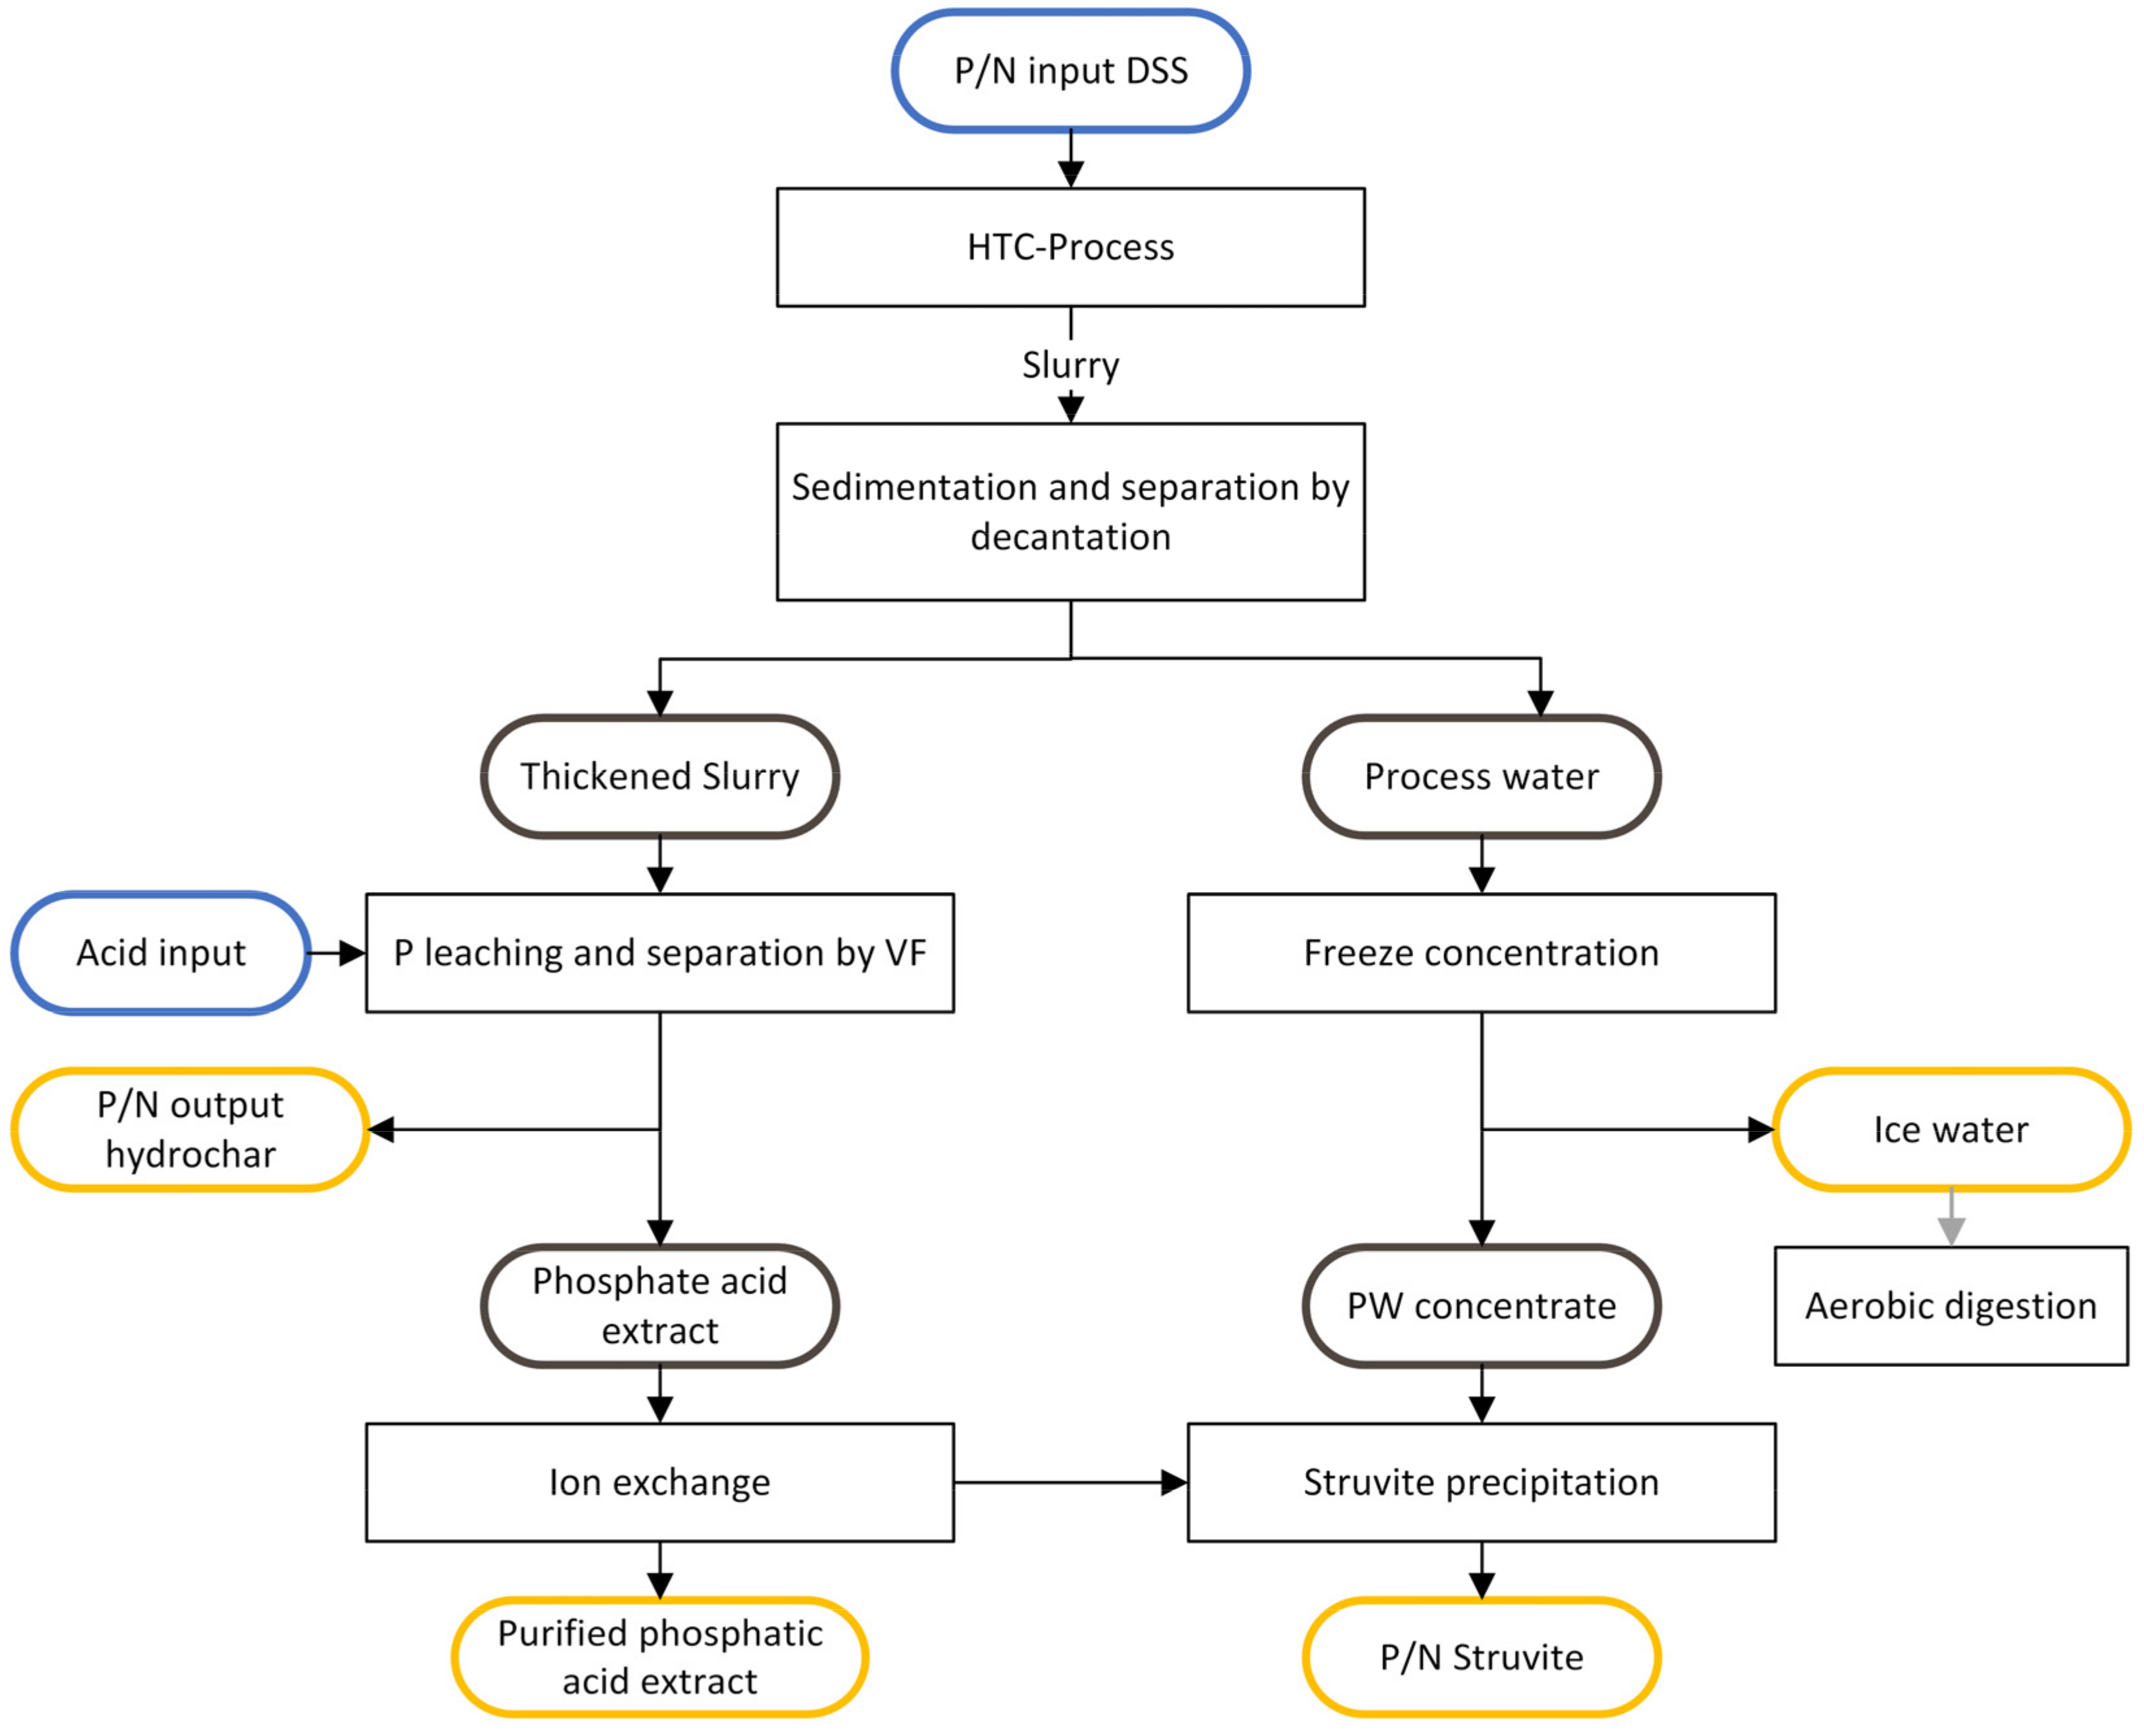
2. Materials and Methods

The experimental setup is depicted in the two main paths shown in Figure 1. Phosphorus recovery was performed using the acid-leaching method used by the authors in an earlier study [21]. The phosphate acid extract (leachate) was treated using ion exchange to remove impurities and subjected to a struvite precipitation process. The process water was first treated via freeze concentration to remove organic compounds and produce cleaned ice water. The concentrate obtained through the freeze concentration was then used as an ammonium source for the struvite precipitation process. Sample characterization was performed using ICP-OES, TOC-analyzer, CHNS-analyzer, spectrophotometry and XRD.

2.1. Raw Material and Chemicals

Anaerobically digested sewage sludge (DSS) with an initial dry matter content of 25.96% (dried at 105 °C) was collected at a wastewater treatment plant (WWTP) in Switzerland (ARA Rietliau, Wädenswil, Switzerland). The WWTP treats communal and industrial wastewater and is built to support a population equivalent to 44,000. More system-dependent information about the WWTP can be found in our previous publication [21]. Chemical phosphorus (P) removal was carried out using poly-aluminum chloride (PAC) and iron(III) chloride. To prevent unwanted chemical losses due to volatilization at high drying temperatures, the DSS was slowly dried at 40 °C for 120 h in a convection oven (BINDER GmbH, Tuttlingen, Germany). The dried stock material was further ground into a fine powder using a knife mill (GM200, Retsch GmbH, Haan, Germany) (30 s in reverse mode at 4000 rpm for pre-crushing, followed by 10 s in forward mode at 10,000 rpm for homogenization) and stored in an airtight plastic bucket until the HTC experiments began. Drying, grinding and homogenization are necessary pre-treatment steps that increase reproducibility in lab-scale experiments. The chemicals used in this study were all analytical grade, unless otherwise mentioned.

2.2. Hydrothermal Carbonization

HTC of the DSS was performed in a 5-liter pressure vessel made of stainless steel 1.4571 (Type 3E, Büchi AG, Uster, Switzerland), which was equipped with an electric heating mantle and a water-cooling coil. The reactor was loaded with a dry matter (DM105C) content of 20% (600 g DSS, 2400 g deionized water (DI)), and the final mixture was stirred at 300 rpm throughout the process. The air was not removed from reactor head space. The reaction temperature of 200 °C and residence time of 4 h were selected based on previous studies with DSS [21]. It took 34 min to heat the reactor contents from 20 to 200 °C (100–200 °C, 22 min), as well as 22 min to cool it to 100 °C. The maximum reaction pressure at the end of the reaction time was 26 bar. The main product (HTC-slurry) consisted of a solid (hydrochar) and a liquid fraction (process water). After reaching room temperature, the pH of the slurry was measured, and the substance was transferred to three 1-liter glass bottles (DURAN® GLS 80® laboratory wide mouth bottle) for further separation steps in the laboratory. To obtain enough PW for the freeze concentration experiment, two additional HTC-runs were performed.

2.3. Separation and Phosphorus Extraction

A previous study conducted by the authors showed that separating the PW before acid extraction doubles the P-concentration in the extract by reducing its volume [21]. Furthermore, the separated PW was lower in volume, and it was pH neutral and free of P and heavy metals. Based on these findings, the separation and P-extraction processes in this study were conducted according to the P-leaching procedure.
After carbonization, the slurry was left for 30 min to allow the char particles to settle. The supernatant that only consisted of PW was then decanted and centrifuged at 4500 rpm (g-force 4347) for 10 min (5910R, Eppendorf AG, Hamburg, Germany) to remove floating particles, after which it was vacuum filtered using a Buchner funnel and Whatman filter paper (pore size 11 µm, Cat No 1001 125). The pH of the PW was measured immediately after filtering prior to being stored at 6 °C for later use.
The thickened HTC-slurry was evenly distributed based on weight into three 1-liter glass bottles. Acidification for the P-extraction (pH 2 for 2 h) was adapted from Gerner et al.’s study [21] and conducted according to the phosphorus-leaching (HTC-PL) treatment. All of the slurries were continuously mixed via a rotary shaker at 120 rpm (Laboshake RO500, C. Gerhardt GmbH & Co. KG, Königswinter, Germany) while the acid was added. To reduce evaporation losses, the glass bottles were loosely covered with lids. The pH was monitored with a portable multi-parameter meter (HQ40d, Hach Lange, Düsseldorf, Germany) throughout the process and adjusted by adding small amounts of acid if necessary. After two hours of contact time, the mixture was vacuum filtered, and the phosphatic acid extract (PAE) (liquid product) was stored at 6 °C. The hydrochar (solid product) was dried at 40 °C in a convection oven (BINDER GmbH, Tuttlingen, Germany) without further treatment until a constant weight was achieved.

2.4. Acid Extract Purification Using Ion-Exchange Resins

Preliminary batch experiments for ion selectivity were conducted via model solutions at different pH (1, 2 and 4) and P-concentrations (25, 50 and 100 ppm), as well as via PAE exposed to different cation and anion-exchange resins. Based on this screening data, the resin with the highest phosphorus recovery rate was selected for further experiments.
To purify the PAE (pH 1.9), a strongly acidic food grade cation exchange resin based on a styrene divinylbenzene copolymer (Indion 225NaF, Ion Exchange Limited, Mumbai, India) was used. The resin properties are listed in Table A1. Next, 50-milliliter plastic centrifuge tubes were filled with 5 mL cation-exchange resin, and 30 mL of three different dilutions (1:10, 1:50, 1:100) of the extract were added. To keep the extract at pH ~2, dilutions were performed with H2SO4 acidified DI water (pH 2 ± 0.05). The tubes were then mixed at room temperature using an overhead rotor (RS-RR 5, PHOENIX Instrument, Garbsen, Germany) for 12 h at 30 rpm to achieve equilibrium. As a control, 30 mL of the hundred-fold dilution without any cation-exchange resin was added. After the overnight mixing procedure, the samples were filtered (pore size 4–12 µm, MN 615¼, Machery-Nagel, Dueren, Germany), and the solution was subsequently digested in aqua regia and analyzed using ICP-OES to determine the total phosphorus and metal concentrations. All batch experiments were conducted in triplicate.

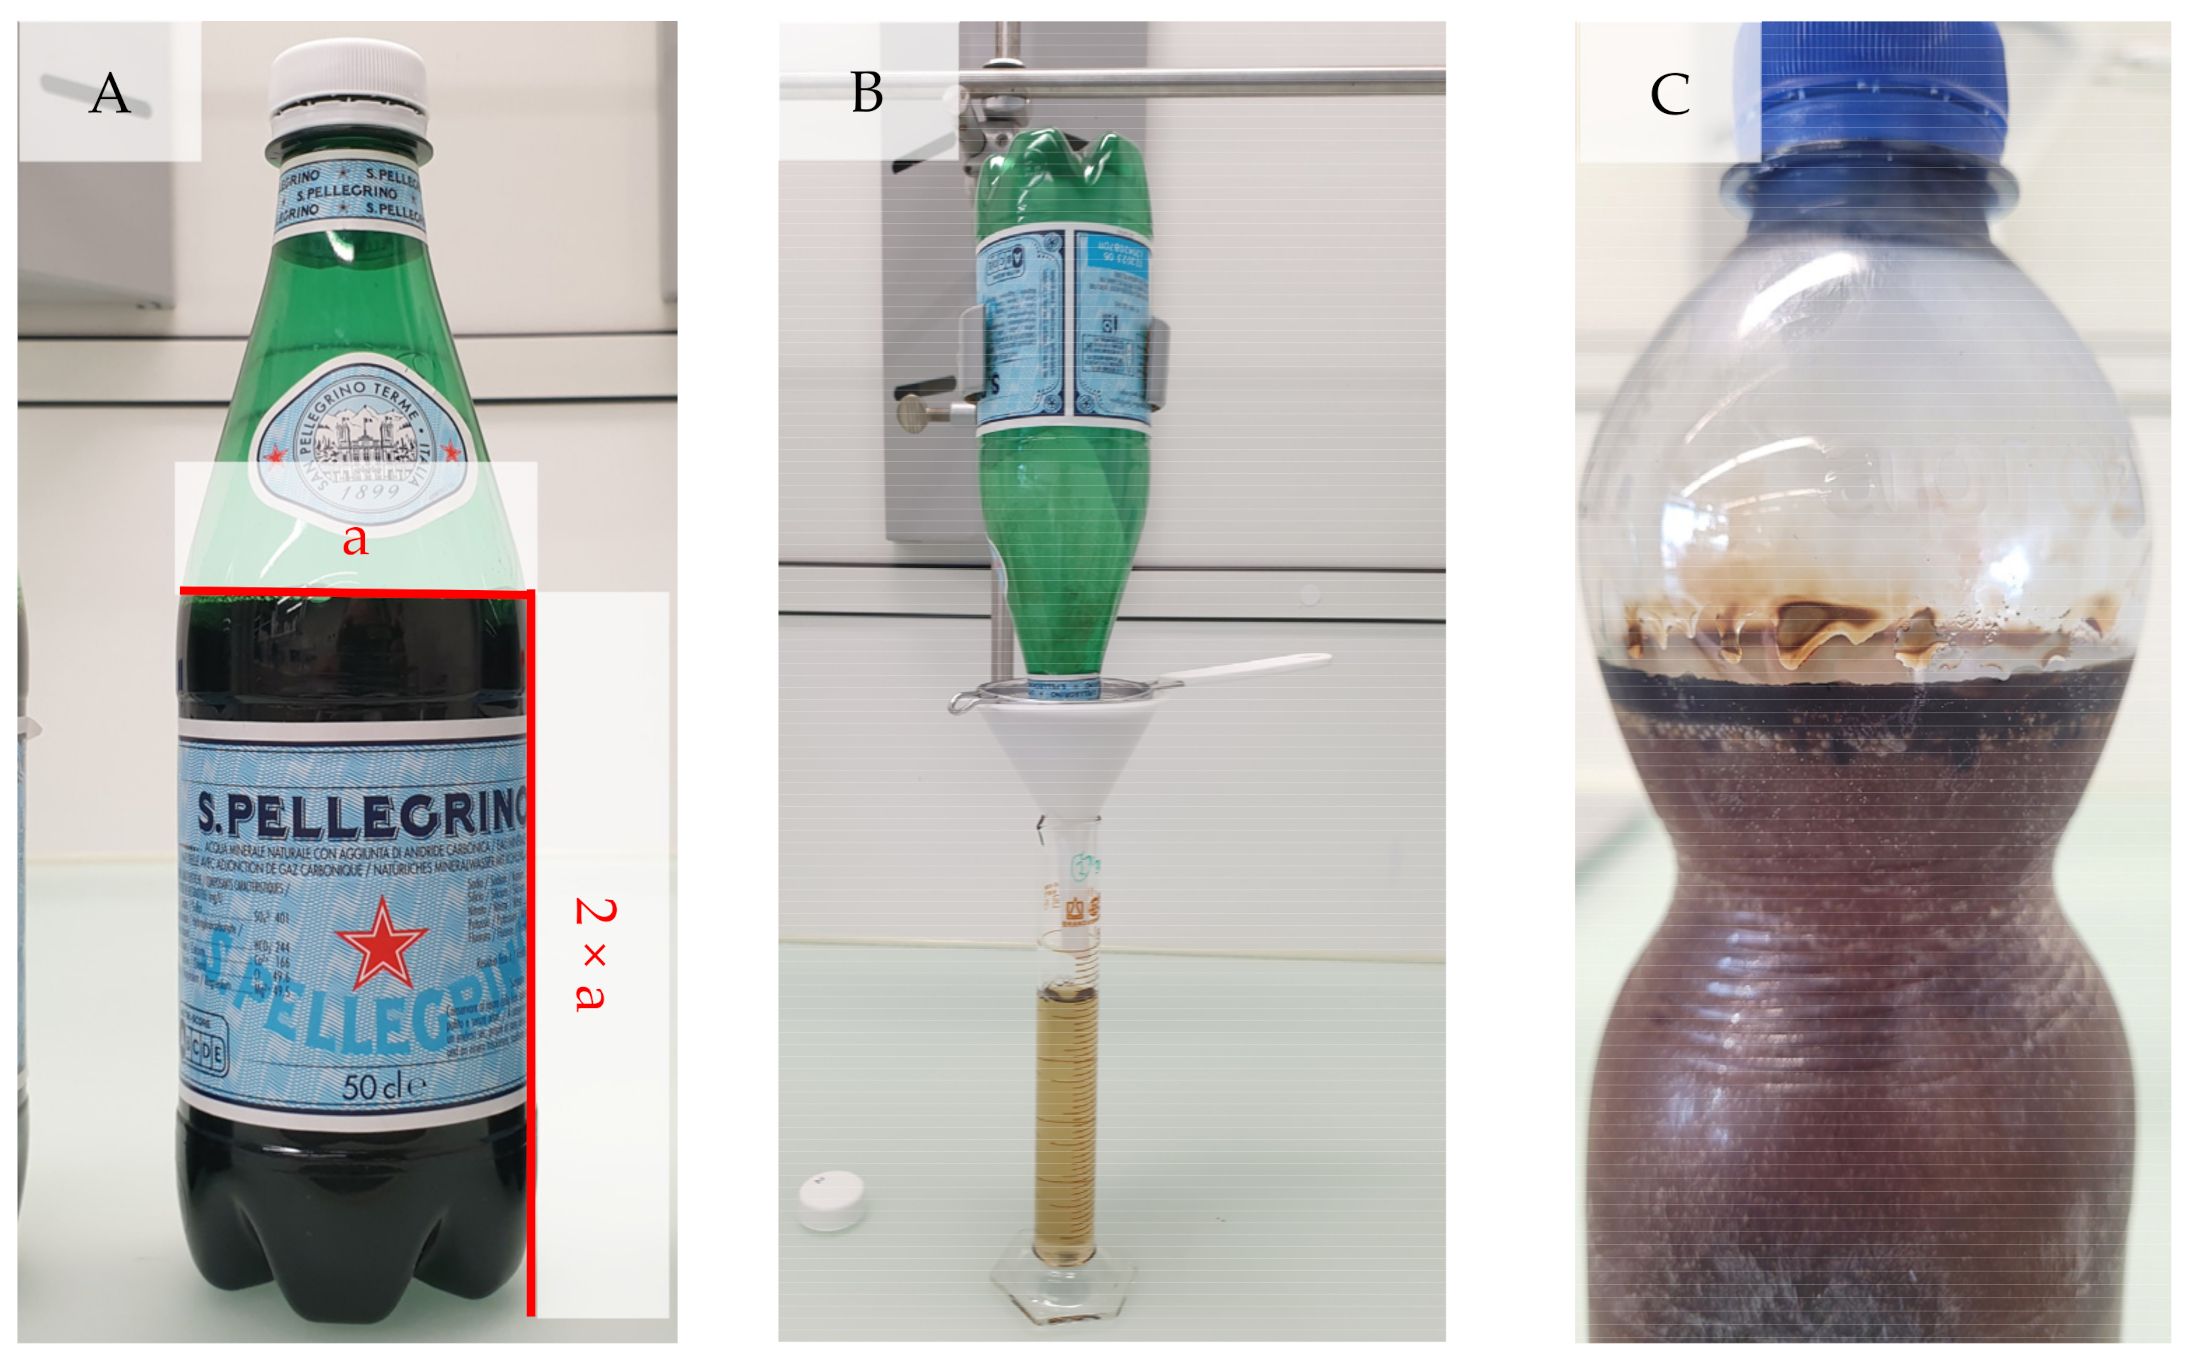
2.5. Freeze Concentration Bottle Test

Freeze concentration was investigated as a novel method for PW treatment. To test the PW for its suitability for BFC, a simple bottle-test method (BTM) was applied. Preliminary experiments with different shapes and sizes of bottles were conducted and evaluated for separation and reproducibility. An optimal bottle should achieve a depth-to-diameter ratio of at least 2, with some head space left for ice expansion (Figure 2A). PET-bottles from international beverage companies were preferred to ensure the comparability of studies. A 500-milliliter San Pellegrino PET bottle achieved the best results in terms of sample volume, separation and reproducibility.
Centrifuged and filtrated PW from the main and supplementary HTC-runs were combined for freeze concentration experiments. Three 500 mL PET bottles were each filled with 400 mL of this bulk PW. They were then closed and placed overnight in an upright position in a freezer at −18 °C to achieve full freezing. The next day, the bottles were fixed upside down to a lab mount and placed above a metal sieve and a plastic funnel to remove particle aggregates, and a 100-milliliter graduated cylinder was used to capture the melt (Figure 2B). After freezing, a thin (2–3 mm) dark organic layer could be seen on top of the ice block, which probably contained substances with lower freezing points (Figure 2C). This layer was washed out with the first melt fraction.
To measure the effect of partition, the meltwater was collected successively in eight 50 mL fractions. Each fraction was immediately analyzed for total organic carbon (TOC) and total nitrogen (TN) contents. All experiments were conducted in triplicate.
To calculate the concentration efficiency and, hence, the recovery of organic substances, a partition coefficient (k) was determined. The k-value was calculated based on the concentration of the TOC in the residue (cr), the concentration of TOC in the feed (cf), the mass of the feed (mf) and the mass of the residue (mr) (Equation (1)) (Samsuri et al., 2018 [37]):
k = 1 log c f c r log m r m f
A k-value of <0.8 shows that separation is possible, and values close to 0.02 indicate optimal separation properties. Each fraction was analyzed for its TOC content, and the combination of the initial fractions, which achieved a TOC recovery of >90%, were determined to be residue (concentrate). This approach was to ensure that a reduced TOC concentration was obtained in the final melt. The k-value was then calculated based on the combined residue.
After determining the volume partition between concentrate and purified PW (ice water), the individual fractions were mixed accordingly and characterized for pH and electrical conductivity (EC) using a portable multi-parameter meter (HQ40d, Hach Lange, Düsseldorf, Germany). A spectrophotometer (DR6000 UV-Vis, Hach Lange, Düsseldorf, Germany) with Hach cuvette tests was used to analyze chemical oxygen demand (COD) (LCI400), ammonium (LCK304), nitrite (LCK341), nitrate (LCK339), phosphate (LCK349) and phenols (LCK346). Samples measured for dissolved compounds were first filtered using a 0.45 µm syringe filter. The total and dissolved organic carbon (TOC, DOC) and total nitrogen (TN) contents in the solution were determined using a TOC-analyzer (Shimadzu, Kyoto, Japan).

2.6. Aerobic Digestion

Aerobic digestion experiments were conducted to analyze the bioavailability of organic compounds in the purified ice water sourced from the FC. Biochemical oxygen demand (BOD) was determined in batch tests via the manometric respirometry method for inhibitor-containing wastewaters (WTW Application report 895232) using OxiTop systems (WTW, Xylem Analytics, Weilheim, Germany) for a total duration of 15 days (BOD15) [38]. The experiments consisted of 5 dilutions and blanks that were run in triplicate. Inoculum was gathered from the final clarifier of a nearby WWTP (ARA Rietliau, Wädenswil, Switzerland).

2.7. Struvite Precipitation

We investigated the recovery of phosphorus in the purified acid extract from the ion-exchange process using a struvite precipitation technique. Two types of extracts were subjected to struvite recovery: 1:50 and 1:100 dilutions. The precipitation batch was prepared using 100 mL of each extract supplemented with process water (NH4-N source) and MgCl2∙6H2O (Mg source). The doses of the supplements were designed to have molar ratios of P, NH4-N and Mg of 1:2:2 (determined by preliminary experiments). The pH of the solution was adjusted to 9 by adding 1 M of NaOH under constant stirring at 300 rpm. Subsequently, the solution was stirred at 150 rpm for a 2-h reaction time. The resultant precipitate was separated via filtration (pore size 4–12 µm, MN 615¼, Machery-Nagel, Dueren, Germany) and dried overnight at 35 °C. The struvite precipitation efficiency was determined via the differences in P, Mg and NH4-N concentrations in the in- and the out-solutions (after separation of the struvite). The following Hach–Lange Cuvette tests were used: LCK-350 for P, LCK-326 for Mg and LCK-304 for NH4-N (Hach Lange, Düsseldorf, Germany).
ICP-OES analysis was performed to obtain the elemental composition of the precipitate, and the values were compared to the regulatory threshold values for mineral recycling fertilizers (MinRec) established by the Swiss Chemical Risk Reduction Ordinance (ORRChem) (Annex 2.6, cipher 2.2, from 18 May 2005). The crystalline structure was characterized using the powder X-ray diffraction (XRD) technique (D8 Advance, Bruker, Billerica, MA, USA) employing Cu radiation through a Ni-filter. The measurements were performed using a theta–theta type Bragg–Brentano geometry, and the K α 2 component was numerically subtracted. The obtained diffraction patterns were verified using the struvite standard (PDF 01-077-2303, syn) from the International Centre for Diffraction Data (ICDD) database. The precipitation experiments were performed in triplicate for each type of leachate.
According to ORRChem (Annex 2.6, No 2.2.4, from 18 May 2005 (Status as of 1 May 2022)), mineral recycling fertilizers have lower threshold values for inorganic pollutants than normal mineral fertilizers. To comply with the current regulations, the inorganic contaminant content must be below the thresholds listed in Table A2. While organic contaminants (PAH, PCB, PCDD and PCDF) in MinRec are also regulated, they are not part of this investigation.

2.8. Characterization of Feedstock and Final Products

DSS, hydrochar and liquid samples (PW, acid extract and freeze concentration products) were analyzed for dry matter and ash content. To reduce losses of volatile substances, all of the solid samples were analyzed at an initial DM content dried at 40 °C (% DM40C), and the results were subsequently corrected to take into account the remaining moisture content by determining the specific DM at 105 °C (% DM105C). The only exceptions were the samples used for the ultimate analysis, which were only dried at 105 °C before being analyzed. The final DM content (% DM) was calculated via Equation (2):
D M w t . % = D M 40 C w t . % × D M 105 C w t . % ÷ 100
The ash content was determined via incineration in a muffle furnace (L 40/11 BO, Nabertherm GmbH, Lilienthal, Germany) according to DIN EN 14775. For the characterization of the hydrochar as kiln fuel, higher and lower heating values (HHV, LHV) were measured in an external lab at Juracement. Ultimate analyses were carried out using a CHN-analyzer (TruSpec Macro, LECO Instrumente GmbH, Mönchengladbach, Germany) for carbon (C), hydrogen (H) and nitrogen (N) and a CHNS-analyzer (vario EL cube, Elementar Analysensysteme GmbH, Langenselbold, Germany) for sulfur (S). In cement production, sulfate (SO4) containing kiln fuel is less problematic, because the more stable form of SO4 either reduces conversion to sulfur dioxide (SO2) or condenses back in the kiln at lower temperatures [39,40]. Other forms, like sulfides or organic sulfur, are more easily oxidized and have to be captured in the flue gas or in the kiln using limestone or dolomite [40]. The SO4 fraction in the hydrochar was determined gravimetrically in an external lab at Juracement. The oxygen (O) content was calculated according to Equation (3):
O w t . % = 100 C w t . % H w t . % N w t . % S w t . % Ash Content w t . %
Heavy metals (Cd, Cu, Ni, Pb and Zn) and plant nutrients (P, K, Ca, and Mg) were measured spectroscopically via ICP-OES (Agilent 5100, Agilent Technologies, Santa Clara, CA, USA). Samples (liquid 2 mL; solid dried at 40 °C 0.35 g) were mixed with aqua regia (8 mL) in a Pyrex glass tube and left for 1 h to react. Subsequently, they were treated via microwave digestion (Discover, CEM GmbH, Kamp-Lintfort, Germany) for 35 min at 175 °C (according to SN EN 13346, protocol C) and diluted in a 25-milliliter volumetric flask with DI water. All samples were digested in triplicate, unless otherwise stated, and the average results were reported.
The organic carbon and nitrogen contents in the liquid samples were determined using a TOC-LCSH analyzer equipped with a TNM-L unit (Shimadzu, Kyoto, Japan) that measured non-purgeable organic carbon (NPOC) (ASTM D7573) and total bound nitrogen (TNb) (DIN EN 12260). To remove any inorganic carbon prior to the TOC measurements, the samples were automatically acidified with 2 M of HCl to pH < 3 and sparged with purified air, which may have resulted in a loss of purgeable organic carbon (POC). Elemental measurements were used to compute the mass balance and individual recovery rates.

3. Results and Discussion

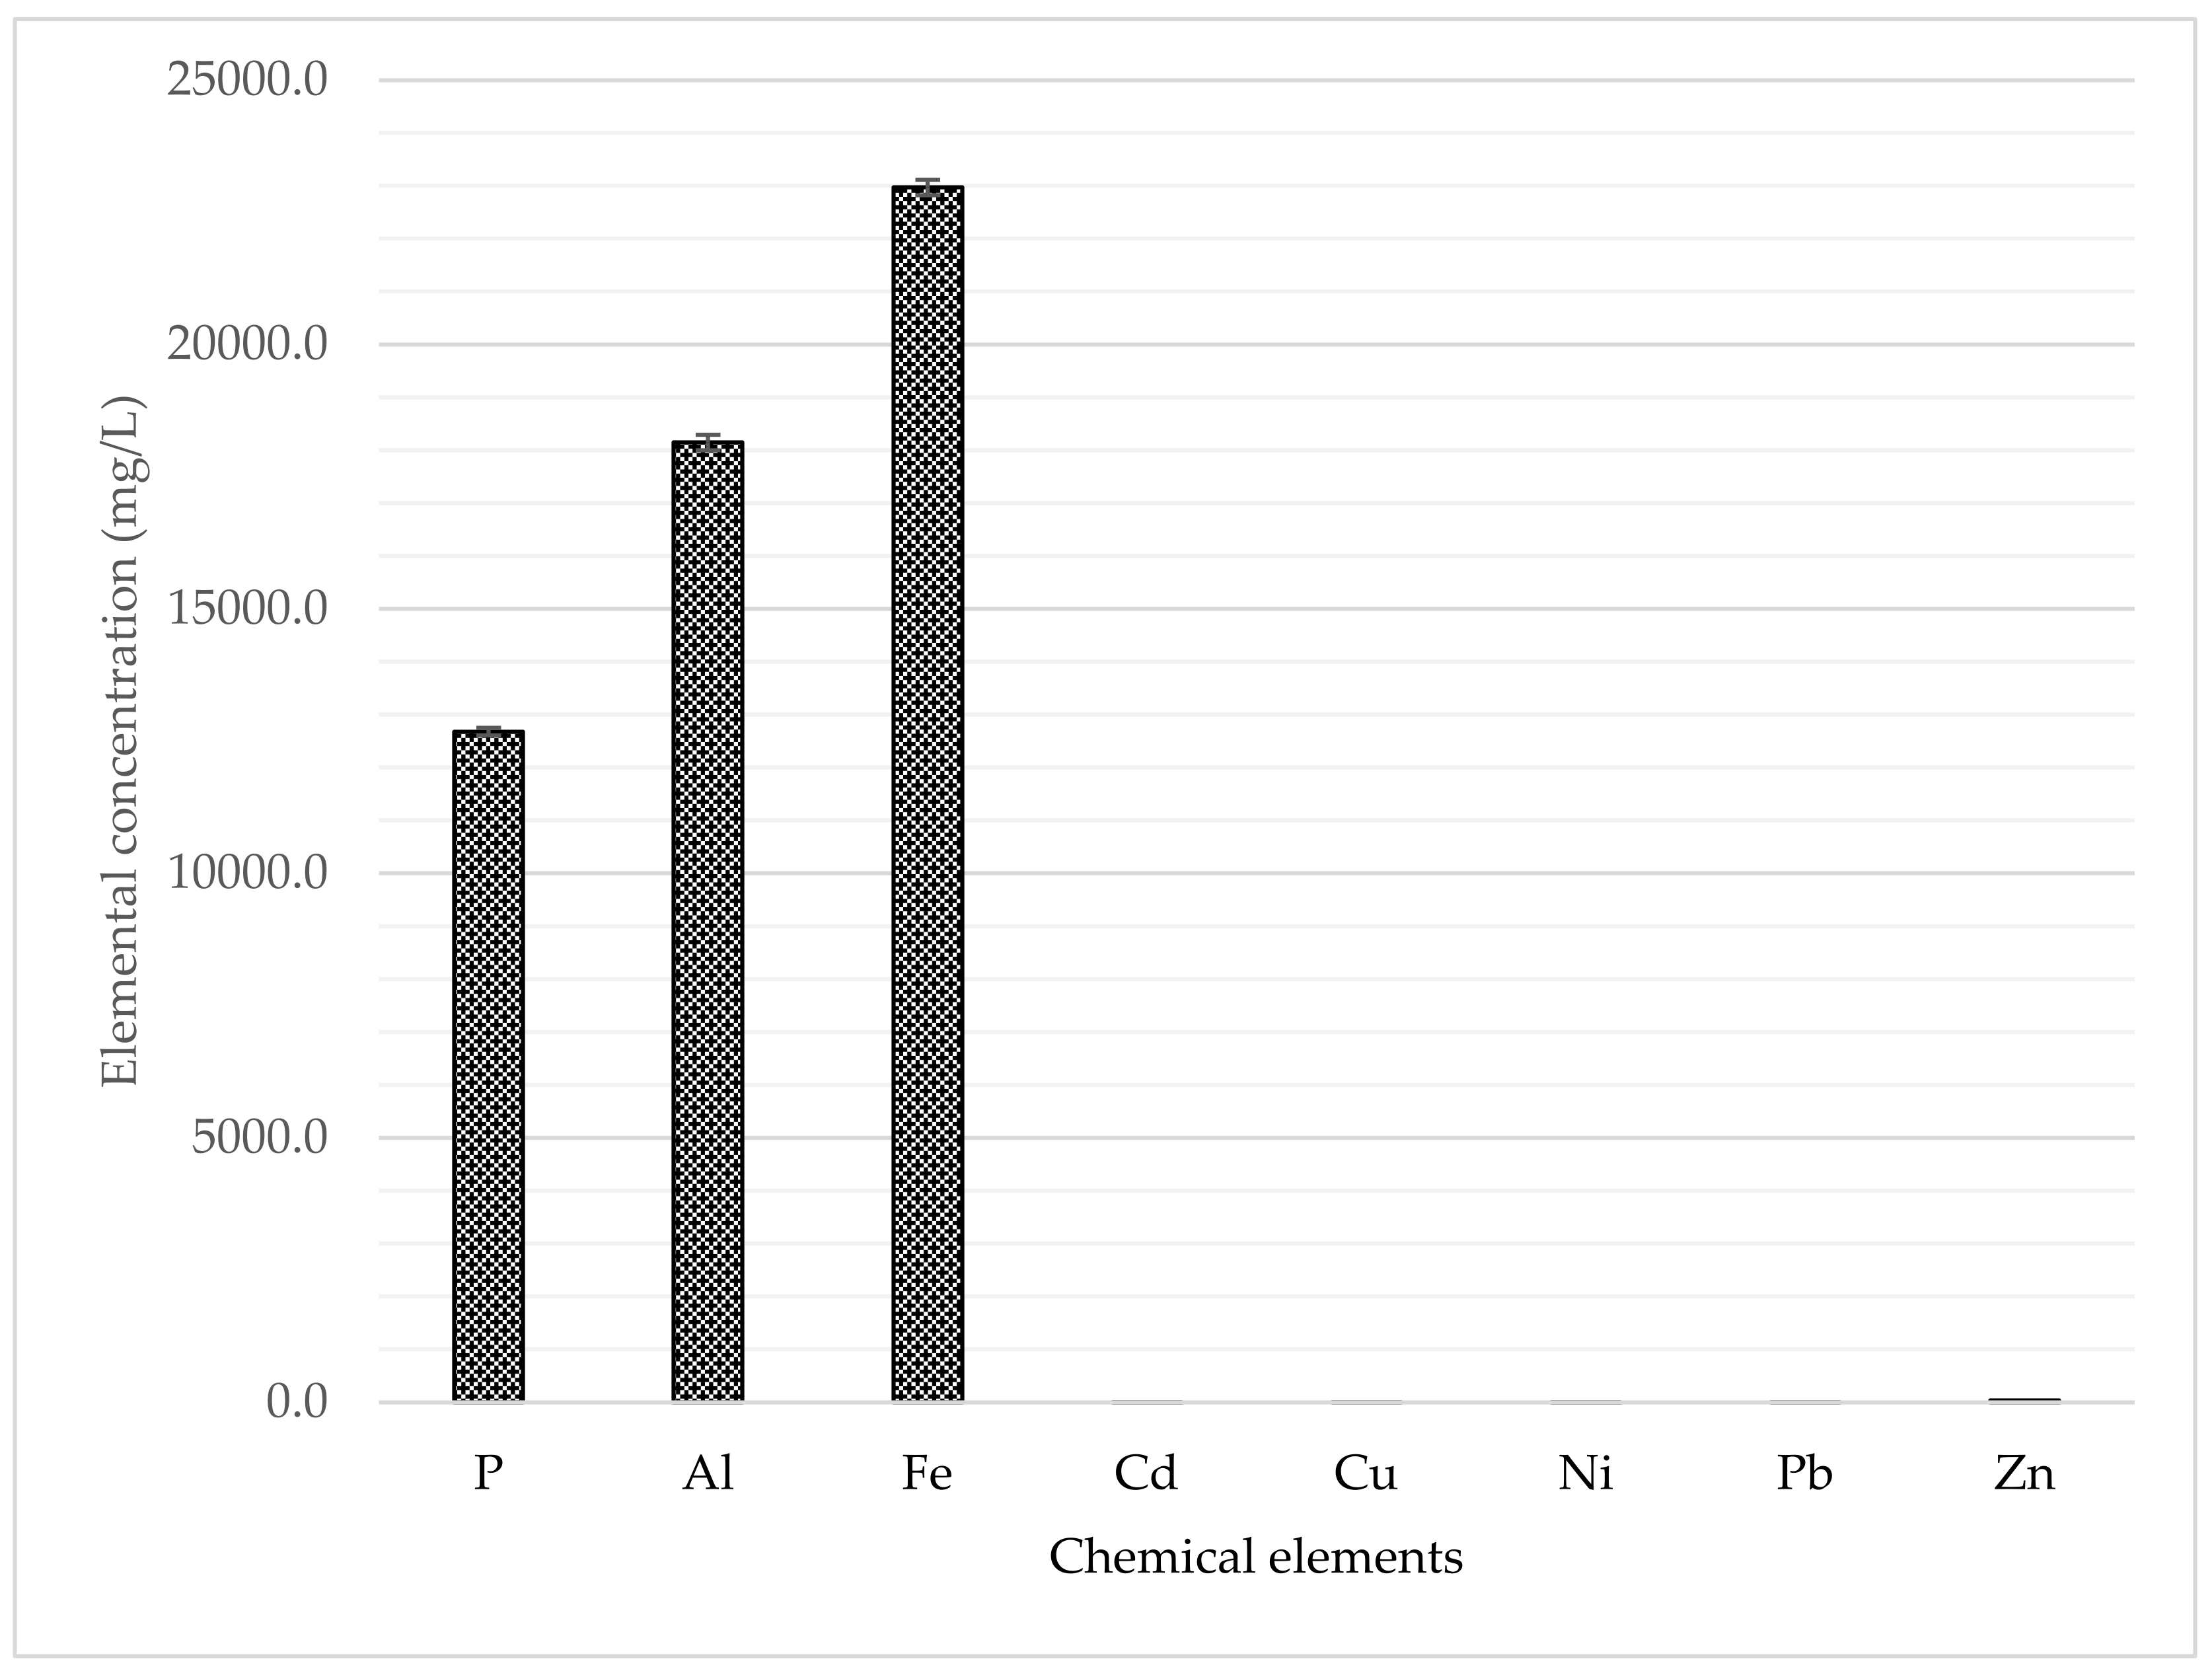
3.1. Hydrothermal Carbonization and P-Extraction

Extensive analyses were conducted to characterize the liquid and solid samples. Ultimate analyses showed a seven-fold increase in S with 9.8 wt.% in the hydrochar compared to 1.4 wt.% in the raw material, which was mainly introduced via the sulfuric acid extraction process (Table 1). This result was comparable to the 9.2 wt.% S content in the hydrochar reported in an earlier study [21]. Determination of the sulfur oxide species revealed that around 90% was available in the more stable SO4 form. At 12.1 MJ/kg, the HHV was in the range of other hydrochars derived from DSS [10,14].
In terms of nutrient recovery, over 72% of the P and 32% of the N leached into the PAE (Table 2). These results are consistent with the recovery rates identified in an earlier study, with a 10% increase in N-recovery recorded in this study [21]. Nevertheless, around 35% of the P and 47% of the N remained in the hydrochar (HTC-HC). Other macronutrients, like K, Mg and Ca, were distributed differently in the hydrochar, PW and PAE. Ca and K were mainly transferred to the hydrochar (93.1 and 60.7%, respectively). The Mg content, on the other hand, was 10% higher in the PAE (53.1%) than in the hydrochar (42.7%). Mass balances of nutrients and metals resulted in good overall recovery rates that lay between 98.9 and 108.2%.
The DSS had high contents of Fe and Al, which are used as precipitants to remove dissolved phosphorus in wastewater treatment plants. The leaching of the P results in the bound metals also being dissolved into the PAE, whereas the PW only contained minor amounts of precipitants and no detectable HM content (Table 3).
Before the ion-exchange treatment step, the PAE contained abundant amounts of P, Al and Fe, which were leached from the thickened HTC-slurry (Figure 3). In terms of HM, only 1.8 mg/L of Ni and 35.2 mg/L of Zn could be detected in the PAE. These results correspond to previous studies conducted by the research group, in which no Ni, however 0.9 ppm Cd was detected in the acidic–liquid phase [21]. Other elements (Cd, Cu and Pb) were below their detection limits.

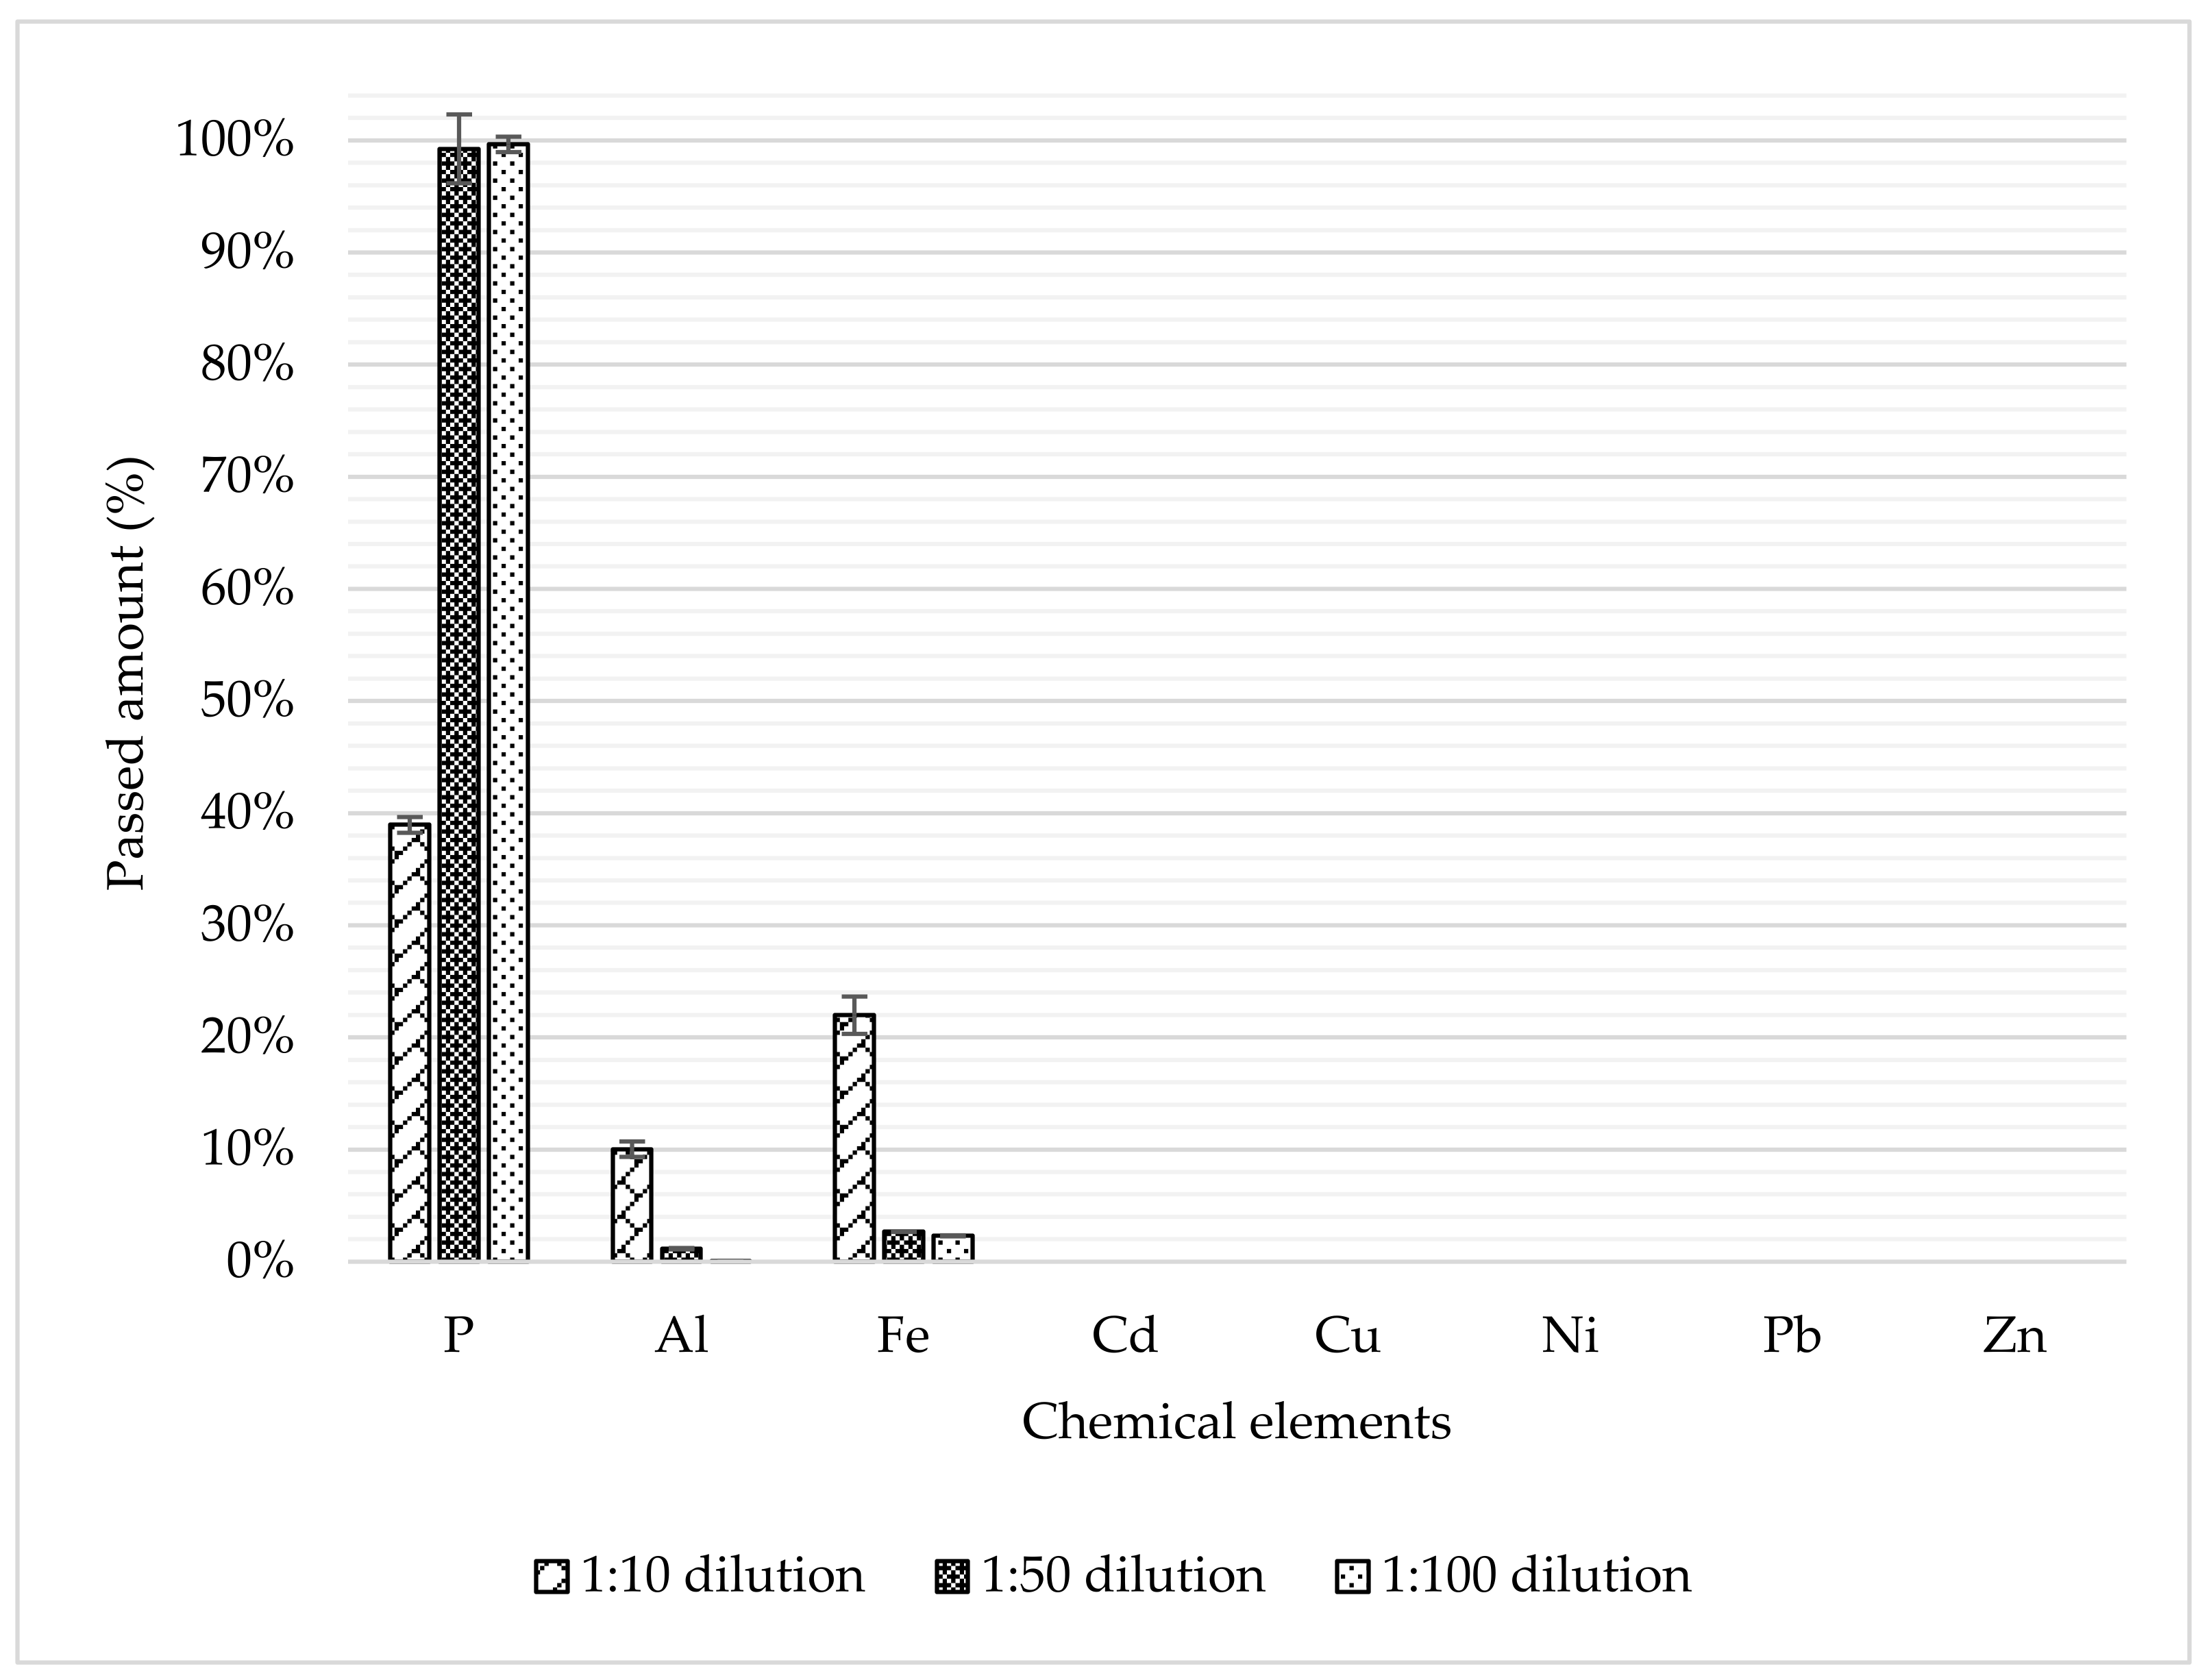
3.2. Purification Step via Ion Exchange

Phosphorus purification experiments using 225NaF cation-exchange resin showed good results for the removal of Fe and Al at higher dilutions, with 99% of P-anions passing through the cation exchanger (Figure 4). Over 98% of the Al and 97% of the Fe, which would interfere with the successive struvite precipitation process, could be removed from the PAE via a single treatment step. However, recovery from the 1:10 dilution was poor, probably as a result of the high ion concentration. Only 39% of the P passed through the ion-exchange resin, whereas substantial amounts of the Al (10.1%) and the Fe (22%) were not retained.
Recently, the Swiss Water Association noticed a possible shortage of coagulants on the Swiss market [41], which could result in the unavoidable discharge of phosphorus into waterbodies. Considering the high retention of Al and Fe in the ion-exchange resin, their elution and reuse in wastewater treatment would be an appealing option for achieving a more closed material cycle. Based on extrapolation of precipitant usage at the Werdhölzli WWTP (Zurich, Switzerland), around 12,000 t of elemental iron precipitant are required in Switzerland every year [41]. On-site recovery and reuse of precipitants could increase the independence of WWTP in uncertain times and over the long term.

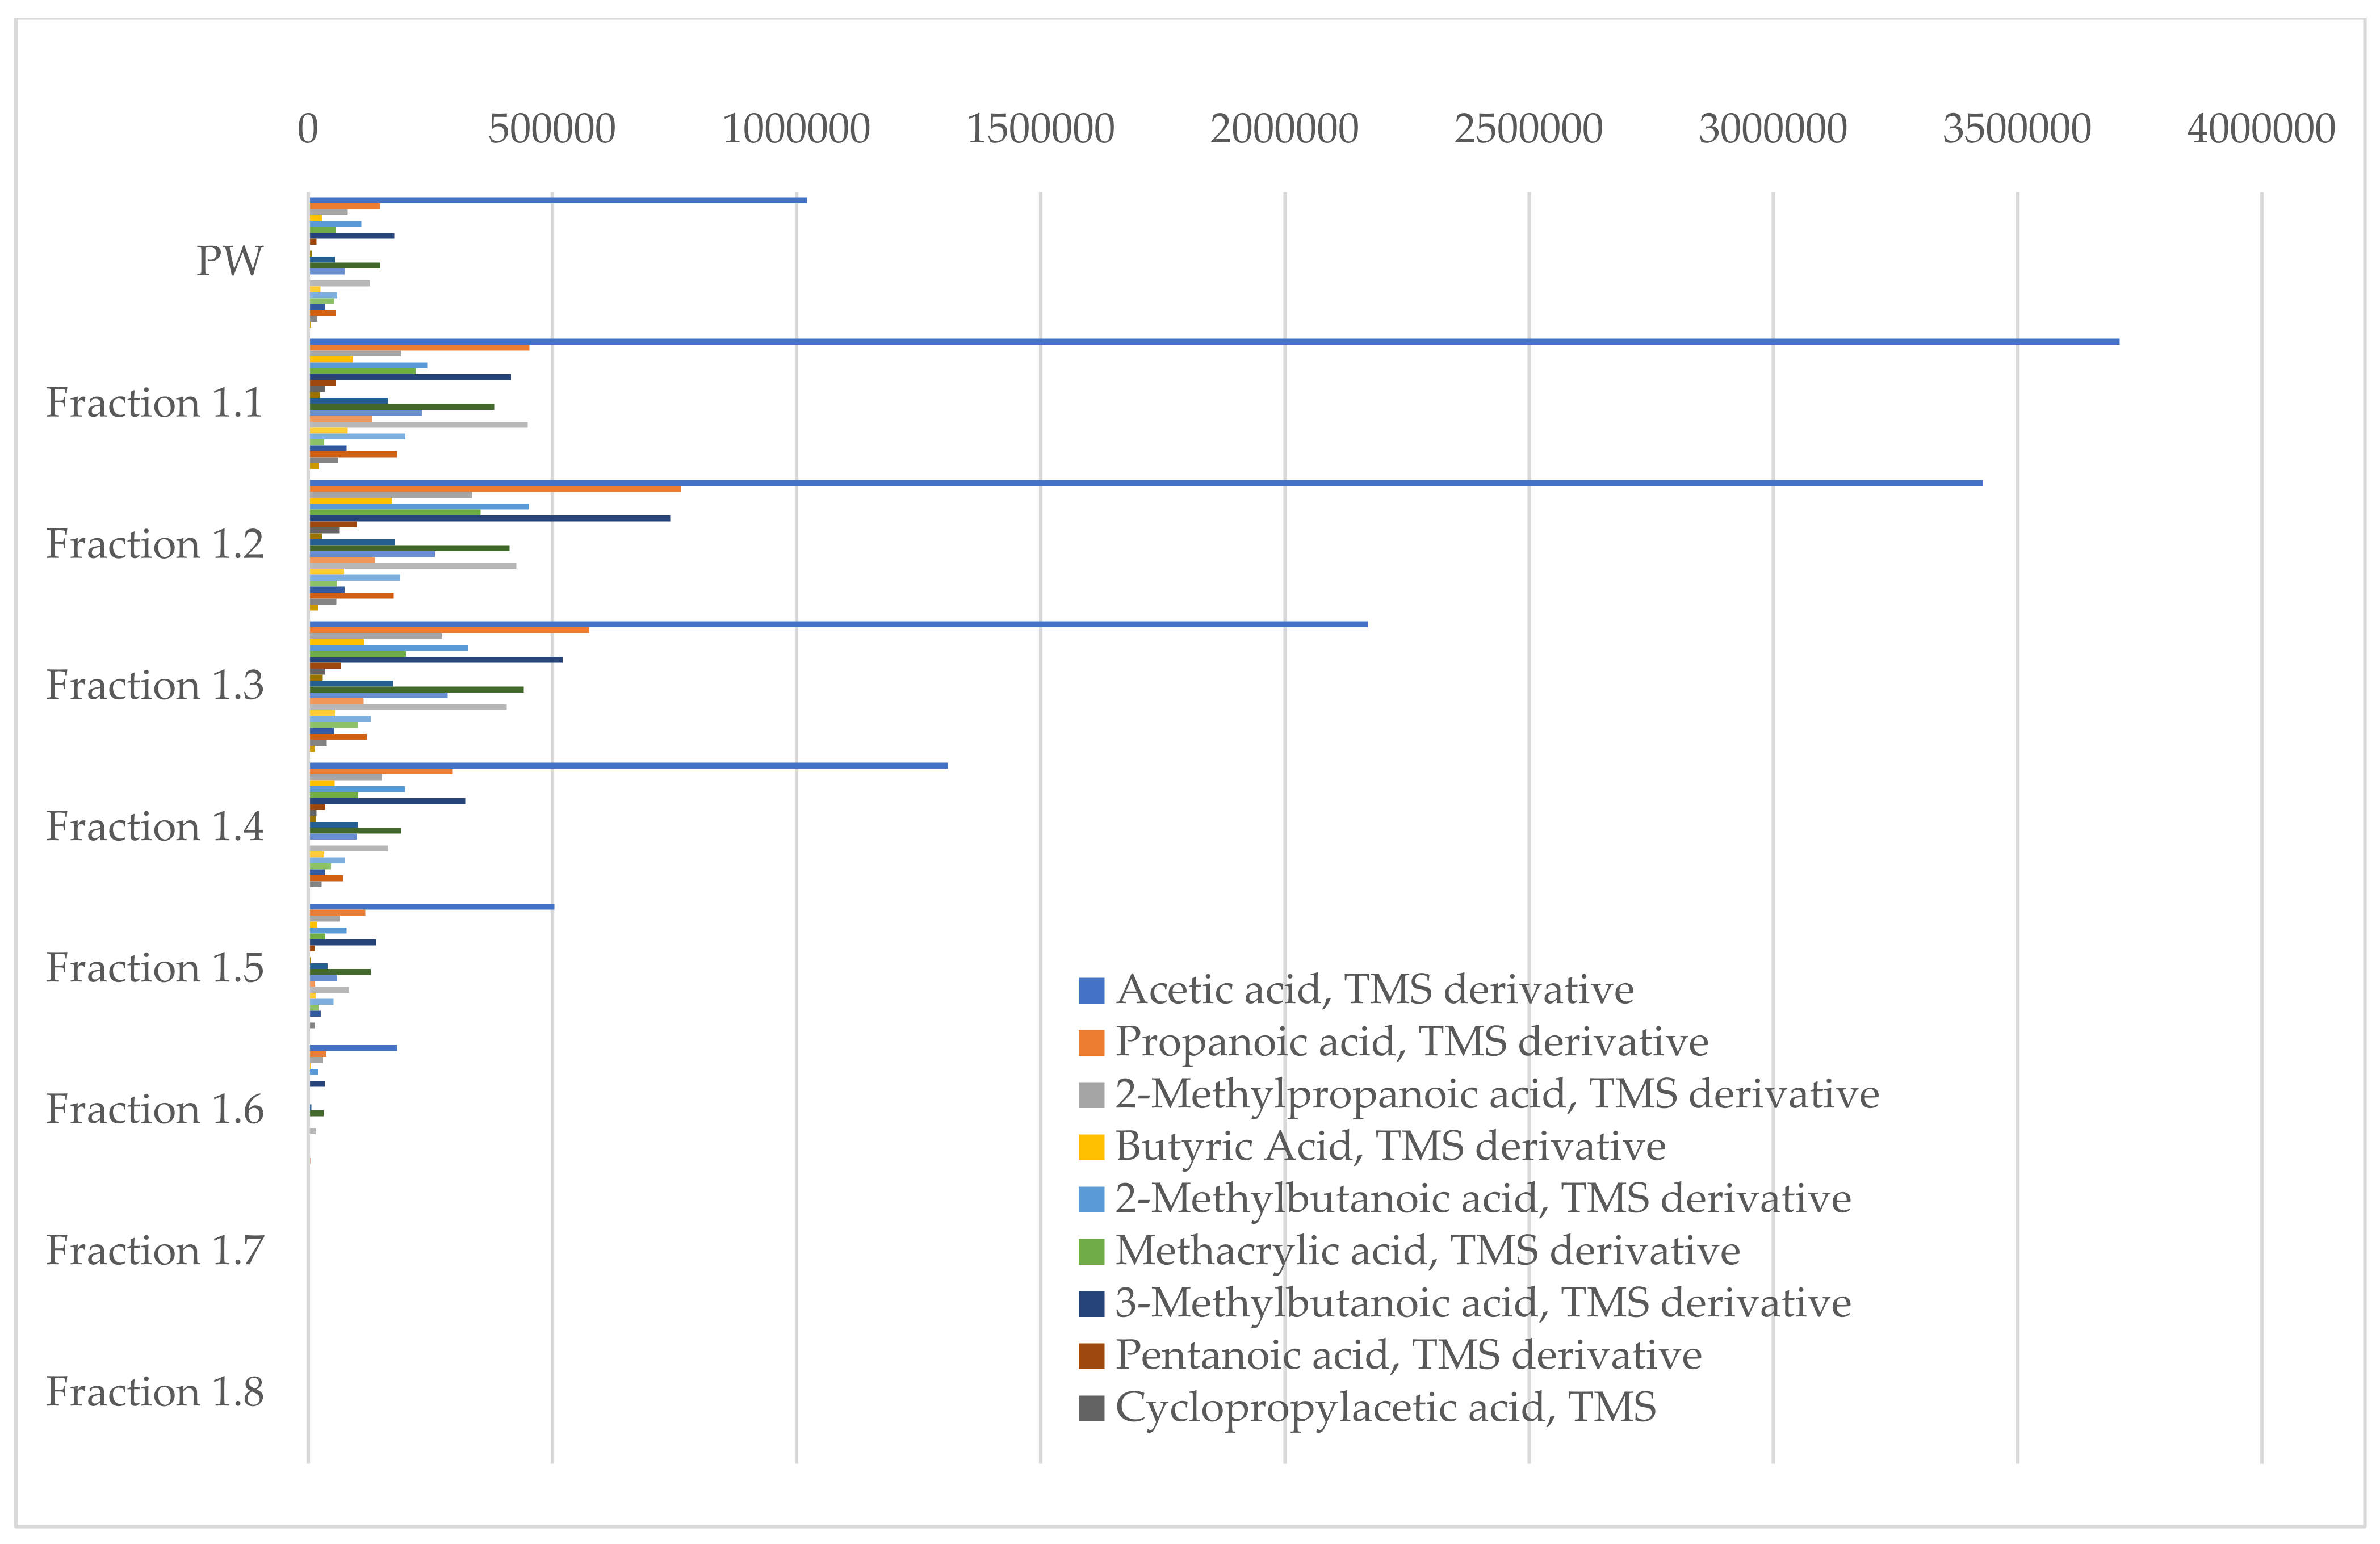
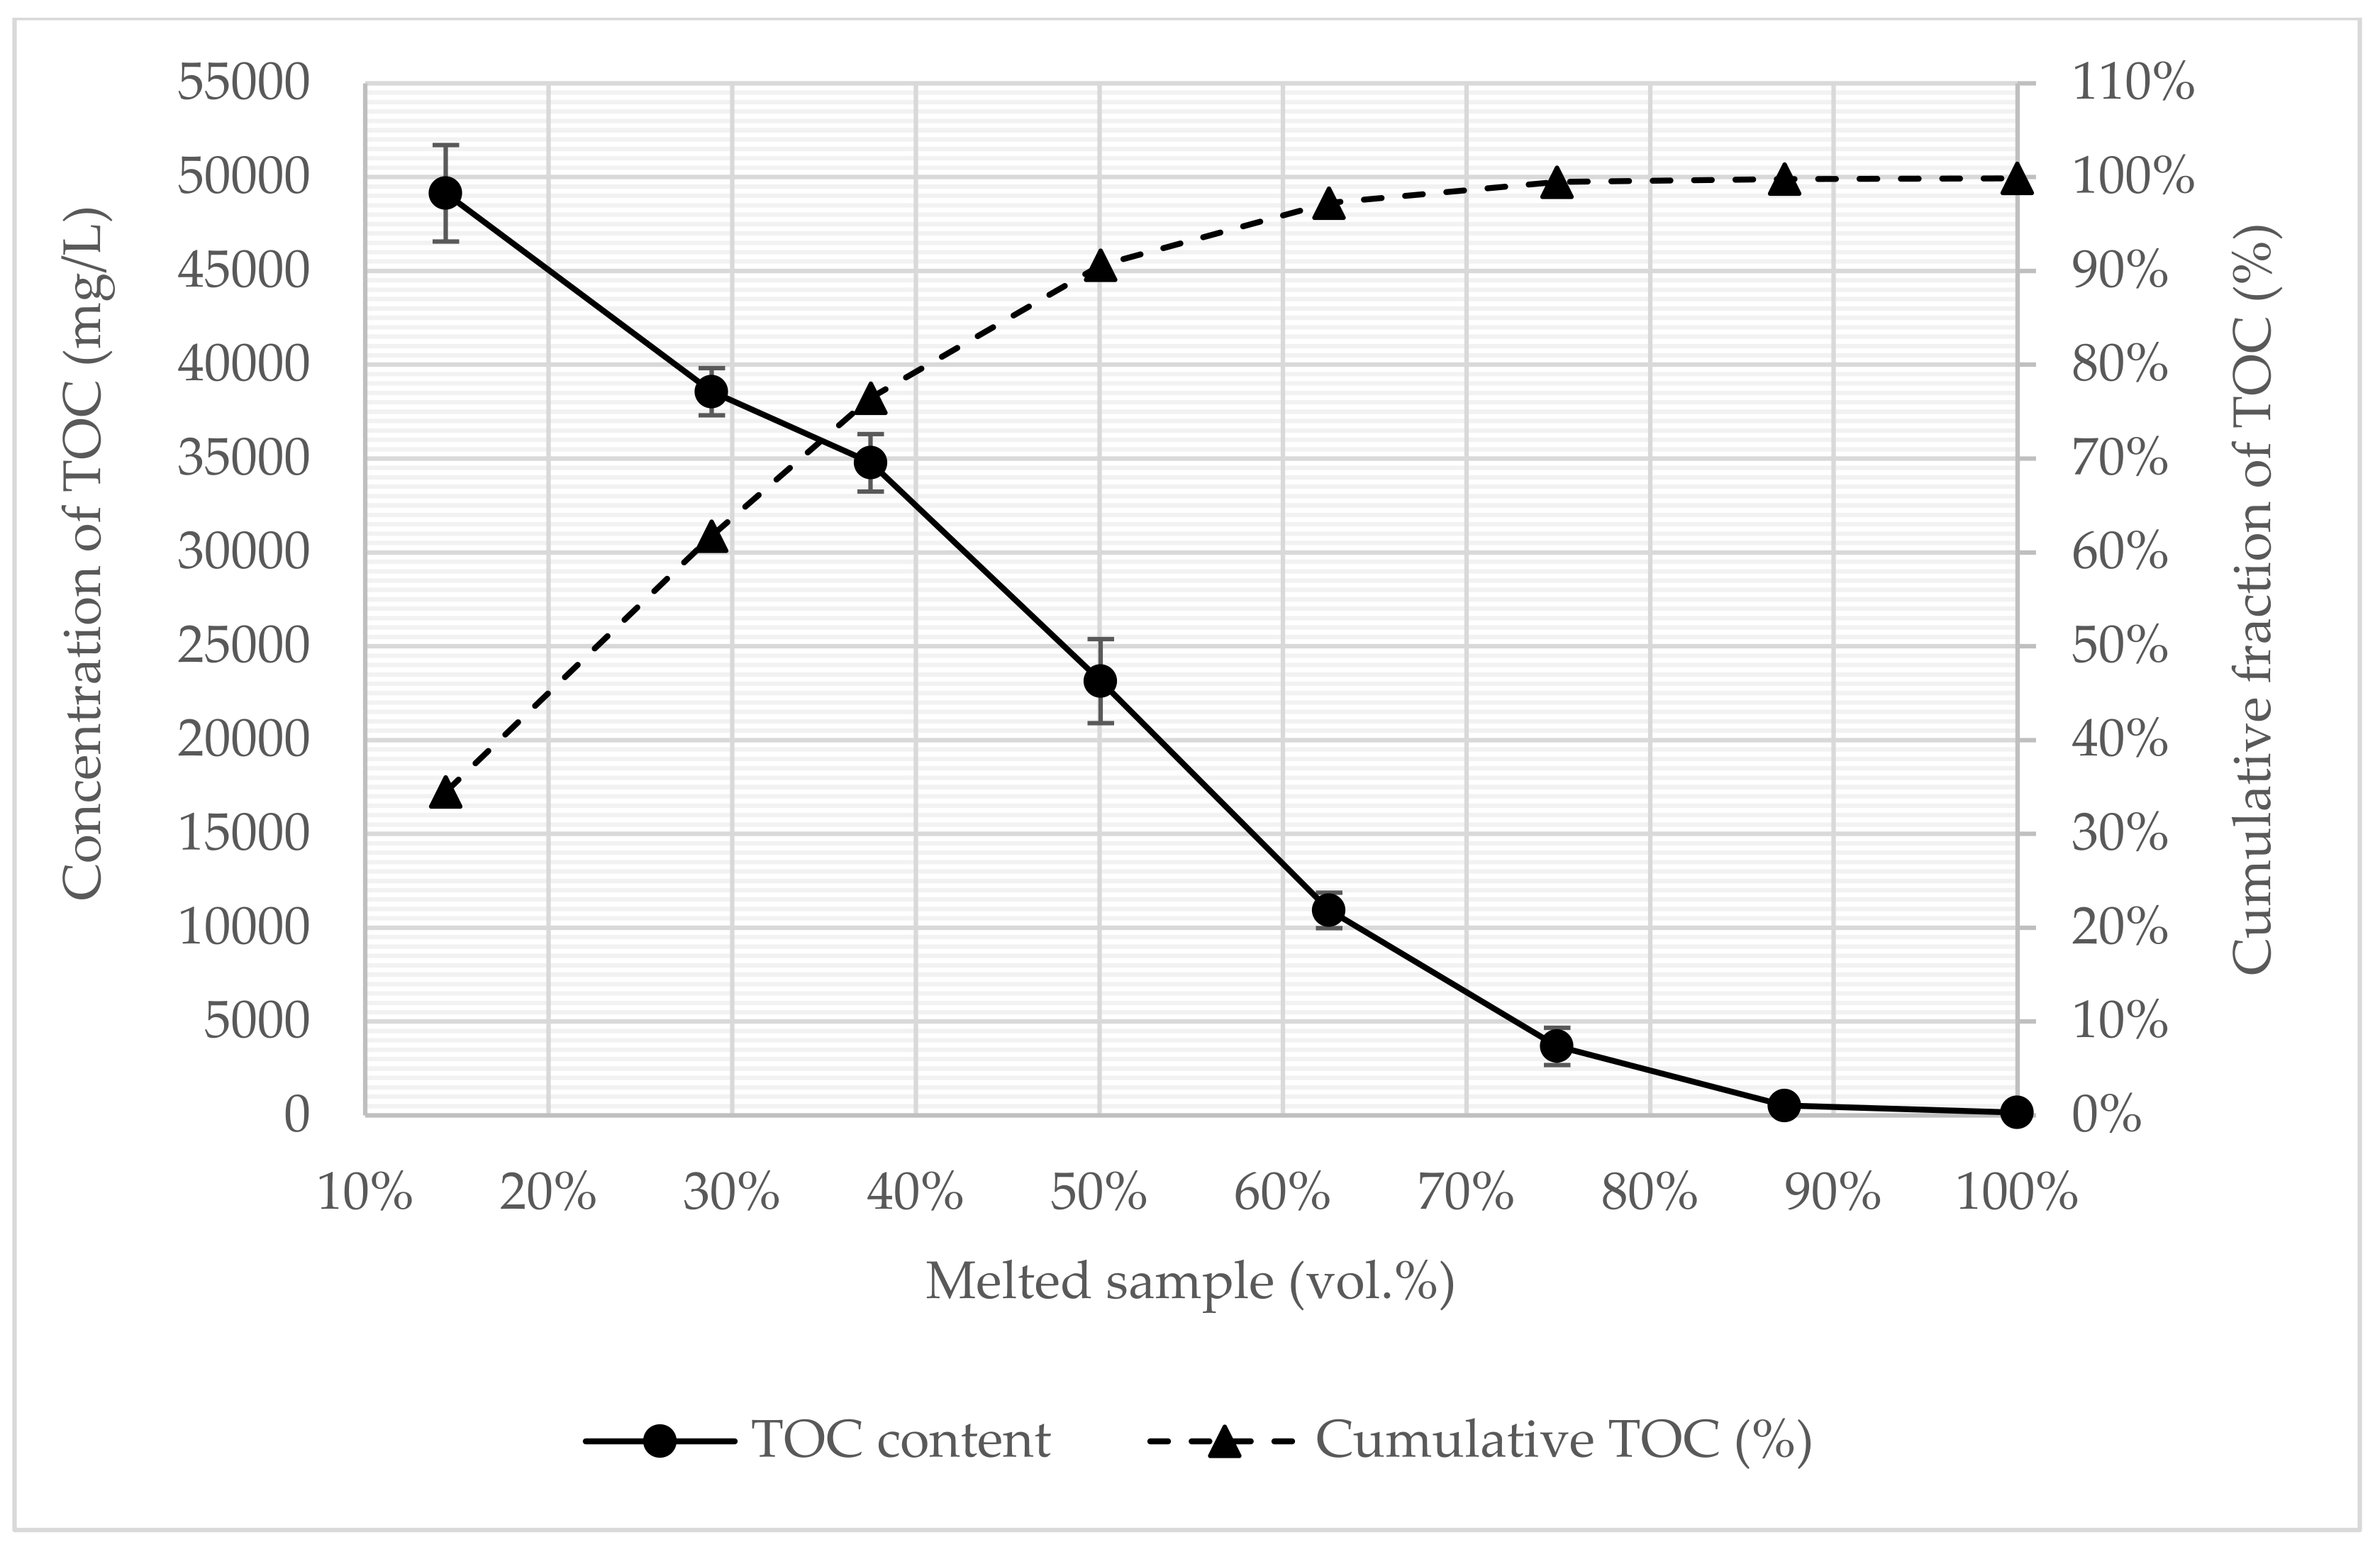
3.3. Process Water Treatment

HTC-PW from sewage sludge contains a diverse composition of organic compounds, which are mostly organic acids (Figure A1). To improve chemical recovery and lower the energy consumption, a novel technology for PW treatment was investigated in this study. Freeze concentration was selected, as it requires less energy than traditional technologies for concentration and offers the possibility of reducing volatile losses and corrosion risks at higher temperatures.
Initially, the suitability of subjecting PW to melt crystallization was investigated. At 50 vol.%, the cumulative TOC and TN fractions reached 90 and 95%, respectively (Figure 5 and Figure 6). These results were in line with expected process efficiency of complete block freeze concentration [23]. Therefore, the cut-off point for the concentrate was set at this volume fraction. With a calculated k-value of 0.145, good separation was achieved, target compounds were enriched in the concentrate, and depleted PW could be used in further treatments.
The PW and separation products (concentrate and depleted PW) were further investigated for their nutrient contents and chemical compositions. Table 4 shows the separation efficiency values for organic carbon, N and P compounds, and pH and EC. While the pH was only slightly affected by freeze concentration, >85% of other compounds were transferred to the concentrated fraction.
Due to the greatly reduced COD content in the ice water, an aerobic digestion treatment step was performed to decompose the remaining organic compounds. The duration of the treatment was set at 15 days (longer than the conventional duration of 5 days (BOD5)) to give the biology more time to adapt. Compared to the initial CODtot of 10,793.3 mg/L, BOD15 resulted in a reduction of 9164 mg/L, which corresponds to a decrease of 85%. This result indicates that a good level of degradation occurs in a relatively short time. BOD curves for dilutions and blank are shown in Figure A2.

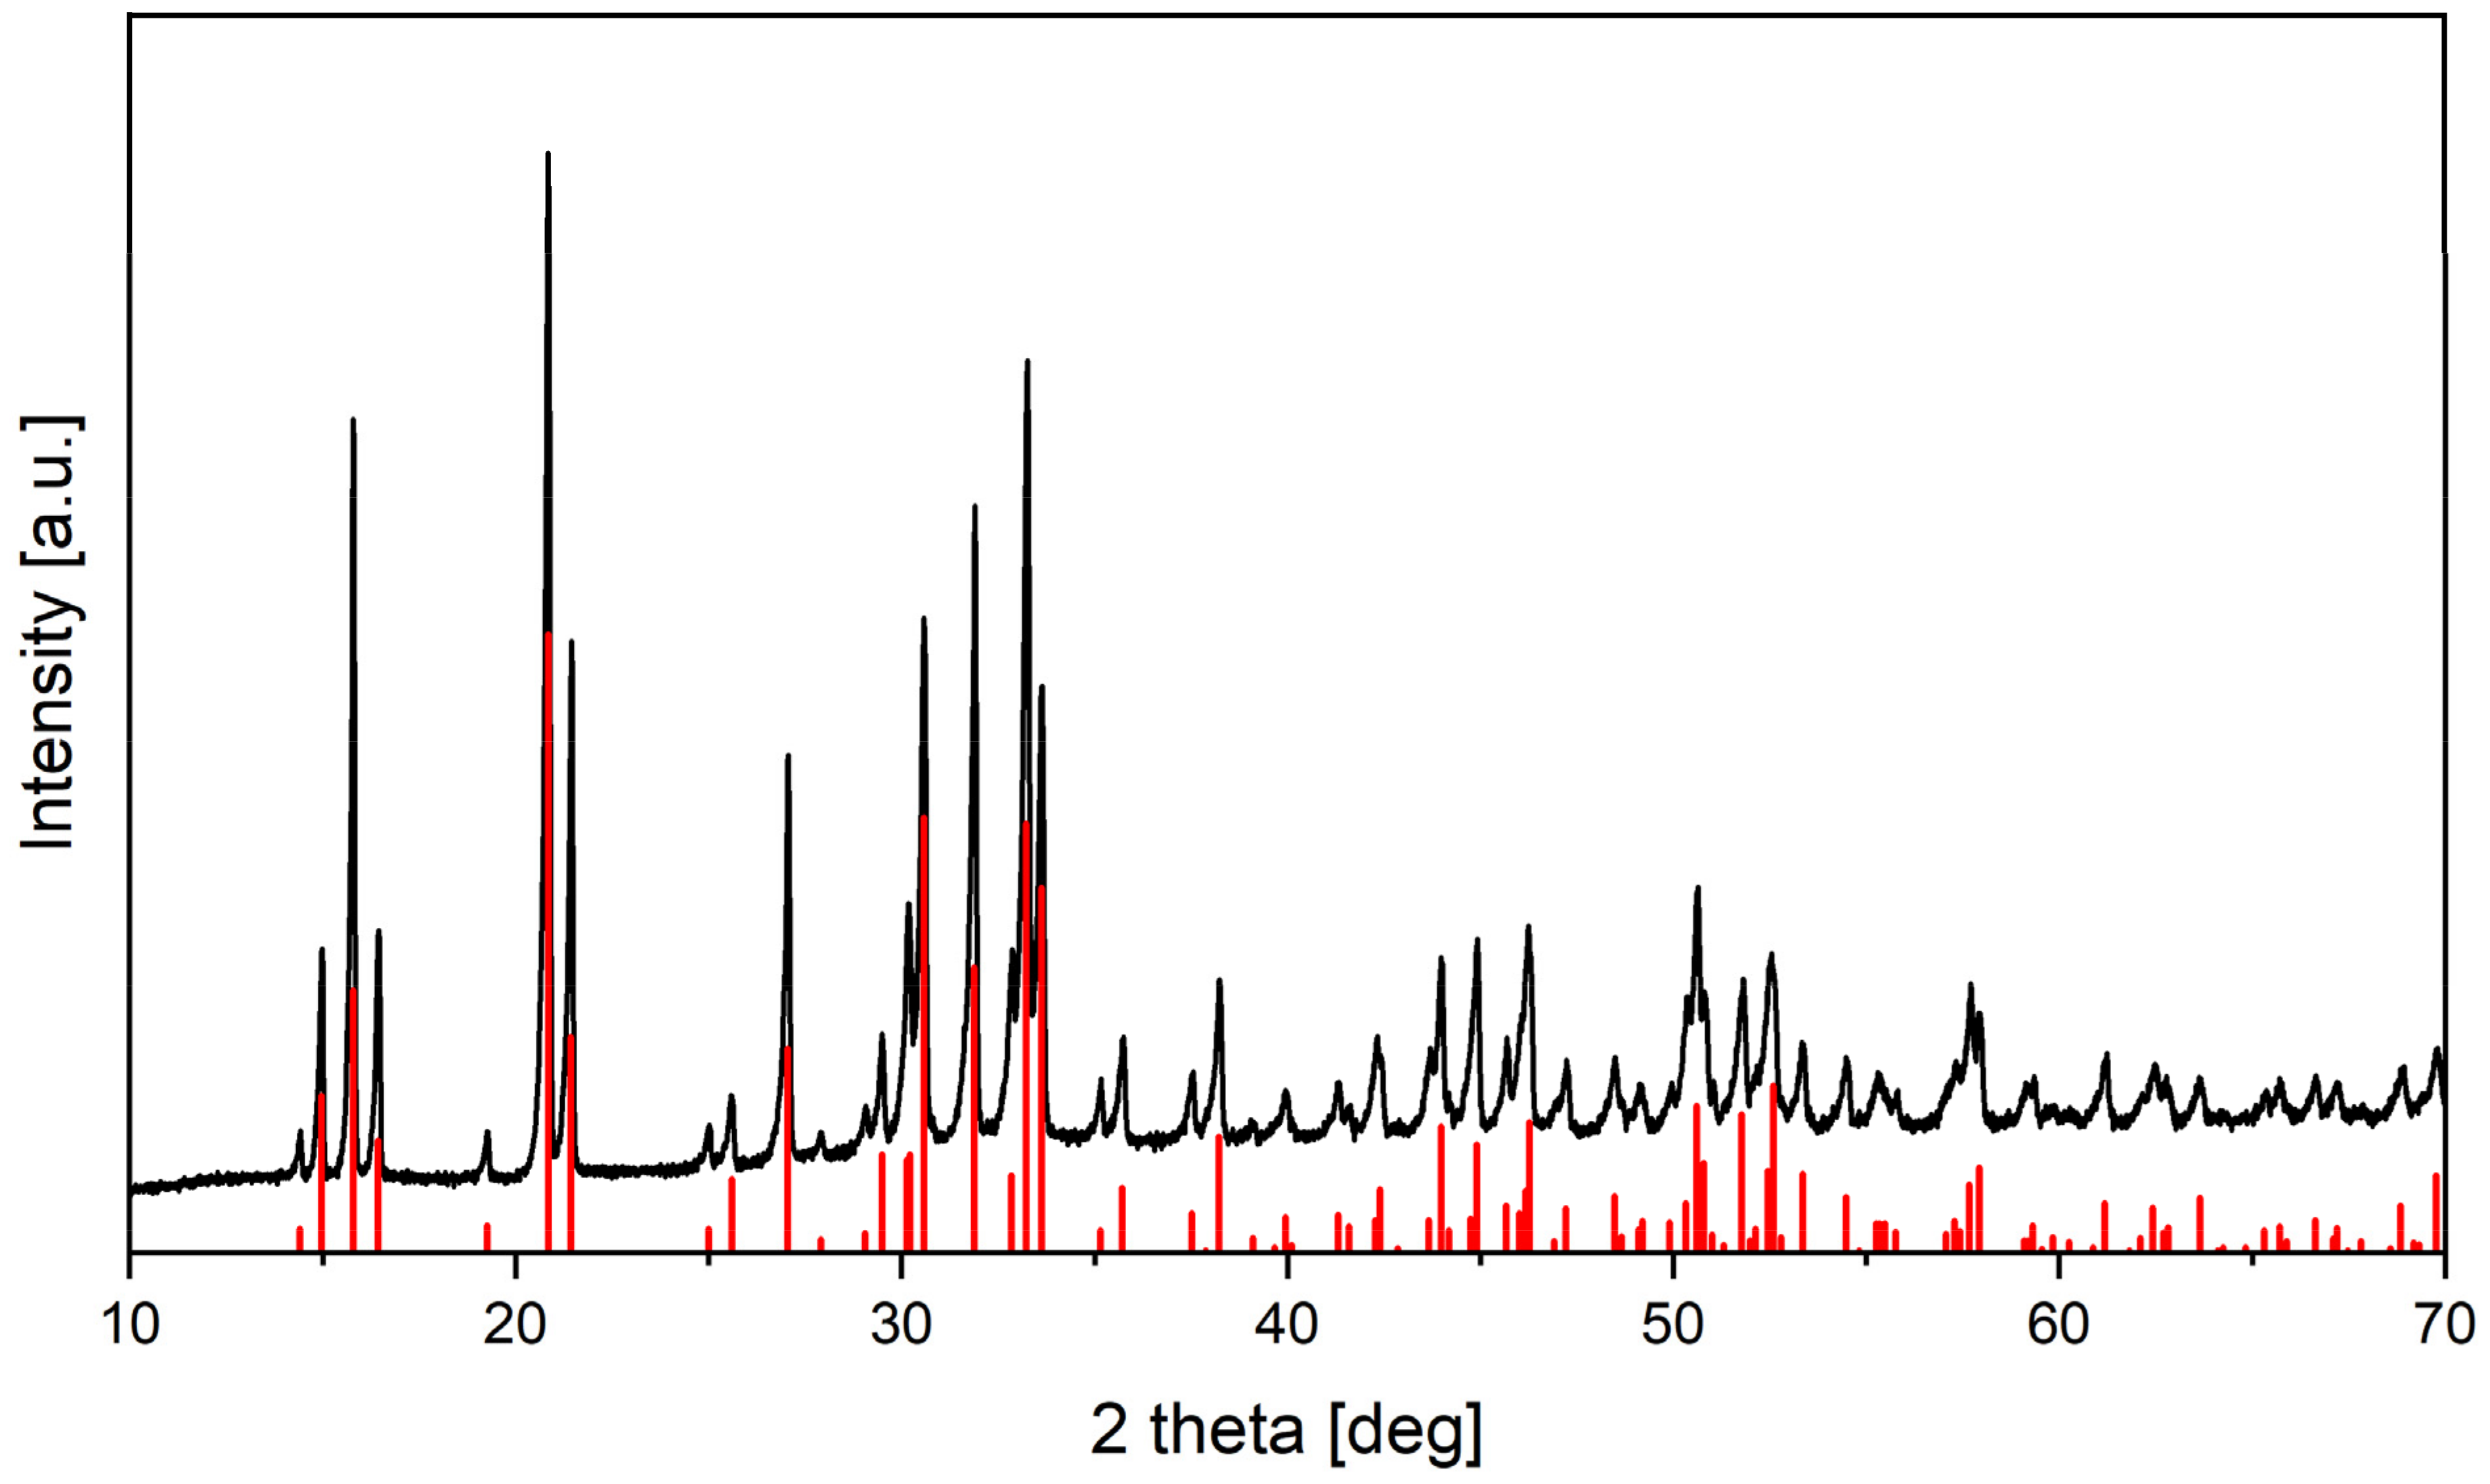
3.4. Struvite Fertilizer

Struvite precipitation is a potential procedure used for the immediate on-site recovery of P and N to produce a tradable slow-release mineral fertilizer. Experiments showed high P recovery efficiencies for both extracts: 98.1 ± 0.1% (average ± standard deviation of triplicate) for the 1:50 dilution and 89.2 ± 0.8% for the 1:100 dilution. Based on the P recovery rate found in the acid extract, an overall recovery of 64–70% was achieved, which was above the legal requirement of 50%. In comparison, Becker et al. achieved a total recovery rate of 82.5% with citric acid [14]. The estimated molar ratio of P:NH4:Mg was 1:1.01:0.97 for the 1:50 dilution extract and 1:0.91:1.06 for the 1:100 dilution extract. As only a very small quantity of struvite formed in the 1:100 dilution batches (<100 mg per batch), which adhered to the entire filter surface during the filtration and drying processes, it was not possible to recover sufficient precipitate for further analysis. Therefore, only the precipitates from the 1:50 dilution batches were investigated for their HM and plant nutrient composition, as well as for struvite identification. XRD patterns from the precipitate closely matched the ICDD reference (PDF 01-077-2303), which confirmed the presence of struvite crystals (Figure 7).
For comparison with MinRec regulations, the most abundant heavy metals were analyzed. All measured HM levels in the struvite sample were below the limit of detection (2.8 mg/kg DM), which would result in a theoretical maximum concentration of 20.4 mg/kg P (Table 5). Therefore, the concentrations of the examined HM in the struvite are below the regulatory threshold values. Other regulated HMs, like As, Cr and Hg and organic contaminants, were not within the scope of this study, and their levels would need to be determined prior to gaining approval for use as a commercial fertilizer.
Plant macro nutrients, like P, N, K, Ca and Mg, as well as Al and Fe, were also determined for the struvite sample (Table 6). The ammonium used in the precipitation process was primarily obtained from the process water concentrate (PWC) (see chapter ‘Process water treatment’), while the remaining ammonium content in the acid extract was relatively low (<5% of stoichiometric demand). If the entire acid extract was used for struvite production, the available ammonium in the PWC would be able to cover 23% of total demand. Throughout all of the processes performed on DSS, 5% of the initial total nitrogen was recovered in the form of struvite. To precipitate all of the P in the acid extract as struvite, additional ammonium and magnesium would have to be provided from external sources. Based on the amount of P available in the PAE, around 170 kg struvite could be produced per metric ton of dry DSS. As the out-solution from the precipitation process still had around half of the initial amount of ammonium and magnesium, further research into their reuse in the precipitation process is necessary. In a comparable study on the hydrothermal treatment of human waste and nutrient recovery, the process water provided around 40% of the ammonium demanded for struvite precipitation [42].
The P content of the struvite product was around 13.7% (31.4% P2O5), which is higher than the content of commercially available P fertilizer, such as ordinary super phosphate (OSP, 20% P2O5) and similar to ammonium polyphosphate (APP, 34% P2O5) [43]. Al and Fe content were low, having contents of 0.2 and 1.8%, respectively. These two elements, in excessive concentrations, could be toxic to plants in soil solutions [36]. In comparison, struvite precipitates from Becker et al. were lower in P (10.0–11.4%) and Ca (0.03–0.23%), slightly lower in Mg (8.4–9.3%) and up to five times higher in Al (0.25–0.77%) [14]. The latter result show the positive effect on the final fertilizer product of the pre-cleaning step to remove Al.

4. Conclusions

Acid extraction with subsequent ion exchange treatment is a promising method, that can improve the quality of the fertilizer product. Excess amounts of Al and Fe can be removed via a single treatment step and recovered during regeneration of the resin. However, to determine the recovery efficiency of the regeneration process, continuous flow experiments need to be conducted. Fertilizer production with a purified extract resulted in a HM-free struvite precipitate, which met the MinRec regulations.
The struvite precipitation processes presented in this research delivered a remarkable level of phosphorus recovery from the purified acid extract: over 98% recovery was registered for the 1:50 dilution, and over 89% recovery was registered for the 1:100 dilution. With an initial P recovery of 72% in the acid extract, a total P recovery of 64–70% was achieved in the struvite fertilizer. The use of a lower dilution is recommended because of the higher phosphorus recovery efficiency and lower resource demand (i.e., less diluent and less volume). Further optimization work to test dilution factors between 10 and 50 of the acid extract would be necessary. As the NH4 supplement for struvite production was obtained from the process water derived via hydrothermal treatment of DSS, the struvite precipitation process also has the advantage of harvesting NH4 retained in the system.
Freeze concentration could be a promising alternative that may reduce energy demand and increase compound recovery. A simple bottle test indicated good separability of the depleted PW, and a TOC-recovery rate of 90% could be achieved. This study intends to provide insight into the possibilities of using freeze concentration as a separation technology for PW, thus laying the foundations for further investigations on a pilot plant scale.
This work represents a technical proof of concept of integrated process chains for digested sewage sludge treatment and nutrient recovery at a laboratory scale. As a next step, pilot-scale trials are needed to determine upscaling effects and allow the economic feasibility to be calculated. Large-scale acid extraction and freeze concentration treatment are expected to be technically feasible, as industrial-scale plants are already available. The purification of acid extracts using ion-exchange resins still requires further investigation, as this process depends on numerous factors related to the experimental setup and the selected resin.

Author Contributions

Conceptualization, G.G.; methodology, G.G. and J.W.C.; validation, G.G.; formal analysis, G.G. and J.W.C.; investigation, G.G., L.M., D.S., S.H., R.W., R.K. (Roman Kontic), A.T. and J.W.C.; resources, G.G., R.K. (Roman Kontic) and R.W.; data curation, G.G., J.W.C. and L.M.; writing—original draft preparation, G.G.; writing—review and editing, G.G., J.W.C., R.K. (Rolf Krebs) and B.K.; visualization, G.G.; supervision, G.G.; project administration, G.G.; funding acquisition, G.G. All authors have read and agreed to the published version of the manuscript.

Funding

This research was funded by cemsuisse, i.e., the Association of the Swiss Cement Industry (project no. 202102). The article processing charges for the open-access publication were funded by Zurich University of Applied Sciences (ZHAW).

Data Availability Statement

Not applicable.

Acknowledgments

The authors would like to thank for the financial support received from cemsuisse, i.e., the Association of the Swiss Cement Industry, and the Zurich University of Applied Sciences (ZHAW) for funding this open-access publication. The authors would also like to thank Markus Bolliger of Jura Cement Fabriken AG for his support with the sulfur analysis, as well as Boris Thamberger of the Institute of Chemistry and Biotechnology (ICBT) at ZHAW for his help with the elemental analysis. We also thank Jürgen Ebert (ICBT-ZHAW) for his expertise and help with using the ion exchanger, as well as ELYSATOR Engineering AG, Switzerland, for supplying the resin.

Conflicts of Interest

The authors declare no conflict of interest. The funders had no role in the design of the study; the collection, analysis, or interpretation of the data; or the writing of the manuscript. The project funders agreed to publish the results.

Appendix A

Table A1. Characteristics of Indion 225NaF (according to the producer’s bulletin) [44].
Functional groupSulphonic acid
Ionic form as suppliedSodium
Total exchange capacity2.0 meq/mL, minimum
Moisture holding capacity43–50%
Shipping weight830 kg/m3, approximately
Particle size range0.3–1.2 mm
  >1.2 mm5.0%, maximum
  <0.3 mm1.0%, maximum
Uniformity co-efficient1.7, maximum
Mean bead size0.45–0.55 mm
Treatment flow rate5–40 bv/h
Maximum operating temperature140 °C
Operating pH range0–14
Resistance to reducing agentsGood
Resistance to oxidizing agentsGenerally good, chlorine should be absent
Table A2. List of threshold values for inorganic contaminants in mineral fertilizer and recycling fertilizer. (Ton = metric ton). (Adapted from Swiss Chemical Risk Reduction Ordinance [45]).
Inorganic PollutantMineral Recycling Fertilizer (MinRec)Mineral Fertilizer
Threshold Value in GramsThreshold Value in Grams Per Ton of
Per Ton of Phosphorus (P)Dry Matter (DM)Phosphorus (P)
Vanadium (V)-4000-
Chromium (Cr)10002000-
Nickel (Ni)500--
Copper (Cu)3000--
Zinc (Zn)10,000--
Arsenic (As)100--
Cadmium (Cd)25-50 1
Mercury (Hg)2--
Lead (Pb)500--
1 Cd in phosphorus fertilizers that contain more than 1% phosphorus.
Figure A1. Results of semi-quantitative GC-MS analysis for compound identification and distribution behavior in eight freeze-concentrated fractions compared to initial PW.
Energies 16 07027 g0a1
Figure A2. BOD curves of blank vs. dilution at 1–5 periods of BOD over 15 days.
Energies 16 07027 g0a2

References

  1. Cordell, D.; White, S. Peak Phosphorus: Clarifying the Key Issues of a Vigorous Debate about Long-Term Phosphorus Security. Sustainability 2011, 3, 2027–2049. [Google Scholar] [CrossRef]
  2. El Bamiki, R.; Raji, O.; Ouabid, M.; Elghali, A.; Khadiri Yazami, O.; Bodinier, J.-L. Phosphate Rocks: A Review of Sedimentary and Igneous Occurrences in Morocco. Minerals 2021, 11, 1137. [Google Scholar] [CrossRef]
  3. Pufahl, P.K.; Groat, L.A. Sedimentary and Igneous Phosphate Deposits: Formation and Exploration: An Invited Paper. Econ. Geol. 2017, 112, 483–516. [Google Scholar] [CrossRef]
  4. Cordell, D.; Drangert, J.-O.; White, S. The Story of Phosphorus: Global Food Security and Food for Thought. Glob. Environ. Chang. 2009, 19, 292–305. [Google Scholar] [CrossRef]
  5. de Ridder, M. Risks and Opportunities in the Global Phosphate Rock Market: Robust Strategies in Times of Uncertainty; The Hague Centre for Strategic Studies: Den Haag, The Netherlands, 2012; ISBN 978-94-91040-69-6. [Google Scholar]
  6. Index Mundi Commodity Prices—Rock Phosphate Monthly Price—US Dollars per Metric Ton. Available online: https://www.indexmundi.com/commodities/?commodity=rock-phosphate&months=240 (accessed on 28 July 2022).
  7. Bertau, M.; Fröhlich, P.; Gellermann, C.; Maurer, A.; Vohrer, U.; Wendler, K. Phosphatrückgewinnung—Statuspapier der ProcessNet-Fachgruppe “Rohstoffe”; DECHEMA: Frankfurt am Main, Germany, 2017. [Google Scholar]
  8. Mehr, J.; Jedelhauser, M.; Binder, C. Transition of the Swiss Phosphorus System towards a Circular Economy—Part 1: Current State and Historical Developments. Sustainability 2018, 10, 1479. [Google Scholar] [CrossRef]
  9. Schenk, K.; Wächter, M. Phosphorreiche Abfälle. Ein Modul der Vollzugshilfe zur Verordnung über die Vermeidung und die Entsorgung von Abfällen (Abfallverordnung, VVEA); Umwelt-Vollzug: Bundesamt für Umwelt: Bern, Switzerland, 2020. [Google Scholar]
  10. Escala, M.; Zumbühl, T.; Koller, C.; Junge, R.; Krebs, R. Hydrothermal Carbonization as an Energy-Efficient Alternative to Established Drying Technologies for Sewage Sludge: A Feasibility Study on a Laboratory Scale. Energy Fuels 2013, 27, 454–460. [Google Scholar] [CrossRef]
  11. Lühmann, T.; Wirth, B. Sewage Sludge Valorization via Hydrothermal Carbonization: Optimizing Dewaterability and Phosphorus Release. Energies 2020, 13, 4417. [Google Scholar] [CrossRef]
  12. Volpe, M.; Fiori, L.; Merzari, F.; Messineo, A.; Andreottola, G. Hydrothermal Carbonization as an Efficient Tool for Sewage Sludge Valorization and Phosphorous Recovery. Chem. Eng. Trans. 2020, 80, 199–204. [Google Scholar] [CrossRef]
  13. Marin-Batista, J.D.; Mohedano, A.F.; Rodríguez, J.J.; De La Rubia, M.A. Energy and Phosphorous Recovery through Hydrothermal Carbonization of Digested Sewage Sludge. Waste Manag. 2020, 105, 566–574. [Google Scholar] [CrossRef]
  14. Becker, G.C.; Wüst, D.; Köhler, H.; Lautenbach, A.; Kruse, A. Novel Approach of Phosphate-Reclamation as Struvite from Sewage Sludge by Utilising Hydrothermal Carbonization. J. Environ. Manag. 2019, 238, 119–125. [Google Scholar] [CrossRef]
  15. Aragón-Briceño, C.; Ross, A.B.; Camargo-Valero, M.A. Evaluation and Comparison of Product Yields and Bio-Methane Potential in Sewage Digestate Following Hydrothermal Treatment. Appl. Energy 2017, 208, 1357–1369. [Google Scholar] [CrossRef]
  16. Urbanowska, A.; Kabsch-Korbutowicz, M.; Wnukowski, M.; Seruga, P.; Baranowski, M.; Pawlak-Kruczek, H.; Serafin-Tkaczuk, M.; Krochmalny, K.; Niedzwiecki, L. Treatment of Liquid By-Products of Hydrothermal Carbonization (HTC) of Agricultural Digestate Using Membrane Separation. Energies 2020, 13, 262. [Google Scholar] [CrossRef]
  17. Wüst, D.; Arauzo, P.; Habicht, S.; Cazaña, F.; Fiori, L.; Kruse, A. Process Water Recirculation During Hydrothermal Carbonization as a Promising Process Step Towards the Production of Nitrogen-Doped Carbonaceous Materials. Waste Biomass Valorization 2022, 13, 2349–2373. [Google Scholar] [CrossRef]
  18. Stemann, J.; Putschew, A.; Ziegler, F. Hydrothermal Carbonization: Process Water Characterization and Effects of Water Recirculation. Bioresour. Technol. 2013, 143, 139–146. [Google Scholar] [CrossRef] [PubMed]
  19. Blach, T.; Lechevallier, P.; Engelhart, M. Effect of Temperature during the Hydrothermal Carbonization of Sewage Sludge on the Aerobic Treatment of the Produced Process Waters. J. Water Process Eng. 2023, 51, 103368. [Google Scholar] [CrossRef]
  20. Villamil, J.A.; Mohedano, A.F.; Rodriguez, J.J.; De La Rubia, M.A. Valorisation of the Liquid Fraction from Hydrothermal Carbonisation of Sewage Sludge by Anaerobic Digestion: Anaerobic Digestion of the Liquid Fraction from HTC of Sewage Sludge. J. Chem. Technol. Biotechnol. 2018, 93, 450–456. [Google Scholar] [CrossRef]
  21. Gerner, G.; Meyer, L.; Wanner, R.; Keller, T.; Krebs, R. Sewage Sludge Treatment by Hydrothermal Carbonization: Feasibility Study for Sustainable Nutrient Recovery and Fuel Production. Energies 2021, 14, 2697. [Google Scholar] [CrossRef]
  22. John, M.; Häkkinen, A.; Louhi-Kultanen, M. Purification Efficiency of Natural Freeze Crystallization for Urban Wastewaters. Cold Reg. Sci. Technol. 2020, 170, 102953. [Google Scholar] [CrossRef]
  23. Petzold, G.; Orellana, P.; Moreno, J.J.; Junod, J.; Bugueño, G. Freeze Concentration as a Technique to Protect Valuable Heat-Labile Components of Foods. In Innovative Processing Technologies for Foods with Bioactive Compounds; Moreno, J.J., Ed.; CRC Press: Boca Raton, FL, USA, 2016; ISBN 978-1-315-37127-6. [Google Scholar]
  24. Samsuri, S.; Rizan, N.A.N.; Hung, S.H.; Amran, N.A.; Sambudi, N.S. Progressive Freeze Concentration for Volume Reduction of Produced Water and Biodiesel Wastewater. Chem. Eng. Technol. 2019, 42, 1764–1770. [Google Scholar] [CrossRef]
  25. Uald-lamkaddam, I.; Dadrasnia, A.; Llenas, L.; Ponsá, S.; Colón, J.; Vega, E.; Mora, M. Application of Freeze Concentration Technologies to Valorize Nutrient-Rich Effluents Generated from the Anaerobic Digestion of Agro-Industrial Wastes. Sustainability 2021, 13, 13769. [Google Scholar] [CrossRef]
  26. Ulrich, J.; Stelzer, T. Melt Crystallization. In Crystallization: Basic Concepts and Industrial Applications; Beckmann, W., Ed.; Wiley-VCH: Weinheim, Germany, 2013; ISBN 978-3-527-65034-7. [Google Scholar]
  27. Williams, P.M.; Ahmad, M.; Connolly, B.S.; Oatley-Radcliffe, D.L. Technology for Freeze Concentration in the Desalination Industry. Desalination 2015, 356, 314–327. [Google Scholar] [CrossRef]
  28. Dadrasnia, A.; de Bona Muñoz, I.; Yáñez, E.H.; Lamkaddam, I.U.; Mora, M.; Ponsá, S.; Ahmed, M.; Argelaguet, L.L.; Williams, P.M.; Oatley-Radcliffe, D.L. Sustainable Nutrient Recovery from Animal Manure: A Review of Current Best Practice Technology and the Potential for Freeze Concentration. J. Clean. Prod. 2021, 315, 128106. [Google Scholar] [CrossRef]
  29. Prestes, A.A.; Helm, C.V.; Esmerino, E.A.; Silva, R.; da Cruz, A.G.; Prudencio, E.S. Freeze Concentration Techniques as Alternative Methods to Thermal Processing in Dairy Manufacturing: A Review. J. Food Sci. 2022, 87, 488–502. [Google Scholar] [CrossRef]
  30. Petzold, G.; Moreno, J.; Lastra, P.; Rojas, K.; Orellana, P. Block Freeze Concentration Assisted by Centrifugation Applied to Blueberry and Pineapple Juices. Innov. Food Sci. Emerg. Technol. 2015, 30, 192–197. [Google Scholar] [CrossRef]
  31. Valle, S.F.; Giroto, A.S.; Guimarães, G.G.F.; Nagel, K.A.; Galinski, A.; Cohnen, J.; Jablonowski, N.D.; Ribeiro, C. Co-Fertilization of Sulfur and Struvite-Phosphorus in a Slow-Release Fertilizer Improves Soybean Cultivation. Front. Plant Sci. 2022, 13, 861574. [Google Scholar] [CrossRef]
  32. Vogel, C.; Rivard, C.; Wilken, V.; Muskolus, A.; Adam, C. Performance of Secondary P-Fertilizers in Pot Experiments Analyzed by Phosphorus X-Ray Absorption near-Edge Structure (XANES) Spectroscopy. Ambio 2018, 47, 62–72. [Google Scholar] [CrossRef] [PubMed]
  33. Gad, S.E.; Barbare, R. Phosphoric Acid. In Encyclopedia of Toxicology; Elsevier: Amsterdam, The Netherlands, 2005; pp. 414–415. ISBN 978-0-12-369400-3. [Google Scholar]
  34. Kraus, F.; Zamzow, M.; Conzelmann, L.; Remy, C.; Kleyböcker, A.; Seis, W.; Miehe, U.; Hermann, L.; Hermann, R.; Kabbe, C. Ökobilanzieller Vergleich Der P-Rückgewinnung Aus Dem Abwasserstrom Mit Der Düngemittelproduktion Aus Rohphosphaten Unter Einbeziehung von Umweltfolgeschäden Und Deren Vermeidung; UBA-FB; Umweltbundesamt: Dessau-Rosslau, Germany, 2019; Volume 13. [Google Scholar]
  35. YARA Fertilizer Industry Handbook. 2022. Available online: https://www.yara.com/siteassets/investors/057-reports-and-presentations/other/2022/fertilizer-industry-handbook-2022-with-notes.pdf/ (accessed on 2 March 2023).
  36. White, P.J.; Brown, P.H. Plant Nutrition for Sustainable Development and Global Health. Ann. Bot. 2010, 105, 1073–1080. [Google Scholar] [CrossRef] [PubMed]
  37. Samsuri, S.; Amran, N.A.; Jusoh, M. Optimization of progressive freeze concentration on apple juice via response surface methodology. In IOP Conference Series: Materials Science and Engineering; IOP Publishing: Bristol, UK, 2018; Volume 358, p. 012042. [Google Scholar] [CrossRef]
  38. WTW. Manometric BOD Measuring Devices OxiTop IS 6 & IS 12—Instruction Manual; ba31107de05; WTW: Weilheim, Germany, 2017. [Google Scholar]
  39. Miller, F.M.; Young, G.L.; von Seebach, M. Formation and Techniques for Control of Sulfur Dioxide and Other Sulfur Compounds in Portland Cement Kiln Systems; R&D Serial No. 2460; Portland Cement Association: Skokie, IL, USA, 2002. [Google Scholar]
  40. Raj, A.; Ibrahim, S.; Jagannath, A. Combustion Kinetics of H2S and Other Sulfurous Species with Relevance to Industrial Processes. Prog. Energy Combust. Sci. 2020, 80, 100848. [Google Scholar] [CrossRef]
  41. Swiss Water Association. Infoblatt—Verfügbarkeit von Fällmitteln für ARA in der Schweiz, Herbst 2022; Verband Schweizer Abwasser- und Gewässerschutzfachleute: Glattbrugg, Switzerland, 2022. [Google Scholar]
  42. Chung, J.W.; Gerner, G.; Ovsyannikova, E.; Treichler, A.; Baier, U.; Libra, J.; Krebs, R. Hydrothermal Carbonization as an Alternative Sanitation Technology: Process Optimization and Development of Low-Cost Reactor. Open Res. Eur. 2022, 1, 139. [Google Scholar] [CrossRef]
  43. Kaiser, D.E.; Pagliari, P. Understanding Phosphorus Fertilizers. Available online: https://extension.umn.edu/phosphorus-and-potassium/understanding-phosphorus-fertilizers (accessed on 12 October 2022).
  44. Ion Exchange Ltd. Indion 225 Na F—Bulletin R047. Available online: https://ionresins.com/pdf/pds/225_Na_F_WQA_PDS.pdf (accessed on 20 August 2021).
  45. Swiss Federal Council. Chemical Risk Reduction Ordinance 2005; Swiss Federal Council: Bern, Switzerland, 2005. [Google Scholar]
Figure 1. Flow chart of experimental setup. (P = phosphorus, N = nitrogen, DSS = digested sewage sludge, HTC = hydrothermal carbonization, VF = vacuum filtration, PW = process water).
Energies 16 07027 g001
Figure 2. Freeze concentration of process water. (A) filled bottle with a depth-to-diameter ratio of 2 and free head space (a = bottle diameter); (B) experimental setup for melt recovery; and (C) dark organic layer on top of ice block (bottle shown from preliminary experiment).
Energies 16 07027 g002
Figure 3. Chemical composition of phosphatic acid extract. (Error bars show standard deviation of n = 3).
Energies 16 07027 g003
Figure 4. Percentage of elements that passed through the ion-exchange resin at three different concentration levels. (Error bars show standard deviation of n = 3).
Energies 16 07027 g004
Figure 5. TOC measurements of individual freeze concentration melt fractions. (Error bars show standard deviation of n = 3).
Energies 16 07027 g005
Figure 6. TN measurements of individual freeze concentration melt fractions. (Error bars show standard deviation of n = 3).
Energies 16 07027 g006
Figure 7. X-ray diffraction (XRD) analysis pattern of crystal struvite product from the 1:50 dilution batches (black line) compared to reference from the ICDD database (red bars).
Energies 16 07027 g007
Table 1. Ultimate analyses of the sewage sludge (DSS) and hydrochar (HTC-HC). Oxygen was calculated based on difference (diff).
CHNSOdiffAshH/CO/CHHVLHV
[wt.%][wt.%][wt.%][wt.%][wt.%][wt.%] [MJ kg−1][MJ kg−1]
DSS30.44.34.21.417.542.21.70.4--
HTC-HC27.33.73.09.811.344.91.60.312.111.2
HHV: higher heating value; LHV: lower heating value.
Table 2. Nutrient content analysis of digested sewage sludge (DSS), hydrochar (HC), process water (PW) and phosphatic acid extract (PAE). Recovery rates in parentheses. (n = 3; 1 n = 2).
Nutrient Content and Recovery
PNKMgCa
[mg kg−1][mg kg−1][mg kg−1][mg kg−1][mg kg−1]
DSS33,613 (-)42,066 (-)1489 (-)3353 (-)33,064 (-)
HTC-HC17,798 (35.6)29,529 (47.1)1 1347 (60.7)1 2133 (42.7)1 45,856 (93.1)
[mg L−1][mg L−1][mg L−1][mg L−1][mg L−1]
HTC-PW17.9 (0.1)6797 (25.6)146 (15.5)64 (3.0)536 (2.6)
HTC-PAE12,681 (72.2)7030 (32.0)199 (25.6)931 (53.1)556 (3.2)
Table 3. Precipitant and heavy metal content analysis of DSS, hydrochar (HC), process water (PW) and phosphatic acid extract (PAE). (n = 3; 1 n = 2).
PrecipitantsHeavy Metal Content
Fe
[mg kg−1]
Al
[mg kg−1]
Ni
[mg kg−1]
Cu
[mg kg−1]
Zn
[mg kg−1]
Cd
[mg kg−1]
Pb
[mg kg−1]
DSS74,09153,44618242583<115
HTC-HC49,86332,6491 23360783<123
[mg L−1][mg L−1][mg L−1][mg L−1][mg L−1][mg L−1][mg L−1]
HTC-PW36716<0.1<0.1<0.1<0.1<0.1
HTC-PAE22,97018,1501.8<0.135.2<0.1<0.1
Table 4. Characterization of PW, partition of concentrate and depleted PW (ice water). Average values are reported ± standard deviation and total mass fraction in parentheses (n = 3). (tot = total, dis = dissolved, after filtration).
ParameterUnitPWConcentrateIce Water
CODtotmg/L56,300.0102,666.7±2886.8(91.3%)10,793.3±864.9(9.6%)
TOC (NPOC)mgC/L20,856.737,503.3±811.9(90.0%)3768.0±449.0(9.0%)
DOCmgC/L20,826.737,710.0±746.5(90.6%)3796.0±398.3(9.1%)
TNtotmgN/L6797.312,646.7±222.8(93.1%)1262.0±89.6(9.3%)
TNdismgN/L6773.012,530.0±337.8(92.6%)1263.7±90.6(9.3%)
AmmoniummgN/L3070.05533.3±111.5(90.2%)562.7±61.2(9.2%)
NitritemgN/L1.52.9±0.03(98.2%)0.2±0.0(6.2%)
NitratemgN/L193.0346.3±3.1(89.8%)36.7±3.5(9.5%)
PhosphatetotmgP/L15.929.2±0.8(91.8%)BLD-
Phenoltotmg/L688.01353.3±87.4(98.5%)107.7±23.8(7.8%)
pH-7.597.96±0.06 7.77±0.02
ECmS/cm17.026.7±0.1 3.9±0.4
Table 5. Comparison of MinRec threshold values and struvite metal content. V, Cr, As and Hg levels were not measured. (BLD = bellow limit of detection; detection limit = ≤20.4 mg/kg P).
Inorganic ContaminantMineral Recycling FertilizerStruvite Precipitate
Threshold Value in Grams Per
Metric Ton Phosphorus
Value in Grams Per Metric Ton Phosphorus
Nickel (Ni)500BLD
Copper (Cu)3000BLD
Zinc (Zn)10,000BLD
Cadmium (Cd)25BLD
Lead (Pb)500BLD
Table 6. Contents of macro nutrients in struvite.
Nutrient Value in Kilogram Per Metric Ton
(%)
Phosphorus (P)137.1 (13.7)
Phosphorus converted to phosphorus pentoxide (P2O5)314.0 (31.4)
Nitrogen (Ncal.) 57.1 (5.7)
Potassium (K)<1.4 (<0.14)
Calcium (Ca)5.0 (0.5)
Magnesium (Mg)95.9 (9.5)
Aluminum (Al) 1.5 (0.15)
Iron (Fe)17.9 (1.8)
Nitrogen content calculated based on the elemental ratio of pure struvite.
Disclaimer/Publisher’s Note: The statements, opinions and data contained in all publications are solely those of the individual author(s) and contributor(s) and not of MDPI and/or the editor(s). MDPI and/or the editor(s) disclaim responsibility for any injury to people or property resulting from any ideas, methods, instructions or products referred to in the content.

