3.3.3. Flow Analysis
The flow distribution for the J-shaped-based VAWT at
using the
SST turbulence model is studied.
Figure 7 shows the turbulent intensity field in the
plane for different azimuthal angles during one ‘converged’ revolution of the VAWT.
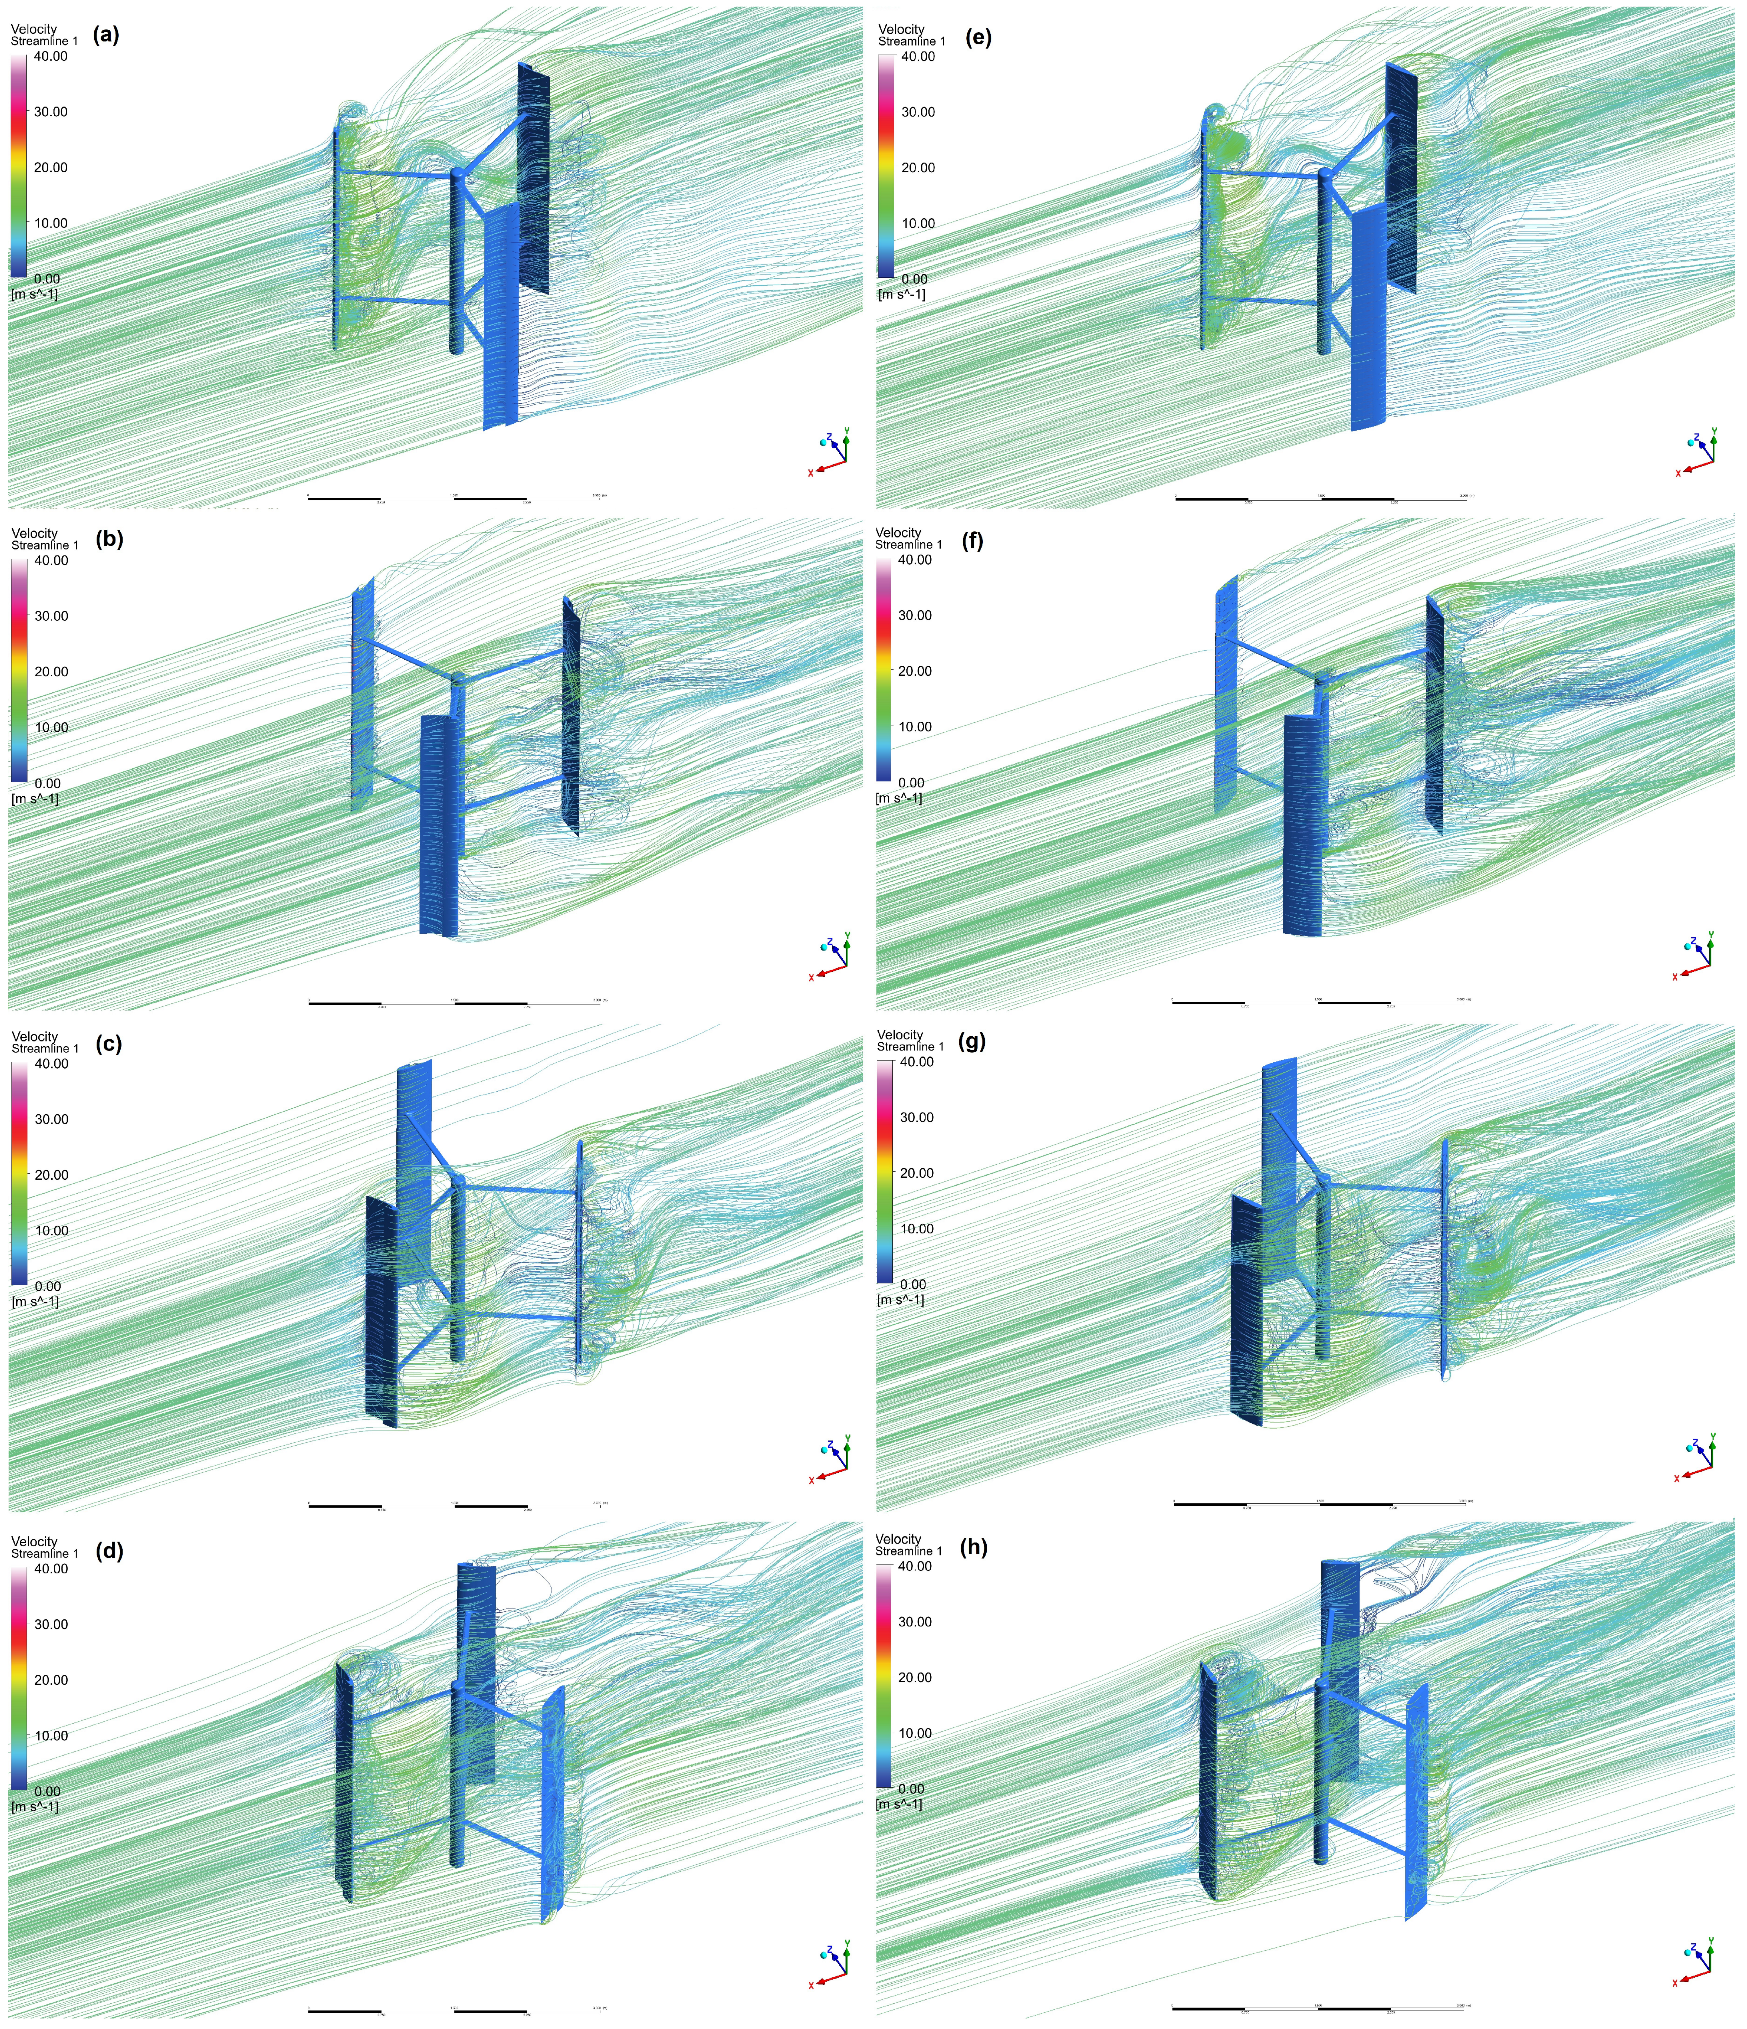
Figure 8 presents the same flow behaviour but in its 3D form, showing the velocity magnitude field and pathlines. The effect of the airfoil dynamic stall is clearly noticeable in regions where the turbulent intensity levels are high in
Figure 7. Tip vortices generated as a consequence of the 3D design are also visible.
Figure 9 shows the evolution of the moment coefficient over one revolution for the J-shaped and NACA 0015 cases at
, with both the
and
SST turbulence models. As can be seen, small differences are present. With both turbulence models, the NACA 0015 profile shows higher and lower peak values of the moment coefficient compared to the J-shape profile. It can also be seen that the curve of the moment coefficient for the J-shape displays a higher number of relative peaks.
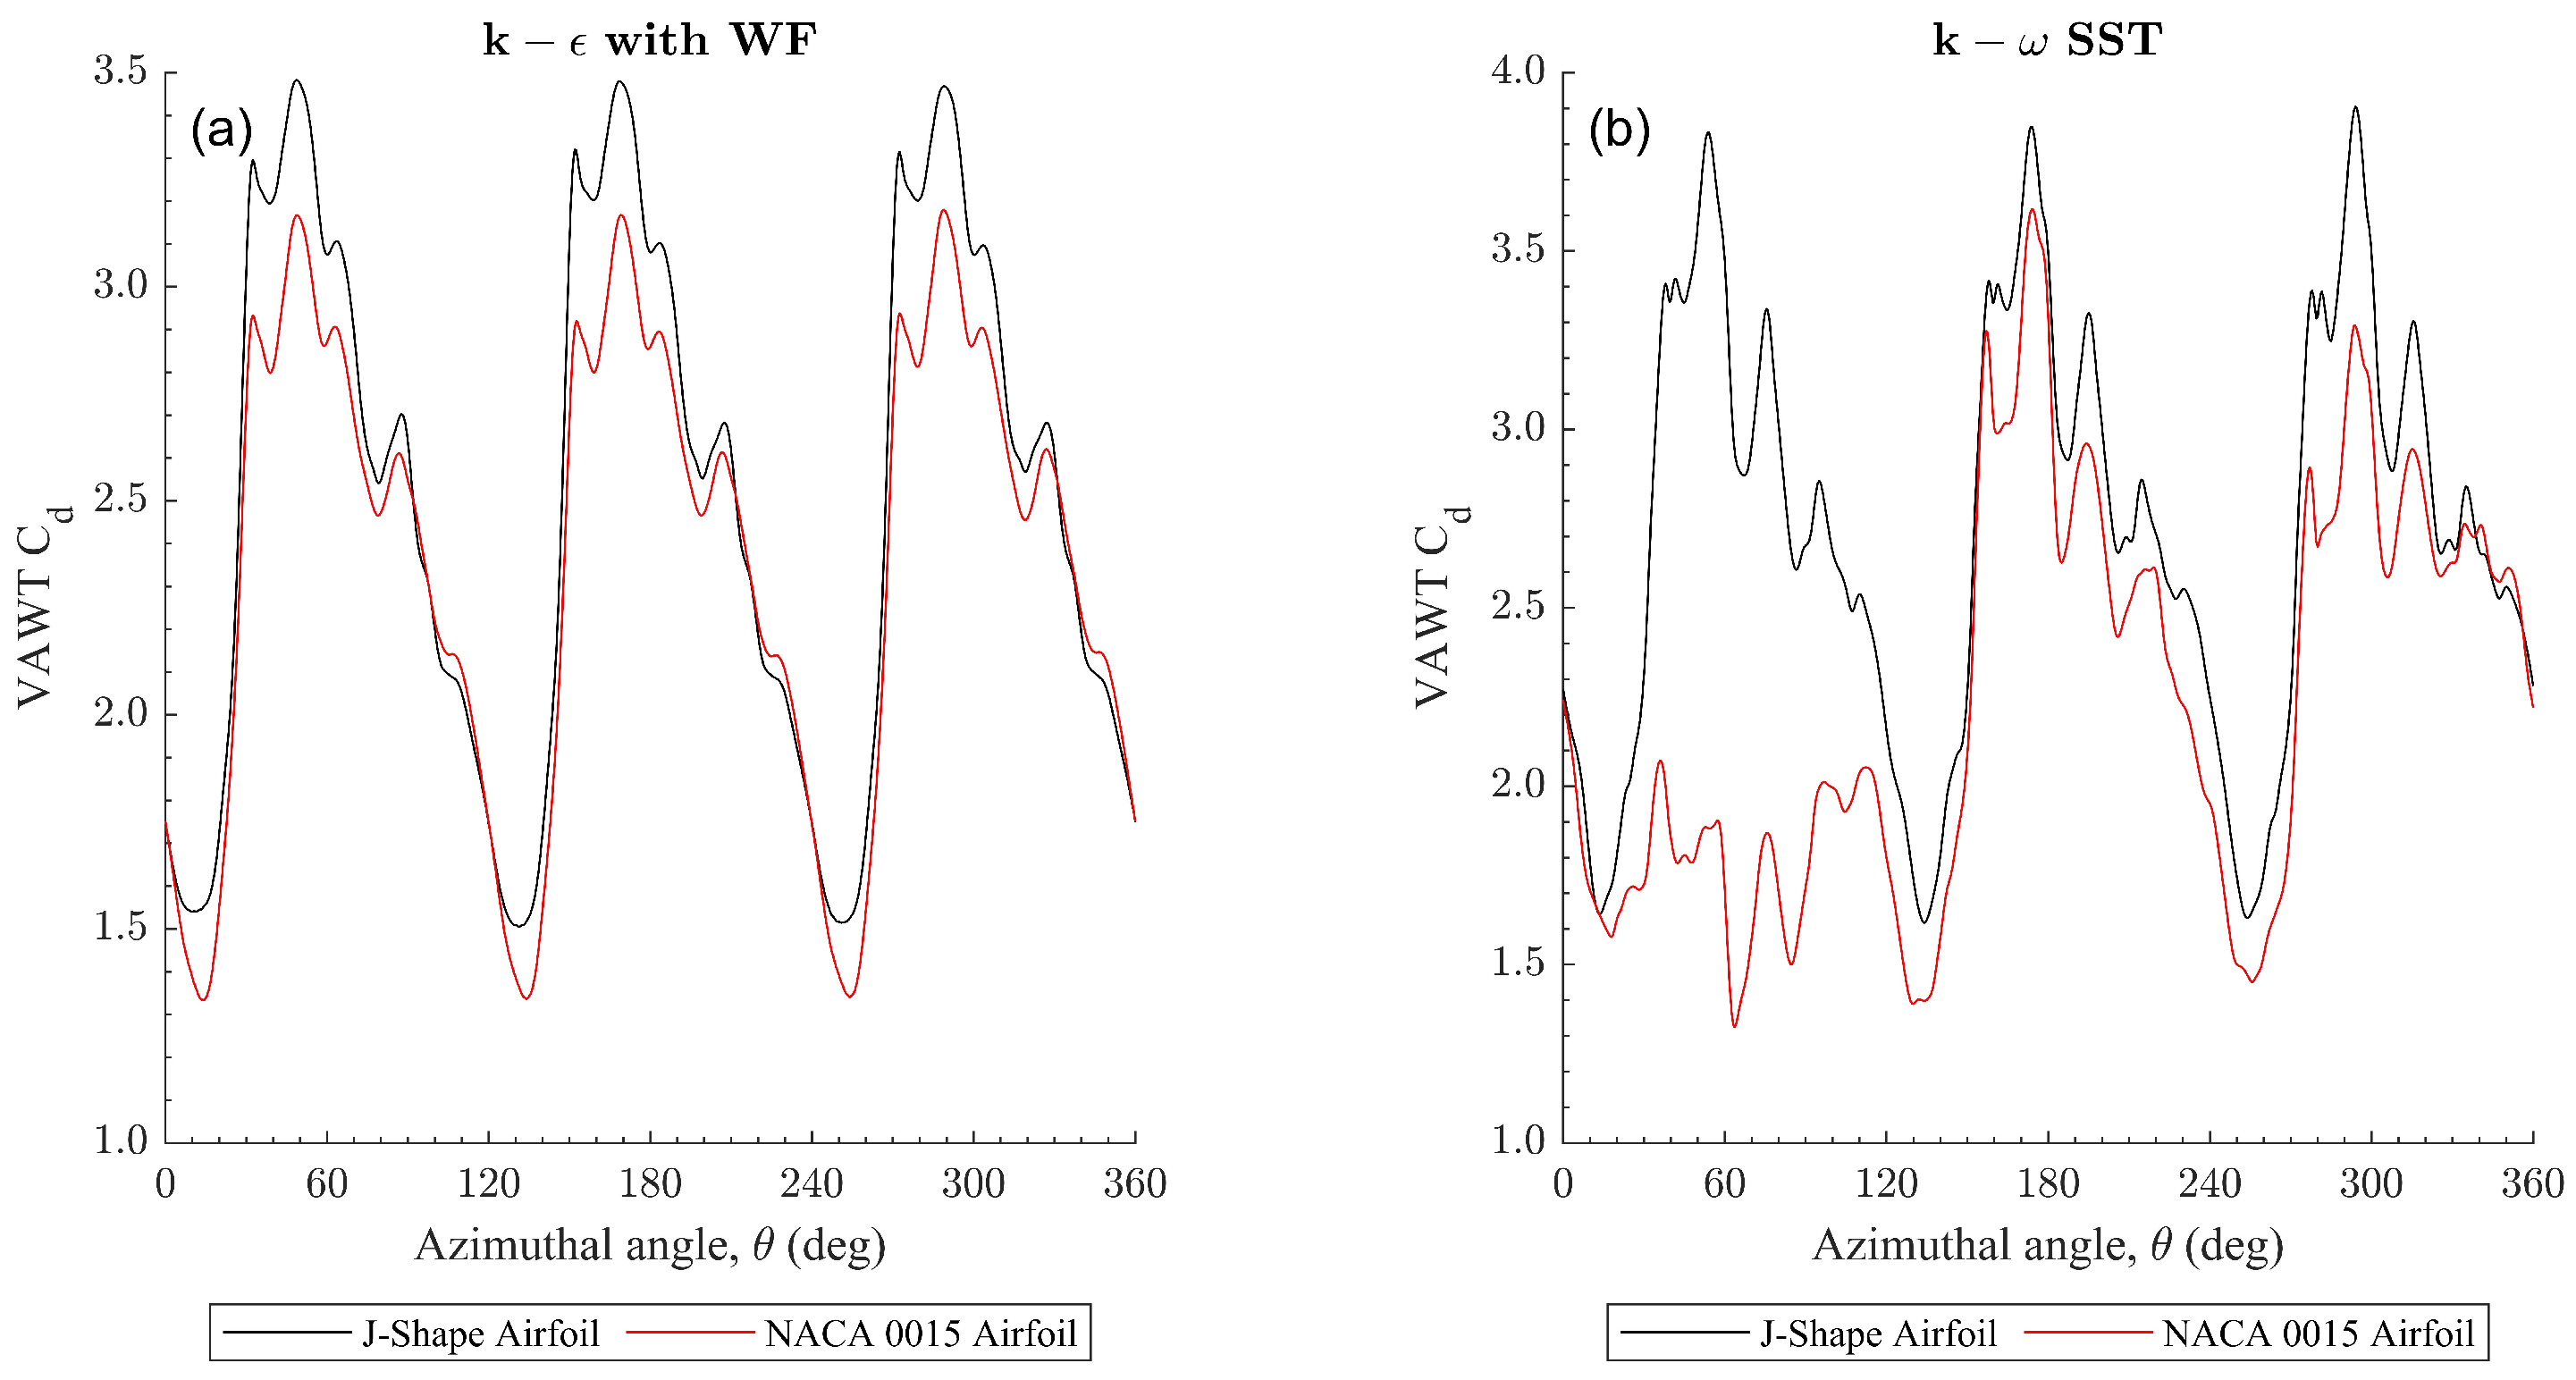
To understand better the difference in the performance of the J-shaped and NACA 0015-based VAWTs, the drags for both airfoil-based VAWTs are plotted in
Figure 10. It can be seen that the J-shaped-based VAWT displays a higher drag coefficient for
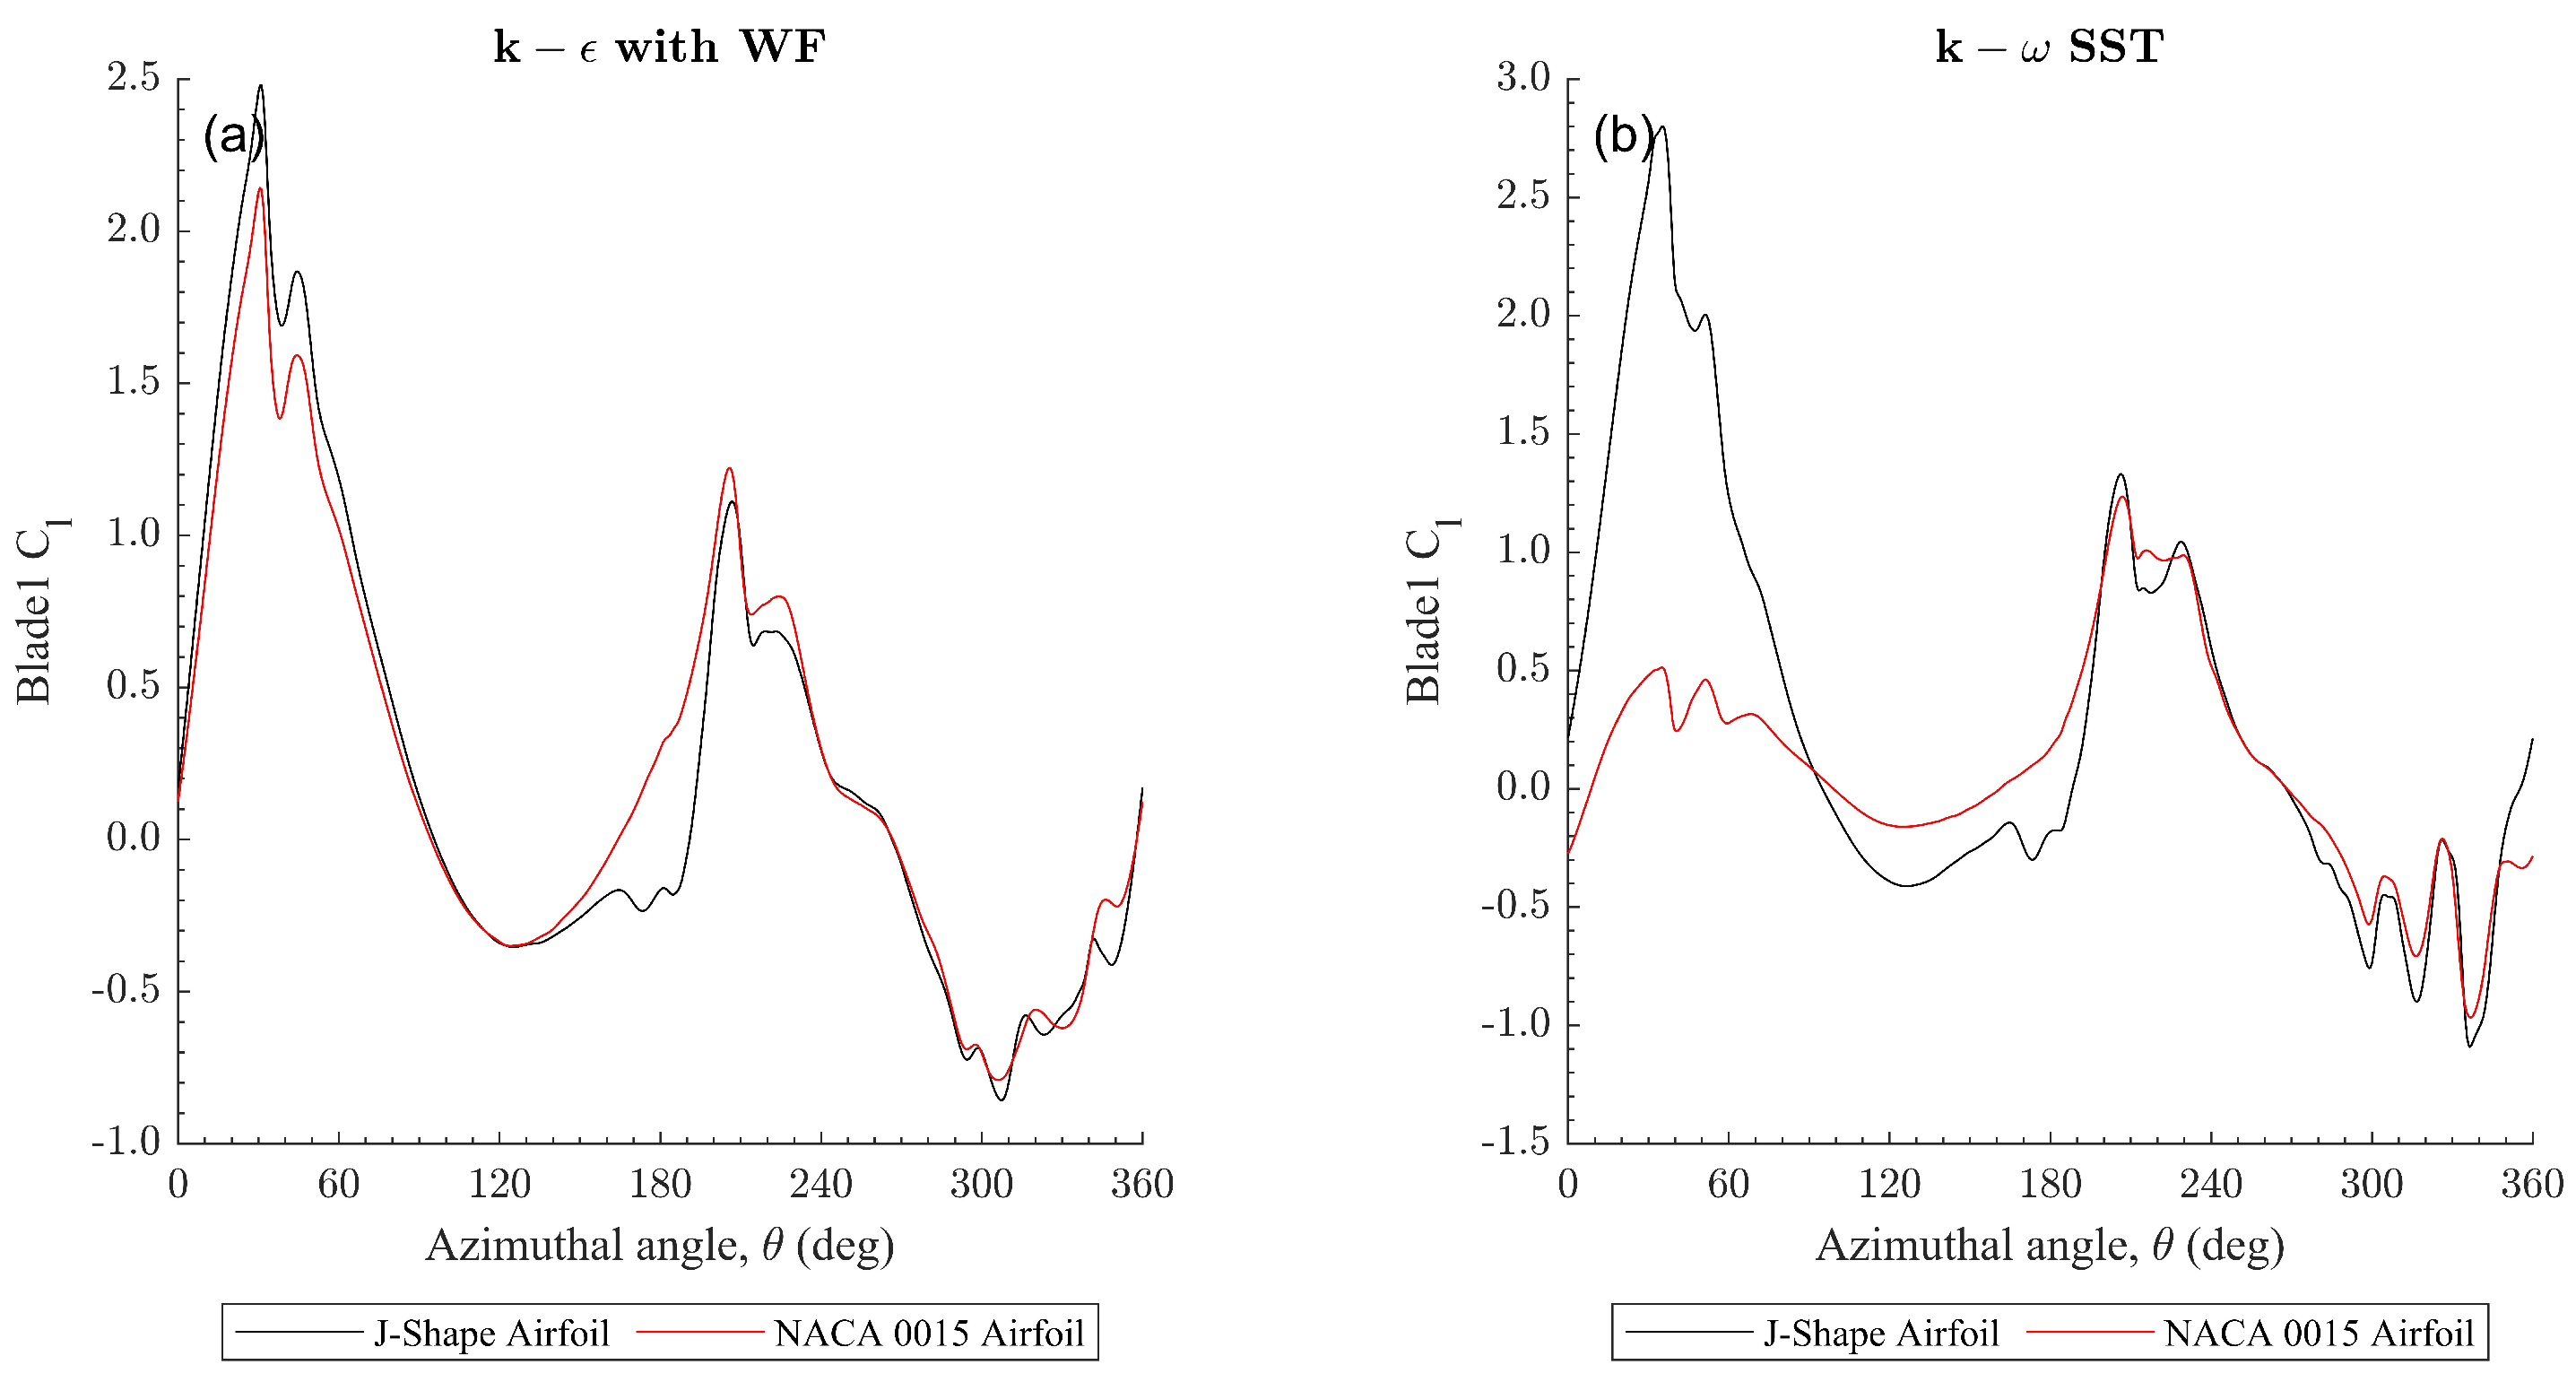
. Similarly, the lift coefficients produced by one blade during one revolution with both turbulence models are plotted in
Figure 11.
To identify more clearly which airfoil provides the best starting torque, the average values of the moment coefficient in one revolution were calculated for both airfoils and turbulence models; see
Table 9. A comparison between all cases is also provided, through the difference in percentage between the values of the 3D NACA 0015 and the
model as a reference. The result obtained with the
turbulence model shows that the starting torque of the VAWT improves by 5.84% with the J-shaped profile compared to NACA 0015. This difference is significantly higher when the
SST model is used as a reference, showing an 18.34% increase with the J-shaped profile. These results will be discussed further in
Section 3.3.4.
The 2D outputs obtained by García Auyanet et al. [
8] and the current 3D results can now be compared. The two main geometrical difference between the current and previously published studies is the 3D nature of the geometry not accounted for in [
8] and the fact that the struts and hub were not considered either in the original study. The mean moment coefficient during an entire revolution of the VAWT is shown for both the 2D and 3D J-shaped cases in
Table 10. The mean moment coefficient appears lower for the 3D case than for the 2D case. This is discussed in more detail in
Section 3.3.4.
3.3.4. Discussion
An aerodynamic and performance study was carried out to identify which airfoil offered optimum self-start capabilities. For both the J-shaped and NACA 0015 cases, under starting torque conditions, the angular velocity is so low that the case is nearly static, with the relative velocity of the profile itself being of similar value and direction as the speed imposed at the inlet. Therefore, during the rotation, there are regions where the airfoil angle of attack in absolute value is elevated, reaching dynamic stall ranges (see
Figure 7), implying a high loss of lift and a high drag in comparison to cases with greater
. Under these conditions, as this VAWT is of the lift type, it has a lower moment to enable VAWT rotation. Due to the stall of the airfoil itself, a large wake is generated. This wake length and the airfoil’s dynamic stall are important to consider if a small wind farm of VAWTs is to be placed in an urban area, as it leads to a significant turbulent intensity, being in certain areas higher than 40%, as illustrated in
Figure 7. This can also cause fatigue problems in the connection region between the struts and the blade, but also in the struts, as reported by [
28,
29]. At a structural level, this means that these regions need to be strengthened, and a structural fatigue analysis should be performed, in addition to experimental tests.
An important point highlighted in the CFD study is the design of the strut. As can be seen in
Figure 7, the presence of a strut generates very little or no wake at all under the conditions of study, thus minimising the turning resistance and reducing possible effects due to turbulence, including noise.
In terms of flow behaviour, no major difference is seen between the J-shape and NACA 0015 cases (see
Figure 7 and
Figure 8). Both the turbulence intensity levels and the magnitude and direction of the wind speed are nearly identical throughout the revolution of the VAWT. The only difference is found, logically, around the airfoil geometry. In
Figure 8, the formation of a vortex can be seen in the bitten region of the J-shaped airfoil, where the low velocity leads to high static pressure on this surface. Such pressure is responsible for an additional drag force, pushing the VAWT tangentially to its trajectory in certain azimuthal regions. Consequently, the drag of this profile is higher, as demonstrated in
Figure 10, acting more like a Savonius VAWT compared to the NACA 0015 profile.
Theoretically, the moment causing a VAWT’s rotation is mainly a consequence of the generated lift, as per its design (H-type). The maximum moment occurs as many times as the number of blades in the model, on a periodic basis, and under the azimuthal angle where the generated lift is maximum (due to the angle of attack between the airfoil and the relative wind velocity direction). At low , this is not noticeable, however, as several peaks are present. This is due to the high azimuthal range where the dynamic stall of the airfoil is produced, as the relative wind velocity direction and magnitude are almost constant and equal to the velocity inlet conditions. The generated lift is also reduced, increasing the drag, which is the main aerodynamic moment generator.
Figure 9 does not show clearly which airfoil provides higher performance. In
Figure 10, it can be seen that the J-shaped-based VAWT displays a higher drag coefficient at
. The most remarkable fact is the comparison of the orders of magnitude between
and
in
Figure 10 and
Figure 11, respectively. In both cases, the magnitude of the drag coefficient is higher, although of a similar order, which is uncommon in lift-based VAWTs, where
is usually one order of magnitude higher than
[
30]. This fact leads to a less harmonic (although periodic) result for the moment coefficient evolution (see
Figure 9). Therefore, it appears that under starting torque conditions, it is as important that the airfoil can generate a lift coefficient at high angles of attack (late stall in the late windward region, 0
<
< 45
) as it is to generate sufficiently high drag in the upwind region (45
<
< 135
).
From
Table 9, it appears that the 3D J-shape is able to provide a 5.84% higher moment coefficient than the 3D NACA 0015 when using the realizable
turbulence model with wall functions, which is 18.34% higher than when the
SST turbulence model is used, under the same conditions. In all cases, this result is promising, since it would improve the VAWT’s ability to self-start at low wind speeds, thus reducing the initial energy consumption to start its movement. Likewise, the power generated at low
conditions would also be higher, since the
is proportional to the calculated
, with
. As discussed in
Section 1, the most commonly used turbulence model in CFD simulations of VAWTs is the
SST. This is due to the better representation of this model in complex boundary layer flows under adverse pressure gradients and separation, as in VAWT cases, obtaining results more similar to the experimental ones [
22]. The results obtained with this turbulence model are therefore a priori more reliable, pending experimental validation.
In the 2D case developed in [
8], the authors concluded that the same J-shape profile improved the self-starting ability by 135% compared to the NACA 0015 profile. However, the present study demonstrated that this improvement is reduced to 18.34% when 3D cases are considered, resulting in a performance reduction between the 2D and 3D J-shaped VAWT of 38.94%. This difference may be due to two main factors: the three-dimensional effects caused by the tip vortices and/or the inclusion of the struts and hub in the current 3D model. In this study, it was found that, on average, the starting torque of the developed 3D design was 48.15% lower than in the 2D study performed by [
8]. According to [
31], in an H-type Darrieus small vertical wind turbine operating at
, the difference in the power coefficients of the simulated 2D and 3D cases is 21.4%, without the consideration of the struts. However, to study the specific influence on the VAWT performance loss due to tip vortices, a CFD study should be performed, considering only the 3D blades, studying the addition of end plates to avoid the flow moving from high to low pressure in the tips and to create such vortices. This will be considered in future work.
