Abstract
This study presents a new methodology for graphene oxide (GO) synthesis through electrochemical exfoliation of graphite, followed by phthalic anhydride functionalization (PhA-GO) and doping with Cu and Ag ions. The synthesis of GO involved the use of an electrochemical cell with HSO as the electrolyte, with a gradual increase in potential from 2.3 V to 10 V. Extensive characterization techniques confirmed the successful incorporation of oxygen-containing functional groups, verifying the oxidation of graphite. PhA-GO functionalization was confirmed by thermogravimetric analysis, Differential Scanning Calorimetry, Fourier-transform infrared spectroscopy (FTIR), UV-Vis spectroscopy, X-ray diffraction, scanning electron microscopy (SEM), and energy-dispersive spectroscopy (EDX), which confirmed the presence of Cu and Ag ions. The Scherrer equation determined a grain size of 75.85 nm for GO. The electrical properties exhibited semiconductor and semimetal behavior, particularly in PhA-GO/Ag composites, making them suitable for electronic devices over a wide temperature range, presenting a promising pathway for advanced materials in electronic applications.
1. Introduction
Graphene, the first stable two-dimensional crystal to be isolated [1], possesses exceptional properties due to its long conjugated system, confining electrons in two dimensions. These properties include high electronic mobility, thermal conductivity, and mechanical resistance, like relativistic particles with zero mass [2,3]. The term “graphene” encompasses compounds ranging from a single monoatomic sheet to organized stacks of two, three, four, or even ten graphene sheets [4].
Graphene’s remarkable physicochemical, mechanical, thermal, electrical, and optical properties render it applicable in diverse fields [5,6]. Its electrical and optical characteristics make it suitable for optoelectronic devices, electronics, solar cells, and batteries. Particularly in rechargeable batteries, graphene shows great promise as an electrode material for electrochemical capacitors (ECs). Beyond its diverse applications, another advantage of graphene lies in its raw material, graphite, which is abundant and cost-effective [7,8].
The current research on obtaining graphene involves extensive procedures, with a prominent method being the graphite exfoliation process [9]. Graphite exfoliation can be achieved either chemically or electrochemically [10]. The chemical approach is the most widely used to disperse graphene from graphite, but it is environmentally complex and involves three steps [11]. Initially, graphite undergoes chemical oxidation using oxidizing agents (KMnO and KClO) and intercalating agents (HSO, HNO and HPO). This step introduces oxygen functional groups (alcohols, epoxy, ketone, and carboxylic acid) into the hexagonal network structure of graphite. In the second step, graphite oxide is exfoliated into graphene oxide (GO) by increasing the pressure between two-dimensional graphene sheets. Finally, in the third step, GO is thermally or chemically reduced to form graphene (r-GO) [12,13]. On the other hand, the electrochemical route simplifies the process, combining the intercalation and oxidation of graphite and final exfoliation to obtain GO in a single step, with the second step involving the final reduction of GO to r-GO [14,15,16].
Electrochemical exfoliation of graphite can be achieved using either the anodic (positive potential) or cathodic (negative potential) method. During anodic exfoliation, anions from the electrolyte and hydroxyl anions from water electrolysis reach the positive graphite electrode and act as intercalants. The diffusion of these intercalant anions through graphite aids in expanding the graphite layers and enables the attachment of hydroxyl groups to graphite. The stronger oxidant effect of oxygen produced during anodic water electrolysis further enhances the functionalization of graphite with epoxy, ketone, and carboxylic acid groups. Therefore, the electrochemical exfoliation occurs due to the simultaneous presence of intercalant anions, functional groups linked to the basal graphite plane, and the force generated by gases released during the water electrolysis process [17].
The GO obtained through electrochemical exfoliation exhibits a low concentration of oxygen functional groups attached to the basal graphite plane. This hinders the separation between graphene sheets, thereby challenging the electrochemical exfoliation of graphite. Additionally, the lower oxidation degree decreases the hydrophilic nature of GO, consequently reducing its solubility in water and organic solvents. Therefore, employing a higher concentration of acid electrolyte and a high current density is crucial for achieving successful electrochemical exfoliation of graphite [18].
Graphene oxide demonstrates improved properties and applications in its reduced form (r-GO), exhibiting a high theoretical specific surface area and electronic conductivity. These properties are of utmost importance for utilizing graphene as an electrode material in the fabrication of electrochemical capacitors (ECs) for rechargeable batteries [19].
However, r-GO tends to exhibit a higher tendency to stack due to Van der Waals interactions between GO sheets. This stacking impedes the effective utilization of graphene as a capacitive electrode. To address this issue, several strategies are being explored, such as incorporating spacers between the sheets using carbon materials, employing intercalated molecules (functionalized or not), creating crumpled GO paper balls from flat GO sheets, and introducing pores in graphene sheets [19].
In this study, we have opted to functionalize graphene oxide to achieve a high specific surface area and electronic conductivity. For this purpose, we have chosen phthalic anhydride (PhA) as a functionalized intercalated molecule. The condensation reaction takes place between the anhydride groups of PhA and the hydroxyl groups of GO sheets, effectively acting as a spacer between the graphene sheets. The free carboxylic group of PhA, linked to GO, actively participates in the formation of a complex with metal ions, leading to an increase in electronic conductivity [20]. Previous research has utilized p-phthalic acid as coverage on the graphite electrode to control the electrochemical exfoliation process’s speed and prevent thus allowing considerable oxidation of graphite. Additionally, maleic anhydride (MA) has been employed as a modifier molecule of graphene through a condensation reaction between the anhydride group of MA and the hydroxyl groups of GO [21].
The concept of doped graphene refers to graphene linked to a heteroatom, such as oxygen (O), or other heteroatoms with a similar size and valence electron numbers as carbon, such as boron (B) and nitrogen (N) [22]. Doped graphene can also be formed through complexation reactions between functional groups of GO and transition metal ions. These materials are known as nanocomposites, where metal ions are anchored to GO sheets through the functional groups acting as ligands for the metal cations. Recent papers show that the interaction between the negative moieties of graphene oxide and Cu and Ag ions can be utilized to improve the electrical properties in the fabrication of electrochemical electrodes and fibrous strain sensors, respectively [22,23,24]. In our study, we have achieved doping of GO by complexing metal ions onto the GO surface [25]. The presence of the functionalized carboxylic acid group of PhA on GO has contributed to an increased level of doping.
In this context, we have introduced several key innovations in this work. Firstly, we have developed a straightforward approach to functionalize GO with phthalic anhydride (PhA), a critical step that effectively mitigates the stacking tendency of GO sheets. Additionally, we have skillfully orchestrated the coordination of Cu and Ag ions, forming charge transfer complexes between these metallic ions and the carboxylic acid groups of PhA located on the GO surface. This pioneering methodology not only lays the foundation for the creation of electrode materials but also holds significant promise for their application in electrochemical capacitors (ECs) designed for rechargeable batteries. Furthermore, this study encompasses a comprehensive presentation of physicochemical characterization results for the materials obtained, alongside a thorough investigation of their electrical behavior across varying temperature ranges.
2. Materials and Methods
Commercial graphite Faber-Castell 2.0 mm HB OF/9020HB, sulfuric acid (HSO) 95–97%, silver nitrate (AgNO) 99.0%, and copper (II) sulfate pentahydrate (CuSO·5HO) of ≥98.0% purity was purchased from Sigma-Aldrich (São Paulo, Brazil). Phthalic anhydride, ethyl alcohol anhydrous, ≥99.5%, N, N, dimethylformamide and benzene, were all from Sigma Aldrich.
Electrochemical exfoliation was performed using an electrolysis cell, following established methods [9,26,27,28]. The cell consisted of two electrodes, a commercial pure graphite anode, and a silver cathode plate (10 × 20 mm). The electrodes were immersed in a 0.1 M sulfuric acid electrolyte solution. Exfoliation was achieved by applying a direct current voltage of +2.3 V for 5 min, using a Power Supply Mod. FA-3005 1-channel digital, with a voltage capacity of up to 32 V and a current capacity of up to 5 A (Instrutherm brand). The voltage was then gradually increased to +3 V for 5 min and further increased up to +10 V, with 5 min at each voltage level. After the gradual exfoliation of graphite, the collected graphene foam was thoroughly washed with distilled water and filtered under vacuum at room temperature (25 C). The foam was subsequently dried in an oven of forced air circulation at 60 C for 24 h (Venticell brand).
The chemical functionalization of GO with phthalic anhydride (PhA-GO) was carried out by adding GO, phthalic anhydride, and benzene in a round bottom flask with a reflux condenser at a weight ratio of 1:2:9. A 2% wt/wt phosphoric acid catalyst (based on the weight of PhA) was added, along with glass beads. The system was refluxed at 100 C for 3 h. After this period, the mixture was allowed to decant, to remove the benzene phase. Next, ethyl alcohol (in a weight proportion of 10:1 with respect to GO) was added to remove any remaining benzene, phosphoric acid, and phthalic anhydride that did not functionalize the GO. The ethyl alcohol dispersion was then magnetically stirred at 450 rpm for 1 h, followed by filtration to recover the pure PhA-GO. The PhA-GO was dried in an oven at 80 C for 24 h.
To dope PhA-GO with Cu and Ag, 0.20 g of dry PhA-GO was weighed and added to separate aqueous solutions of 1 M CuSO and 1 M AgNO, respectively. The PhA-GO dispersions in the metal solutions were subjected to ultrasound bath treatment (42 kHz) for 24 h at room temperature (25 C). The organometallic GO was then vacuum filtered, thoroughly washed with distilled water, and dried at 60 C for 24 h.
Thermogravimetric analysis (TGA) was employed to characterize the thermal behavior of GO by assessing its main thermal degradation temperatures and corresponding mass losses. The analysis was conducted using Shimadzu TGA-50 equipment (Carlsbad, CA, USA). Each sample weighed approximately 5 mg and was subjected to a temperature range of 25–1000 C at a heating rate of 10 C/min, under a nitrogen atmosphere with a flow rate of 30 mL/min.
Differential Scanning Calorimetry (DSC) was performed to evaluate the oxidation behavior and thermal stability of the GO sample. The DSC analysis was conducted using a Shimadzu Calorimeter, model DSC 60 Plus, with a hermetically sealed aluminum crucible. Approximately 4 mg of GO sample was heated from 25 C to 150 C, then cooled back to 25 C, and further heated to 300 C at a heating rate of 20 C/min, under a nitrogen atmosphere with a flow rate of 25 mL/min.
The functionalization of GO with PhA was characterized using Fourier Transform Infrared Spectroscopy (FTIR). FTIR analyses were performed with a Shimadzu spectrometer, model IR Tracer 100, in the region of 600–4000 cm and with a resolution of 4 cm. The samples were mixed with carefully dried potassium bromide (KBr) in a 1:100 ratio, ground in an agate mortar, and compressed to form KBr pellets. The spectra were obtained at room temperature (25 C).
To characterize the absorption spectrum of GO in the UV-Vis region, two dispersions of GO were analyzed. One dispersion of GO was dissolved in an aqueous medium, while the other was dissolved in dimethylformamide (DMF). The concentrations of GO in the dispersions were 0.01 mg/mL in distilled water and 0.1 mg/mL in DMF. The UV-Vis spectrum of an aqueous solution of AgNO and CuSO·5HO salts and an aqueous dispersion of PhA-GO doped with Cu and Ag were comparatively studied. UV-Vis spectra of the solutions were obtained using a Varian spectrometer (Cary 50 Bio) in the wavelength range between 200 and 700 nm. A quartz cuvette with a width of 10 mm was used for the measurements.
The X-ray spectra of GO deposited on SiO from the DMF dispersion were obtained using a Rigaku Japan diffractometer, equipped with CuK radiation ( = 1.5406 Å) and a graphite monochromator. The diffractograms were collected in the 5.00 to 90.00 angle (2) range, with a step size of 0.02 and a sweep speed of 5.0 s/step. The grain size L was calculated using the Scherrer equation [29,30].
For electrical characterization, the samples were compressed into cylindrical shapes, with 13.0 mm in diameter and 1.0 mm in thickness. The study of electrical resistivity as a function of temperature was conducted in a cryostat (Oxford brand), which uses a flow of helium to lower the temperature, while a temperature sensor records the sample’s temperature. Electrical resistance measurements were recorded using a current source (Keithley brand-Model 2612). To perform the measurements, the samples were securely attached to the cryostat’s contacts (gold wires) using conductive glue (composed of a polymeric base and graphite). The electrical resistance measurements were conducted over a temperature range from 310 K to 10 K, with a cooling rate of 1 K/min.
To analyze the morphology of GO and PhA-GO doped with Cu and Ag, scanning electron microscopy (SEM) was employed using a Superscan SSX-550 SEM-EDX equipment (Superscan SSX-550 SEM-EDX, Shimadzu (New Castle, DE, USA). An electron beam of 15 kV was used, and the equipment was coupled to an energy-dispersive spectroscopy (EDX) analyzer. The samples were analyzed in powder form, fixed to support using double-sided carbon tape, and were previously metalized with gold using an IC-50 ion coater equipment (Shimadzu).
3. Result and Discussion
Figure 1 illustrates the thermal analysis curves, including thermogravimetric (TGA) and differential thermogravimetric (DTG) analyses. The observed degradation profile closely resembles that reported in the literature for GO [31]. In the TGA curve (Figure 1), three distinct stages of mass loss with increasing temperature are evident. Notably, GO obtained by exfoliating graphite initiates degradation before reaching 100 C, which can be attributed to the removal of adsorbed water. The DTG curve exhibits two weight loss peaks in the second stage of degradation, with peak temperatures (Tm) around 196 C and 268 C. This double weight loss (17%) is ascribed to the loss of labile functional groups. Subsequently, the third weight loss (58.5%) occurs at Tm near 596 C and 747 C, involving the pyrolysis of unstable carbon linked to oxygen residues within the GO structure [32]. Studies of the thermal decomposition mechanism of GO indicate that functional groups (hydroxyl and carboxylic acid) are eliminated at lower temperatures, resulting in the release of H and HO. However, oxygen atoms from epoxy, carbonyl, or oxygen linked to hetero rings with carbon atoms, formed during the decomposition mechanism, persist in GO and are subsequently eliminated at higher temperatures in the form of CO and CO [33].
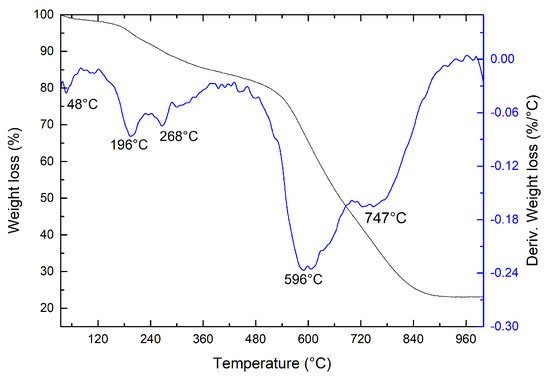
Figure 1.
Thermogravimetric analysis of GO. For this measurement, a heating rate of 10 C/min was used, the mass used = 5.2402 mg, and a nitrogen atmosphere was used.
The substantial presence of functional groups (hydroxyl, carboxylic acid, epoxy, and carbonyl) observed in the mass loss of the TGA curve provides evidence of a higher oxidation level in GO obtained via electrochemical exfoliation. This heightened oxidation level is crucial for the successful exfoliation of graphite into GO.
This result constitutes the first evidence of graphite exfoliation and successful GO production, as both graphite and graphite oxide exhibit significantly different thermal degradation profiles from those observed in Figure 1. Graphite remains thermally stable, not degrading within the studied temperature range, whereas graphite oxide demonstrates relative loss of labile oxygen from the different functional groups, thus maintaining thermal stability [34]. The analysis of the degradation stages of GO is summarized in Table 1.

Table 1.
Analysis of degradation stages of GO.
Figure 2 shows the DSC analysis curve for GO. The curve exhibits a prominent exothermic peak centered at approximately 196 C, with a heat release of 172.36 J/g. This peak corresponds to the degradation of GO, involving the loss of labile functional groups during the decomposition process at lower temperatures. As previously discussed, this event corresponds to the second stage of degradation observed in the TGA curve.
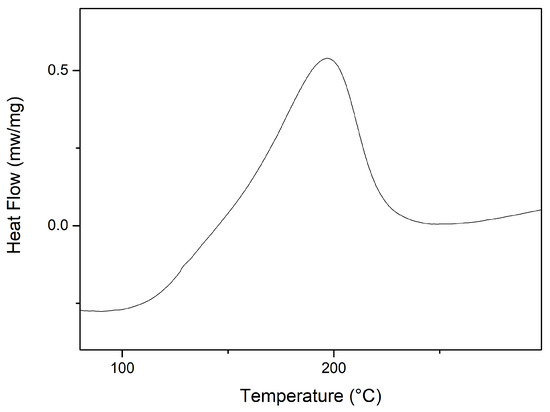
Figure 2.
Differential exploratory calorimetry analysis of GO.
Figure 3 displays the comparative FTIR spectrum of GO and functionalized GO with phthalic anhydride (PhA-GO). In the FTIR spectrum of GO, characteristic absorption bands are observed at 1018/806 cm, corresponding to the stretching vibration C-O-C of the epoxy ring. Another band at 1084 cm is related to the stretching vibration C-O. The bending vibration of the C-H bond is represented by the absorption band at 1398 cm. Additionally, the absorption band at 1647 cm corresponds to the C=C stretching vibration of the aromatic rings, while the band at 1741 cm is attributed to C=O stretching vibrations. The elongation vibrations of C-H bonds are observed at 2924 cm and 2853 cm. The broad band at 3450 cm represents the O-H stretch vibration [26,35]. The FTIR analysis of GO demonstrates the presence of various oxygen functional groups.
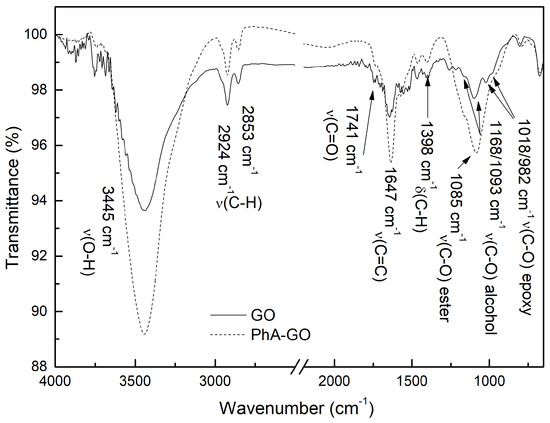
Figure 3.
FTIR comparison between GO and PhA-GO.
There are no significant differences observed between the FTIR spectra of GO and PhA-GO. The condensation reaction between the anhydride groups of PhA and hydroxyl groups of GO sheets (Figure 4) suggests a decrease in the concentration of hydroxyl groups. The area ratio between the -OH and C=C vibration bands was calculated using Origin software, resulting in values of 24.24 and 19.64 for GO and PhA-GO, respectively. This decrease in the area ratio between the OH band and the C=C vibrations band may indicate the functionalization of GO by PhA.
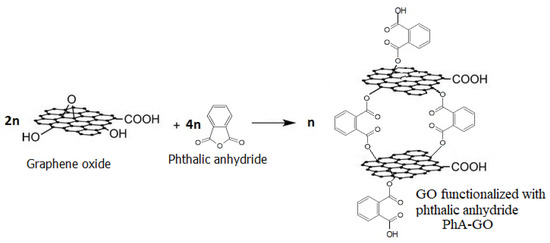
Figure 4.
Scheme of the condensation reaction between PhA and hydroxyl groups of GO sheets.
The results from UV-Vis spectroscopy (Figure 5) show the HOMO-LUMO electronic transitions relative to the absorption of the energy between molecular orbitals. Figure 5a presents a band with a maximum at 272 nm, which is characteristic of GO in DMF and is attributed to the electronic transition of the molecular orbitals → , present in the C=C aromatic group. Another band of lesser intensity appears as a shoulder at 350 nm, attributed to the electronic transition n → of the carbonyl group (C=O).
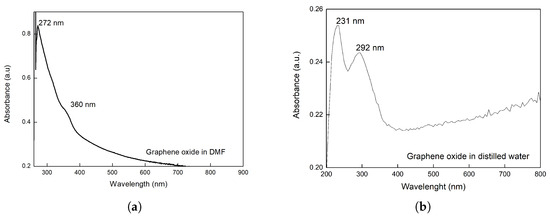
Figure 5.
UV-Vis of GO (a) dispersion in DMF, (b) dispersion in distilled water.
In Figure 5b, where GO was dispersed in distilled water, both characteristic bands of the electronic transition → of the C=C bond and n → of the C=O group are observed. These bands are observed at shorter wavelengths, specifically 231 nm and 292 nm, respectively [36]. The shift to shorter wavelengths is attributed to the greater interaction of the groups (C=C, C=O) with the more polar water, which stabilizes the lower energy orbital and consequently increases the energy of the electronic transition, leading to a decrease in wavelength [37].
The UV-Vis spectroscopy of aqueous dispersion of PhA-GO doped with Cu and Ag ions is shown in Figure 6. Figure 6a shows the shift of the maximum absorption wavelength, = 811 nm of CuSO·5HO, towards higher wavelengths in the Ph-GO/Cu complex, 845 nm. Red shifted off the absorption band of the d–d transition of Cu [38], which implies that the Ph-GO/Cu complex has lower d-orbital splitting energy than the aqueous Cu complex.
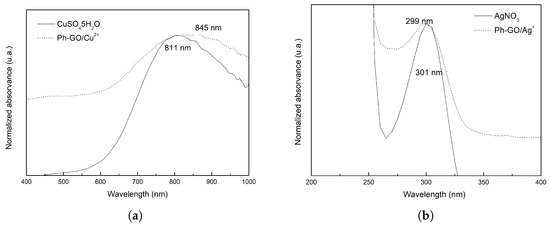
Figure 6.
UV-Vis of Ph-GO/Cu and CuSO·5HO (a); Ph-GO/Ag and AgNO (b).
The Figure 6b shows a negligible shift of maximum absorption wavelength, = 301 nm of AgNO to = 299 nm in the Ph-GO/Ag complex. This transition electronic is assigned to intraionic electronic transition of the Ag ion [39].
Figure 7 displays the XRD spectrum of GO obtained from the electrochemical exfoliation of graphite. The result reveals the presence of three forms of carbon: GO with higher and lower concentrations of functional groups and graphite. GO with a higher concentration of functional groups exhibits the [002] crystal plane at 9.1. On the other hand, GO with a lower concentration of functional groups shows a broad diffraction hump ranging from 15 to 30, centered at 24.5, indicating a smaller interlayer distance between graphene sheets [20]. By applying Bragg’s law, we determined that the interplanar spacing is 0.96 nm at 2 = 9.1, a value similar to that reported in the literature [40]. For GO with a lower concentration of functional groups, the XRD pattern centered at 24.5 has an interplanar spacing of 0.36 nm. Finally, graphite presents the [002] crystalline plane at 30, with an interplanar spacing of 0.29 nm. The intense peak of the graphite crystalline plane corresponds to the hexagonal arrangement and stacking of the highly oriented carbon atomic layers [41,42]. The grain size obtained by the Scherrer equation for GO with a higher concentration of functional groups was L = 75.85 nm.
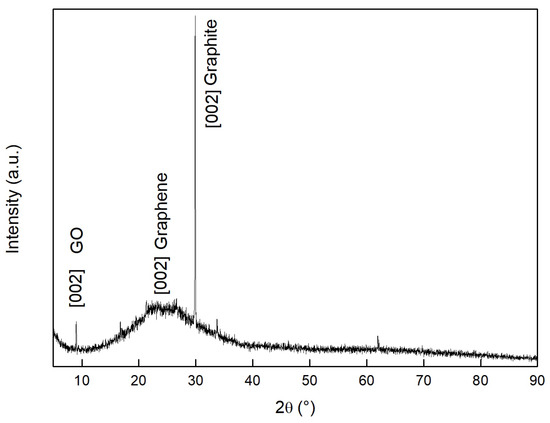
Figure 7.
XRD of GO measured at room temperature (25 C).
The increase in the interplanar spacing from graphite < GO with few functional groups < GO is explained by the introduction of oxygen-containing groups at the edge of each layer, causing their distance to be increased. GO with few functional groups still retains some oxygen functional groups in its structure, resulting in an intermediate interplanar distance [41,42].
Figure 8 presents SEM images at different magnifications of GO obtained by exfoliating graphite. In the micrograph of Figure 8a, with a magnification of 100 KX, GO appears in the form of aggregates of different dimensions. The morphology of these aggregates is defined in micrographs of Figure 8b,c, showing two different aggregates at 500 KX magnification. These aggregates consist of superimposed sheets or layers of GO without regular organization, exhibiting heterogeneous sizes. The micrograph of Figure 8d, at a greater magnification than Figure 8c, confirms that GO’s morphology is characterized by superimposed sheets or layers with heterogeneous sizes, oriented parallel to each other in both transverse and longitudinal directions. Based on the scale of the micrograph, it appears that the GO sheets have different sizes, but their thickness seems to be homogeneous, measuring approximately 200 nm. Similar morphology for GO has been reported in the literature [21,43]. In contrast, Figure 9 shows micrographs of graphite at the same magnification as the micrographs of the GO samples presented in Figure 8, allowing the visualization of the difference in morphology between graphite and GO.
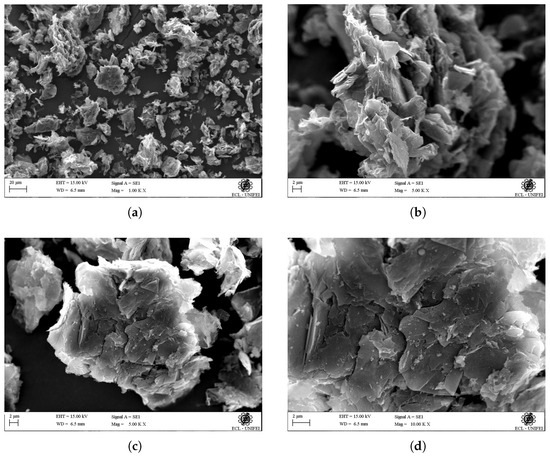
Figure 8.
SEM micrograph of GO obtained by exfoliation of graphite, at different magnifications: (a) 100 KX, (b) 500 KX, (c) 500 KX, (d) 1000 KX.
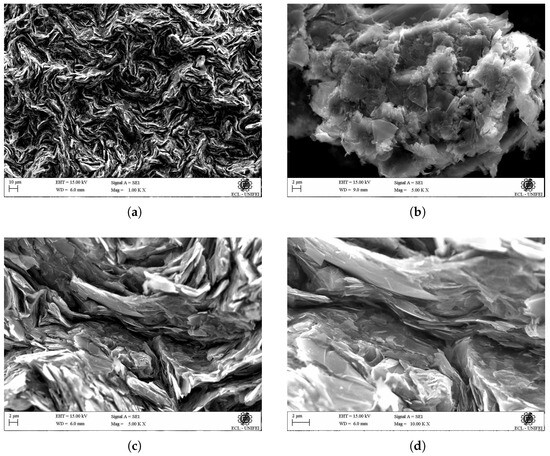
Figure 9.
SEM micrograph of graphite, at different magnifications: (a) 100 KX, (b) 500 KX, (c) 500 KX, (d) 1000 KX.
To perform the doping of the functionalized GO, copper and silver metal ions were chosen. It is common to use GO to absorb metal ions to purify aqueous systems. The functionalization of GO with phthalic anhydride serves two purposes: first, it establishes spacing between the GO layers, facilitating the intercalation of metal ions. Second, it forms a chemical complex with metal ions, allowing the fixation of ions in the GO network and, thereby, increasing the electrical conductivity of the material. The morphology observed in the PhA-GO micrograph (Figure 10a,b,e,f) is slightly different from that of graphene oxide. The surfaces of the samples exhibit a large number of edges and surface defects. In the morphology of functionalized GO, the graphene layers appear as wrinkled sheets. The morphology is composed of 3D structures formed by interspersed thin sheet corrugations, with spacing between them. This spacing between the graphene sheets allows for obtaining a more porous material and, therefore, a greater contact area compared to that observed in GO. EDX analysis has confirmed the existence of a 15% composition of copper, as depicted in Figure 10c,d, as well as silver, as shown in Figure 10g,h. As demonstrated in Figure 10d, the copper distribution appears uniform across the entire surface presented in the image. Similarly, the presence of silver exhibits uniform distribution over the complete image surface, as illustrated in Figure 10h.
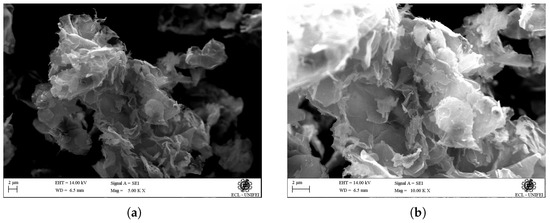
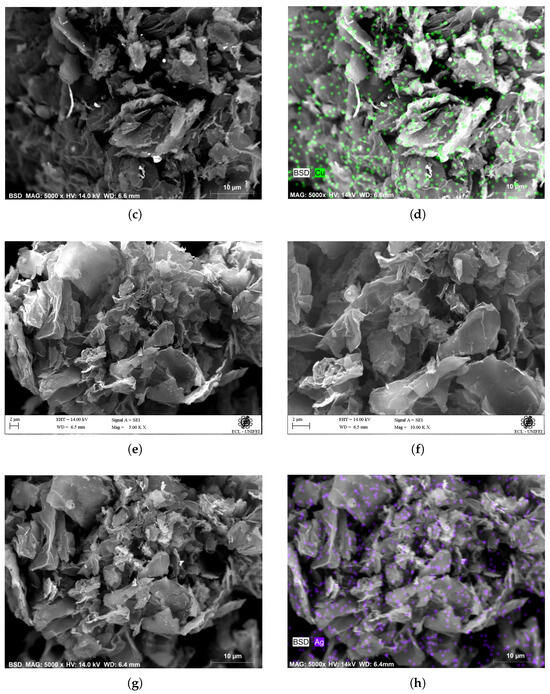
Figure 10.
SEM micrograph of PhA-GO doped with Cu ions. (a) 500 KX, (b) 1000 KX. SEM-EDX micrograph of PhA-GO doped with Cu ions. (c) SEM (5000 X), (d) SEM-EDX (5000 X). SEM micrograph of PhA-GO doped with Ag ions. (e) 500 KX, (f) 1000 KX. SEM-EDX micrograph of PhA-GO doped with Ag ions. (g) SEM (5000 X), (h) SEM-EDX (5000 X).
Figure 11 shows the electrical behavior of the GO sample with temperature, covering the range from 100 K to 300 K. As the temperature increases, the resistance of the GO sample also increases, leading to a decrease in conductivity. This behavior indicates that the GO sample exhibits metallic conductor characteristics, where its electrical conductivity diminishes with rising temperatures [44].
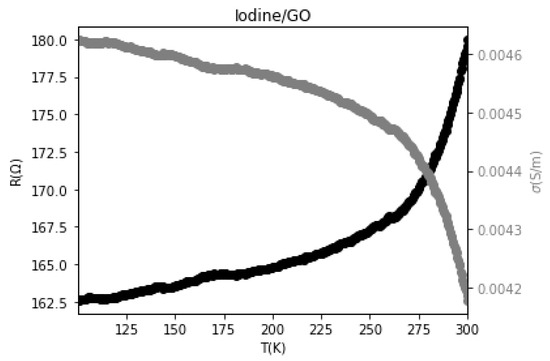
Figure 11.
The behavior of resistance and electrical conductivity with temperature for GO.
According to prior research, pure and uncharged graphene exhibits characteristics of a zero-gap semiconductor, positioned at the boundary between metallic and semiconductor behavior. As a consequence, the electronic band structure of graphene displays highly unusual features, with the dispersion (energy) relationships of the two bands intersecting at the Fermi level. This implies that electrons in graphene are accurately described by the Dirac equation, not the Schroeder equation [45]. Studies have indicated that the electrical conductivity and high electron mobility of graphene monolayers lead to a small effective mass for the charge carriers. As per the literature, the electronic structure of a graphene monolayer allows the charge carriers to be interpreted as “mass-less” electrons or Dirac fermions. Consequently, the charge carriers, i.e., the electrons in the graphene layer, behave akin to massless particles, resulting in their rapid motion [46]. According to Liang et al. [47], the electrical conductivity of graphene exhibits a decrease with increasing temperature in the range of 300 K to 480 K, which is consistent with previous findings suggesting that elevated temperatures favor lattice vibration over electronic conductivity. In the study conducted by Poyato et al. [48], they observed that the graph of electrical conductivity as a function of temperature did not conform to the fit of the Variable Range Hopping (VRH) model, with an R-squared value of 0.93. This outcome has also been reported by other researchers when analyzing polymeric composites with a high graphene content. The deviation from the VRH model is attributed to the metallic behavior of graphene in charge transport [48].
Figure 12a,b show the resistance and electrical conductivity behaviors of graphene oxide (GO) samples functionalized and doped with metal ions. Both samples exhibit similar behavior below a critical temperature (TC) and act as semiconductors, displaying a decrease in resistance (increase in conductivity) as the temperature rises. However, above this critical temperature, both materials demonstrate metallic behavior, characterized by an increase in resistance (decrease in conductivity) with increasing temperature. Notably, the critical temperature is observed to be lower for the PhA-GO/Ag sample, which also exhibits higher conductivity values. Table 2 summarizes the resistance and conductivity values at TC and at 298 K.
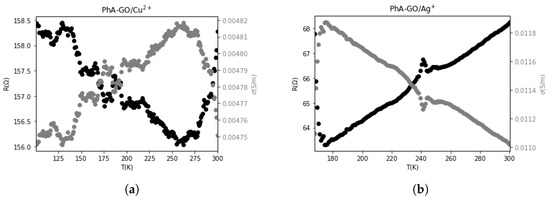
Figure 12.
The behavior of resistance and electrical conductivity with temperature for (a) PhA-GO doped with Cu ions and (b) PhA-GO doped with Ag ions.

Table 2.
Resistance and conductivity values at and at 298 K.
In Table 2, it is evident that the highest conductivity values were achieved for the functionalized GO samples doped with metal ions. These samples exhibited conductivity values ranging from 1 to 30 S/m. This level of conductivity is notably higher when compared to reduced GO, as reported in other works [49].
The regions demonstrating semiconductor behavior were subjected to analysis using the Varied Range Hopping (VRH) model [50,51,52,53]. In VRH conduction, electrons undergo hopping between energy levels in close proximity to the Fermi level, irrespective of their spatial distribution. During this hopping process, the distance between hops is not constant. The VRH mechanism is mathematically described by Equation (1) [54],
where d = 2 is the number of dimensions, is the conductivity, is a constant, is the Boltzmann constant, is the Activation energy, and T is the temperature.
Figure 13 shows that both samples conform to the VRH transport mechanism. The activation energy values obtained through the VRH model are presented in Table 3.
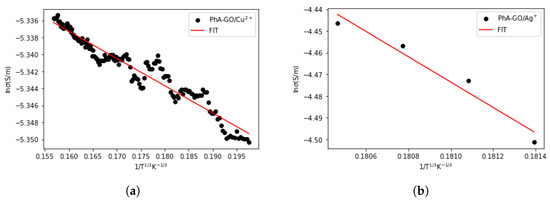
Figure 13.
Fitting the dependence of conductivity with temperature to the VRH model in samples (a) PhA-GO/Cu and (b) PhA-GO/Ag.

Table 3.
The values obtained for the activation energy, through the VRH model.
Table 3 reveals that following the transition from metal to semiconductor behavior, the activation energy of the PhA-GO/Ag sample is considerably higher than that of the PhA-GO/Cu sample. Additionally, during the transition from metal to semiconductor, the PhA-GO/Ag sample exhibits this change at a much higher temperature compared to the PhA-GO/Cu sample. The reduction in conductivity due to the presence of Cu is also reported in recent research [23]. These distinct characteristics of the samples hold promise for potential applications in electronic devices in the future.
4. Conclusions
The successful preparation of GO through the electrochemical exfoliation of graphite was confirmed by various physicochemical analyses. Firstly, thermal analysis techniques, TGA, and DSC confirmed the presence of GO. TGA revealed the relative mass loss of the oxygen functional groups, while DSC evidenced the decarboxylation process on the GO surface. XRD analysis further confirmed the GO structure by the appearance of a diffraction peak at approximately 2 = 9.1. Additionally, SEM micrographs displayed the morphology of multiple layers of graphene superimposed, providing evidence of graphite exfoliation. The behavior of electrical conductivity with temperature for GO also corroborated the exfoliation process, as the samples exhibited a semimetal behavior and displayed decreased electrical conductivity with increasing temperature within the studied temperature range.
The functionalization of GO with phthalic anhydride was verified through FTIR analysis by the decrease in the area ratio between the vibration’s bands of groups OH and C=C in relation to GO.
Furthermore, the doping of PhA-GO was confirmed through SEM-EDX analysis. The SEM micrographs of PhA-GO/Cu and PhA-GO/Ag samples exhibited distinct characteristics compared to GO. In these samples, the GO layers appeared as corrugated sheets, showcasing a morphology with greater porosity and surface area.
The doped samples, PhA-GO/Cu and PhA-GO/Ag, exhibited higher electrical conductivity values, with the value being higher for PhA-GO doped with Ag. The study of electrical conductivity with temperature revealed a semiconductor character at temperatures below 259 K for PhA-GO/Cu and below 174 K for PhA-GO/Ag. Between 259 K and 300 K, PhA-GO/Cu exhibited a semimetallic behavior similar to that observed in GO, and the same behavior was observed for PhA-GO/Ag at temperatures between 174 K and 300 K. These unique electrical properties are promising for potential applications in electronic devices that can operate in different temperature ranges.
Author Contributions
Methodology, N.G.A.P., M.E.L.G., A.A.A.d.Q., A.F.O. and E.T.W.N.; Software, N.G.A.P., A.A.A.d.Q. and A.F.O.; Validation, N.G.A.P., M.E.L.G., A.F.O. and E.T.W.N.; Formal analysis, M.E.L.G., A.A.A.d.Q., A.F.O. and E.T.W.N.; Investigation, N.G.A.P. and M.E.L.G.; Resources, M.E.L.G., A.A.A.d.Q. and E.T.W.N.; Data curation, M.E.L.G., A.A.A.d.Q. and A.F.O.; Writing—original draft, N.G.A.P., M.E.L.G., A.A.A.d.Q. and A.F.O. All authors have read and agreed to the published version of the manuscript.
Funding
Fapemig (Finance Code APQ-02676-16 and APQ-00010-18).
Acknowledgments
The authors would like to thank the Brazilian agencies CAPES, CNPq, and Fapemig (Finance Code APQ-02676-16 and APQ-00010-18) for financial support.
Conflicts of Interest
The authors declare no conflict of interest.
References
- Bonaccorso, F.; Colombo, L.; Yu, G.; Stoller, M.; Tozzini, V.; Ferrari, A.C.; Ruoff, R.S.; Pellegrini, V. Graphene, related two-dimensional crystals, and hybrid systems for energy conversion and storage. Science 2015, 347, 1246501. [Google Scholar] [CrossRef] [PubMed]
- Huang, X.; Yin, Z.; Wu, S.; Qi, X.; He, Q.; Zhang, Q.; Yan, Q.; Boey, F.; Zhang, H. Graphene-Based Materials: Synthesis, Characterization, Properties, and Applications. Small 2011, 7, 1876–1902. [Google Scholar] [CrossRef] [PubMed]
- Osman, A.; Elhakeem, A.; Kaytbay, S.; Ahmed, A. A comprehensive review on the thermal, electrical, and mechanical properties of graphene-based multi-functional epoxy composites. Adv. Compos. Hybrid Mater. 2022, 5, 547–605. [Google Scholar] [CrossRef]
- Park, H.J.; Meyer, J.; Roth, S.; Skákalová, V. Growth and properties of few-layer graphene prepared by chemical vapor deposition. Carbon 2010, 48, 1088–1094. [Google Scholar] [CrossRef]
- Sharma, S.S.A.; Bashir, S.; Kasi, R.; Subramaniam, R.T. The significance of graphene based composite hydrogels as smart materials: A review on the fabrication, properties, and its applications. FlatChem 2022, 33, 100352. [Google Scholar] [CrossRef]
- Chung, C.; Kim, Y.K.; Shin, D.; Ryoo, S.R.; Hong, B.H.; Min, D.H. Biomedical Applications of Graphene and Graphene Oxide. Acc. Chem. Res. 2013, 46, 2211–2224. [Google Scholar] [CrossRef]
- Shen, S.; Wang, J.; Wu, Z.; Du, Z.; Tang, Z.; Yang, J. Graphene Quantum Dots with High Yield and High Quality Synthesized from Low Cost Precursor of Aphanitic Graphite. Nanomaterials 2020, 10, 375. [Google Scholar] [CrossRef]
- Sun, L.; Fugetsu, B. Mass production of graphene oxide from expanded graphite. Mater. Lett. 2013, 109, 207–210. [Google Scholar] [CrossRef]
- Yu, P.; Lowe, S.; Simon, G.; Zhong, Y. Electrochemical exfoliation of graphite and production of functional graphene. Curr. Opin. Colloid Interface Sci. 2015, 20, 329–338. [Google Scholar] [CrossRef]
- Oliveira, A.E.F.; Braga, G.B.; Tarley, C.R.T.; Pereira, A.C. Thermally reduced graphene oxide: Synthesis, studies and characterization. J. Mater. Sci. 2018, 53, 12005–12015. [Google Scholar] [CrossRef]
- Inagaki, M.; Tashiro, R.; Washino, Y.I.; Toyoda, M. Exfoliation process of graphite via intercalation compounds with sulfuric acid. J. Phys. Chem. Solids 2004, 65, 133–137. [Google Scholar] [CrossRef]
- Liu, M.; Zhang, X.; Wu, W.; Liu, T.; Liu, Y.; Guo, B.; Zhang, R. One-step chemical exfoliation of graphite to 100% few-layer graphene with high quality and large size at ambient temperature. Chem. Eng. J. 2019, 355, 181–185. [Google Scholar] [CrossRef]
- Letoffé, A.; Cuynet, S.; Noel, C.; de Poucques, L.; Royaud, I.; Hérold, C.; Henrion, G.; Ponçot, M.; Fontana, S. Functionalization and exfoliation of graphite with low temperature pulse plasma in distilled water. Phys. Chem. Chem. Phys. 2022, 24, 5578–5589. [Google Scholar] [CrossRef] [PubMed]
- Loudiki, A.; Matrouf, M.; Azriouil, M.; Farahi, A.; Lahrich, S.; Bakasse, M.; El Mhammedi, M. Preparation of graphene samples via electrochemical exfoliation of pencil electrode: Physico-electrochemical Characterization. Appl. Surf. Sci. Adv. 2022, 7, 100195. [Google Scholar] [CrossRef]
- Aksu, Z.; Şahin, C.H.; Alanyalıoğlu, M. Fabrication of Janus GO/rGO humidity actuator by one-step electrochemical reduction route. Sens. Actuators B Chem. 2022, 354, 131198. [Google Scholar] [CrossRef]
- Padma, N. Exfoliation Routes to the Production of Nanoflakes of Graphene Analogous 2D Materials and Their Applications. In Handbook on Synthesis Strategies for Advanced Materials; Springer: Berlin/Heidelberg, Germany, 2022; pp. 377–443. [Google Scholar]
- Liu, W.W.; Aziz, A. Review on the Effects of Electrochemical Exfoliation Parameters on the Yield of Graphene Oxide. ACS Omega 2022, 7, 33719–33731. [Google Scholar] [CrossRef]
- Biranje, P.M.; Patwardhan, A.W.; Joshi, J.B.; Prakash, J.; Dasgupta, K. Kinetic study of graphene oxide synthesis by electrochemical exfoliation of graphite. J. Ind. Eng. Chem. 2023, 119, 335–345. [Google Scholar] [CrossRef]
- Lei, Z.; Zhang, J.; Zhang, L.L.; Kumar, N.A.; Zhao, X.S. Functionalization of chemically derived graphene for improving its electrocapacitive energy storage properties. Energy Environ. Sci. 2016, 9, 1891–1930. [Google Scholar] [CrossRef]
- Wang, H.S.; Tian, S.Y.; Yang, S.W.; Wang, G.; You, X.F.; Xu, L.X.; Li, Q.T.; He, P.; Ding, G.Q.; Liu, Z.; et al. Anode coverage for enhanced electrochemical oxidation: A green and efficient strategy towards water-dispersible graphene. Green Chem. 2018, 20, 1306–1315. [Google Scholar] [CrossRef]
- Li, C.; Shi, Y.; Chen, X.; He, D.; Shen, L.; Bao, N. Controlled synthesis of graphite oxide: Formation process, oxidation kinetics, and optimized conditions. Chem. Eng. Sci. 2018, 176, 319–328. [Google Scholar] [CrossRef]
- Wang, X.; Sun, G.; Routh, P.; Kim, D.H.; Huang, W.; Chen, P. Heteroatom-doped graphene materials: Syntheses, properties and applications. Chem. Soc. Rev. 2014, 43, 7067–7098. [Google Scholar] [CrossRef] [PubMed]
- Xie, G.; Forslund, M.; Pan, J. Direct Electrochemical Synthesis of Reduced Graphene Oxide (rGO)/Copper Composite Films and Their Electrical/Electroactive Properties. ACS Appl. Mater. Interfaces 2014, 6, 7444–7455. [Google Scholar] [CrossRef] [PubMed]
- Quan, J.; Zhang, J.; Li, J.; Zhang, X.; Wang, M.; Wang, N.; Zhu, Y. Three-dimensional AgNPs-graphene-AgNPs sandwiched hybrid nanostructures with sub-nanometer gaps for ultrasensitive surface-enhanced Raman spectroscopy. Carbon 2019, 147, 105–111. [Google Scholar] [CrossRef]
- Tadyszak, K.; Majchrzycki, Ł.; Szyller, Ł.; Scheibe, B. Preparation and characterization of partially reduced graphene oxide aerogels doped with transition metal ions. J. Mater. Sci. 2018, 53, 16086–16098. [Google Scholar] [CrossRef]
- Jibrael, R.I.; Mohammed, M.K. Production of graphene powder by electrochemical exfoliation of graphite electrodes immersed in aqueous solution. Optik 2016, 127, 6384–6389. [Google Scholar] [CrossRef]
- Zhang, R.; Yang, Y.; Guo, L.; Luo, Y. A fast and high-efficiency electrochemical exfoliation strategy towards antimonene/carbon composite for selective lubrication and sodium-ion storage applications. Phys. Chem. Chem. Phys. 2022, 24, 4957–4965. [Google Scholar] [CrossRef]
- Kochergin, V.; Komarova, N.; Kotkin, A.; Manzhos, R.; Krivenko, A. Bipolar Electrochemical Exfoliation of Graphite for Synthesizing Electrocatalysts of Oxygen Reduction. Russ. J. Electrochem. 2022, 58, 88–92. [Google Scholar] [CrossRef]
- Pavoski, G.; Maraschin, T.; Fim, F.d.C.; Balzaretti, N.M.; Galland, G.B.; Moura, C.S.; Basso, N.R.d.S. Few layer reduced graphene oxide: Evaluation of the best experimental conditions for easy production. Mater. Res. 2016, 20, 53–61. [Google Scholar] [CrossRef]
- Devi, L.G.; Murthy, B.N.; Kumar, S.G. Photocatalytic activity of TiO2 doped with Zn2+ and V5+ transition metal ions: Influence of crystallite size and dopant electronic configuration on photocatalytic activity. Mater. Sci. Eng. B 2010, 166, 1–6. [Google Scholar] [CrossRef]
- Yang, H.; Shan, C.; Li, F.; Han, D.; Zhang, Q.; Niu, L. Covalent functionalization of polydisperse chemically-converted graphene sheets with amine-terminated ionic liquid. Chem. Commun. 2009, 26, 3880–3882. [Google Scholar] [CrossRef]
- Fathy, M.; Moghny, T.A.; Mousa, M.A.; El-Bellihi, A.H.A.A.; Awadallah, A.E. Absorption of calcium ions on oxidized graphene sheets and study its dynamic behavior by kinetic and isothermal models. Appl. Nanosci. 2016, 6, 1105–1117. [Google Scholar] [CrossRef]
- Zhang, C.; Fu, X.; Yan, Q.; Li, J.; Fan, X.; Zhang, G. Study on the thermal decomposition mechanism of graphene oxide functionalized with triaminoguanidine (GO-TAG) by molecular reactive dynamics and experiments. RSC Adv. 2019, 9, 33268–33281. [Google Scholar] [CrossRef]
- Li, X.; Bandyopadhyay, P.; Nguyen, T.T.; Park, O.-k.; Lee, J.H. Fabrication of functionalized graphene oxide/maleic anhydride grafted polypropylene composite film with excellent gas barrier and anticorrosion properties. J. Membr. Sci. 2018, 547, 80–92. [Google Scholar] [CrossRef]
- Al-Tamimi, B.H.; Farid, S.B.H.; Chyad, F.A. Modified Unzipping Technique to Prepare Graphene Nano-Sheets. J. Phys. Conf. Ser. 2018, 1003, 012020. [Google Scholar] [CrossRef]
- Sedaghat, S.; Ahadian, M.M.; Jafarian, M.; Hatamie, S. Model Fuel Deep Desulfurization Using Modified 3D Graphenic Adsorbents: Isotherm, Kinetic, and Thermodynamic Study. Ind. Eng. Chem. Res. 2019, 58, 10341–10351. [Google Scholar] [CrossRef]
- Kumar, S. Spectroscopy of organic compounds. Cosm. Rays 2006, 10, 1–36. [Google Scholar]
- Kettle, S.F.A. Physical Inorganic Chemistry; Springer: Berlin/Heidelberg, Germany, 1996. [Google Scholar] [CrossRef]
- Kettle, S. Physical Inorganic Chemistry: A Coordination Chemistry Approach; Springer: Berlin/Heidelberg, Germany, 2013. [Google Scholar]
- Cordeiro, G.L.; Ussui, V.; Messias, N.A.; Piasentin, R.M.; de Lima, N.B.; Neto, A.O.; Lazar, D.R. Effect of Sn loading on the characteristics of Pt electrocatalysts supported on reduced graphene oxide for application as direct ethanol fuel cell anode. Int. J. Electrochem. Sci. 2017, 12, 3795–3813. [Google Scholar] [CrossRef]
- Johra, F.T.; Lee, J.W.; Jung, W.G. Facile and safe graphene preparation on solution based platform. J. Ind. Eng. Chem. 2014, 20, 2883–2887. [Google Scholar] [CrossRef]
- Ban, F.; Majid, S.R.; Huang, N.M.; Lim, H. Graphene oxide and its electrochemical performance. Int. J. Electrochem. Sci. 2012, 7, 4345–4351. [Google Scholar] [CrossRef]
- Najafi, F.; Moradi, O.; Rajabi, M.; Asif, M.; Tyagi, I.; Agarwal, S.; Gupta, V.K. Thermodynamics of the adsorption of nickel ions from aqueous phase using graphene oxide and glycine functionalized graphene oxide. J. Mol. Liq. 2015, 208, 106–113. [Google Scholar] [CrossRef]
- Bark, H.; Ko, M.; Lee, M.; Lee, W.; Hong, B.; Lee, H. Thermoelectric properties of thermally reduced graphene oxide observed by tuning the energy states. ACS Sustain. Chem. Eng. 2018, 6, 7468–7474. [Google Scholar] [CrossRef]
- Kaiser, A.B.; Skákalová, V. Electronic conduction in polymers, carbon nanotubes and graphene. Chem. Soc. Rev. 2011, 40, 3786. [Google Scholar] [CrossRef] [PubMed]
- Neto, A.C.; Guinea, F.; Peres, N.M. Drawing conclusions from graphene. Phys. World 2006, 19, 33. [Google Scholar] [CrossRef]
- Liang, B.; Song, Z.; Wang, M.; Wang, L.; Jiang, W. Fabrication and Thermoelectric Properties of Graphene/Bi2Te3Composite Materials. J. Nanomater. 2013, 2013, 210767. [Google Scholar] [CrossRef]
- Poyato, R.; Osuna, J.; Morales-Rodríguez, A.; Gallardo-López, Á. Electrical conduction mechanisms in graphene nanoplatelet/yttria tetragonal zirconia composites. Ceram. Int. 2018, 44, 14610–14616. [Google Scholar] [CrossRef]
- Pham, V.H.; Pham, H.D.; Dang, T.T.; Hur, S.H.; Kim, E.J.; Kong, B.S.; Kim, S.; Chung, J.S. Chemical reduction of an aqueous suspension of graphene oxide by nascent hydrogen. J. Mater. Chem. 2012, 22, 10530. [Google Scholar] [CrossRef]
- Fogler, M.; Teber, S.; Shklovskii, B. Variable-range hopping in quasi-one-dimensional electron crystals. Phys. Rev. B 2004, 69, 035413. [Google Scholar] [CrossRef]
- Liu, H.; Pourret, A.; Guyot-Sionnest, P. Mott and Efros-Shklovskii variable range hopping in CdSe quantum dots films. ACS Nano 2010, 4, 5211–5216. [Google Scholar] [CrossRef]
- El Hassan, M.; Dlimi, S.; Limouny, L.; El Oujdi, A.; Echchelh, A.; El Kaaouachi, A. Electrical transport phenomenon and variable range hopping conduction in reduced graphene oxide/polystyrene composites. Mol. Cryst. Liq. Cryst. 2022, 726, 82–89. [Google Scholar] [CrossRef]
- Chung, F.Y.; Hasibuan, D.P.; Saragih, C.S.; Patil, R.A.; Tsai, C.H.; Liou, Y.; Ma, Y.R. Transmission-path Dependent Electron Hopping Transport in Thin Films and Nanorods of NiO. Surf. Interfaces 2022, 30, 101845. [Google Scholar] [CrossRef]
- Kovtun, A.; Candini, A.; Vianelli, A.; Boschi, A.; Dell’Elce, S.; Gobbi, M.; Kim, K.H.; Avila, S.L.; Samorì, P.; Affronte, M.; et al. Multiscale Charge Transport in van der Waals Thin Films: Reduced Graphene Oxide as a Case Study. ACS Nano 2021, 15, 2654–2667. [Google Scholar] [CrossRef] [PubMed]
Disclaimer/Publisher’s Note: The statements, opinions and data contained in all publications are solely those of the individual author(s) and contributor(s) and not of MDPI and/or the editor(s). MDPI and/or the editor(s) disclaim responsibility for any injury to people or property resulting from any ideas, methods, instructions or products referred to in the content. |
© 2023 by the authors. Licensee MDPI, Basel, Switzerland. This article is an open access article distributed under the terms and conditions of the Creative Commons Attribution (CC BY) license (https://creativecommons.org/licenses/by/4.0/).