Abstract
In the last decade, growing awareness about CO2 emissions is supporting the authorities in a more sustainable society. The proposed solutions embrace different topics, such as renewable energy implementation, lower waste production, and carbon capture and storage technologies (CCS). The latter is based upon the best available knowledge about the thermophysical properties of CO2, which are not always satisfactory for its complete characterization. In this work, it is investigated the interaction of the CO2 in solid phase (dry-ice) with sandy soil, a phenomenon that can potentially occur following pipeline ruptures. An experimental setup and a numerical model have been developed to measure and validate the temperature profiles beneath the dry-ice bank at steady-state conditions. The model has been validated with the experimental data by defining a suitable range of the thermal conductivity at the solid phase (0.25–0.30 W m−1 K−1) that led to the best match (deviation of 7.81%). Finally, the overall heat transfer coefficient (85.56–86.35 W m−2 K−1) has been numerically calculated.
Keywords:
dry-ice; carbon-dioxide; safety; experimental; thermal analysis; heat-transfer; low temperature; soil; underground 1. Introduction
Greenhouse Gas (GHG) emission control and climate change are considered urgent and extremely important matters to solve in the current century. As reported in the last International Panel on Climate Change (IPCC) report [1], the increase in world population as well as the utilization of fossil fuels for energy generation and mobility are linked with the greenhouse gases emission worldwide. Carbon dioxide is the most significant anthropogenic greenhouse gas that accounts for 70% of global emissions. In order to preserve the ozone layer and prevent global warming, there is an increasing demand for science and technology based on ecologically safe and natural working fluids such as carbon dioxide (CO2). The thermodynamic and transport properties of CO2 seem to be also favorable in terms of heat transfer and pressure drop, compared to other typical fluids. Moreover, the full-scale application of Carbon Capture Utilization and Storage (CCUS) strategies, has been proposed among the possible actions to reduce GHG emissions [2,3]. The management of large amounts of CO2 in the value chain of CCUS should be operated safely and with a quantifiable reduction of the CO2 emission of the overall process, usually calculated with Life Cycle Assessment (LCA) procedures. Most of the GHG emissions are addressable to human activities and heavy industries, which weigh 20% of the total [4]. The captured CO2 can be transported mainly by pipeline or by ship [5,6], the development of large-scale Carbon Capture and Storage (CCS) projects will require the management and transport of CO2 safely and under different operating conditions. Carbon dioxide can be treated and transported both in gas and liquid phases, however, it is not unexpected the necessity to deal with solid phases, namely the dry-ice formation. Dry-ice is the solid phase of carbon dioxide, it forms through a deposition process when the pressure of liquid CO2 is decreased until its solidification. The utilization of dry-ice for commercial purposes is related to vaccine cooling, food chilling and freezing, blood and tissue sample preservation, heat treating of metals, and even to create special effects such as fog for events or stage productions [7].
The event of accidental dry-ice formation is commonly related to the management of high pressure of CO2 that, following a rapid pressure drop opens to a phase transition [8,9]. Under atmospheric pressure, the boiling point for the CO2 is the sublimation point where gas and solid occur, and the flashing ultimately results in the formation of a solid phase. During the process of sublimation, the dry-ice goes from solid directly to a gas state, without passing through the liquid phase (sublimation temperature of −78.8 °C), the sublimation rate is related to the energy balance of the bank [10,11,12]. The formation of a solid phase is usually an unwanted scenario, especially during the transportation of CO2 via pipeline, indeed it can cause two main scenarios: the clogging of equipment [13] (such as valves) and the accumulation of potentially dangerous gases in depression during blowdowns [14,15,16,17,18]. The accidental rupture of a pipeline can cause the release of large amounts of gas (Figure 1), in the case of CO2 the sudden depressurization as well as the Joule-Thomson effect, can lead to the formation of large amounts of dry-ice spread nearby [19,20,21] for a considerable amount of time. In the worst-case scenario, the dry-ice can freeze the soil and the equipment, leading to the slowdown of safety operations.
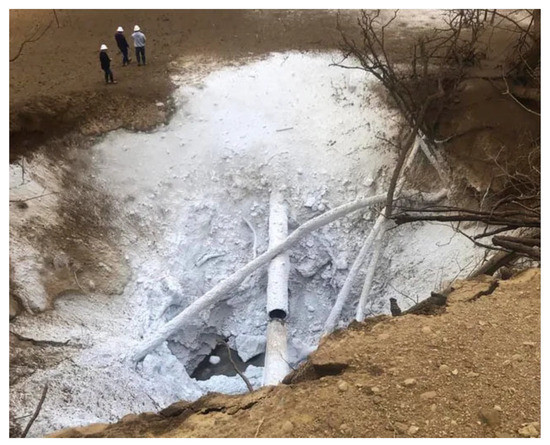
Figure 1.
CO2 pipeline rupture and dry-ice formation occurred in Yazoo County in 2020 (Mississippi Emergency Management Agency—MEMA) [22].
For these reasons, the phenomenon of dry ice formation and accumulation should be studied carefully, either in the laboratory or with numerical methods. In this work, it is hence proposed an experimental investigation that assesses the temperature field below the soil surface. Further, a numerical model (Section 3) is presented and validated with the temperature profiles beneath the dry ice bank. Finally, a sensitivity analysis is performed with the goal to quantify the thermal behavior of the experiment represented by the overall heat transfer coefficient that occurs in the unlucky and unlikely events of CO2 dispersion. The experimental and numerical results are reported in Section 4, while the inherent discussion is presented in Section 5.
2. Materials and Methods
The aim of this research is to give a quantitative description of the dry-ice sublimation behavior on a coarse sandy soil. An experimental setup has been defined in order to measure the temperature profile beneath a sublimating dry-ice bank, described in Section 2.1. The different test case conditions have been defined in Section 2.2. After that, a Computational Fluid Dynamics (CFD) model in Ansys Fluent has been validated according to the experimental data. The latter is discussed in Section 3.
2.1. Experimental Setup
In order to analyze the temperature evolution of a simulated dry-ice release on the soil, a small-scale setup has been built. A wooden box has been crafted in the carpentry room at the laboratories of the Department of Industrial Engineering and Mathematical Sciences at Ancona (Italy), the box internal sizes were 0.23 m in length, 0.19 m height and 0.12 m deep (respectively 0.26 m, 0.22 m and 0.135 m considering external measurements, with a 0.015 m wall thickness). The box was filled completely with a coarse sand type of soil. To monitor the temperature distribution in the experimental system, type-T thermocouples (copper in the positive conductor and constantan in the negative conductor) were used, with an accuracy of ±1 °C [23]. This measurement configuration required the combined use of software, Agilent Bench link Data Logger 3, and a temperature acquisition system, Agilent Acquisition A. The reference junction has been kept at 0 °C (Ice Point Reference) thanks to a KAYE K170 reference system, a multimeter has been utilized for the temperature values monitoring. The thermocouples are positioned inside the setup through wires that are connected to the data logger. The latter shows the value of the real-time temperatures, measured by every thermocouple on the computer. Metal supports have been buried in the soil at fixed depths before filling the box with sand. The thermocouples were fixed to the metal supports in order to stabilize the position of the sensors during all the tests. The metal supports were placed at 0.06 m and 0.095 m of depth from the surface level of the box. The disposition of the thermocouples is reported in Figure 2, Figure 3 and Figure 4. The thermocouples labeled 2, 7, and 12 are placed right underneath the block of dry ice, at the surface level of the box, the sensors number 8 and 9 are 0.06 m deep inside the topsoil and those number 10 and 11 are 0.11 m deep inside the topsoil. The box filled with sand and equipped with the sensors has been placed inside a display case with a transparent wall. Thermocouple number 6 was positioned inside the case while sensors number 1 and 3 are outside the display case, at room temperature. In Table 1 are reported the channels where the thermocouples are connected, the distance from the long side of the box (x dependent position), the depth of the thermocouples (from the dry-ice block), the average and the minimum temperature of every channel.
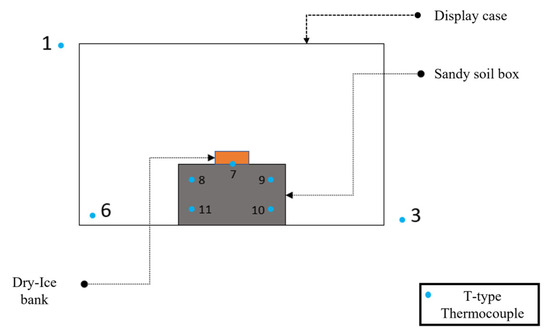
Figure 2.
Experimental Setup—General Scheme.
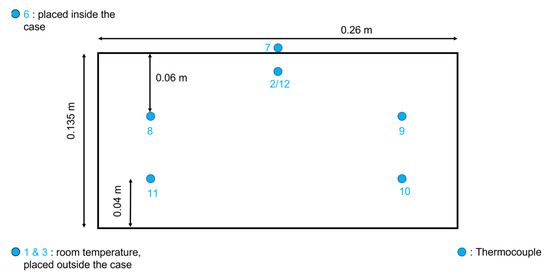
Figure 3.
Sensors positions—Front section.
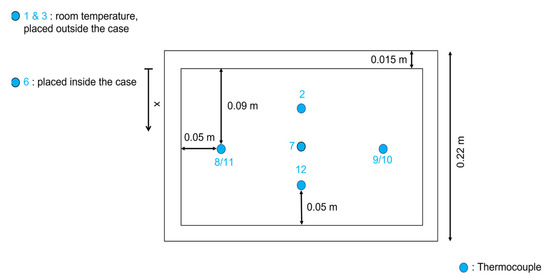
Figure 4.
Sensors positions—Top view.

Table 1.
Temperature sensors position and number.
2.2. Measurements and Test Cases
A total of 5 tests have been carried out in this investigation and the summary is provided in Table 2. Initially, a test zero has been defined to measure the temperature trends in a steady-state case with fixed boundary conditions. Indeed, “Test 0” was run as a base case without the contribution of a dry-ice source to establish the heat transfer mechanisms equilibrium in the setup utilized. In “Test 1”, the dry ice block’s width and length are estimated to be 0.07 × 0.08 m with a weight of 0.175 kg, in “Test A” the block was slightly lighter with an actual measured 0.07 × 0.08 m frames and a weight of 0.17 kg. In “Test B” the block’s measures of width and length were measured to be 0.09 × 0.06 m with a weight of 0.167 kg. “Test C” defines a block of ice with an irregular shape and a weight of 0.165 kg, the lightest of all.

Table 2.
Experimental test cases.
The dry-ice samples have been weighed and measured prior to the setting up of each experiment start. In Figure 5 the weighing procedure performed with a mass scale and the sample in the measurement setup for the case “Test 1”. Due to the sublimation rate, measured in the range of 160–240 g/min·m2 by Mocellin et al. [12], the weight value has been adjusted according to the short time required from the scaling to the setup test measurement start. The uncertainty in terms of weight and size can be estimated in the range of ± 0.025 kg and ± 0.005 m.
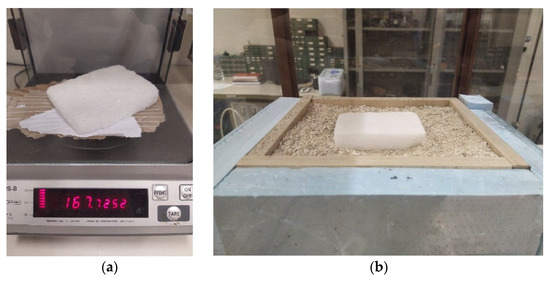
Figure 5.
Preparation of the dry-ice bank samples: (a) Mass weighing; (b) Dry-ice bank setup for “Test 1”.
3. Numerical Model
The thermal model was numerically analyzed with the finite volume CFD code ANSYS Fluent [24]. A 3D steady-state simulation has been performed; double-precision was used in the simulations. A second-order upwind scheme is adopted for the energy equations with a pressure-based coupled algorithm. The coupled scheme guarantees a robust and efficient single-phase implementation for steady-state flows, with superior performance than segregated solution schemes. The applied convergence criterion was 10−12 for the energy equation, expressed in Equation (1) in the general time-dependent form. Continuity and momentum equations are not considered in the numerical model since only the heat transfer between the dry-ice bank and the soil is assessed.
A uniform structured mesh with 6.2 × 10⁴ quadrilateral elements (cells) was developed with Fluent Meshing to describe the geometry. The shared topology option ensures the correct continuity between the common mesh nodes at the interfaces (Figure 6).
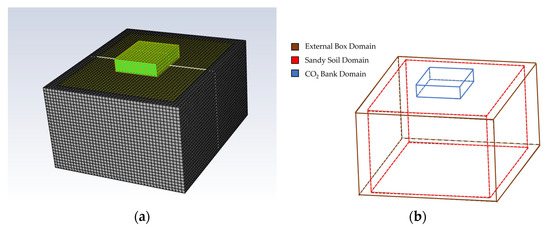
Figure 6.
Mesh visualization of the numerical model (a) and the wireframe (b).
The boundary conditions have been set according to the observation of the sublimation phenomenon. In fact, the latter has been defined as coupled for the whole domain, indeed the solution is calculated starting from the initial values. The soil solid domain was initialized with an initial temperature TG = TROOM = 22 °C (293.15 K), while the dry-ice bank was set at TB = −78.8 °C (194.35 K) (Figure 7). The properties utilized for the materials characterization of the model are reported in Table 3.
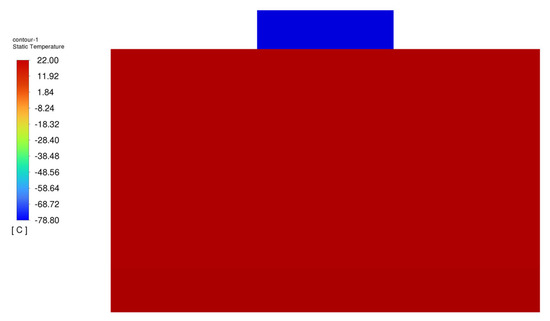
Figure 7.
Initialization temperature for the model.

Table 3.
Relevant properties of dry-ice, sand, and wood.
4. Results
4.1. Experimental Results
Following the results of Test 1 (see Table 2), a summary of the main parameters such as average and minimum temperature has been calculated from the measurement results, from the beginning of the test to its end (end of the sublimation of the dry-ice). The temperature at the steady-state phase of the process, estimated according to the measurements, is reported in Table 4; these average values have been calculated using the data between 3000 s and 11,000 s for each test, i.e., at the bottom plateau of the temperature trends. Indeed, in this elapsed time, the temperature is quite constant for a few hours, so the heat transfer mechanism between the dry-ice and the soil can be assumed at equilibrium.

Table 4.
Experimental test cases and results.
The room temperature and the environment temperature, as reported in Figure 8, can be considered as constant based on the measurements results from sensors 1, 3, and 6 with an average value calculated for Test A around 22.89 °C (295 K).
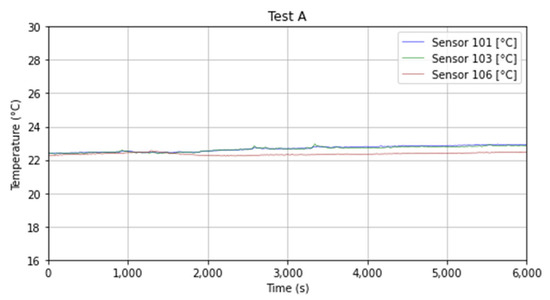
Figure 8.
Room temperature and air-case temperature measured during Test A.
Sensors 2 and 12 are positioned at surface level, slightly below the topsoil, meanwhile, the 7 is positioned right underneath the block of ice. The average temperatures obtained are very different, the 7 was placed on the bottom of the dry-ice, and its minimum value of temperature is measured to be −50 °C (223 K) right after the block is positioned (Figure 9). It should be noted that the temperature measured is not exactly the dry-ice temperature, indeed due to the sublimation, an air-pocket between the dry-ice and the soil has been observed. Therefore, the temperature measured should be lower in absolute value but higher in real value than the actual dry-ice bulk temperature of −78.5 °C (194.7 K). In Figure 9 it is also possible to visualize the temperature variation that occurred during the sublimation process probably caused by the air-pocket as previously described. This phenomenon has been observed in all the tested cases.

Figure 9.
Temperature variations between the dry-ice and the soil in the first hour for Test A (a) and Test 1 (b). The dry-ice bank was positioned after 1280 s from the start of the experiment in Test A and around 610 s in Test 1.
The 2 and 12 obtained a minimum temperature of respectively −18 °C (255 K) and 8 °C (281 K). The difference in temperature is shown in Figure 10 and can be explained by the dry ice position, which was closer to sensor 2 than the 12 (Figure 4—Top View—for better visualization). In Figure 10 it is also possible to observe that after s (around 3 h) which corresponds to the end of the sublimation for Test A, the temperature starts rising for both sensors.
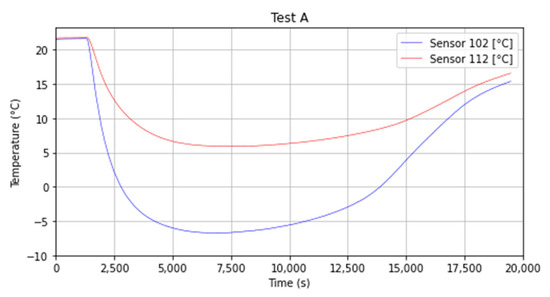
Figure 10.
Temperature decay and recovery for sensors 2 and 12.
The thermocouples 8 and 9 were positioned 0.06 m deep into the topsoil and the values of temperature obtained are very similar, the two curves have a slowly rising trend after reaching the minimum value measured in the range of 9.10 °C (282.25 K) and 9.58 °C (282.73 K) for sensor 8 and 9 respectively (Figure 11).
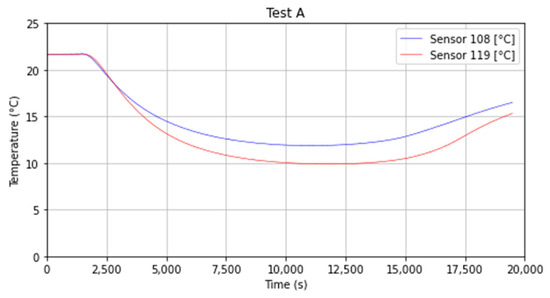
Figure 11.
Temperature trend for sensors 8 and 9.
As reported for sensors 8 and 9 (z = 0.06 m), thermocouples 10 and 11 were located at the same depth in the ground (z = 0.095 m), in this case, the minimum average values in the different tests are 16.11 °C (289.26 K) and 16.82 °C (289.97 K) for the sensor 10 and 11 respectively. In this case, the impact of the cold source placed on top, namely the dry-ice bank has less impact if compared with the numbers 8 and 9. The slope variation is also limited since they were positioned 0.095 m deep inside the topsoil (see Figure 12).
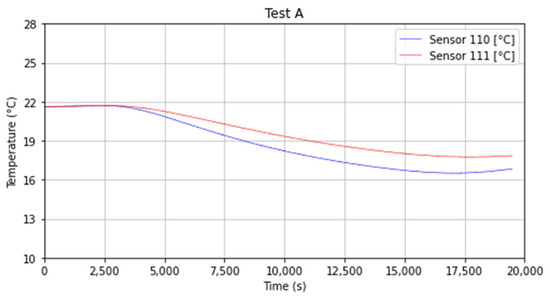
Figure 12.
Temperature trend for sensors 10 and 11.
The temperature measured during Test 1 is reported in. It has been observed that the after approx. 6000 s (1.6 h) the temperature is stable and the phenomenon can be considered as a steady-state, indeed no significant variation (<8%) can be observed for more than 3000 s.
4.2. Numerical Results
The results from the numerical model are reported in this section; temperature and heat flux have been calculated with the CFD simulation. The results have been calculated at steady-state, with the assumption of constant temperature for the dry-ice as a cold source, this was verified with the observations and the measurements (after 6000 s of transient phenomena) due to the very slow process of sublimation (see Figure 10, Figure 11 and Figure 12). In Figure 13 it can be visualized how the temperature gradient is uniform from the center of the dry-ice and it propagates through the soil.

Figure 13.
Temperature map of the 3D domain (a) and the central 2D vertical section (b).
In order to calculate the exact temperature values at the point where the temperature sensors have been placed, horizontal planes have been analyzed. In Figure 14 three planes are reported, at different ground levels according to the values described in Table 3. In Figure 14a the first horizontal plane is reported, and the distance from the soil surface is 0.01 m corresponding to the sensors 2 and 12 positions. In Figure 14b the second horizontal plane is reported, the distance from the soil surface is 0.06 m corresponding to the sensors 8 and 9 positions. In Figure 14c the second horizontal plane is reported, the distance from the soil surface is 0.095 m corresponding to the sensors 10 and 11 position. Figure 15 instead highlights the complete temperature distribution map inside the sandy soil on the symmetry plane.

Figure 14.
Temperature distribution on different horizontal underground layers: z = 0.01 m (a), z = 0.06 m (b), z = 0.095 m (c).
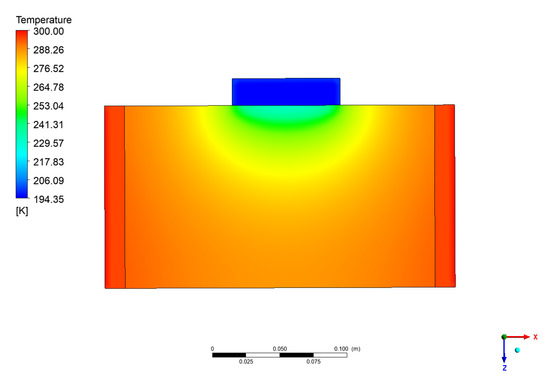
Figure 15.
Temperature distribution on the vertical mid layer as Figure 13b.
The simulation results have been compared with the experimental data from the steady-state values. Among the given range of thermal conductivity, the best fitting cases were 0.25 (overall DEV 7.81% as per Equation (2)) and 0.30 (overall DEV 7.80%). Table 5 and Table 6 report, respectively, the detailed variations for each thermocouple. It can be noted that Test C reports different values for sensor 7, this can be attributed to the different shapes of the dry-ice utilized for the test if compared with the other, as already described in Section 2.

Table 5.
Experimental test cases and results (Thermal conductivity 0.25 W m−1 K−1).

Table 6.
Experimental test cases and results (Thermal conductivity 0.30 W m−1 K−1).
The deviation has been evaluated according to Equation (2):
where Tp is the temperature predicted in the numerical model at the corresponding sensor location, Texp is the registered temperature, Tmax,exp and Tmin,exp are the maximum and minimum temperatures measured in each test case.
5. Discussion
In this work, a new experimental setup for the evaluation of the impact of solid CO2 deposition on the ground has been built. The setup has been equipped with several thermocouples to measure the temperature variations during the sublimation of the dry-ice. The sensors have been positioned at different layers below the surface as well as in contact with the block itself. Four tests have been developed for consistency and repeatability and the results have been compared with a numerical thermal model using commercial software as described in Section 3. The numerical model results were in good agreement with the experimental measurements, major deviations from the results have been registered for sensors number 7 (−33.87%/−39.45%) and 12 (−20.69%/−23.47%). The main limitations of this work are related to the position of sensors number 12 and 2, indeed due to operative reasons, they were not positioned at the same distance from the dry-ice sample, which caused a difference in the measured values of the temperature as reported in Table 5 and Table 6. Finally, the overall heat transfer coefficient and the heat transfer flux resulted to be very sensitive to the dry-ice conductivity. For this reason, following a literature review, several values have been tested in the range of 0.05 (W m−1 K−1) and 0.30 (W m−1 K−1) to achieve the best match with the experimental data and provide a more accurate correlation. The overall heat transfer coefficient U (W m−2 k−1) that gives the best fitting of the experimental results is within 85.56–86.35 W m−2 K−1. The value could be potentially utilized for the estimation of the heat transfer between the dry-ice and the soil under similar conditions. In this work a first approach for the evaluation of this phenomenon has been presented; further improvement can be made both with the performing of more experimental tests as well as other test case under with different conditions (weight, type of soil and number of sensors).
Supplementary Materials
The experimental data measured in this work with temperature sensors is available online at: https://www.mdpi.com/article/10.3390/en16020987/s1.
Author Contributions
Conceptualization, M.V. and G.B.; methodology, M.V.; investigation, M.V.; resources, F.C.; data curation, M.V. and G.B.; writing—original draft preparation, M.V.; writing—review and editing, M.V. and G.B; supervision, F.C. and B.M.; project administration, F.C. and B.M.; funding acquisition, F.C. and B.M. All authors have read and agreed to the published version of the manuscript.
Funding
This research received no external funding.
Data Availability Statement
The data presented in this study are available in the Supplementary Materials of this manuscript.
Conflicts of Interest
The authors declare no conflict of interest.
References
- Arias, P.; Bellouin, N.; Coppola, E.; Jones, R.; Krinner, G.; Marotzke, J.; Naik, V.; Palmer, M.; Plattner, G.-K.; Rogelj, J. Climate Change 2021: The Physical Science Basis. In Proceedings of the Contribution of Working Group14 I to the Sixth Assessment Report of the Intergovernmental Panel on Climate Change, Technical Summary, Weßling, Germany, 8–26 July 2021. [Google Scholar]
- IEA. Energy Technology Perspectives 2020—Special Report on Carbon Capture Utilisation and Storage; OECD Publishing: Paris, France, 2020. [Google Scholar] [CrossRef]
- International Energy Agency. Transforming Industry through CCUS; OECD Publishing: Paris, France, 2019. [Google Scholar] [CrossRef]
- Vitali, M.; Corvaro, F.; Marchetti, B.; Terenzi, A. Thermodynamic challenges for CO2 pipelines design: A critical review on the effects of impurities, water content, and low temperature. Int. J. Greenh. Gas Control 2022, 114, 103605. [Google Scholar] [CrossRef]
- Lee, U.; Lim, Y.; Lee, S.; Jung, J.; Han, C. CO2 Storage Terminal for Ship Transportation. Ind. Eng. Chem. Res. 2012, 51, 389–397. [Google Scholar] [CrossRef]
- Bjerketvedt, V.S.; Tomasgard, A.; Roussanaly, S. Deploying a Shipping Infrastructure to Enable Carbon Cap-ture and Storage from Norwegian Industries. J. Clean. Prod. 2022, 333, 129586. [Google Scholar] [CrossRef]
- Compressed Gas Association. Carbon Dioxide & Dry Ice Fact Sheet; Compressed Gas Association: Chantilly, VA, USA, 2022. [Google Scholar]
- Wang, C.; Li, Y.; Teng, L.; Gu, S.; Hu, Q.; Zhang, D.; Ye, X.; Wang, J. Experimental study on dispersion behavior during the leakage of high pressure CO2 pipelines. Exp. Therm. Fluid Sci. 2019, 105, 77–84. [Google Scholar] [CrossRef]
- Fan, X.; Wang, Y.; Zhou, Y.; Chen, J.; Huang, Y.; Wang, J. Experimental study of supercritical CO2 leakage behavior from pressurized vessels. Energy 2018, 150, 342–350. [Google Scholar] [CrossRef]
- Mazzoldi, A.; Hill, T.; Colls, J.J. CO2 transportation for carbon capture and storage: Sublimation of carbon dioxide from a dry ice bank. Int. J. Greenh. Gas Control 2008, 2, 210–218. [Google Scholar] [CrossRef]
- Vianello, C.; Mocellin, P.; Maschioa, G. Study of Formation, Sublimation and Deposition of Dry Ice from Carbon Capture and Storage Pipelines. Chem. Eng. 2014, 36, 613–618. [Google Scholar]
- Mocellin, P.; Carboni, M.; Pio, G.; Vianello, C.; Salzano, E. Investigation of Sublimating Dry-Ice Bank due to Accidental Release in the Framework of CCS Risk Analysis. Chem. Eng. Trans. 2022, 90, 193–198. [Google Scholar]
- Feliu, J.A.; Manzulli, M.; Alós, M.A. Determination of Dry-Ice Formation during the Depressurization of a CO2 Re-Injection System. In Cutting-Edge Technology for Carbon Capture, Utilization, and Storage; John Wiley & Sons, Inc.: Hoboken, NJ, USA, 2018; pp. 135–146. [Google Scholar]
- Vitali, M.; Zuliani, C.; Corvaro, F.; Marchetti, B.; Terenzi, A.; Tallone, F. Risks and Safety of CO2 Transport via Pipeline: A Review of Risk Analysis and Modeling Approaches for Accidental Releases. Energies 2021, 14, 4601. [Google Scholar] [CrossRef]
- Vitali, M.; Zuliani, C.; Corvaro, F.; Marchetti, B.; Tallone, F. Statistical analysis of incidents on onshore CO2 pipelines based on PHMSA database. J. Loss Prev. Process. Ind. 2022, 77, 104799. [Google Scholar] [CrossRef]
- Mocellin, P.; Vianello, C.; Maschio, G. Carbon Capture and Storage Hazard Investigation: Numerical Analy-sis of Hazards Related to Dry Ice Bank Sublimation Following Accidental Carbon Dioxide Releases. Chem. Eng. Trans. 2015, 43, 1892–1902. [Google Scholar]
- d’Amore, F.; Mocellin, P.; Vianello, C.; Maschio, G.; Bezzo, F. Economic Optimisation of European Supply Chains for CO2 Capture, Transport and Sequestration, including Societal Risk Analysis and Risk Mitigation Measures. Appl. Energy 2018, 223, 401–415. [Google Scholar] [CrossRef]
- Baxter, P.J.; Kapila, M.; Mfonfu, D. Lake Nyos Disaster, Cameroon, 1986: The Medical Effects of Large Scale Emission of Carbon Dioxide? Br. Med. J. 1989, 298, 1437–1441. [Google Scholar] [CrossRef] [PubMed]
- Ahmad, M.; Lowesmith, B.; De Koeijer, G.; Nilsen, S.; Tonda, H.; Spinelli, C.; Cooper, R.; Clausen, S.; Mendes, R.; Florisson, O. COSHER joint industry project: Large scale pipeline rupture tests to study CO2 release and dispersion. Int. J. Greenh. Gas Control 2015, 37, 340–353. [Google Scholar] [CrossRef]
- Godbole, A.; Liu, X.; Michal, G.; Davis, B.; Lu, C.; Armstrong, K.; Medina, C.H. Atmospheric Dispersion of CO2 Following Full-Scale Burst Tests. In Proceedings of the 14th Greenhouse Gas Control Technologies Conference, Melbourne, Australia, 21–26 October 2018. [Google Scholar]
- Gant, S.; Narasimhamurthy, V.; Skjold, T.; Jamois, D.; Proust, C. Evaluation of multi-phase atmospheric dispersion models for application to Carbon Capture and Storage. J. Loss Prev. Process. Ind. 2014, 32, 286–298. [Google Scholar] [CrossRef]
- Zegart, D. The Gassing of Satartia. Huffington Post. 2021. Available online: https://www.huffpost.com/entry/gassing-satartia-mississippi-co2-pipeline_n_60ddea9fe4b0ddef8b0ddc8f (accessed on 20 November 2022).
- Agilent. Agilent 34970A—Data Acquisition Unit Switch Manual Agilent Technologies; Agilent Technologies: Santa Clara, CA, USA, 2003. [Google Scholar]
- ANSYS, Inc. ANSYS CFX-Fluent 14.0 Theory Guide; ANSYS, Inc.: Canonsburg, PA, USA, 2011. [Google Scholar]
- Nikolaev, P.; Sedighi, M.; Rajabi, H.; Pankratenko, A. Artificial ground freezing by solid carbon dioxide—Analysis of thermal performance. Tunn. Undergr. Space Technol. 2022, 130, 104741. [Google Scholar] [CrossRef]
Disclaimer/Publisher’s Note: The statements, opinions and data contained in all publications are solely those of the individual author(s) and contributor(s) and not of MDPI and/or the editor(s). MDPI and/or the editor(s) disclaim responsibility for any injury to people or property resulting from any ideas, methods, instructions or products referred to in the content. |
© 2023 by the authors. Licensee MDPI, Basel, Switzerland. This article is an open access article distributed under the terms and conditions of the Creative Commons Attribution (CC BY) license (https://creativecommons.org/licenses/by/4.0/).