Article

The Impact of the Urban Heat Island on the Sensation of Thermal Comfort and Electricity Consumption in Sfax in Central-Eastern Tunisia during the Hot Season

1
SYFACTE Laboratory, Department of Geography, Faculty of Arts and Humanities, University of Sfax, Sfax 3038, Tunisia
2
UMR PRODIG UMR 8586, Department of Geography, Faculty of Science and Humanities, Université Paris Cité, 75006 Paris, France
*
Author to whom correspondence should be addressed.
Energies 2023, 16(2), 911; https://doi.org/10.3390/en16020911
Submission received: 6 December 2022 / Revised: 4 January 2023 / Accepted: 9 January 2023 / Published: 13 January 2023

Abstract

:

Highlights

What are the main findings?
  • The calculated HI, UTCI and THW indices show that thermal difference between the city center and the peri-urban area is greater in terms of perceived temperatures (thermal comfort indices) than in terms of air temperatures (UHI) at night in summer, especially during the heat wave period.
  • A correlation between temperature distribution and electrical energy consumption was found. In fact, During the hot period, the overconsumption of electricity can reach 400% in the downtown area.
What is the implication of the main finding?
  • The improvement of thermal comfort is possible by promoting natural ventilation.
  • reducing the UHI would reduce the consumption of electrical energy in summer.

Abstract

This study follows on from the work on the urban climate of Sfax and its energy repercussions. The spatial configuration of the urban heat island (UHI) and the spatial distribution of the thermal comfort indices, the heat index (HI), the universal thermal climate index (UTCI) and the temperature humidity wind index (THW), resulting from the car survey method, essentially show the impact of land use and the distance from the coastline on the spatial distribution of air temperatures. A maximum difference of 7 °C between the city centre and the countryside is measured in very hot summer weather. During the night phase, the apparent temperatures are oppressive, particularly in the city centre, where HI and THW comfort indices exceeding 40 °C were calculated. Compared to the HI and UTCI, the THW demonstrates a much stronger variation due to the influence of wind between open areas and the downtown area. The intensity of thermal discomfort decreases as one moves towards the rural area (−15 °C compared to the centre), hence the impact on the consumption of electrical energy dedicated to air conditioning. The central part is the most energy-intensive area compared to the peripheral areas, especially during hot days when the use of air conditioners becomes constant, day and night.

Graphical Abstract

1. Introduction

At night in the city, the temperatures observed in dense areas are significantly higher compared to surrounding suburban and rural areas [1,2,3,4]. This variability is attributable to the formation of a UHI above the built-up areas [5,6,7,8,9]. The urban microclimate influences thermal comfort [10,11]. Consequently, contrasting thermal comfort indices are observed in the same conurbation. The suburbs, which are more vegetated, are cooler and more ventilated, in contrast to the downtown, where the sensation of comfort deteriorates, particularly during periods of high heat, leading to excessive use of electric air conditioning [12,13,14,15,16,17]. The urban heat island and its energy impact on residential buildings has been demonstrated in the Mediterranean climate such as in Barcelona [18], in many European cities [19], in Sydney [20] and in Hong Kong [21]. Vegetation, via shading and the evapotranspiration function, improve thermal comfort in the urban environment and can reduce energy demand [22,23,24]. The UHI poses a major problem during hot periods of the year and may have health and bioclimatic consequences [25]. The pressure on electric air conditioning is systematically higher in the densest and least ventilated central areas [15,26,27,28,29,30].
In the current context of global warming, heat waves have become more frequent, as is the case in the Mediterranean [31]. The southern shore of the Mediterranean seems to be more vulnerable to high heat because it is more intense and longer. Similarly, the capacity to adapt to extreme climatic phenomena is weaker in the southern countries due to the low socio-economic status of the population. The health impacts of high heat are greatest in large cities where the impact of the UHI is greater [32,33,34]. Many researches have studied microclimatic variation in thermal comfort at night in Mediterranean cities [35,36]. In fact, clear sky conditions are very frequent during the summer and favor the strong spatial variability of temperatures and thermal comfort.
This study focuses on the agglomeration of Sfax (middle-eastern Tunisia; 600,000 inhabitants). The UHI is well documented [37,38,39], and studies dealing with thermal comfort conditions in outdoor areas do exist. In contrast, the issue of the impacts of high heat on the consumption of electrical energy dedicated to air conditioning has never been studied in depth. Innovatively, this paper compares the spatial distribution of air temperatures (UHI phenomenon) to three thermal comfort indices (HI, UTCI and THW) in summer, at night.
First, the present work aims to demonstrate the main thermal characteristics of the UHI in the conurbation of Sfax. Second, we intend to study the variability in the thermal comfort indices in the conurbation in order to finally examine and understand the impact of the climate of the city of Sfax on both the sensation of comfort and the consumption of electrical energy dedicated to air conditioning during the hot season.

2. Study Area, Data and Methods

2.1. Study Area

The conurbation of Sfax, located in the centre-east of Tunisia at 34°50′ N and 10° E, opens onto the Mediterranean to the east. It has about 600,000 inhabitants and is considered by its economic and demographic weight as the second urban centre in Tunisia. Its weak and isotropic topography as well as its Mediterranean climate, which is dry and stable throughout the summer, favor radiative and thermal phenomena such as the sea breeze and the UHI. In the current context of climate change, summers are becoming hotter and hotter, as in 2021 and 2022. Hence the interest of this study in this agglomeration where heat waves accentuate the use of air conditioners
Based on the types of land use, the density of the built-up area and the types of housing, the urban space of Sfax can be divided into three large areas: the first area (A) occupies the central part of the conurbation over a radius of 4 km. This central zone, very dense and highly artificialized, is characterized by vertical structures. The second area (B) is less dense than the first. It is located between 4 and 8 km from the city centre and corresponds to the suburban area. Individual houses with small gardens are the main type of housing. The last area (C) is located between 8 and 12 km from the city centre and corresponds to the most open and vegetated areas of the conurbation. Except for a few small, sparsely populated working-class neighborhoods located 12 km from the town centre, such as “El Awabed” on the road to Gremda, “El Karama” on the road to El Ain and ”El Khazzanet” on the road to Menzel Chaker (Figure 1), the dwellings in this area, which are adjacent to the almond and olive tree fields, are scattered.

2.2. Meteorological Data

Temperatures and relative air humidity are measured at a height of 2 m from the ground by a reliable thermo-hygrometric sensor of the “Testo 665” type with an accuracy of 0.2 °C and a resolution of 0.1 °C for the temperature and 0.1% for the relative air humidity. These data were obtained from 16 mobile survey campaigns, carried out in the summer between 12 a.m. and 2 a.m. (local time). These campaigns, carried out in radiative weather, were conducted in cars driving at an average speed of 35 km/h. The mobile surveys were performed on 7 transects (A, B, C, D, E, F and G) crossing all the urban areas of the conurbation of Sfax, in all directions (north, west and south) (Figure 1) and were repeated at least three times. We used the temperatures and air humidity recorded by the weather station of the Sfax–Thyna airport, belonging to the network of the Institut National de la Météorologie (INM), to calculate the “Heat Index” for 38 weeks between 2019 and 2020; i.e., 19 weeks between 6 May and 15 September 2019 (133 days) and 19 weeks from 28 June to 7 November 2020 (133 days).
The heat index (HI) and the temperature humidity wind (THW) index were also calculated using data from the mobile survey campaigns carried out on transects A, B, C and E in radiative weather (clear skies and wind speed ≤ 3 m/s), during which the thermal contrasts observed at the scale of the conurbation were essentially due to factors of urbanization, land use and distance from the coastline. The wind speed was determined in the central (A), peripheral (B) and suburban (C) areas from the observations of a network of fixed meteorological stations of the “Davis” type installed in the region of Sfax (urban, peri-urban and rural areas) between 2005 and 2017 within the framework of the studies conducted and directed by Professor Salem Dahech. The heat index (HI), is a simple thermo-hygrometrical index developed by NOAA (1985). It is based on air temperature and humidity and conceptually similar to apparent temperature, also known as humidex [36]. It was calculated, in this work, using an automatic calculator (web reference 1).
The calculation of the THW index is based on the HI and the wind speed according to the following formula (Equation (1)):
THW = HI − (1.072 ∗ W)
HI is the heat index in degrees Fahrenheit, and W is the wind speed in miles/hour. The results obtained in degrees Fahrenheit are then converted to degrees Celsius. It should be remembered that this index was developed by Steadman (1979) [40].
In addition, the UTCI is defined as “the isothermal air temperature of the reference condition that would elicit the same dynamic response (strain) of the physiological model” than the actual environment [41]. It was calculated to better measure and estimate the human physiological response to the thermal environment [42,43,44,45]. The UTCI, created by the International Society of Biometeorology in 2009, was developed by an international multidisciplinary team (web reference 2) as a universal outdoor indicator that can be used in any cities, for all seasons and for different applications [41,46]. To calculate UTCI, four variables are used: air temperature, relative humidity (measured at 2 m above the ground), wind speed at 10 m above the ground and mean radiant temperature (MRT) [42,47,48,49]. The last one is more complicated than air temperature but is a very significant factor because it recaps the radiant fluxes of the environment and it is a necessary parameter for the estimation of human thermal comfort [50,51]. MRT is calculated in this work by RayMan Pro software.
RayMan is one of the most successful models in urban biometeorology and has been applied in many studies all around the world [36,52,53,54]. Numerous validation studies have proven that RayMan has good precision in approximating MRT [55]. “The models main advantage is the low computational effort, as well as the good usability” [56,57,58,59,60]. To calculate MRT, this model uses air temperature, relative humidity, wind velocity, cloud cover and surface temperature. The last parameter was recorded during a car survey by Testo 875-1 infrared camera.
The UTCI was calculated using an automatic calculator. The results obtained are consistent with those from the RayMan Pro (Appendix A).

2.3. Data on Electrical Energy Consumption

To track the consumption of electrical energy in the conurbation of Sfax, we used the data provided by the STEG (Tunisian Company of Electricity and Gas). We collected the indexes of 500 single-phase meters (dedicated and adapted to household use) in May and August 2018. The samples were distributed over almost the entire conurbation as follows: 250 m in the central area (A), 150 m in the peripheral areas (B) and 100 m in the suburban area (C), in proportion to the urban density of each area. From the data collected, we calculated the average monthly consumption for the months of May, during which temperatures are generally moderate, and August, which is the hottest month in Sfax. In addition, in order to better study the impact of air conditioning during the hot season on the consumption of electrical energy in the residential sector, we opted for a participatory study involving 54 households. We collected completed forms every Sunday during the spring and summer of 2019 and the summer and autumn of 2020. In addition to the indexes, we asked our volunteers, in case they temporarily left their homes, to note the number of days they were away in order to adjust the calculation of weekly consumption averages according to this potential factor. Subsequently, these weekly consumption data for 38 weeks between 2019 and 2020, i.e., from 06 May to 15 September 2019 and from 28 June to 7 November 2020, enabled us to study the combined evolution of electrical energy consumption and temperature, using the reliable records of the INM, and to detect consumption peaks linked mainly to intense heat.
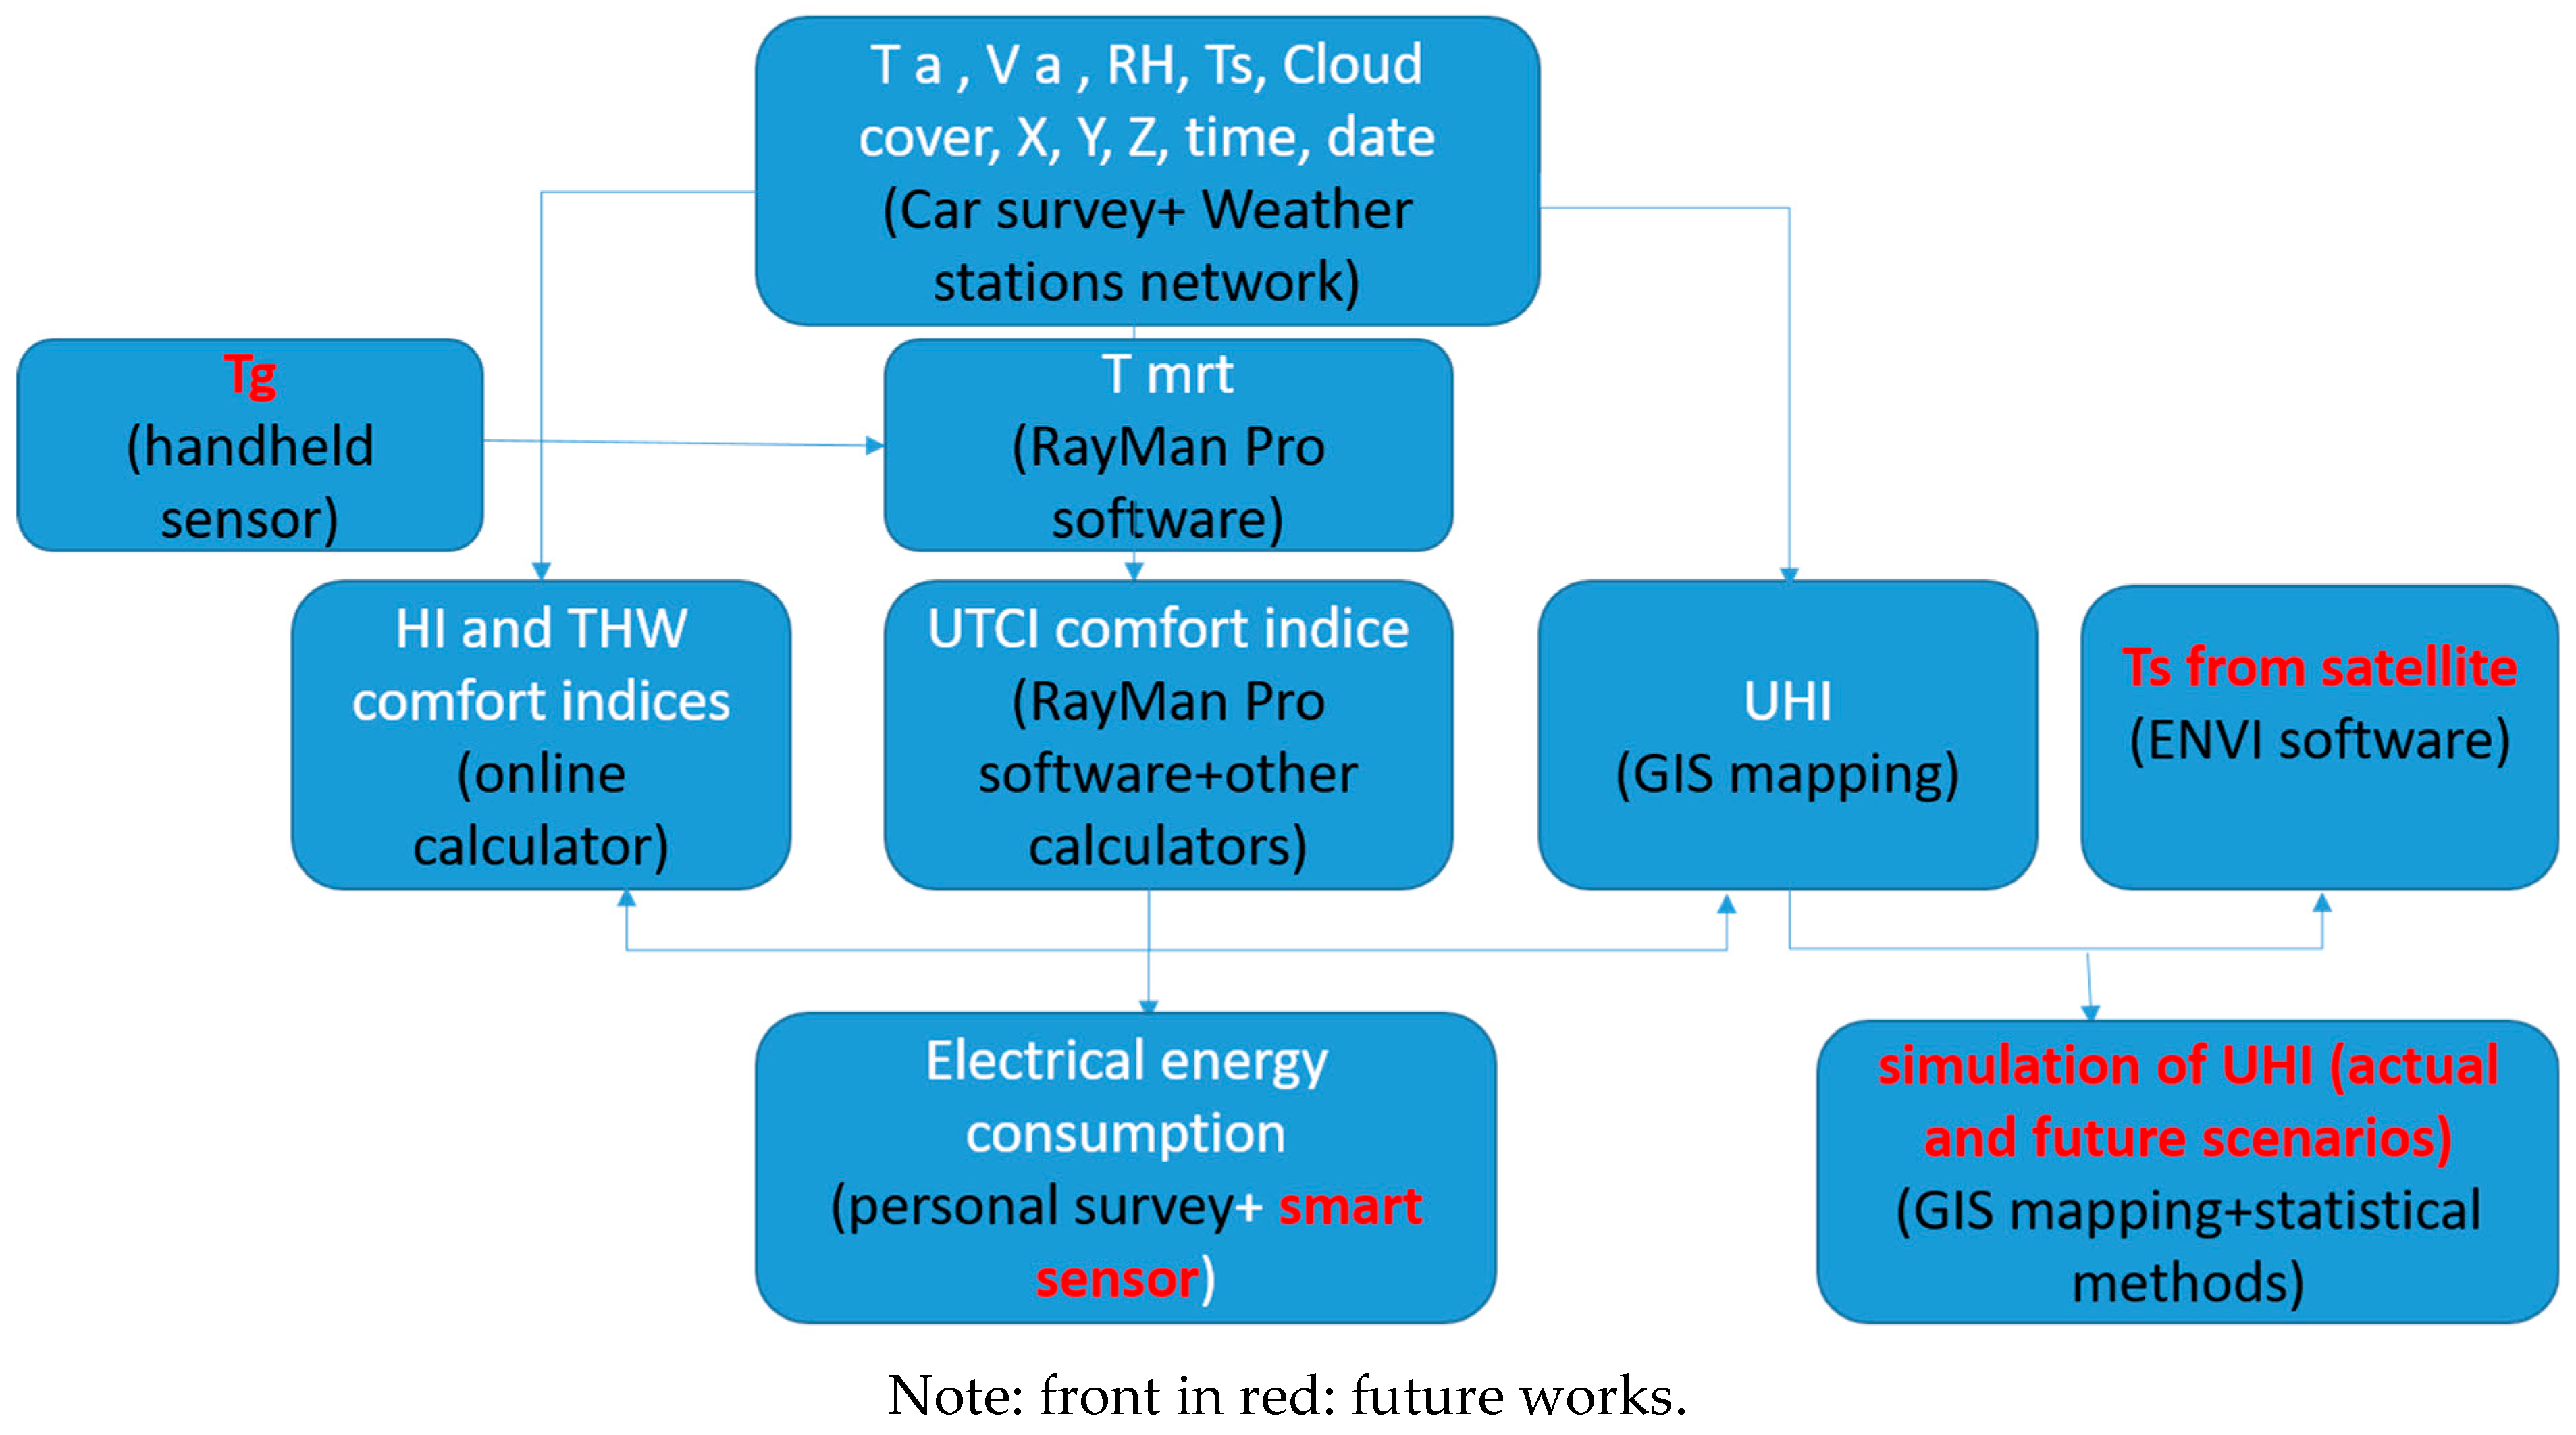
In the Appendix A, flowchart summarizes the data and methods used in this paper.

3. Results

3.1. Urban Heat Island in Sfax: Main Thermal Aspects in the Conurbation

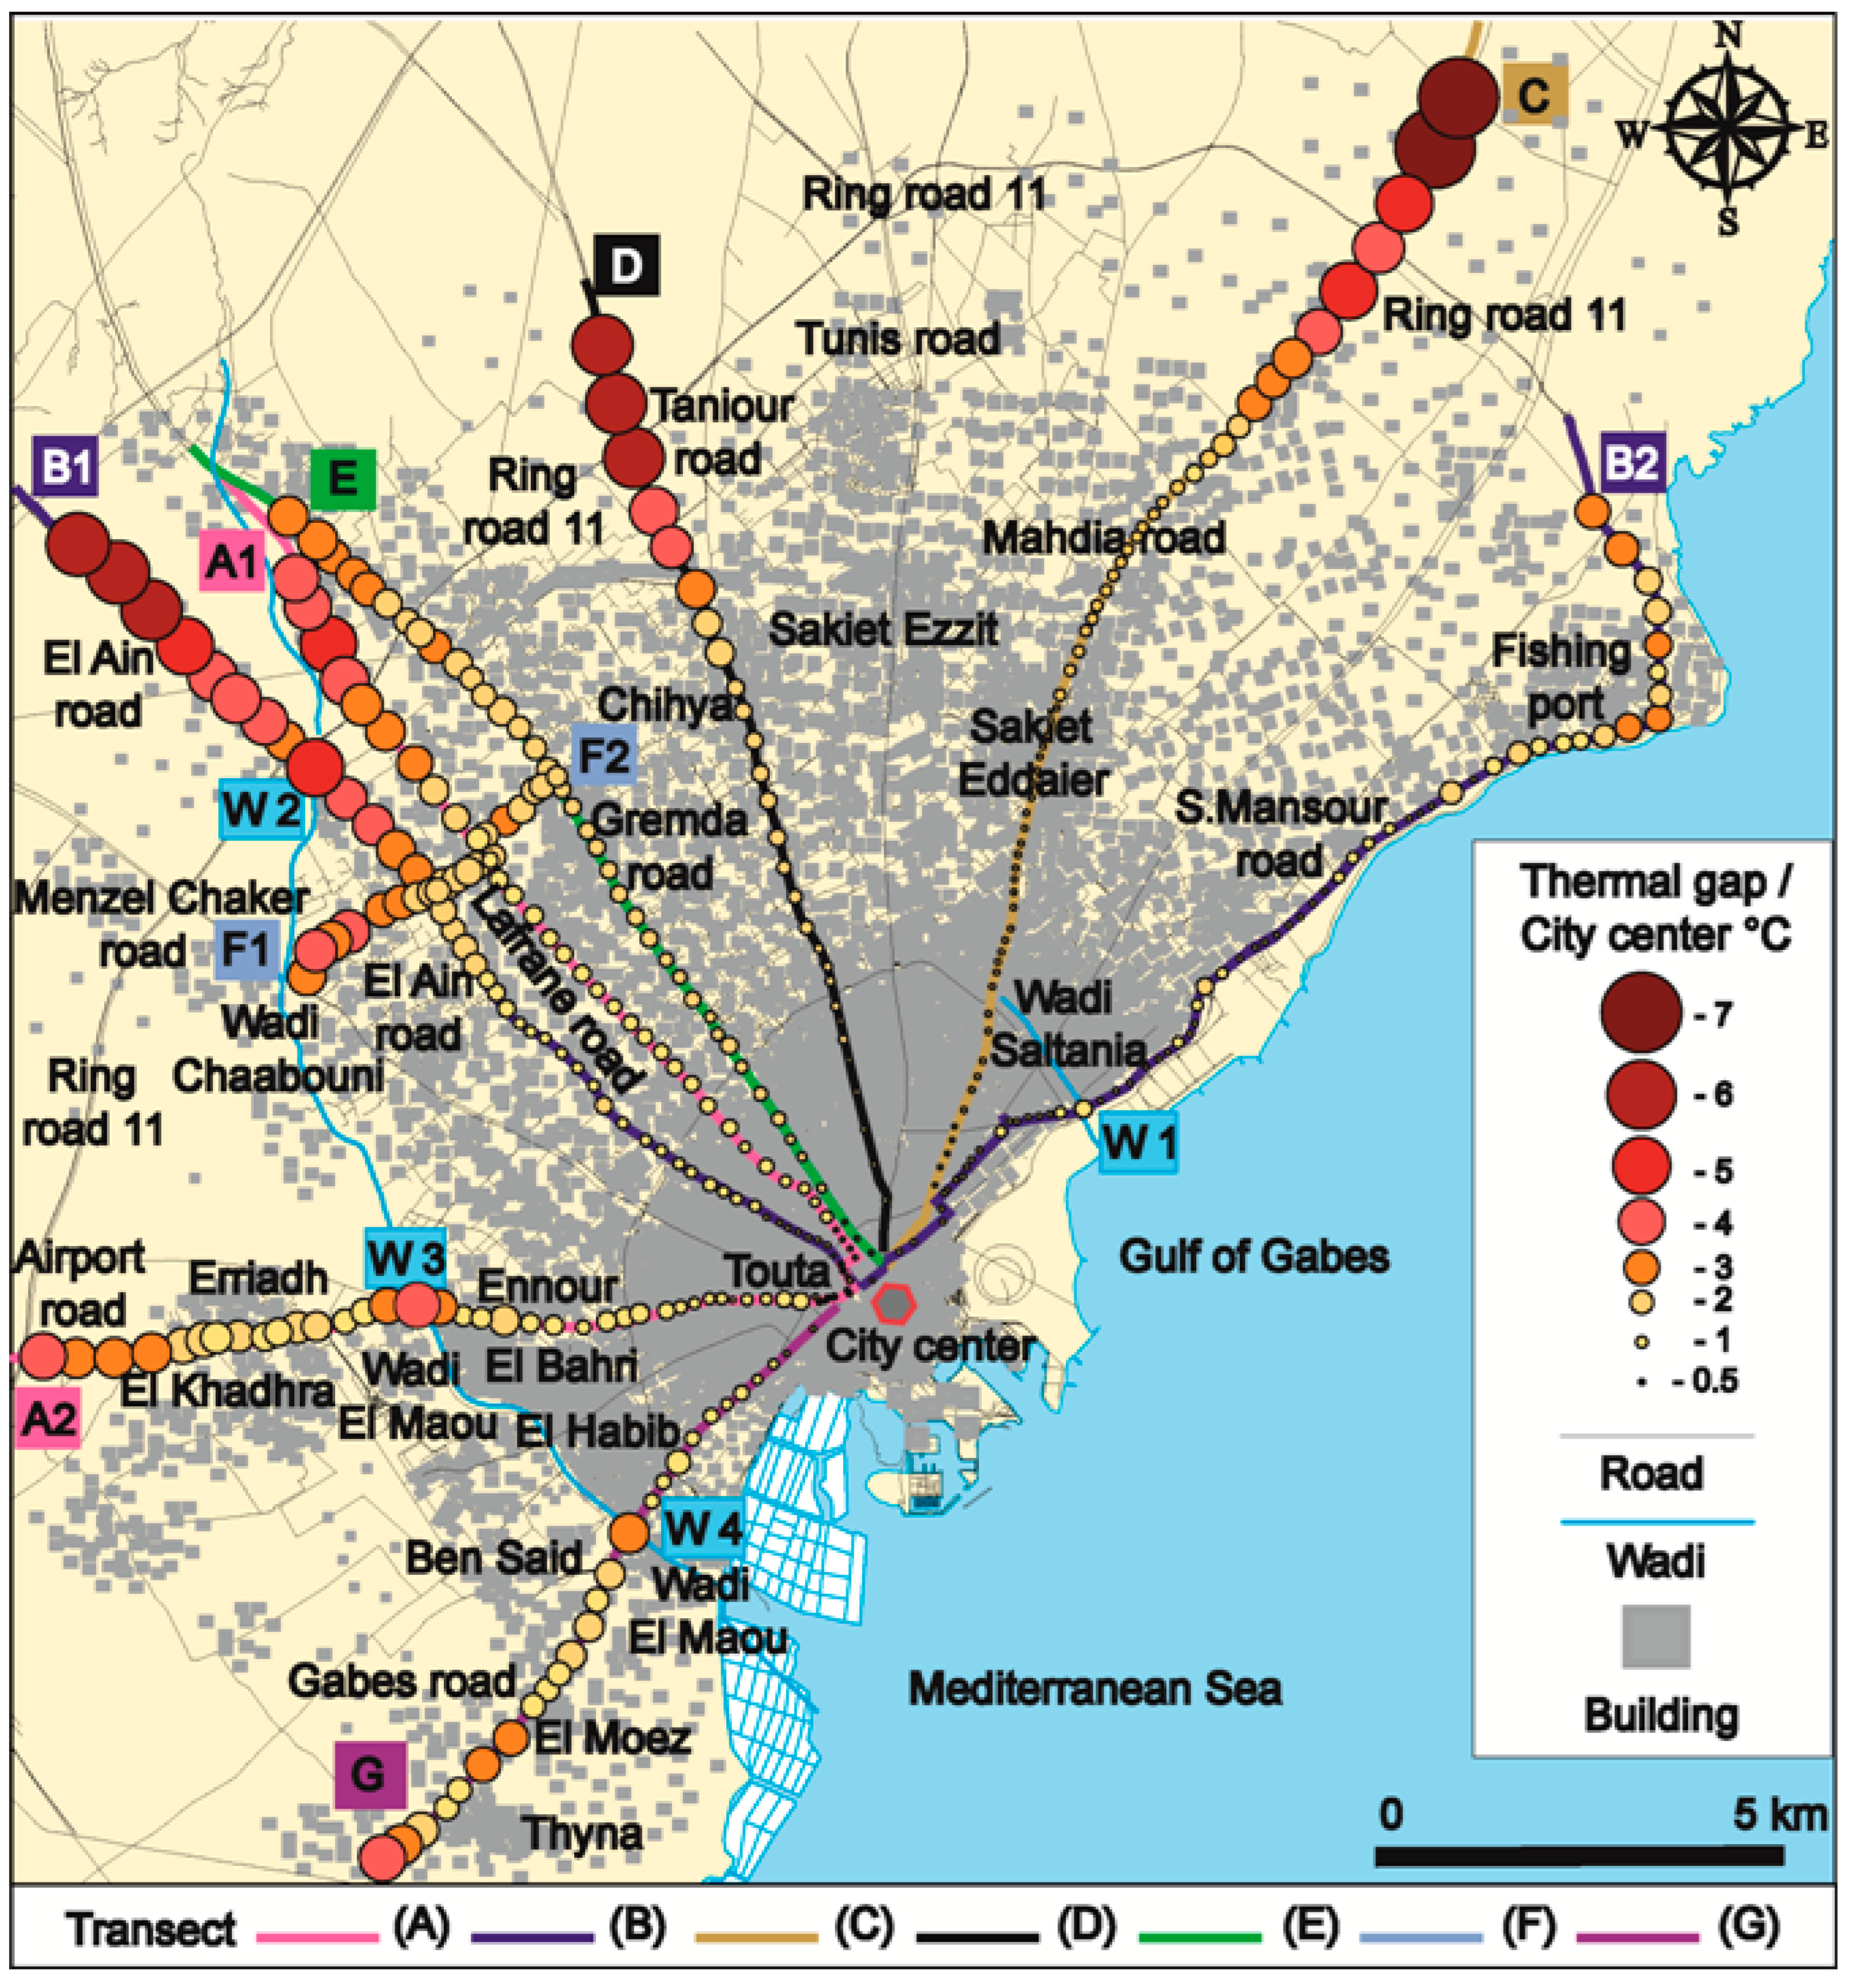
Generally speaking, in the conurbation of Sfax, during calm and clear nights, the temperatures depend on the density of the built-up area, the nature of the substrate, the anthropic pressure and the distance from the city centre. In fact, during the night, the densely built-up city centre is always warmer than its less dense and sometimes vegetated surroundings, particularly in the peripheral tentacles and suburbs furthest from the coast, especially the peripheral areas located between the Mahdia road to the north of the city centre (transect C) and the Gabès road to the south of the conurbation (transect G), passing through the areas of Taniour (transect D), Gremda (transect E), Lafrane (transect A1) and El Ain (transect B1) to the west and the airport road southwest of the city centre (transect A2) (Figure 2). As one moves away from the city centre towards the periphery, the air temperatures progressively decrease to reach significant differences compared to the centre, particularly from the areas bordering Ring Road 11 (a transverse road, bypassing the conurbation, located about 10 km from the city centre). For example, during very hot summer weather, with a Saharan flow coming from the south, we measured a difference of 7 °C between the city centre and the open areas near Ring Road 11 on the road to Mahdia (transect C) on 3 August 2020 between 12 a.m. and 1 a.m. (local time). However, in good summer weather, with a sea breeze, differences of 4 to 6 °C were calculated between the warmer central part and the suburbs located near the roads of Taniour (transect D), Lafrane (transect A1), El Ain (transect B1), the airport (transect A2) and Gabes (transect G) (Figure 2). This contrast was less significant at the level of the Gremda road (transect E), characterized by a high density all along the radial roads up to 13 km from the Medina, where the average difference observed compared to the city centre was about 3 °C (Figure 2).
Contrary to the areas located more or less far from the coastline, the difference between the city centre and the periphery was weak or even non-existent all along the coastal fringe. In this context, a survey campaign (transect B) was conducted simultaneously, between 12 a.m. and 1 a.m., on axes B1 (El Ain road) and B2 (Sidi Mansour road) (transect B, Figure 1) in order to study the impact of the sea on the air temperatures by carrying out joint surveys in the areas adjacent to the sea (B2 axis) and surfaces located on the road of El Ain (B1), representing the central axis of the conurbation, which is the radial road furthest from the coastline. At the level of transect B, a thermal difference between the centre and the periphery of about 6 °C was calculated on axis B1, while on axis B2 the difference was near-zero up to 10 km from the centre (Figure 2). The sea has a strong thermal inertia, which significantly reduces nighttime cooling. Away from the coast, vegetation and land breezes accelerate the cooling at night. Furthermore, on all the radial roads, except for the coastal axis (B2) on the Sidi Mansour road, heading towards the peripheral areas, the thermal difference compared to the centre of the conurbation remains insignificant or even weak up to 7 km and sometimes 8 km from the medina (historical centre built in the middle of the city). This is probably due to the accelerated sprawl of the city, the constant densification of the areas bordering the radial roads and the extension of the built-up areas, particularly in recent years, leading to the expansion of the hot surface and obviously to the decrease in the gap between the central areas and the periphery [39]. The excessive use of air conditioning in this dense part of the city is among the factors that explain the high and homogeneous values. The increased densification of the interradial space gives rise to micro heat islands, which result in sometimes significant differences between the most densely built areas and their open and often vegetated surroundings. A maximum difference of 3 °C was calculated between the dense areas and the most open areas in the interradial zones located between points F1 and F2, 8 km from the city centre and 10 km from the coastline (transect F); this attests to the strong impact of urbanization on the distribution of temperatures (Figure 2).
Moreover, at the scale of the conurbation, significant decreases in temperature are observed as a result of the coolness that arises each time clearings and vegetated areas are encountered. For example, at the level of the airport road (transect A, axis A2), significant decreases of about 2 °C were observed around the Touta urban park compared to its artificial surroundings (Figure 2). Actually, Wadi El Agareb, partially covered with trees, which runs along the airport road up to 4 km from the city centre, largely explains the temperature decreases observed at the level of this radial in comparison to the central area (transect A2), under the combined effect of the topography (undulating) and the vegetation (Figure 2).
Similarly, significant decreases were recorded next to other wadis crossing the conurbation, at the level of the roads of Sidi Mansour (transect B2, WadiSaltania W1), El Ain (transect B1, Wadi El Ain W2) and Wadi El Maou, which passes by the roads of the airport (transect A2, W3) and Gabes (transect G, W4). The most significant decreases were recorded next to Wadi El Ain (W2) and Wadi El Maou (W3) (Figure 2). Passing through Wadi El Ain talweg (transect B1), at the level of point W2, surrounded by generally open areas adjacent to Ring Road 11, the thermal difference observed compared to the city centre reached 5 °C (Figure 2). Similarly, at the level of the bridge crossing Wadi El Maou (point W3), which is densely vegetated and located about 5 km from the Medina on the airport road (axis A2), we calculated differences of about −2.5°C in comparison to the neighboring built-up areas and −4 °C in comparison to the city centre (Figure 2).

3.2. Thermal Comfort Indices: Spatial and Temporal Variations According to Weather Type

The HI, UTCI and THW comfort indices, calculated based on the repeated mobile survey campaigns covering the whole of the conurbation of Sfax and conducted in all directions, indicate that the temperatures felt in the city of Sfax vary essentially according to the urban density, the distance from the coastline and the type of weather (Figure 3).

3.2.1. Breezy Summer Weather

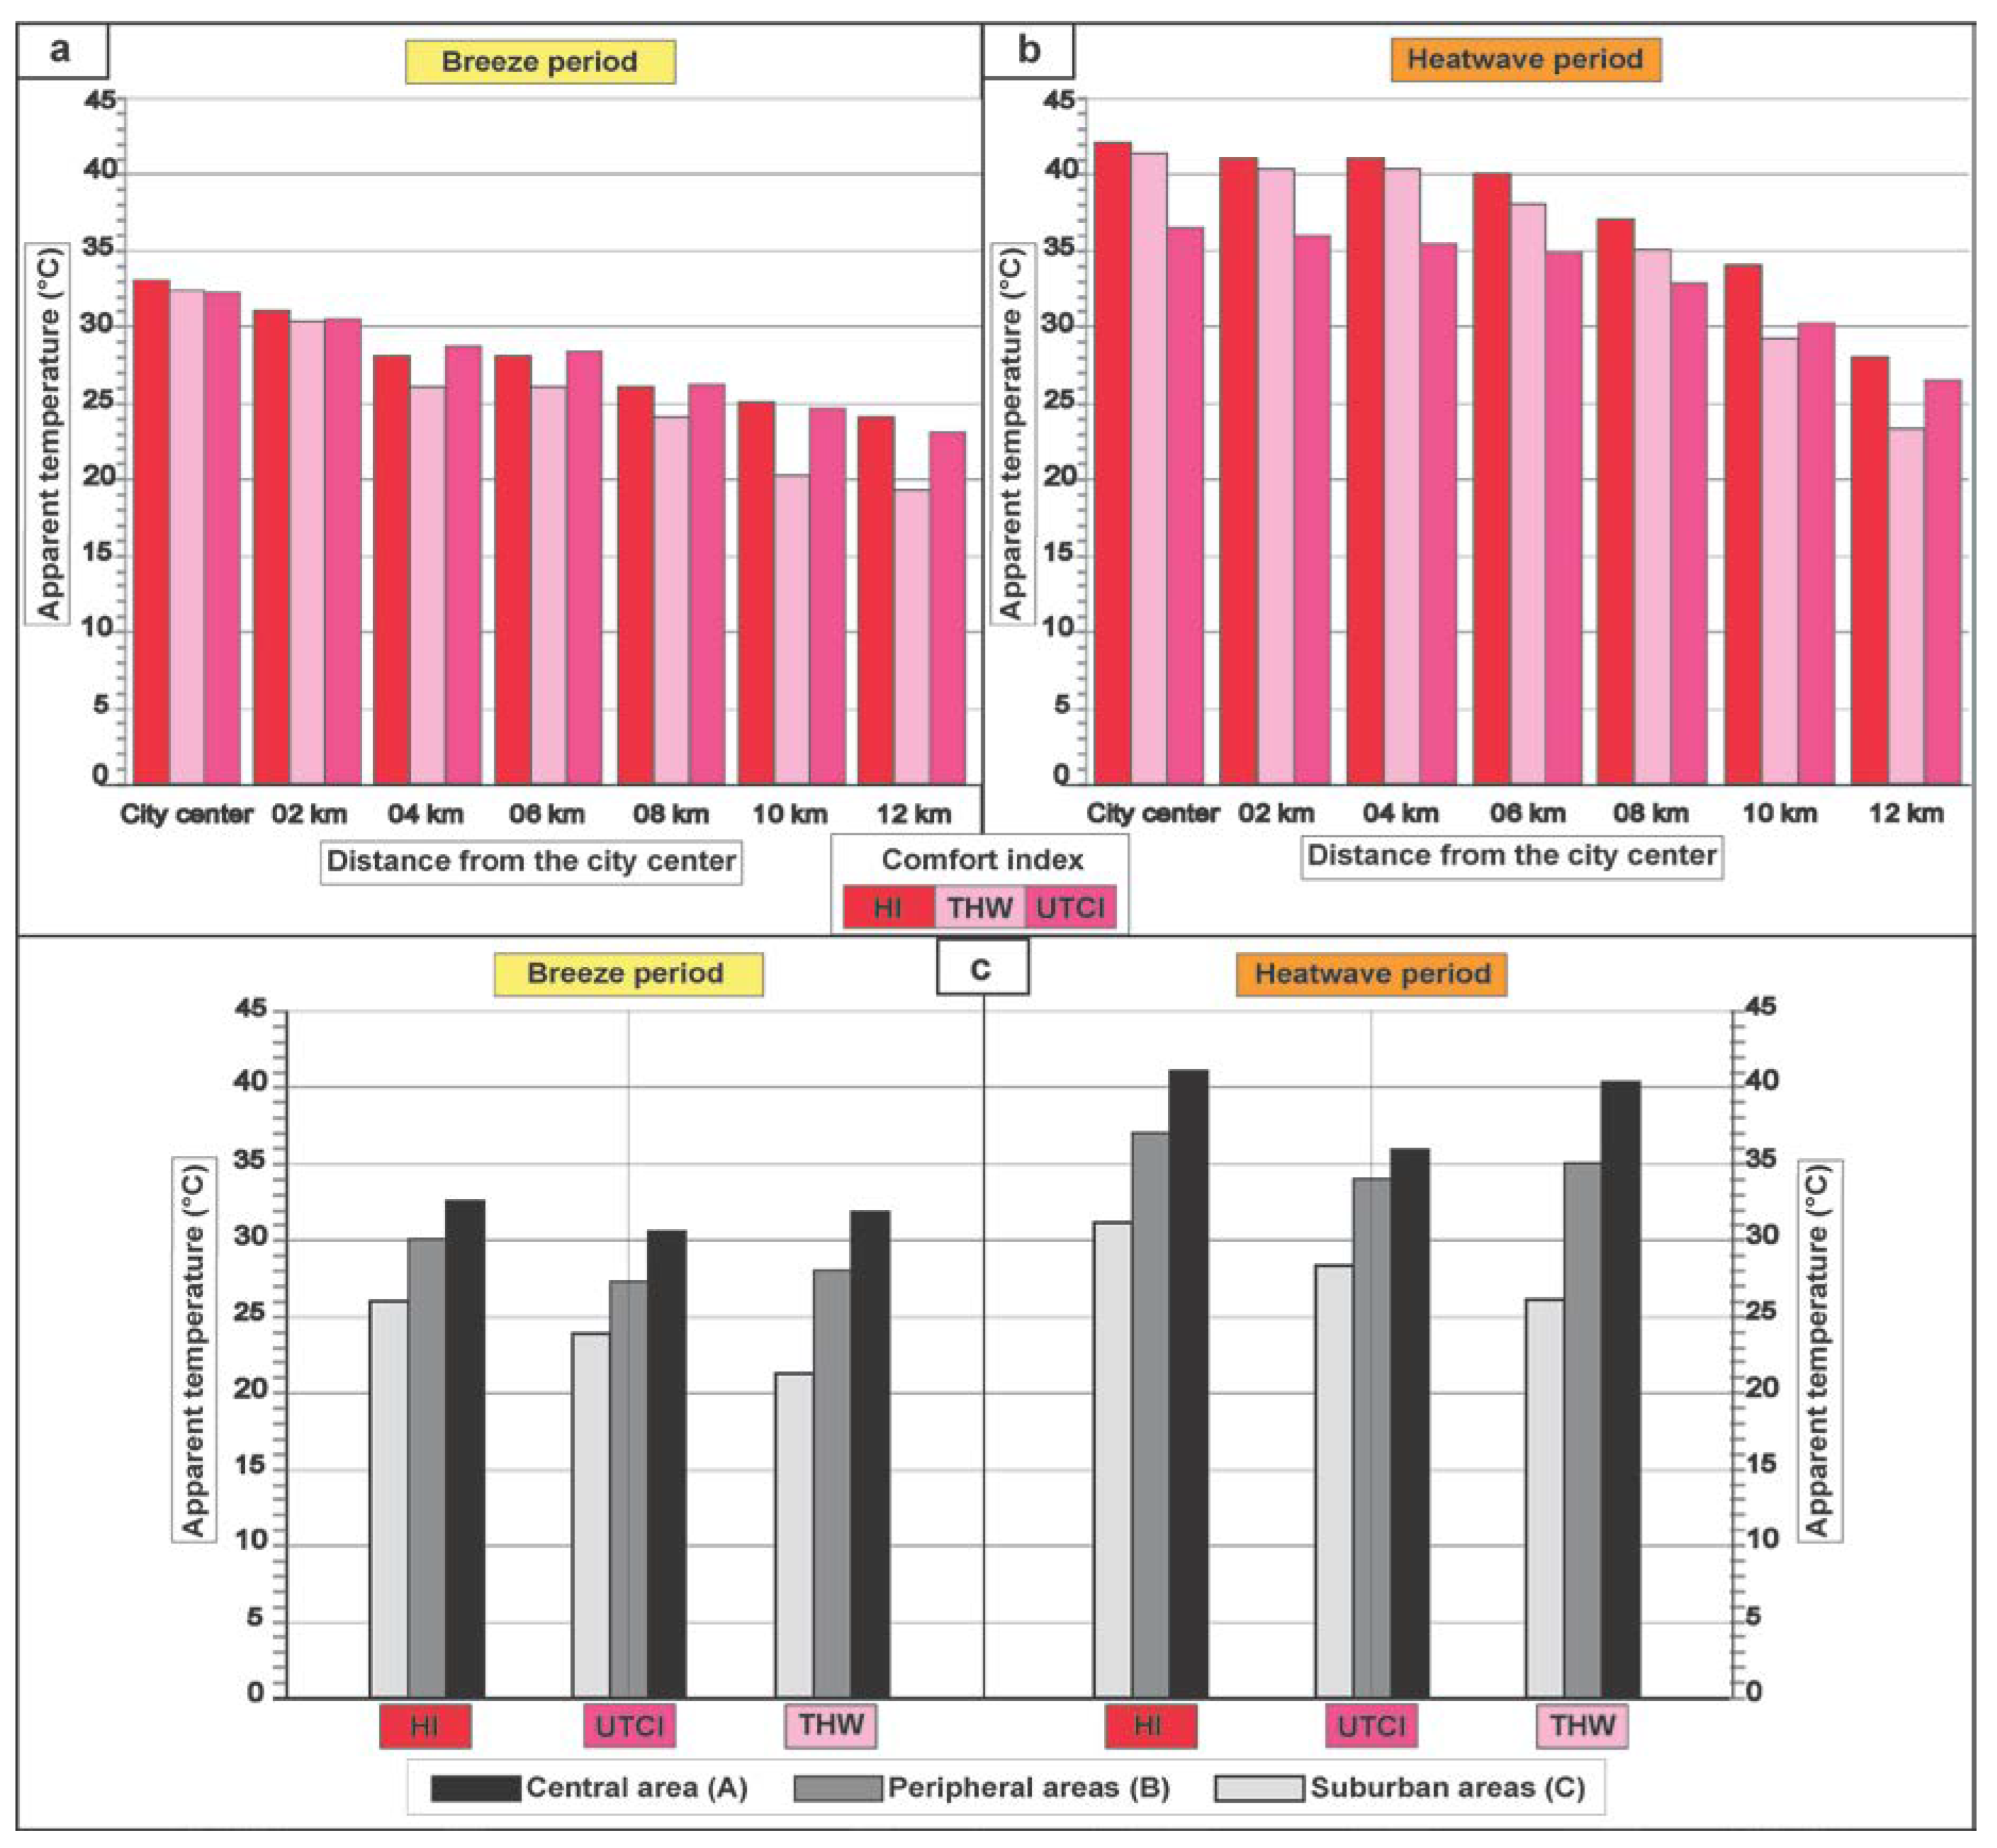
As a matter of fact, in good summer weather, observed for more than 85% of the days between June and September, temperatures are close to the seasonal normal and coastal breezes (land/sea) alternate [33]. Indeed, the weak synoptic wind, following the domination of barometric swamp situations on the surface and a high geopotential altitude, as well as the strong sunshine, favor the land/sea and city/country thermal contrasts. The latter are more pronounced on radiative nights, during which the apparent temperatures gradually decrease as one moves away from the city centre. A difference of 9 °C is observed between the central part and the area located 12 km from the city centre. Indeed, up to 2 km from the centre of the conurbation, the HI values vary between 31 and 33 °C (Figure 3a). Decreases in apparent temperatures are observed towards the periphery, between 4 and 6 km from the centre, where the value of the calculated HI reaches 28 °C with a difference of 5 °C compared to the apparent temperatures calculated in the centre. Furthermore, the most significant decrease is recorded between 8 and 12 km from the city centre (24 °C) (Figure 3a).
By integrating the wind factor, a fundamental element in the sensation of comfort, the calculated values of the THW index show that the impact of the strongest wind is observed at the level of the points located 10 to 12 km away, i.e., the most open, with a significant drop of about 5 °C compared to the values of the HI (Figure 3a). This impact is far less significant in the areas closest to the conurbation, particularly in the city centre. In this area, the wind speed, due to the terrain roughness and high density of the buildings, is near-zero and the difference with the most open and ventilated areas is over 13 °C (Figure 3a).
Furthermore, UTCI values indicate that the warmest thermal environment is observed in the downtown area, while the thermal comfort improves when moving away from the center of the agglomeration towards the peri-urban areas located at 12 km from the center (Figure 3a). According to the indicators obtained, a difference of more than 9 °C is calculated between the city center and the areas 12 km from the center, i.e., a decrease of about 0.75 °C every 2 km from the center to the suburban areas (Figure 3a).
In this regard, at the scale of the conurbation, during radiative situations, the average HI values calculated in good weather indicate a difference of about 6.5 °C between the central area (A), which is the warmest and least comfortable, and the open and vegetated suburbs (C) (Figure 3c). Indeed, the temperatures in the city centre are influenced by the UHI and the rather high humidity due to the proximity of the sea (SE wind).
By changing the index from HI to THW, the more open rural area gains 4 °C, while the drop in apparent temperature is much less significant in the periphery (B) (−2 °C) and negligible (−0.72 °C) in the very dense city centre, where the penetration of the breeze is obstructed by the tall and bulky buildings (Figure 3c).UTCI values show a significant improvement in thermal comfort in the peri-urban areas (C) (23.9 °C) compared to the central area (A) (30.5), while this contrast is less important between the central area (A) and the peripheral crown (B) with an average difference of about 3 °C (Figure 3c).

3.2.2. Very Hot Weather

During heat waves, the air temperature often exceeds 30 °C at night in the central areas of the conurbation, and the apparent temperatures remain overwhelming, particularly in the densest areas. According to hygrometric surveys carried out on the night of 3 August 2020, the HI values calculated in the central part and up to 6 km from the city centre fluctuate between 40 and 42 °C. These exceptional values recorded around midnight can be explained by the hot air advected from the Sahara, the impact of the UHI and a high humidity rate when the wind blows from the SE to the S (crossing the sea before reaching Sfax). Heading further towards open areas, the sensation of discomfort decreases and the apparent temperature values start dropping after 8 km from the city centre, reaching 28 °C at 12 km from the city centre (Figure 3b). In this area, which is strongly influenced by its rural environment, natural ventilation (land breeze) noticeably lowers the apparent temperature. In fact, during this extremely hot weather, the value of the THW index rose from 23 °C at a distance of 12 km from the centre, to 35 °C at 8 km and finally to 41 °C in the centre (Figure 3b).
During hot days, UTCI values are lower than HI and THW values, especially in the central part. The UTCI shows a thermal difference of about 10 °C between the central part and the surrounding countryside (Figure 3b). MRT are significantly higher than those observed in the open areas (C), with up to a 6 °C difference between the two zones.
In fact, the average UTCI value decreased from 36 °C calculated in the downtown area (A) to 34 °C in the peripheral area (B) and to 28.3 °C in the peri-urban area (C) (Figure 3c).
The distance from the coastline (source of humidity and heat at night) and the presence of vegetation have a significant effect on the apparent temperatures [61].
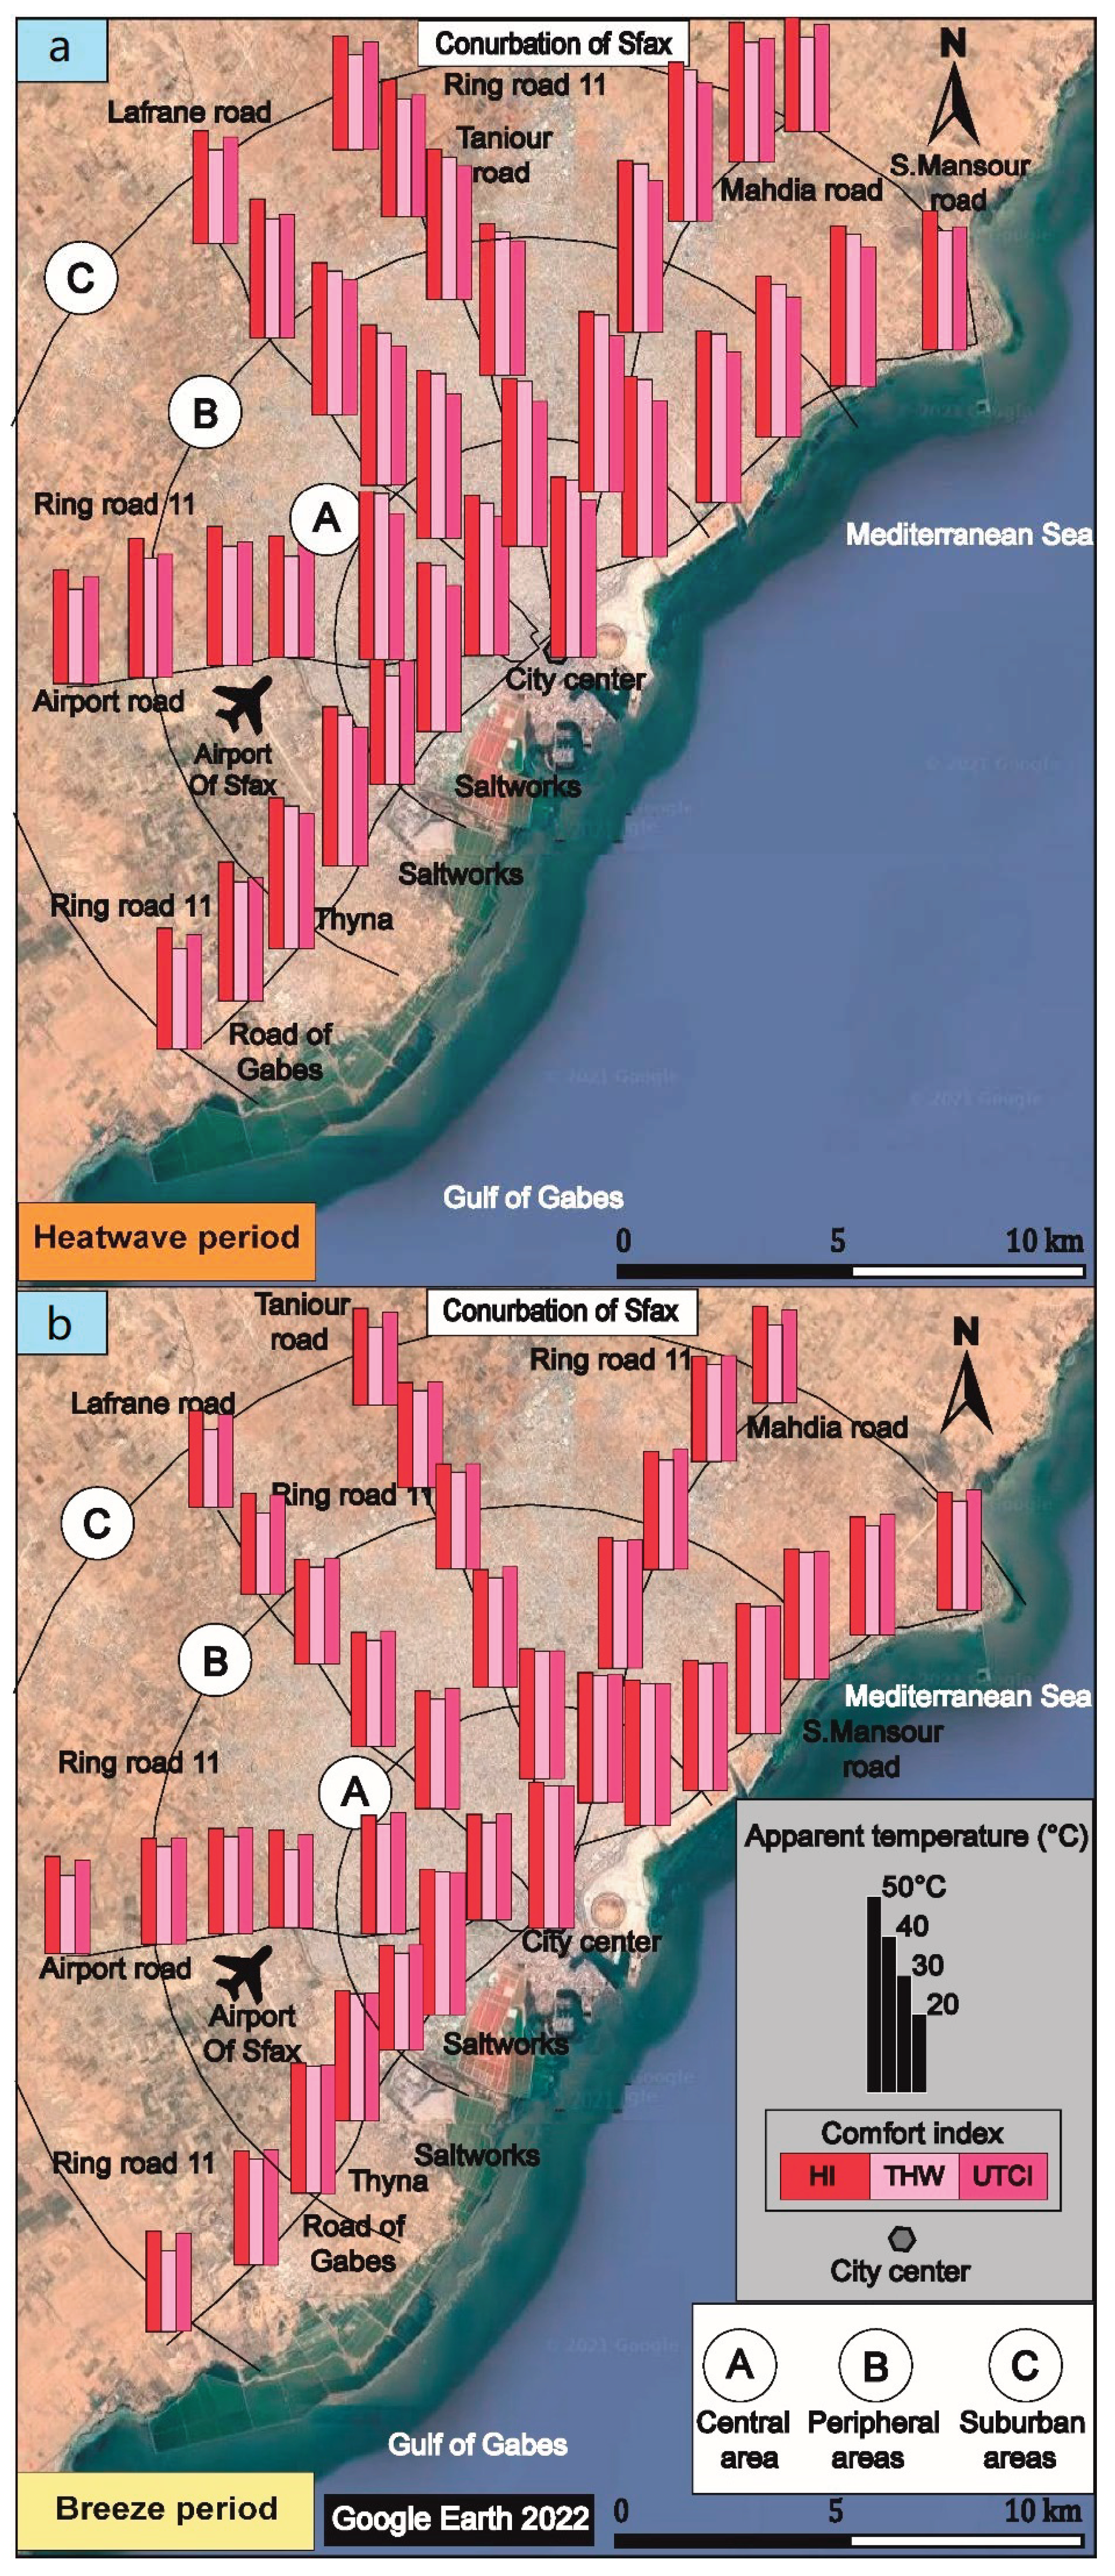
On the one hand, according to the calculation of the HI, UTCI and THW comfort indices, in good weather, we can describe the risk of discomfort as low in the suburbs (C), medium in the periphery (B) and high in the central area (A) (Figure 4b). On the other hand, during extremely hot days, the risk of discomfort affects almost all areas of the conurbation, including the central area and dense urban centres such as Sakiet Ezzit, Sakiet Eddaier, Ben Halima and Thyna, which are located in the peripheral areas to the north, west and south of the city centre and where the risk of discomfort remains very high and the sensation of discomfort is widespread (Figure 4a). This risk is more serious in central and pericentral districts such as Rabat, Hamza, Ennour, El Bahri and El Habib, where the highest degree of vigilance is required, particularly for infants, the elderly and people with chronic respiratory and cardiovascular diseases, who are likely to be more sensitive to high temperatures (Figure 4a).
The three used indices are characterized by different limit values and different input values. Then, a spatiotemporal variation between the three indices used in this work is noticed according to weather types. In fact, in the downtown area, the differences between the three indices are minimal in the central part when the weather is breezy. However, during a heat wave, the HI and THW values are higher than UTCI because the last one uses the MRT instead of the air temperature. The first is lower than the second at night. Gradually, moving towards the rural periphery, the THW drops relative to the other two indices as it better incorporates the wind factor.

3.3. Electrical Energy Consumption: The Role of Air Conditioning

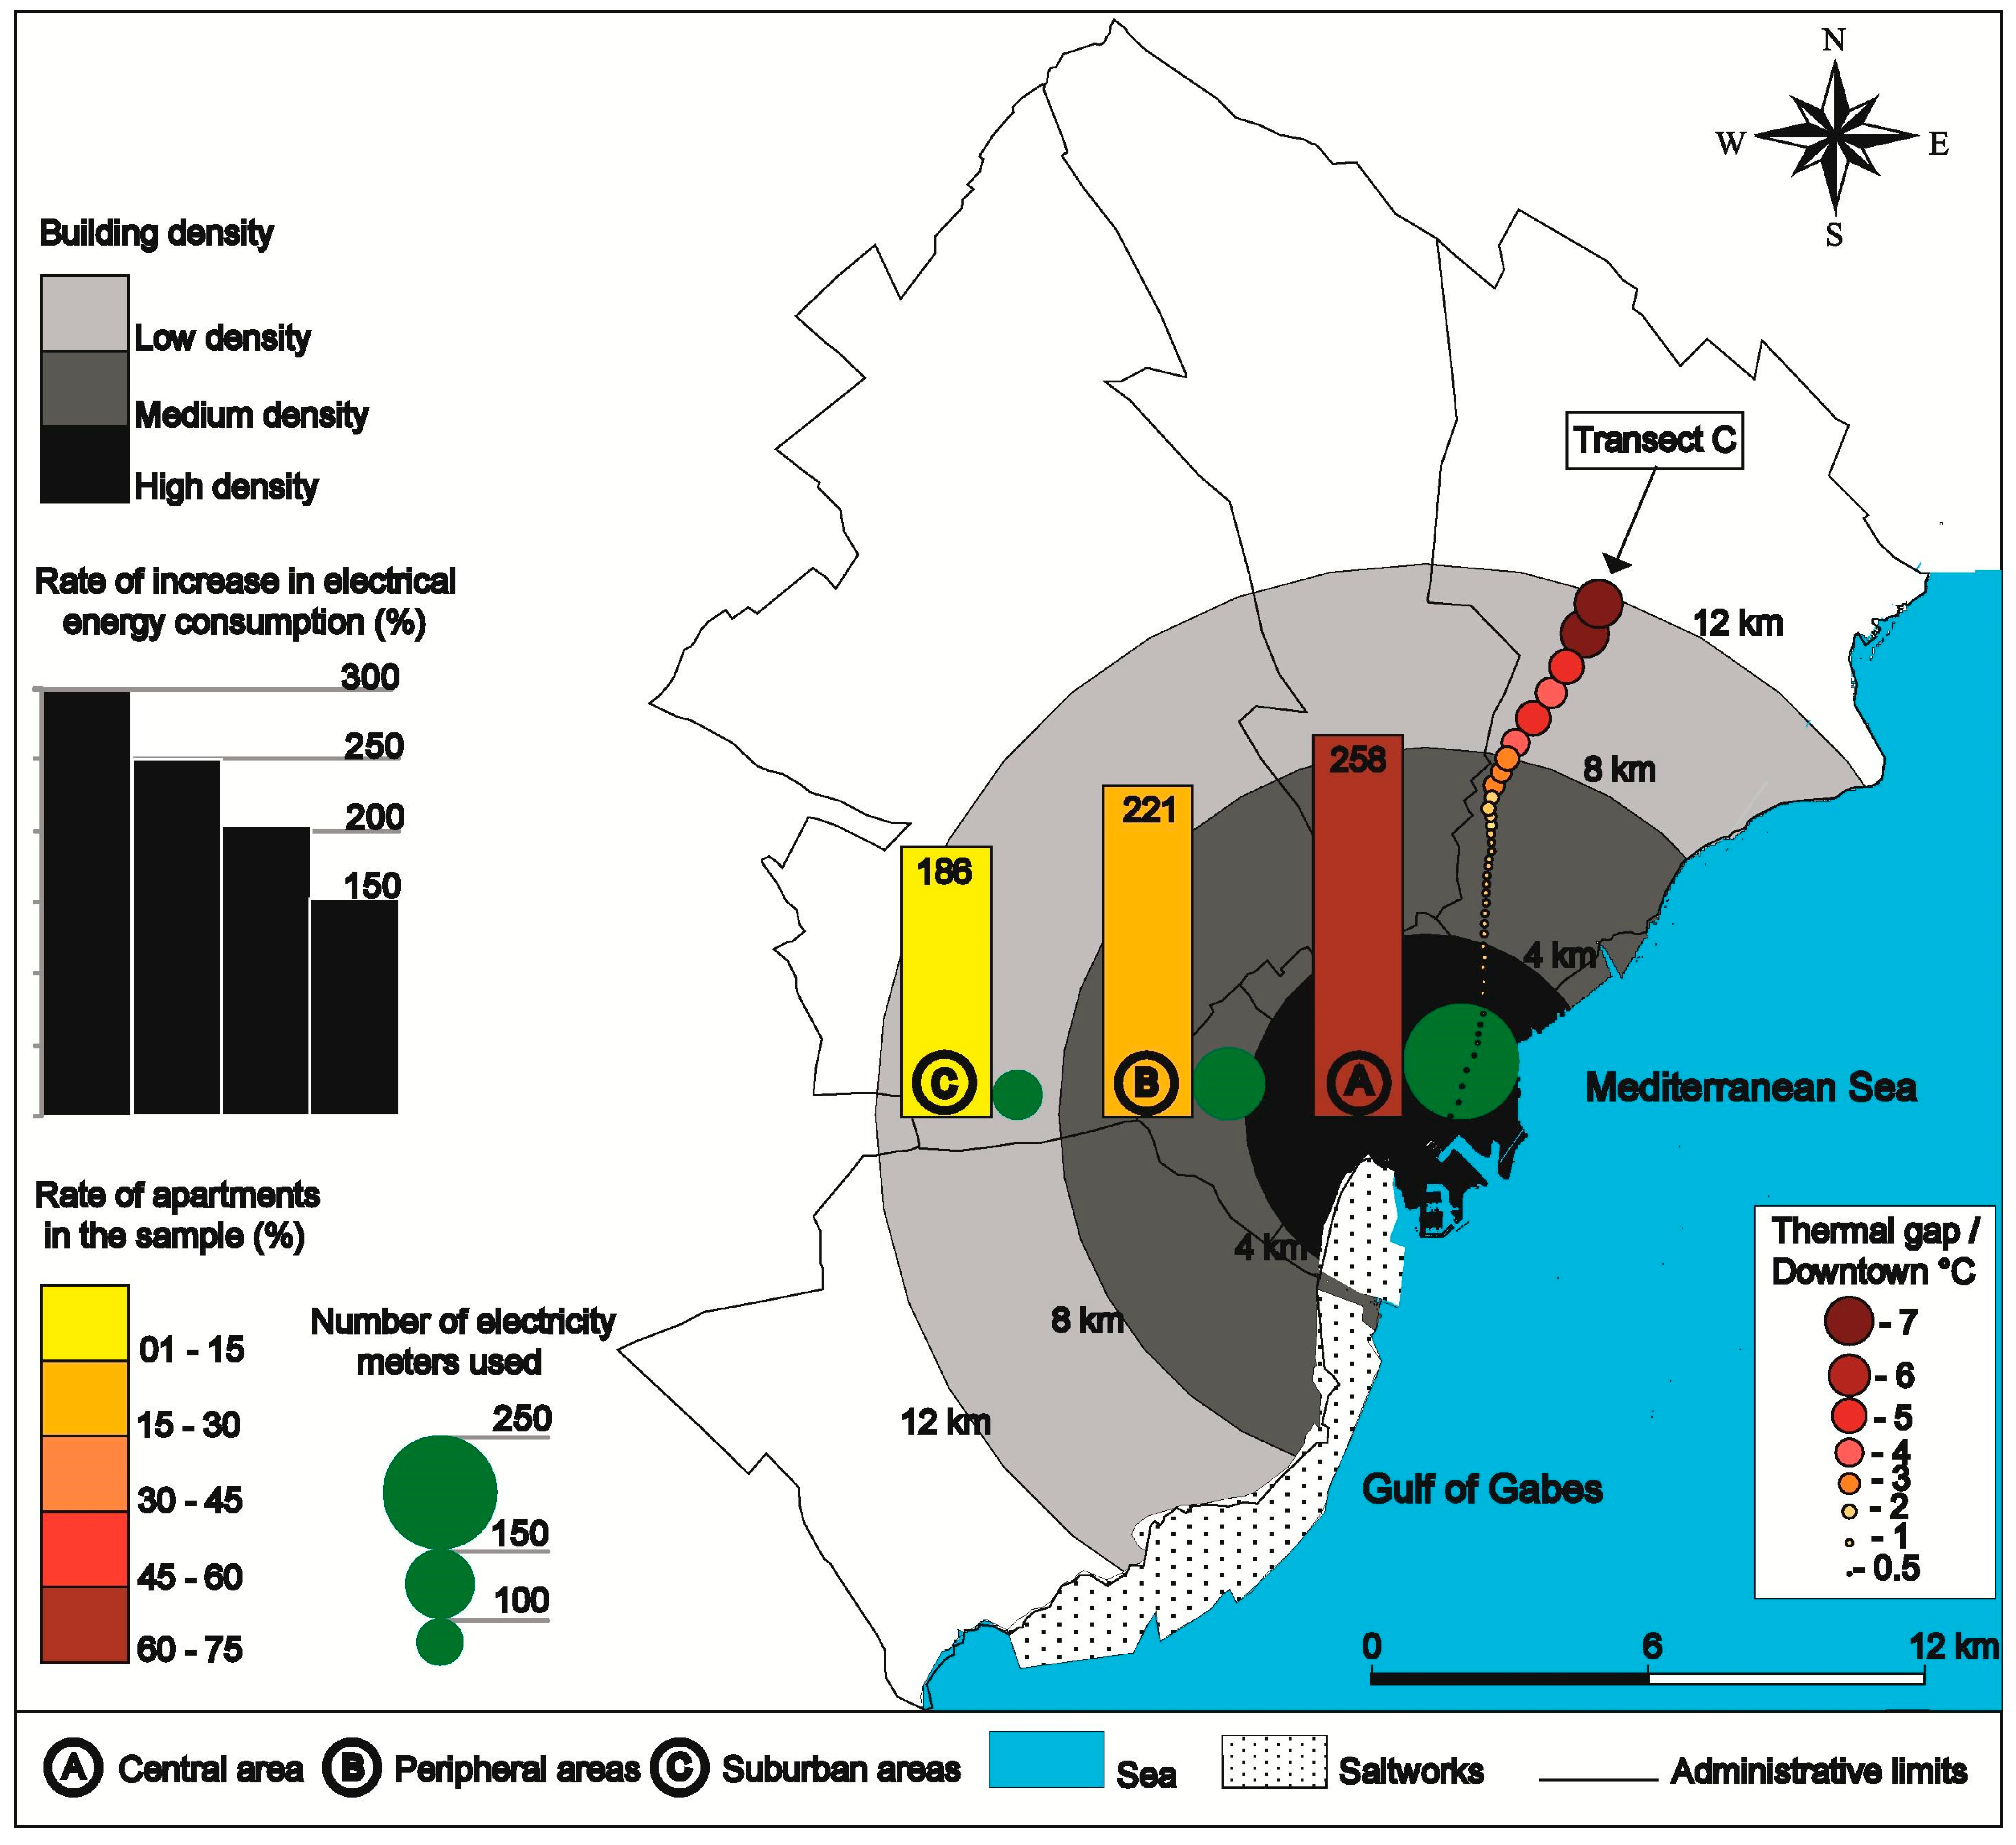
In the dense central area (A), characterized by the abundance of vertical buildings and the type of collective housing, 68% of the dwellings studied are flats (Figure 5). In the less dense peripheral area (B), located between 4 and 8 km from the city centre, individual dwellings (villas with gardens) represent 76%. In the third area (C), located 8 to 12 km from the centre, 90% of the buildings studied are single-family dwellings dotting this suburban area, which is the most open (Figure 5).
The average consumptions calculated for the months of May and August indicate a strong seasonal variation. According to the surveys conducted, compared to the month of May, the average consumption of electrical energy in the conurbation of Sfax more than doubled from 154 kWh/household to 347 kWh/household during the month of August.
Strong spatial disparities are observed between the three areas of the conurbation (A, B and C). Indeed, the highest increase is calculated in the central areas (A), where the average increase between May and August reached 258% (163 kWh in May compared to 420 kWh in August) (Figure 5). This increase is less significant in area B where the average consumption calculated in May and August reached 178 kWh and 393 kWh, respectively, i.e., an increase of about 221% (Figure 5). In area C, the average consumption of electrical energy rose from 123 kWh in May to 229 kWh in August, with an average increase of 186% (Figure 5). Indeed, these spatial disparities are essentially explained by the UHI, caused by the density of the built-up area, the absence of green spaces, except for the Touta park, and the voluminous structures that block the circulation of the refreshing breeze, especially at night, in the central part of the conurbation. Moreover, during the daytime, in area A, which is more equipped with air conditioning units, the dark coatings and glazed panels covering the urban facades drastically increase the thermal gains inside the buildings and increase their energy demands, even if a good part of the premises is for administrative use and private services [28,38]. On the other hand, while moving away from the centre towards the open suburban areas (C), characterized by spaced single-family dwellings, the sensation of discomfort is less intense during a large part of the summer season due to the proximity of the almond and olive fields, which accelerate nighttime cooling. Furthermore, part of these spatial disparities can be explained by the difference in living standards, particularly between households in area C, most of which belong to the working class and middle class, and areas B and A, which are generally inhabited by better-off households that are more equipped with air conditioners.
The majority of participants in the electricity monitoring, living in downtown and dense neighborhoods, attest that the use of electric air conditioning is mandatory during heat waves.
The use of weekly records of electricity meter readings, carried out each Sunday using prepared index cards, allowed us to highlight the impact of hot days, which are frequent in summer, on electric air conditioning.
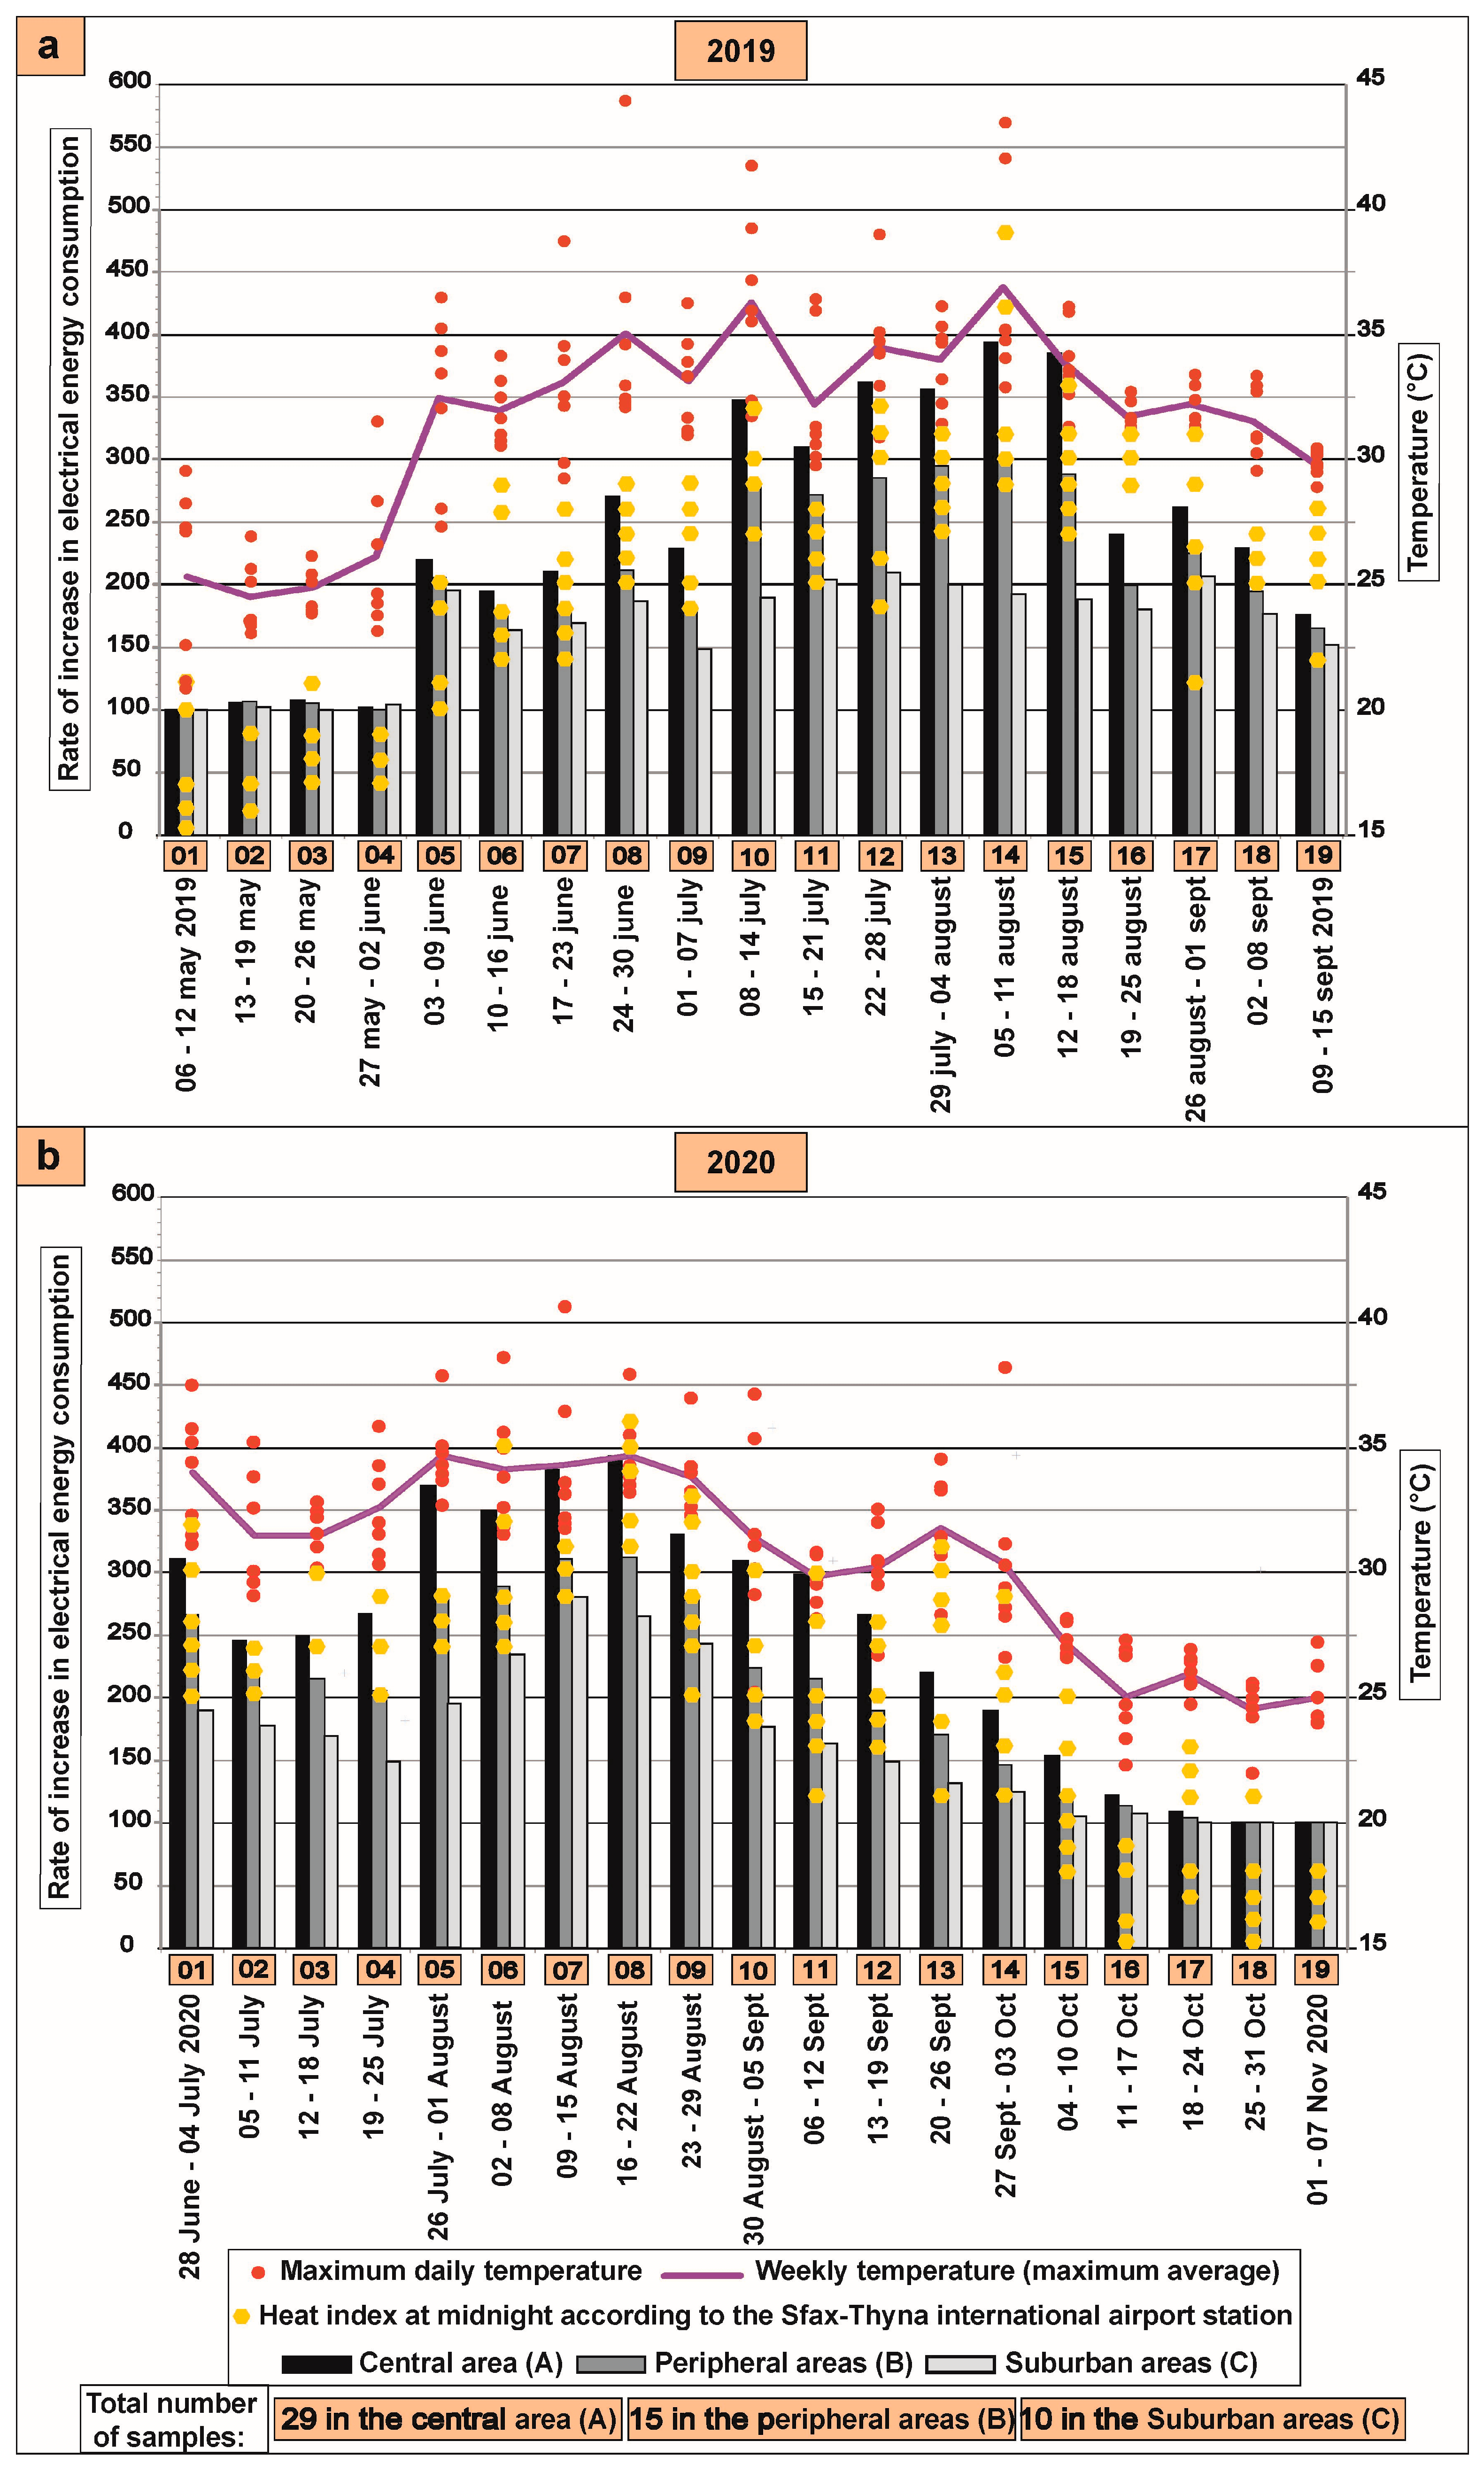
In 2019, during the period between 6 May and 15 September, i.e., 19 weeks, the weekly records of electricity consumption indicate a strong correlation between temperatures (recorded by the Sfax el Maou station) and energy consumption (Figure 6a). Indeed, the higher the recorded temperature values, the higher the electricity consumption. We retained the average of week 1 as 100% of consumption, during which no overconsumption related to heating or air conditioning was recorded (the week with the lowest consumption). From this average, we calculated the observed overconsumption from the weekly records obtained during the study period.
During the first 4 weeks, temperatures were moderate and the weekly maximum averages varied between 24 and 27 °C (Figure 6a). The nighttime temperatures did not exceed 20 °C on average, which explains the lack of increase in electricity consumption (Figure 6a). From week 5 onwards, at the beginning of the summer, in conjunction with the gradual increase in temperatures, electricity consumption gradually exceeded the normal level (the consumption observed during thermally moderate periods), reaching peaks between weeks 10 and 15 (Figure 6a). During this paroxysmic phase, in all areas of the conurbation, including the central area, the highest rates of increase were recorded during the 14th week, from 5 to 11 August 2019, the hottest of the season and the year. Indeed, electricity overuse rates of 394%, 298% and 193% above the normal average were calculated in areas A, B and C, respectively (Figure 6a). As a matter of fact, during this week, record temperatures of 42 °C and 43.5 °C were measured on 7 and 8 August 2019, respectively (Figure 6a).
In addition, according to the records of the INM meteorological station, the calculated values of the heat index indicate situations of acute discomfort observed during this week. In fact, in the airport area, representative of area B, located about 6 km from the city centre, the calculated weekly average value of the HI reached 32 °C around midnight during week 14. This value is likely to be higher in the centre of the conurbation where the thermal environment is systematically warmer than the periphery and suburbs due to the effect of the UHI. During these nights, strong pressure on electric air conditioning was observed in all parts of the conurbation to make the thermal environment in the dwellings more comfortable, which is reflected in these dramatic increases in the consumption of electrical energy dedicated mainly to air conditioning.
Moreover, the pressure on electricity is more intense and the use of electric air conditioning is much more excessive in the collective dwellings of the central part (A), the densest and least ventilated, where the apparent temperature during heat waves can exceed 40 °C in the night phase (Figure 3). During this phase, the human body requires thermal rest after the exhaustion of its thermoregulatory mechanisms during hot daytime situations. The sensation of discomfort during the night phase is slightly less intense in the single-family dwellings of the peripheral area (B) and in the open spaces of area C, which are better ventilated. After this extremely hot period, a subsequent drop in temperature and a gradual return to normal electricity consumption were observed from the 18th week onwards (Figure 6a).
In 2020, during the summer season, overconsumption rates were calculated during the first 10 weeks of the study period. As a matter of fact, from 28 June to 5 September, the average overconsumption of electrical energy dedicated to air conditioning in the central part (A), the peripheral area (B) and the suburbs (C) reached 320%, 260% and 208% respectively (Figure 6b). During this period, on a weekly basis, the pressure on electricity due to excessive use of electric air conditioning depended on the type of weather. Indeed, during the 2nd, 3rd and 4th weeks, from 5 to 25 July 2020, we calculated overconsumption rates of 254% in the central part (A), 213% in the periphery (B) and 165% in the dwellings of the suburban area (C) (Figure 6b). In fact, during this period, the meteorological parameters were close to seasonal norms with relatively bearable temperatures, especially at night. Moreover, during the same period, the apparent temperatures around midnight were, on average, lower than 28 °C (HI) in the peripheral areas (B) and the suburbs (C) (Figure 6b).
On the other hand, between weeks 5 and 9, peaks in consumption were recorded, particularly during week 8, when electricity consumption in areas A, B and C was about 4 times, 3 times and 2.6 times higher than normal, respectively. These peaks, recorded between 16 and 22 August 2020, are likely to be due to the overuse of electric air conditioning since, during this week, the temperature values (THW), calculated around midnight, varied between 31 and 36 °C in the airport area (Figure 6b). The beginning of the autumn season is generally marked by regularly uncomfortable thermal environments (oppressive weather), mainly linked to high humidity levels, impacting the apparent temperature in the city of Sfax [30]. During this period, fairly high overconsumption rates were calculated in the central part where electricity consumption reached 266% compared to the average consumption recorded at the beginning of November (19th week) characterized by a drop in temperature during this period preceding winter (Figure 6b).
In 2020, the results obtained from the weekly monitoring of electricity consumption indicated significant overconsumption compared to the normal averages recorded at the beginning of November, from 1 to 7 November 2020 (19th week, Figure 6b).

4. Discussion

The intensity of the UHI varies according to weather types. Hot and humid weather generates the maximum difference between the city centre and the rural area according to the mobile survey method. These results are consistent with those obtained from a network of four fixed weather stations (Davis) [40]. The results from the mobile surveys and the fixed stations form a database allowing the elaboration of a statistical model to simulate the thermal field in Sfax following the example of the work carried out for the Tunis conurbation [62]. The methods used are very original compared to the work already conducted in North Africa. Compared to reference [29], cited in the bibliography, the present paper is interested in the whole of the agglomeration of Sfax and not only in the districts of west Sfax. Moreover, the feeling of heat and thermal comfort is studied using three indices, HI, THW and UTCI, calculated from the results of 16 mobile measurements. In addition, the methods used in this study are replicable in other areas, including medium and large cities with warm climates.
In addition to factors related to building density and urbanization, the sensation of heat, as measured by the HI, UTCI and THW thermal comfort indices, differs from one body to another depending on health and age. This subjective parameter can partly justify the additional electricity consumption due to the pressure on air conditioning during the hot season. In the absence of sufficient data, this parameter has not been included in this work.
The months of July and August coincide with holidays and annual leaves, which could partly explain the drastic increases in electrical energy consumption recorded during this period when the surveyed population spends more time at home. Indeed, this permanent presence can significantly increase energy consumption. The latter is most likely caused by the abuse of electric air conditioning.
In the absence of quantitative data on the consumption of electricity due to the absence of a smart meter in Sfax, our study allowed us to quantify this consumption and thus provide first-hand information. The geographical approach allowed us to spatialize both the repair of temperatures and the consumption of electrical energy in different neighborhoods, particularly during the hot season. The sensitive neighborhoods in the case of a heat wave are identified. It is in these last ones that we will have to intervene as a priority in case of hazards.
UHI and thermal field variations are different to comfort indices maps. In spite of the fact that there is a small microclimatic variation in air temperature, the three thermal comfort indices present a much stronger variation due to the influence of air humidity, wind and radiative fluxes.
There are some differences in the results of the three indices depending on the area studied and weather types. Indeed, in the suburban area (C), the THW index gives the lowest values because the effect of the wind is determining outside of the city. The THW index demonstrates a much stronger variation between open areas and downtown areas sheltered from the wind due to the influence of this climatic element. The use of the THW index is more appropriate on breezy days, in open areas, as the cool wind is appreciated by the population. However, the warm wind, as in the case during heat waves, cannot improve the thermal comfort.
However, in the central and pericentral part, the UTCI gives lower values than the other two indices because it uses the MRT contrary to the others including the air temperature. The latter is higher than the MRT at night. The UTCI is therefore suitable for thermal comfort studies in the central part where the wind is very weak.
Although the RayMan model is easily understandable and user friendly, its most severe shortcoming is in the absence of a wind model.
The installation of a network of fixed weather stations equipped with a wet-bulb globe temperature in addition to the thermo-hygrometer, an anemometer and a solar radiation sensor would make it possible to calculate, using a small software program, the various comfort indices in different districts of the agglomeration. The results of this work concerning the spatial distribution of the temperatures and the comfort indices studied will make it possible to refine the choice of the location of the weather stations. A globe thermometer (with diameter of 150 mm) is useful for assessing the mean radiant temperature. The data collected by this tool are averaged over 15 min. This sampling time is necessary to offset the response time of the globe thermometer [51].
In future studies, we propose a simulation of the UHI with software of the actual scenario and of future scenarios (e.g., change albedo, change air conditioning efficiency).
In addition, in future work, we will be interested in the different actions and land-use planning to be implemented to reduce overheating in the dense neighborhoods. For instance, as a proposal for intervention, based on the findings of this study, the insulation of buildings and increasing their surface albedo, especially on the top floor, are among the most important solutions for improving thermal comfort inside and outside of the buildings. In parallel, to benefit from the cooling effect of the sea breeze, very frequent in summer in the study area, the orientation of windows towards the directions included between the north-east and the south-east, while passing by the east direction, is recommended.

5. Conclusions

This work contributes to the study of the UHI and the thermal characteristics of the urban climate of Sfax. Land use, and the distance from the city centre and the sea, as well as urbanization, are at the origin of the thermal contrasts observed between the central area and the rural area further away from the coastline. At night, a maximum difference of 7 °C between the centre and the countryside is measured during a heat wave. In addition, in the interradial areas located 8 km from the city centre, a difference of 3 °C is calculated between the densely built-up areas and the open and often vegetated areas.
The UHI affects the spatial distribution and evolution of thermal comfort indices. During periods of intense heat, a difference in apparent temperature of around 15 °C (THW index) is calculated between the central, dense, less comfortable part of the conurbation and the open areas of the suburbs, which are fairly ventilated. This factor causes the central area to be the most energy-intensive at the scale of the conurbation, where the pressure on electric air conditioning is much higher than in the less dense areas. Moreover, during the hot season, this excessive pressure on electric air conditioning is mainly observed during hot days in the city centre, where the overconsumption of electricity for air conditioning can reach about 400% compared to normal.

Author Contributions

Conceptualization, M.G. and S.D.; methodology, M.G. and S.D.; software, M.G. and S.D.; validation, S.D.; formal analysis, M.G. and S.D.; investigation, M.G. and S.D.; resources, M.G. and S.D.; data curation, M.G. and S.D.; writing—original draft preparation, M.G. and S.D.; writing—review and editing, S.D.; visualization, M.G. and S.D.; supervision, S.D.; project administration, S.D.; funding acquisition, S.D. All authors have read and agreed to the published version of the manuscript.

Funding

This research was funded by the PHC Utique research program funded by Campus France and the Sciences et Humanités faculty of the Université Paris Cité.

Acknowledgments

Our thanks go to the citizens who participated in monitoring electricity consumption.

Conflicts of Interest

The authors declare no conflict of interest.

Nomenclature

CCcloud cover octas
MRTmean radiant temperature
XYZgeographic coordinates
HI °C heat index
RH %relative humidity
T a °C air temperature
T g °Cglobe temperature
THW °Ctemperature humidity wind index
Ts °Csurface temperature
UHIurban heat index
UTCI °Cuniversal thermal climate index
V a m/swind speed

Appendix A

Flowchart summarizing the data and methods used and future work.
Energies 16 00911 i001

References

  1. Oke, T.R. City size and the urban heat island. Atmos. Environ. 1973, 7, 769–779. [Google Scholar] [CrossRef]
  2. Djen, C.S. The urban climate of Shanghai. Atmos. Environ. Part B Urban Atmos. 1992, 26, 9–15. [Google Scholar] [CrossRef]
  3. Kłysik, K.; Fortuniak, K. Temporal and spatial characteristics of the urban heat island of Łódź, Poland. Atmos. Environ. 1999, 33, 3885–3895. [Google Scholar] [CrossRef]
  4. Porson, A.; Harman, I.N.; Bohnenstengel, S.I.; Belcher, S.E. How Many Facets are Needed to Represent the Surface Energy Balance of an Urban Area? Bound.-Layer Meteorol. 2009, 132, 107–128. [Google Scholar] [CrossRef]
  5. Fujibe, F. Urban warming in Japanese cities and its relation to climate change monitoring. Int. J. Clim. 2011, 31, 162–173. [Google Scholar] [CrossRef]
  6. Santamouris, M. Analyzing the heat island magnitude and characteristics in one hundred Asian and Australian cities and regions. Sci. Total Environ. 2015, 512–513, 582–598. [Google Scholar] [CrossRef]
  7. Magli, S.; Lodi, C.; Contini, F.; Muscio, A.; Tartarini, P. Dynamic analysis of the heat released by tertiary buildings and the effects of urban heat island mitigation strategies. Energy Build. 2016, 114, 164–172. [Google Scholar] [CrossRef]
  8. Chapman, S.; Watson, J.E.M.; Salazar, A.; Thatcher, M.; McAlpine, C.A. The impact of urbanization and climate change on urban temperatures: A systematic review. Landsc. Ecol. 2017, 32, 1921–1935. [Google Scholar] [CrossRef]
  9. Xi, C.; Ren, C.; Wang, J.; Feng, Z.; Cao, S.-J. Impacts of urban-scale building height diversity on urban climates: A case study of Nanjing, China. Energy Build. 2021, 251, 111350. [Google Scholar] [CrossRef]
  10. Landsberg, H. The urban climate. Academic, New York Lee DO (1979) Contrasts in warming and cooling rates at an urban and a rural site. Weather 1981, 34, 60–66. [Google Scholar] [CrossRef]
  11. Charalampopoulos, I.; Tsiros, I.; Chronopoulou-Sereli, A.; Matzarakis, A. Analysis of thermal bioclimate in various urban configurations in Athens, Greece. Urban Ecosyst. 2012, 16, 217–233. [Google Scholar] [CrossRef]
  12. Santamouris, M. On the energy impact of urban heat island and global warming on buildings. Energy Build. 2014, 82, 100–113. [Google Scholar] [CrossRef]
  13. Sun, Y.; Augenbroe, G. Urban heat island effect on energy application studies of office buildings. Energy Build. 2014, 77, 171–179. [Google Scholar] [CrossRef]
  14. Radhi, H.; Sharples, S.; Assem, E. Impact of urban heat islands on the thermal comfort and cooling energy demand of artificial islands—A case study of AMWAJ Islands in Bahrain. Sustain. Cities Soc. 2015, 19, 310–318. [Google Scholar] [CrossRef]
  15. Skelhorn, C.P.; Levermore, G.; Lindley, S.J. Impacts on cooling energy consumption due to the UHI and vegetation changes in Manchester, UK. Energy Build. 2016, 122, 150–159. [Google Scholar] [CrossRef] [Green Version]
  16. Costanzo, V.; Evola, G.; Marletta, L. Energy savings in buildings or UHI mitigation? Comparison between green roofs and cool roofs. Energy Build. 2016, 114, 247–255. [Google Scholar] [CrossRef]
  17. Groppi, D.; de Santoli, L.; Cumo, F.; Garcia, D.A. A GIS-based model to assess buildings energy consumption and usable solar energy potential in urban areas. Sustain. Cities Soc. 2018, 40, 546–558. [Google Scholar] [CrossRef]
  18. Salvati, A.; Roura, H.C.; Cecere, C. Assessing the urban heat island and its energy impact on residential buildings in Mediterranean climate: Barcelona case study. Energy Build. 2017, 146, 38–54. [Google Scholar] [CrossRef] [Green Version]
  19. Boccalatte, A.; Fossa, M.; Gaillard, L.; Menezo, C. Microclimate and urban morphology effects on building energy demand in different European cities. Energy Build. 2020, 224, 110129. [Google Scholar] [CrossRef]
  20. Santamouris, M.; Haddad, S.; Saliari, M.; Vasilakopoulou, K.; Synnefa, A.; Paolini, R.; Ulpiani, G.; Garshasbi, S.; Fiorito, F. On the energy impact of urban heat island in Sydney: Climate and energy potential of mitigation technologies. Energy Build. 2018, 166, 154–164. [Google Scholar] [CrossRef]
  21. Ma, Y.X.; Yu, C. Impact of meteorological factors on high-rise office building energy consumption in Hong Kong: From a spatiotemporal perspective. Energy Build. 2020, 228, 110468. [Google Scholar] [CrossRef]
  22. Singh, M.; Sharston, R. Quantifying the dualistic nature of urban heat Island effect (UHI) on building energy consumption. Energy Build. 2021, 255, 111649. [Google Scholar] [CrossRef]
  23. Mayer, H.; Matzarakis, A.; Iziomon, M.G. Spatio-temporal variability of moisture conditions within the Urban Canopy Layer. Theor. Appl. Clim. 2003, 76, 165–179. [Google Scholar] [CrossRef]
  24. Holmer, B.; Thorsson, S.; Eliasson, I. Cooling rates, sky view factors and the development of intra-urban air temperature differences GeografiskaAnnaler: Series A. Phys. Geogr. 2007, 89, 237–248. [Google Scholar] [CrossRef]
  25. Heaviside, C.; Vardoulakis, S.; Cai, X.-M. Attribution of mortality to the urban heat island during heatwaves in the West Midlands, UK. Environ. Health 2016, 15, 49–59. [Google Scholar] [CrossRef] [Green Version]
  26. Tzoulas, K.; Korpela, K.; Venn, S.; Yli-Pelkonen, V.; Kaźmierczak, A.; Niemela, J.; James, P. Promoting ecosystem and human health in urban areas using Green Infrastructure: A literature review. Landsc. Urban Plan. 2007, 81, 167–178. [Google Scholar] [CrossRef] [Green Version]
  27. Liu, Y.; Stouffs, R.; Tablada, A.; Wong, N.H.; Zhang, J. Comparing micro-scale weather data to building energy consumption in Singapore. Energy Build. 2017, 152, 776–791. [Google Scholar] [CrossRef]
  28. Dahech, S.; Ghribi, M. Réchauffement climatique en ville et ses répercussions énergétiques. Cas de l’agglomération de Sfax (centre-est de la Tunisie). Méditerranée 2017, 128, 29–38. [Google Scholar] [CrossRef]
  29. Ghribi, M.; Euchi, H.; Dahech, S. Inconfort Thermique et Olfactif dans l’agglomération de Sfax: Perception dans les Quartiers Populaires de Sfax-Ouest (Tunisie). XXXIIème Colloque de l’Association Internationale de Climatologie, Thessaloniki-Grèce 29 mai au 1 Juin 2019; pp. 359–364. Available online: http://www.climato.be/aic/colloques/actes/Thessaloniki2019_actes.pdf (accessed on 5 December 2022).
  30. Li, X.; Zhou, Y.; Yu, S.; Jia, G.; Li, H.; Li, W. Urban heat island impacts on building energy consumption: A review of approaches and findings. Energy 2019, 174, 407–419. [Google Scholar] [CrossRef]
  31. IPCC. Climate Change 2021: The Physical Science Basis. Contribution of Working Group I to the Sixth Assessment Report of the Intergovernmental Panel on Climate Change; Masson-Delmotte, V., Zhai, P., Pirani, A., Connors, S., Péan, C., Berger, S., Caud, N., Chen, Y., Goldfarb, L., Gomis, M., et al., Eds.; Cambridge University Press: Cambridge, UK; New York, NY, USA, 2021; in press. [Google Scholar] [CrossRef]
  32. Johnson, D.P.; Wilson, J.S. The socio-spatial dynamics of extreme urban heat events: The case of heat-related deaths in Philadelphia. Appl. Geogr. 2009, 29, 419–434. [Google Scholar] [CrossRef]
  33. Arbuthnott, K.; Hajat, S.; Heaviside, C.; Vardoulakis, S. Changes in population susceptibility to heat and cold over time: Assessing adaptation to climate change. Environ. Health 2016, 15, 73–93. [Google Scholar] [CrossRef] [PubMed] [Green Version]
  34. Le Tertre, A.; Lefranc, A.; Eilstein, D.; Declercq, C.; Medina, S.; Blanchard, M.; Chardon, B.; Fabre, P.; Filleul, L.; Jusot, J.-F.; et al. Faculty Opinions recommendation of Impact of the 2003 heatwave on all-cause mortality in 9 French cities. Epidemiology 2006, 17, 75–79. [Google Scholar] [CrossRef] [PubMed]
  35. Andrade, H.; Alcoforado, M.-J. Microclimatic variation of thermal comfort in a district of Lisbon (Telheiras) at night. Theor. Appl. Climatol. 2008, 92, 225–237. [Google Scholar] [CrossRef]
  36. Deng, Z.; Deng, Q.; Wang, L.; Xiang, P.; Lin, J.; Murugadoss, V.; Song, G. Modifying coconut shell activated carbon for improved purification of benzene from volatile organic waste gas. Adv. Compos. Hybrid Mater. 2021, 4, 751–760. [Google Scholar] [CrossRef]
  37. Dahech, S. Le vent à Sfax (Tunisie), Impacts sur le Climat et la Pollution Atmosphérique. Ph.D. Thesis, de l’Université Paris: Paris, France, 2007; Volume VII, p. 309 + annexes. [Google Scholar]
  38. Dahech, S. Évolution de la répartition spatiale des températures de l’air et de surface dans l’agglomération de Sfax entre 1987 et 2010. Impact sur la consommation d’énergie en été. Climatologie 2012, 9, S11–S32. [Google Scholar] [CrossRef] [Green Version]
  39. Ghribi, M.; Dahech, S. Caractéristiques de l’îlot de chaleur urbain à Sfax durant la saison chaude (centre-est de la Tunisie). Climatologie 2020, 17, 7. [Google Scholar] [CrossRef]
  40. Steadman, R.G. The Assessment of Sultriness. Part II: Effects of Wind, Extra Radiation and Barometric Pressure on Apparent Temperature. J. Appl. Meteorol. 1979, 18, 874–885. [Google Scholar] [CrossRef]
  41. Jendritzky, G.; de Dear, R.; Havenith, G. UTCI—Why another thermal index? Int. J. Biometeorol. 2012, 56, 421–428. [Google Scholar] [CrossRef] [Green Version]
  42. Broede, P.; Fiala, D.; Blazejczyk, K.; Holmér, I.; Jendritzky, G.; Kampmann, B.; Tinz, B.; Havenith, G. Deriving the operational procedure for the Universal Thermal Climate Index (UTCI). Int. J. Biometeorol. 2011, 56, 481–494. [Google Scholar] [CrossRef]
  43. Bröde, P.; Krüger, E.L.; Rossi, F.A.; Fiala, D. Predicting urban outdoor thermal comfort by the Universal Thermal Climate Index UTCI—A case study in Southern Brazil. Int. J. Biometeorol. 2011, 56, 471–480. [Google Scholar] [CrossRef]
  44. Havenith, G.; Fiala, D.; Blazejczyk, K.; Richards, M.; Bröde, P.; Holmér, I.; Rintamaki, H.; Benshabat, Y.; Jendritzky, G. The UTCI-clothing model. Int. J. Biometeorol. 2011, 56, 461–470. [Google Scholar] [CrossRef] [PubMed] [Green Version]
  45. Fiala, D.; Havenith, G.; Bröde, P.; Kampmann, B.; Jendritzky, G. UTCI-Fiala multi-node model of human heat transfer and temperature regulation. Int. J. Biometeorol. 2011, 56, 429–441. [Google Scholar] [CrossRef] [PubMed] [Green Version]
  46. Park, S.; Tuller, S.E.; Jo, M. Application of Universal Thermal Climate Index (UTCI) for microclimatic analysis in urban thermal environments. Landsc. Urban Plan. 2014, 125, 146–155. [Google Scholar] [CrossRef]
  47. Pappenberger, F.; Jendritzky, G.; Staiger, H.; Dutra, E.; Di Giuseppe, F.; Richardson, D.; Cloke, H.L. Global forecasting of thermal health hazards: The skill of probabilistic predictions of the Universal Thermal Climate Index (UTCI). Int. J. Biometeorol. 2014, 59, 311–323. [Google Scholar] [CrossRef] [Green Version]
  48. Vatani, J.; Golbabaei, F.; Dehghan, S.F.; Yousefi, A. Applicability of Universal Thermal Climate Index (UTCI) in occupational heat stress assessment: A case study in brick industries. Ind. Health 2016, 54, 14–19. [Google Scholar] [CrossRef] [Green Version]
  49. Baaghideh, M.; Mayvaneh, F.; Shojaee, T. Evaluation of human thermal comfort using UTCI index: Case study Khorasan Razavi Iran. Nat. Environ. Chang. 2016, 2, 165–175. [Google Scholar]
  50. Fanger, P. Thermal Comfort; McGraw Hill: New York, NY, USA, 1972. [Google Scholar]
  51. Nikolopoulou, M.; Baker, N.; Steemers, K. Improvements to the globe thermometer for outdoor use. Archit. Sci. Rev. 1999, 42, 27–34. [Google Scholar] [CrossRef]
  52. Abreu-Harbich, L.V.; Labaki, L.; Matzarakis, A. Thermal bioclimate in idealized urban street canyons in Campinas, Brazil. Theor. Appl. Clim. 2013, 115, 333–340. [Google Scholar] [CrossRef]
  53. Ndetto, E.L.; Matzarakis, A. Urban atmospheric environment and human biometeorological studies in Dar es Salaam, Tanzania. Air Qual. Atmos. Health 2014, 8, 175–191. [Google Scholar] [CrossRef]
  54. Yang, S.-Q.; Matzarakis, A. Implementation of human thermal comfort information in Köppen-Geiger climate classification—The example of China. Int. J. Biometeorol. 2016, 60, 1801–1805. [Google Scholar] [CrossRef]
  55. Matzarakis, A.; Rutz, F.; Mayer, H. Modelling radiation fluxes in simple and complex environments—Application of the RayMan model. Int. J. Biometeorol. 2007, 51, 323–334. [Google Scholar] [CrossRef] [PubMed]
  56. Matzarakis, A.; De Rocco, M.; Najjar, G. Thermal bioclimate in Strasbourg—The 2003 heat wave. Theor. Appl. Clim. 2009, 98, 209–220. [Google Scholar] [CrossRef]
  57. Matzarakis, A.; Rutz, F.; Mayer, H. Modelling radiation fluxes in simple and complex environments: Basics of the RayMan model. Int. J. Biometeorol. 2010, 54, 131–139. [Google Scholar] [CrossRef] [PubMed] [Green Version]
  58. Matzarakis, A.; Fröhlich, D. Influence of urban green on human thermal bioclimate—application of thermal indices and micro-scale models. Acta Hortic. 2018, 1215, 1–9. [Google Scholar] [CrossRef]
  59. Matzarakis, A.; Gangwisch, M.; Fröhlich, D. RayMan and SkyHelios Model. In Urban Microclimate Modelling for Comfort and Energy Studies; Palme, M., Salvati, A., Eds.; Springer: Cham, Switzerland, 2021; pp. 339–361. [Google Scholar] [CrossRef]
  60. Fröhlich, D.; Gangwisch, M.; Matzarakis, A. Effect of radiation and wind on thermal comfort in urban environments—Application of the RayMan and SkyHelios model. Urban Clim. 2018, 27, 1–7. [Google Scholar] [CrossRef]
  61. Dahech, S. Impact de la brise de mer sur le confort thermique au Maghreb oriental durant la saison chaude. Cybergeo Eur. J. Geogr. 2014. [Google Scholar] [CrossRef]
  62. Charfi, S.; Dahech, S. Cartographie des températures à Tunis par modélisation statistique et télédétection. Mappemonde 2018, 123, 1–16. [Google Scholar] [CrossRef]
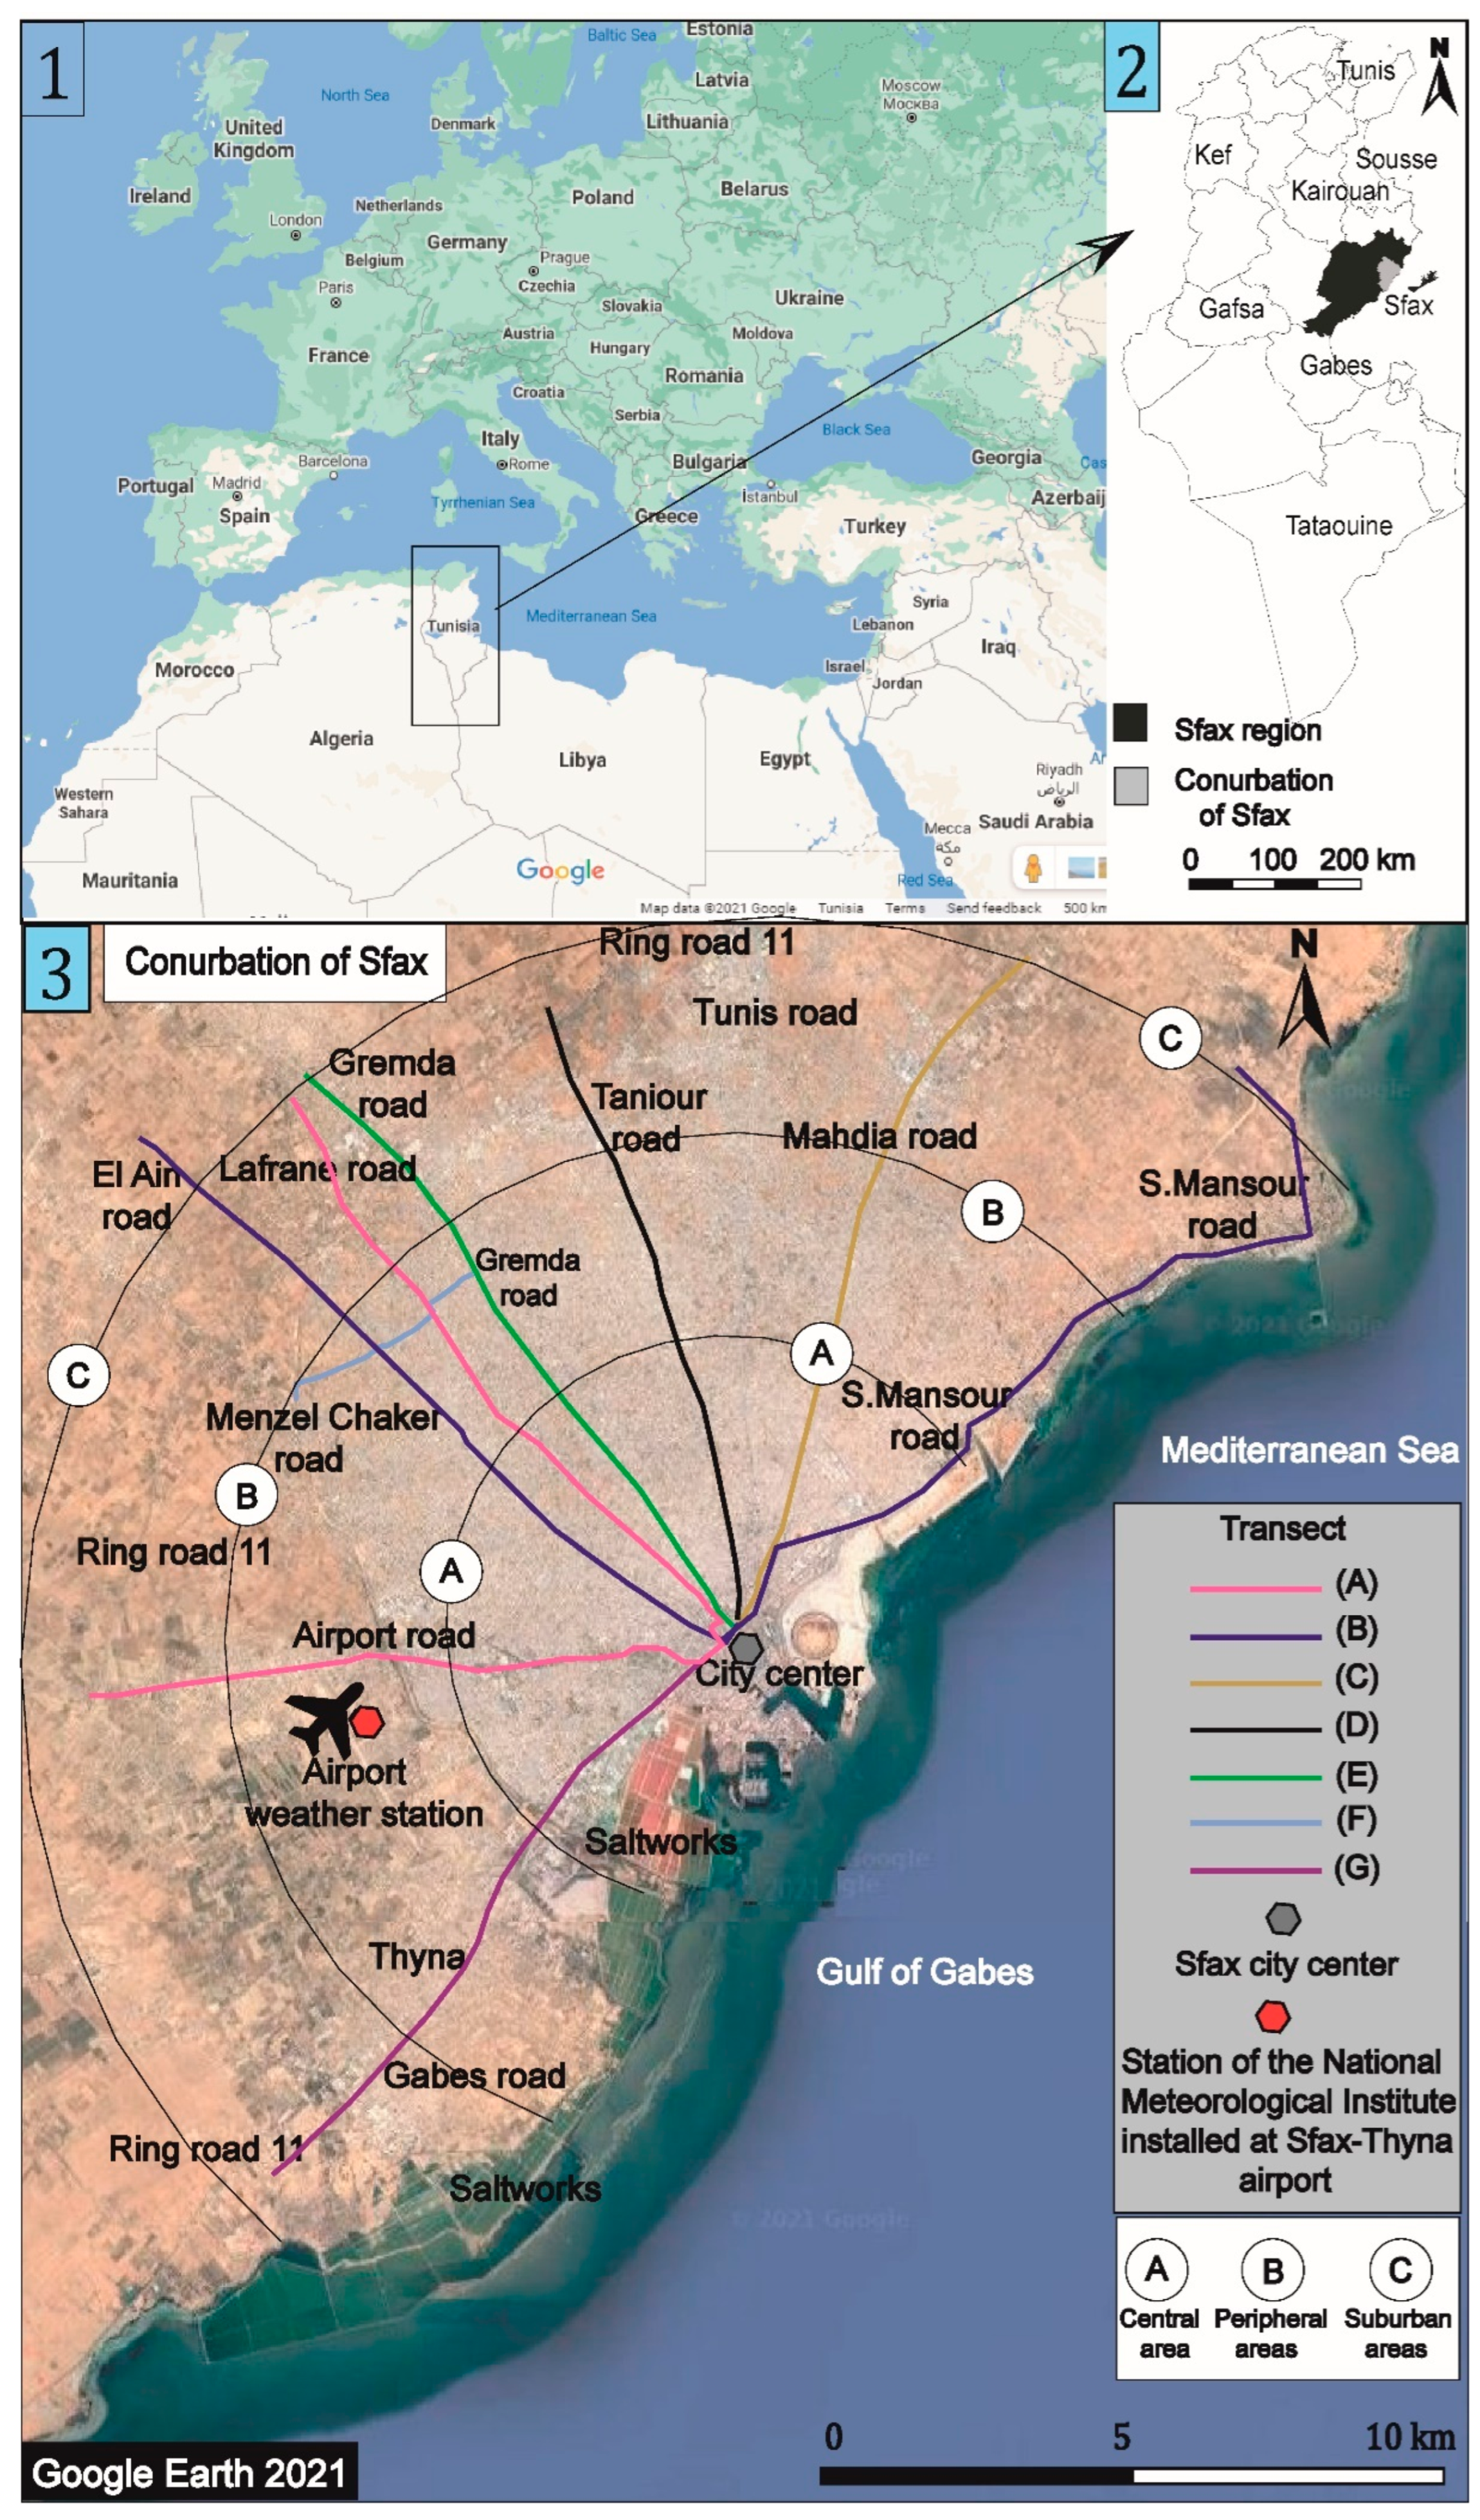
Figure 1. (1) Location of Tunisia in North Africa on the southern shore of the Mediterranean (background, Google Maps 2020); (2) location of the region and conurbation of Sfax in central-eastern Tunisia; (3) the conurbation of Sfax and the urban transects on which the mobile survey campaigns were carried out (background, Google Earth 2020).
Energies 16 00911 g001
Figure 2. Spatial distribution of night air temperatures at 2 m above ground level (thermal gap with city center in °C) in the conurbation of Sfax according to the average temperature values calculated from 16 mobile survey campaigns at the level of the seven urban transects A, B, C, D, E, F and G.
Energies 16 00911 g002
Figure 3. (a) HI, UTCI and THW comfort indices calculated between the central part and 12 km from the city centre in breezy weather; (b) in hot weather (Sirocco); (c) HI, UTCI and THW comfort indices calculated in areas A, B and C in breezy weather and hot weather (Sirocco) during night.
Energies 16 00911 g003
Figure 4. Spatial distribution of the risk of discomfort (mean of HI, UTCI and THW indices) during the hot season in the different areas of the Sfax conurbation based on 14 mobile thermo-hygrometry car surveys, (a) during breezy weather; (b) during the heatwave period at midnight during the summers of 2019 and 2020.
Energies 16 00911 g004
Figure 5. Spatial distribution of building density, number of electricity meters used, rates of apartments in the samples used in areas A, B and C and percentages of the average increase in electrical energy consumption in the conurbation of Sfax between the months of May and August 2018.
Energies 16 00911 g005
Figure 6. (a) Weekly average increase in energy consumption for air conditioning calculated between 6 May and 15 September 2019; (b) weekly average increase in energy consumption for air conditioning calculated between 28 June and 7 November 2020. The daily maximum temperatures and weekly maximum averages were recorded and calculated during the same periods as the weekly consumption monitoring mentioned above.
Energies 16 00911 g006
Disclaimer/Publisher’s Note: The statements, opinions and data contained in all publications are solely those of the individual author(s) and contributor(s) and not of MDPI and/or the editor(s). MDPI and/or the editor(s) disclaim responsibility for any injury to people or property resulting from any ideas, methods, instructions or products referred to in the content.