Article

Application of the Gradient-Based Metaheuristic Optimizerto Solve the Optimal Conductor Selection Problemin Three-Phase Asymmetric Distribution Networks

by
Julián David Pradilla-Rozo
,
Julián Alejandro Vega-Forero
and
Oscar Danilo Montoya
*
Grupo de Compatibilidad e Interferencia Electromagnética (GCEM), Facultad de Ingeniería, Universidad Distrital Francisco José de Caldas, Bogotá 110231, Colombia
*
Author to whom correspondence should be addressed.
Energies 2023, 16(2), 888; https://doi.org/10.3390/en16020888
Submission received: 28 November 2022 / Revised: 10 January 2023 / Accepted: 10 January 2023 / Published: 12 January 2023

Abstract

:
This study addresses the problem of selecting the conductor sizes for medium-voltage distribution networks with radial configurations. The optimization model that represents this problem is part of the mixed-integer non-linear programming (MINLP) models, in which a power flow must be solved for each possible combination of conductor sizes. The main objective of this optimization problem is to find the best set of conductor sizes that minimize an economic objective function composed of the total costs of conducting materials added with the expected annual costs of the energy losses by proposing a new hybrid optimization methodology from the family of combinatorial optimization methods. To solve the MINLP model, a master–slave optimization method based on the modified version of the gradient-based metaheuristic optimizer (MGbMO) combined with the successive approximation power flow method for unbalanced distribution networks is presented. The MGbMO defines the set of conductor sizes assignable for each distribution line using an integer codification. The slave stage (three-phase power flow) quantifies the total power losses and their expected annual operating costs. Numerical results in the IEEE 8-, 27-, and 85-bus grids demonstrate the effectiveness of the proposed master–slave optimizer when compared with multiple combinatorial optimization methods (vortex search algorithm, the Newton-metaheuristic optimizer, the traditional and Chu and Beasley genetic algorithms, and the tabu search approaches). Two scenarios regarding the demand behavior were analyzed for the IEEE 8- and 27-bus grids: a peak load operation was considered, and, for the IEEE 85-bus grid, the daily demand behavior, including the presence of renewable generators, was considered. The 85-bus grid allowed showing that the most realistic operative scenario for selecting conductors is the case where a demand curve is implemented since reductions over 40% in the annual investment and operating costs were found when compared to the peak load operating condition. All numerical validations were performed in MATLAB software.

1. Introduction

Electric power systems are made up of different stages, which range from the generation of electric energy, transmission, and distribution to the final consumer. Each of these stages is very important; thus, it is necessary to develop adequate planning, optimization, coordination of components, design protections, and fault detection, among other aspects [1,2]. Today, there is a growing demand for energy in the world. This increase is mainly due to demographic growth, new technologies and services, improved social conditions, and expanding industry. As the population density is increasing daily, the electrical system must adjust to the diminishing availability of land, and lowering its costs must also be considered [3].
Most distribution networks are generally built with a radial topology to minimize investment costs in conductors and protection schemes [4,5,6] and are responsible for supplying electricity to all end users through interconnected networks in both rural and urban areas [7,8]. In recent decades, several solutions have been proposed to make this type of network increasingly efficient, significantly contributing to the reduction in greenhouse gases [9], in addition to improving the reliability in the provision of the energy service, with this being one of the main requirements for the network operator. The number of resources in this type of network is limited, and the disconnection of any power supply will prevent the correct supply of energy. Therefore, it is important to select the appropriate types of conductors capable of transporting the energy required to supply the demand for electrical energy in the short and medium term [10]. In radial systems, the load located upstream of a feeder starts high and reduces as it moves downstream. In that sense, using large-gauge conductors for the entire distribution network means the system is technically and economically inefficient. Using different gauge types of conductors for the intermediate sections will minimize the capital investment cost and the energy loss along the line. In the same way, using a large number of high-gauge conductors will involve a higher investment cost. In this sense, more studies are needed, and new intelligent and analytical methods for their correct implementation must be devised [11].
Selecting the conductor gauge in the radial distribution network is essential to improving network performance. The optimal assignment of the conductor gauge leads to a lower energy loss, improving the distribution system’s voltage profiles and reducing the system’s annual operating cost [10]. This problem is part of a subfield of study corresponding to the efficient expansion of electrical networks, and its research motivates this study, clearly denoting that the main purpose of this study is to find the best set of conductor sizes that minimize an economic objective function composed of the total costs of conducting materials added with the expected annual costs of the energy losses by proposing a new hybrid optimization methodology from the family of combinatorial optimization methods. Thus, the optimal selection of conductors in electrical distribution networks represents a complex problem as it is subject to different constraints, such as the limits of the voltage profile in all buses, the current flow capacity of the feeders, the variation in the demand profile that possibly maintains continuous growth [3]. For this reason, heuristic algorithms have been an efficient tool to solve this type of problem, allowing cost reduction due to their ability to analyze the solution space and correctly assign the conductors to be installed in the electrical distribution system [12]. As it is essential to have efficient optimization methodologies to deal with the problem of the optimal selection of conductor sizes in distribution networks, a complete revision of the state of the art in this regard will be presented in the next section since multiple approaches have been reported based on combinatorial optimizers, which necessitate a profound review of the literature to identify the research gap and propose a new alternative solution for the studied problem.
The rest of the article is organized as follows: Section 2 presents a complete review of state-of-the-art for the problem of the optimal selection of conductors in three-phase asymmetric distribution networks followed by the main contributions in this research. Section 3 presents the mathematical formulation of the optimal selection of conductors in three-phase distribution networks. Section 4 describes the proposed master–slave methodology in the master stage based on the MGbMO metaheuristic algorithm integrated with the slave stage based on the three-phase power flow of successive approximations. Section 5 presents information on the test systems used and the different simulation cases. Section 5 reveals the information related to the computational validation of the proposed method. Section 6 discusses the numerical results obtained in the optimal selection of conductors and the associated costs. Finally, Section 7 presents the main conclusions and outlines future lines of research according to the findings.

2. Literature Review and Contributions

Over the years, multiple optimization strategies have been presented, represented in different algorithms, seeking to solve the problem of optimal conductor selection in distribution networks, where it is necessary to minimize technical and non-technical losses [13]. Different methodologies have been devised to solve the radial networks’ optimal conductor selection problem. These methodologies in the specialized literature can be classified into two main categories: conventional approaches based on analytical analysis and metaheuristics [10]. In this way, we will start focusing on methods based on conventional approaches.
The conventional methods turn out to be extended. As the conditions or the buses of the system are increased, the calculation time increases exponentially since the total number of calculations, and the number of iterations increases, as shown in [14,15], where an algorithm was proposed to select the optimal size of the conductors of the supply segments of the radial distribution networks. The load flow method applied to the radial distribution network determines the optimal conductor size. This method calculates the losses and the cost of each of the conductors in the different buses based on some proposed examples and compares them with the conductors already installed in the network.
In Ref. [16], the authors proposed a methodology to select conductors in distribution networks with the aim of increasing the loadability of the entire system by considering different load models. The optimization model ensures that all the currents through the conductors do not exceed their nominal rates using multiple power flow evaluations. The total savings in the cost of material conduction and energy losses were maximized by maintaining acceptable voltage levels in the radial distribution systems, which were implemented in a radial network of 26 buses. In Ref. [17], formulated models to represent the cost of the feeder, the cost of energy loss, and the voltage regulation as a function of the cross-section of the conductor were proposed as a dynamic multi-stage decision-programming problem, where the objective function was to optimize the conductor cross-section while minimizing costs. In Ref. [18], the methodology for the selection of optimal conductors in radial distribution systems was presented through the comparative study of the results obtained by the conventional or analytical method and the genetic algorithm (GA) method, yielding better results in the GA, both economically and in terms of the solution time, which was much longer in the conventional method.
GAs are generalized search algorithms based on the mechanics of the natural evolution of species. GAs maintain a population of individuals representing the possible solutions to the given problem, and each individual is evaluated to give some measure of their adequacy to the problem from the objective function. The GA combines the evaluation of solutions with stochastic operators, namely selection, crossing, and mutation, to obtain optimization as demonstrated by the authors in [19]. GAs are also used in combining the selection of conductors with the placement of capacitors in radial distribution systems, further improving the voltage profiles and reducing energy losses. In Ref. [20], a hybrid optimization approach was presented to solve the optimal conductor size selection (CSS) problem in a distribution network with a high penetration of distributed generation (DG). An adaptive genetic algorithm (AGA) was the main optimization strategy to find the optimal conductor sizes for the distribution networks. The proposed approach aimed to minimize the sum of the life-cycle cost (LCC) of the selected conductor and the total cost of energy acquisition during the expected operating periods; additionally, it sought to maintain the voltage profiles and improve them with the DG.
In 2018, the authors of [21] proposed a novel approach to select the optimal conductors of radial distribution networks using a metaheuristic algorithm known as the grasshopper optimization (GO) algorithm. Their results revealed that the proposed conductors explored a broader search space and found the optimal overall set of conductors satisfying the objective functions. The authors of [22] applied a heuristic evolutionary strategy (ES) to select the optimal size of feeders in radial energy distribution systems. ES incorporates biologically inspired structures and operators, such as recombination, mutation, and selection based on fitness, obtaining better results than other iterative methods in most problems. The differential evolution (DE) is another optimization algorithm, and it was implemented in [23] to obtain the optimal location and classifications of the capacitors, in addition to the optimal sizes of the conductors in the distribution systems for an unbalanced radial system, complying with the voltage and temperature constraints for each branch. There are several applications of these methods for the reduction in costs in the selection of conductors as shown in [24], where an algorithm was applied in a radial network for agriculture in the distribution network of the Eastern Power Distribution Corporation of Andhra Pradesh, and in [25], where the application of an algorithm was performed in a network of the Bangladesh power system.
To determine the losses of both active and reactive power, algorithms, such as the backward/forward sweep, have been implemented, as evidenced in [26], which, in turn, together with optimization techniques such as particle swarming, have sought to solve problems such as the optimal conductor selection for single-wire earth return (SWER) systems, whereby the objective function is established as a function of the costs associated with conductor investment and power losses. In Ref. [27], a direct approximation load flow is implemented in which the technical constraints associated with maximum current capacity, load growth, and maximum permissible voltage drop are taken into account.
In Ref. [28], the authors compared how user losses improve before and after implementing an optimization algorithm, and they sought the best optimal selection of conductors for the distribution system under study, employing the aid of the optimization technique based on the teaching–learning methodology. Furthermore, the implementation of a discrete version of the metaheuristic vortex search method to perform the optimal selection of conductors in three-phase distribution networks was presented in [29], where two 27- and 8-bus systems were analyzed under different demand scenarios. In Ref. [11], a method based on the branch-wise minimization technique was implemented to present a model that selects the optimal size of ACSR (aluminum-conductor steel-reinforced) conductors. In the initial stage, the sizes of the conductors were selected according to their characteristics and operating conditions. Subsequently, they were updated to optimal values through an economic optimization technique. The systems under study by authors of [11] were two systems of 85 and 69 buses. In addition to the above, factors such as the annual cost of losses and the cost of depreciation of the conductor were taken into account.
To summarize, the main approaches used for solving the problem of the optimal selection of conductors in electrical distribution networks are reported in Table 1. This table presents the numerical method applied, the objective function under analysis, the year of publication, and the corresponding citation.
As evidenced in the review of state of the art and the summary in Table 1, all methodologies and research have the following characteristics: (i) the minimization of the investment and operating costs regarding conductor sizes and energy losses by ensuring that the technical parameters are within the permissible values according to territorial regulations, thereby improving the quality of service to users and the economic benefits for the companies providing the service, (ii) the usage of combinatorial methods based on evolutionary algorithms to deal with the mixed-integer non-linear programming structure of the optimization model to reach high-quality solutions (maybe local solutions) with acceptable processing times, and (iii) the heart of the combinatorial optimization methods is the power flow solution approach (as in the case of the heuristic approaches) since this is the tool that allows verifying all the technical/operative constraints of the network (line capacities, voltage regulation, and power loss calculation, etc.).
Considering the literature review presented in the previous section, this paper makes the following contributions: (i) it applies an efficient combinatorial optimization method to select conductors in three-phase asymmetric distribution networks. The selected optimizer is the gradient-based metaheuristic optimizer which works with pseudo-derivatives for solving optimization problems with discrete decision variables [13]. (ii) It adds an improvement stage to the gradient-based metaheuristic optimizer based on the combination of its evolution rules with the vortex search algorithm to obtain a new combinatorial optimizer named modified gradient-based optimizer (MGbMO). The main advantage of this proposed method is the usage of Gaussian distributions and derivatives to explore and exploit the solution space by guaranteeing high repeatability and low standard deviations.
The main advantages of the proposed MGbMO to deal with the problem in electrical distribution networks are as follows: (i) its applicability to three-phase balanced and unbalanced distribution networks with radial (or meshed) topologies since it works in a master–slave connection with a general three-phase power flow solution based on the successive approximation methods which are equivalent to the generalized matricial backward/forward power flow [33], and (ii) its high-quality performance regarding objective function calculation, repeatability, and easy computational implementation.
Note that this study’s scope only covers applying a new efficient optimization technique to select conductors in three-phase asymmetric networks with radial topologies. In this study, uncertainties regarding demand behavior or penetration of renewable generation are not considered; however, a simulation scenario with daily demand and generation curves is presented to validate the effectiveness of the proposed MGbMO. In future works derived from this study, uncertainty in generation and demand curves can be studied since, as evidenced in Table 1, the studied problem continues to be relevant and essential for academics and distribution companies, implying that more research is required. Additionally, we present the effectiveness of the proposed MGbMO in the 8-bus grid with five different combinatorial optimization methods. The best three approaches are selected for comparison in the 27-bus grid. However, for the 85-bus grid, based on the results of the 27-bus grid, we only present numerical results with the proposed MGbMO because no literature reports exist for the IEEE 85-bus grid in its three-phase version.

3. Mathematical Formulation

Optimal conductor selection problems in distributed systems can be mathematically modeled through mixed-integer non-linear programming (MINLP) [34]. The integer variables are related to the selection of the conductor gauge per phase for each network section. In contrast, the continuous variables appear in the formulation of the three-phase power flow. The MINLP model for the problem studied is presented below.

3.1. Objective Function

The main objective for the optimal selection of conductors in three-phase distribution systems is to minimize the costs associated with the investment in conductor gauges and annual energy losses. The value of the objective function is represented by Z , where C l o s s represents the costs of energy losses for the evaluation period, and  C i n v represents the cost of the investment according to the selected conductor gauges. Equations (1)–(3) describe the formulation of the objective function.
C l o s s = C p T h Ω h p Ω p q Ω p i Ω b j Ω b V h , i p V h , j q q Y i j p q λ i j c cos ϕ h , i p ϕ h , j q ϕ h , i j p q λ i j c Δ h ,
C i n v = c Ω C k m Ω L C k m c L k m λ k m c ,
Z = min C l o s s + C i n v + C p e n ,
where C p represents the average cost of energy, T is the value in hours of the evaluated period, V h , i p and V h , j p represent the variables of the magnitudes of the voltages, and Φ h , i p and Φ h , j p are the angles of the voltages at buses i and j of phase p , respectively. These are non-linear functions of the binary variable λ i j c . This variable defines the c-type gauges for the conductor that joins buses i and j for the period h , and  Y i j p q and Φ i j p q represent the magnitude and angle of the admittance formed between buses i and j of the phases p and q , respectively. C k m c is the cost of the conductor along a kilometer of length for a type of conductor (c), L k m represents the network section in kilometers between the buses k and m , and  λ k m c is the binary decision variable that defines the installation of the type of conductor (c) between buses k and m . C p e n are the penalty costs due to violating distribution system constraints.

3.2. Set of Constraints

The optimal selection of conductors in three-phase distribution networks encompasses multiple constraints linked to operational limitations present in the electrical distribution system. The entire set of constraints that models the problem is defined in Equations (4)–(11).
P g i , h p P d i , h p = p Ω h q Ω p i Ω b j Ω b V h , i p V h , j q Υ i j p q λ i j c c o s ϕ h , i p ϕ h , j q ϕ h , i j p q λ i j c , i Ω b h Ω h p Ω p ,
Q g i , h p Q d i , h p = p Ω h q Ω p i Ω b j Ω b V h , i p V h , j q Υ i j p q λ i j c s e n ϕ h , i p ϕ h , j q ϕ h , i j p q λ i j c , i Ω b h Ω h p Ω p ,
I k m , h p = f V h , k p , V h , m p , ϕ h , k p , ϕ h , m p , λ k m c , R k m c , X k m c , k m Ω L h Ω h p Ω p ,
I k m , h p C Ω λ k m c I c m a x , k m Ω L h Ω h p Ω p ,
V i m i n V i , h p V i m a x , i Ω b h Ω h p Ω p ,
c Ω c λ k m c = 1 k m Ω L ,
k m Ω L c Ω c λ k m c = n 1 ,
λ k m c 0 , 1 k m Ω L , c Ω c ,
Equation (4) defines the active power balance for each bus, phase, and period, where P g i , h p and P d i , h p symbolize the active power generated and demanded, respectively, V h , i p is the magnitude of the voltage at bus i for the period h , Y i j p q defines the magnitude of the admittance matrix connecting buses i and j , Φ h , i p is the phase angle i for the period h , and  Φ h , i j p q is the angle of the admittance matrix that connects buses i and j . In (5), the reactive power balance is represented for each bus, phase, and period, where Q g i , h p and Q d i , h p represent the reactive power generated and demanded, respectively. In (6), the feasibility of the current capacity of the conductors is verified, where the current that flows in the network section between the buses k and m , of phase p , in a period h represented by I k m , h p is calculated. In contrast, R k m c and X k m c are the resistance and reactance of the conductor in the network section between buses k and m , respectively. In (7), it is ensured that the current flow in the network section does not exceed the thermal limit of the selected gauge, where I c m a x is the maximum current for the selected conductor. In (8), it is established that the voltage is within its limits, where V i m i n and V i m a x are the minimum and maximum voltages, respectively. Equation (9) ensures that only one type of gauge c is selected for the conductor in the network section between buses k and m . In (10), the maximum number of conductors to be installed is defined, guaranteeing the radial topology. Finally, Equation (11) defines the binary nature of the decision variables.
In the previous equations, Ω L is the set that contains the network sections of the distribution system, Ω b contains all the buses of the system, the set Ω h contains the periods of load duration, and  Ω p contains the phases of the system.
There can be multiple solutions for this mathematical model defined in (1)–(11), which is of type MINLP, and the main complexity of MINPL is its non-convex continuous equality constraints with binary variables. Knowing the difficulties that the model develops, a solution strategy is presented with a master–slave optimization approach, using the metaheuristic optimization algorithm based on the modified MGbMO gradient for the master part and the three-phase successive approximation method for the slave part.

3.3. Solution Space Analysis

One of the main complications in the problem of the optimal selection of conductors for three-phase unbalanced systems is the large size of the solution space since it includes binary and continuous variables. In the case of binary variables, for a system with l distribution lines and c options for calibers, the number of possible solutions is c l [35]. Additionally, for each possible combination of the conductor sizes, multiple variables are associated with the power flow problem in three-phase networks. Table 2 shows the number of variables involved in the power flow solution (note that n is the number of nodes and d is the number of dispersed sources).
Table 2 reveals that for each combination of conductors in a three-phase network, there is 6 n + 3 l + d + 4 . Additionally, if h periods are considered in the operation horizon, the total dimension of the solution space will be 6 n + 3 l + d + 4 h c l .
Note that for the problem of the optimal selection of conductors for three-phase distribution networks, the probability of finding the optimal global solution is low due to the enormous dimension of the solution space, implying that medium- and large-scale distribution networks in the proposed MGbMO, as well as other combinatorial optimization methodologies only, can ensure optimal local solution or one that is maximally near the optimal global solution [36].

4. Solution Methodology

This article proposes a master–slave optimization methodology to solve the problem of optimal selection of conductors in three-phase distribution networks with balanced and unbalanced loads, seeking to minimize the operation and investment costs, representing the objective function. In the master part, the metaheuristic algorithm MGbMO is used [13], and the method of successive approximations is used for the slave part. In the proposed methodology, the master stage is responsible for the optimal selection of gauges in each distribution line. In contrast, the slave stage is responsible for evaluating the set of constraints associated with the power flow to determine the value of the objective function. Equation (12) presents the coding that represents the problem studied:
X i t = [ 8 , 2 , c , , N c a v a ] ,
where X i t represents the configuration of each individual i in the set of candidate solutions in iteration t , and its size is given by 1 × ( y ), where y represents the number of branches in the distribution system, while c is a random integer that symbolizes the type of conductor to be installed in the network section of the system. N c a v a is a value between 1 and the number of sizes of conductors available for the installation Note that for the studied systems N c a v a is assigned as 8. In the following subsections, the most important aspects of the master and slave stages are described.

4.1. Slave Stage: Three-Phase Power Flow

In the slave stage belonging to the metaheuristic part of the master–slave optimization process, a method that explores and exploits the solution space in each iteration is employed. For the calculation of the objective function, the evaluation of the power flow is required for each iteration, which allows the calculation of the costs of losses and verifying that all constraints are satisfied. In this research, successive approximations are used to solve the power flow recursively in each iteration and for each individual, which presents some complication due to the constraints that are highly non-linear and non-convex, making it necessary to use numerical methods in their solution. The general formula of power flow for the method of successive approximations is presented in Equation (13), [13].
V d t + 1 = Y d d 1 ( d i a g 1 ( V d t , * ) S d * + Y d g V s ) ,
where V d is the vector that contains all the voltage variables in the complex domain in all the demand buses, t represents the iterative counter, Y d s and Y d d represent the sub-components of the general nodal admittance matrix that connect the demand buses with the slack bus and the demand buses with each other, respectively, S d is the complex demand vector that contains the active and reactive power consumption in the demand buses, V s is a vector with the complex voltage in the buses of the slack sources, diag 1 ( x ) is a matrix formed with the elements of the diagonal of x , and, finally, x * is the conjugate operator of the vector  x .
The recursive evaluation of the power flow in Equation (13) stops when there is a convergence with the application of Banach’s fixed point theorem [33]. For convergence, the difference in the two magnitudes of voltage between two consecutive iterations is taken as shown in (14).
V d t + 1 V d ϵ ,
where ϵ is the maximum acceptable error value, which, in this case, is taken from 1 × 10 10 . Once the power flow is found, the three-phase power losses are determined using Equation (15).
P l o s s 3 ϕ = R e ( s u m ( E r 3 ϕ t + 1 ) T ( J r 3 ϕ t + 1 ) * ) ,
where E r 3 ϕ t + 1 is a vector that contains all the voltage drops for the different network sections in the electrical distribution systems, and  J t 3 ϕ t + 1 is a vector that contains all the currents associated with each network section. In this way, the three-phase successive approximation method is shown in Figure 1.
Note 1.
With the equation presented in (15), it is possible to calculate the value of the objective function associated with the energy loss costs, as shown in (1), as shown in (16).
C l o s s = C p T P l o s s 3 ϕ Δ h

4.2. Master Stage: MGbMO Metaheuristic Algorithm

The MGbMO algorithm is a metaheuristic method recently developed by Montoya O. [13]. This method uses the GbMO method developed by Ahmadianfar [37] and adds a new improvement in the exploration and exploitation through the use of hyperellipses with a variable radius around the best current solution, which is used in the vortex search algorithm [13].
The gradient-based metaheuristic algorithm (GbMO) is inspired by the gradient-based Newton method, where the initial terms of the Taylor series are used from an initial point, and it uses two main operators: the gradient search rule (GSR) and the local escape operator (LEO) and a set of vectors to explore the search space. In the algorithm proposed in [37], each member of the population is a vector generated randomly, as shown in (17).
X n = X min + r a n d ( 0 , 1 ) ( X max X min ) ,
where X min and X max are the lower and upper limits, respectively, of the decision variable X , and  r a n d ( 0 , 1 ) is a random number between 0 and 1. The general evolution rule of the GbMO part is defined in Equation (18), where we already have the application of the Taylor series and the use of the slave part mentioned above. These steps are explained in [13,37].
X i t + 1 = X i t r a n d ( 0 , 1 ) α i t X i t X i 1 t ( f ( X i + 1 t ) f ( X i t ) ) ,
where X i t + 1 and X i t are the new individual and the current individual, respectively, α i t is the adaptive step of the gradient search algorithm in the i t h iteration t , and  f ( X i t ) represents the gradient of the function f evaluated in the individual X i t .
Taking into account that all the exploration qualities of Equation (18) are local, no information is being obtained on which is the best current solution; therefore, the authors in [13] propose an adaptive evolution as shown in (19), based on the recommendations of [38], where X b e s t t is the best current solution.
X i t + 1 = X i t r a n d ( 0 , 1 ) α i t X i t X i 1 t ( f ( X i + 1 t ) f ( X i t ) ) + r a n d ( 0 , 1 ) ( X b e s t t X i t ) .
To improve the exploration and exploitation stages of the original GbMO, it was proposed in [13] to modify this algorithm based on an evolution strategy used by the vortex search algorithm (VSA) [39]. This algorithm allows exploring and exploiting the solution space through non-concentric hyperellipses of variable radius generated with a Gaussian distribution, generating candidate solutions around the center of the solution space, which would be the best solution [29]. In this way, the initial center of the hyperellipse is defined in (20).
μ t = X b e s t t ,
where μ t is a vector with dimension d × 1 ( d = y ) that represents the center of the hyperellipse for each iteration t . The best current solutions around the center are generated as shown in the following Gaussian distribution (21).
X t + 1 = p x μ t , Σ = 1 2 π d Σ e x p 1 2 x μ t τ Σ 1 x μ t ,
where x is a vector with dimension d × 1 of a random variable, and  Σ is the covariance matrix. This matrix has identical values in its diagonal and zeros outside it. The covariance matrix is defined as shown in (22).
Σ = σ 0 I ,
where σ 0 is the standard deviation of the Gaussian distribution, and  I is the identity matrix with the appropriate dimensions. For exploration and initial exploitation, σ 0 is calculated as follows (23):
σ 0 = m a x x m a x m i n x m i n 2 ,
where σ 0 can also be considered the initial radius (i.e., r 0 ), taking into account that r 0 is chosen to be a large value and that as the number of iterations progresses, it decreases [39]. x m a x and x m i n are the upper and lower admissible limits for the vector decision variables X i t , respectively, as shown in (12). The rate of decrease is shown in Equation (24).
r t = 1 t t max ,
where r t is the radius in iteration t , and  t max is the total number of iterations. Each time the individuals of the population are created X t + 1 , these individuals should be adjusted if necessary to maintain them within their limits as presented in (12) and rounded so that they present a discrete character.

4.3. Implementation of the MGbMO

The implementation of the MGbMO algorithm for the optimal selection of conductors in asymmetric three-phase distribution networks is presented in Algorithm 1.
Algorithm 1: Implementation of the MGbMO algorithm
Data: Select the AC electrical network under study;
Obtain the equivalent in values per unit of the distribution system;
Define the maximum number of iterations ( t max );
Define the size of the initial population ( N i );
Generate the initial population X t and make t = 0 ;
Define the solution space’s initial center ( μ 0 );
for   t t max   do
    Obtain the value of the objective function for each of the individuals of the initial population
     X i t with the help of the slave stage;
    Find the best current solution X b e s t t ;
    Generate a random number between 0 and 1 for e ;
     if   e < 1 2   then
        for   i = 1 : N i   do
           Apply the evolution rule of Equation (19);
           Verify and adjust the values of X i t so that it is within its limits;
           Evaluate X i t in the slave stage to find the value of the objective function;
        end
       Update X b e s t t + 1 to the current best;
     else
       Calculate the radius r t as expressed in (24);
       Generate the descendant population X i t using Equation (21);
       Verify and adjust the values of X i t so that it is within its limits;
        for   i = 1 : N i   do
           Evaluate X i t in the slave stage to find the value of the objective function;
        end
       Update X b e s t t + 1 to the current best;
     end
end
Show the best solution X b e s t t max ;

5. Characteristics of the Test Systems

In this section, the data and main characteristics of two different radial test systems of 8 and 27 buses are presented and used to validate the master-slave methodology to solve the optimal selection of conductors problem. The test systems will be studied according to their configuration, and the two test systems manage Star connections for all their loads.

5.1. General Parameters

Eight different types of conductors are assigned for the test systems discussed below. The data of gauge, resistance, impedance, maximum thermal currents, and cost per kilometer for each one are presented in Table 3.
Table 4 shows the general simulation parameters for both test systems.

5.2. 8-Bus Test System

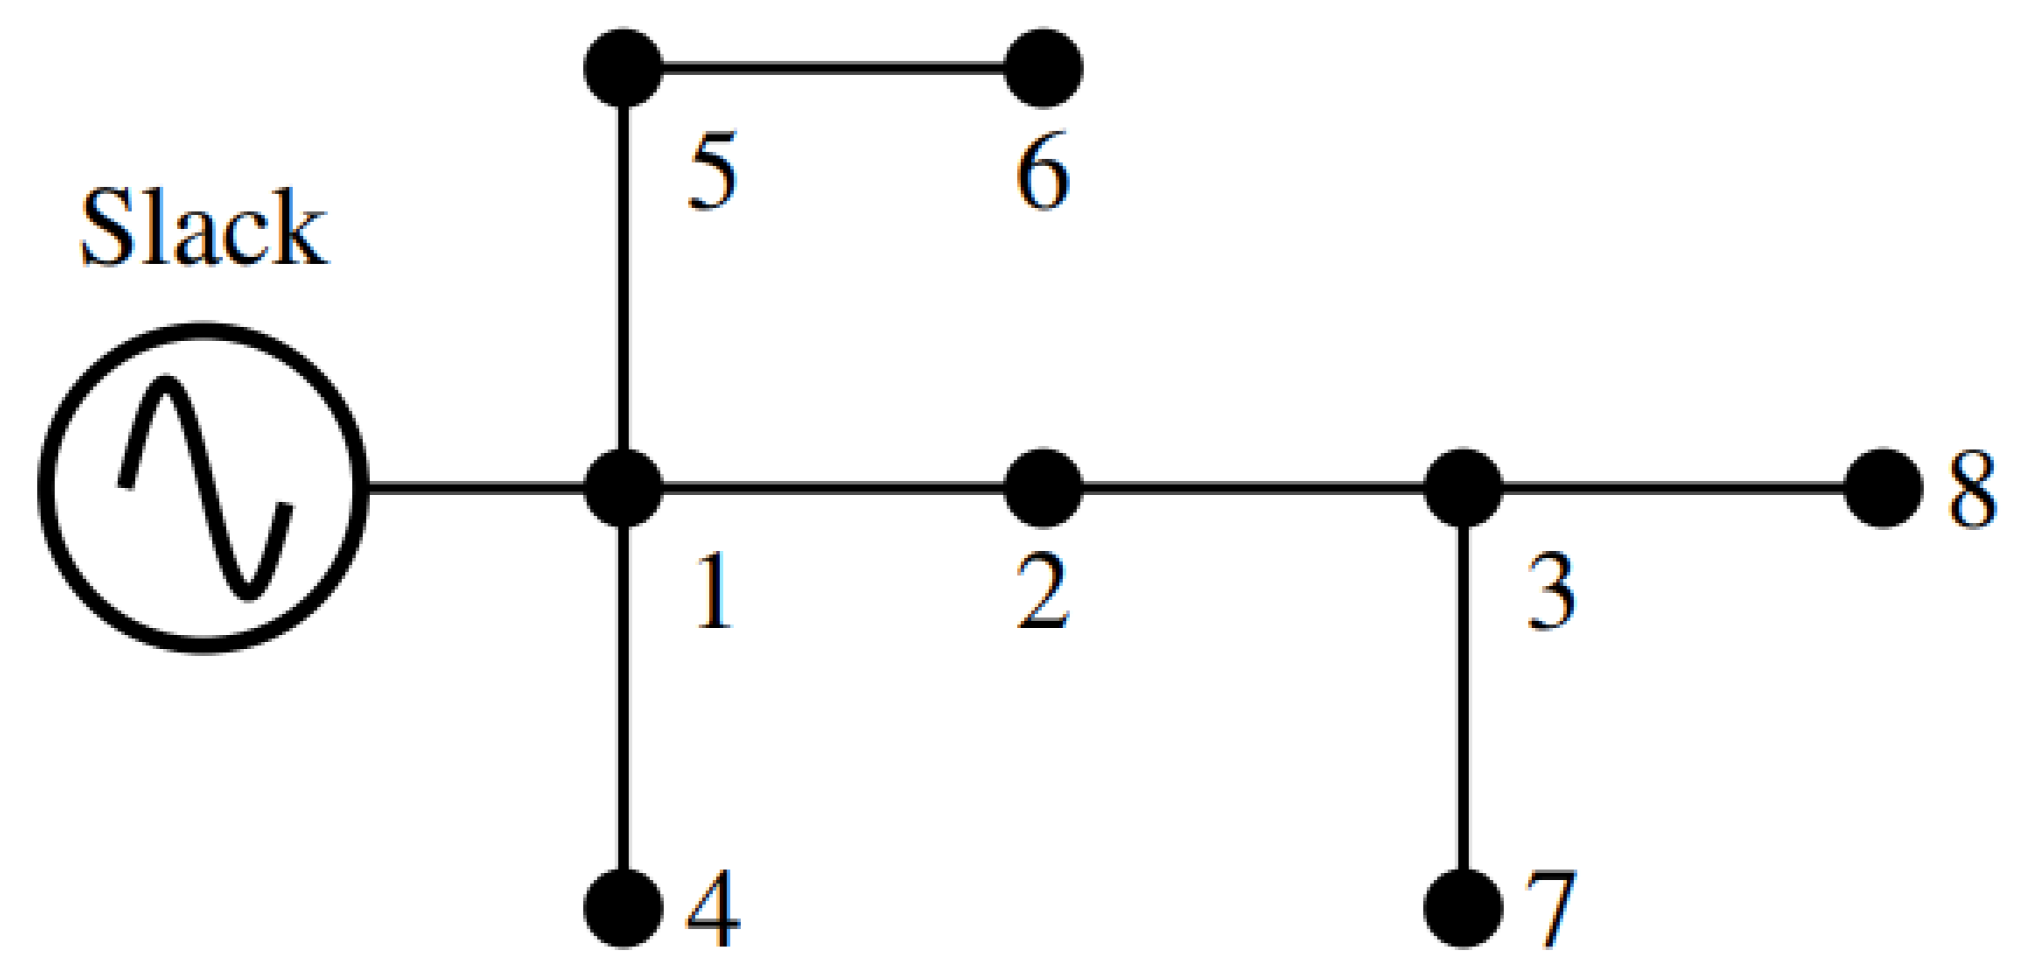
The three-phase test system has a radial topology and has 7 lines and 8 buses that operate with a nominal voltage of 13.8 kV between phase and neutral with a unity power factor. The slack bus is located on bus 1 [29]. Figure 2 shows the single-line diagram of this test system.
The data of how the lines are connected to the different buses and their length are shown in Table 5, as well as the data for the balanced case of the 8-bus system, where the levels of both active and reactive load present in each bus are indicated.
The data for the unbalanced case of the 8-bus system are presented in Table 6, where both the active and reactive load levels present in each bus are indicated.

5.3. 27-Bus Test System

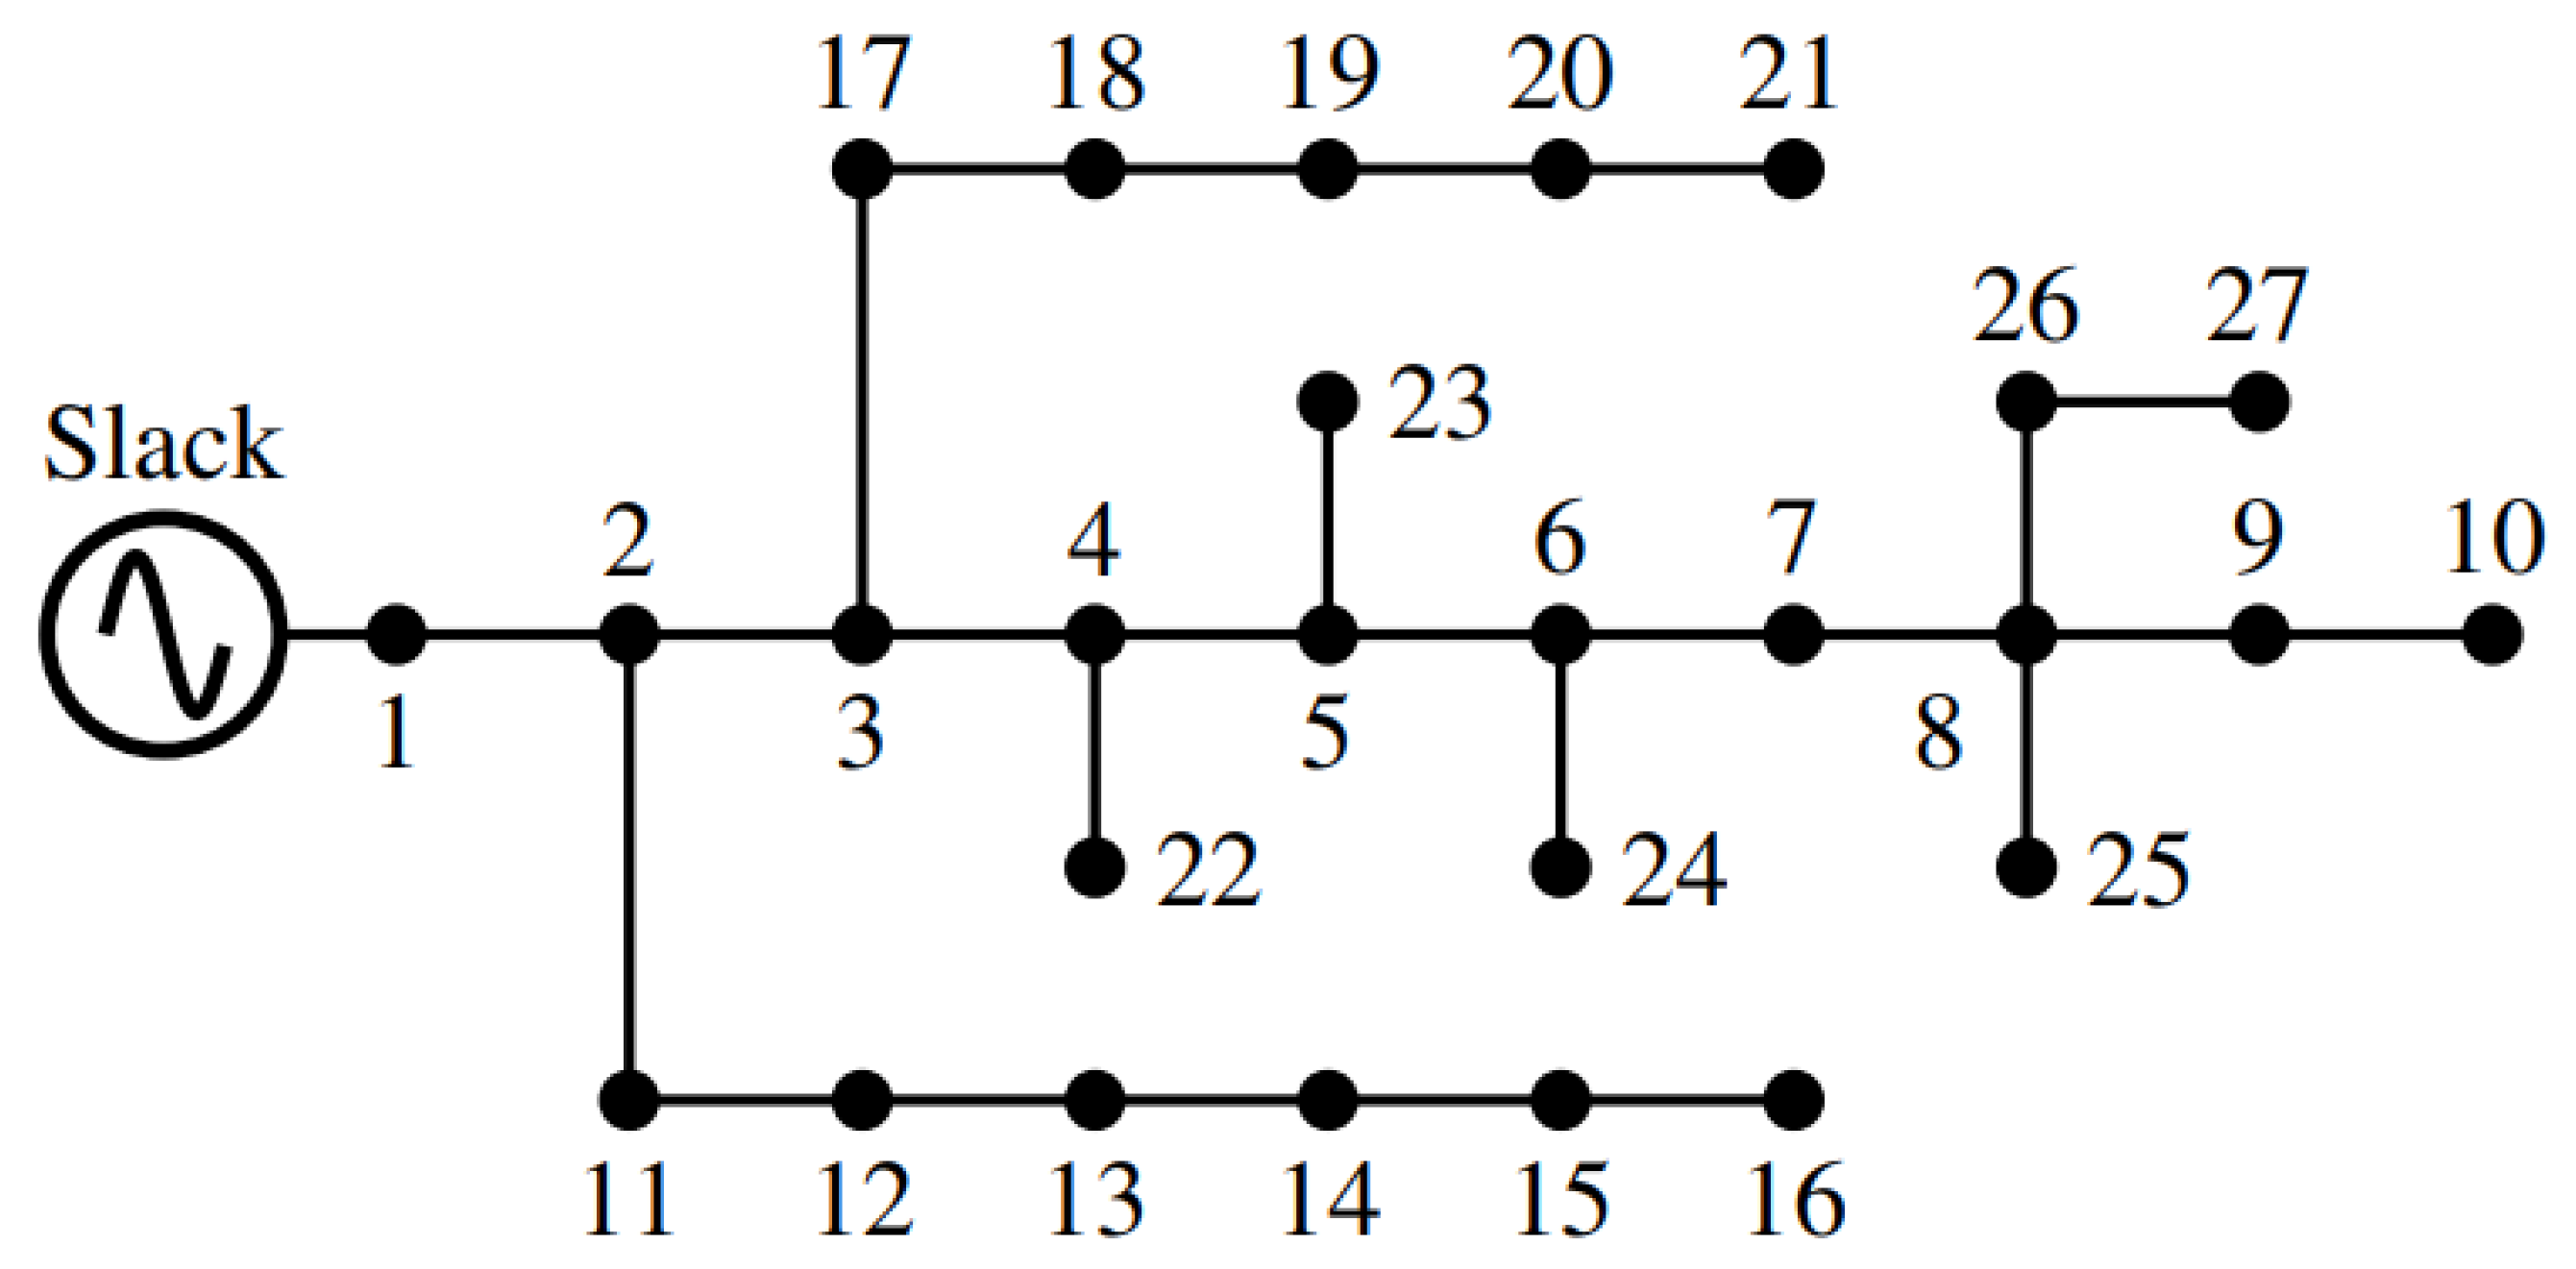
The three-phase test system has a radial topology and 26 lines and 27 buses that operate with a nominal voltage of 13.8 kV between phase and neutral with a unity power factor. The slack bus is located on bus 1 [29]. Figure 3 shows the single-line diagram of this test system.
The data on how the lines are connected to the different buses and their length are shown in Table 7, as well as the data for the balanced case of the 27-bus system, where the levels of both active and reactive load present in each bus are indicated.
The data for the unbalanced case of the 27-bus system are presented in Table 8, where the levels of both active and reactive load present in each bus are indicated.

6. Results and Discussion

The proposed optimization methodology is implemented on a personal computer using MATLAB® R2021a software. The computer has an Intel (R) Core (TM) i7-8565U CPU @1.80 GHz 1.99 GHz, 8 Gb RAM (Intel, Santa Clara, CA, USA), and Windows 11 Home operating system of ×64 bits. The results are analyzed with the help of Microsoft Power BI Desktop® Version 2.109.642.0 ×64 bits (Redmond, WA, USA).
To demonstrate the effectiveness of the MGbMO algorithm, this section presents the numerical validation of the solution of the optimal conductor selection problem for the IEEE 8- and 27-bus test systems compared with two other techniques used for solving the optimal conductor selection problem: Newton’s metaheuristic algorithm (NMA) [32] and the vortex search algorithm (VSA) [29]. For the comparison, it is considered that all the algorithms would work with 30 individuals and 1000 iterations; additionally, an operating scenario in peak demand for the entire year is taken into account, i.e., T = 8760 h and with the demand of 100% at every instant of time. The convergence presented by the MGbMO algorithm for all study systems is analyzed.
In the case of the three-phase unbalanced version of the IEEE 85-bus grid, a daily operation scenario considering a typical demand curve and the presence of two renewable generators is also considered to verify the effectiveness and robustness of the proposed MGbMO under demand and generation of varying profiles.
It is noteworthy that in this research, the boundaries of the solution space regarding the possible conductor types are between 1 and 8 (maximum conductor size included); regarding current flows, their limits are restricted by the nominal rates associated with each selected conductor, and the voltage profile as set as ± 10 % of the nominal voltage value of the distribution network under analysis.

6.1. Results in the 8-Bus Test System

6.1.1. Balanced Case for the 8-Bus Test System

Table 9 shows the numerical results obtained by the different comparison algorithms, such as the traditional genetic algorithm (TGA), the Chu and Beasley genetic algorithm (CBGA), the exact solution in GAMS of the PNLEM model, the tabu search algorithm (TSA), the vortex search algorithm (VSA), and Newton’s metaheuristic algorithm (NMA). These data were obtained from the article [32] and the results of the MGbMO algorithm.
The results presented in Table 9 demonstrate the following:
  • The MGbMO algorithm obtained the best numerical result for the balanced 8-bus system, yielding annual costs of USD 455,969,791, with USD 227,826 in the investment of the conductors and USD 228,143,791 in the costs associated with the losses.
  • The result obtained by the MGbMO algorithm improved by 10.3% compared to the VSA and NMA algorithms, which obtained the second-best solutions with USD 508,357.959 for annual costs, which represents a reduction of USD 52,388.2 for the study case.
  • The cost of the investment of the conductors, according to the set of gauges selected by the MGbMO algorithm, presents the highest cost compared to the rest of the algorithms; however, the cost of annual losses is lower, which thus ends up compensating for the high costs in the investment of the conductors.
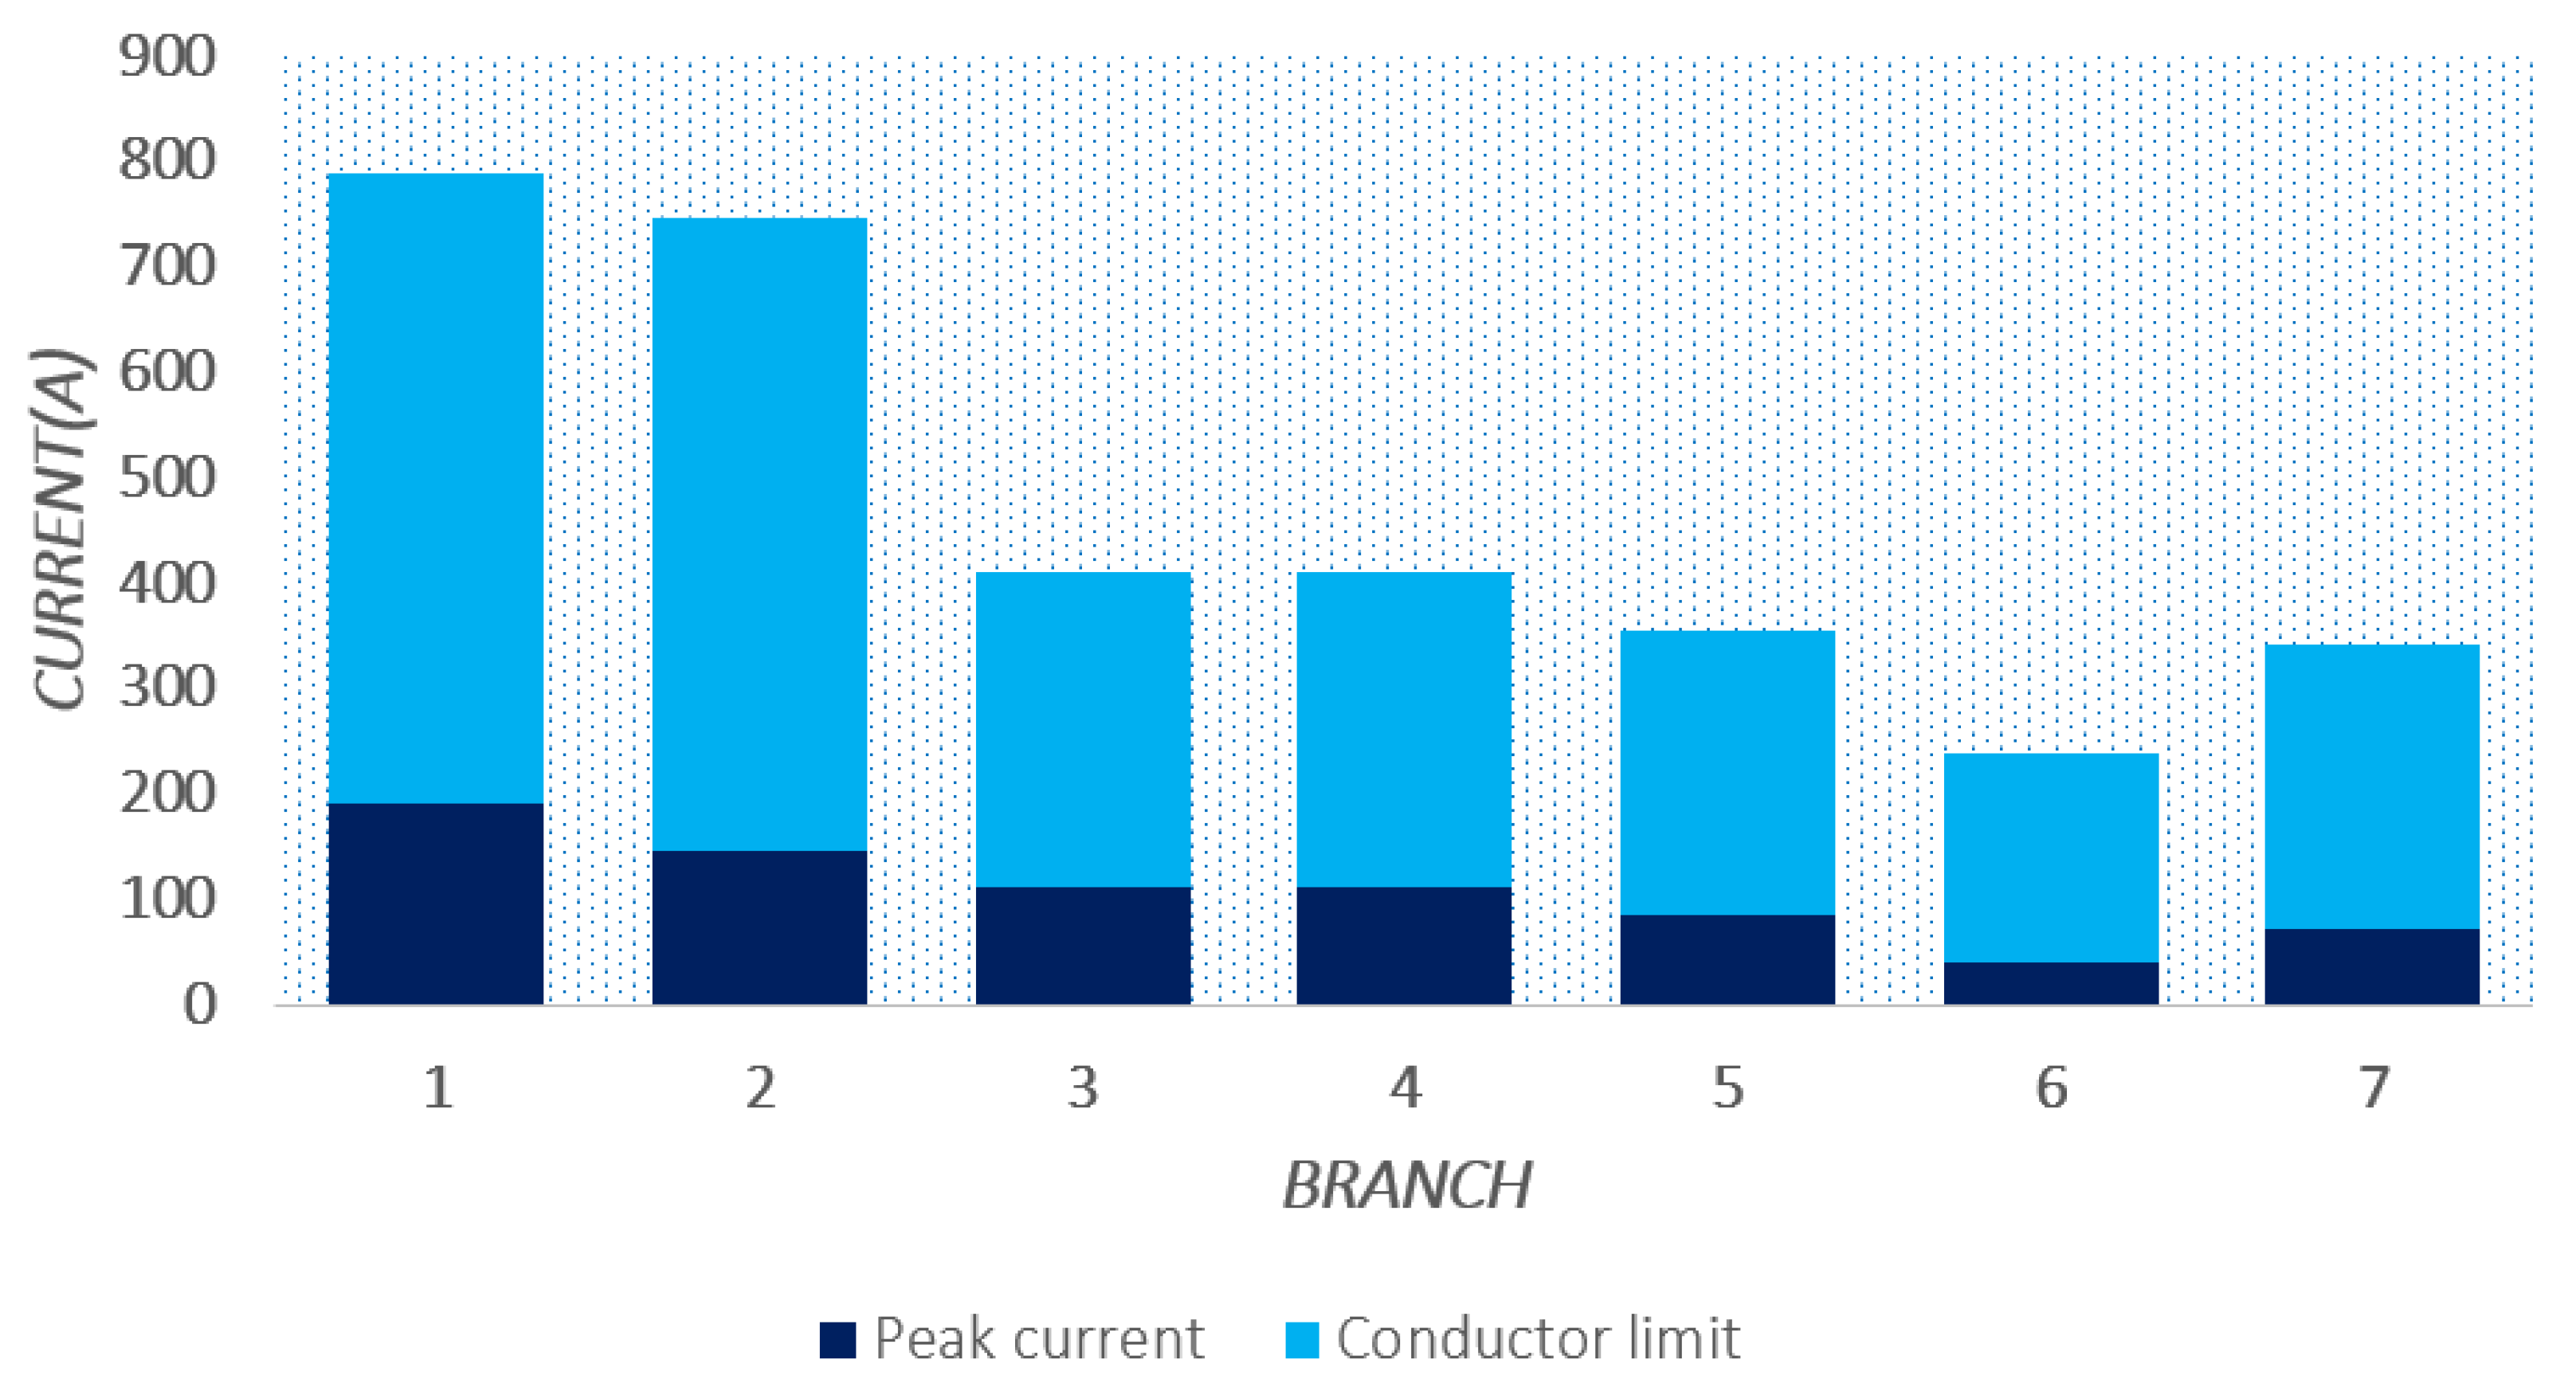
To determine the behavior of the radial distribution system for this case study, Figure 4 and Figure 5 demonstrate the behavior of the peak currents flowing in the different branches and the voltage profiles in the buses, respectively.
In Figure 4, it can be observed that the maximum current levels in each of the branches are well away from their established limits according to the conductor gauges, which allows energy losses to be low, thus decreasing their costs, as shown in Table 9.
Figure 5 shows that the voltage levels remain close to 1 pu, the lowest occurring at bus 6 with a value of 0.9904 pu. It is important to mention that only one behavior is shown for the three phases because the system is balanced.

6.1.2. Unbalanced Case for the 8-Bus Test System

Table 10 shows the numerical results obtained by the different comparison algorithms, such as the vortex search algorithm (VSA) and the Newton metaheuristic algorithm (NMA). These data were obtained from article [32] and the results of the MGbMO algorithm.
The results presented in Table 10 demonstrate the following:
  • The MGbMO algorithm equaled the results of the VSA and NMA algorithms for the unbalanced 8-bus system, yielding annual costs of USD 558,758,394, with USD 289,713 in the investment of the conductors and USD 269,045,394 in the costs associated with the losses.
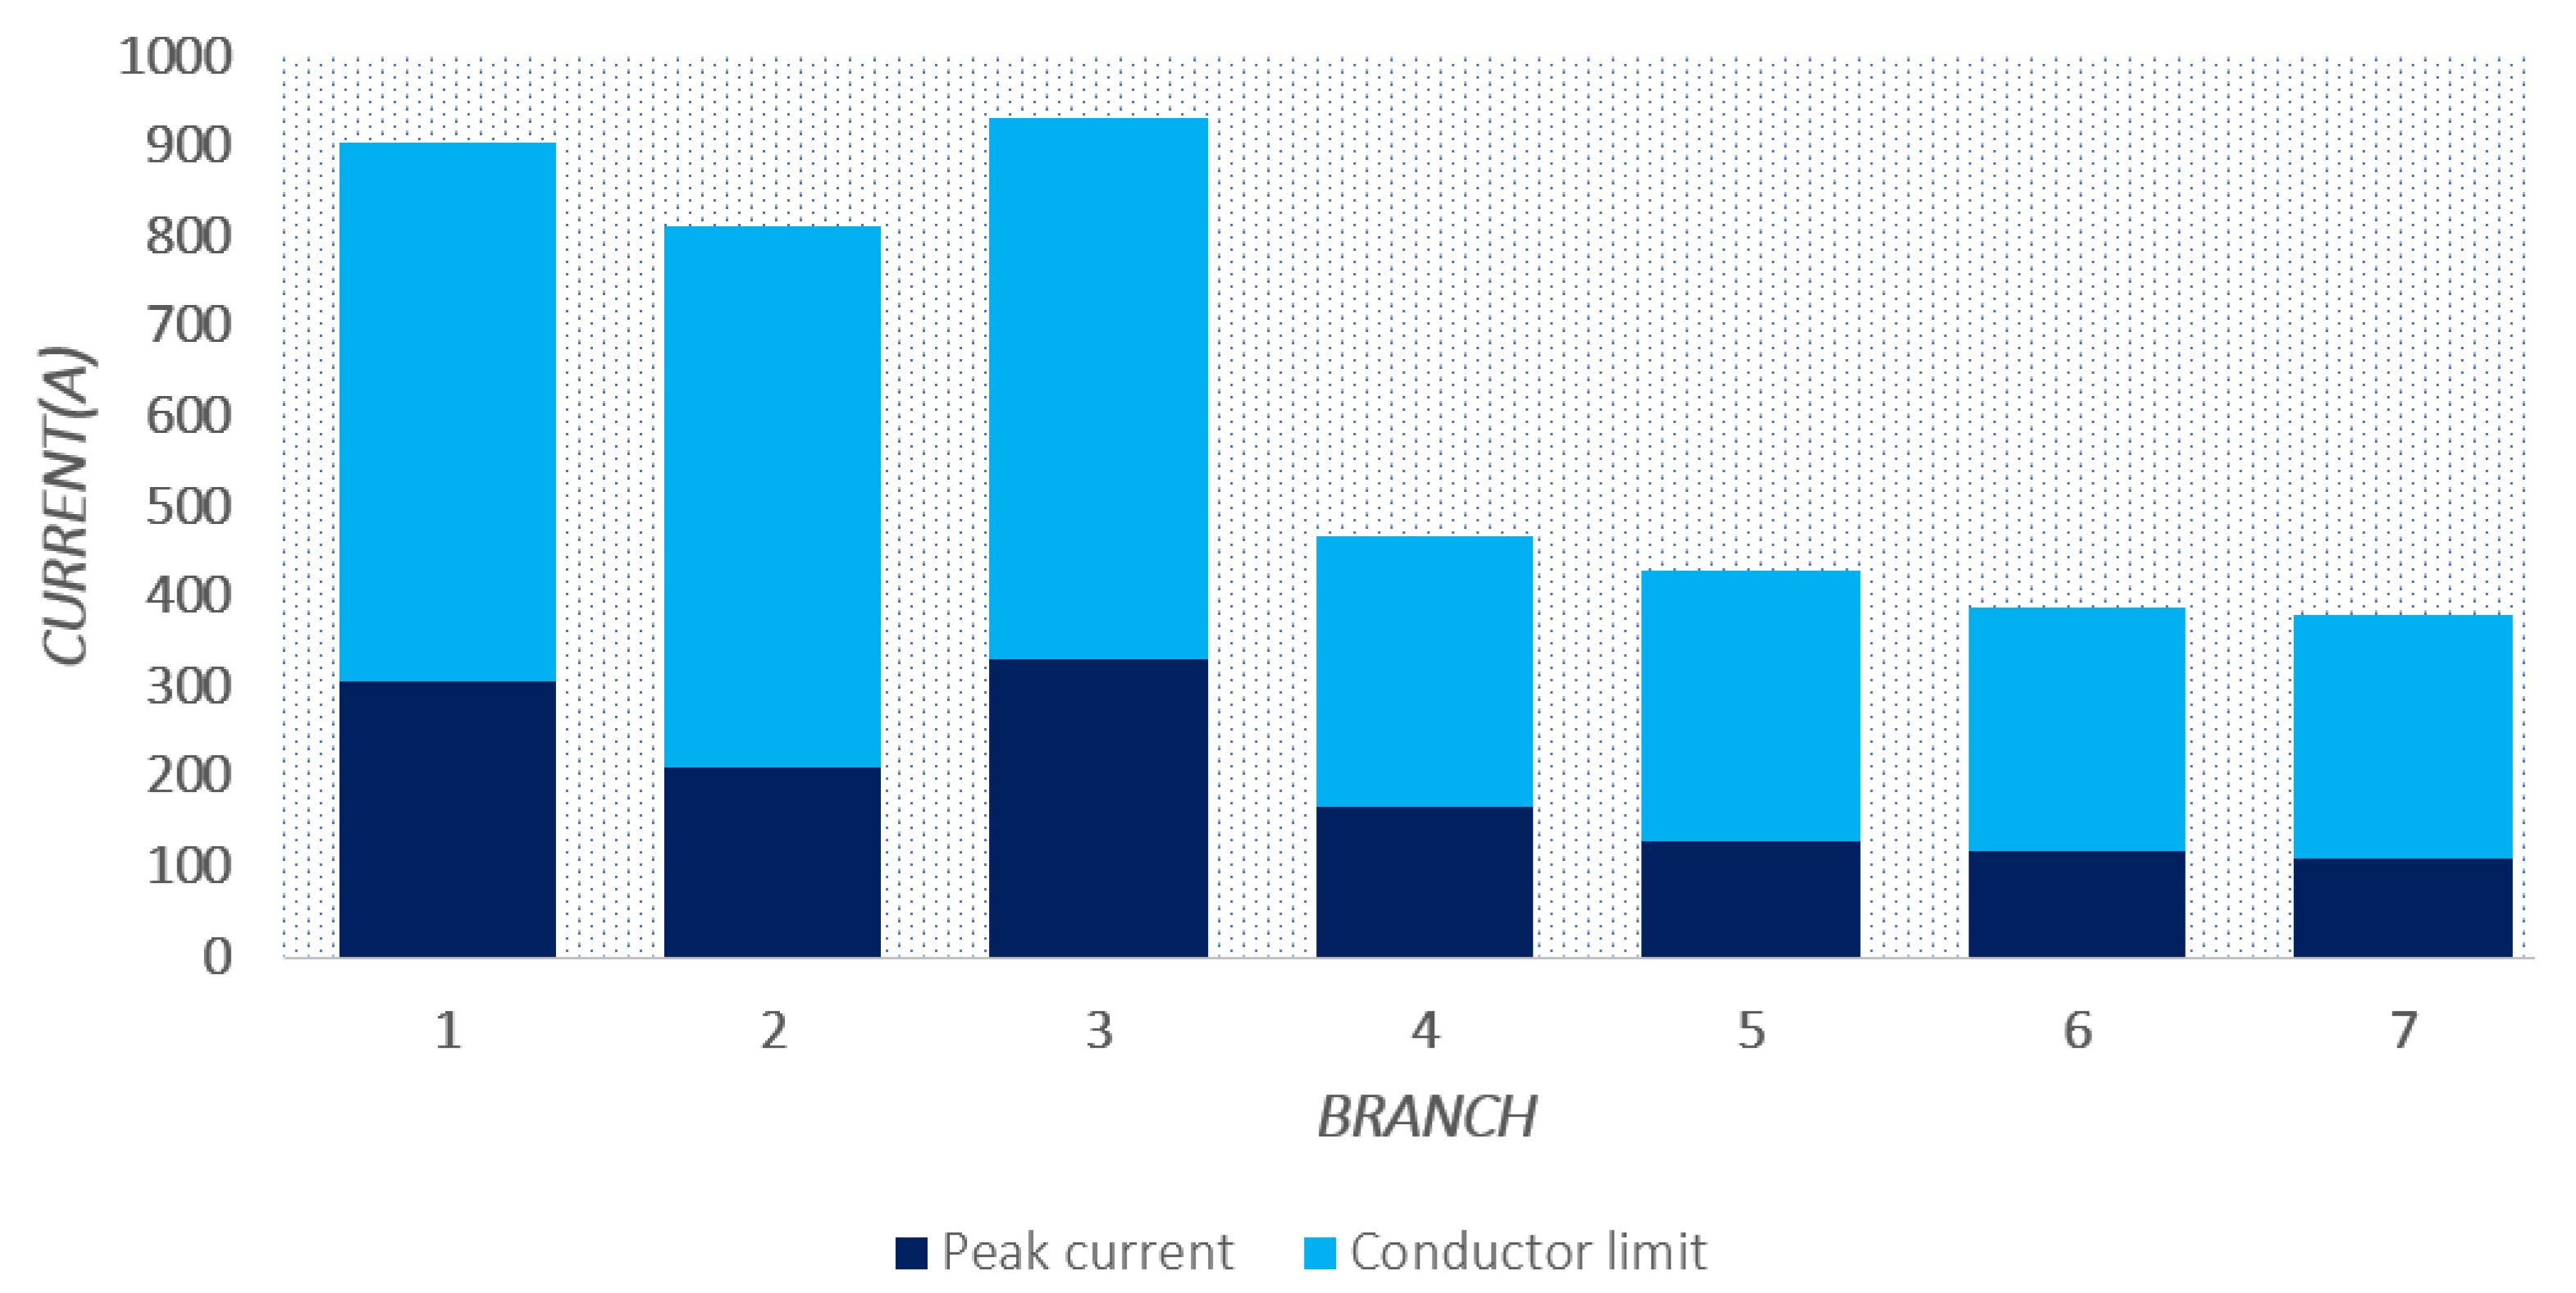
To determine the behavior of the radial distribution system for this case study, Figure 6 and Figure 7 show the behavior of the peak currents flowing in the different branches and the voltage profiles in the buses, respectively.
In Figure 6, the maximum current levels in each of the branches are well away from their established limits according to the conductor gauges, which allows energy losses to be low, thus decreasing their costs, as shown in Table 10. The highest current level is seen in branch 3, which is close to 35% of the conductor limit.
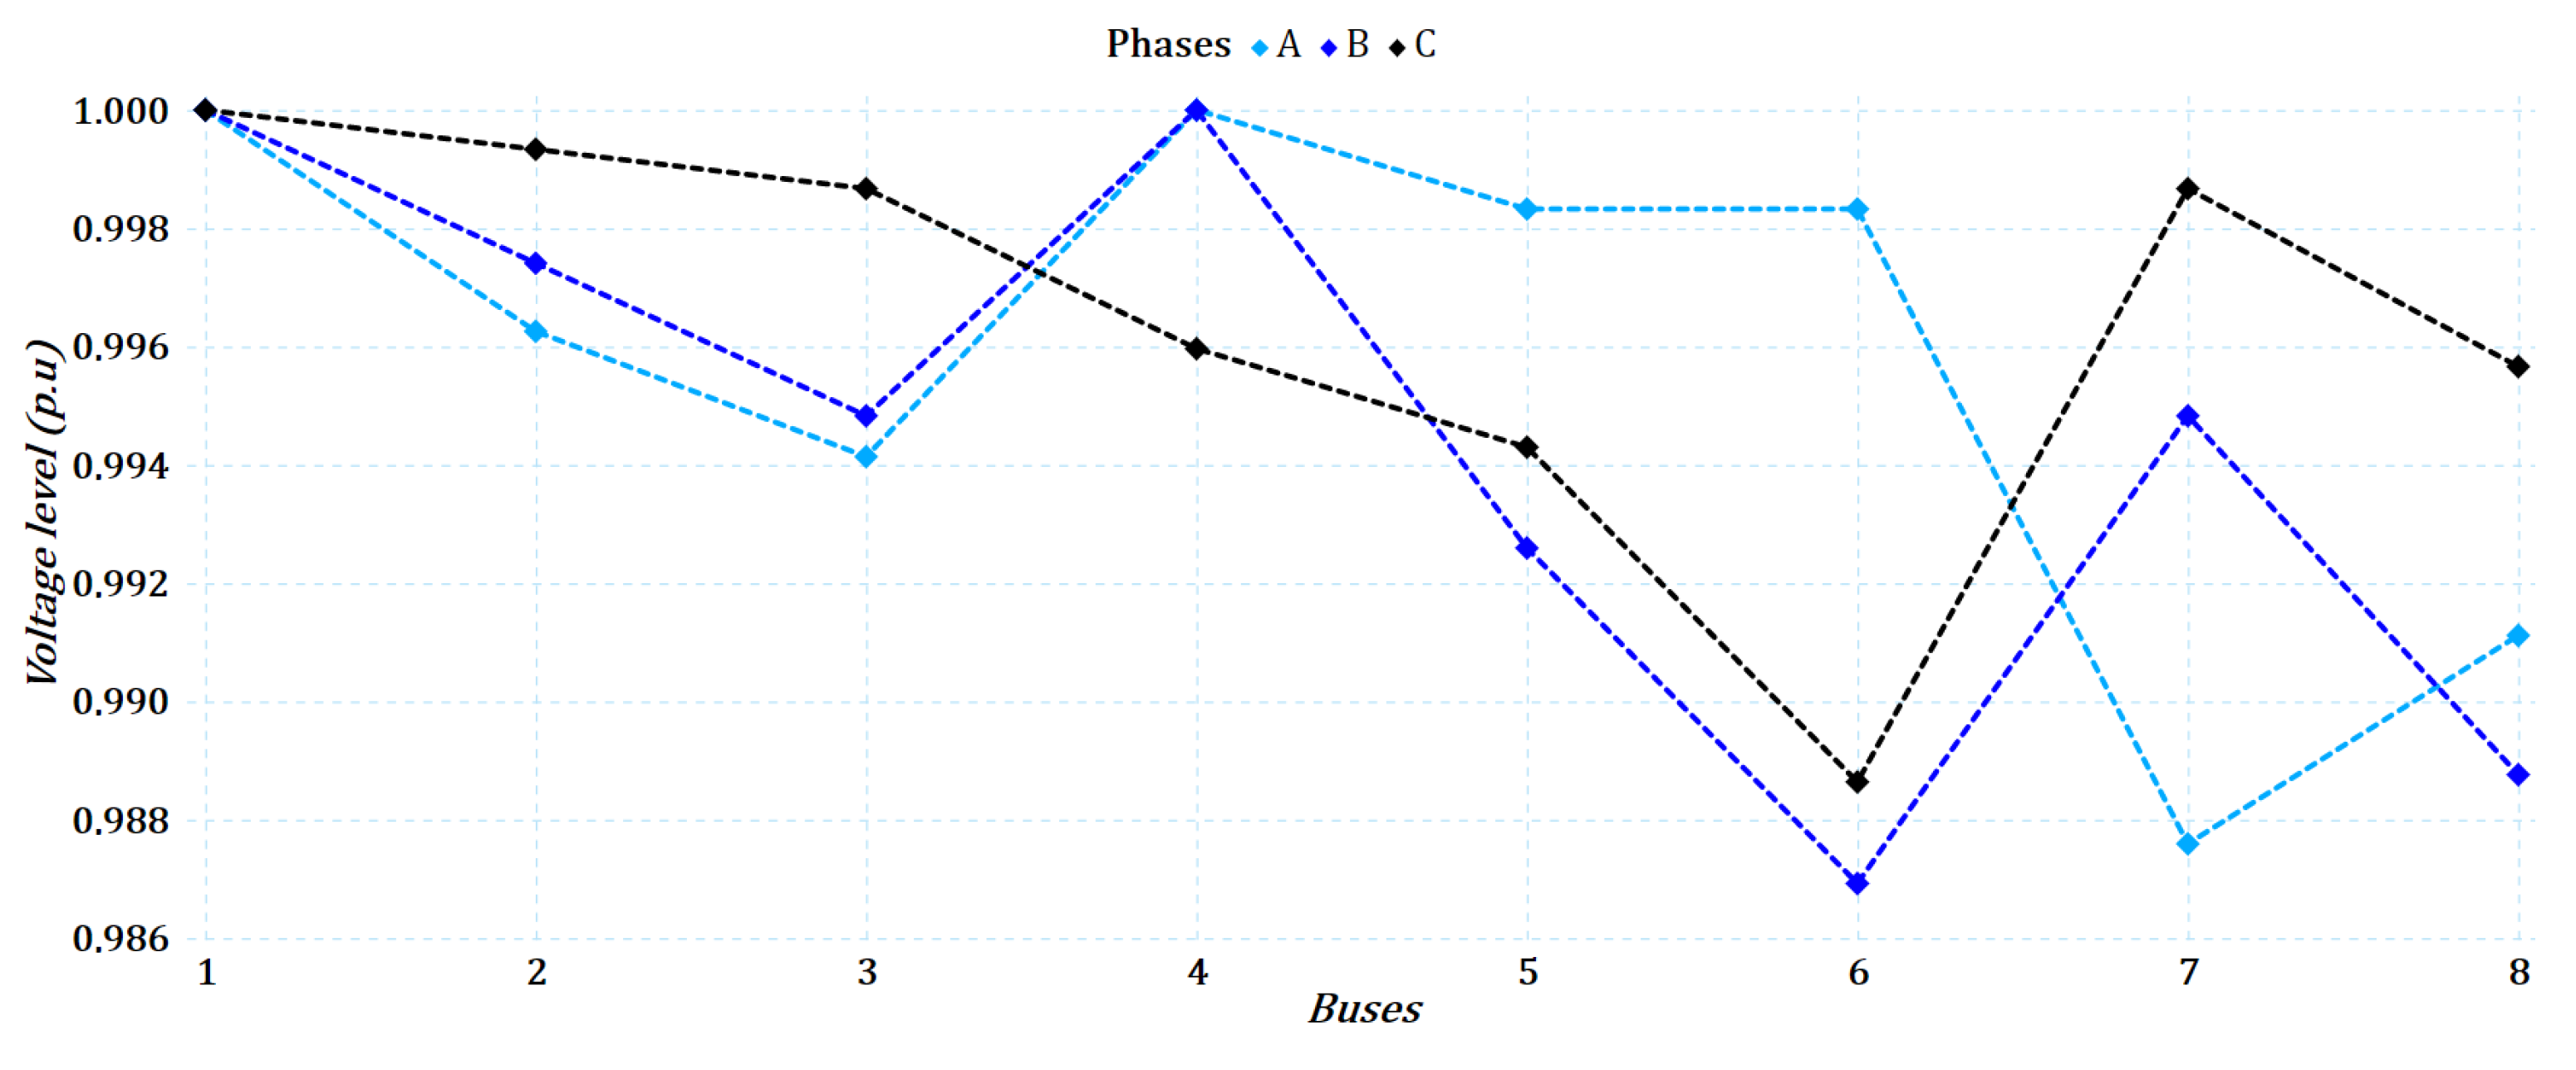
In Figure 7, the voltage levels remain close to 1 pu, the lowest being the one presented in bus 6 in phase B with a value of 0.9869 pu. It is important to mention that for this scenario, the voltage profiles for each phase are shown because the system is unbalanced.

6.2. Results in the 27-Bus Test System

6.2.1. Balanced Case for the 27-Bus Test System

Table 11 shows the numerical results obtained by the different comparison algorithms, such as the vortex search algorithm (VSA) and the Newton metaheuristic algorithm (NMA). These data were obtained from the article [32] and the results of the MGbMO algorithm.
The results presented in Table 11 demonstrate the following:
  • The MGbMO algorithm obtained the best numerical result for the balanced 27-bus system, yielding annual costs of USD 549,883.572, with USD 319,768.08 in the investment of the conductors and USD 230,115.492 in the costs associated with losses.
  • The result obtained by the MGbMO algorithm improved by 1.4% compared to the NMA algorithm, which obtained the second-best solution with USD 557,695.255 for annual costs, representing a reduction of USD 7811.68 for the case study.
  • The cost of the investment of the conductors, according to the set of gauges selected by the MGbMO algorithm, presents the lowest cost compared to the rest of the algorithms, thus increasing the costs of annual losses slightly. In the end, the costs are compensated, as shown in the annual costs, allowing a lower value in the objective function.
To determine the behavior of the radial distribution system for this case study, Figure 8 and Figure 9 show the behavior of the peak currents flowing in the different branches and the voltage profiles in the buses, respectively.
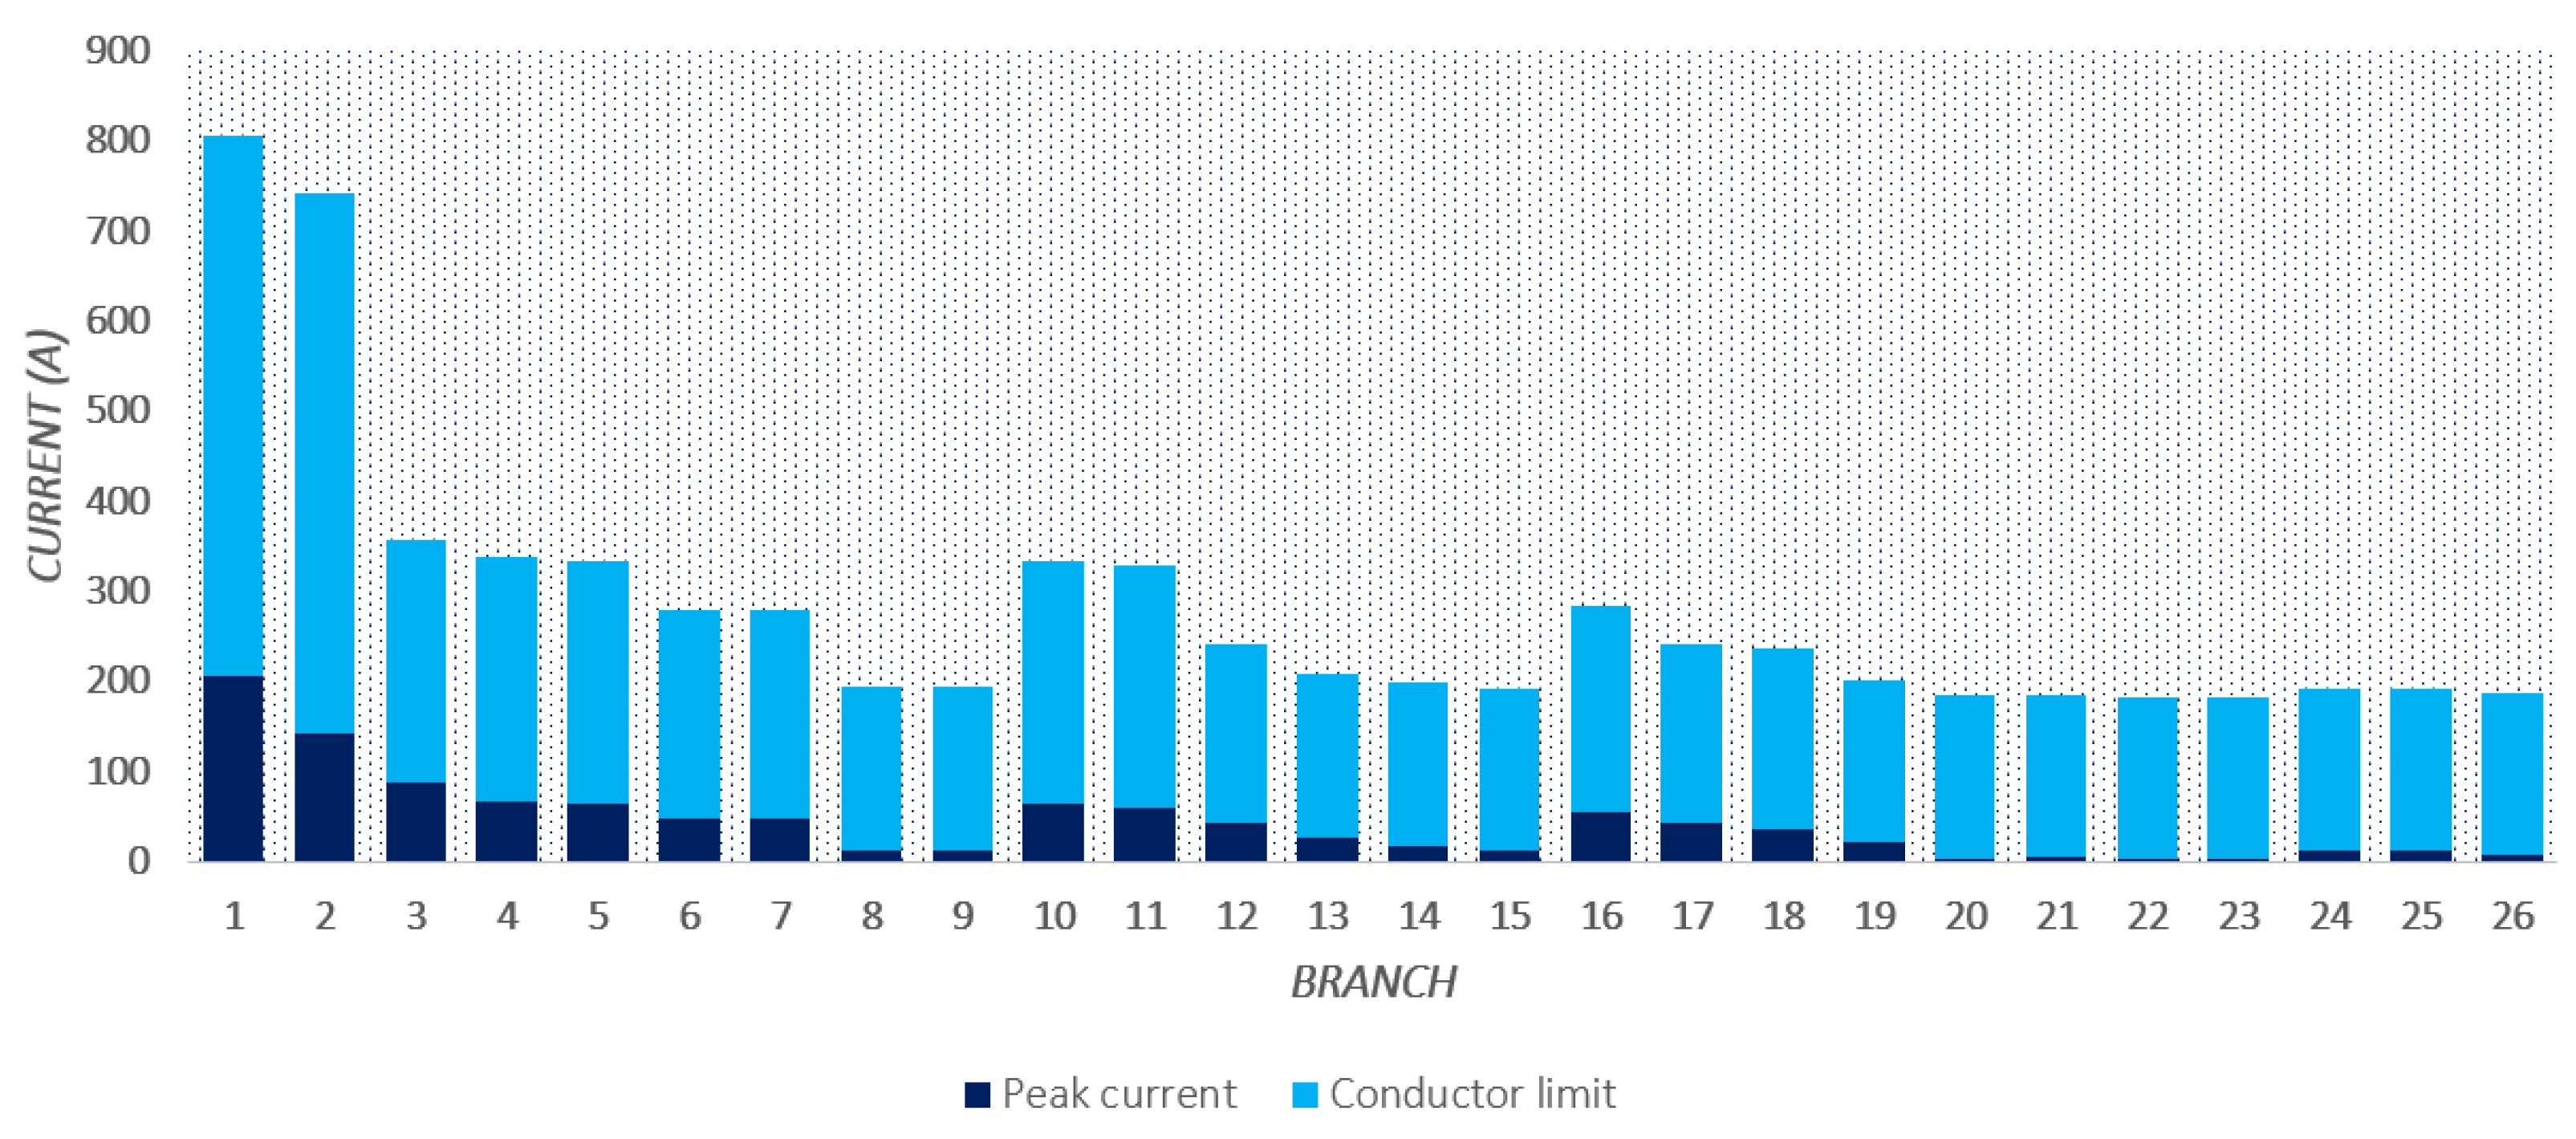
In Figure 8, it can be observed that the maximum current levels in each of the branches are well away from their established limits according to the conductor gauges, which allows energy losses to be low, thus decreasing their costs as shown in Table 11.
Figure 9 demonstrates that the voltage levels remain close to 1 pu, the lowest voltage with a value of 0.9771 pu. It is important to mention that only one behavior is shown for the three phases because the system is balanced.

6.2.2. Unbalanced Case for the 27-Bus Test System

Table 12 presents the numerical results obtained by the different comparison algorithms, such as the vortex search algorithm (VSA) and the Newton metaheuristic algorithm (NMA). These data were obtained from the article [32] and the results of the MGbMO algorithm.
The results presented in Table 12 demonstrate the following:
  • The MGbMO algorithm obtained the best numerical result for the unbalanced 27-bus system, yielding annual costs of USD 589,018.8, with USD 331,828.08 in the investment of the conductors and USD 257,190.72 in the costs associated with the losses.
  • The result obtained by the MGbMO algorithm improved by 1.432% compared to the NMA algorithm, which obtained the second-best solution with USD 597,579.008 for annual costs, thus representing a reduction of USD 8560.21 for the case study.
  • The cost of the investment of the conductors, according to the set of gauges selected by the MGbMO algorithm, presents the lowest cost compared to the rest of the algorithms, thus increasing the costs of annual losses slightly but without exceeding the costs presented by the VSA version. These costs are compensated in the end, as shown in the annual costs, allowing a lower value in the objective function.
To determine the behavior of the radial distribution system for this case study, Figure 10 and Figure 11 show the behavior of the peak currents flowing in the different branches and the voltage profiles in the buses, respectively.
In Figure 10, the maximum current levels in each of the branches are well away from their established limits according to the conductor gauges, which allows energy losses to be low, reducing their costs as shown in Table 12. The highest level is presented in branch 1, which is close to 28% of the conductor’s limit.
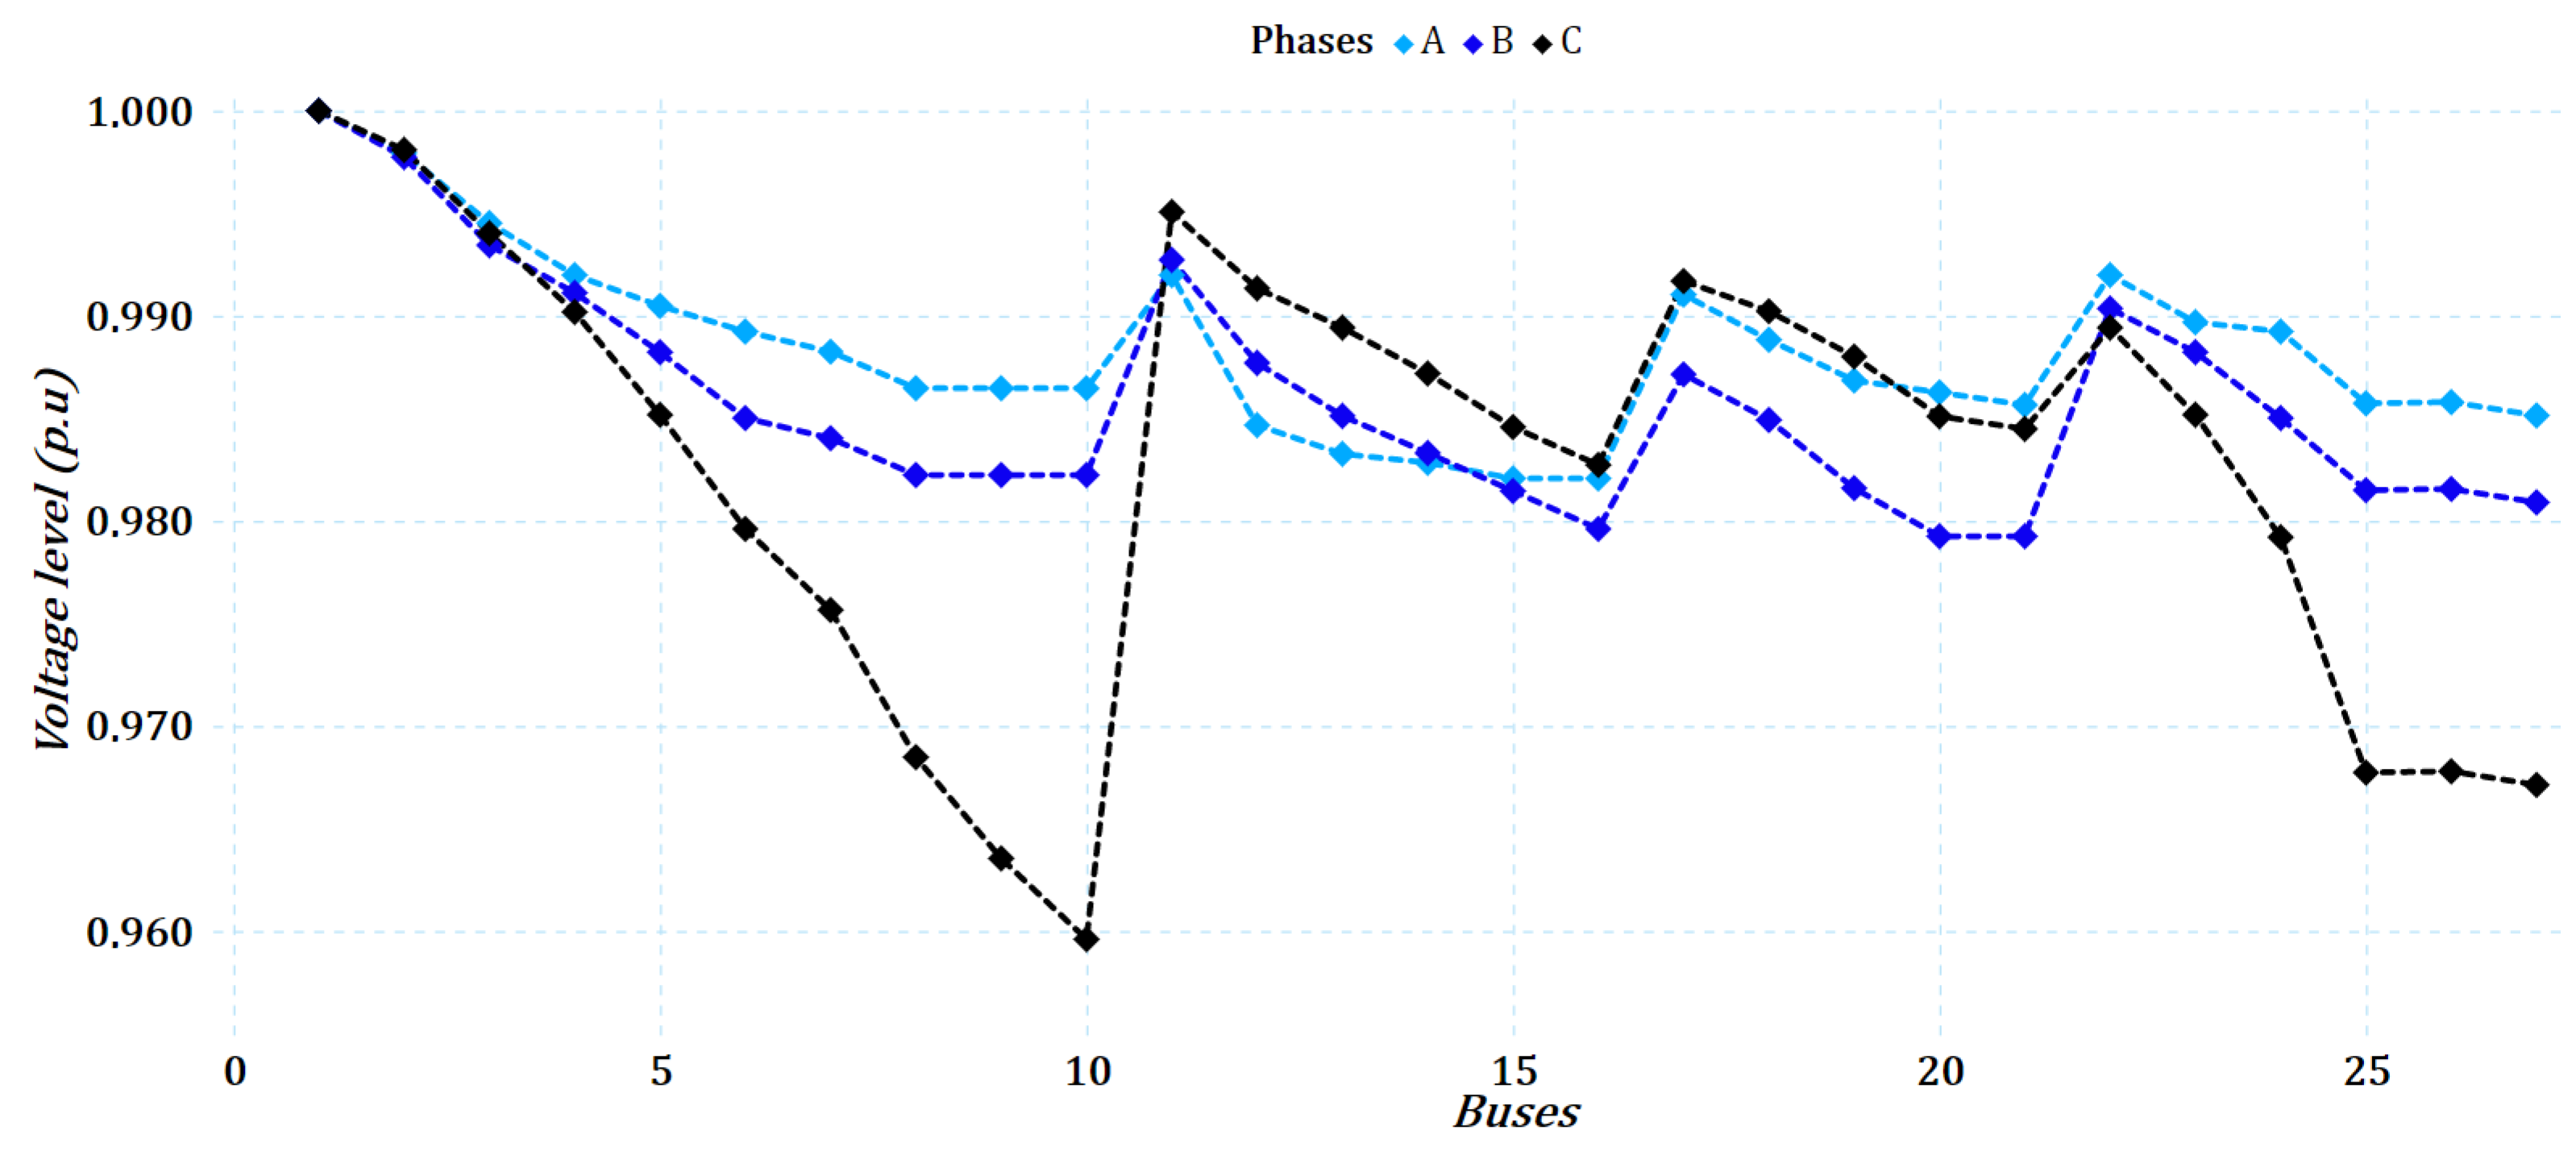
In Figure 11, it can be observed that the voltage levels remain close to 1 pu, and the lowest values occurred in buses 10, 25, 26, and 27 of phase C, the lowest being that of bus 10 with a value of 0.96 pu. It is essential to mention that for this scenario, the voltage profiles for each phase are shown because the system is unbalanced.

6.3. Performance of the Algorithm

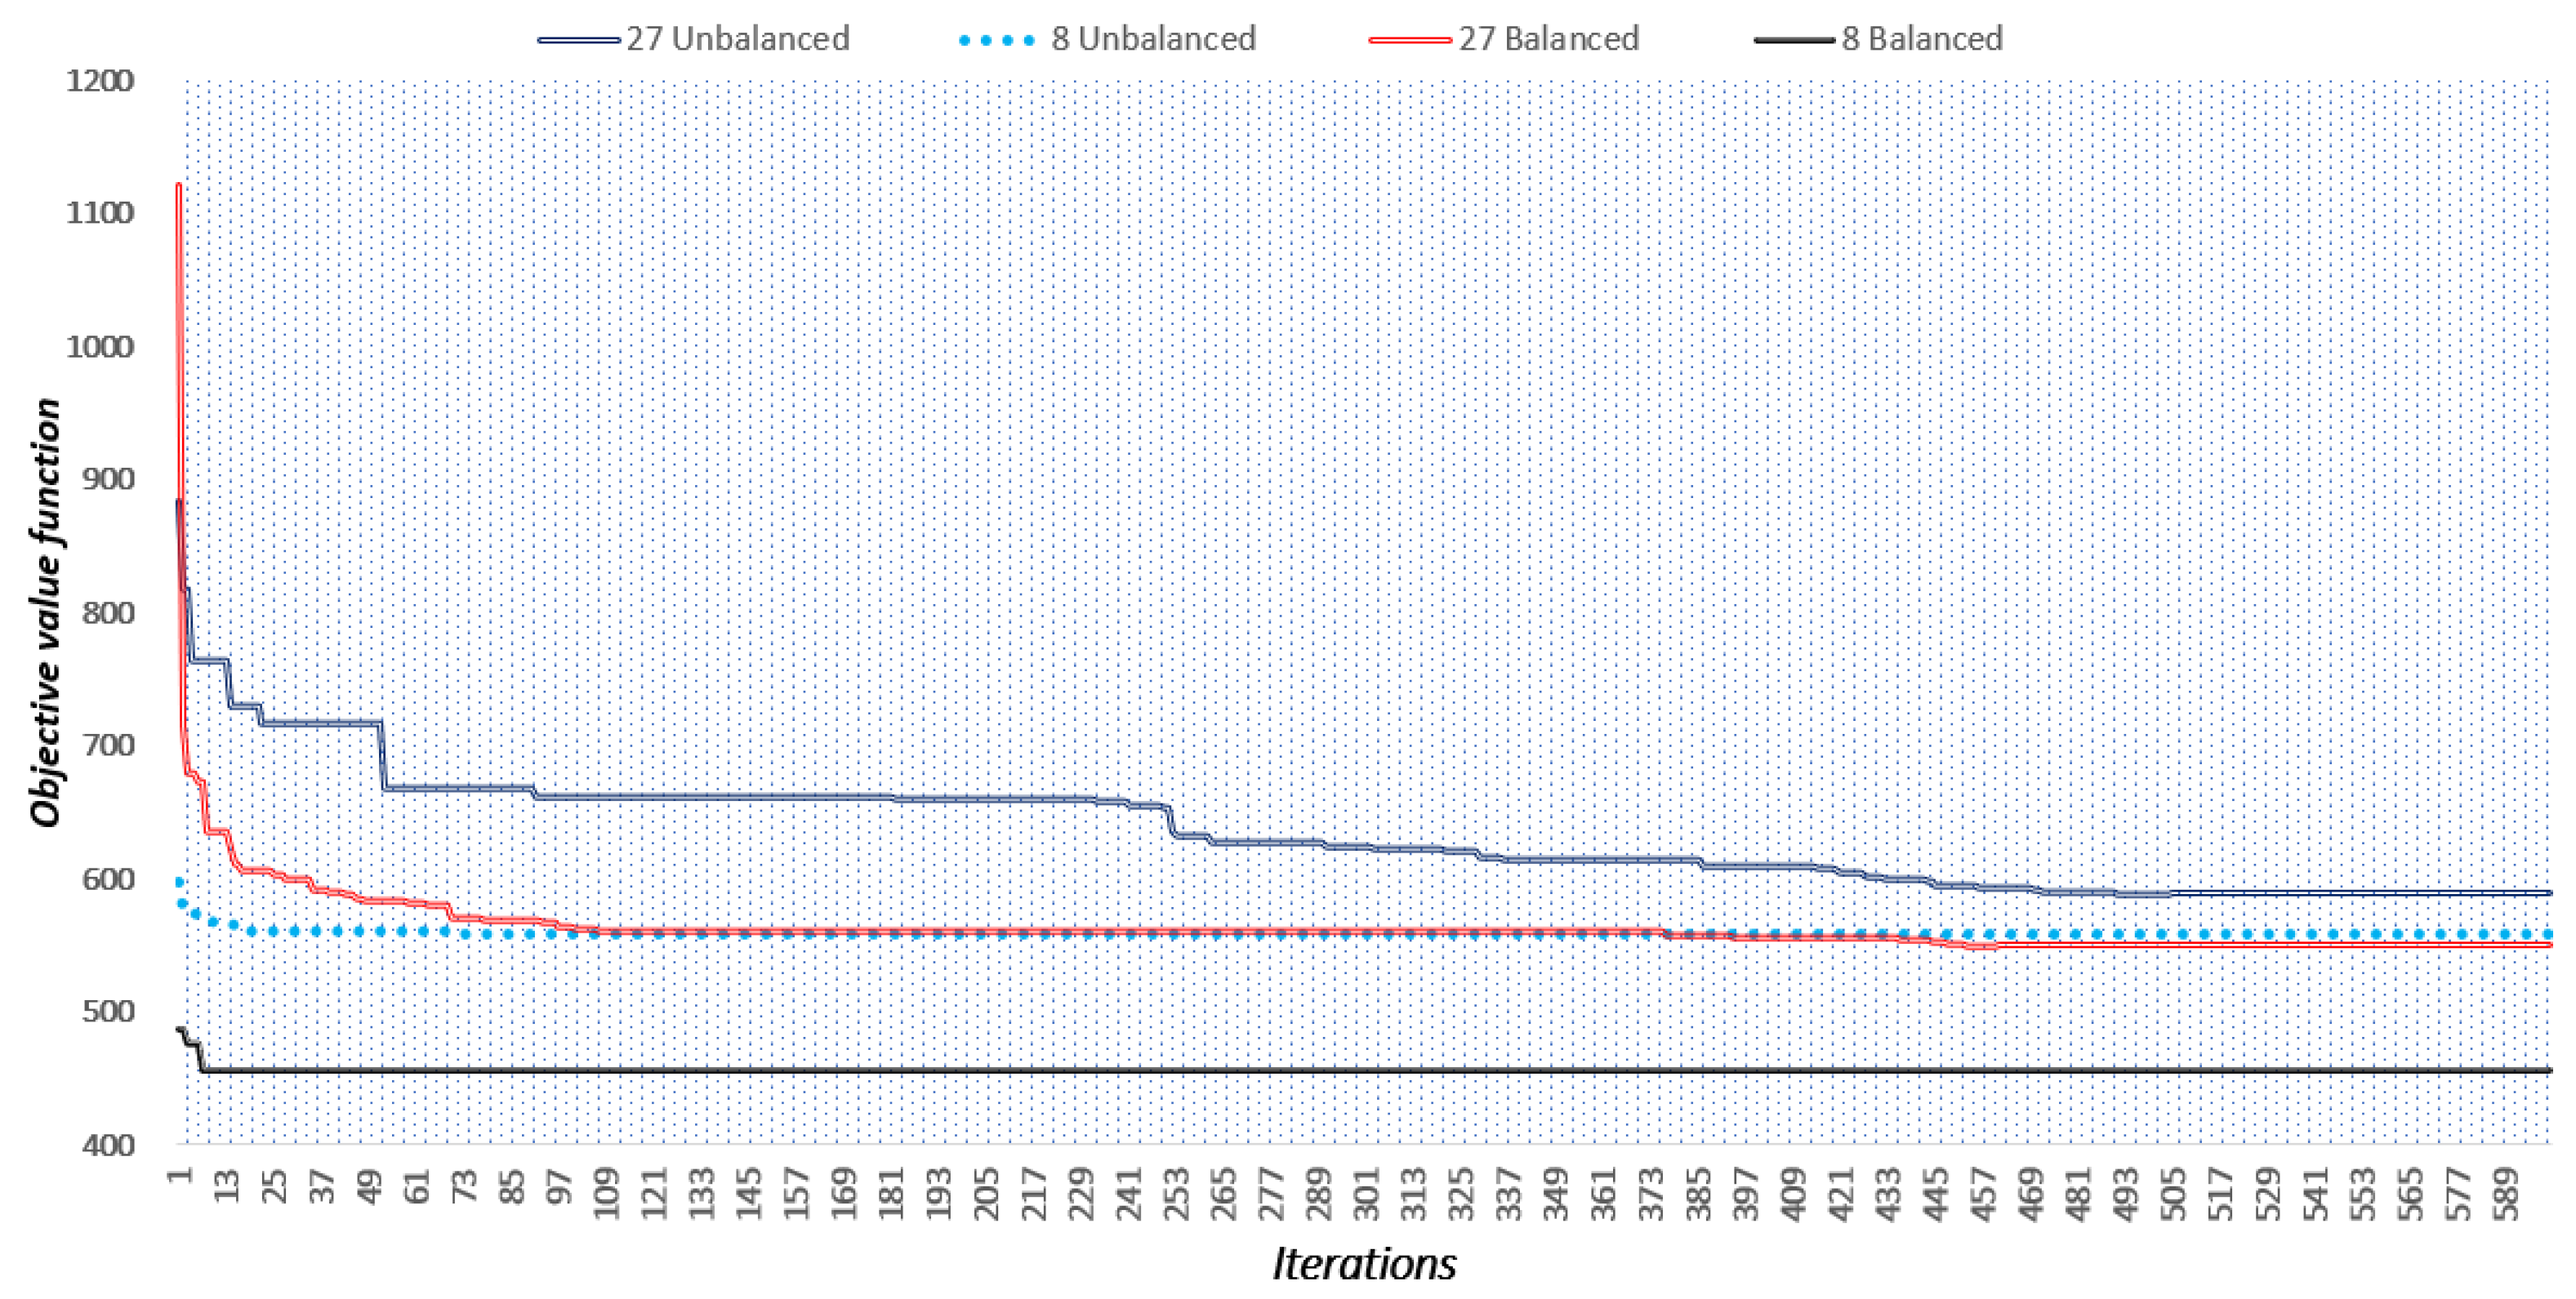
To illustrate the MGbMO algorithm’s performance and determine its convergence behavior, Figure 12 shows this proposed methodology’s behavior in each case study. It should be noted that the algorithm seeks to optimize the objective function throughout the 1000 iterations.
Figure 12 showcases that for 8-bus systems, both balanced and unbalanced, the value of the objective function converges in a few iterations. In particular, the fastest case of convergence is around the tenth iteration. Conversely, for 27-bus systems, the number of iterations is more significant, reaching close to 500, thus making this study scenario the slowest compared to the 8-bus system.

6.4. A Daily Operation Scenario

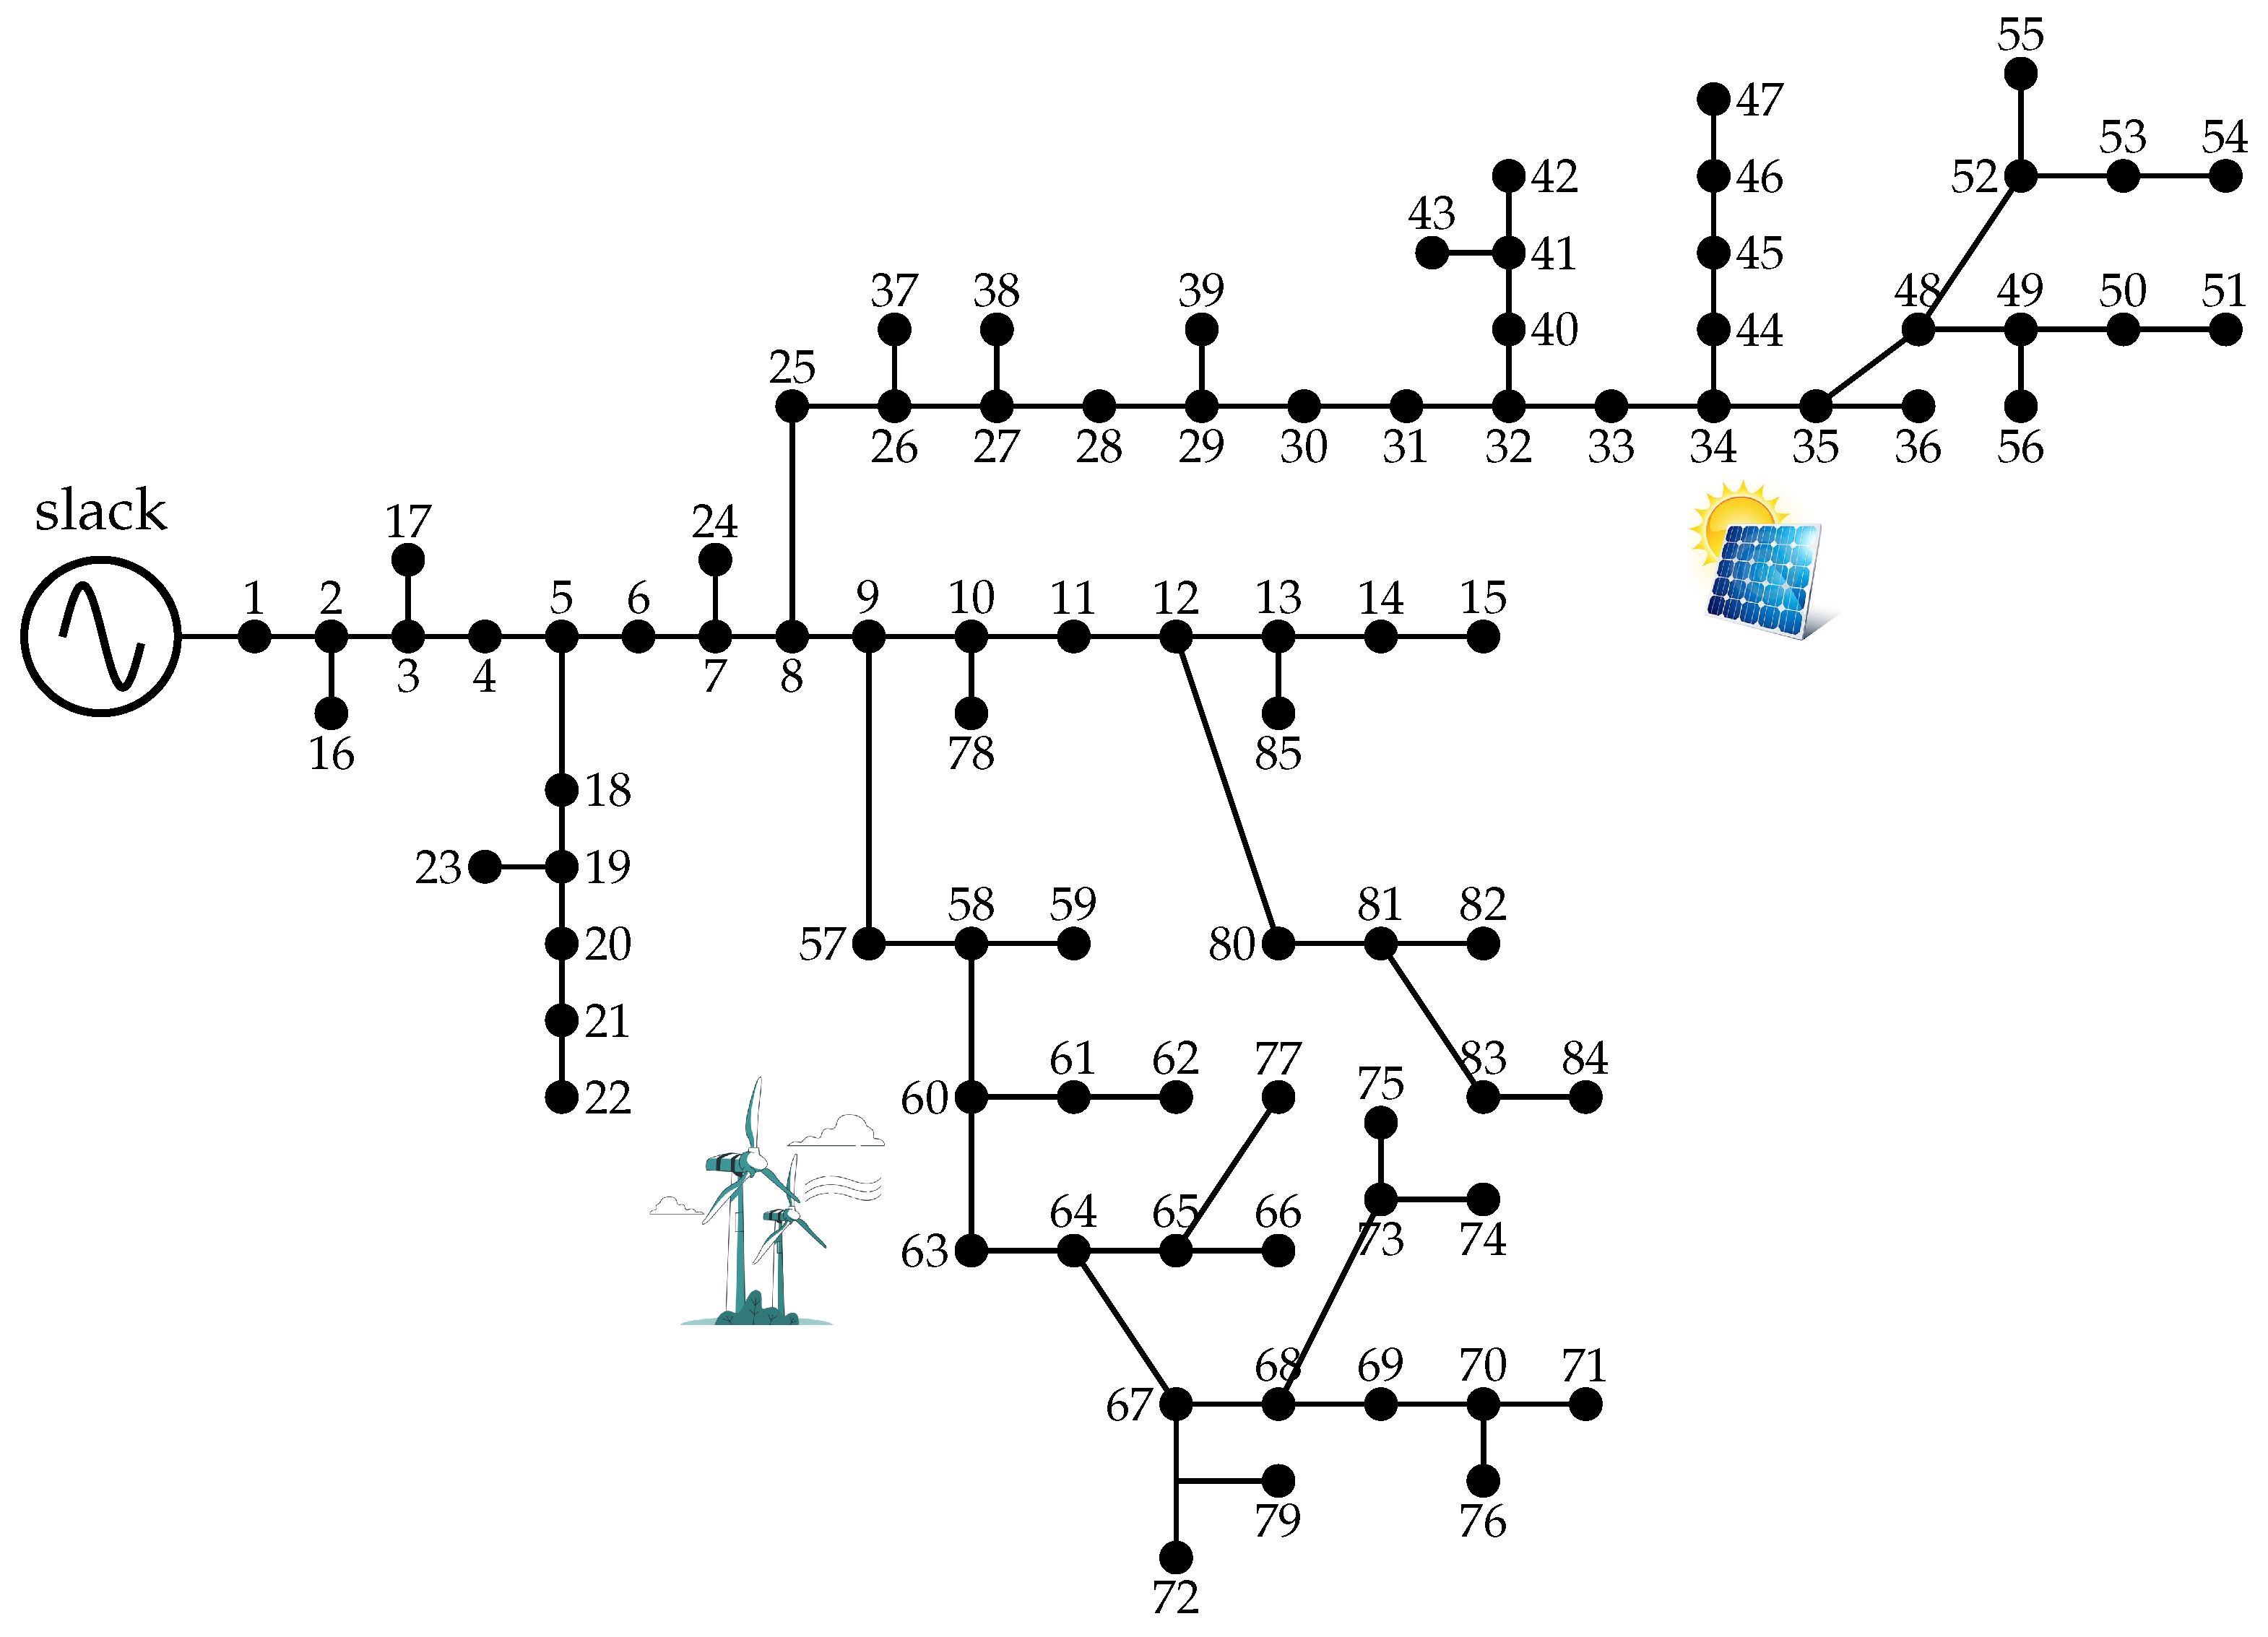
To demonstrate the effectiveness of the proposed optimization methodology in dealing with large-scale distribution networks considering daily demand variations and the penetration of renewable generation, this section presents some numerical validations for the three-phase asymmetric version of the IEEE 85-bus grid. The single-line diagram for the 85-bus grid is depicted in Figure 13.
The line connections and their lengths are listed in Table 13.
The information regarding power consumption per node in the three-phase version of the 85-bus grid is listed in Table 14.
To evaluate the effect of the daily variation in the demand profile and the presence of two renewable generators, the information presented in Table 15 is considered. Note that the PV generator will be located at node 34 with a nominal generation capacity per phase of about 750 kW. Regarding the wind turbine, it will be sited at node 60 with a total generation capability of 600 kW per phase.
To evaluate the effectiveness of the proposed MGbMO in solving the problem of the optimal selection of conductors in three-phase unbalanced distribution networks, three numerical validations are carried out as defined below.
  • Case 1: The evaluation of the optimization methodology during the peak load condition, i.e., under the same simulation conditions used for the 8- and 27-bus grids.
  • Case 2: The selection of the conductors only considers the daily load variations without penetration of renewable generation.
  • Case 3: The evaluation of the optimization methodology considering the daily demand and generation curves.
It is noteworthy that no comparison with the previous literature reports is made in this simulation scenario since this is the first time that the IEEE 85-bus grid is adapted to a three-phase unbalanced version to study the problem of the optimal selection of conductors. Ultimately, this implies that the results reported here will become a reference for future developments in this research area.
Table 16 presents the list of calibers assigned for each operative scenario. The main characteristic of the conductors selected for each operative scenario is that these solutions fulfill the telescopic operating condition typically implemented by distribution companies to reduce investment costs in conducting material.
Table 17 presents the investment, operating, and total costs for the IEEE 85-bus grid. Note that C p e n is zero for all the solutions listed in Table 16 since each final solution is 100% feasible.
The numerical results presented in Table 17 reveal the following:
i.
Case 1 is an operation scenario that invests more in conducting material to minimize the effect of the energy loss costs in the objective function as soon as possible. This is accomplished by increasing the conductor sizes in some strategic distribution lines, which reduces the energy loss since these are proportional to the resistive parameter and the square value of the current. Additionally, the expected energy loss costs for this scenario can be far from the real operative scenario for a distribution grid where all the demands vary along the day.
ii.
Case 2 demonstrates a more realistic operative scenario for medium-voltage distribution networks, where the energy consumption varies along the day, considering a typical demand curve. In this case, the expected energy losses are about USD 312,264.9263 per year of operation, which implies a reduction of about USD 91,652.7653 concerning the peak load operation scenario. This implies that it is highly probable for a distribution company that the energy loss costs will be near the daily demand variation scenario compared to the peak load condition. However, the most important result in simulation Case 2 is the reduction in the investment costs concerning the peak load scenario of about 40.0691%. This implies that when the energy calculation is more realistic, the algorithm finds conductors with small sizes (see Cases 1 and 2 in Table 16), which can be considered a more convenient design scenario for the distribution company.
iii.
Case 3 presents the well-known benefits of the usage of renewable generation in distribution networks since these allow important reductions in the expected energy loss costs. This scenario showcases that the energy loss costs are reduced by about USD 62,738.9098 with respect to Case 2. Additionally, the inclusion of renewables has reduced the investment costs in conducting material by about USD 27,179.0850 through the reduction in the conductor sizes in some strategy lines (lines near to the substation bus as can be seen for Cases 2 and 3 in Table 16).
Finally, when Cases 2 and 3 are compared with the typical peak load scenario in Case 1, the total reductions regarding the final objective function value are 32.7184% and 42.1347%, respectively. These reduction values confirm that for the solution of the best set of conductors in three-phase unbalanced networks, expected daily demand curves and also the presence of renewables must be considered before making the final investment decision by the utility company.

7. Conclusions and Future Work

This article presents the problem of the optimal conductor selection in radial electrical distribution systems. Its objective function is the minimization of the total annual operating costs, broken down into the costs associated with conductor investment and the energy losses over one year of operation. The problem is addressed by adopting a master–slave solution methodology, using the MGbMO algorithm in the master part, which is responsible for selecting the optimal set of gauges to be used by the conductors in each branch of the system. Conversely, in the slave stage, the AS method is employed to calculate the power flow. The methodology is applied to balanced and unbalanced IEEE 8- and 27-bus test systems, yielding promising results and demonstrating its applicability and efficiency compared to other algorithms reported in the specialized literature, including the NMA and the VSA. The main conclusions of this study are as follows:
i.
The MGbMO algorithm implemented yields the best current solutions for three of the four systems studied, where for the balanced 8-bus system, an objective function of USD 455,969.791 is obtained, achieving a reduction of 10.3% over the value obtained with NMA, which has the second-best result; regarding the unbalanced case, the results of the other algorithms are matched with a value of USD 558,758.394, and it can, thus, be inferred that the optimal global solution is found (this affirmation is based on the small dimension of the solution space for the 8-bus grid, i.e., c l = 8 7 = 2,097,152, which can be easily explored with any combinatorial optimization method or exhaustive search). In the balanced 27-bus system, a value of USD 549,883.572 is obtained as total annual costs, achieving an improvement of 1.4% compared to the NMA, while in the unbalanced case, a value of USD 589,018.800 is obtained, which is 1.432% more than in the case of the NMA.
ii.
For the four case studies, the findings ascertain that since the current levels that pass through the branches are far from their limits established by each gauge (less than 35%), the energy losses are low, and the loss costs are thus reduced as well, ensuring good operation and adapting to future new load connections.
iii.
The voltage profiles are adequate for all test systems. In this regard, the lowest and most distant one is evident in the 27-bus system for the balanced case, where a shift of 4.61% is presented in phase C, which is very low and positive for the system.
iv.
The MGbMO algorithm only needs a single evaluation in each test system to obtain the best numerical results, which are previously reported in this research, due to the exploration and exploitation characteristics of the solution space, which shortened simulation times, making this method one of the most efficient methods reported in the specialized literature.
v.
The numerical results obtained with the MGbMO in the three-phase version of the IEEE 85-bus grid indicate that the peak demand scenario is a simulation case where the energy losses costs are overestimated, which leads the optimization algorithm to increase the conductor sizes to find an adequate equilibrium between investment and operating costs. However, when daily demand curves and renewable generation are considered, the expected annual costs of the energy losses reduce significantly, allowing the MGbMO to find conductor sizes with lower costs in comparison to the peak scenario of operation. These results imply that considering daily demand curves is the most realistic scenario for the studied problem. Ultimately, this simulation case must be considered the benchmark case for any new study in this research area.
For future studies, the problem presented in this article can be addressed by employing new metaheuristic methods with high numerical yields, implementing static compensators or renewable sources, such as photovoltaic or wind generation, and including uncertainties in demand and power-generation profiles to improve the voltage profiles and further reduce losses. Further research can validate existing distribution networks with a higher number of nodes as in the case of Brazilian and Taiwan distribution systems.

Author Contributions

Conceptualization, methodology, software, and writing (review and editing): O.D.M., J.D.P.-R. and J.A.V.-F. All authors have read and agreed to the published version of the manuscript.

Funding

This research received no external funding.

Data Availability Statement

No new data were created or analyzed in this study. Data sharing does not apply to this article.

Acknowledgments

To God, our families, and the teachers who were part of our professional training process. This work is derived from the undergraduate project Aplicación del método de optimización basado en el gradiente modificado para la selección óptima de conductores en sistemas de distribución trifásicos desbalanceadas, submitted by Julián David Pradilla Rozo to the Electrical Engineering Program of the Department of Engineering of Universidad Distrital Francisco José de Caldas as a partial requirement for obtaining a Bachelor’s degree in Electrical Engineering.

Conflicts of Interest

The authors declare no conflict of interest.

References

  1. Kazmi, S.A.A.; Shahzad, M.K.; Khan, A.Z.; Shin, D.R. Smart Distribution Networks: A Review of Modern Distribution Concepts from a Planning Perspective. Energies 2017, 10, 501. [Google Scholar] [CrossRef]
  2. Jin, T.; Zhuo, F.; Mohamed, M.A. A Novel Approach Based on CEEMDAN to Select the Faulty Feeder in Neutral Resonant Grounded Distribution Systems. IEEE Trans. Instrum. Meas. 2020, 69, 4712–4721. [Google Scholar] [CrossRef]
  3. Acosta, J.S.; Tavares, M.C. Optimal selection and positioning of conductors in multi-circuit overhead transmission lines using evolutionary computing. Electr. Power Syst. Res. 2020, 180, 106174. [Google Scholar] [CrossRef]
  4. Nahman, J.; Peric, D. Optimal Planning of Radial Distribution Networks by Simulated Annealing Technique. IEEE Trans. Power Syst. 2008, 23, 790–795. [Google Scholar] [CrossRef]
  5. Lavorato, M.; Franco, J.F.; Rider, M.J.; Romero, R. Imposing Radiality Constraints in Distribution System Optimization Problems. IEEE Trans. Power Syst. 2012, 27, 172–180. [Google Scholar] [CrossRef]
  6. Macedo, L.H.; Franco, J.F.; Mahdavi, M.; Romero, R. A Contribution to the Optimization of the Reconfiguration Problem in Radial Distribution Systems. J. Control. Autom. Electr. Syst. 2018, 29, 756–768. [Google Scholar] [CrossRef]
  7. Lavorato, M.; Rider, M.J.; Garcia, A.V.; Romero, R. A Constructive Heuristic Algorithm for Distribution System Planning. IEEE Trans. Power Syst. 2010, 25, 1734–1742. [Google Scholar] [CrossRef]
  8. Girbau-Llistuella, F.; Díaz-González, F.; Sumper, A.; Gallart-Fernández, R.; Heredero-Peris, D. Smart Grid Architecture for Rural Distribution Networks: Application to a Spanish Pilot Network. Energies 2018, 11, 844. [Google Scholar] [CrossRef] [Green Version]
  9. Escobar-Yonoff, R.; Maestre-Cambronel, D.; Charry, S.; Rincón-Montenegro, A.; Portnoy, I. Performance assessment and economic perspectives of integrated PEM fuel cell and PEM electrolyzer for electric power generation. Heliyon 2021, 7, e06506. [Google Scholar] [CrossRef]
  10. Abdelaziz, A.Y.; Fathy, A. A novel approach based on crow search algorithm for optimal selection of conductor size in radial distribution networks. Eng. Sci. Technol. Int. J. 2017, 20, 391–402. [Google Scholar] [CrossRef]
  11. Abul’Wafa, A.R. Multi-conductor feeder design for radial distribution networks. Electr. Power Syst. Res. 2016, 140, 184–192. [Google Scholar] [CrossRef]
  12. Islam, S.; Ghani, M. Economical optimization of conductor selection in planning radial distribution networks. In Proceedings of the 1999 IEEE Transmission and Distribution Conference (Cat. No. 99CH36333), New Orleans, LA, USA, 11–16 April 1999; Volume 2, pp. 858–863. [Google Scholar] [CrossRef]
  13. Montoya, O.D.; Grisales-Noreña, L.F.; Giral-Ramírez, D.A. Optimal Placement and Sizing of PV Sources in Distribution Grids Using a Modified Gradient-Based Metaheuristic Optimizer. Sustainability 2022, 14, 3318. [Google Scholar] [CrossRef]
  14. Sivanagaraju, S.; Sreenivasulu, N.; Vijayakumar, M.; Ramana, T. Optimal conductor selection for radial distribution systems. Electr. Power Syst. Res. 2002, 63, 95–103. [Google Scholar] [CrossRef] [Green Version]
  15. Falaghi, H.; Ramezani, M.; Haghifam, M.R.; Milani, K. Optimal selection of conductors in radial distribution systems with time varying load. In Proceedings of the 18th International Conference and Exhibition on Electricity Distribution (CIRED 2005), Turin, Italy, 6–9 June 2005. [Google Scholar] [CrossRef] [Green Version]
  16. Satyanarayana, S.; Ramana, T.; Rao, G.K.; Sivanagaraju, S. Improving the Maximum Loading by Optimal Conductor Selection of Radial Distribution Systems. Electr. Power Components Syst. 2006, 34, 747–757. [Google Scholar] [CrossRef]
  17. Ponnavaikko, M.; Rao, K. An Approach to Optimal Distribution System Planning Through Conductor Gradation. IEEE Trans. Power Appar. Syst. 1982, PAS-101, 1735–1742. [Google Scholar] [CrossRef]
  18. Thenepalle, M. A Comparative Study on Optimal Conductor Selection for Radial Distribution Network using Conventional and Genetic Algorithm Approach. Int. J. Comput. Appl. 2011, 17, 6–13. [Google Scholar] [CrossRef]
  19. Legha, M.M.; Javaheri, H.; Legha, M.M. Optimal Conductor Selection in Radial Distribution Systems for Productivity Improvement Using Genetic Algorithm. Iraqi J. Electr. Electron. Eng. 2013, 9, 29–35. [Google Scholar] [CrossRef]
  20. Zhao, Z.; Mutale, J. Optimal Conductor Size Selection in Distribution Networks with High Penetration of Distributed Generation Using Adaptive Genetic Algorithm. Energies 2019, 12, 2065. [Google Scholar] [CrossRef]
  21. Ismael, S.M.; Aleem, S.H.A.; Abdelaziz, A.Y.; Zobaa, A.F. Optimal Conductor Selection of Radial Distribution Feeders: An Overview and New Application Using Grasshopper Optimization Algorithm. In Classical and Recent Aspects of Power System Optimization; Elsevier: Amsterdam, The Netherlands, 2018; pp. 185–217. [Google Scholar] [CrossRef]
  22. Mendoza, F.; Requena, D.; Bemal-Agustin, J.; Dominguez-Navarro, J. Optimal Conductor Size Selection in Radial Power Distribution Systems Using Evolutionary Strategies. In Proceedings of the 2006 IEEE/PES Transmission & Distribution Conference and Exposition: Latin America, Caracas, Venezuela, 15–18 August 2006. [Google Scholar] [CrossRef]
  23. Samal, P.; Mohanty, S.; Ganguly, S. Simultaneous capacitor allocation and conductor sizing in unbalanced radial distribution systems using differential evolution algorithm. In Proceedings of the 2016 National Power Systems Conference (NPSC), Bhubaneswar, India, 19–21 December 2016. [Google Scholar] [CrossRef]
  24. Raju, M.R.; Murthy, K.V.S.R.; Ravindra, K.; Rao, R.S. Optimal conductor selection for agricultural distribution system—A case study. In Proceedings of the 2010 International Conference on Intelligent and Advanced Systems, Manila, Philippines, 15–17 June 2010. [Google Scholar] [CrossRef]
  25. Osman, I.; Rahman, M.A.; Mahbub, A.R.; Haque, A. Benefits of optimal size conductor in transmission system. In Proceedings of the 2014 International Conference on Advances in Electrical Engineering (ICAEE), Vellore, India, 9–11 January 2014. [Google Scholar] [CrossRef]
  26. Momoh, I.; Jibril, Y.; Jimoh, B.; Abubakar, A.S.; Ajayi, O.; Abubakar, A.; Sulaiman, S.; Yusuf, S. Effect of an Optimal Conductor Size Selection Scheme for Single Wire Earth Return Power Distribution Networks For Rural Electrification. J. Sci. Technol. Educ. 2019, 7, 286–295. [Google Scholar]
  27. Kalesar, B.M. Conductor selection optimization in radial distribution system considering load growth using MDE algorithm. World J. Model. D Simul. 2014, 10, 175–184. [Google Scholar]
  28. Ramana, T.; Nararaju, K.; Ganesh, V.; Sivanagaraju, S. Customer Loss Allocation Reduction Using Optimal Conductor Selection in Electrical Distribution System. In Emerging Trends in Electrical, Communications, and Information Technologies; Springer: Berlin/Heidelberg, Germany, 2020; pp. 369–379. [Google Scholar]
  29. Martínez-Gil, J.F.; Moyano-García, N.A.; Montoya, O.D.; Alarcon-Villamil, J.A. Optimal Selection of Conductors in Three-Phase Distribution Networks Using a Discrete Version of the Vortex Search Algorithm. Computation 2021, 9, 80. [Google Scholar] [CrossRef]
  30. Ismael, S.M.; Aleem, S.H.E.A.; Abdelaziz, A.Y. Optimal selection of conductors in Egyptian radial distribution systems using sine-cosine optimization algorithm. In Proceedings of the 2017 Nineteenth International Middle East Power Systems Conference (MEPCON), Cairo, Egypt, 19–21 December 2017. [Google Scholar] [CrossRef]
  31. Montoya, O.D.; Serra, F.M.; Angelo, C.H.D.; Chamorro, H.R.; Alvarado-Barrios, L. Heuristic Methodology for Planning AC Rural Medium-Voltage Distribution Grids. Energies 2021, 14, 5141. [Google Scholar] [CrossRef]
  32. Nivia Torres, D.J.; Salazar Alarcón, G.A.; Montoya Giraldo, O.D. Selección óptima de conductores en redes de distribución trifásicas utilizando el algoritmo metaheurístico de Newton. Ingeniería 2022, 27, e19303. [Google Scholar] [CrossRef]
  33. Shen, T.; Li, Y.; Xiang, J. A Graph-Based Power Flow Method for Balanced Distribution Systems. Energies 2018, 11, 511. [Google Scholar] [CrossRef]
  34. Ramírez Castaño, S. Redes de Distribución de Energía. Diseño y Construcción y en la Operación del Sistema de Distribución; Universidad Nacional de Colombia: Manizales, Colombia, 2009. [Google Scholar]
  35. Montoya, O.D. Notes on the Dimension of the Solution Space in Typical Electrical Engineering Optimization Problems. Ingeniería 2022, 27, e19310. [Google Scholar] [CrossRef]
  36. Jaddi, N.S.; Abdullah, S. Global search in single-solution-based metaheuristics. Data Technol. Appl. 2020, 54, 275–296. [Google Scholar] [CrossRef]
  37. Ahmadianfar, I.; Bozorg-Haddad, O.; Chu, X. Gradient-based optimizer: A new metaheuristic optimization algorithm. Inf. Sci. 2020, 540, 131–159. [Google Scholar] [CrossRef]
  38. Gholizadeh, S.; Danesh, M.; Gheyratmand, C. A new Newton metaheuristic algorithm for discrete performance-based design optimization of steel moment frames. Comput. Struct. 2020, 234, 106250. [Google Scholar] [CrossRef]
  39. Doğan, B.; Ölmez, T. A new metaheuristic for numerical function optimization: Vortex Search algorithm. Inf. Sci. 2015, 293, 125–145. [Google Scholar] [CrossRef]
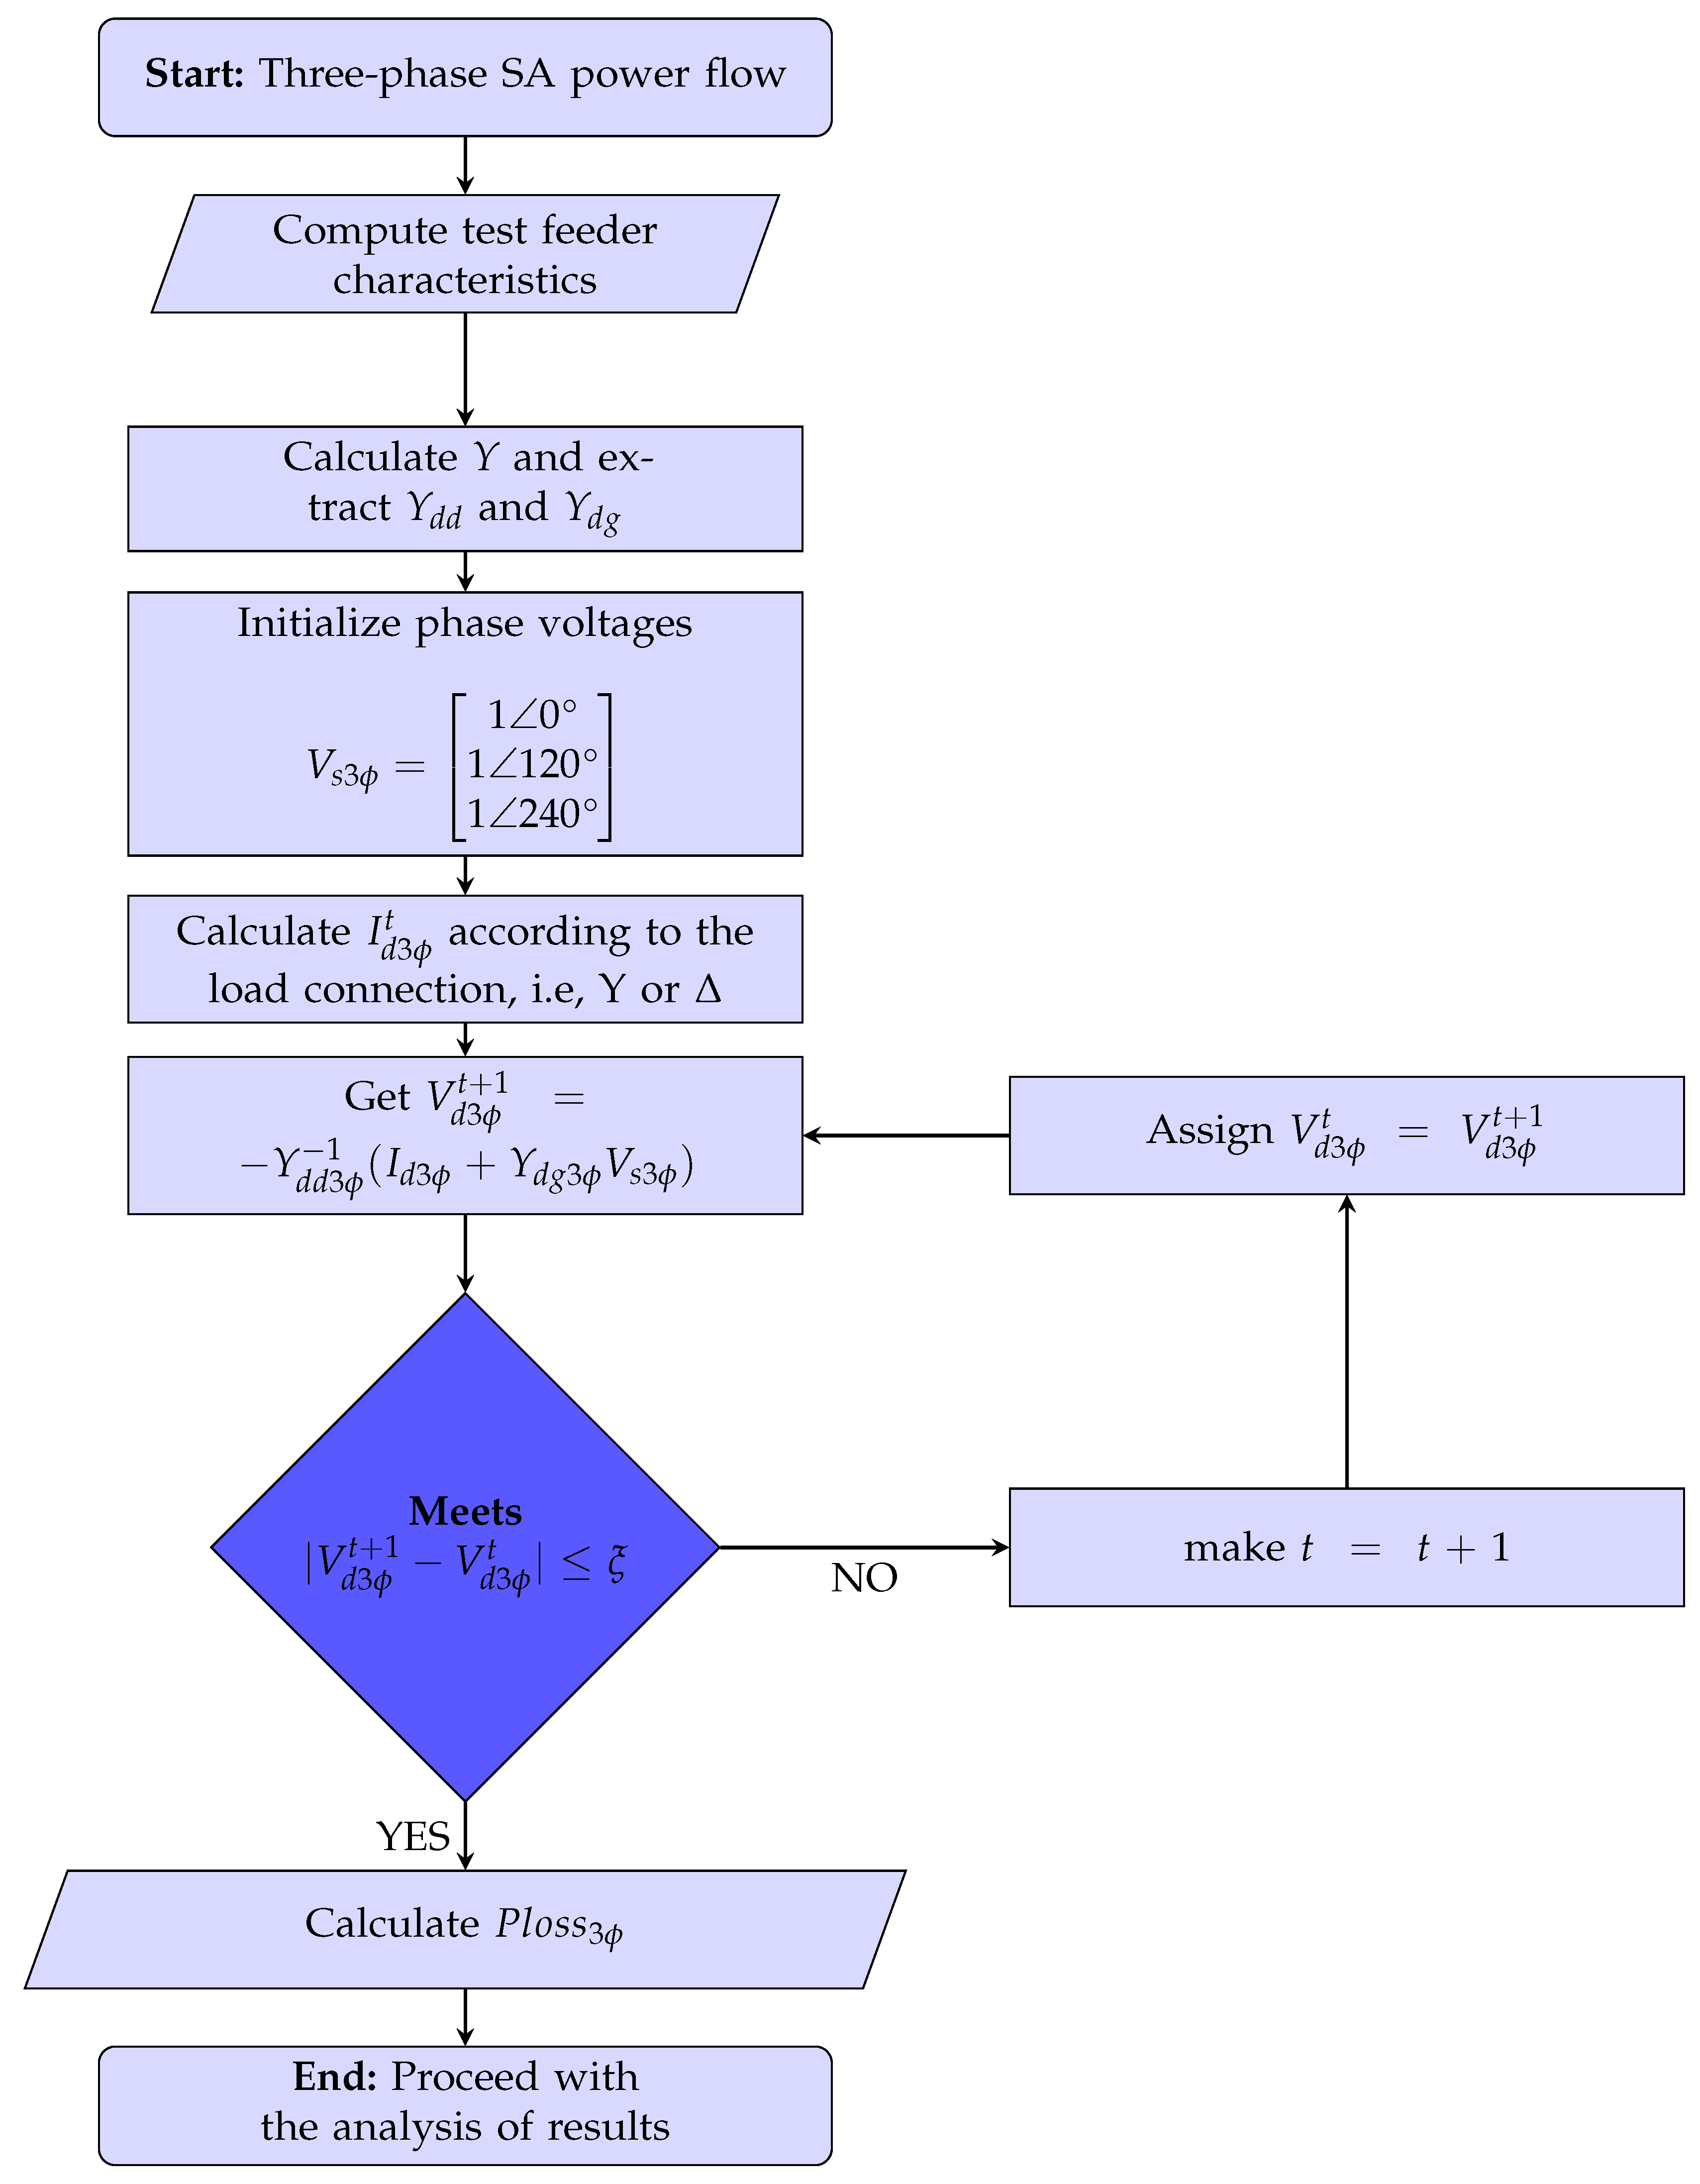
Figure 1. Flowchart for the SA method.
Energies 16 00888 g001
Figure 2. Single-line diagram of the 8-bus test system.
Energies 16 00888 g002
Figure 3. Single-line diagram for the 27-bus test system.
Energies 16 00888 g003
Figure 4. Behavior of the current in the branches for the IEEE system of 8 buses (balanced).
Energies 16 00888 g004
Figure 5. Voltage profiles in the buses for the IEEE 8-bus system (balanced).
Energies 16 00888 g005
Figure 6. Behavior of the current in the branches for the IEEE system of 8 buses (unbalanced).
Energies 16 00888 g006
Figure 7. Node voltage profiles for the 8-bus IEEE system (unbalanced).
Energies 16 00888 g007
Figure 8. Behavior of the current in the branches for the IEEE 27-bus system (balanced).
Energies 16 00888 g008
Figure 9. Voltage profiles in the buses for the IEEE system of 27 buses (balanced).
Energies 16 00888 g009
Figure 10. Behavior of the current in the branches for the IEEE system of 27 buses (unbalanced).
Energies 16 00888 g010
Figure 11. Voltage profiles in the buses for the IEEE 27-bus system (unbalanced).
Energies 16 00888 g011
Figure 12. Convergence of the objective function for each test system (note that the objective function was normalized by using a dividing factor of 1000).
Energies 16 00888 g012
Figure 13. Single-line diagram for the IEEE 85-bus grid.
Energies 16 00888 g013
Table 1. Summary of the literature approaches used in the optimal selection of conductors for electrical distribution networks.
Sol. MethodologyObjective FunctionYearRef.
A heuristic approach based on power flow solutionsSaving in cost of conducting material and cost of energy losses2002[14]
A recursive power flow solution methodologyMinimizing investment and operating costs and improving voltage profile2005[15]
A constructive algorithm based on power flow solutionsSaving in cost of conducting material and energy losses2006, 2010[16,24]
Evolutionary optimization strategiesMinimizing investment and operating costs2006[22]
Optimization with genetic algorithmsSaving in cost of conducting material and active and minimizing reactive power loss2011, 2013[18,19]
Differential evolution algorithmSaving in cost of conducting material and energy losses2016[23]
Adaptive optimizer based on genetic algorithmsMinimizing the sum of the life-cycle cost in conductors and the total energy procurement cost2019[20]
Grasshopper optimization algorithmMinimizing the annual cost of energy loss and investment cost of the conductors2018[21]
Mixed-integer non-linear programming optimization methodMinimizing investment and operating costs2012[5]
Crow search algorithmMinimizing investment and operating costs2017[10]
Sine cosine algorithmMinimizing investment and operating costs2017[30]
Vortex search algorithmMinimizing investment and operating costs2021[29]
Tabu search algorithmMinimizing investment and operating costs2021[31]
Newton-based metaheuristic algorithmMinimizing investment and operating costs2022[32]
Table 2. Number of variables for the power flow problem in three-phase networks.
Variable NameNumber of VariablesVariable NameNumber of Variables
Voltages 3 n Angles 3 n
Currents 3 l Dis. Gen. Powers 3 d
Objective func.1Slack powers3
Table 3. Set of conductors for the test systems.
Gauge (c) r  ( Ω /km) x  ( Ω /km) I c , m a x  (A) C c  (USD/km)
10.87630.41331801986
20.69600.41332002790
30.55180.40772303815
40.43870.39832705090
50.34800.38993008067
60.27650.361034012,673
70.09660.120160023,419
80.08530.095072030,070
Table 4. General simulation parameters.
ParameterValueUnit
Energy cost0.1390(USD/kWh)
Iterations1000-
Population size30-
Tolerance 1 × 10 10 -
Table 5. Connection of lines and load levels of the system for the balanced case in the 8-bus test system.
LineBus i Bus j L ij (km) P j , h D (kW) Q j , h D (kvar)
1121.001054.20
2231.00806.50
3141.002632.50
4151.006090
5561.002034.50
6371.00932.80
7381.001731.40
Table 6. Load for each phase in the 8-bus test system for the unbalanced case.
Bus j P j , a D (kW) Q j , a D (kvar) P j , b D (kW) Q j , b D (kvar) P j , c D (kW) Q j , c D (kvar)
23162.600000
3002419.5000
400007897.50
5913.50913.5000
6003051.603051.60
72798.400000
81298.5502597.101298.550
Table 7. Connection of lines and load levels of the system for the balanced case in the 27-bus test system.
LineBus i Bus j L ij (km) P j , h D (kW) Q j , h D (kvar)
1120.5500
2231.5000
3340.45297.5184.4
4450.6300
5560.70255158
6670.5500
7781.00212.5131.7
8891.2500
99101.00266.1164.9
102111.008552.7
1111121.23340210.7
1212130.75297.5184.4
1313140.56191.3118.5
1414151.00106.365.8
1515161.00255158
163171.00255158
1717180.60127.579
1818190.90297.5184.4
1919200.95340210.7
2020211.008552.7
214221.00106.365.8
225231.0055.334.2
236240.4069.743.2
248250.60255158
258260.6063.839.5
2626270.80170105.4
Table 8. Load for each phase in the 27-bus test system for the unbalanced case.
Bus j P j , a D (kW) Q j , a D (kvar) P j , b D (kW) Q j , b D (kvar) P j , c D (kW) Q j , c D (kvar)
2000000
3000000
4892.5553.20000
5000000
60076547400
7000000
80000637.5395.1
9000000
100000798.3494.7
1100255158.100
121020632.10000
13446.25276.6446.25276.600
1400286.95177.75286.95177.75
15159.4598.700159.4598.7
1600382.5237382.5237
171076547400
18382.52370000
19446.25276.6446.25276.600
2000510316.05510316.05
21127.579.0500127.579.05
2200159.7598.7159.7598.7
23165.9102.60000
240000209.1129.6
25255158255158255158
2663.839.563.839.563.839.5
27170105.4170105.4170105.4
Table 9. Numerical results for the IEEE 8-bus system (balanced).
MethodGaugesInvestment in Conductors (USD)Losses (USD)Annual Costs (USD)
TGA{6, 5, 3, 4, 4, 1, 4}125,433406,222.461531,655.461
CBGA{6, 6, 4, 4, 4, 1, 4}143,076373,155.965516,231.965
GAMS{6, 4, 4, 5, 4, 1, 2}122,358416,681.580539,039.580
TSA{6, 5, 4, 4, 4, 1, 3}125,433397,754.442523,187.442
VSA{6, 6, 5, 5, 4, 2, 4}163,350345,007.959508,357.959
NMA{6, 6, 5, 5, 4, 2, 4}163,350345,007.959508,357.959
MGbMO{7, 7, 5, 5, 4, 2, 4}227,826228,143.791455,969.791
Table 10. Numerical results for the IEEE 8-bus system (unbalanced).
MethodGaugesInvestment in Conductors (USD)Losses (USD)Annual Costs (USD)
VSA{7, 7, 7, 5, 5, 4, 4}289,713269,045.394558,758.394
NMA{7, 7, 7, 5, 5, 4, 4}289,713269,045.394558,758.394
MGbMO{7, 7, 7, 5, 5, 4, 4}289,713269,045.394558,758.394
Table 11. Numerical results for the IEEE 27-bus system (balanced).
MethodGaugesInvestment in Conductors (USD)Losses (USD)Annual Costs (USD)
VSA{7, 7, 5, 4, 4, 3, 3, 1, 1, 4, 4, 2, 3, 2, 1, 4, 4, 2, 2, 2, 1, 1, 2, 2, 1, 1}344,352.150217,672.327562,024.477
NMA{7, 7, 4, 4, 4, 4, 3, 1, 1, 4, 4, 3, 3, 1, 2, 4, 3, 2, 1, 1, 1, 1, 2, 2, 1, 1}337,744.800219,950.455557,695.255
MGbMO{7, 7, 4, 4, 4, 3, 3, 1, 1, 4, 4, 2, 1, 1, 1, 3, 2, 2, 1, 1, 1, 1, 1, 1, 1, 1}319,768.08230,115.492549,883.572
Table 12. Numerical results for the IEEE 27-bus system (unbalanced).
MethodGaugesInvestment in Conductors (USD)Losses (USD)Annual Costs (USD)
VSA{7, 7, 5, 4, 4, 4, 4, 2, 2, 4, 4, 3, 2, 1, 1, 2, 3, 2, 1, 2, 2, 1, 2, 2, 4, 1}350,392.95257,999.185608,392.135
NMA{7, 7, 4, 4, 4, 3, 4, 2, 1, 4, 4, 4, 2, 1, 1, 4, 3, 2, 2, 1, 1, 1, 2, 2, 2, 1}344,954.40252,624.608597,579.008
MGbMO{7, 7, 4, 4, 4, 4, 4, 1, 1, 4, 4, 3, 1, 1, 1, 4, 2, 2, 1, 1, 1, 1, 1, 1, 1, 1}331,828.08257,190.720589,018.800
Table 13. Line connections and their lengths for the IEEE 85-bus grid.
LineBus i Bus j L ij (km)LineBus i Bus j L ij (km)
1120.4684334440.985
2230.4494444450.441
3340.3234545460.225
4450.8704646470.184
5560.8834735480.698
6670.3434848490.875
7780.9534949500.768
8890.3095050510.261
99100.9315148520.985
1010110.1615252530.448
1111120.9525353540.344
1212130.8785452550.673
1313140.5075549560.564
1414150.018569570.545
152160.778757580.564
163170.3595858590.650
175180.8485958600.237
1818190.4336060610.626
1919200.6056161620.530
2020210.3776260630.514
2121220.7216363640.701
2219230.3166464650.373
23740.9496565660.614
24850.8496664670.307
2525260.7756767680.322
2626270.2996868690.662
2727280.8726969700.150
2828290.3757070710.384
2929300.7987167720.320
3030310.8167268730.291
3131320.9997373740.213
3232330.0457473750.721
3333340.2367570760.705
3434350.4307665770.715
3535360.8477710780.361
3626370.3867867790.546
3727380.1227912800.357
3829390.9158080810.940
3932400.1828181820.444
4040410.5908281830.110
4141420.8128383840.865
4241430.2618413850.300
Table 14. Load for each phase in the 85-bus test system.
Bus j P j , a D (kW) Q j , a D (kvar) P j , b D (kW) Q j , b D (kvar) P j , c D (kW) Q j , c D (kvar)
214.5020.0010.0028.5020.5031.00
312.5029.500.0000.00017.5048.50
40.0000.0000.0000.00035.5043.00
539.0043.5032.5048.500.0000.000
628.0022.0022.5024.500.0000.000
714.0010.500.0000.00024.5042.50
841.5029.5023.5012.0010.5027.00
90.0000.00030.0040.5017.0050.00
100.0000.00014.0045.000.0000.000
110.0000.00026.5014.0027.5035.50
1235.5049.0045.5047.500.0000.000
1317.0043.0015.0047.5048.0037.50
1425.0045.0022.0044.000.0000.000
150.0000.0000.0000.00010.5020.00
1619.0039.0047.5032.0035.5018.50
1718.5044.5049.0026.0032.5026.50
180.0000.00011.0044.0048.5034.50
1938.0031.0035.0039.0042.5025.50
2046.0046.000.0000.00026.5032.50
2139.0025.0037.0011.0041.5023.50
2222.5050.0021.0030.0018.5025.50
230.0000.0000.0000.00024.0023.50
2444.5012.5033.0027.0037.0018.00
2540.5014.0040.5036.0033.5039.50
2615.5022.500.0000.00025.5047.00
2716.0038.000.0000.0000.0000.000
2813.5015.0035.0038.0015.5022.50
2918.5039.5010.5036.0039.0042.00
3021.0036.500.0000.00043.0013.00
310.0000.0000.0000.00020.5020.50
3241.5035.5046.5050.000.0000.000
3329.0012.5047.0037.5027.5024.50
3416.0028.000.0000.00025.0012.00
350.0000.0000.0000.0000.0000.000
3648.5034.000.0000.00010.5018.00
3741.0045.0044.0047.5012.0045.50
3842.0022.0045.0015.500.0000.000
390.0000.00037.0047.5027.5018.50
400.0000.0000.0000.00015.0013.50
4117.5027.5036.0040.0043.0020.00
4244.5017.0038.5019.000.0000.000
4349.5045.500.0000.0000.0000.000
4439.0028.5032.5026.5030.0030.50
4530.5027.0039.0036.5013.5042.50
4625.0022.5030.5021.0011.0015.50
4730.5048.0048.0022.0014.0034.00
4834.0042.0050.0013.500.0000.000
4942.5034.5036.0045.5045.0046.50
500.0000.0000.0000.00010.5013.50
5122.0018.5024.5023.0010.0013.50
5249.0040.5047.0048.0020.0028.00
5313.5041.5015.0048.000.0000.000
5439.5019.5019.0043.0045.5040.50
550.0000.00019.5026.5019.5045.00
5636.5020.0034.0049.0014.5017.00
5713.5040.5016.5033.5016.0034.00
5829.5018.0022.0018.000.0000.000
5924.0036.5032.0015.5029.0027.50
600.0000.00038.0012.0025.0024.50
6138.0042.0028.0017.5045.5027.00
6230.0032.0042.0026.5036.0047.50
6342.0025.5046.5026.0026.0017.00
640.0000.0000.0000.00019.0047.50
6537.0029.000.0000.00028.0026.50
6647.5049.0025.0036.5047.5017.50
6714.0022.500.0000.00022.5041.00
6835.5039.0036.5023.5041.5037.00
6922.0022.500.0000.0000.0000.000
7043.5024.500.0000.0000.0000.000
7111.0050.000.0000.00011.5028.50
7231.0020.000.0000.0000.0000.000
7343.0023.0049.5048.0050.0035.00
7428.0022.0021.0019.500.0000.000
750.0000.0000.0000.0000.0000.000
760.0000.00046.5045.0019.5047.50
7728.0012.5025.0024.0041.0049.00
7827.5045.0048.5031.0029.5038.50
7932.5035.0048.5018.500.0000.000
8028.5046.5011.5021.0018.5037.00
8118.0049.5036.0013.5023.0013.50
8246.0037.0028.5032.0017.5014.50
8324.5013.0034.0030.000.0000.000
840.0000.0000.0000.00011.5048.50
850.0000.00036.5012.000.0000.000
Table 15. Daily demand and generation variation for the 85-bus grid.
Time (h)Demand (pu)Photovoltaic (pu)Wind (pu)
10.68451133549247500.633118295
20.64412269003619700.607259323
30.61306915602972000.605557422
40.59973328253000600.684246423
50.58887407125166700.783719339
60.59801867022290000.790557706
70.62678605448656900.744958950
80.6517431891788910.03912336500.769603567
90.7060392455705850.06558717900.826492212
100.7870070489617070.23687079600.876523598
110.8390169556105930.45501781800.931213527
120.8527338540674410.72644026500.965504834
130.8706420270527720.92448632600.972218577
140.8342541436464090.98204115300.981135531
150.8165364831396460.82940707900.991393173
160.8193941703181560.73306329501
170.8740712516669840.50113384900.987258076
1810.17711751800.929542167
190.98361592684320800.791155379
200.93636883215850600.708839248
210.88759763764526600.712881960
220.80929700895408700.719897641
230.74585635359116000.703007456
240.73347304248428300.687238555
Table 16. Conductors selected for the IEEE 85-bus grid at each operative scenario.
LineCase 1Case 2Case 3LineCase 1Case 2Case 3
175443311
275444311
355445211
445446211
544347311
644348311
744349311
841150311
941151311
1041152311
1141153311
1241154211
1331155311
1411156311
151117311
1621158111
1731159311
1831160311
1931161111
2031162311
2121163311
2221164311
2321165311
2431166311
2531167311
2631168311
2731169311
2831170311
2931171311
3031172211
3131173211
3231174211
3331175111
3431176311
3511177211
3631178211
3731179311
3821180311
3931181111
4021182311
4121183111
4221184211
Table 17. Investment and operating costs found with the application of the MGbMO to the three-phase version of the IEEE 85-bus grid for each operative scenario.
Case C inv (USD) C loss (USD)Z (USD)
1550,998.7080403,917.6916954,916.3996
2330,218.1420312,264.9263642,483.0683
3303,039.0570249,526.0165552,565.0735
Disclaimer/Publisher’s Note: The statements, opinions and data contained in all publications are solely those of the individual author(s) and contributor(s) and not of MDPI and/or the editor(s). MDPI and/or the editor(s) disclaim responsibility for any injury to people or property resulting from any ideas, methods, instructions or products referred to in the content.