Article

An Optimal Site Selection Framework for Near-Zero Carbon Emission Power Plants Based on Multiple Stakeholders

1
School of Economics and Management, North China Electric Power University, Beijing 102206, China
2
Beijing Key Laboratory of New Energy and Low-Carbon Development, North China Electric Power University, Beijing 102206, China
3
Chinese Research Academy of Environmental Sciences, Beijing 100012, China
4
Electric Power Research Institute of Guizhou Power Grid Co., Ltd., Guiyang 550002, China
*
Author to whom correspondence should be addressed.
Energies 2023, 16(2), 797; https://doi.org/10.3390/en16020797
Submission received: 6 December 2022 / Revised: 26 December 2022 / Accepted: 5 January 2023 / Published: 10 January 2023
(This article belongs to the Special Issue Wind/PV/Hydrogen Integrated Energy System for a Clean Future)

Abstract

:
Near-zero carbon emission power (NZCEP) plants, consisting of gas-fired units; wind turbines; power-to-gas (P2G); and carbon capture, utilization and storage (CCUS) systems, have recently received a lot of attention due to their enormous benefits in reducing carbon emissions and increasing the consumption of renewable energy. However, a complex environment of interest and a combination of risks makes their development very slow. This paper establishes a risk analysis framework for NZCEP considering multi-stakeholder participation. Firstly, a synthetic risk factor system was constructed based on stakeholders’ interests. Subsequently, interval type II trapezoidal fuzzy numbers were used and final weights were calculated from both subjective and objective aspects. Finally, we applied an acronym in Portuguese of the interactive and multi-criteria decision-making (TODIM) method to site selection to achieve a balance of interests of all stakeholders. In addition, a case study was conducted. The case result demonstrates that Zhengzhou in Henan Province is the best choice for a NZCEP power plant. A further finding is that government plays an important role in the development of NZCEP plants, with site selection results being the most sensitive to changes in the government’s risk appetite. Moreover, human resources are an important factor in the siting of an NZCEP plant.

1. Introduction

Many countries and regions set ambitious climate targets ahead of the 26th Conference of the Parties (COP26) in November 2021, but keeping warming below 1.5 °C by the end of the century will still require a collaborative effort from all countries [1]. As the largest carbon emitter in the world, China has reaffirmed its goal of achieving peak carbon by 2030 and carbon neutrality by 2060 (the carbon peaking and carbon neutrality goals). Currently, China emits around 10 billion tonnes of carbon dioxide per year [2], with the power sector accounting for nearly 50% of the carbon emissions. Therefore, building a power network based on renewable energy system, gradually increasing the proportion of renewable energy generation and reducing the proportion of thermal power generation is the key to China’s low-carbon transformation of its energy system. However, due to the fluctuation of renewable energy generation, its large-scale connection will have an impact on the safe and stable operation of power systems. The development and layout of multi-energy complementarity integrated energy systems could effectively solve this problem.
An integrated energy system (IES) refers to the use of advanced physical information technology and innovative management models in a certain region to integrate multiple energy sources in the area and to achieve coordinated planning, optimal operation, collaborative management, interactive response and complementarity between multiple heterogeneous energy subsystems. IES can reduce the negative impact of uncertainty in renewable energy output through multi-energy complementarity, while also meeting diverse energy demands and improving energy efficiency. As a form of IES, combined cooling, heating and power (CCHP) systems have been widely used on the customer side [3]. Meanwhile, the inclusion of energy storage devices allows for the free conversion of energy flows, ensuring the flexibility of the CCHP system under uncertain renewable energy source outputs [4,5]. The CCHP system provides a solution for the stable operation of the power system under renewable energy integration, but it still emits CO2 and has some negative environmental impacts.
Therefore, some researchers proposed integrating power-to-gas (P2G) and carbon capture, utilization and storage (CCUS) technology into CCHP to establish near-zero carbon emission power (NZCEP) plant (Figure 1). The potential of a NZCEP plant to reduce CO2 emissions and use residual renewable energy has been proven by researchers [6]. Meanwhile, the Datang International Beijing Gaojing Thermal Power Plant completed an industrial demonstration project of an NZCEP plant, which was carried out successfully [7]. As a form of IES, NZCEP plants are not only excellent at reducing CO2 emissions and increasing the consumption of renewable energy sources but also have significant economic advantages. Researchers who measured the operating costs of NZCEP plants found that by using multi-market trading, including for electricity, carbon and natural gas, NZCEP plants could reduce the CO2 emissions by almost 90% while maintaining profits [8,9].
With many advantages in terms of reducing carbon emissions, absorbing new energy and increasing power plant revenues, NZCEP plants will play a key role in promoting the deep decarbonization of China’s power system and the Chinese government has enacted a number of policies to support their development, but they have yet to achieve rapid growth in China. The reason for this is that the construction of a NZCEP plant involves multiple stakeholders, including the government, investors and the power plant, with different interests and inevitable conflicts of interest. Furthermore, NZCEP plants include energy storage systems, P2G systems and CCUS systems, which are still in the early stages of commercial application, with significant safety and revenue risks [10]. The combination of multiple risks leads to a high degree of uncertainty in the construction and operation of NZCEP plants. Hence, the construction of NZCEP plants requires both risk management and balancing the interests of all stakeholders. This has led to a lack of enthusiasm among stakeholders for NZCEP plants and has affected the development of the NZCEP plants in China.
The selection of a suitable location for the construction of a NZCEP plant, taking into account the psychological behaviour and risk appetite of the stakeholders, is a key step in addressing the above issues. However, previous studies have not dealt with this issue. The authors of this paper examined the related literature and found that the issue of siting projects is primarily a discussion of project risk. In conducting risk analysis, researchers have discussed the policy, economic, technical, social and environmental risks in the operation of the project (a more detailed literature review can be found in Section 2). Through comparison, we found that the gap between the existing research and this study lies in the distinctiveness of the perspective and rationality of the research method. Firstly, the siting of NZCEP projects is subject to significant uncertainty due to the many risks involved. However, studies in the relevant literature have focused more on project operational optimization and the verification of project carbon reduction effects, neglecting the discussion of project siting methods. Secondly, the NZCEP project faces complex interest conditions, with many stakeholders competing for their own interests. However, existing risk analysis models only consider a single stakeholder, failing to take into account the potential trade-offs between conflicting objectives and the risk preferences of stakeholders. To address the above issues, this paper proposes a practical risk factor system from a stakeholder’s perspective, taking into account the characteristics of NZCEP plants, and introduces the Criteria Importance Though Intercrieria Correlation (CRITIC) and an acronym in Portuguese of an interactive and multi-criteria decision-making (TODIM) method to improve the existing fuzzy decision-making trial and evaluation laboratory (DEMATEL) method to form a new combination of evaluation methods. Finally, to validate the applicability of the site selection system proposed in this paper, this paper conducted a siting analysis of an NZCEP plant in China. This study reaches the following conclusions in the process:
  • A site selection framework for NZCEP plant from a stakeholder perspective was constructed. This study establishes a risk factor system for near-zero carbon emission power plants based on the characteristics of these facilities and the findings of the literature review. After expert debate, five dimensions are finally retained, including political, economic, technological, social and environmental. The framework also includes some generic indicators that can be used to NZCEP plant site selection in other regions.
  • A comprehensive system of NZCEP plant siting methods is proposed. In order to achieve a balance between risk management and multi-stakeholder interests in the siting of NZCEP plant, this paper combined the trapezoidal interval type-2 fuzzy number, DEMATEL, CRITIC and TODIM methods, with different methods used in each evaluation phase. The combination of these methods ensures that the evaluation results are accurate and that the risk appetite of multiple stakeholders is considered, resulting in a practical evaluation system.
  • Bridging the gap in research on NZCEP plants. Previous research focused on verifying the operational economics of NZCEP plants and neglected the siting thereof. Due to the lack of a mature operating model for NZCEP plants, the external environmental requirements are more demanding, and traditional siting methods are no longer applicable. This paper proposed a site selection framework for NZCEP plants, taking into account factors such as the social environment, the natural environment and the risk appetite of decision makers in order to provide a reliable approach for NZCEP plant siting at this stage.
  • The rest of this paper is organized as follows: Section 2 is a literature review. The risk factor system is established in Section 3. Section 4 is concerned with the methodology used for this study. Section 5 is case study. The conclusions are given in Section 6.

2. Literature Review

This section briefly reviews theoretical and empirical studies on the siting of other types of IES projects similar to NZCEP plants, namely the identification of risk factor system and project siting methods.

2.1. Identification of Risk Factor System

This section reviews relevant research on NZCEP plant risk analysis and serves as the foundation for selecting indicators for the risk indicator system in this paper. As the IES project represented by NZCEP plants is still in its infancy in China and project operations are still fraught with uncertainty, site selection decisions are primarily based on the results of the project risk assessment. In general, the two dimensions necessary for project risk analysis are political and economic. Furthermore, depending on the specific project characteristics, the risk analysis framework for the IES projects adds three additional dimensions, namely technical, social and environmental.
Hitaj and Löschel analysed the policy factors that promote the development of wind power and concluded that policy incentives play an important role in promoting the construction of projects [11]. Kang and Yang discussed the risks associated with the CCUS projects and discovered that the implementation of incentive policies played an important role in increasing investor willingness to invest and reducing the economic risks of the projects [12,13]. Wang analysed 263 CCUS commercialization projects worldwide and discovered that policy risk was the most fundamental risk, with significant implications for other types of risk [10]. Regarding economic risk, researchers believe that the factors that determine economic risk primarily include a project payback period, project construction cost, operating cost and project income, with the economic risk involved in different types of projects differing slightly. Dong analysed the economic risk of the wind power coupled hydrogen energy storage (WPCHES) project from the perspective of stakeholders and found that cost risk and profit risk are the main factors that constitute economic risk [14]. Wu discovered that the initial investment costs, annual operation and maintenance costs, annual capital income and investment payback period are the primary economic risks of low-speed wind farm (LSWF) projects [15]. Zhou identified construction costs and payback periods as two major economic risks in his discussion of the location of urban photovoltaic charging stations [16]. Abdel-Basset identified building cost, profit, maintenance cost and payback period as the main indicators of economic risk to the project while conducting an offshore wind energy station site selection study [17]. Concerning technical risks, Zhou and Dong believe that grid-connected risks and project technical safety are critical factors for power generation projects [14,16]. Rezaei discussed the technical risk in certain renewable energy systems that include hydrogen production devices and found that electricity production and hydrogen production are the main factors [18]. Furthermore, when identifying the project’s technological risk, researchers classified the environmental conditions required for technology development as a technological risk [19]. When discussing the social and environmental risks of IES, some researchers consider the social risks to be the impact of project operation on the quality of life and the living conditions of the residents in the surrounding area, and therefore, the two types of risks are combined into one category for discussion [20]. Another group of researchers believes that social risks only include the project’s impact on the quality of life for surrounding residents and the local industries, such as public support and tourism impact [21,22,23], whereas environmental risks refer specifically to the ability of factors such as geological conditions and energy resource conditions to meet the needs of the project to proceed (e.g., wind resource conditions) and the impact of the project on the environment (e.g., carbon emission levels) [24].

2.2. Project Siting Methods

In addition to a review of studies related to project risk analysis, this study also reviews the methodology involved in site selection. The siting of an integrated energy system based on a stakeholder perspective is a typical multi-criteria decision making (MCDM) problem. Common methods used to solve MCDM problems include Technique for Order Preference by Similarity to Ideal Solution (TOPSIS), Vlsekriterijumska Optimizacija Ikompromisno Resenje (VIKOR), Analytic Hierarchy Process (AHP), Criteria Importance Though Intercrieria Correlation (CRITIC), Decision Making Trial and Evaluation Laboratory (DEMATEL) and an acronym in Portuguese concerning an interactive and multi-criteria decision-making method (TODIM) [25,26]. However, due to the lack of information and the ambiguity of decision makers’ judgements, the standard clarity values are not sufficient to accurately portray the reality of the problem. For this reason, researchers combined fuzzy sets with the above methodology and created fuzzy TOPSIS [27], fuzzy VIKOR [28], fuzzy AHP [29], fuzzy ANP [30] and fuzzy DEMATEL [31]. These methodologies can better deal with ambiguity issues. Additionally, a combination of the above methodologies can further enhance their practicality [32]. Karuppiah combined fuzzy ANP and DEMATEL and applied to the identification, analysis and assessment of faulty behaviour risks (FBRs) that lead to occupational accidents and injuries [30]. The introduced fuzzy sets are mainly used to remove the ambiguity of the decision maker’s judgment, commonly used methods are type-2 fuzzy number (IT2TrFN) [33] and Triangular Fuzzy Numbers (TFN) [15,34] The purpose of combining decision-making methods is to eliminate the errors associated with a single decision method. The TODIM method has received a lot of attention from researchers in recent years. Due to the influence of the decision maker’s own cognitive ability, emotion and psychology, the decision maker is often limited in rationality, and the actual choice of the decision maker may deviate from the optimal choice under the theory of rational choice. TODIM, as a typical decision-making method that takes into account the psychological behaviour of the decision maker, can simultaneously consider the risk preference of the decision maker and the objectivity of the decision; therefore, it is more suitable for solving the decision-making problems involving multiple stakeholders [35]. Wu used fuzzy DEMATEL–TODIM to choose the optimal project site for the expressway service area photovoltaic (ESAPV) [36]. Zhang proposed the CPT–TODIM method, a TODIM method based on Cumulative Prospect Theory (CPT), and used the method to assess the credit risk of companies [37]. Li combined the DANP (DEMATEL–ANP) and TODIM method to develop a comprehensive evaluation model for evaluating information quality [38].
According to the above literature review, political and economic risks are essential in the development of a risk analysis framework, while social, technical and environmental risks must be traded off based on the specific characteristics of the IES. In terms of decision-making methods, the combination of fuzzy sets and TODIM methods can minimize errors in judgment while taking a stakeholder’s risk preferences into account and is well suited to address multi-stakeholder project siting. However, existing studies have a single perspective in the selection of indicators for the risk analysis system and lack a multi-stakeholder perspective in indicator screening. At the same time, when conducting the siting analysis, existing decision-making methods do not adequately consider the balance of risks among multiple stakeholders and the sensitivity of different stakeholders to risks. As a result, there are two key points that must be improved in the siting of near-zero carbon emission power plants: First, focusing on comprehensiveness of the perspective, the indicator selection must reflect the concerns of various stakeholders. Second, the siting evaluation method must be improved to ensure that the siting decision takes into account stakeholder demands while remaining objective.

3. Criteria System of Risk Analysis for NZCEP Plant

Based on the findings of the literature review and expert interviews, this section develops a risk system for NZCEP plants, including political, economic, technological, social and environmental dimensions, as well as 12 secondary indicators (shown in Figure 2). Explanations for each secondary indicator are provided below. It should be noted that the stakeholders corresponding to each risk indicator are marked in the upper right-hand corner, where G represents government, I represents investors and P represents power plants.

3.1. Political Risk (C1)

Approval risk I,P (C11): In China, NZCEP plants are still in their infancy and have yet to be widely built. Since the government has limited experience with these projects, it will not approve a large number of them. At the same time, accidents in recent years have plagued wind power equipment and energy storage equipment in NZCEP plant, making the government more cautious about approving NZCEP plants.
Insufficient incentive policies G,I,P (C12): CCUS technology is the core technology for achieving carbon reduction for near-zero carbon emission power plants. Although it is regarded as a crucial technology for achieving carbon neutrality, it has not yet been put into widespread commercial operation. The majority of China’s current CCUS projects are industrial demonstration projects that received upfront funding. Currently, there are few incentives for CCUS projects, and the relevant agencies may gradually reduce subsidies in the future to leverage power plant profits through improved carbon emission trading market construction. Therefore, the availability of policy incentives at alternative sites is also an important factor when choosing a site for an NZCEP plant, taking into account the benefits of plant operation.
Inadequate legal and regulatory framework G,I,P (C13): To ensure that NZCEP plant can achieve the benefits of reducing carbon emissions, the accurate accounting of carbon emissions from power plants is required. However, there is currently no unified standard for calculating carbon emissions in China. Simultaneously, China lacks a comprehensive system of carbon management laws and regulations, which increases the operational risk of NZCEP plant.

3.2. Economic Risk (C2)

Profit risk I,P (C21): The revenue of a NZCEP plant is mainly comprises revenue from the electricity sales, revenue from CO2 trading and revenue from carbon trading; however, these revenues are subject to market influences, which constitute the uncertainty of this indicator.
Cost risk I,P (C22): The procurement costs for the component equipment in a NZCEP plant is relatively high. For example, the purchase cost of carbon capture equipment with a capture capacity of 100,000 tons per year is nearly CNY100 million, which is a significant cost for the plant. In addition, the operation and maintenance costs of an NZCEP plant also need to receive attention. The operation and maintenance of carbon capture equipment and power-to-gas equipment is extremely expensive, while the transportation and storage of CO2 also incur high costs. Thus, operation and maintenance are also a significant part of the cost of the NZCEP plant.

3.3. Technical Risk (C3)

Technology security risk G,I (C31): NZCEP plants achieve carbon emission reduction through CCUS technology; however, there are still some risks associated with this technology. In the carbon capture process, the leakage, volatilisation and degradation of solvents will generate toxic substances and cause environmental pollution, in addition to the residual waste from the use of adsorbent solvents, which may cause secondary pollution to the environment. During transportation, the canning equipment is vulnerable to external force impact or self-pressure overload, resulting in explosion and carbon dioxide leakage, causing damage to surrounding facilities and personnel. During the storage stage, CO2 leakage caused by geological movements (such as earthquakes) and the corrosiveness of CO2 to the formation will result in catastrophic asphyxiation areas, exacerbating the greenhouse effect. Thus, stakeholders are particularly concerned about the security of these technologies.
Technology lock-in risk G,I (C32): Technology lock-in is defined as the development of technology, social practices, regulatory regimes, standards, skills and management systems that become highly interconnected over time, thereby making it difficult for advantageous alternatives to gain a foothold. In this case, if the behavioural agent fails to disrupt the status quo, it will persist, resulting in technological lock-in [39]. CCUS technology is in the midst of an alternation between two generations of technology. While second generation technology hold great promise (lower carbon capture costs, higher carbon capture efficiency), it is at risk of technology lock-in due to factors such as government policy and path dependency [40].

3.4. Social Risk (C4)

Lack of human resources G,P (C41): Human resources are an essential factor in the operation of a NZCEP plant, and therefore the ability of local human resources to support the operation of the plant is a key concern for stakeholders. The profitability and management model of a NZCEP plant has changed dramatically compared to a traditional power plant, requiring the import of talent with relevant expertise, such as carbon management talent, system optimization and scheduling talent.
Lack of public support G (C42): The construction of a power plant will have an impact on the surrounding population and therefore the public willingness also needs to be taken into account. Some residents may oppose the project for fear of the threat posed by CO2 leakage, as in the case of the Barendrecht project in the Netherlands, which was cancelled due to public opposition. Another objection by residents may involve the belief that the visual impact of a wind farm on the landscape will affect tourism in the area and cause a decrease in their incomes [41]. These possibilities require the attention of the government.

3.5. Evironmental Risk (C5)

Wind resource condition G,I,P (C51): Wind resource conditions, such as wind speed, wind shear and turbulence, directly determine the installed capacity and operating hours of a project, affecting the investment benefits of the project, as well as having an impact on the safety of the turbines. For instance, in 2020, a wind farm in Heilongjiang was overloaded with high wind speeds, leading to the collapse of the turbines. Therefore, the wind resource conditions at alternative sites also need to be focused on in order to ensure the safety and economics of operating a NZCEP plant.
Geological conditions G,I,P (C52): Carbon dioxide storage has high geological requirements. The geological environment of the storage site needs to be sufficiently stable and resistant to corrosion, and there must be no pathways for carbon dioxide spillage or incorrectly closed abandoned wells in the vicinity of the storage site in order to ensure the safety of carbon dioxide storage.
Ecological damage risk G (C53): It has been noted that the construction of wind farms may have a detrimental impact on the local natural environment [42]. Infrastructure works, for example, may destroy vegetation as well as soil or even lead to habitat loss and fragmentation, and these potential risks of ecological damage are a major concern for government.

4. Methodology

4.1. Risk Evaluation Tools: Interval Type-2 Fuzzy Sets (IT2FSs)

IT2FSs were introduced in this research in order to reduce the influence of the fuzziness of expert judgments on the evaluation results when conducting risk evaluations. The operations of the IT2FSs involved in the calculation process are defined as follows [33,43].
Definition 1. 
Type-2 fuzzy set is defined as follow.
A ˜ = { ( ( x , u ) , μ A ˜ ( x , u ) ) | x X , u J x [ 0 , 1 ] , 0 μ A ˜ ( x , u ) 1 }
In Equation (1), X is the domain of discourse of A ˜ and μ A ˜ is the type-2 membership function of A ˜ . x denotes the value in the type-2 fuzzy number. u is the membership function corresponding to x, and μ A ˜ ( x , u ) is the secondary membership function of u.
Definition 2. 
For a type-2 fuzzy set A ˜ , if all μ A ˜ ( x , u ) = 1 , then the type-2 fuzzy set A ˜ is called an interval type-2 fuzzy set.
A ˜ = x X   u J x   1 / ( x , u )
where J x [ 0 , 1 ] .
Definition 3. 
If the upper and lower bound membership functions of an interval type-2 fuzzy number are trapezoidal type-2 fuzzy numbers, it is called trapezoidal interval type-2 fuzzy number (TIT2FN).
A = ( A U , A L ) = ( ( ( a 1 U , a 2 U , a 3 U , a 4 U ; H 1 ( A U ) , H 2 ( A U ) ) , ( ( a 1 L , a 2 L , a 3 L , a 4 L ; H 1 ( A L ) , H 2 ( A L ) ) )
where H j ( A U ) and H j ( A L ) , represent the subordination of each of the elements a j + 1 U and a j + 1 L ( 1 j 2 ) in A U and A L , respectively.
Definition 4. 
If A1 and A2 are two trapezoidal interval type-2 fuzzy numbers and k is a real number, then the basic operations are as follows [44].
A 1 + A 2 = ( A 1 U , A 1 L ) + ( A 2 U , A 2 L ) ( a 11 U + a 21 U , a 12 U + a 22 U , a 13 U + a 23 U , a 14 U + a 24 U ; min ( H 1 ( A 1 U ) , H 1 ( A 2 U ) ) , min ( H 2 ( A 1 U ) , H 2 ( A 2 U ) ) , a 11 L + a 21 L , a 12 L + a 22 L , a 13 L + a 23 L , a 14 L + a 24 L ; min ( H 1 ( A 1 L ) , H 1 ( A 2 L ) ) , min ( H 2 ( A 1 L ) , H 2 ( A 2 L ) ) )
A 1 × A 2 = ( A 1 U , A 1 L ) × ( A 2 U , A 2 L ) ( a 11 U × a 21 U , a 12 U × a 22 U , a 13 U × a 23 U , a 14 U × a 24 U ; min ( H 1 ( A 1 U ) , H 1 ( A 2 U ) ) , min ( H 2 ( A 1 U ) , H 2 ( A 2 U ) ) , a 11 L × a 21 L , a 12 L × a 22 L , a 13 L × a 23 L , a 14 L × a 24 L ; min ( H 1 ( A 1 L ) , H 1 ( A 2 L ) ) , min ( H 2 ( A 1 L ) , H 2 ( A 2 L ) ) )
kA 1 = ( ka 11 U , ka 12 U , ka 13 U , ka 14 U ; H 1 ( A 1 U ) , H 2 ( A 1 U ) , ka 11 L , ka 12 L , ka 13 L , ka 14 L ; H 1 ( A 1 L ) , H 2 ( A 1 L ) )
Then, the following formula is applied for defuzzification [45].
Defuzzified ( a i ) = 1 2 ( 1 4 ( ( a i 4 U a i 1 U ) + ( H 1 ( A i U ) × a i 2 U a i 1 U ) + ( H 2 ( A i U ) × a i 3 U a i 1 U ) ) + a i 1 U + 1 4 ( ( a i 4 L a i 1 L ) + ( H 1 ( A i L ) × a i 2 L a i 1 L )   + ( H 2 ( A i L ) × a i 3 L a i 1 L ) ) + a i 1 L )

4.2. Weighting Calculation Tools: Fuzzy DEMATEL-CRITIC

DEMATEL method is able to visualise complex causal relationships in order to elucidate the root causes of problems and identify strategies to solve core problems [46]. CRITIC is an objective weighting method that takes into account the correlation between indicators while taking into account the degree of variability of the indicators. The method determines indicator weights based on the comparative strength of the evaluation indicators and the conflicting nature of the indicators. This study combines the two methods in order to enable the determination of weights to take into account both the causal relationships between indicators and to ensure objectivity. The calculation steps are as follows:
Step 1. The direct-relation matrix A s is constructed. Where there are a total of s experts involved in the evaluation, each expert will provide a direct-relation matrix A s . The direct-relation matrix is expressed as follows:
A s = [ a ij ] n × n
In Equation (8), aij represents the degree of influence of indicator Ci on Cj. In this study, the degree of influence is divided into seven levels from Extremely low to Extremely high, and the values of each level are set in Table 1 [33].
Step 2. Construct the aggregation relation matrix A . Convert aij to TIT2FN (bij) according to Table 1. A ˜ s denotes the TIT2FN direct influence matrix.
A ˜ s = [ b ij ] n × n
Meanwhile, to avoid the influence of subjective expert assignments on the results, this study introduced the Ordered Weighted Averaging (OWA) (Equation (10)) [47].
OWA ( b ij E 1 , b ij E 2 , , b ij E s ) = j = 1 s w j b j
where bj represents the j-th largest value after sorting b ij E 1 , b ij E 2 , , b ij E s in ascending order and wj is the weight. The calculation is as follows.
w j = Q ( j s ) Q ( j 1 s )
In Equation (11) w j [ 0 , 1 ] , j = 1 s w j = 1 , Q ( β ) = β α , α 0 , 1 j s . In this paper α = 2 .
Following the above steps, the aggregation relation matrix A can be obtained.
A = [ b 11 b 12 b 1 n b 21 b 22 b 2 n b n 1 b n 2 b nn ]
Step 3. Normalized the direct-relation matrix A s .
B = 1 max ( max 1 i n j = 1 n b ij , max 1 j n i = 1 n b ij ) A s
Step 4. Calculate the total relationship matrix.
T = [ t ij ] n × n = B + B 2 + B 3 + + B n = i = 1 B i = B ( I B ) 1   i , j { 1 , 2 , 3 , , n }
where I is the unit matrix.
Step 5. Calculated centrality and causality.
D represents the degree of influence of indicator i on other indicators. R represents the degree to which indicator j is influenced by other indicators. The formulae for calculating the two indicators are as follows:
D = j = 1 n t ij
R = i = 1 n t ij
The centrality (D + R) measures how significant an indicator is within the context of the entire system: the higher the value, the more significant the indicator. Causality (D R) measures the extent to which an indicator influences other indicators. The indicator is a cause indicator and has a significant impact on other indicators when causality is greater than 0; otherwise, the indicator is a result indicator and is influenced by other indicators.
Step 6. Calculated the subjective weight of each indicator based on centrality and causality.
w sj = [ ( D + R ) 2 + ( D R ) 2 ] 2 j = 1 n [ ( D + R ) 2 + ( D R ) 2 ] 2
Step 7. Calculated the weight according to CRITIC method. The objective weight of the j-th indicator is calculated as follows:
w crj = c j j = 1 n c j
c j = σ j x ¯ j i = 1 m ( 1 | r ij | )
where σ j is the standard deviation of the j-th indicator. x ¯ j is the mean and r ij is the correlation coefficient between the i-th indicator and the j-th indicator.
Step 8. Calculated the final weight matrix w j .
w j = φ w sj + θ w crj ,   φ + θ = 1  
In Equation (20), φ and θ represent the weights of the two assignment methods (DEMATEL and CRITIC), respectively, and in this study φ = θ = 0.5.

4.3. Optimal Selection Tools: TODIM

Step 1. Constructing the normative decision matrix.
R N = [ r ij N ] m × n  
In a practical decision-making environment, indicator attributes include both benefit-based and cost-based categories. To ensure consistency in evaluating data for decision-making and to overcome the influence between different types of data, indicators need to be standardized.
The formula for calculating the benefit-based indicator is as follows:
r ij N = r ij / i = 1 m r ij 2  
The formula for calculating the cost-based indicator is as follows:
r ij N = 1 r ij / i = 1 m ( 1 r ij ) 2  
Step 2. Calculated the associated weights w jr for indicator cj [48].
w jr = w j w r ,   j = 1 , 2 , , n
w r = max { w j | j = 1 , 2 , , n }
Step 3. Calculated the dominance of option Ai over option Ak.
δ ( A i , A k ) = j = 1 m ϕ j ( A i , A k ) ,   i , k = 1 , 2 , , m
ϕ j ( A i , A k ) = { w jr ( r ij N r kj N ) j = 1 n w jr , if ( r ij N r kj N ) > 0 0 , if ( r ij N r kj N ) = 0   1 θ ( j = 1 n w jr ) ( r kj N r ij N ) w jr , if ( r ij N r kj N ) < 0
where θ is the loss attenuation factor, which can be adjusted by the expert. The smaller the value of θ, the greater the loss aversion of the decision maker, that is, the more sensitive the decision maker is to risk.
Three stakeholders are involved in this study: the government, the power plant and investors. Because each of these stakeholders has a different risk appetite, a different risk recession coefficient, or θv, is set for each of them, with V = 1, 2 and 3. the risk recession for Cj is calculated as follows:
θ C j = ( V j = 1 δ j θ V j ) 1 δ j  
where vj stands for the subjects with an interest in Cj, θvj for the risk recession coefficient of the subject n with an interest in Cj and δj for the total number of stakeholders with an interest in Cj.
Therefore, Equation (27) can be adjusted to ϕ j ( A i , A k ) = 1 θ C j ( j = 1 n w jr ) ( r kj N r ij N ) w jr .
If there exist an indicator C1 that is linked to three stakeholders, Then, the relative dominance of Ai to Ak on C1 should calculated as:
ϕ 1 ( A i , A k ) = [ ϕ 1 1 ( A i , A k ) × ϕ 1 2 ( A i , A k ) × ϕ 1 3 ( A i , A k ) ] 1 3
ϕ 1 1 ( A i , A k ) = 1 θ 1 ( j = 1 n w jr ) ( r k 1 N r i 1 N ) w 1 r
ϕ 1 2 ( A i , A k ) = 1 θ 2 ( j = 1 n w jr ) ( r k 1 N r i 1 N ) w 1 r
ϕ 1 3 ( A i , A k ) = 1 θ 3 ( j = 1 n w jr ) ( r k 1 N r i 1 N ) w 1 r
It should be noted that in this study, we assume risk aversion coefficients of 0.1, 0.75 and 1.25 for the government, power plants and investors, respectively, based on the actual construction of NZCEP.
Step 4. Calculate the global dominance of option Ai.
ξ i = k = 1 m δ ( A i , A k ) min 1 i m ( k = 1 m δ ( A i , A k ) ) max 1 i m ( k = 1 m δ ( A i , A k ) ) min 1 i m ( k = 1 m δ ( A i , A k ) )
Step 5. Ranking alternatives. Ranked the options Ai according to the value of ξ i , the larger ξ i , the better the option Ai.

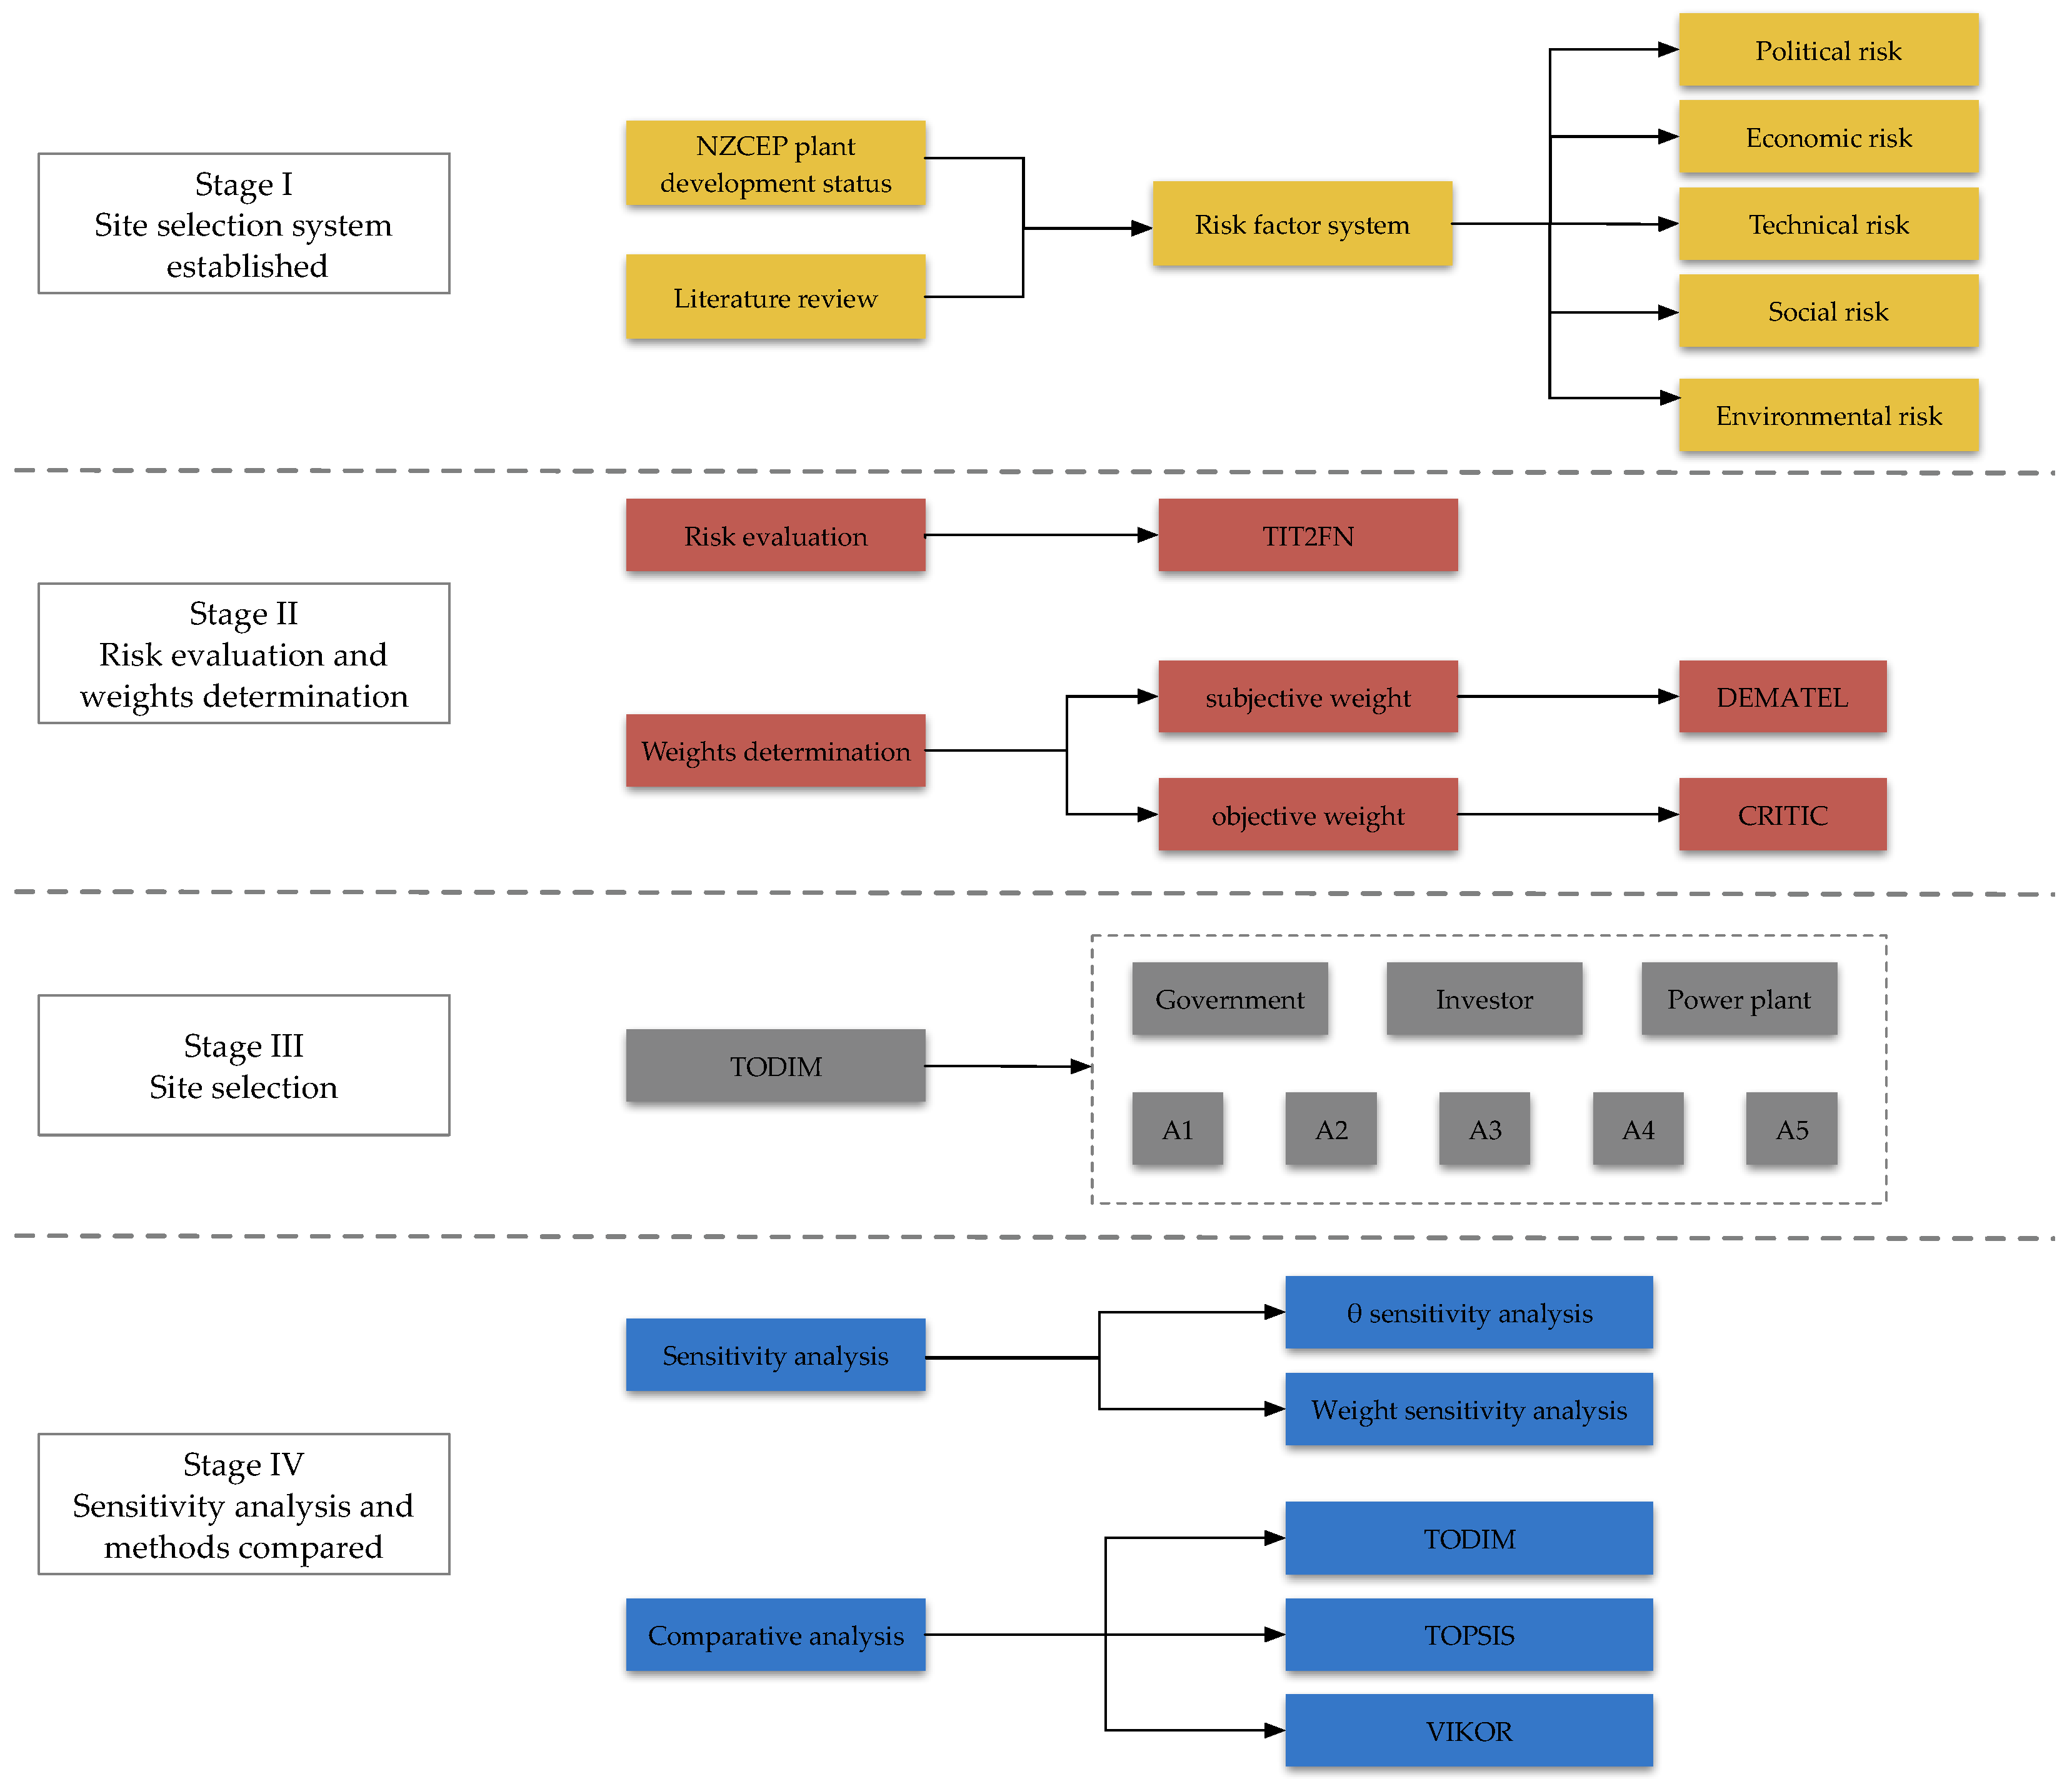
4.4. Study Framework

This section describes the technical route for NZCEP siting (as shown in Figure 3) and summarized in the following stages:
Stage I: The preliminary phase is divided into two parts: the identification of alternative sites and of risk factors. Firstly, the expert group selected five alternative sites based on government policy and findings on local resources. Secondly, risk factors associated with the NZCEP plant site were identified by analysing stakeholder interests and the results of previous research.
Stage II: Risk evaluation and calculation of the comprehensive indicator weights. Firstly, risk evaluation is carried out by TIT2FN, the specific usage and conversion methods, which are detailed in Section 4.1. Secondly, in order to minimize the influence of experts’ personal preferences on the factor weights, this paper combined the subjective and objective methods to determine the indicator weights. The DEMATEL method was used to determine the causal relationships between risk indicators and their subjective weights, and the CRITIC method was used to determine the objective weights of risk indicators. The details are shown in Section 4.2.
Stage III: Site selection. In this stage, this study proposes a method for applying TODIM to decision making, taking into account the psychological behaviour and risk preference of different stakeholders in the decision-making process. This stage is divided into five steps and the specific calculation method is described in detail in Section 4.3. By calculating the value of ξ i of the selected sites and comparing them, the optimal site is finally determined.
Stage IV: Sensitivity analysis and methods comparison. The aim of this stage is to validate the credibility and advantages of the decision-making method proposed in this study. In the actual decision-making process, the subjective judgement of the decision maker may have an impact on the weights and θ values, thus causing the final site selection results to change. In order to avoid such situation, a sensitivity analysis was conducted to ensure the stability of the results in this paper. Furthermore, we compared the different decision methods with the TODIM method to verify the accuracy of the decision results.

5. Case Study

The siting of NZCEP plants places high demands on natural resource conditions and the social environment, so the choice of location requires a combination of factors. Currently, suitable sites for large amounts of CO2 are mainly located in the north of China; however, given the level of technology, policy support and electric power structure, it is the central and eastern regions that are the first choices for the construction of NZCEP plants. On the one hand, the central and eastern regions have a high level of technical and economic development and can provide the necessary human resources, policies and technical support for the operation of power plants. On the other hand, there are more gas-fired power generation units in the region, which can provide the basis for the construction of near-zero carbon emission power plants. Of these, Fujian, Henan, Beijing, Guangdong and Sichuan provinces have relative advantages in terms of technology, policy support and natural environment.
Based on policy support, a power investment company will invest in the construction of an NZCEP plant in these provinces with a construction capacity of 200 MW of wind power with a total installed capacity and a CCUS system with a capture capacity of 100,000 tonnes/year. The wind turbine will have a rated capacity of 4 MW, a cut-in speed of 2.5 m/s and a rated speed of 9.7 m/s.

5.1. Identification of Feasible Sites

In this paper, five sites were selected as potential construction sites for a NZCEP plant. They are: Jinjiang, Fujian Province (A1); Zhengzhou, Henan Province (A2); Chaoyang District, Beijing (A3); Huizhou City, Guangdong Province (A4); and Ziyang City, Sichuan Province (A5). These sites satisfy three basic conditions simultaneously. Firstly, the local wind resource conditions meet the requirements for wind power generation. Secondly, there is a carbon sink point within 250 km of the site that is eligible for carbon dioxide sequestration. Thirdly, there are gas-fired units available in the vicinity of the site. The specific locations of the five sites and the conditions for carbon dioxide storage in China are shown in Figure 4 below. The wind speed data are provided by the geographic remote sensing ecological network platform [49]. The data of geological storage conditions for CO2 in China are from the China Geological Survey (CGS) [50].

5.2. Process and Results

Following the process described in Section 4.4., this section evaluates the five alternative sites mentioned in the previous section for the siting of NZCEP plants.
In the first stage, we invited five experts in the relevant fields and formed a panel for the evaluation. The basic information of the experts is shown in Table 2 below. The experts had three main jobs. The first was to review the reasonableness of the evaluation indicators. The second was to discuss and decide on alternative sites based on their own experience and the actual situation. The third was to fill in the comment form and give the evaluation matrix data for the determination of the weight of each indicator (the evaluation matrix is drawn in Appendix A).
In the second stage, our main task was to calculate the indicator weights based on the evaluation data given by the experts, and the calculation method is shown in Section 4. Firstly, the experts’ evaluation results were converted into TIT2FN. Secondly, the DEMATEL method was used to determine the centrality, causality and subjective weights of the indicators, and the CRITIC method was used to determine the objective weights of each indicator. Finally, the composite weights were calculated by Equation (20). The conversion methods of the expert evaluation results and the calculation of the weights are detailed in Section 4.1. and Section 4.2. of this paper.
The centrality and causality of each indicator calculated using the DEMATEL method is shown in Figure 5 below. From the results of the centrality calculation, the most important indicator is profit risk (C21, 2.60857), followed by lack of human resource (C41, 2.130743) and approval risk (C11, 2.070333). The centrality of revenue risk is much greater than that of project approval risk, indicating that the revenue risk is the most important factor to consider when selecting a site. From the calculation results of the reason degrees, inadequate legal and regulatory framework (C13, 0.239818), technology security risk (C31, 0.328298), lack of human resources (C41, 0.660439), wind resource conditions (C51, 0.546262), geological conditions (C52, 0.536097) and ecological damage risk (C53, 0.50681), several indicators with values greater than 0 are the reason indicators, and it is worth noting that, in addition to ecological conditions, human resources is also a reason indicator that cannot be ignored for the site selection of an NZCEP plant.
The weighting calculations indicate that political and economic factors are the most important considerations when selecting a NZCEP plant site, followed by social, resource and technical factors (the results is shown in Figure 6). The secondary indicators of greatest concern are the profit risk (C21) and the approval risk (C11). In addition to this, lack of human resource (C41) is also an important indicator that should not be overlooked. This is due to the fact that NZCEP plants are integrated energy systems that are complex to operate and necessitate the involvement of managers with market forecasting and carbon management skills who manage and rationalize resource allocation by optimizing plant scheduling to drive increased plant profitability.
In the third stage, the TODIM method was used for site selection evaluation. The calculation steps are described in detail in Section 4.3. and the results are shown in Table 2 below. According to Table 3, among the five alternatives for siting the NZCEP plant, the optimal choice is Zhengzhou, Henan Province (A2), followed by Chaoyang District, Beijing (A3); Ziyang City, Sichuan Province (A5); and Huizhou City, Guangdong Province (A4), with the least suitable choice being Jinjiang, Fujian Province (A1).

5.3. Sensitivity Analysis

This section performs the sensitivity analysis of weights and θ . The stability of the decision framework proposed in this paper is verified by comparing the calculated results under different levels of weights and θ values.

5.3.1. Weight Sensitivity Analysis

The setting of weights is a critical part of the evaluation system and has a significant impact on the evaluation results. This section conducts a sensitivity analysis of the weights, in which we vary the weights of each category of risk factors and calculate the ranking results. The weights were changed in six levels, namely −30%, −20%, −10%, 10%, 20% and 30%. It should be noted that when the weight of one type of risk factor increased, the weights of the other risk types decreased proportionally and vice versa. The results of the weighting sensitivity analysis are shown in Figure 7 below.
Figure 7 shows that weight fluctuations have a small impact on the overall ranking but a large impact on the calculated results, primarily for A4 and A5. When the weights of political risk (C1), economic risk (C2) and technical risk (C3) continue to rise, the scores of A4 and A5 fall, and the change in the weight of C1 has the greatest impact on the scores of A4 and A5. When the weights of social risk (C4) and environmental risk (C5) keep increasing, the scores of A4 and A5 show an increasing trend and the increase in the weight of environmental risk (C5) has a more obvious impact on the scores of A4 and A5. In conclusion, no matter how the indicator weights change, the ranking of the alternatives is always A2 > A3 > A5 > A4 > A1, with Zhengzhou City in Henan Province always being the best choice.

5.3.2. Sensitivity Analysis of θ

To further test the impact of different stakeholders’ risk preferences on the site selection results, a sensitivity analysis of θ was conducted in this section. The sensitivity analysis was conducted in two parts. First, the effect of changes in the θ value of a single stakeholder on the results was tested. Second, the effect of a change in θ on the results was tested, with the government, investors and power plants all having equal risk preferences.
While testing single stakeholder risk preference changes, we keep θ values of the other two stakeholders unchanged. The specific θ value setting and calculation results are shown in Table 4 and Figure 8 below.
To show the sorting changes more visually, we present the results as a line graph below.
According to Table 4 and Figure 8, it can be seen that changes in the risk preferences of a stakeholder have no effect on the ranking of the site selection results, with the ranking remaining unchanged at A2 > A3 > A5 > A4 > A1, although they have some effect on the scores of each alternative. It can be seen that regardless of which stakeholder’s θ value changes, the scores for A3, A4 and A5 all decrease as θ values increase, but A4 has the fastest decrease of 2.19163%, while A3 and A5 decrease by 0.06% and 0.26%, respectively. In addition, this paper further calculates the degree of influence of changes in risk appetite of different stakeholders on the calculated results. The results show that the degree of influence is in the following order: government > power plants > investors, with the change in risk appetite of the government having the greatest influence on the results, with an average change in the resultant values of 14.5681%, 13.8641% for power plants and 13.3465% for investors.
In addition to the sensitivity analysis of changes in risk preferences for a single stakeholder, this section further tests the impact of different levels of combined risk preferences on site selection outcomes. Specifically, this section assumes that the government, investors and power plants have the same θ value when making a site selection for NZCEP plant. Additionally, we set three risk preferences for testing: low (0.1), medium (1) and high (2.25). The specific results are shown in Figure 9 below.
According to Figure 9, when the risk preferences of the three stakeholders are at low levels, the results of the site selection ranking are A2 > A3 > A4 > A5 > A1. When the risk preferences of the three stakeholders are at medium to high levels, the results of the site selection ranking are A2 > A3 > A5 > A4 > A1. Similar to the results in the previous section, the scores of A3, A4 and A5 show a decreasing trend as theta values increase, and the score of A4 decreases the most. It is also important to note that when the risk preferences of government, investors and power plants are all at low levels, A4 has a higher score than A5.
A thorough examination of the preceding data reveals that, in general, when the level of risk preference of stakeholders is higher, the difference in scores between options is more pronounced, but this has no bearing on the final site selection decision, and the calculation results are generally stable, with A2 being the best option and A1 being the worst. The most sensitive to changes in risk preference is A4, which scores slightly higher than A5 when the risk preferences of the government, investors and power plants are all at low levels but remains lower than A5 at other times. When siting for a NZCEP plant, A4 requires extra attention to risk management and a stable investment and operating environment.

5.4. Comparative Analysis

To verify the credibility and advantages of the TODIM method, this section compares TOPSIS and VIKOR, two commonly used multi-objective decision methods, with the TODIM method. The fuzzy TOPSIS method solves the ranking problem by the distance of each site from the ideal solution [27]. VIKOR determines the ranking of the evaluation objects by comparing the magnitude of the distance between each object and the optimal and worst solutions, and thus obtains the superiority rank of the object to be evaluated. The results of the three methods of site selection are shown in Table 5 below [51].
According to Table 5, the ranking results for all three methods are the same, with A2 > A3 > A5 > A4 > A1, indicating the high accuracy of the TODIM method in solving the site selection problem. However, although the results obtained by the three methods are the same, only the TODIM method takes into account the psychological behaviour of decision makers; the TOPSIS and VIKOR methods are used under the assumption that decision makers are perfectly rational. The construction of NZCEP plant is currently in its infancy and decision makers lack relevant experience. Meanwhile, the construction and operation of NZCEP plant involve multiple interests, which makes it impossible for decision makers to be fully rational, so the TODIM method, which takes into account the psychology of decision makers, is more advantageous in solving this type of problem.
Finally, the findings we obtained after summarizing and analysing the results of the preceding calculations are shown below:
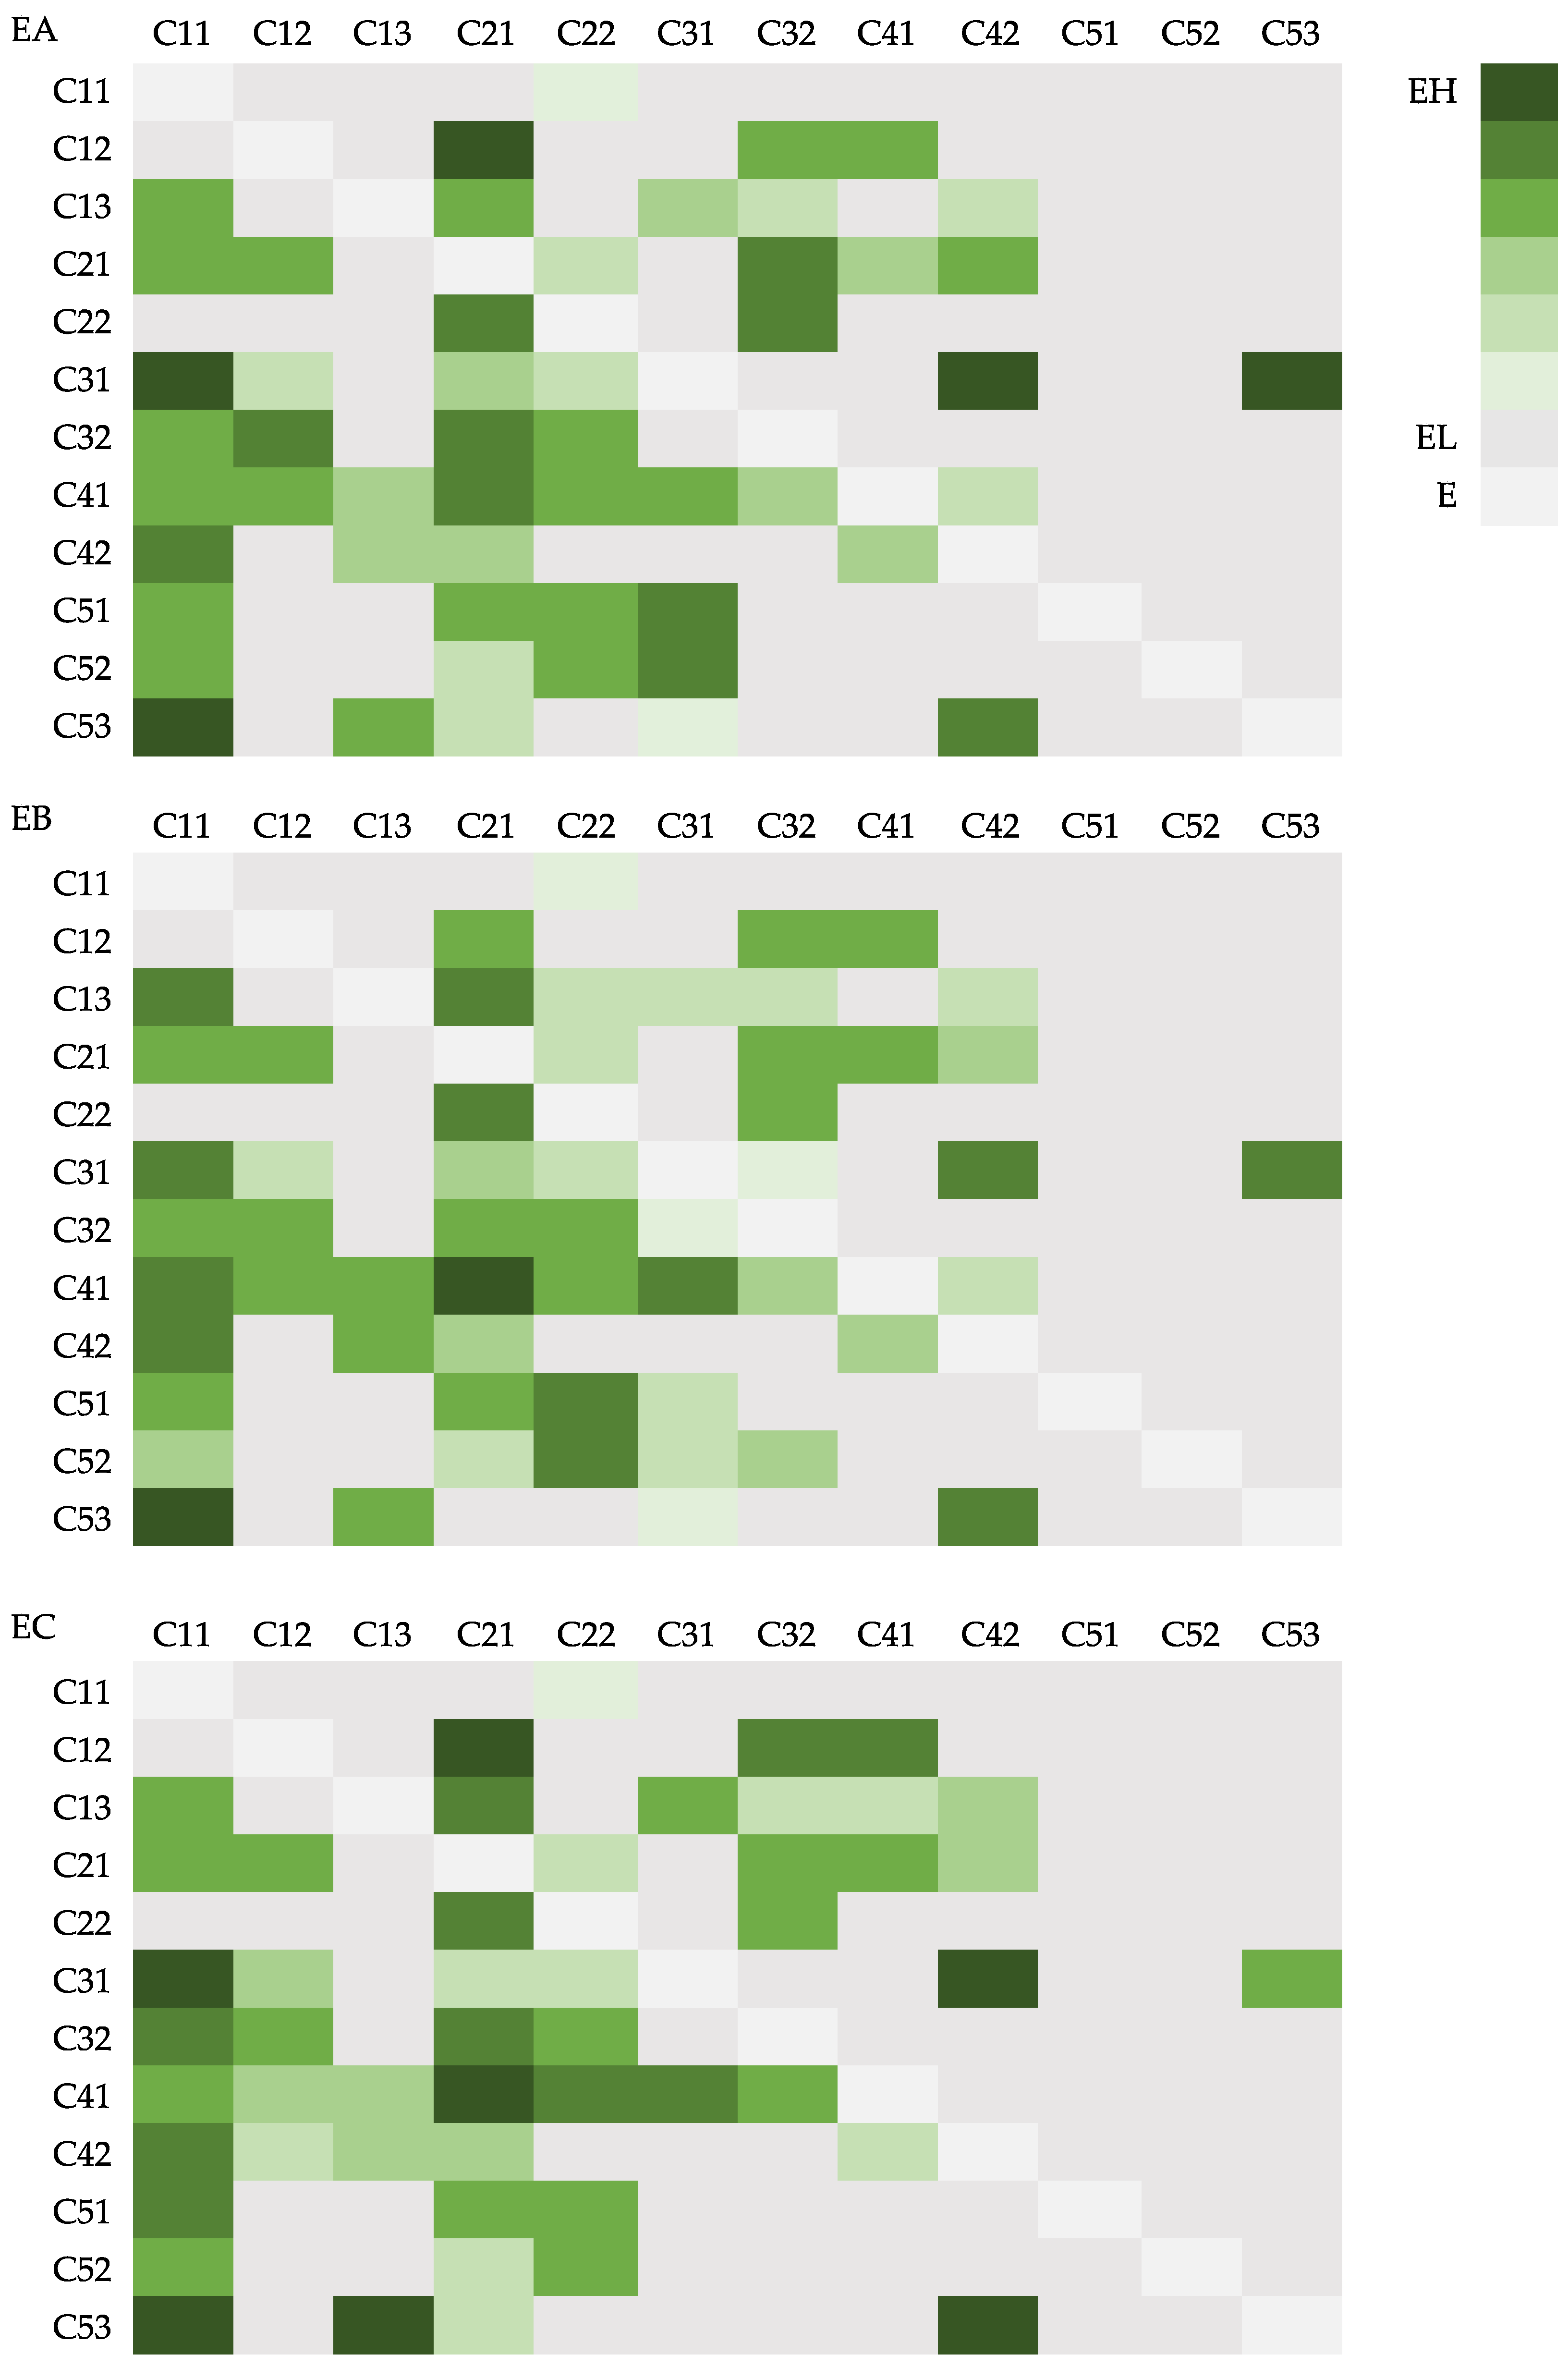
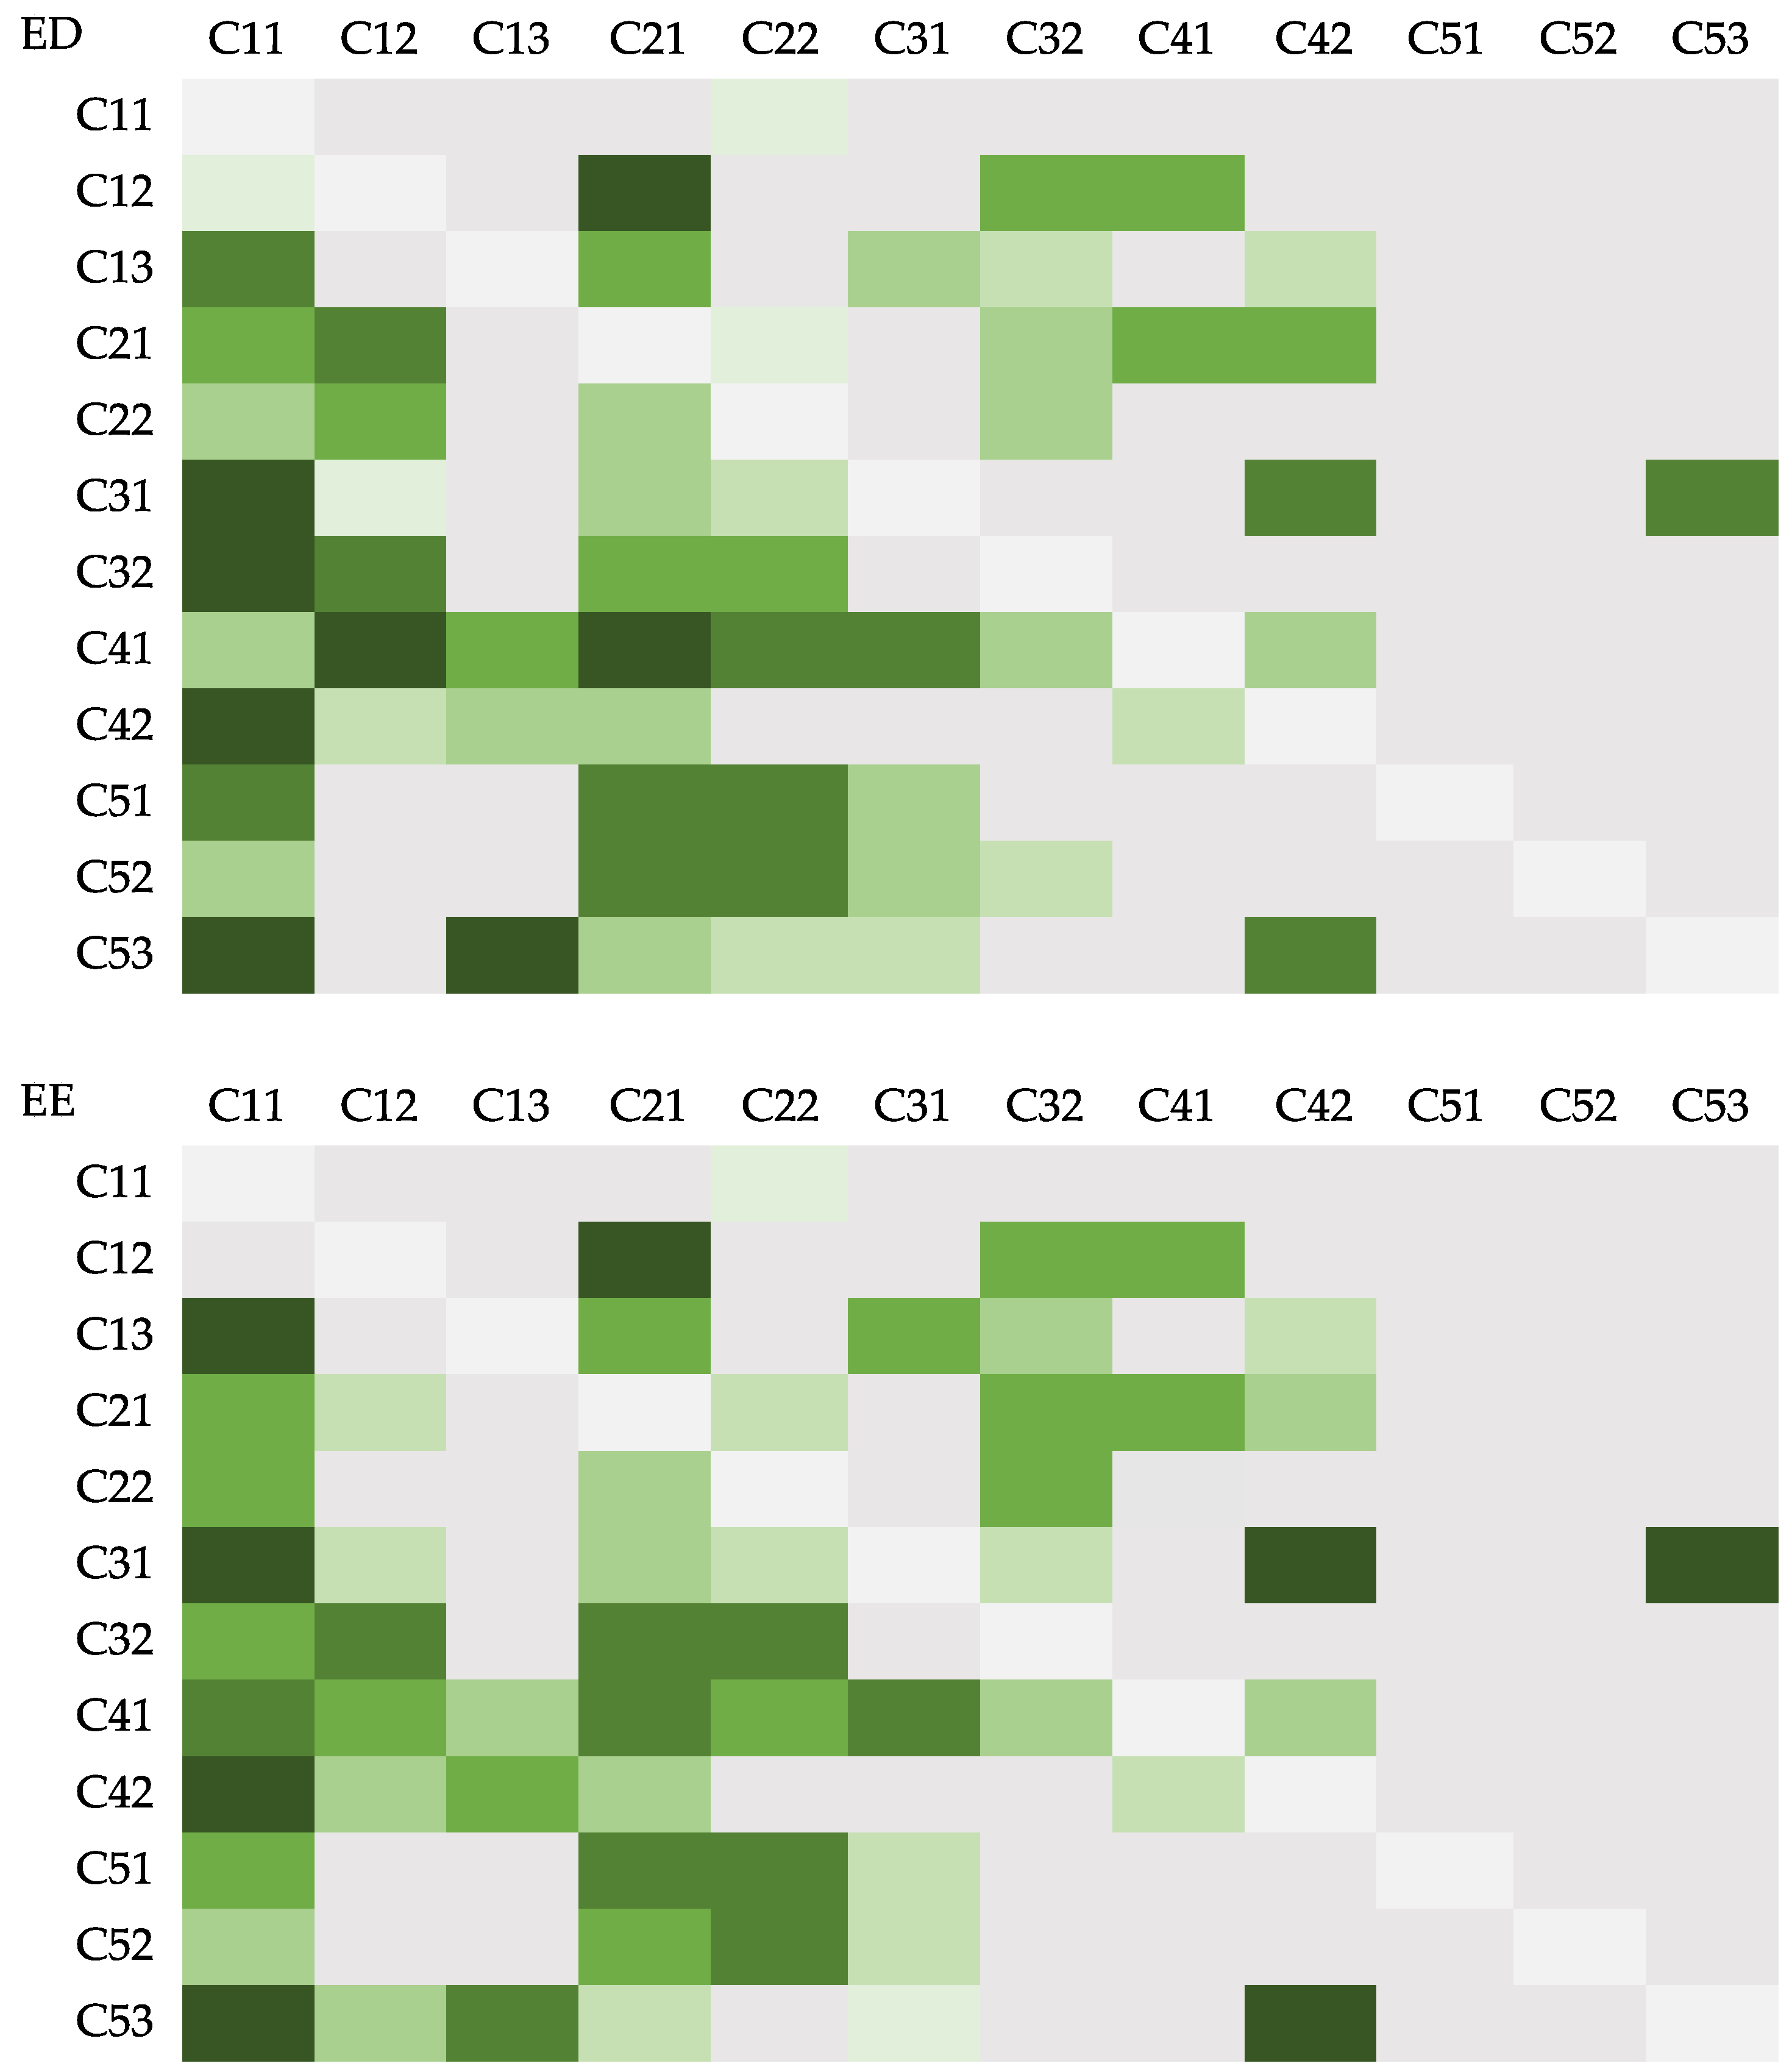
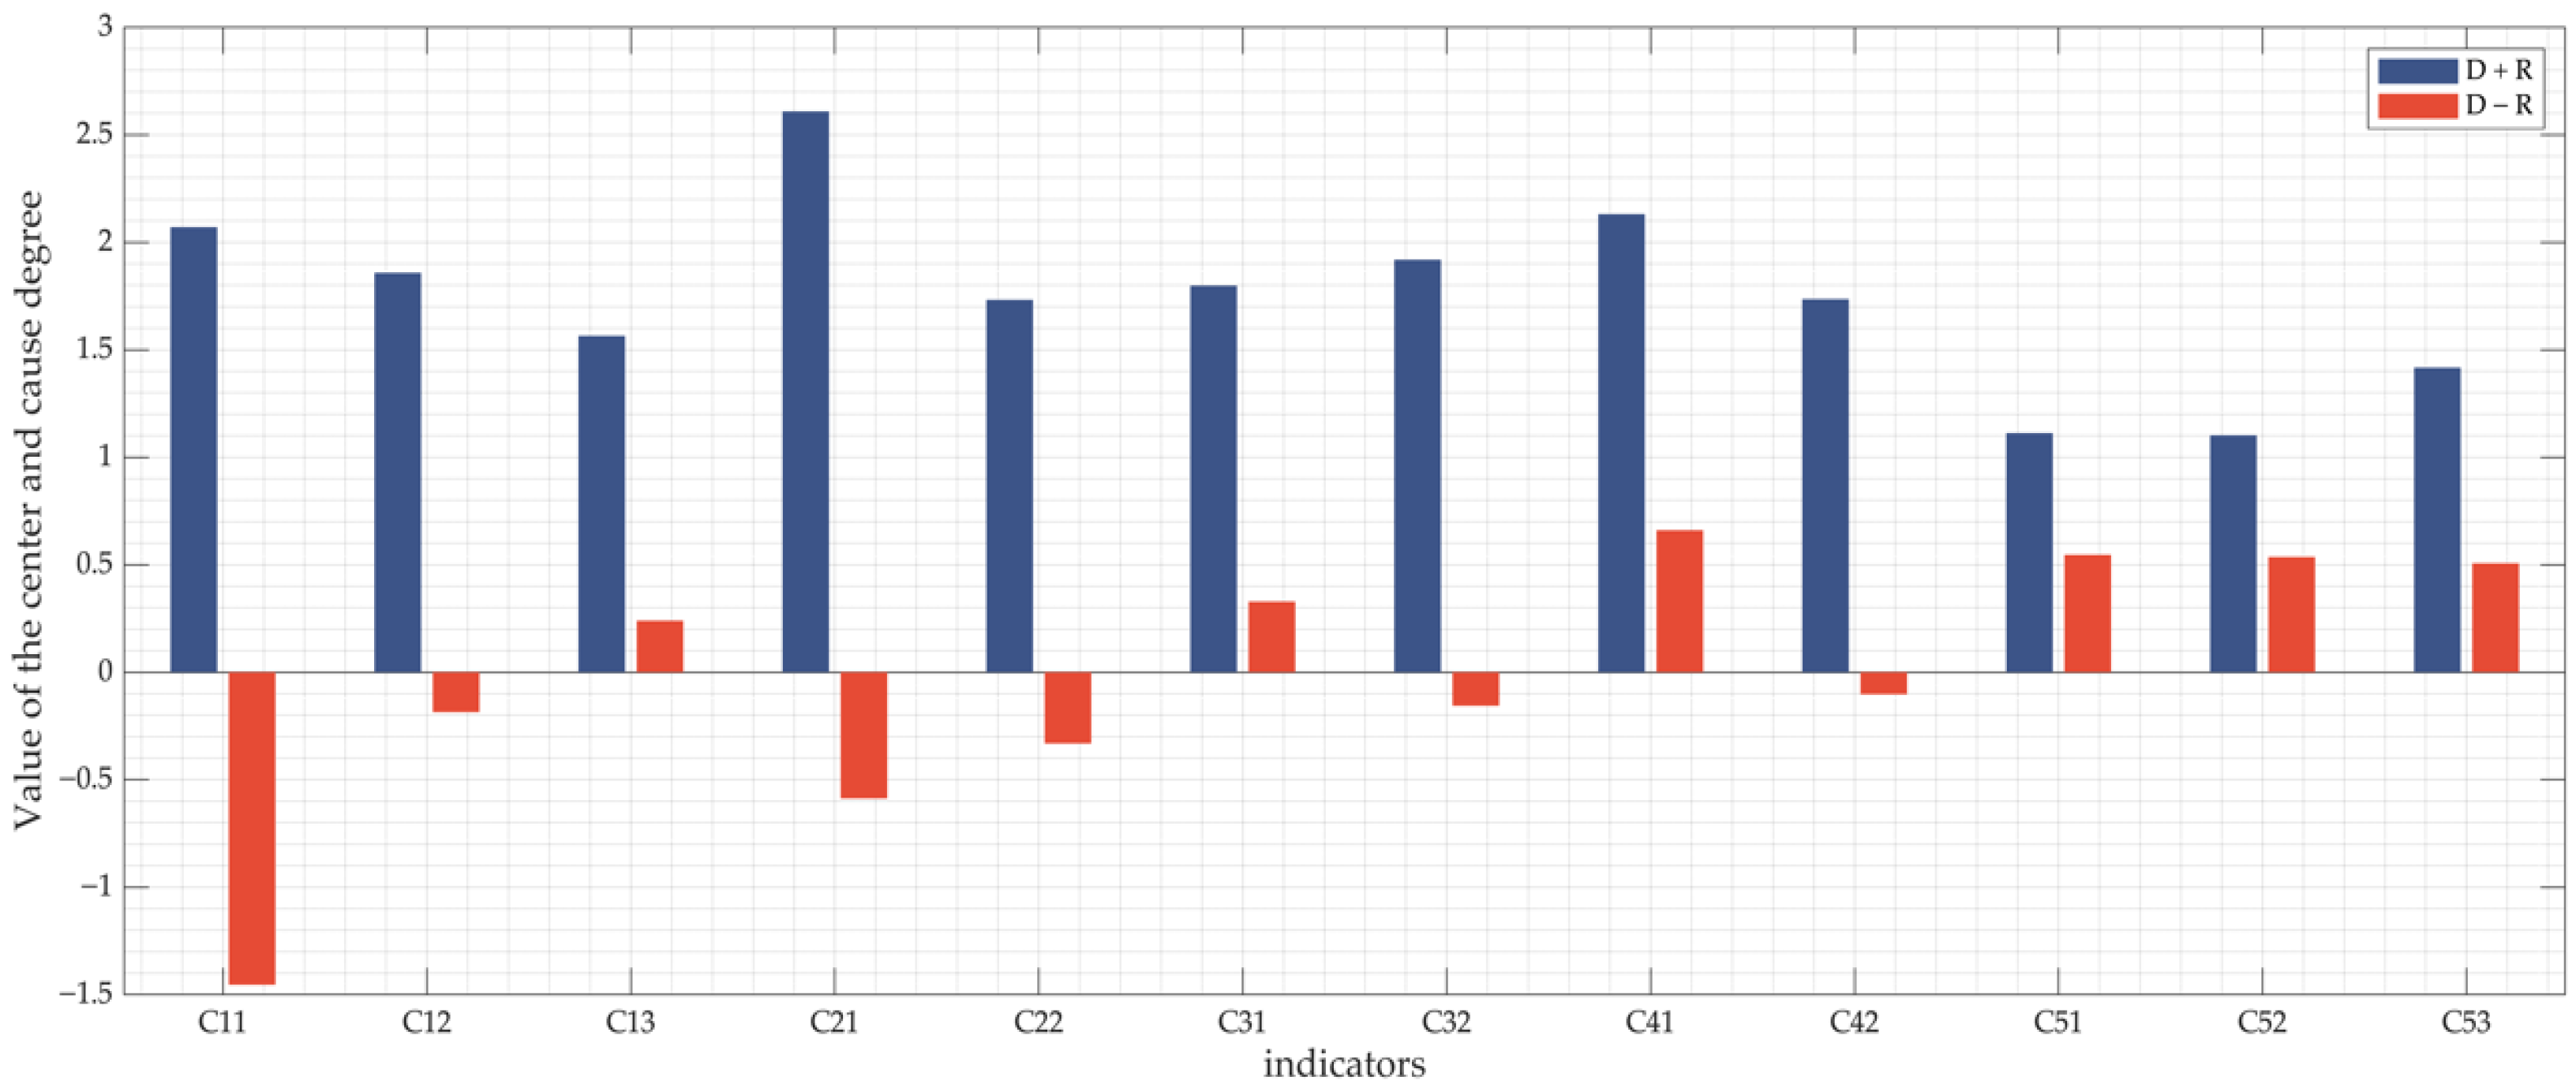
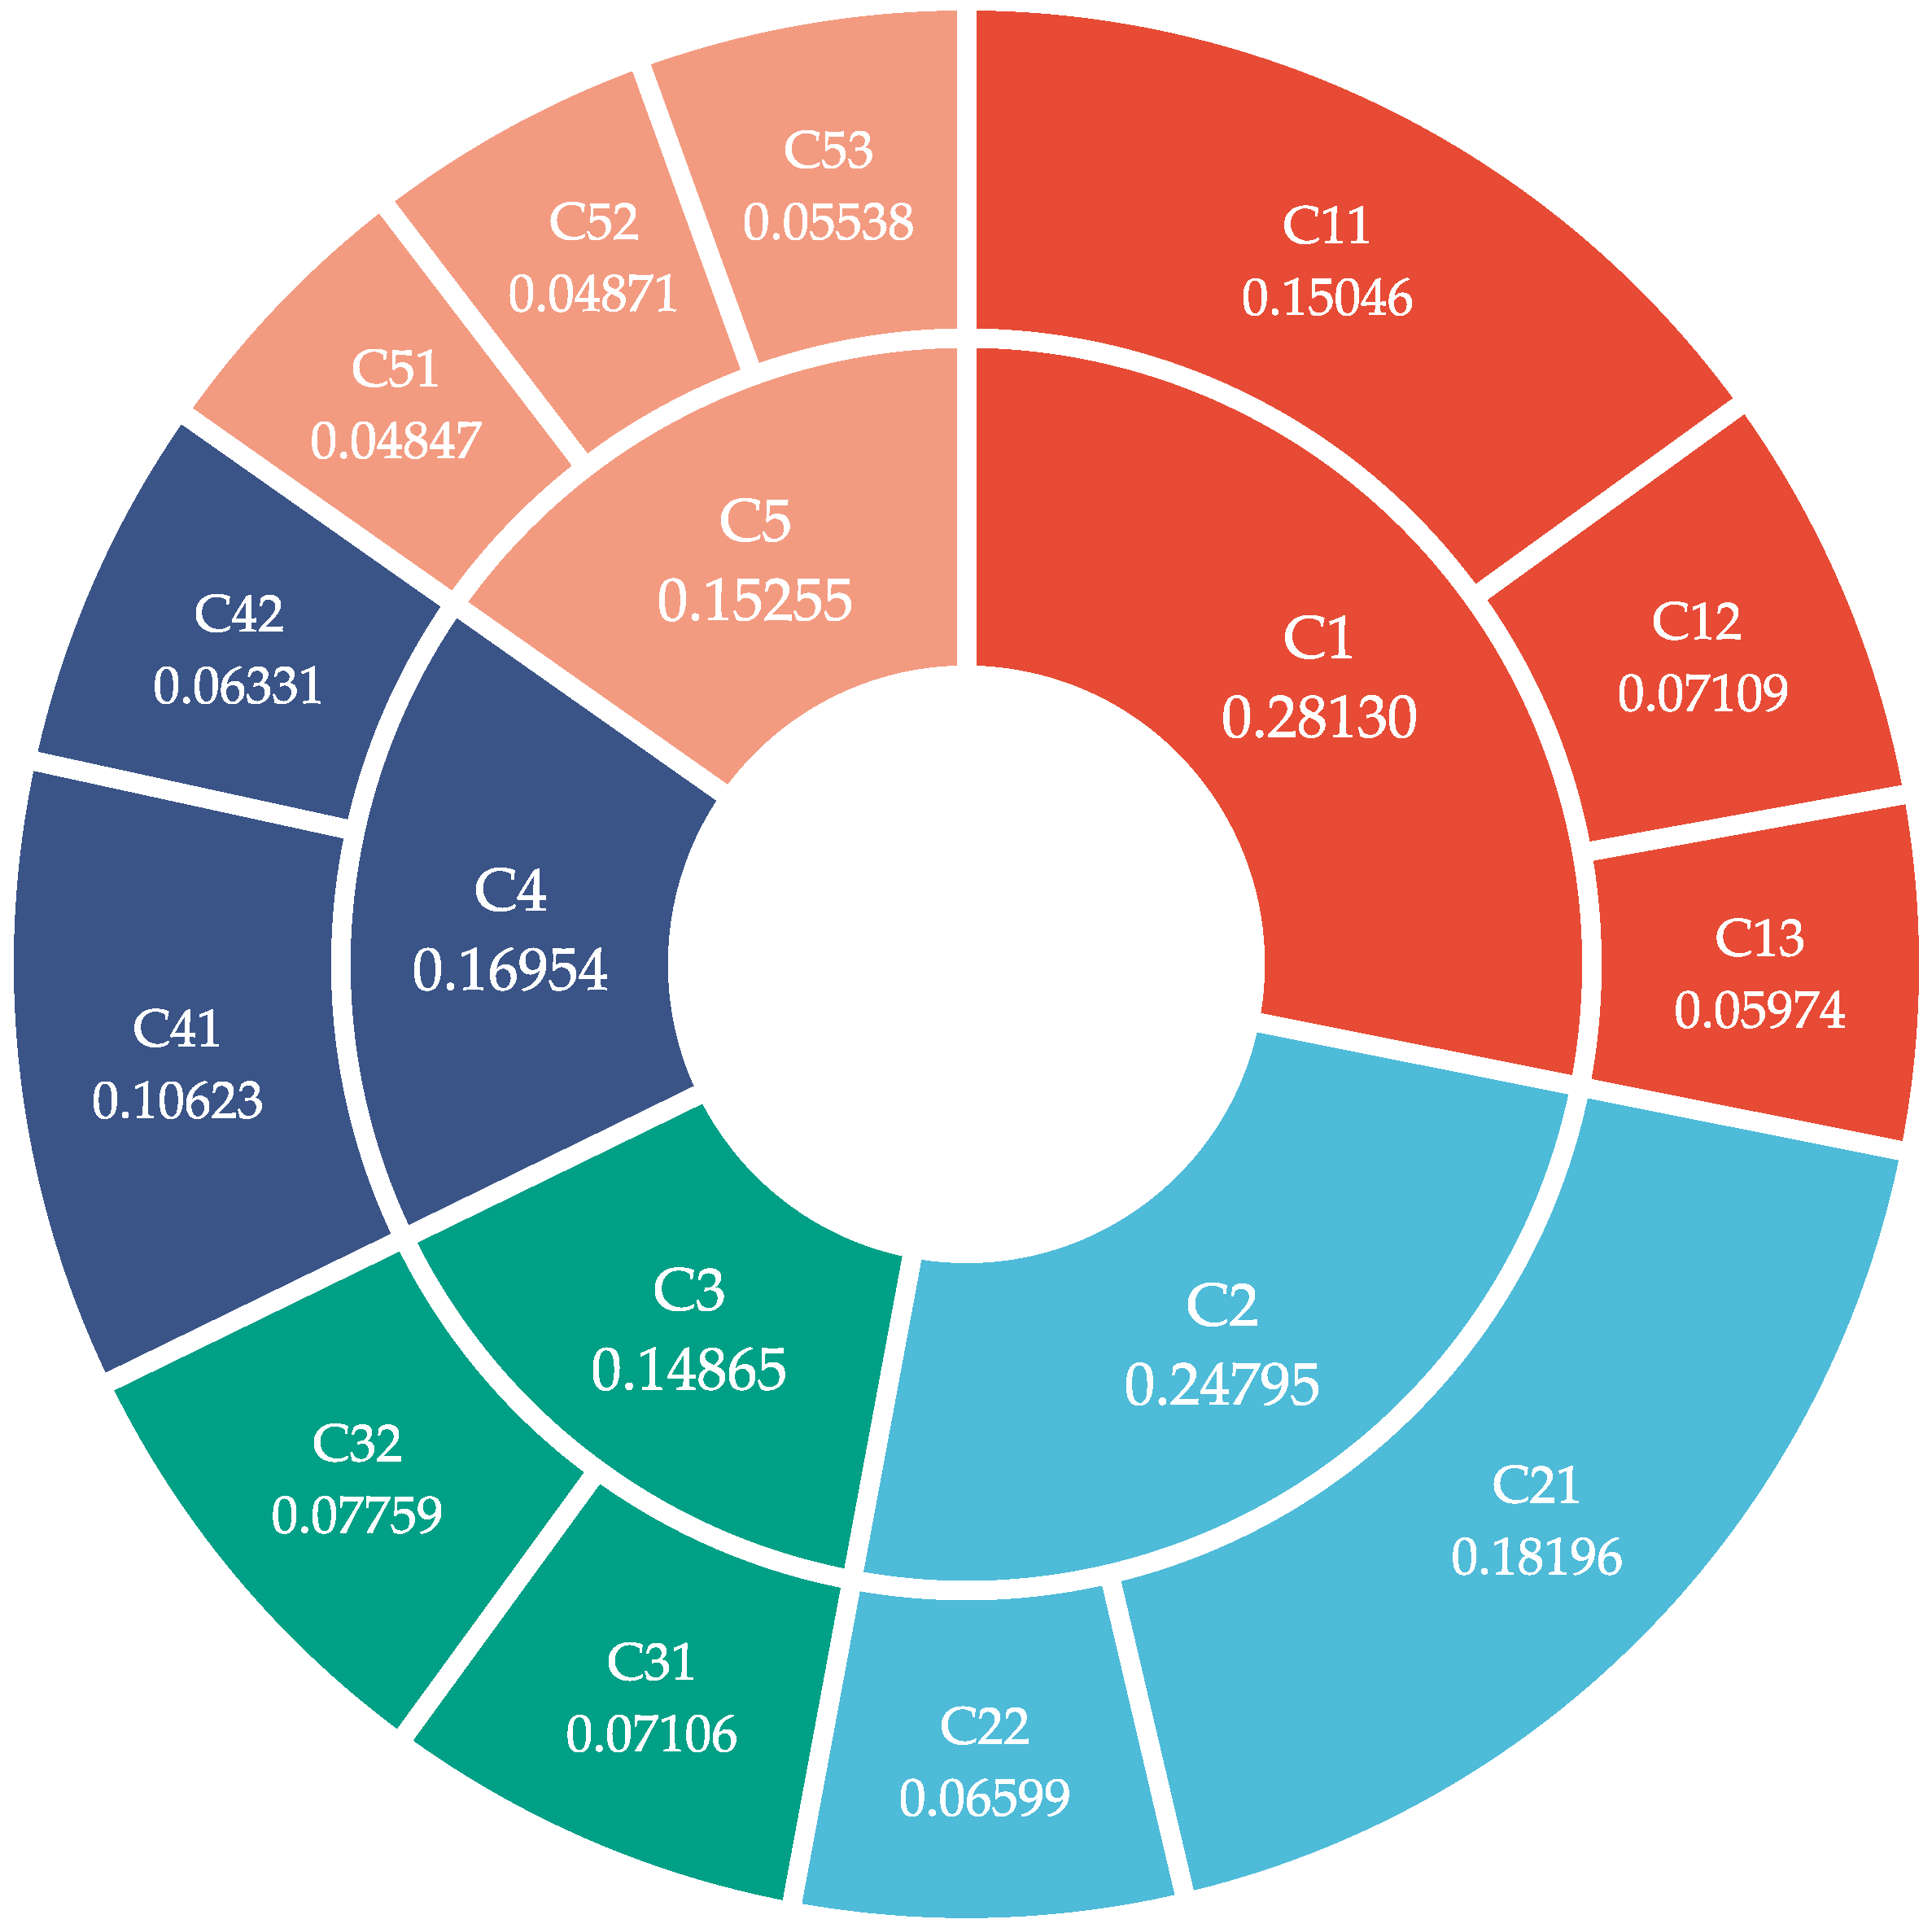
  • The results of the weighting calculation show that political risk (C1) is the most important among the risk categories. The most critical risk indicator is profit risk (C21), followed by approval risk (C11) and lack of human resources (C41). In terms of the relationship between indicators, inadequate legal and regulatory framework (C13), technology security risk (C31), lack of human resources (C41), wind resource conditions (C51), geological conditions (C52) and ecological damage risk (C53) are cause indicators that influence other risk indicators. Of particular interest is that human resources are both important risk and cause indicators. This suggests that decision makers should pay extra attention to whether the human resources at alternative sites can meet the operational needs of the project in the process of siting NZCEP power plants.
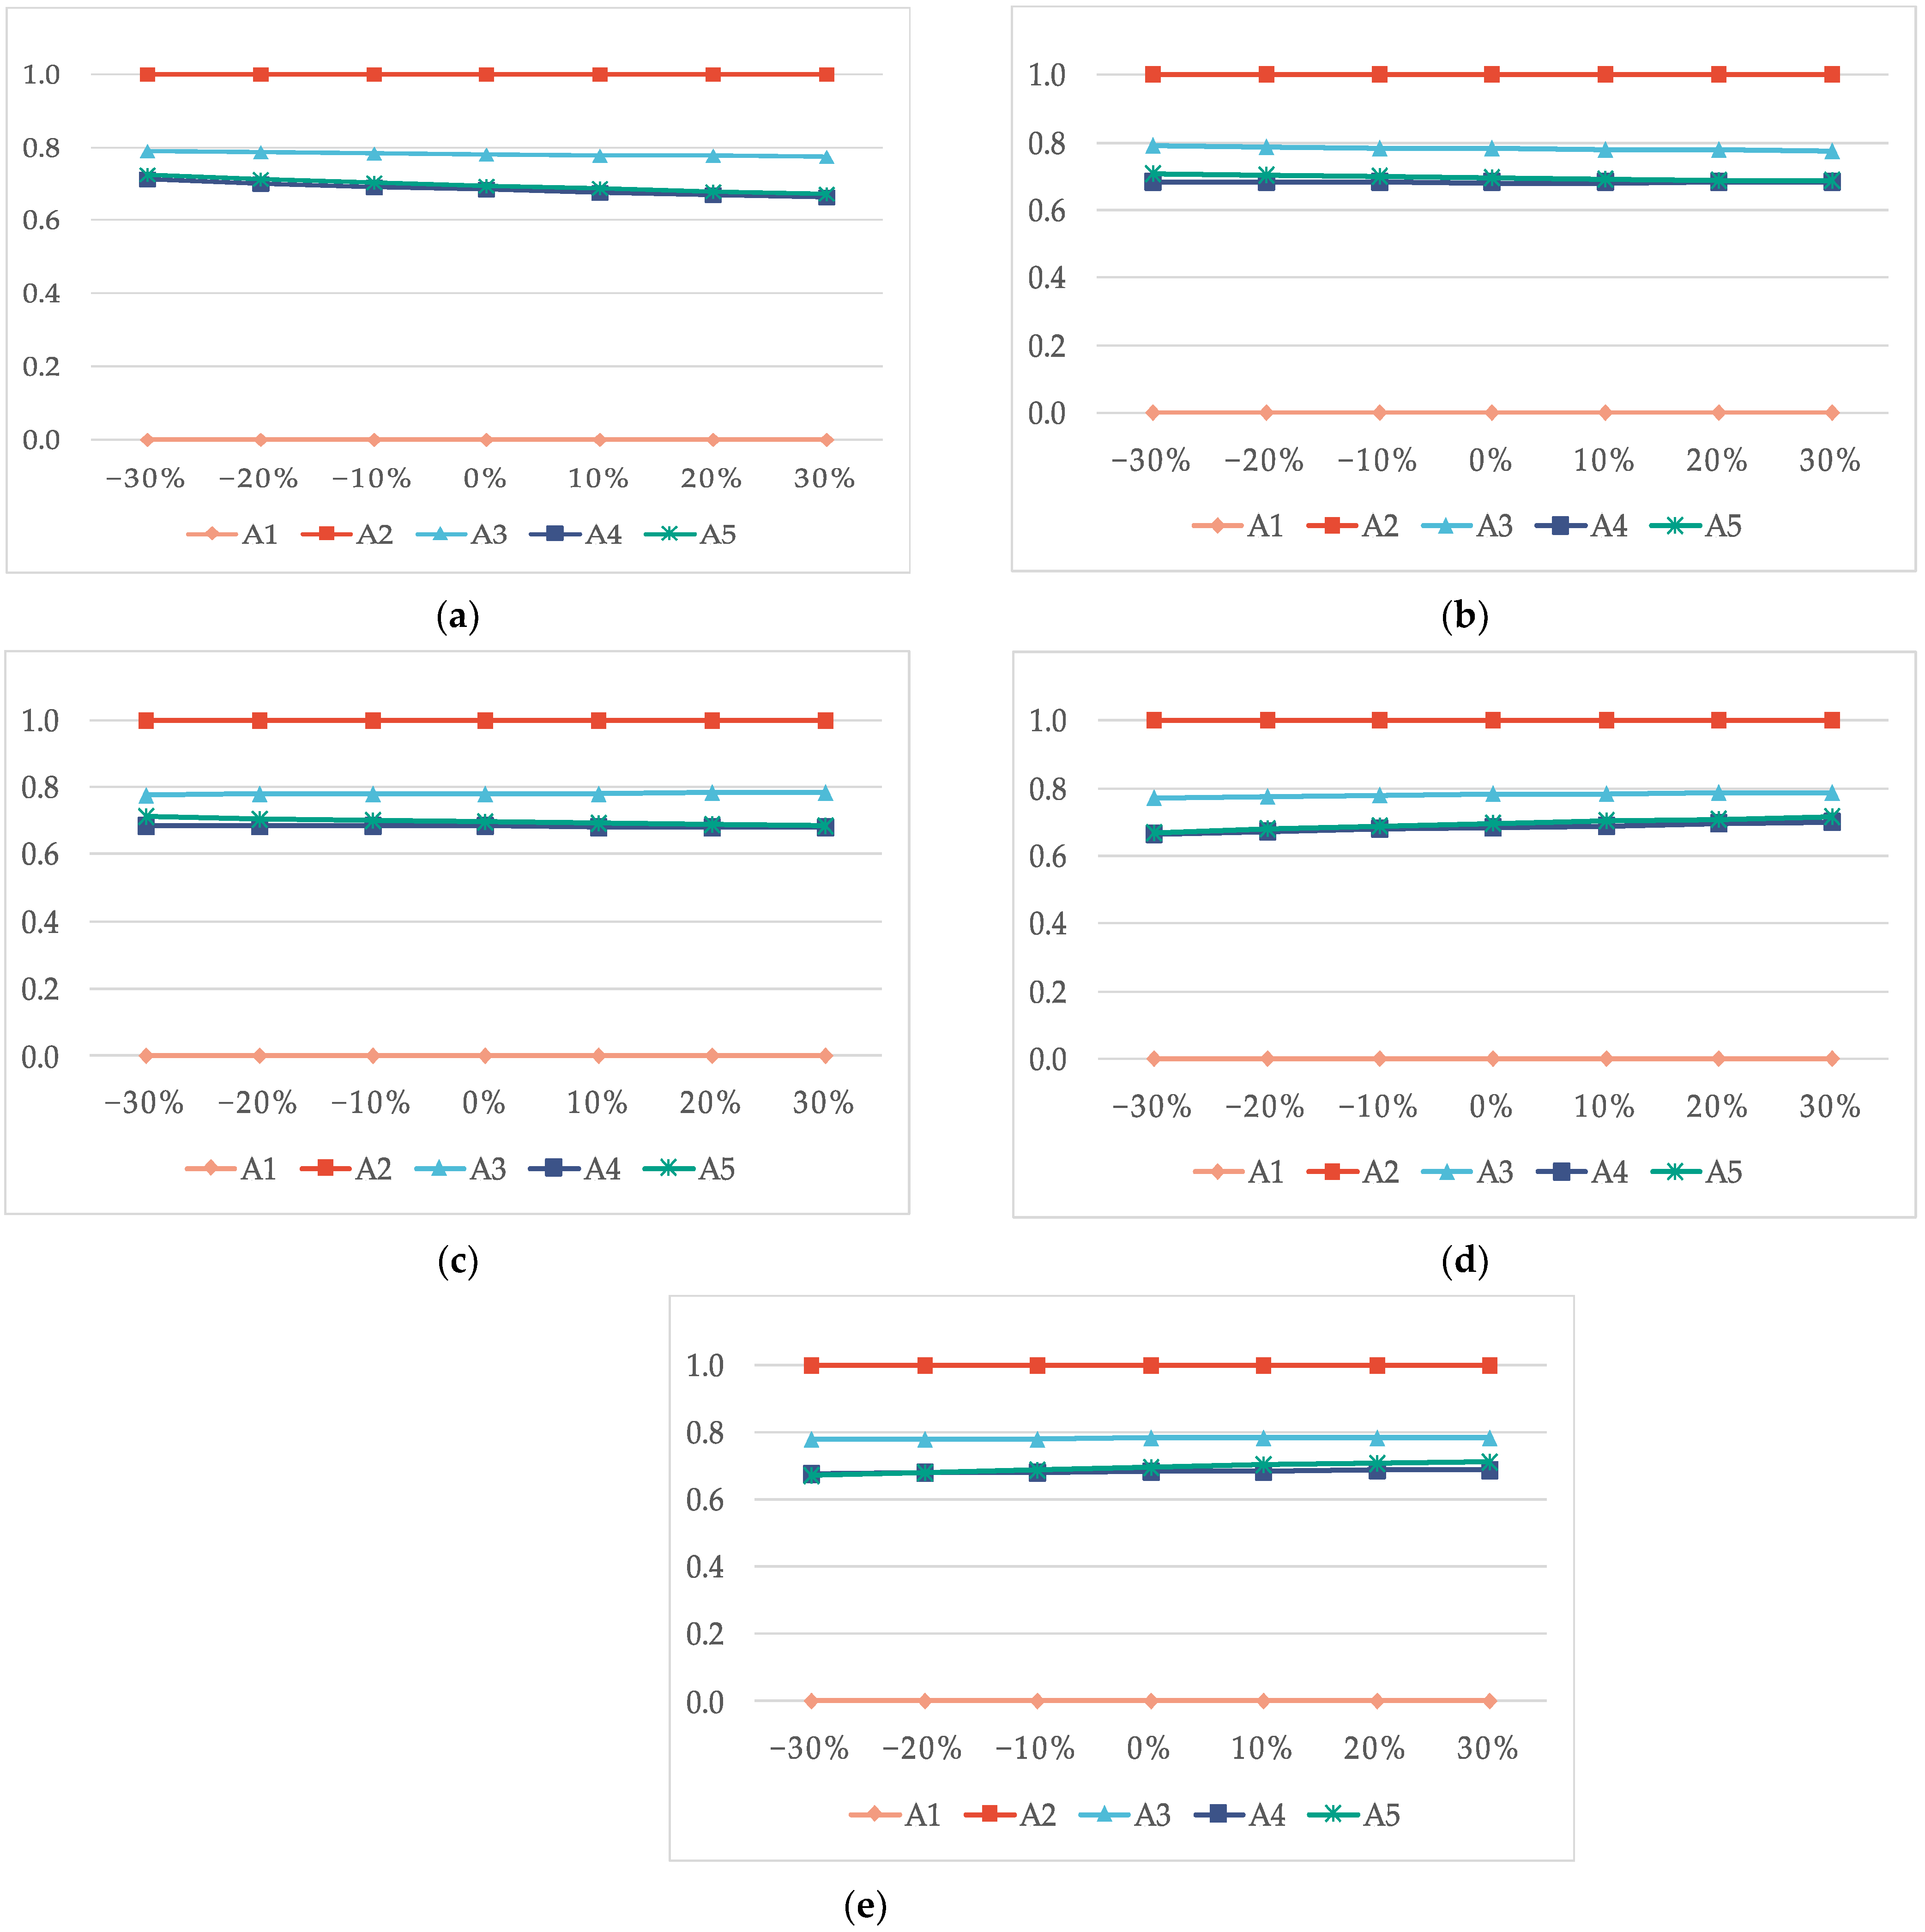
  • In most cases, changes in risk appetite (θ value) only have an effect on the value of the calculated results and do not have an effect on the ranking of the alternatives. In addition, we tested the sensitivity of the calculation results to changes in the risk preferences of different stakeholders. The ranking of sensitivity is as follows: government > power plant > investors. This suggests that for integrated energy projects in the early stages of development, the government’s risk appetite will have a greater impact on site selection due to the higher policy dependency of this type of project. This finding coincides with other scholars’ studies [14].
  • Changes in the weights do not affect the results of the site selection ranking, but changes in the weights of different risk categories affect the trend of the calculated results, such as Guangdong Province (A4) and Ziyang City, Sichuan Province (A5). When the weight of political risk (C1), economic risk (C2) and technical risk (C3) increases, the score of A4 and A5 tends to decrease and when the weight of social risk (C4) and environmental risk (C5) increases, the score of A4 and A5 tends to increase. This result also shows that compared to other provinces, A4 and A5 are relatively weak in the three risk categories of political, economic and technological factors and have better performances in both social and environmental aspects.

6. Conclusions

Recently, IES have been attracting more attention as a solution to improve the efficiency of regional energy use and the consumption of renewable energy and have gradually become an essential topic of current research. As a type of IES, NZCEP plants are able to achieve both the consumption of renewable energy and a stable supply of electricity and can effectively reduce the carbon emissions of the power generation industry. This paper therefore develops a framework for siting NZCEP plants based on a sustainable development perspective and draws the following conclusions:
  • Unlike traditional power plants that focus on locational advantages, human resources are an important factor in the siting of NZCEP plants because of the complexity of managing a NZCEP plant and the need for a multi-disciplinary workforce to maximize both its economic and social benefits.
  • Government plays an important role in the development of NZCEP power plants. This is reflected in two main aspects: firstly, the government’s risk appetite has a strong influence on site selection decisions, with site selection results being the most sensitive to changes in the government’s risk appetite; secondly, the policy risk of the project is the most important risk category, with the introduction of incentives and the difficulty of project approval affecting the construction of NZCEP power plants.
  • From the site selection results, Zhengzhou in Henan Province is the best choice for a NZCEP plant because it has the best global dominance in most cases and is the least sensitive to stakeholder risk preferences. The second choice is Chaoyang District, Beijing (A3) followed by Ziyang City, Sichuan Province (A5); Huizhou City, Guangdong Province (A4); and Jinjiang, Fujian Province (A1). This reveals the current situation of NZCEP development in China. Compared to the southern provinces, the northern provinces have certain advantages in the construction of NZCEP power plants due to their superior natural environment and the fact that they have the basis for project construction at the same time. For example, the CCUS system, which is an important component of NZCEP power plants, has already been built in many demonstration projects in the north and can provide important support for the construction of NZCEP power plants in the region.
  • From the perspective of stakeholders, the indicator system and the fuzzy evaluation method are better suited for the siting of NZCEP plants. On the one hand, the selection of the evaluation index system takes into account the interests of multiple stakeholders and a double sensitivity analysis was carried out, ensuring the evaluation framework’s high degree of reliability and stability. This paper, on the other hand, introduces TIT2FN, improves the DEMATEL and CRITIC methods to reduce the influence of human factors and introduces the TODIM method at the site selection stage, which accounts for the differences in risk preferences of various actors and ensures the scientificity of the site selection results.
In addition, the policy implications of this paper are that it provides a reliable approach to the problem of siting NZCEP power plants and offers suggestions for promoting the development of NZCEP power plants. Specifically, at the government level, in addition to introducing incentives, the government should appropriately relax the conditions for project approval to reduce this risk, while the southern provinces should pay more attention to balancing the risks of all parties to create a low-risk environment for the development of NZCEP power plants. For power plants, improving the quality of staff, training relevant talent and joining forces with research institutions to accelerate technology development are important breakthrough points. For investors, the most important thing is to match the technology with the best business model and drive down the cost of the technology.
To sum up, the decision framework proposed in this paper is able to solve the complex problem of siting NZCEP plant with a high degree of reliability. In addition, the decision-making framework can be applied to different regions to solve similar siting problems, and the decision-making ideas and methods used in this paper will also be useful for further research on IES. It should be noted that although this paper makes some improvements to the siting methodology for NZCEP plants, there are still some objective limitations. First, the risk factor system cannot be perfect, and some indicators will need to be replaced as the actual development of the project evolves. Second, due to the limitations of technical means, there are still many unproven areas in China that are suitable for the geological storage of CO2, and therefore the data in this section are incomplete. Further studies could focus on, but not be limited to, two main issues: (1) the impact of technology lock-in on the siting of NZCEP plants and (2) location issues for near-zero carbon emission power plants adopting different types of business models.

Author Contributions

Conceptualization, Y.S.; methodology, Y.S. and Y.K.; software, Y.S.; investigation, Y.K.; writing—original draft preparation, Y.S. and F.Z.; writing—review and editing, F.Z.; visualization, J.Z.; supervision, Y.L. All authors have read and agreed to the published version of the manuscript.

Funding

This work was supported by Beijing Municipal Natural Science Foundation [grant numbers 9224037, 9222028].

Data Availability Statement

Not applicable.

Conflicts of Interest

The authors declare no conflict of interest.

Appendix A

Figure A1. The evaluation matrix of five experts.
Energies 16 00797 g0a1aEnergies 16 00797 g0a1b

References

  1. Iyer, G.; Ou, Y.; Edmonds, J.; Fawcett, A.A.; Hultman, N.; McFarland, J.; Fuhrman, J.; Waldhoff, S.; McJeon, H. Ratcheting of Climate Pledges Needed to Limit Peak Global Warming. Nat. Clim. Chang. 2022, 12, 1129–1135. [Google Scholar] [CrossRef]
  2. National Center for Climate Change Strategy and International Cooperation (NCSC) Second Biennial Update on Climate Change in the People’s Republic of China. Available online: http://www.ncsc.org.cn (accessed on 22 November 2022).
  3. Ren, F.; Wei, Z.; Zhai, X. Multi-Objective Optimization and Evaluation of Hybrid CCHP Systems for Different Building Types. Energy 2021, 215, 119096. [Google Scholar] [CrossRef]
  4. Wang, Y.; Yang, Y.; Fei, H.; Song, M.; Jia, M. Wasserstein and Multivariate Linear Affine Based Distributionally Robust Optimization for CCHP-P2G Scheduling Considering Multiple Uncertainties. Appl. Energy 2022, 306, 118034. [Google Scholar] [CrossRef]
  5. Li, Y.; Zhang, F.; Li, Y.; Wang, Y. An Improved Two-Stage Robust Optimization Model for CCHP-P2G Microgrid System Considering Multi-Energy Operation under Wind Power Outputs Uncertainties. Energy 2021, 223, 120048. [Google Scholar] [CrossRef]
  6. Pyo, M.-J.; Moon, S.-W.; Kim, T.-S. A Comparative Feasibility Study of the Use of Hydrogen Produced from Surplus Wind Power for a Gas Turbine Combined Cycle Power Plant. Energies 2021, 14, 8342. [Google Scholar] [CrossRef]
  7. Huang, Z.; Li, J.; An, H.; Tong, Y.; Xie, B.; Zhao, Y.; Li, C. Study on the Thermal Energy Integration of Post-Combustion CO2 Capture in Natural Gas Combined Cycle Plant. Zhongguo Dianji Gongcheng Xuebao/Proc. Chin. Soc. Electr. Eng. 2017, 37, 2644–2651. [Google Scholar] [CrossRef]
  8. Khani, H.; Farag, H.E.Z. Optimal Day-Ahead Scheduling of Power-to-Gas Energy Storage and Gas Load Management in Wholesale Electricity and Gas Markets. IEEE Trans. Sustain. Energy 2018, 9, 940–951. [Google Scholar] [CrossRef]
  9. Song, X.; Lin, C.; Zhang, R.; Jiang, T.; Chen, H. Two-Stage Stochastic Scheduling of Integrated Electricity and Natural Gas Systems Considering Ramping Costs With Power-to-Gas Storage and Wind Power. Front. Energy Res. 2020, 8, 289. [Google Scholar] [CrossRef]
  10. Wang, N.; Akimoto, K.; Nemet, G.F. What Went Wrong? Learning from Three Decades of Carbon Capture, Utilization and Sequestration (CCUS) Pilot and Demonstration Projects. Energy Policy 2021, 158, 112546. [Google Scholar] [CrossRef]
  11. Hitaj, C.; Löschel, A. The Impact of a Feed-in Tariff on Wind Power Development in Germany. Resour. Energy Econ. 2019, 57, 18–35. [Google Scholar] [CrossRef]
  12. Kang, J.-N.; Wei, Y.-M.; Liu, L.; Yu, B.-Y.; Liao, H. A Social Learning Approach to Carbon Capture and Storage Demonstration Project Management: An Empirical Analysis. Appl. Energy 2021, 299, 117336. [Google Scholar] [CrossRef]
  13. Yang, B.; Wei, Y.-M.; Hou, Y.; Li, H.; Wang, P. Life Cycle Environmental Impact Assessment of Fuel Mix-Based Biomass Co-Firing Plants with CO2 Capture and Storage. Appl. Energy 2019, 252, 113483. [Google Scholar] [CrossRef]
  14. Dong, H.; Wu, Y.; Zhou, J.; Chen, W. Optimal Selection for Wind Power Coupled Hydrogen Energy Storage from a Risk Perspective, Considering the Participation of Multi-Stakeholder. J. Clean. Prod. 2022, 356, 131853. [Google Scholar] [CrossRef]
  15. Wu, Y.; Liao, M.; Hu, M.; Lin, J.; Zhou, J.; Zhang, B.; Xu, C. A Decision Framework of Low-Speed Wind Farm Projects in Hilly Areas Based on DEMATEL-Entropy-TODIM Method from the Sustainability Perspective: A Case in China. Energy 2020, 213, 119014. [Google Scholar] [CrossRef]
  16. Zhou, J.; Wu, Y.; Wu, C.; He, F.; Zhang, B.; Liu, F. A Geographical Information System Based Multi-Criteria Decision-Making Approach for Location Analysis and Evaluation of Urban Photovoltaic Charging Station: A Case Study in Beijing. Energy Convers. Manag. 2020, 205, 112340. [Google Scholar] [CrossRef]
  17. Abdel-Basset, M.; Gamal, A.; Chakrabortty, R.K.; Ryan, M. A New Hybrid Multi-Criteria Decision-Making Approach for Location Selection of Sustainable Offshore Wind Energy Stations: A Case Study. J. Clean. Prod. 2021, 280, 124462. [Google Scholar] [CrossRef]
  18. Rezaei, M.; Alharbi, S.A.; Razmjoo, A.; Mohamed, M.A. Accurate Location Planning for a Wind-Powered Hydrogen Refueling Station: Fuzzy VIKOR Method. Int. J. Hydrog. Energy 2021, 46, 33360–33374. [Google Scholar] [CrossRef]
  19. Gao, J.; Guo, F.; Ma, Z.; Huang, X.; Li, X. Multi-Criteria Group Decision-Making Framework for Offshore Wind Farm Site Selection Based on the Intuitionistic Linguistic Aggregation Operators. Energy 2020, 204, 117899. [Google Scholar] [CrossRef]
  20. Ayodele, T.R.; Ogunjuyigbe, A.S.O.; Odigie, O.; Munda, J.L. A Multi-Criteria GIS Based Model for Wind Farm Site Selection Using Interval Type-2 Fuzzy Analytic Hierarchy Process: The Case Study of Nigeria. Appl. Energy 2018, 228, 1853–1869. [Google Scholar] [CrossRef]
  21. Wu, Y.; Liu, F.; He, J.; Wu, M.; Ke, Y. Obstacle Identification, Analysis and Solutions of Hydrogen Fuel Cell Vehicles for Application in China under the Carbon Neutrality Target. Energy Policy 2021, 159, 112643. [Google Scholar] [CrossRef]
  22. Tsunemi, K.; Kihara, T.; Kato, E.; Kawamoto, A.; Saburi, T. Quantitative Risk Assessment of the Interior of a Hydrogen Refueling Station Considering Safety Barrier Systems. Int. J. Hydrog. Energy 2019, 44, 23522–23531. [Google Scholar] [CrossRef]
  23. Vasilev, Y.; Cherepovitsyn, A.; Tsvetkova, A.; Komendantova, N. Promoting Public Awareness of Carbon Capture and Storage Technologies in the Russian Federation: A System of Educational Activities. Energies 2021, 14, 1408. [Google Scholar] [CrossRef]
  24. Büyüközkan, G.; Güleryüz, S. An Integrated DEMATEL-ANP Approach for Renewable Energy Resources Selection in Turkey. Int. J. Prod. Econ. 2016, 182, 435–448. [Google Scholar] [CrossRef]
  25. Goel, P.; Sharma, N.; Mathiyazhagan, K.; Vimal, K.E.K. Government Is Trying but Consumers Are Not Buying: A Barrier Analysis for Electric Vehicle Sales in India. Sustain. Prod. Consum. 2021, 28, 71–90. [Google Scholar] [CrossRef]
  26. Heidary Dahooie, J.; Husseinzadeh Kashan, A.; Shoaei Naeini, Z.; Vanaki, A.S.; Zavadskas, E.K.; Turskis, Z. A Hybrid Multi-Criteria-Decision-Making Aggregation Method and Geographic Information System for Selecting Optimal Solar Power Plants in Iran. Energies 2022, 15, 2801. [Google Scholar] [CrossRef]
  27. Solangi, Y.A.; Longsheng, C.; Shah, S.A.A. Assessing and Overcoming the Renewable Energy Barriers for Sustainable Development in Pakistan: An Integrated AHP and Fuzzy TOPSIS Approach. Renew. Energy 2021, 173, 209–222. [Google Scholar] [CrossRef]
  28. Lam, W.S.; Lam, W.H.; Jaaman, S.H.; Liew, K.F. Performance Evaluation of Construction Companies Using Integrated Entropy-Fuzzy VIKOR Model. Entropy 2021, 23, 320. [Google Scholar] [CrossRef]
  29. Tukimin, R.; Mahmood, W.H.W.; Nordin, M.M.; Muhamad, M.R.B.; Ayuni, N.S. Application of AHP and FAHP Algorithm for Supplier Development Evaluation. Malays. J. Compos. Sci. Manuf. 2021, 5, 21–30. [Google Scholar]
  30. Karuppiah, K.; Sankaranarayanan, B.; Ali, S.M. A Fuzzy ANP–DEMATEL Model on Faulty Behavior Risks: Implications for Improving Safety in the Workplace. Int. J. Occup. Saf. Ergon. 2020, 28, 923–940. [Google Scholar] [CrossRef] [PubMed]
  31. Wu, Y.; Liao, Y.; Xu, M.; He, J.; Tao, Y.; Zhou, J.; Chen, W. Barriers Identification, Analysis and Solutions to Rural Clean Energy Infrastructures Development in China: Government Perspective. Sustain. Cities Soc. 2022, 86, 104106. [Google Scholar] [CrossRef]
  32. Lim, Y.J.; Afifah Basri, N. Sites Selection for a Potential Radioactive Waste Repository in Peninsular Malaysia: GIS-Based Weight Linear Combination and Multi-Criteria Decision-Making Analysis. Prog. Nucl. Energy 2022, 149, 104252. [Google Scholar] [CrossRef]
  33. Xu, C.; Wu, Y.; Dai, S. What Are the Critical Barriers to the Development of Hydrogen Refueling Stations in China? A Modified Fuzzy DEMATEL Approach. Energy Policy 2020, 142, 111495. [Google Scholar] [CrossRef]
  34. Wu, Y.; Zhang, T.; Xu, C.; Zhang, X.; Ke, Y.; Chu, H.; Xu, R. Location Selection of Seawater Pumped Hydro Storage Station in China Based on Multi-Attribute Decision Making. Renew. Energy 2019, 139, 410–425. [Google Scholar] [CrossRef]
  35. Wu, Y.; Zhou, J.; Hu, Y.; Li, L.; Sun, X. A TODIM-Based Investment Decision Framework for Commercial Distributed PV Projects under the Energy Performance Contracting (EPC) Business Model: A Case in East-Central China. Energies 2018, 11, 1210. [Google Scholar] [CrossRef] [Green Version]
  36. Wu, Y.; Wu, C.; Zhou, J.; Zhang, B.; Xu, C.; Yan, Y.; Liu, F. A DEMATEL-TODIM Based Decision Framework for PV Power Generation Project in Expressway Service Area under an Intuitionistic Fuzzy Environment. J. Clean. Prod. 2020, 247, 119099. [Google Scholar] [CrossRef]
  37. Zhang, Y.; Wei, G.; Guo, Y.; Wei, C. TODIM Method Based on Cumulative Prospect Theory for Multiple Attribute Group Decision-Making under 2-Tuple Linguistic Pythagorean Fuzzy Environment. Int. J. Intell. Syst. 2021, 36, 2548–2571. [Google Scholar] [CrossRef]
  38. Li, M.; Li, Y.; Peng, Q.; Wang, J. A Hybrid MCDM Model Combining DANP with TODIM to Evaluate the Information Quality of Community Question Answering in a Two-Dimensional Linguistic Environment. Expert Syst. 2021, 38, e12619. [Google Scholar] [CrossRef]
  39. Arthur, W.B. Competing Technologies, Increasing Returns, and Lock-In by Historical Events. Econ. J. 1989, 99, 116–131. [Google Scholar] [CrossRef]
  40. Fan, J.-L.; Xu, M.; Li, F.; Yang, L.; Zhang, X. Carbon Capture and Storage (CCS) Retrofit Potential of Coal-Fired Power Plants in China: The Technology Lock-in and Cost Optimization Perspective. Appl. Energy 2018, 229, 326–334. [Google Scholar] [CrossRef]
  41. Irfan, M.; Hao, Y.; Panjwani, M.K.; Khan, D.; Chandio, A.A.; Li, H. Competitive Assessment of South Asia’s Wind Power Industry: SWOT Analysis and Value Chain Combined Model. Energy Strategy Rev. 2020, 32, 100540. [Google Scholar] [CrossRef]
  42. Peri, E.; Tal, A. A Sustainable Way Forward for Wind Power: Assessing Turbines’ Environmental Impacts Using a Holistic GIS Analysis. Appl. Energy 2020, 279, 115829. [Google Scholar] [CrossRef]
  43. Mendel, J.M.; John, R.I.; Liu, F. Interval Type-2 Fuzzy Logic Systems Made Simple. IEEE Trans. Fuzzy Syst. 2006, 14, 808–821. [Google Scholar] [CrossRef] [Green Version]
  44. Lee, L.-W.; Chen, S.-M. Fuzzy Multiple Attributes Group Decision-Making Based on the Extension of TOPSIS Method and Interval Type-2 Fuzzy Sets. In Proceedings of the 2008 International Conference on Machine Learning and Cybernetics, Kunming, China, 12–15 July 2008; Volume 6, pp. 3260–3265. [Google Scholar]
  45. Mendel, J.M. Advances in Type-2 Fuzzy Sets and Systems. Inf. Sci. 2007, 177, 84–110. [Google Scholar] [CrossRef]
  46. Si, S.-L.; You, X.-Y.; Liu, H.-C.; Zhang, P. DEMATEL Technique: A Systematic Review of the State-of-the-Art Literature on Methodologies and Applications. Math. Probl. Eng. 2018, 2018, 3696457. [Google Scholar] [CrossRef] [Green Version]
  47. Csiszar, O. Ordered Weighted Averaging Operators: A Short Review. IEEE Syst. Man Cybern. Mag. 2021, 7, 4–12. [Google Scholar] [CrossRef]
  48. Liu, D.; Luo, Y.; Liu, Z. The Linguistic Picture Fuzzy Set and Its Application in Multi-Criteria Decision-Making: An Illustration to the TOPSIS and TODIM Methods Based on Entropy Weight. Symmetry 2020, 12, 1170. [Google Scholar] [CrossRef]
  49. Geographic Remote Sensing Ecological Network Platform. Available online: www.gisrs.cn (accessed on 22 December 2022).
  50. China Geological Survey (CGS) Geocloud. Available online: https://geocloud.cgs.gov.cn/ (accessed on 22 December 2022).
  51. Akram, M.; Kahraman, C.; Zahid, K. Group Decision-Making Based on Complex Spherical Fuzzy VIKOR Approach. Knowl.-Based Syst. 2021, 216, 106793. [Google Scholar] [CrossRef]
Figure 1. The main system configuration of an NZCEP plant. Natural gas energy is represented by the orange line, carbon flow by the blue line and electrical energy by the green line.
Energies 16 00797 g001
Figure 2. The risk factor system for NZCEP plant.
Energies 16 00797 g002
Figure 3. Study framework of NZCEP optimal selection.
Energies 16 00797 g003
Figure 4. Geological storage conditions for CO2 in China and possible sites for NZCEP plants. A1–A5 are potential construction sites for NZCEP plant. Jinjiang, Fujian Province (A1); Zhengzhou, Henan Province (A2); Chaoyang District, Beijing (A3); Huizhou City, Guangdong Province (A4); and Ziyang City, Sichuan Province (A5).
Energies 16 00797 g004
Figure 5. Calculation results for centrality and causality.
Energies 16 00797 g005
Figure 6. Weight calculation results.
Energies 16 00797 g006
Figure 7. Weight sensitivity analysis results. (a) C1 weight fluctuation; (b) C2 weight fluctuation; (c) C3 weight fluctuation; (d) C4 weight fluctuation; (e) C5 weight fluctuation.
Energies 16 00797 g007
Figure 8. The effect of single stakeholder θ value fluctuations on results. (a) The effect of fluctuations in the government’s θ value on the results; (b) the effect of fluctuations in the power plant’s θ value on the results; (c) the effect of fluctuations in the investor’s θ value on the results.
Energies 16 00797 g008
Figure 9. Results of theta sensitivity analysis for the same risk preferences of stakeholders.
Energies 16 00797 g009
Table 1. Correspondence between linguistic variables and TIT2FN.
Linguistic VariableTIT2FN
Extremely low (EL)((0, 0.1, 0.1, 0.2; 1, 1), (0.05, 0.1, 0.1, 0.15; 0.9, 0.9))
Very low (VL)((0.1, 0.2, 0.2, 0.35; 1, 1), (0.15, 0.2, 0.2, 0.3; 0.9, 0.9))
Low (L)((0.2, 0.35, 0.35, 0.5; 1, 1), (0.25, 0.35, 0.35, 0.45; 0.9, 0.9))
Medium (M)((0.35, 0.5, 0.5, 0.65; 1, 1), (0.4, 0.5, 0.5, 0.6; 0.9, 0.9))
High (H)((0.5, 0.65, 0.65, 0.8; 1, 1), (0.55, 0.65, 0.65, 0.75; 0.9, 0.9))
Very high (VH)((0.65, 0.8, 0.8, 0.9; 1, 1), (0.7, 0.8, 0.8, 0.85; 0.9, 0.9))
Extremely high (EH)((0.8, 0.9, 0.9, 1; 1, 1), (0.85, 0.9, 0.9, 0.95; 0.9, 0.9))
Table 2. Basic information of the experts.
Research FieldProfessionalExperience
Expert AFossil energy clean utilizationSenior engineer15 years
Expert BCarbon capture utilization and storage Senior engineer11 years
Expert CRenewable energy systems (thermal and concentrated solar power)Professor8 years
Expert DInnovative and high efficiency fossil fired power generation systemsProfessor16 years
Expert E
-
Carbon capture and storage
-
Renewable energy systems
Professor25 years
Table 3. Site selection results.
Alternative SitesA1A2A3A4A5
Results0.0001.0000.7810.6830.695
Ranking51243
Table 4. Results of θ sensitivity analysis (single stakeholder risk preference changed).
StakeholdersAlternative Sites
GovernmentPower PlantInvestorA1A2A3A4A5
θ value fluctuations of government0.10.751.250.000001.000000.781130.689140.69583
0.250.751.250.000001.000000.781100.688120.69570
0.50.751.250.000001.000000.781030.686440.69550
0.750.751.250.000001.000000.781000.684780.69530
10.751.250.000001.000000.780970.683160.69510
1.250.751.250.000001.000000.780900.681590.69490
1.50.751.250.000001.000000.780870.680010.69470
1.750.751.250.000001.000000.780830.678490.69450
20.751.250.000001.000000.780800.676970.69433
2.250.751.250.000001.000000.780770.675470.69413
2.50.751.250.000001.000000.780700.674030.69396
θ value fluctuations of power plant0.10.11.250.000001.000000.781270.693520.69637
0.10.251.250.000001.000000.781230.692490.69623
0.10.51.250.000001.000000.781170.690800.69603
0.10.751.250.000001.000000.781130.689140.69583
0.111.250.000001.000000.781100.687500.69563
0.11.251.250.000001.000000.781030.685920.69543
0.11.51.250.000001.000000.781000.684330.69523
0.11.751.250.000001.000000.780970.682800.69503
0.121.250.000001.000000.780930.681270.69486
0.12.251.250.000001.000000.780900.679760.69466
0.12.51.250.000001.000000.780830.678320.69450
θ value fluctuations of investor0.10.750.10.000001.000000.781370.696770.69677
0.10.750.250.000001.000000.781330.695740.69663
0.10.750.50.000001.000000.781270.694050.69643
0.10.750.750.000001.000000.781230.692370.69623
0.10.7510.000001.000000.781200.690720.69603
0.10.751.250.000001.000000.781130.689140.69583
0.10.751.50.000001.000000.781100.687540.69563
0.10.751.750.000001.000000.781070.686010.69543
0.10.7520.000001.000000.781030.684470.69526
0.10.752.250.000001.000000.781000.682950.69506
0.10.752.50.000001.000000.780930.681500.69490
Table 5. Comparative analysis results.
Alternative SitesTODIMTOPSISVIKOR
ResultsRanking ResultsRanking ResultsRanking
A10.00050.21850.8865
A21.00010.72010.0001
A30.78120.37220.4562
A40.68340.31540.8634
A50.69530.36530.7583
Disclaimer/Publisher’s Note: The statements, opinions and data contained in all publications are solely those of the individual author(s) and contributor(s) and not of MDPI and/or the editor(s). MDPI and/or the editor(s) disclaim responsibility for any injury to people or property resulting from any ideas, methods, instructions or products referred to in the content.

