Abstract
Nepal possesses a good solar resource, and there has been increasing interest in the use of photovoltaic systems. About 1.1 million solar home systems, rated at nearly 30 MWp, have been installed across Nepal. With the introduction of net metering by the Nepal Electricity Authority, an increase in rooftop photovoltaics (RPV) is expected. However, to inform any policy developments around increased electricity generation, and the uptake of RPV, there is a need to quantify the potential of such systems (a situation mirrored in many developing countries). To this end, this study utilized a hierarchical geospatial technique based on open-source data to estimate the potential output from RPV in several cities in Nepal (Kathmandu, Pokhara, Butwal, Nepalgunj, and Biratnagar). It was found that the potential theoretical output of RPV ranged from 637 GWh per annum, in Kathmandu, to 50 GWh per annum in Butwal. Moreover, the total RPV potential from urban households of Nepal was estimated to be in the order 6.5 TWh per annum. As such, the findings of this paper can be used to make informed policy decisions about the future of Nepal’s energy mix.
1. Introduction
Energy is crucial to the advancement of developing countries, such as Nepal. Without a reliable and steady supply of energy, economic development would be affected; the consequences of which would be felt throughout the small nation. Currently, about 69% of the nation’s energy consumption is met by biomass: firewood and agricultural residues. A further 25% is derived from fossil fuels, all of which are imported from India, and the remainder is met using a mix of hydropower and small-scale renewables such as photovoltaics (PV), biogas and micro-hydro [1].
Despite its reliance on biomass and fossil fuel derived energy sources, Nepal has relatively low emissions of carbon dioxide per capita. However, this belies the fact that Nepal is ranked as the fourth most vulnerable nation to the effects of climate change [2]. With an increasing population and economic expansion forecast, the demand for electrical energy is likely to increase significantly within Nepal. As evidence of this growth, the Ministry of Energy and Water Resources (2018) aims to increase the annual household use of electricity from 267 to700 kWh within 5 years, and to 1500 kWh in 10 years. Much of this increase is due to a desire to place electric cook stoves in all households by 2030 (to reduce the health and environmental impacts of using open fires). Furthermore, with the intervention to increase electricity use for cooking, the Water and Energy Commission Secretariat state that under a Business as Usual (BAU) scenario, the capacity for electricity generation would need to be 15,000 MW by 2030 and demand would increase to 35,000 MW by 2040. Assuming a high GDP growth rate (9.2%), the capacity requirement could reach 50,000 MW by 2040 [3].
All these factors make large-scale hydroelectricity a tempting proposition, particularly when paired with the Nepal’s theoretical potential for such technology, noting that in 2020, Nepal consumed 7741 GWh of electricity primarily generated from hydropower [4]. In gross terms, Nepal has a theoretical hydropower potential of 83,000 MW of which about 42,000 MW are considered economically viable [5]. However, although there is significant interest and investment in hydropower in Nepal, this needs to be balanced against Nepal’s relatively small geographic size, 147,516 km2. This means that land has a premium, and any change in land-use (to large scale hydro dams) would have a significant long-term environmental and social impacts, as a result of flooding and resettlements [6,7,8].
That said, it is worth noting that Nepal lies in the sunbelt region, with the country being between 26° N to 30° N latitude. Furthermore, the sun shines for about 300 days a year providing an average of 6.8 sunshine hours per day and an average insolation of 4.7 kWh/m2/day (Figure 1). On this basis an increased use of solar energy technology is a favorable prospect for Nepal [6] and is also one of the cheapest energy sources currently available [9]. Now, revisiting the Water and Energy Commission Secretariat’s BAU capacity of 15,000 MW by 2030; it is worth noting that Australia has delivered nearly 17,000 MW of generation capacity, in the form of rooftop photovoltaic (RPV) systems, in just over a decade [10]. As such, the push towards electrification in Nepal could be met, in part, by the installation of RPV systems. Moreover, RPV systems can be developed rapidly, and would allow incremental expansion of generation and distribution infrastructure, unlike delivering a large-scale hydroelectricity power plant. Hence, there appears to be significant potential for RPV technology in Nepal. However, in considering the expanded use of RPV in delivering on Nepal’s energy policies, there is a need to understand the potential for it, particularly in Nepal’s urban areas where the demand for electricity will be most pronounced.
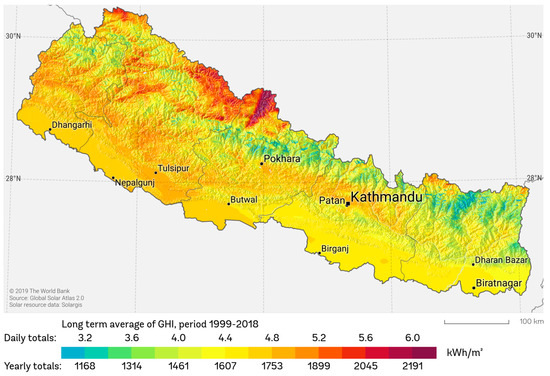
Figure 1.
PV power potential in Nepal [11].
In summary, against the backdrop of increasing demand for energy, and the social, environmental, and capital cost of hydropower, RPV would appear to have significant merit in Nepal (and other developing countries). Therefore, this work set out to assesses the potential of RPV in several of Nepal’s major cities: Kathmandu and Pokhara in the midland valleys, Butwal in the Shiwalik, Nepalgunj in the western Terai, and Biratnagar in humid Eastern Terai. These five cities in general represent urban cities, includes both terai and hilly cities and can also be representative as it includes from eastern cities, central cities to western cities of the countries. All other urban cities have similar conditions for instance house type, roof areas, insolation, etc. Thus, these five cities are broadly representative of the national urban cities where installation of Rooftop PV systems is possible.
In this regard, the study aims to highlight the potential for the increased use of photovoltaics in Nepal, focusing on the potential for RPV, using open-source data. It is hoped that the results of this study, and the methods employed, can be used to make informed policy decisions regarding renewable energy use in Nepal, and other developing countries more broadly.
2. Method
The estimation of RPV potential involves two major steps: estimating the rooftop area (for RPV) of the city in concern and determining the solar insolation on the study area. To this end, several studies have proposed and utilized different methods to calculate RPV potential. In their study, Boz et al. demonstrated an automated ArcGIS model that used LiDAR (Light Detection and Ranging) data to undertake an assessment of RPV systems in the city of Philadelphia [12]. Similarly, Kodysh et al. used LiDAR data and radiation maps obtained from a hemispherical view-shed algorithm to estimate solar radiation on multiple buildings in Knox County, Tennessee [13]. They concluded that their method worked effectively to obtain building rooftop solar radiation maps and argue their method was more accurate than using regional irradiation averages.
Brito et al. estimated the 3D solar potential of Lisbon [14], using Digital Surface Models (DSM) obtained from LiDAR implemented in ArcGIS and the SOL Algorithm (SOL is an open-source library for scalable online learning algorithms) described by Redweik et al. [15]. In doing this, the authors did not limit their study to RPV, but also examined facades, which delivered a 15% increase in solar potential. More recently, Jurasz et al. also used LiDAR generated Digital Elevation Models (DEM) of buildings to analyze the potential of RPV in Wroclaw, Poland [16], with a view to establishing the potential self-sufficiency of the city. They found a potential RPV capacity of 850 MWp, or 2.9 MWp per km2 of the city’s area, and concluded that over 1/3 of the city-wide energy demand could be met by this.
To estimate RPV potential, Castellanos et al. suggested that the existing methodologies could be divided into three categories: low-, medium- and high-level, based on their spatial resolution and results [17]. Low-level methods use aggregated homogeneous datasets without using geospatial techniques. A low-level technique would assume the irradiation incident throughout the city to be homogeneous and rely on statistical datasets. As an example, Kurdgelashvili et al. developed a low-level model for PV systems that used building statistics such as the floor area, number of floors, and the total number of buildings in a given area [18]. This was paired with assumptions (rules-of-thumb) for roof tilt, roof top orientation, and shading in a ‘matrix’ model. Similarly, Lehmann and Peter established a relation between the population density and the roof and facade area of residential and non-residential buildings to obtain the potential output of solar installations [19].
Medium-level techniques combine statistical data with spatially resolved data acquired through Geographical Information Systems (GIS) and LiDAR [17]. Khan et al. and Singh and Banerjee both applied medium-level techniques using GIS and remote sensing to assess RPV [20,21]. In their study, Singh and Banerjee proposed the use of a ‘building footprint area ratio’ for various types of land use along with a coefficient of photovoltaic-available roof area [21]. Khan and Arsalan also utilized a medium-level method to estimate the potential for RPV in Lahore [22]. They used Google satellite imagery and a ‘feature extraction’ algorithm to determine the rooftop area of a sample administrative division, which they then used to extrapolate the total rooftop area to Lahore and subsequently the RPV.
Finally, high-level techniques use advanced methods for rooftop digitization and their insolation calculations. In doing this, they also account for the aspect and shading of buildings, and their roofs and facades, to determine their suitability for RPV [17].
Based on these categories, it is obvious that estimates of RPV potential derived from high-level methods and their advanced algorithms to calculate rooftop area and insolation present the ideal scenario. However, high level methods are extremely resource intensive, both computationally and in terms of the detailed geographic data they require. In Nepal, and many other developing countries, the lack of LiDAR images of cities completely rules out using high level methods to estimate their RPV. Given this data scarcity, it is apparent that a medium-level technique is the best option for estimating the RPV of cities in Nepal.
Therefore, to realize a medium-level estimate of the RPV in Nepal, this work sought to leverage ‘open-source’ data, and data readily available in the public domain. Such an approach for energy studies and modeling increases the transparency of the model. Non-transparent models and data, especially for urban energy systems, hinders public participation, limits scientific evaluation, and impedes discussions and public debate [23,24]. As such, there are significant benefits to be gained in the utilization of this approach.
In achieving this, the process consisted of two independent methods, firstly, Rooftop Area Estimation and secondly, Solar Insolation Estimation as illustrated in Figure 2.
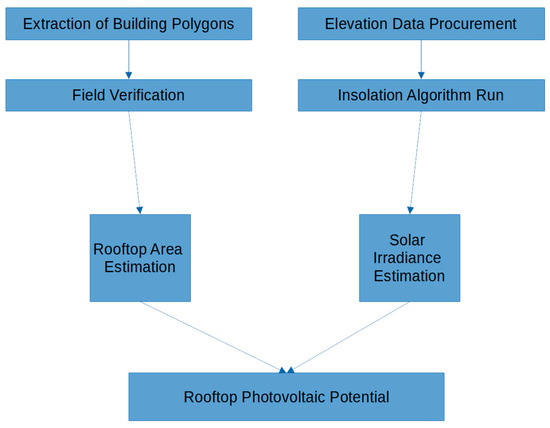
Figure 2.
Flowchart of the method.
2.1. Rooftop Area Estimation
The first step towards determining the RPV potential for Nepal’s cities was to determine the roof area available for such systems. To achieve this, two sampling methods were applied to determine the rooftop area. In the first instance, a satellite image of a small area of Kathmandu was examined and the roofs present were manually digitized using QGIS (a free and open-source GIS application) to determine their area, as shown in Figure 3. In this area, 32 residences were identified, and the occupants were surveyed to determine both the accuracy of the OpenStreetMap, manual digitization and the average roof area per inhabitant. This mirrors the approach used by Singh and Banerjee and Khan and Arsalan to estimate and validate rooftop area [21,22].
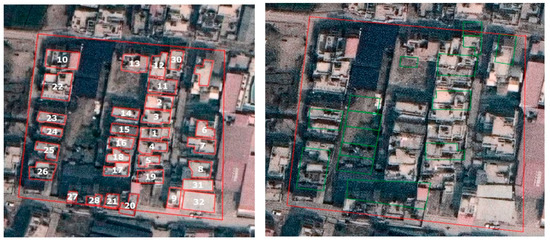
Figure 3.
Manual digitization with house numbers (right), OSM polygon extraction (left) (Satellite Imagery of the study area from Google EarthTM).
In the second instance, QGIS was used to query the OpenStreetMap database [25] for building tags. In doing this it was assumed that roof area associated with the building tags was of the same extent as the digitized buildings, as shown in Figure 4. Subsequently, through use of Nepal’s census data of average number of family in each household, it was possible to determine an average roof area per capita, that could be cross correlated with that of the small sample area to ensure a degree of validation.
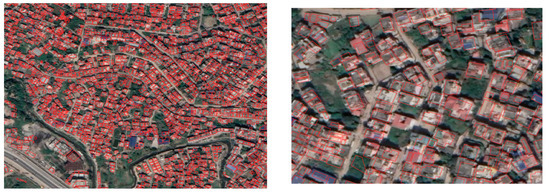
Figure 4.
Building polygons overlaid on satellite imagery of Kathmandu (left) and Zoomed in view (right) from Google EarthTM.
2.2. Solar Insolation Estimation
The second step towards estimating the RPV potential of the cities was to determine the available solar radiation. Insolation data can be obtained remotely from satellites and remote sensing, or by geospatial algorithms to simulate the position of the sun in the sky, combined with open access solar databases. However, a challenge to the use of satellite derived solar radiation measurements is their poor spatial resolution (often in the order of tens of square kilometers), which makes them poorly suited to the study of small areas [26]. This fact is exacerbated for sparsely populated areas and developing countries. Bearing this in mind, this work sought to avoid the use of poor spatial resolution satellite solar radiation data by adopting a geospatial approach.
Given that solar irradiation is affected by the surrounding topography, and hills with northerly aspects receive less irradiation than hills with southerly aspects (in the Northern Hemisphere), it was necessary to account for these effects. Hence, for each city in the study area, it was necessary to account for its topography. As such Digital Elevation Models (DEMs) for each city were extracted from the United States Geological Survey’s (USGS) EarthExplorer database [27]. Unlike satellite solar radiation data, which often have a resolution in the order of kilometers, the USGS DEMs have a resolution of 30 m, meaning that radiation can be mapped at a much finer resolution. To achieve the fine resolution estimation necessary for RPV analysis, it was necessary to pair the DEM with an appropriate algorithm for calculating the incident solar radiation.
In this study, the solar radiation was calculated in a Geographic Information System (ARCGIS) using the hemispherical viewshed algorithm developed by Hetric et. al. and which was extended by Fu and Rich [28,29]. This algorithm uses DEM as its primary data source. Simulation period and time-step can be entered manually. Data like latitude of the study area is read by the algorithm from the DEM itself. Table 1 lists the values that have been entered in Area Solar Radiation tool for this study.

Table 1.
Parameters for area solar radiation tool [29] (Default values used unless otherwise stated).
2.3. Estimating the RPV Potential
The final stage of the method involves combining the rooftop area and solar insolation estimations. For such an exercise, Izquierdo et al. (2008) proposed that a three-level hierarchy: (i) physical potential, (ii) geographical potential, and (iii) technical potential, be used to assess the RPV potential of any site. Izquierdo et al. also recommended two additional levels; economic potential and a social potential to enable researchers to check if RPV are an economically feasible and socially acceptable source of energy in the region of interest, though these were not undertaken as part of this study [30].
In simple terms, the physical potential area for RPV installations is the total rooftop area in the study areas, i.e., the cities considered. The physical potential is then obtained by taking the product of the rooftop area and the daily insolation incident on the rooftop. In this respect, the physical potential does not consider the roof use, its orientation, or its aspect. Rather, it calculates the total energy incident on the total rooftop area of the study area.
Of course, not all the area with physical potential would or could be used to install RPV. The orientation of the roof, style of the roof (flat or pitched), accessibility structures and shading, reduce the available area that is realistically suited to RPV. Now in high-level studies, using full three-dimensional models of their study region, these issues are addressed in the model itself. However, medium-level studies, such as the current work, must rely on ‘available-roof-area’ (ARA) coefficients (a fraction of the roof area) to account for the reduction in the rooftop area by such obstacles. Table 2 shows some of the typical ARAs used in other similar studies.
Table 2.
ARA coefficients used in the literature.
Given that there have been no studies to assess the ARA in Nepali cities, this study used an ARA of 0.25. Although this choice may appear somewhat arbitrary, the value was chosen with reference to [33]. They estimated the RPV potential in Uttarakhand State in India, a region that has similar terrain and urban characteristics to Nepal.
Thus, having defined the physical potential of a given site, the geographic potential (on a monthly average basis) can be obtained for any point on the DEM using Equation (1).
where, Eavg is the monthly average solar energy in kWh, Aroof is the roof area in the study area in m2, n is the ARA coefficient, I is the daily average irradiation in kWh/m2 found from the ‘Area Solar Radiation’ algorithm and D is the number of days in the month.
The final step in quantifying the RPV of the cities is the determination of the technical generation potential. This primarily depends on the PV array and considers the array efficiency, performance ratio and other losses [33,34,35]. In this respect, the technical generation potential of RPV was calculated for any site in the city using Equation (2).
where Etech is the technical generation potential in kWh, r is solar array efficiency (assumed as 20%) [36,37], PR is a performance ratio that includes cabling, and dust on panel losses and was taken to be 0.75 as suggested by Mishra et al. and finally, ηTH is a temperature and irradiance loss coefficient taken to be 0.9 [33,38].
3. Results
3.1. Validation of the Rooftop Area
Before undertaking the full RPV analysis, it was important that the estimation of the rooftop area was representative of reality. Now as noted in the method, a small section of a city was analyzed and surveyed to determine the per capita roof area. In Table 3, it is apparent that there was a slight difference between the roof area from the OpenStreetMap, manual digitization of the satellite images, and that from the household survey; however, the results appear to be in quite good agreement.
Table 3.
Rooftop area per person from different methods.
Extending to a much wider area, using the OpenStreetMap data for the five cities, the total rooftop area and per capita rooftop area were determined as shown in Table 4. From this, it is apparent that the rooftop area per person corresponds well with the small-scale study. Moreover, the average across the cities corresponds to that of the manual digitization and household survey, suggesting the use of the OpenStreetMap data is broadly representative of the ‘situation on the ground’.
Table 4.
City and rooftop area.
3.2. Potential for RPV
Having ascertained the roof area in each of the five cities, it was possible to then determine the technical generation potential based on the daily irradiation for each month. Figure 5 provides an insight into the role that topology plays in the radiation received at various locations within the five cities studied. Nepalgunj and Biratnagar exhibit a uniform insolation profile due to their relative flatness. However, Butwal experiences slightly more variation due to the terrain in its northern extent and Pokhara demonstrates the most variability due to its numerous hills.

Figure 5.
Spatial insolation variation in selected cities in Nepal during August.
The result of this is borne out across the year, as shown in Table 5. From this, it is apparent that Kathmandu has the highest annual RPV potential, approximately 636 GWh. The reasons for this are twofold, it has the largest population, and so the largest rooftop area, and secondly, it has a relatively high level of incident solar energy, as shown in Figure 5. Similarly, Butwal has the lowest annual RPV potential due its low rooftop area.
Table 5.
Technical generation potential of rooftop photovoltaics in Nepal’s urban centers.
The daily average insolation of the studied cities is shown in Figure 6. It indicates that Kathmandu has the highest insolation throughout the year, whereas other four cities have nearly the same daily average insolation.
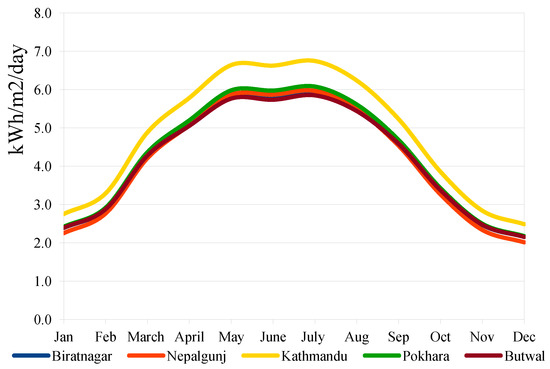
Figure 6.
Average daily insolation pattern in selected cities of Nepal.
Considering the results further, the average per capita technical potential for RPV of the five cities is approximately 1.1 MWh per year. With an increasing trend towards urbanization, one could expect the use of RPV to rise in the foreseeable future provided appropriate policies are put in place. Given the urban population of Nepal in 2020 is 5,995,190 [40], this could deliver up to 6.5 TWh of electrical energy to Nepal’s energy mix.
4. Discussion
The current annual per capita electric energy consumption in Nepal is 267 kWh [41]. However, the Ministry of Energy Water Resource and Irrigation of Nepal has set targets to increase per capita electricity consumption to 1500 kWh by 2030 [42] . From the results, it is more than apparent that RPV has significant potential in Nepal. In fact, PV systems are already gaining popularity in Nepal. A total capacity of about 60 MWp of off-grid solar PV systems have been installed, and an additional 20.8 MW have been connected to the national grid [43]. In addition, the Department of Electricity Development (DoED) has provided construction licenses for 19 projects with a total capacity of 117.97 MW, and survey licenses to install larger grid-connected solar PV plants at 26 different locations with a total capacity of 623.9 MW.
A challenge presented by the systems under construction and proposed for construction is that they are ground mounted, but do not appear to consider the viability of agrivoltaics. Consequently, the poor deployment of such systems, at scale, may lead to debates over land use for agriculture or energy like those encountered with hydropower, if appropriate policy directions are not put in place. Such an outcome would be extremely counterproductive, as according to IRENA [44], the Levelized Cost of Electricity (LCOE) from residential PV systems is between USD 0.055/kW and USD 0.236/kWh as of 2020, a decline of between 49% and 82% over the last decade. Furthermore, this price is expected to decrease, and could conceivably pass the LCOE of large-scale hydropower in regions with favorable solar conditions (e.g., sunbelt countries such as Nepal). Viewed in this context, RPV could potentially circumvent issues around land-use, but still deliver the cost advantages, and flexible deployment that solar technology offers.
To date, however, only a fraction of the total urban RPV potential has been develop in Nepal. Two of the principal bottlenecks in the technology’s uptake are the lack of net-metering infrastructure and equitable policy for residential users. Although net-metering was introduced in 2017, adoption has not been as fast as anticipated despite regulations that allow the electricity utility to buy energy from consumers at Rs 7.30/kWh (~USD 62/MWh). While anecdotal evidence suggests that the national utility company is generally reluctant to connect solar rooftop to the national grid, one of the barriers to entry appears to be the utility setting a minimum solar capacity in an attempt to maintain a 230V system voltage level. In addition to this minimum installation capacity, the owner of the RPV must guarantee the integration of electricity from RPV to the national grid is within set standards and minimum power factor. It is conjectured that these factors, and the cost associated with them, have been major contributors to the lack of adoption of net-metering and RPV. In the broader context, they also appear to be the result of the lack of a policy framework around distributed energy generation, such as RPV, and an over-zealous regulatory environment that has the potential to stifle Nepal’s energy transition.
Going forward, it is apparent that RPV can be a major contributor to this goal, although the policy and regulatory environment in Nepal would benefit from a review, to see how barriers to RPV’s entry can be removed. Although the use of RPV alone cannot guarantee a self-sufficient city, RPV can contribute to more than 60% of the targeted demand in 2030. Despite the government plans to produce 88% from hydropower and 12% from ‘modern’ renewables [45] , the dramatic cost reduction of RPV would appear to provide some significant advantages in terms of cost, flexibility, and synergies with the existing hydropower infrastructure, that should be further explored.
5. Conclusions
Nepal’s energy mix, like many developing nations, is dominated by traditional energy sources that are unlikely to be sustainable in meeting future energy demand projections. With the effects of climate change likely to have a significant impact on Nepal, there is a need to examine renewable energy technologies to address these challenges, and to have an appropriate policy framework to support them.
Although there has been a significant push for large-scale hydropower, this technology can have significant social and environmental impacts, and would require significant upfront investment in distribution infrastructure. As such, this study assessed the potential for RPV in several of Nepal’s urban centers. The deployment of RPV would allow infrastructural improvements to be met in a phased manner that is synergistic with a phased growth profile. Using publicly available geospatial data and techniques, it was found that the average annual technical generation potential from RPV in urban centers is 1.1 MWh per capita. Of the cities studied, Kathmandu has the highest RPV technical generation potential, about 636 GWh per annum, due to the large rooftop area and solar insolation levels. On this basis, there appears to be significant scope for RPV in Nepal.
However, it was also noted that although the introduction of net-metering for RPV has started, there appear to be some barriers to its uptake. In particular: anecdotal evidence suggests that there is a reluctance from the utility to have RPV connected to the grid. Furthermore, it appears that minimum generation requirements, in the name of voltage stability, may present a challenge to residential households. Finally, when paired with regulations relating to power quality, that the user is responsible for maintaining, it is clear how RPV may be put in the ‘too-hard basket’
Despite these factors, RPV has significant potential to assist Nepal in meeting its energy goals. However, this must be addressed by the relevant authorities working together with university researchers and the private sector to develop a robust policy and regulatory framework that recognize the role such technologies will play.
Author Contributions
Conceptualization, S.P.L.; methodology, S.P.L. and U.K.; software, U.K.; validation, S.P.L. and T.A.; writing—original draft preparation, U.K. and S.P.L.; writing—review and editing, S.P.L. and T.A.; visualization, S.P.L. and T.A.; supervision, S.P.L. All authors have read and agreed to the published version of the manuscript.
Funding
This research received no external funding.
Data Availability Statement
Data will be available as per request.
Acknowledgments
The authors would like to acknowledge Renewable and Sustainable Energy Laboratory for the support.
Conflicts of Interest
The authors declare no conflict of interest.
References
- ADB. Nepal Energy Sector Assessment, Strategy, and Roadmap. Asian Development Bank. 2017. Available online: https://www.adb.org/sites/default/files/publication/356466/nepal-energy-assessment-road-map.pdf (accessed on 10 January 2022).
- UNDP. In Depth UNDP in Nepal. 2021. Available online: https://www.np.undp.org/content/nepal/en/home/energy-environment-climate-and-disaster-risk-management/in-depth.html (accessed on 10 January 2022).
- WECS. Electricity Demand Forecast Report (2015–2040). 17 January 2017. Available online: http://www.wecs.gov.np/uploaded/Electricity-Demand-Forecast-Report-2014-2040.pdf (accessed on 10 January 2022).
- Nepal Electricity Authority. Nepal Electricity Authority: A Year in Review. Fiscal Year 2019/2020; Kathmandu: Bagmati, Nepal, 2020. [Google Scholar]
- United States Agency for International Development (USAID). Nepal Hydropower Development Program. 2018. Available online: https://www.usaid.gov/nepal/fact-sheets/nepal-hydropower-development-program (accessed on 10 January 2022).
- Lohani, S.P.; Blakers, A. 100% renewable energy with pumped-hydro-energy storage in Nepal. Clean Energy 2021, 5, 243–253. [Google Scholar] [CrossRef]
- Lohani, S.P.; Gurung, P.; Gautam, B.; Fulford, D.; Jeuland, M. Current Status, Prospects, and Implications of Renewable Energy for Achieving Sustainable Development Goals in Nepal. Sustain. Dev. 2022; in press. [Google Scholar] [CrossRef]
- Gyawali, S.K. Socio-Economic Impacts of Hydropower Development: A case Study of Budhigandaki Hydropower Affected Darbungphaat and Majhitaar Villages of Gorkha and Dhading Districts. In Proceedings of the IOE Graduate Conference, Kathmandu, Nepal, 19–22 October 2019; pp. 65–77. [Google Scholar]
- Evans, S. Solar is Now ‘Cheapest Electricity in History’, Confirms IEA. CarbonBrief. 2020. Available online: https://www.carbonbrief.org/solar-is-now-cheapest-electricity-in-history-confirms-iea (accessed on 10 January 2022).
- Vorrath, S. New Rooftop Solar Milestone, as Australia Tops 3GW in 2021. RenewEconomy. Available online: https://reneweconomy.com.au/new-rooftop-solar-milestone-as-australia-tops-3gw-in-2021/ (accessed on 20 August 2022).
- Global Solar Atlas. Available online: https://globalsolaratlas.info/map (accessed on 10 October 2021).
- Boz, M.B.; Calvert, K.; Brownson, J.R. An automated model for rooftop PV systems assessment in ArcGIS using LIDAR. AIMS Energy 2015, 3, 401–420. [Google Scholar] [CrossRef]
- Kodysh, J.B.; Omitaomu, O.A.; Bhaduri, B.L.; Neish, B.S. Methodology for estimating solar potential on multiple building rooftops for photovoltaic systems. Sustain. Cities Soc. 2013, 8, 31–41. [Google Scholar] [CrossRef]
- Brito, M.C.; Redweik, P.; Catita, C.; Freitas, S.; Santos, M. 3D solar potential in the urban environment: A case study in lisbon. Energies 2019, 12, 3457. [Google Scholar] [CrossRef]
- Redweik, P.; Catita, C.; Brito, M. Solar energy potential on roofs and facades in an urban landscape. Sol. Energy 2013, 97, 332–341. [Google Scholar] [CrossRef]
- Jurasz, J.K.; Dąbek, P.B.; Campana, P.E. Can a city reach energy self-sufficiency by means of rooftop photovoltaics? Case study from Poland. J. Clean. Prod. 2020, 245, 118813. [Google Scholar] [CrossRef]
- Castellanos, S.; Sunter, D.A.; Kammen, D.M. Rooftop solar photovoltaic potential in cities: How scalable are assessment approaches? Environ. Res. Lett. 2017, 12, 125005. [Google Scholar] [CrossRef]
- Kurdgelashvili, L.; Li, J.; Shih, C.H.; Attia, B. Estimating technical potential for rooftop photovoltaics in California, Arizona and New Jersey. Renew. Energy 2016, 95, 286–302. [Google Scholar] [CrossRef]
- Lehmann, H.; Peter, S. Assessment of Roof Façade Potentials for Solar Use in Europe; Insitute for Sustainable Solutions and Innovations (ISUSI): Aachen, Germany, 2003. [Google Scholar] [CrossRef]
- Khan, M.M.A.; Asif, M.; Stach, E. Rooftop PV potential in the residential sector of the kingdom of Saudi Arabia. Buildings 2017, 7, 46. [Google Scholar] [CrossRef]
- Singh, R.; Banerjee, R. Estimation of rooftop solar photovoltaic potential of a city. Sol. Energy 2015, 115, 589–602. [Google Scholar] [CrossRef]
- Khan, J.; Arsalan, M.H. Estimation of rooftop solar photovoltaic potential using geo-spatial techniques: A perspective from planned neighborhood of Karachi—Pakistan. Renew. Energy 2016, 90, 188–203. [Google Scholar] [CrossRef]
- Wiese, F.; Bökenkamp, G.; Wingenbach, C.; Hohmeyer, O. An open source energy system simulation model as an instrument for public participation in the development of strategies for a sustainable future. Wiley Interdiscip. Rev. Energy Environ. 2014, 3, 490–504. [Google Scholar] [CrossRef]
- Pfenninger, S.; DeCarolis, J.; Hirth, L.; Quoilin, S.; Staffell, I. The importance of open data and software: Is energy research lagging behind? Energy Policy 2017, 101, 211–215. [Google Scholar] [CrossRef]
- OpenStreetMap. 2021. Available online: https://www.openstreetmap.org/search?query=Kathmandu#map=19/27.68616/85.33343 (accessed on 10 January 2022).
- Hijmans, R.J.; Cameron, S.E.; Parra, J.L.; Jones, P.G.; Jarvis, A. Very high resolution interpolated climate surfaces for global land areas. Int. J. Climatol. 2005, 25, 1965–1978. [Google Scholar] [CrossRef]
- USGS Earth Explorer. Available online: https://earthexplorer.usgs.gov (accessed on 15 July 2021).
- Hetrick, W.A.; Rich, P.M.; Barnes, F.J.; Weiss, S.B. GIS-based solar radiation flux models. Am. Soc. Photogramm. Remote Sens. Tech. Pap. 1993, 3, 132–143. [Google Scholar]
- Fu, P.; Rich, P.M. Design and Implementation of the Solar Analyst: An ArcView Extension for Modeling Solar Radiation at Landscape Scales. In Proceedings of the 19th Annual ESRI User Conference, San Diego, CA, USA, 1–24 February 1999. [Google Scholar]
- Izquierdo, S.; Rodrigues, M.; Fueyo, N. A method for estimating the geographical distribution of the available roof surface area for large-scale photovoltaic energy-potential evaluations. Sol. Energy 2008, 82, 929–939. [Google Scholar] [CrossRef]
- Pillai, I.R.; Banerjee, R. Methodology for estimation of potential for solar water heating in a target area. Sol. Energy 2007, 81, 162–172. [Google Scholar] [CrossRef]
- Wiginton, L.K.; Nguyen, H.T.; Pearce, J.M. Quantifying rooftop solar photovoltaic potential for regional renewable energy policy. Comput. Environ. Urban Syst. 2010, 34, 345–357. [Google Scholar] [CrossRef]
- Mishra, T.; Rabha, A.; Kumar, U.; Arunachalam, K.; Sridhar, V. Assessment of solar power potential in a hill state of India using remote sensing and Geographic Information System. Remote Sens. Appl. Soc. Environ. 2020, 19, 100370. [Google Scholar] [CrossRef]
- Gastli, A.; Charabi, Y. Solar electricity prospects in Oman using GIS-based solar radiation maps. Renew. Sustain. Energy Rev. 2010, 14, 790–797. [Google Scholar] [CrossRef]
- Mahtta, R.; Joshi, P.K.; Jindal, A.K. Solar power potential mapping in India using remote sensing inputs and environmental parameters. Renew. Energy 2014, 71, 255–262. [Google Scholar] [CrossRef]
- Charfi, W.; Chaabane, M.; Mhiri, H.; Bournot, P. Performance evaluation of a solar photovoltaic system. Energy Rep. 2018, 4, 400–406. [Google Scholar] [CrossRef]
- Gholami, A.; Khazaee, I.; Eslami, S.; Zandi, M.; Akrami, E. Experimental investigation of dust deposition effects on photo-voltaic output performance. Sol. Energy 2018, 159, 346–352. [Google Scholar] [CrossRef]
- Bergamasco, L.; Asinari, P. Scalable methodology for the photovoltaic solar energy potential assessment based on available roof surface area: Application to Piedmont Region (Italy). Sol. Energy 2011, 85, 1041–1055. [Google Scholar] [CrossRef]
- CBS, Center Bureau of Statistics 2021, National Planning Commission, Government of Nepal. Available online: https://cbs.gov.np/population/ (accessed on 10 February 2022).
- The World Bank. (n.d.). Urban Population—Nepal|Data. 2020. Retrieved 19 September 2021. Available online: https://data.worldbank.org/indicator/SP.URB.TOTL?locations=NP (accessed on 10 January 2022).
- Himalayan News Service. Electricity Consumption Increases to 267 Units. The Himalayan Times. 2020. Available online: https://thehimalayantimes.com/business/electricity-consumption-increases-to-267-units (accessed on 10 January 2022).
- White Paper; Ministry of Energy Water Resource and Irrigation. Energy, Water Resource and Irrigation Sector’s Current Situation and Future Prospects. 2018. Available online: https://moewri.gov.np/storage/listies/May2020/white-paper-2075-with-annex02.pdf (accessed on 10 January 2022).
- Solar Electric Manufacturer’s Association Nepal (SEMAN). Solar Energy Technology in Nepal. 2019. Available online: https://www.semannepal.org.np/publications/solar-energy-technology-in-nepal (accessed on 5 August 2019).
- IRENA. Renewable Power Generation Costs in 2019. 2020. Available online: https://www.irena.org/-/media/Files/IRENA/Agency/Publication/2018/Jan/IRENA_2017_Power_Costs_2018.pdf (accessed on 31 March 2021).
- National Planning Commission. 15th Plan Approach Paper. 2019. Available online: https://npc.gov.np/images/category/15th_Plan_Approach_Paper2.pdf (accessed on 10 January 2022).


Disclaimer/Publisher’s Note: The statements, opinions and data contained in all publications are solely those of the individual author(s) and contributor(s) and not of MDPI and/or the editor(s). MDPI and/or the editor(s) disclaim responsibility for any injury to people or property resulting from any ideas, methods, instructions or products referred to in the content. |
© 2023 by the authors. Licensee MDPI, Basel, Switzerland. This article is an open access article distributed under the terms and conditions of the Creative Commons Attribution (CC BY) license (https://creativecommons.org/licenses/by/4.0/).