Article

Investigation and Optimization of Fast Cold Start of 18650 Lithium-Ion Cell by Heating Film-Based Heating Method

1
Key Laboratory of Ocean Energy Utilization and Energy Conservation of Ministry of Education, Dalian University of Technology, Dalian 116023, China
2
State Key Laboratory of Multiphase Flow in Power Engineering, Xi’an Jiaotong University, Xi’an 710049, China
*
Authors to whom correspondence should be addressed.
Energies 2023, 16(2), 750; https://doi.org/10.3390/en16020750
Submission received: 25 November 2022 / Revised: 3 January 2023 / Accepted: 4 January 2023 / Published: 9 January 2023

Abstract

:
In this paper, based on the multi-scale multi-domain (MSMD) battery modeling approach, the NTGK model was used to model the 18650 cylindrical lithium-ion single battery on the electrochemical sub-scale. The model was successful, as it was able to fit the experimental voltage and temperature of the battery at different temperatures. Lithium-ion battery discharge capacity and energy output can be improved during cold starting by preheating and insulation, as demonstrated by a comparison of the impacts of heat transfer coefficient and preheating duration at −20 °C ambient temperature. For the traditional heating method, the heating model of heating film (HF) and liquid-cooled plate (LCP) is constructed in this paper, and the heating performance of both is compared by Fluent. Analysis of the energy balance of Li-ion battery at low temperatures has been presented, showing that Li-ion battery requires a suitable start-up temperature to maximize energy output. Taking care of the problem of excessive temperature difference inside the battery due to excessive heating power, we investigated the effects of axial thermal conductivity, heating power, and heating area on the heating uniformity of the battery in this paper. Finally, a multi-stage stepped power (MSP) heating method was proposed to improve the temperature control accuracy of HF. A level orthogonal test L16(43) without interaction was designed to determine the degree of influence of each parameter on the temperature control performance and the optimal level combination, revealing that the optimized maximum temperature and temperature control rate were reduced by 4.09% and 40.53%, respectively, when compared to direct heating.

1. Introduction

Evidence suggests that the use of internal combustion engine vehicles (ICE) powered by fossil fuels is among the most important factors for dramatic climate changes around the world [1]. Hybrid electric vehicles (HEVs), plug-in electric vehicles (PHEVs), and pure electric vehicles (EVs) are gradually gaining market share in order to alleviate the air pollution and global warming problems that come with them [2]. Compared to other types of batteries, lithium-ion batteries (LIB) have higher specific energy, power density, and cycle stability, and are therefore ideal as a driving energy source for electric vehicles [3]. However, the power, discharge capacity, and cycle life of LIBs are extremely sensitive to the operating temperature, and in order for LIBs to better exhibit excellent cycling performance, Pesaran et al. [4] limited the optimal operating temperature range of LIBs within 15~35 °C. At high temperatures, the accumulated heat from discharge of LIBs can seriously weaken cycle life and power performance, and excessive temperatures can cause chemical chain exothermic reactions within the LIB [5], leading to a thermal runaway or even explosion. When the temperature is below 0 °C, the conductivity and diffusivity of the liquid phase is severely reduced [6,7], making the electrolyte resistance larger. The decrease in the electrochemical inverse rate of the active particle surface and the solid-phase diffusion coefficient of li-ions [8] also lead to a larger electrochemical polarization resistance and charge transfer resistance [9], and these temperature-dependent electrochemical parameters caused the performance of LIBs at low temperatures to fail to meet commercial requirements. In addition, Li et al. [10] predicted that when the amount of Li+ involved in charge transfer reactions on the surface of graphite particles during low temperature charging of LIBs is greater than the amount diffusing to the interior of the particles, there is a possibility of precipitation of solid phase Li at the negative electrode/electrolyte interface, which grows into dendrites capable of piercing the diaphragm to cause internal short-circuiting or even explosion of LIBs [11]. Therefore, how to preheat the battery to a suitable operating temperature at low temperatures has received increased attention across a number of disciplines in recent years. One of the main focuses of current research is the development of a preheated thermal management system (BTMS) with high efficiency and low energy consumption; this is because the preheating method is simple and easy to operate, and there is a lack of battery materials that perform well at both low and normal temperatures [6,12].
According to the energy transfer law of the heating process, low-temperature BTMS is classified as either internal or external preheating. External preheating distinguishes four different types, i.e., air preheating, liquid preheating, phase change material (PCM) preheating, and electric heating element preheating. The use of air preheating is a tried-and-true method to heat the battery, with the benefits of simple installation and disassembly, good efficiency, and high safety. Ji et al. [13] compared the heating time for heating a lithium battery from −20 °C to 20 °C with different load resistances using a coupled heating method of air preheating and lithium-ion battery self-discharge. As the heating resistance drops, the data reveal that the heating time drops from 201 s to 85 s. Wang et al. [14] designed a heating box with parallel resistive wires inside, and 20 °C air was preheated through the box and then heated the lithium-ion battery. The experimental results presented here suggest that the approach might increase the ambient air temperature by 70 °C in just 8 min. However, the method’s complex structure and lackluster economics make it unattractive. What is more, the high voltage and density of parallel resistance pose a significant risk of accidental electrocution. Although most studies have improved on the simple air preheating method, it is still difficult to improve the heating efficiency due to the low thermal conductivity of air, and in large battery modules, a large temperature gradient is generated in the air flow direction, which has a significant impact on the lifetime of lithium-ion battery modules [15]. Due to the high specific heat capacity and heat transfer coefficient of the liquid, the battery is able to achieve a greater increase in heating temperature and greater temperature uniformity. In BTMS, the liquid is usually pumped through a pre-set flow channel of the clamping block or plate to heat the battery indirectly [16], which is used in the market for electric cars like the Volt and Tesla because it works well and is safe [17]. Li et al. [18] developed a battery heat power model to simulate the LCP thermal management capability based on the heat generation source term and heat transfer control equation for Li-ion battery. The simulation findings indicate that, with a coolant input temperature of 10 °C, the LCP heating system can heat the battery pack from −30 °C to coolant temperature and sustain a maximum temperature difference of 1 °C within 1 h. Rao et al. [19] designed a microchannel LCP BTMS with variable contact surface for cylindrical Li-ion battery modules. Inlet velocity of 0.05 m/s is required to produce the cooling effect of a continuous contact surface system, and the simulation results show that the temperature difference may be reduced by 28% using this heating approach. Boiling heat transfer with two-phase flow has higher heat transfer coefficient and better temperature uniformity than single-phase flow. In the literature [20], a cooling system was designed to immerse the battery cells in a hydrofluoric ether liquid and then fill the cells with porous dielectric material and use a fan to improve the cooling performance of the system, and the results showed that the temperature could be maintained at about 35 °C all the time, even when the batteries were operated at a very high charge/discharge rate. Saw et al. [21] introduced distilled water mist into dry air and allowed the water mist to evaporate and absorb heat on the cell surface to improve the cooling performance. Results from experiments and computer simulations demonstrated that mist cooling can give a battery pack a more acceptable temperature and homogeneity than dry air cooling. However, complexity of equipment, large power requirements, and the possibility of a battery short-circuit are all drawbacks of the liquid preheating method [22]. In contrast to air and liquid preheating, phase change materials (PCM) are of interest because they release/absorb a large amount of heat stored as latent heat when they undergo phase change [23]. Zhong et al. [24] used composite phase change material (CPCM) to improve the heat dissipation performance of PCM at high temperature and wound resistive wire outside the cylindrical Li-ion battery module to heat the battery at low temperature. The connection mechanism can raise the battery pack’s central temperature by 40 °C in 300 s, according to experiments. Additionally, it can keep the temperature of a 5C battery pack that has been discharged to below 45 °C in an operating environment of 40 °C. This has a high heating rate and temperature control performance. Bai et al. [25] designed a PCM/microchannel water-cooled plate thermal management structure with upper and lower layered structure in the middle of the square battery pack, which can limit the battery pack temperature to below 40 °C at 2C discharge multiplier, but the disadvantage is that the temperature difference of the battery pack is not limited to 5 °C. PCM’s poor heat dissipation at high temperatures is a result of its low thermal conductivity, and its shortcomings of heavy weight and high cost have prevented it from gaining popularity in the EV industry. In exterior heating, electric heating element heating is a system with greater heating efficiency, lower cost, and a simpler structure. Most other BTMS also require electric heating components for low-temperature heat transmission. Mostafavi et al. [26] used a thermoelectric cooling film using the Peltier effect for dual thermal management of a Li-ion battery pack. Experiment results showed that at 5C, the cooling film could almost completely absorb the heat released by the battery pack, and the temperature rise rate of the heated battery could reach 2 °C/s by reversing the electrodes of the cooling film. Kang et al. [27] placed a cylindrical Li-ion battery pack into an aluminum square battery tray with resistance heaters attached to both sides of the tray. The heaters heated the battery pack at a heating boundary condition of 20 W/m2 at −32 °C and further reduced the temperature difference from 10 °C to 1 °C by optimizing the aluminum tray design and heating area. Internal heating is a method of producing heat spontaneously by applying excitation to a lithium-ion battery and utilizing the battery’s high internal resistance at low temperatures [28]. Unlike the external heating method, the internal heating method does not have to deal with too much thermal conductivity and thermal resistance. It is also not limited by the shape of the cell and can get a more even temperature [29]. So far, self-heating, mutual pulse heating, and AC heating are the three main ways that BTMS has investigated for heating the inside. A widely studied strategy applied to the fast preheating of Li-ion batteries is the self-heating structure. Wang et al. [30] proposed the structure of embedding thin nickel sheets inside the lithium-ion battery to form a self-heating circuit of the battery. This method can turn on/off the heating function at any time and can heat the battery from −30 °C to 0 °C in 29.6 s with high heating efficiency, but it is not popular now because of the change of the internal structure of the battery, which makes it difficult for mass production and quality inspection in assembly line production. In order to achieve a low decay rate fast charge in 10 min, the above “sandwich” self-heating structure proposed by Wang’s team is applied to the proposed asymmetric temperature modulated fast charging idea by Yang et al. [31,32]. The result is that the 10 min fast charging method at 60 °C is able to increase the cycle life from 60 cycles to 1700 cycles compared to 6 C charging at 26 °C. Additionally, for the fast cold start, Ye et al. [33] designed a self-heating structure by adding uniform ultra-thin nickel sheets as thermal regulators inside an all-solid-state battery, and a 5 kWh square battery pack was able to uniformly increase the battery temperature from room temperature to up to 90 °C in 10.5 s with an energy consumption of only 5.86% of the battery capacity. One of the most efficient heating methods is alternating current (AC) heating, which, unlike self-heating and inter-pulse heating, employs an external power source applied to the internal resistance of the Li-ion battery to generate heat [34]. Li et al. [35] simulated the heating of 18650 cylindrical Li-ion batteries using sinusoidal alternating current (SAC) signals based on a hierarchical thermal model, and the capacity and power of the batteries could be increased by 45% and 12% after preheating the cells using AC signals within 100 Hz at −20 °C. However, a note of caution is a temperature difference of 6 °C between the inside and outside of the battery. Besides, charging and discharging LIBs at low temperatures will speed up the deposition of lithium ions inside the battery. How the internal heating makes the battery produce heat depends entirely on the multidimensional coupled electrochemical reactions inside the battery. The lithium plating of the negative electrode and the battery’s cycle life are two aspects of their utilization that necessitate investigation using electrochemical modeling owing to this restriction.
Thermal modeling of Li-ion batteries can avoid complicated experimental operations and safety issues and reduce time costs. The electrochemical-thermal coupling model (ECT), equivalent circuit model (ECM), and NTGK empirical model are widely used mathematical models to describe the charging and discharging and heat generation characteristics of Li-ion battery. Zhang et al. [36] established an equivalent circuit model (ECM) to simulate the preheating of 18650 battery at low temperature using sinusoidal AC signal, analysis showed that at a rate of 1 °C/min, there is essentially no capacity loss or temperature change within the battery. In literature [37], H2O-Al2O3 nanofluid has been used to submerge and cool cylindrical lithium battery modules, which were externally supplemented with a fan to improve the cooling performance of the system, and the cooling effect of the cooling system was simulated by a 1D electrochemical model and a 3D CFD model for different cell arrays and airflow inlet and outlet locations. The results showed that the cooling strategy could reduce the maximum temperature of the battery stack by 16–24 K. Patil et al. [38] used a multi-scale multi-domain (MSMD) approach to simulate a square battery pack immersed in a flowing dielectric using the NTGK mathematical model, and showed that the maximum battery pack temperature can still be limited to 40 °C at a discharge multiplier of 5C. Although internal heating can bring good temperature rise rate and temperature uniformity, it has not been applied in practice because its effect on the safety of Li-ion battery has not been fully studied.
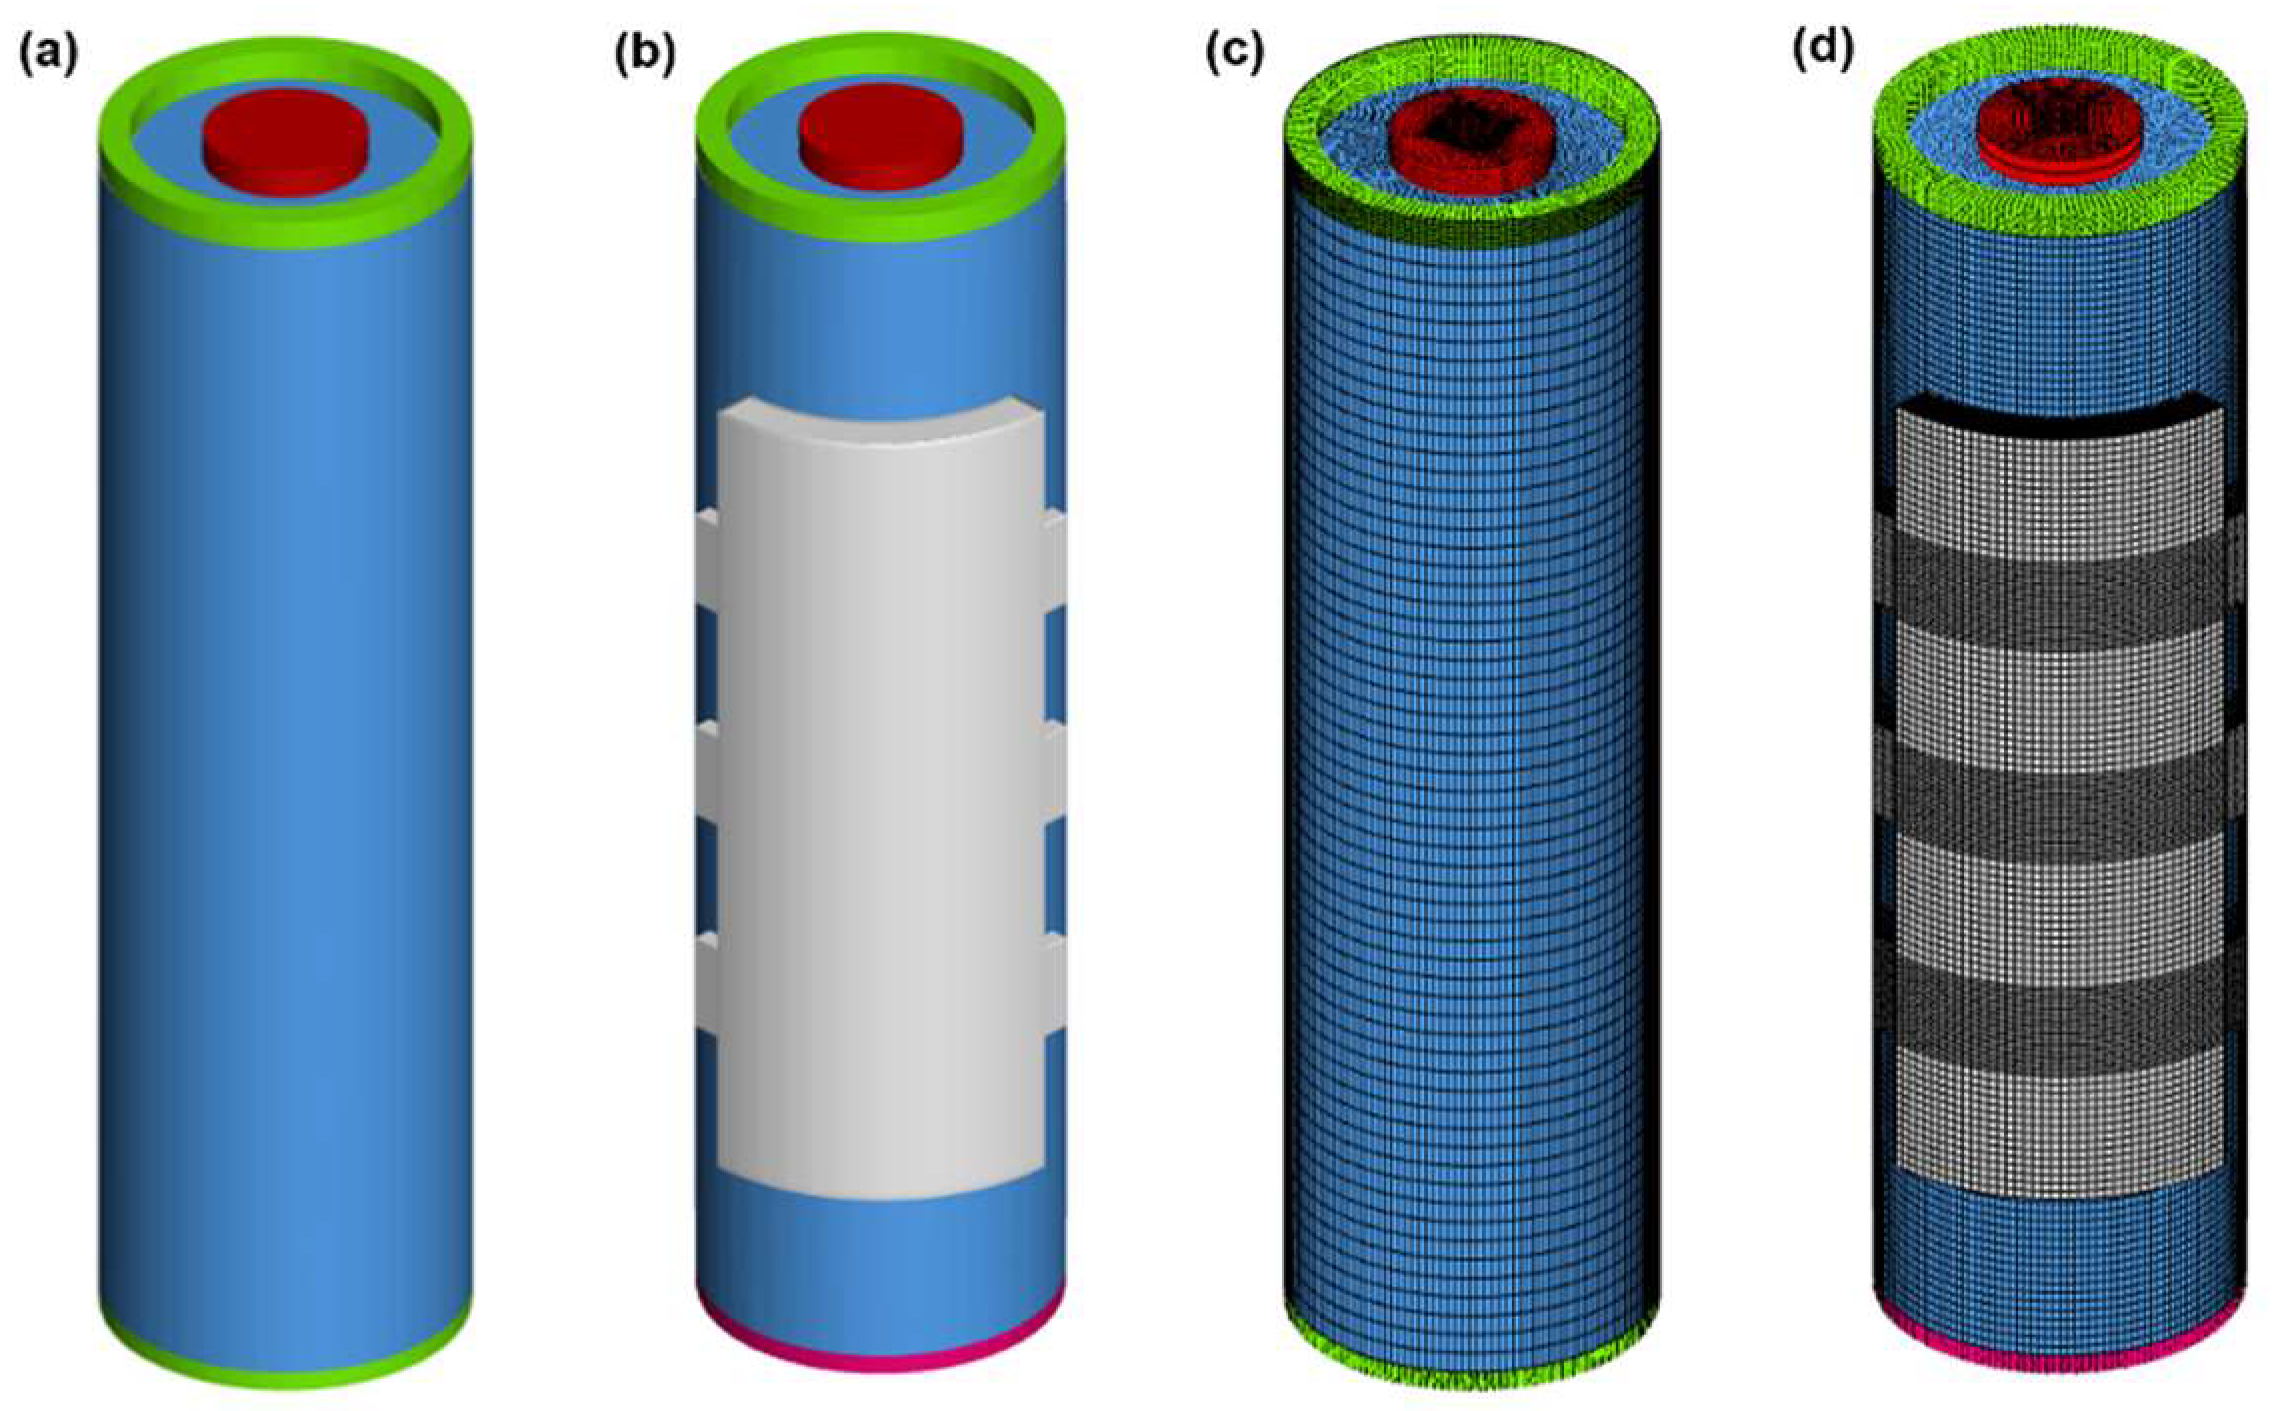
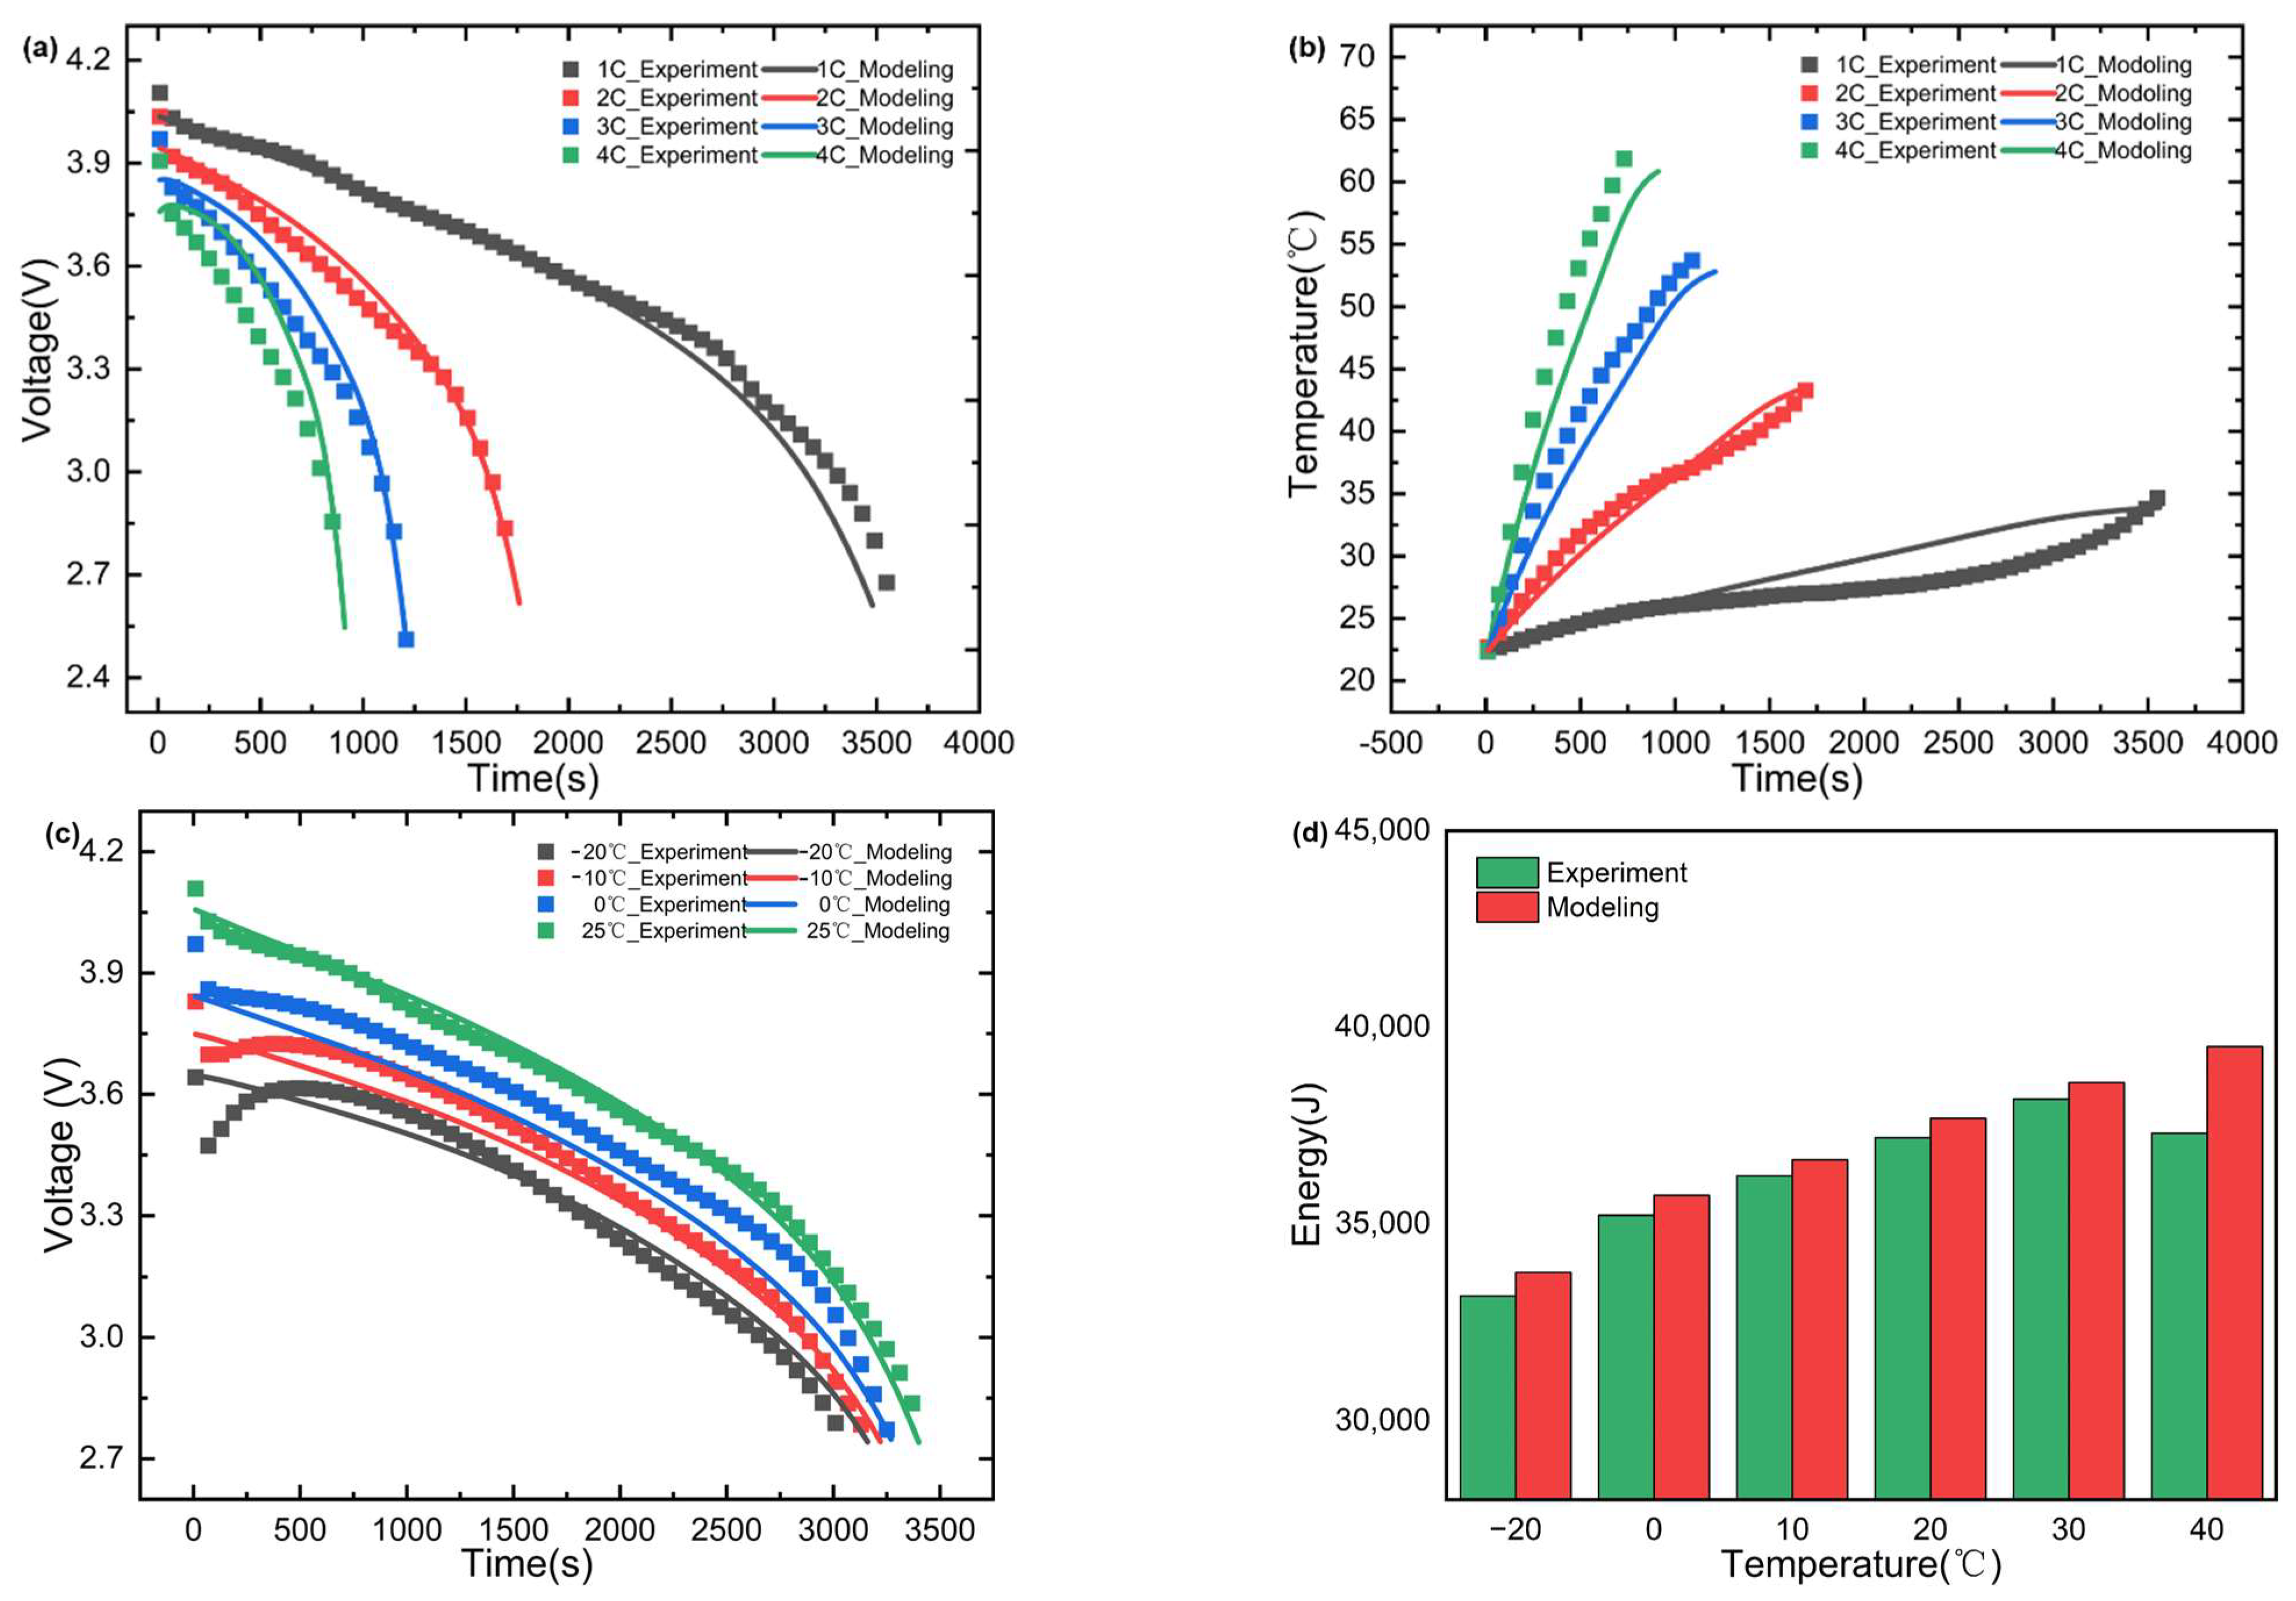
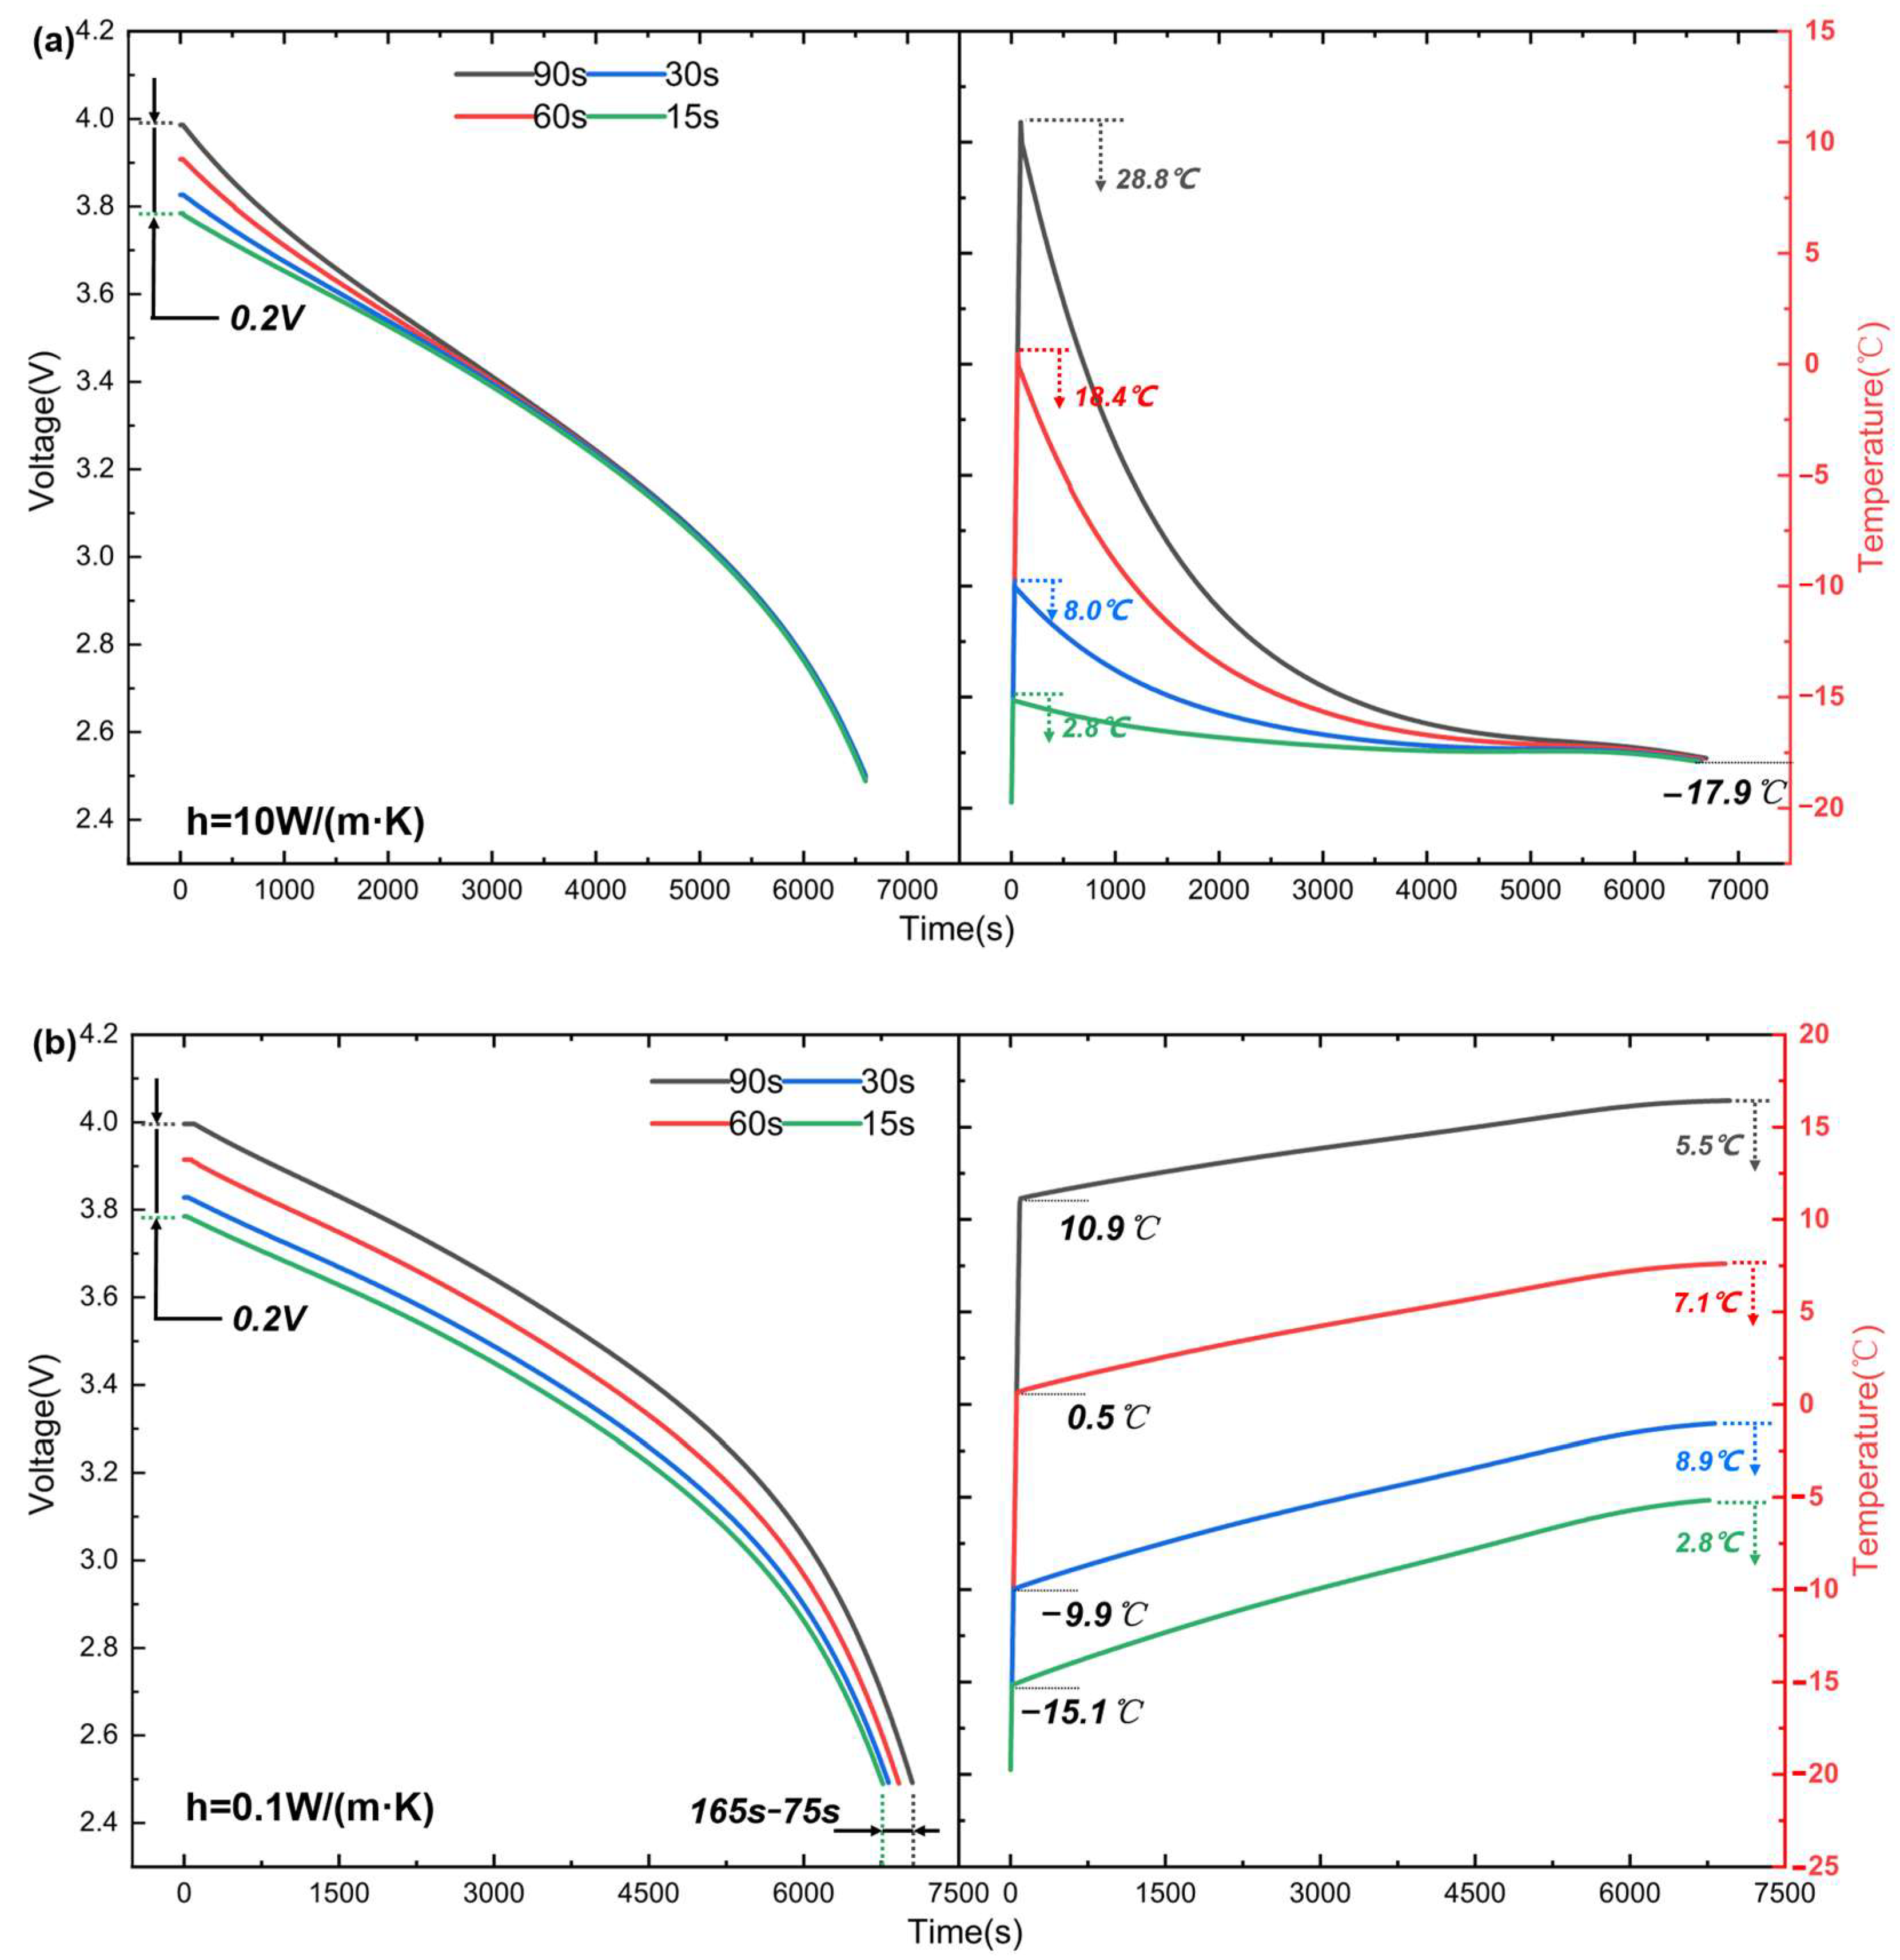
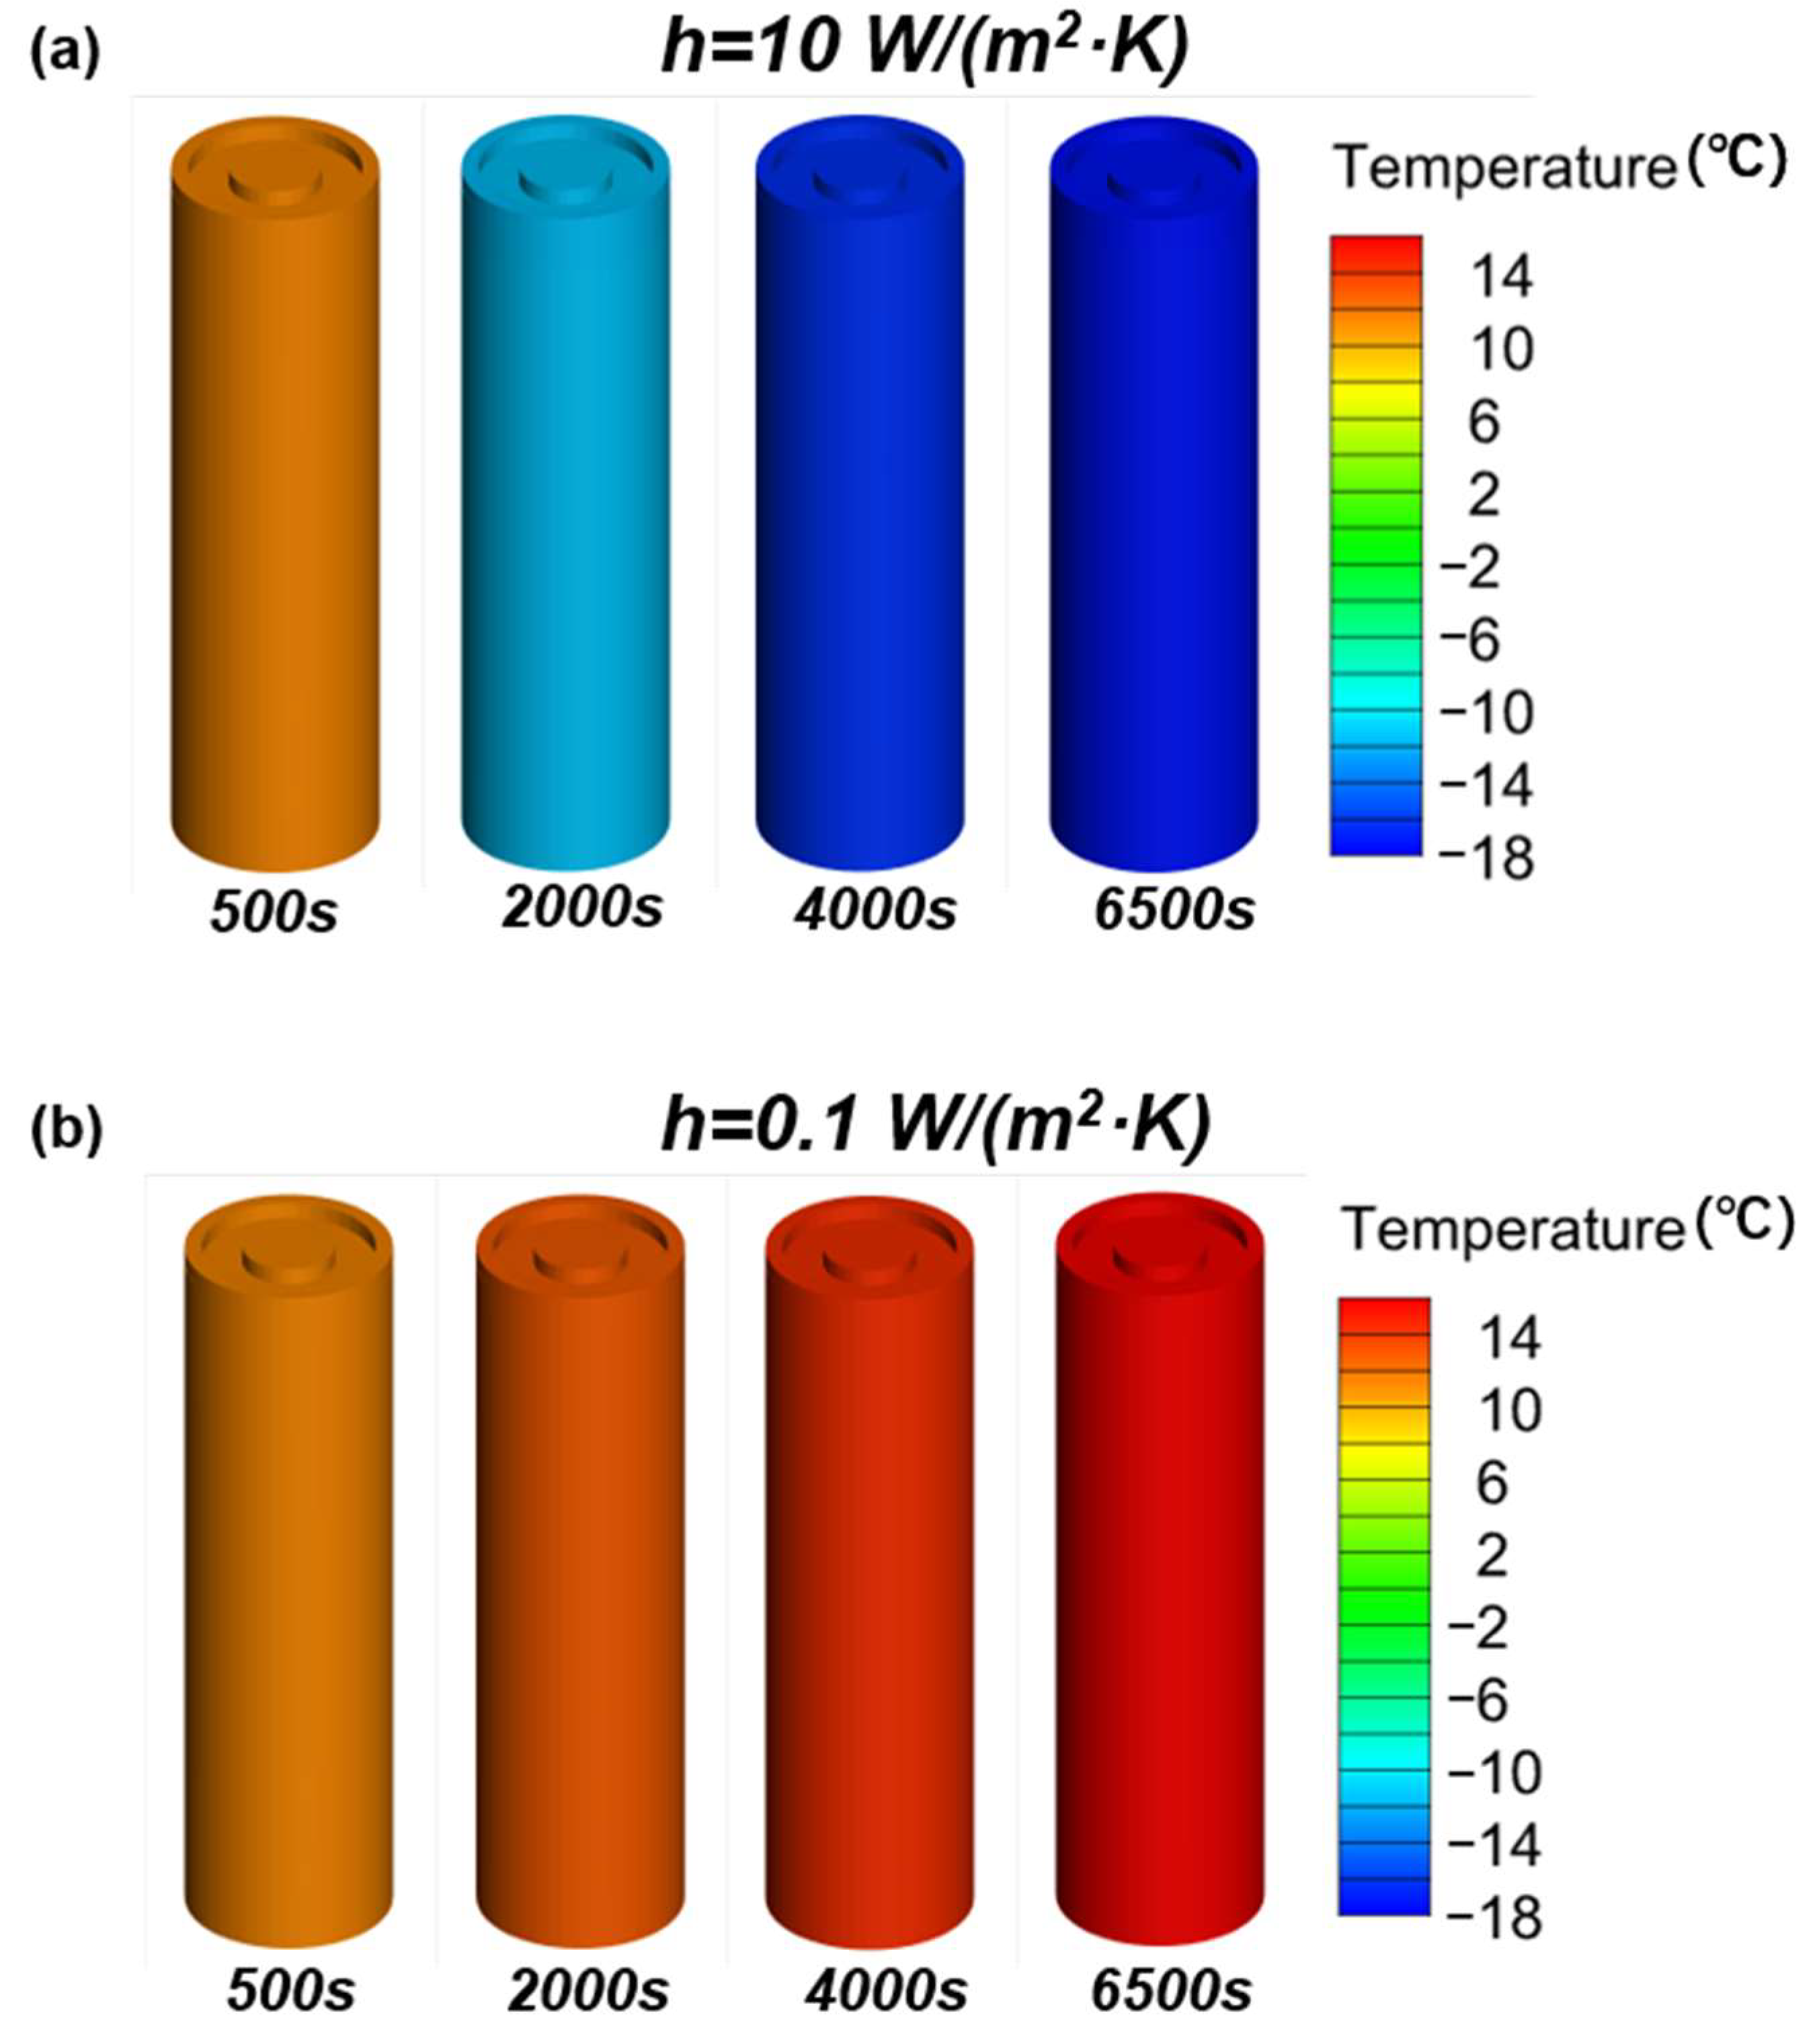
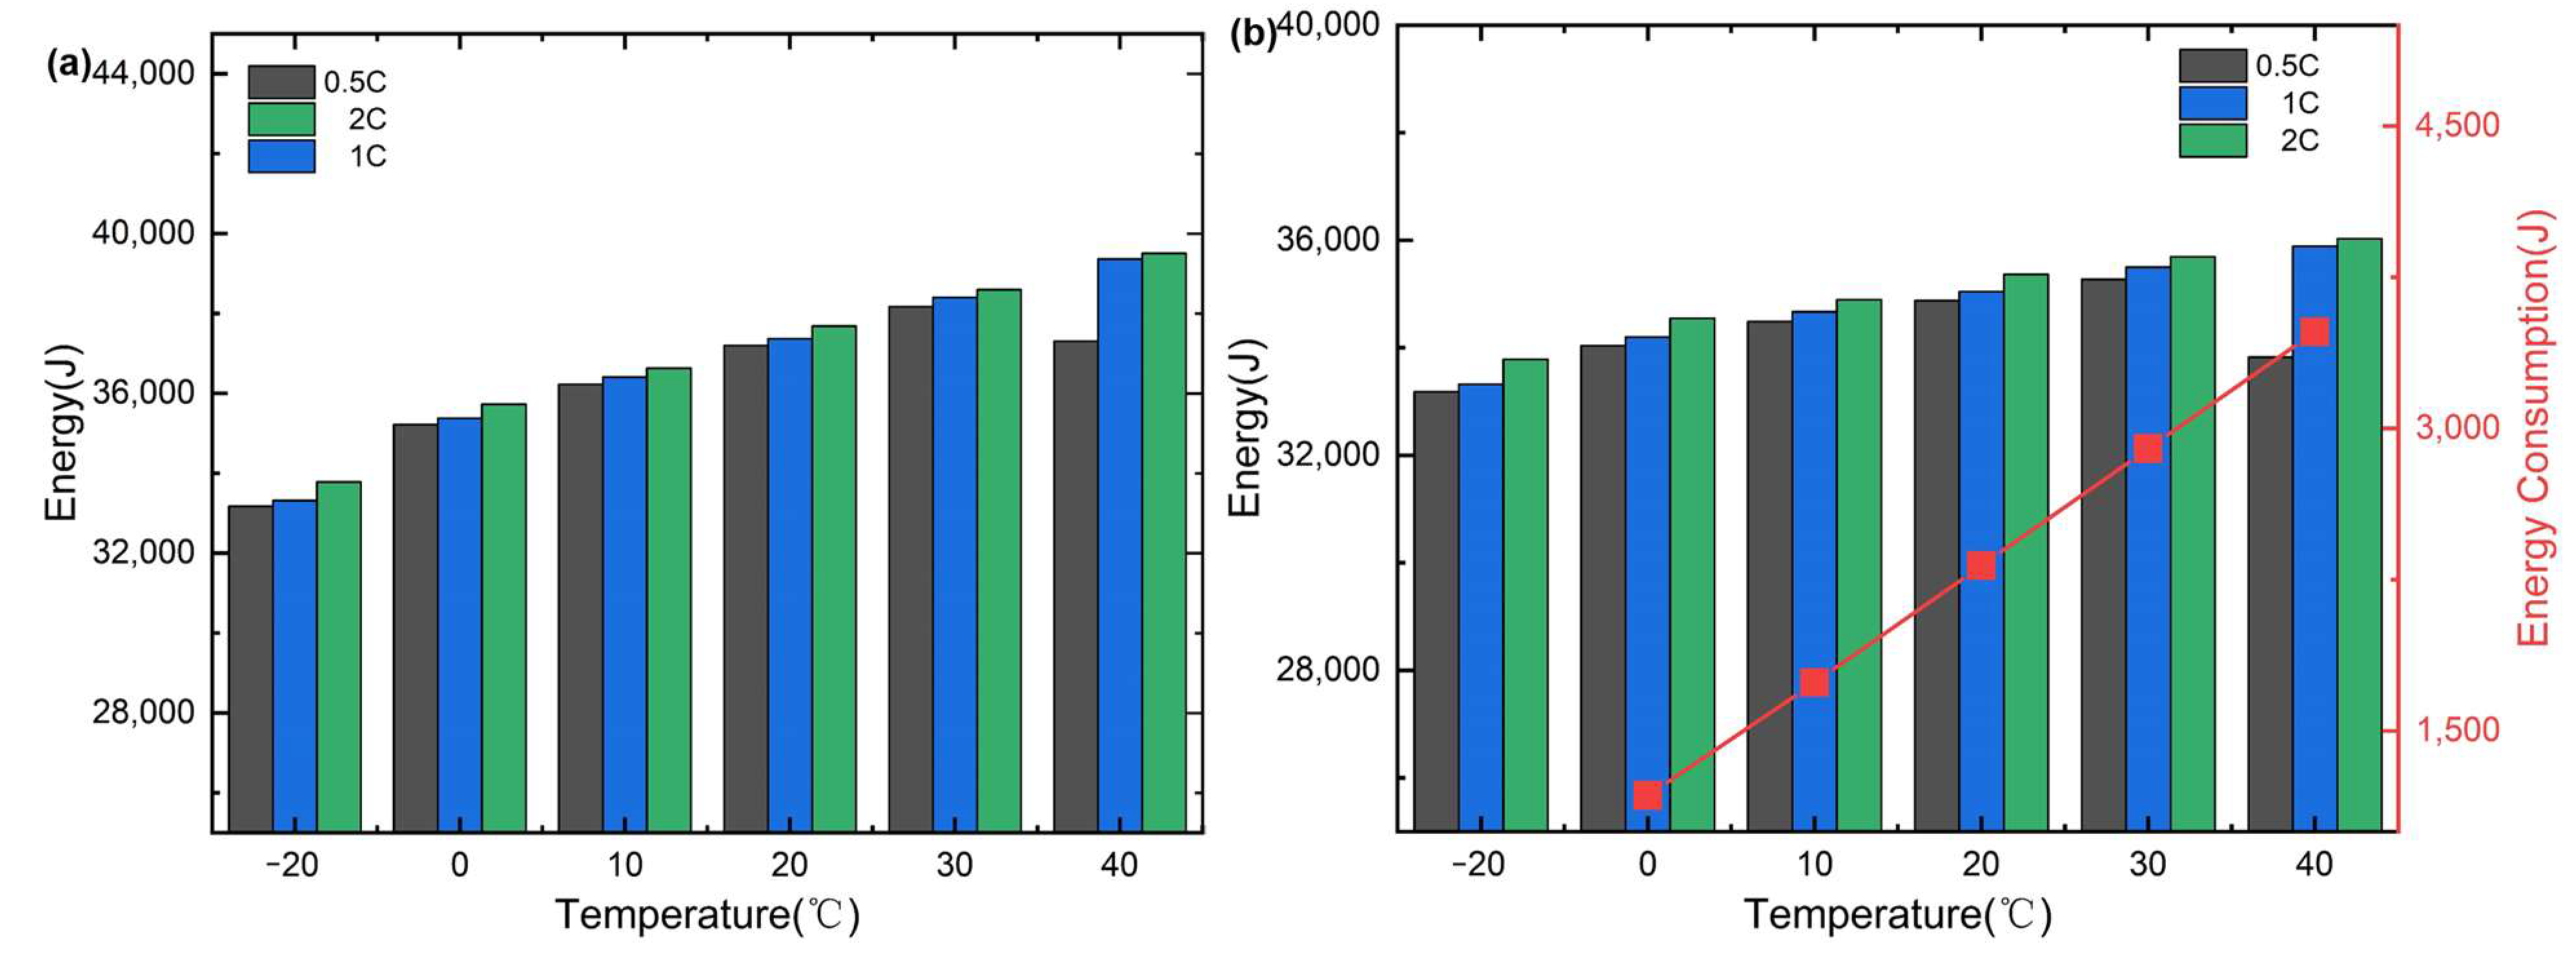
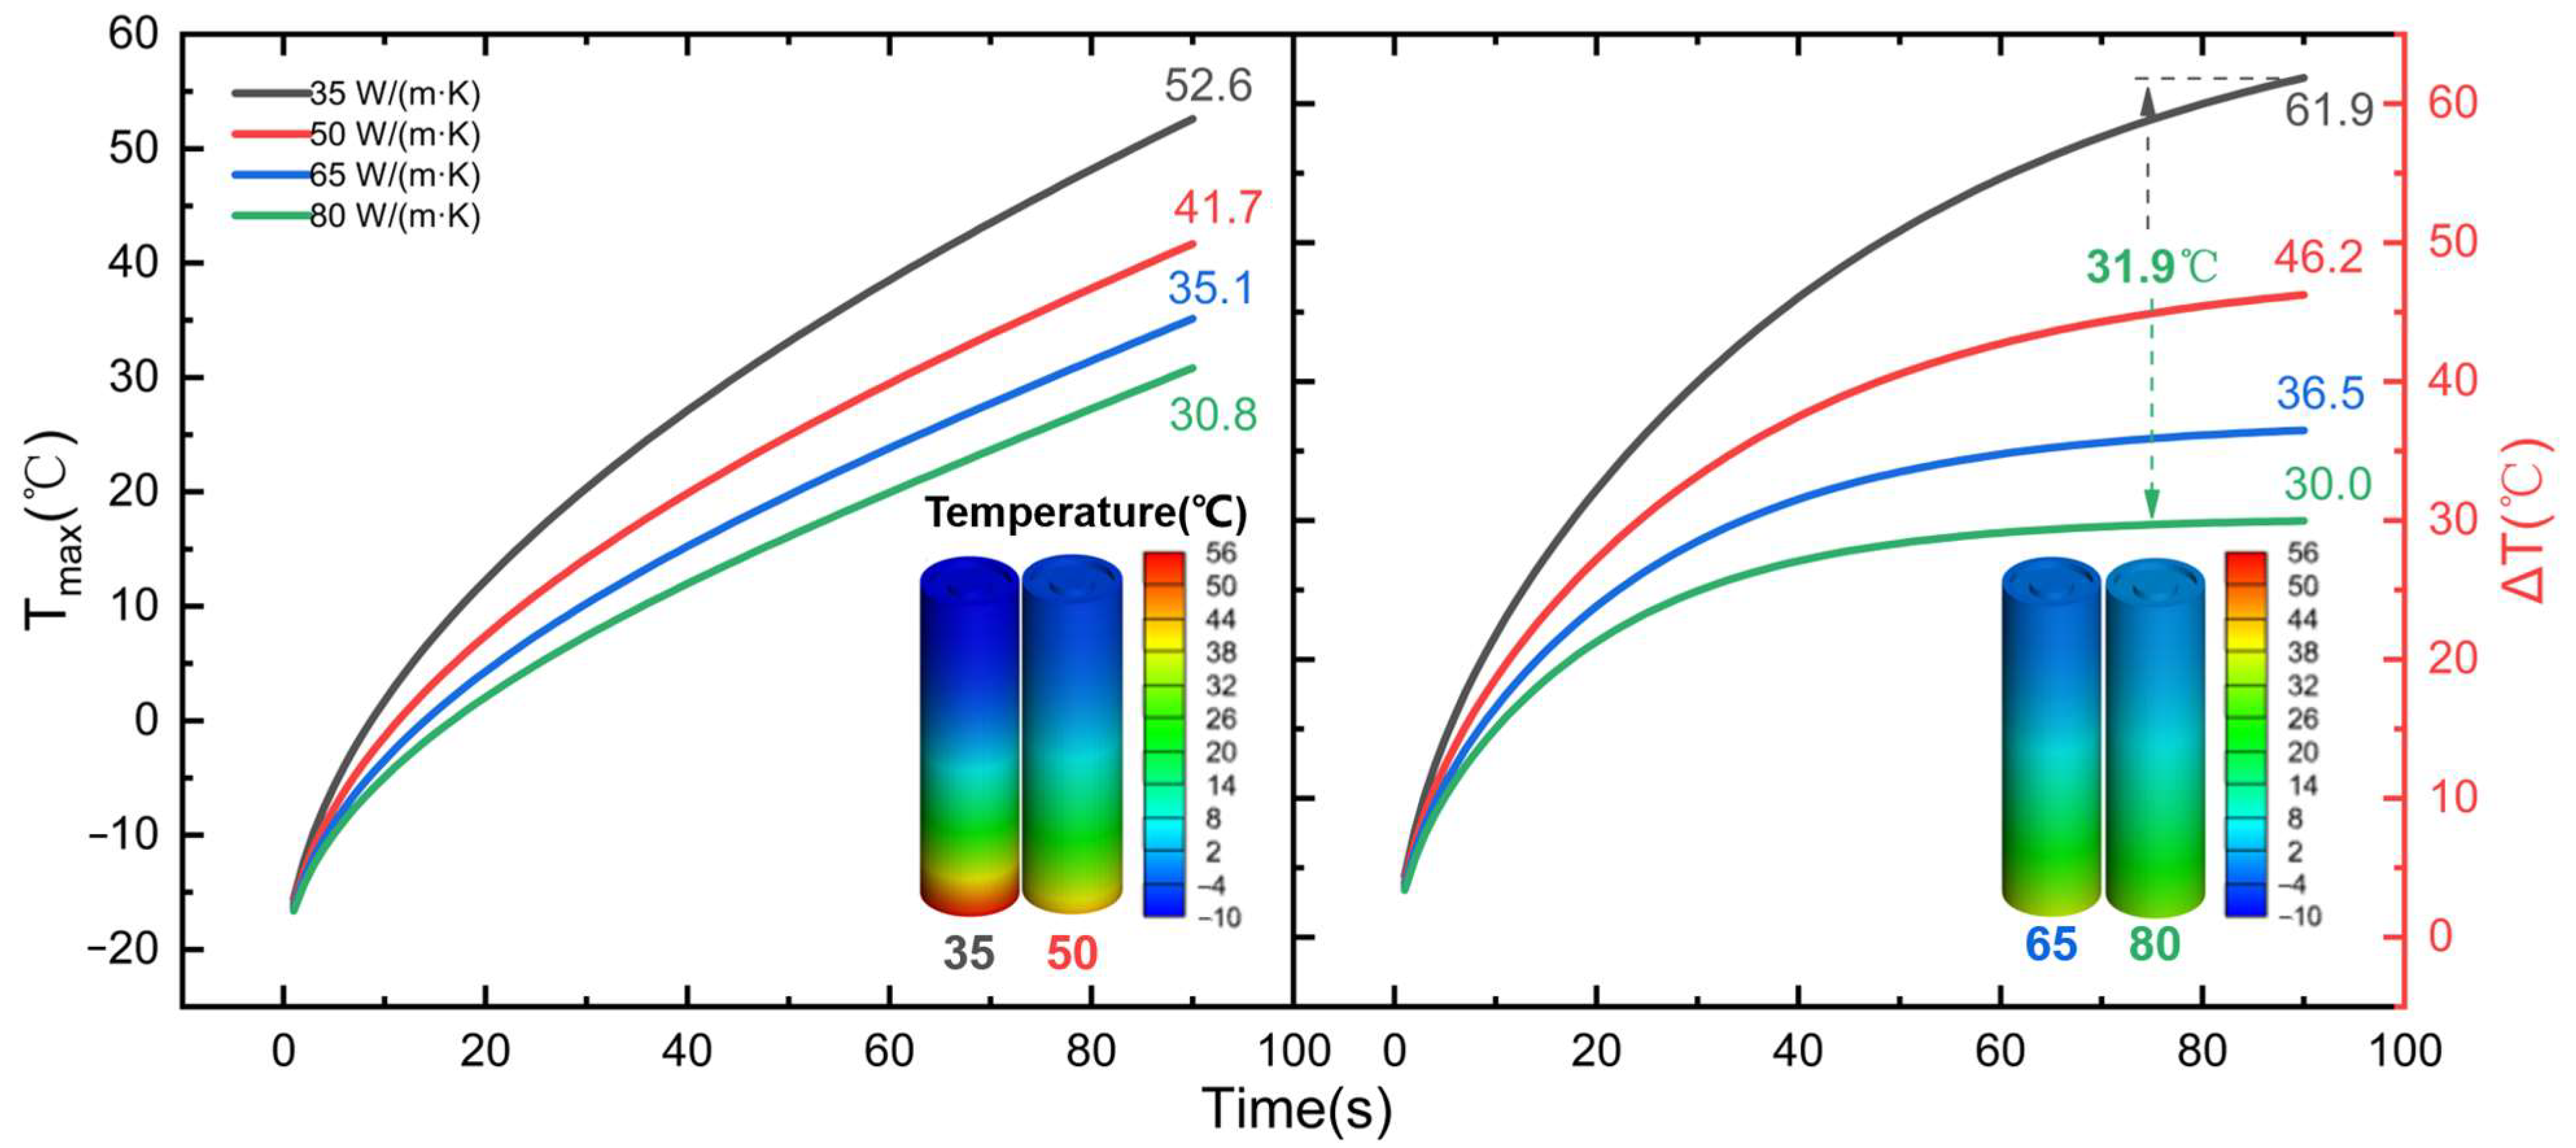
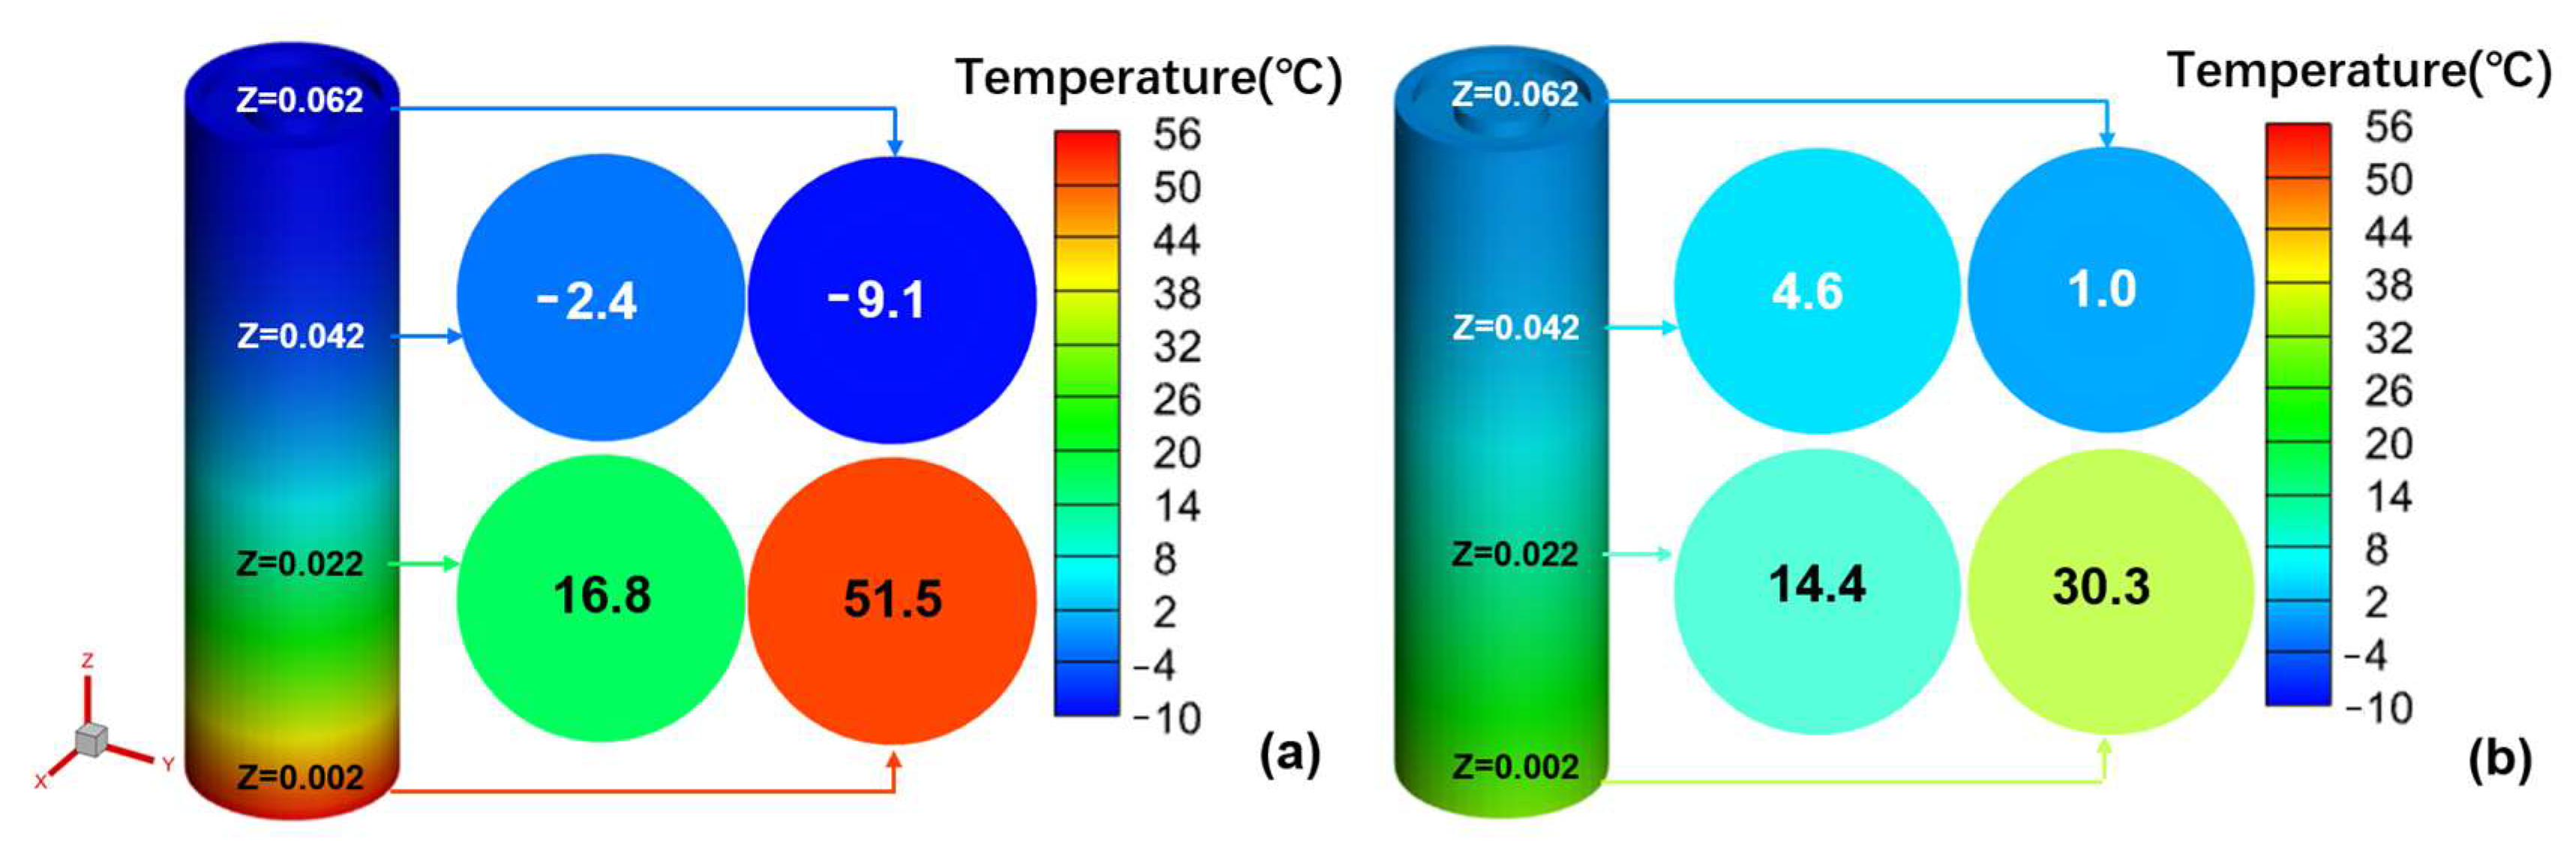
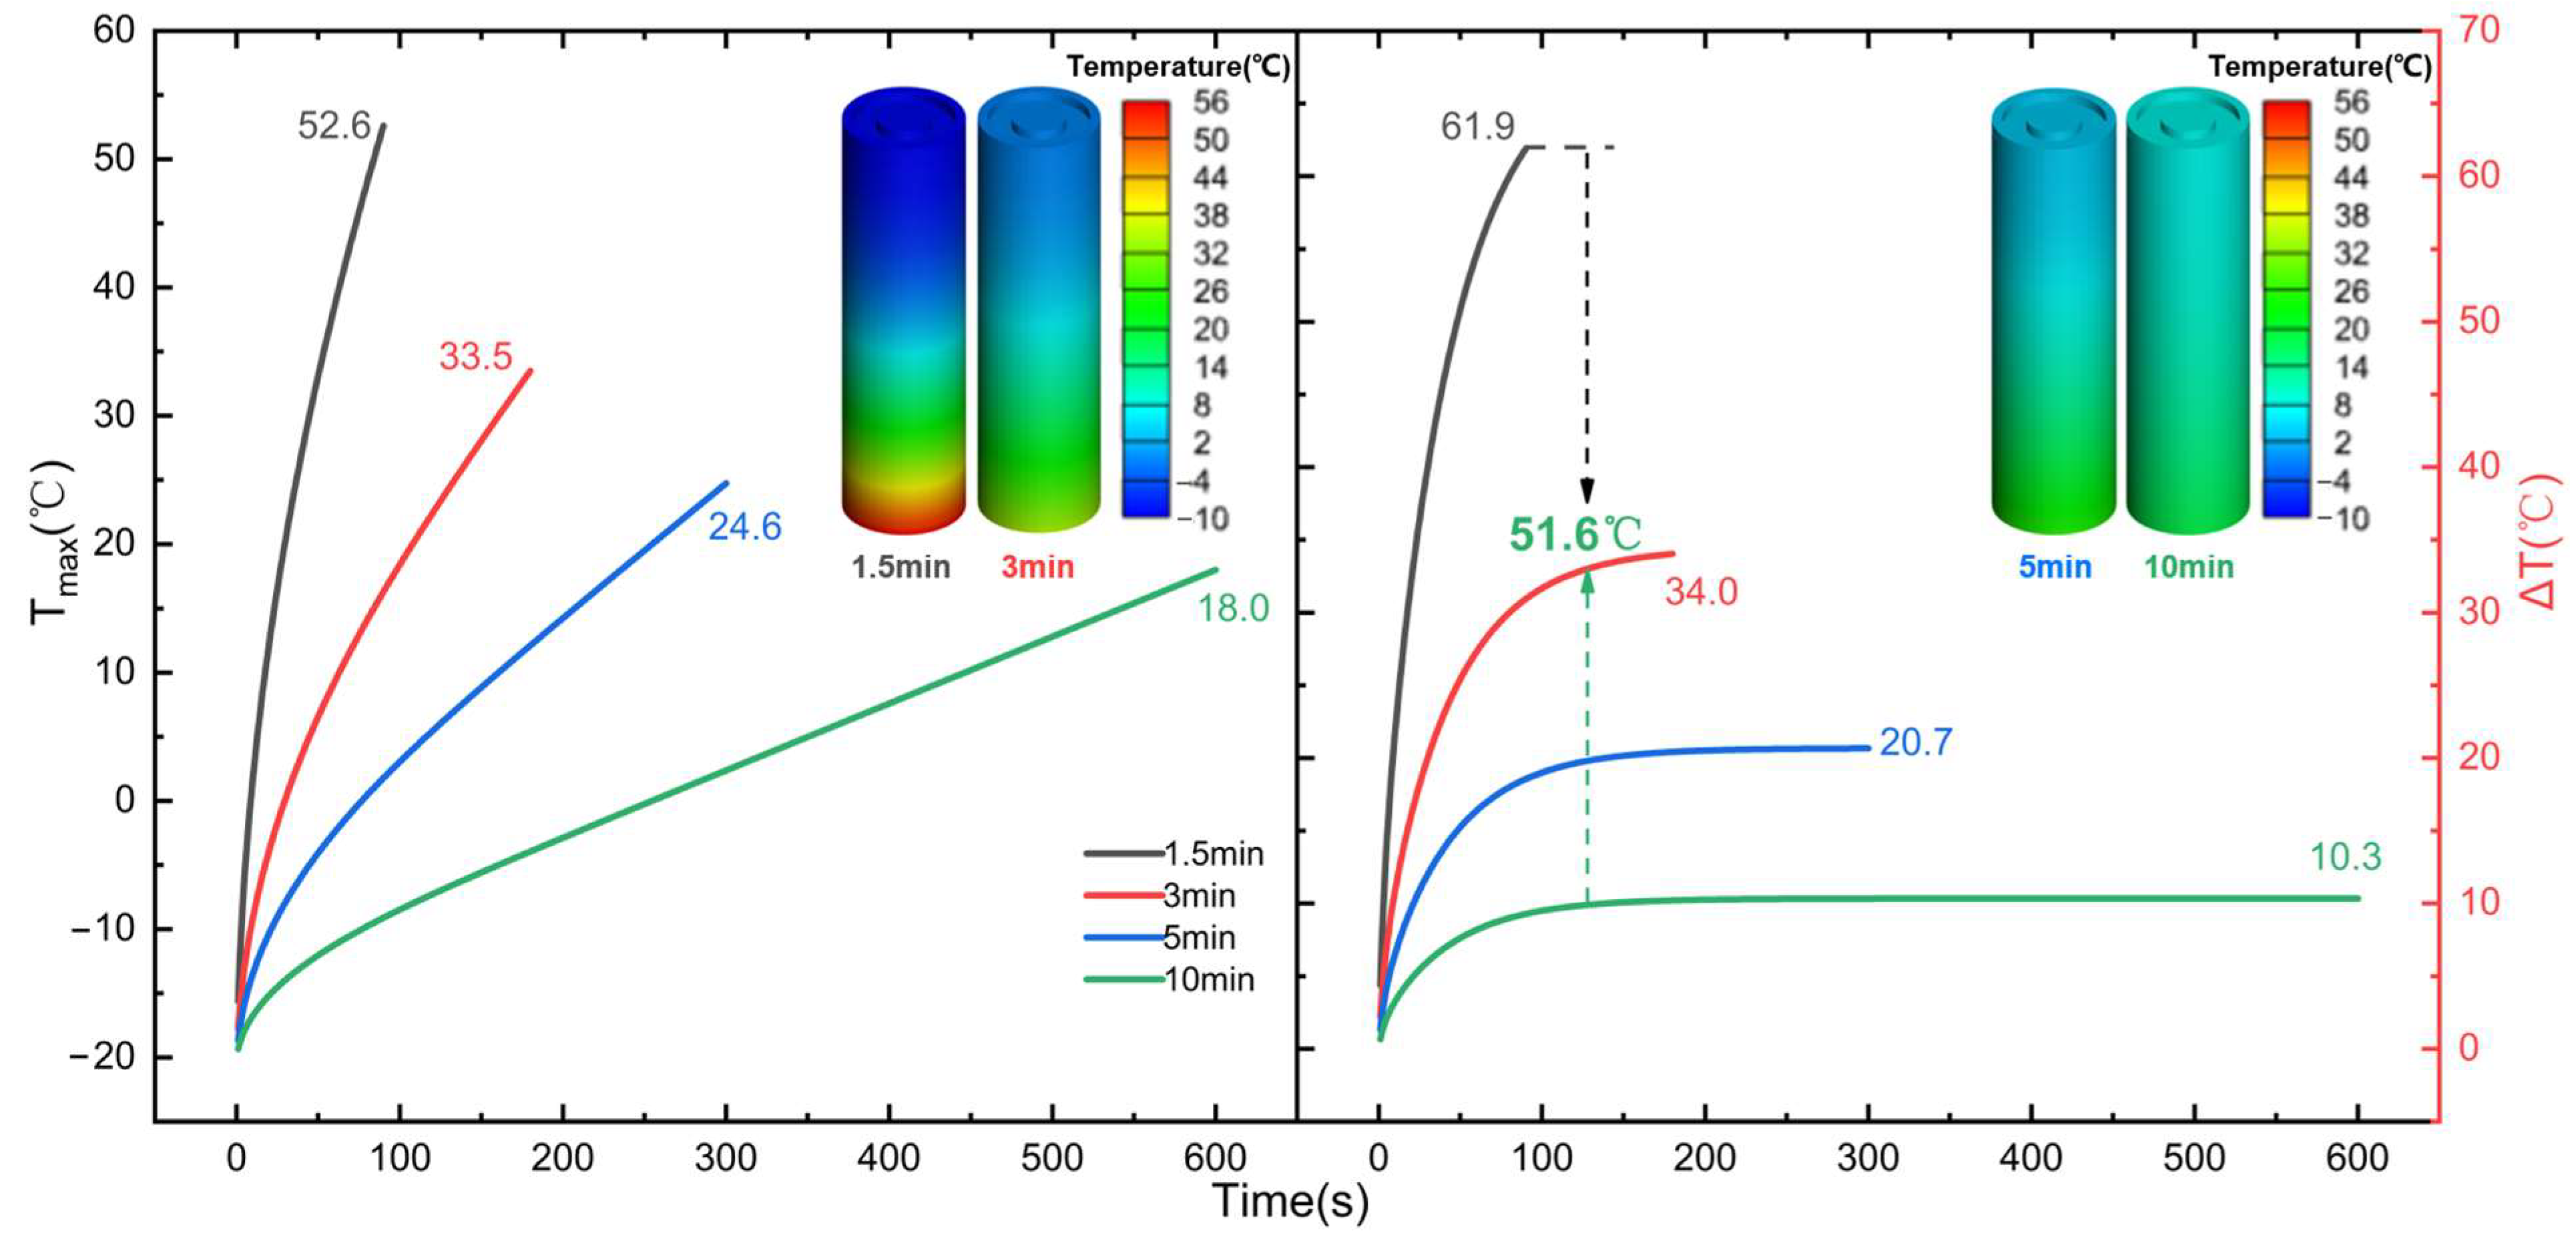
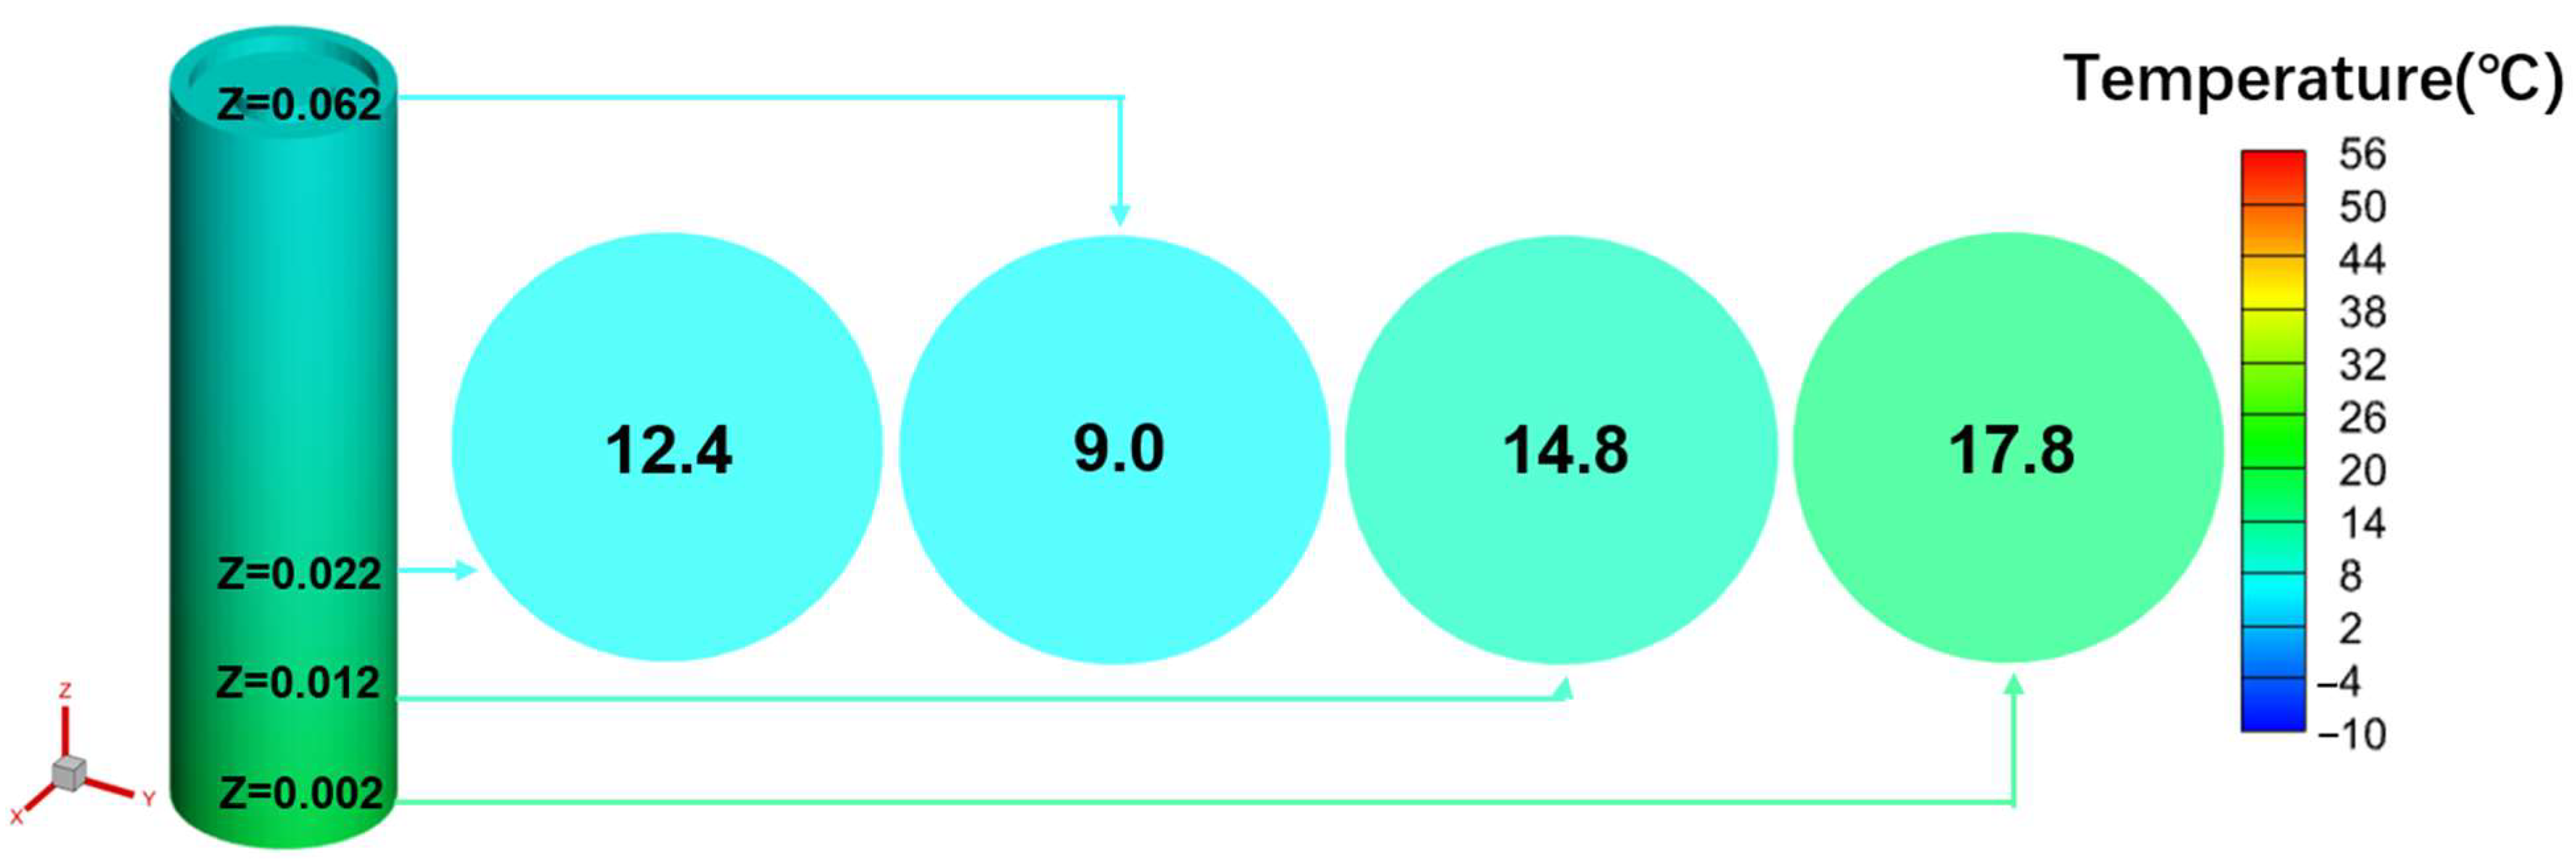
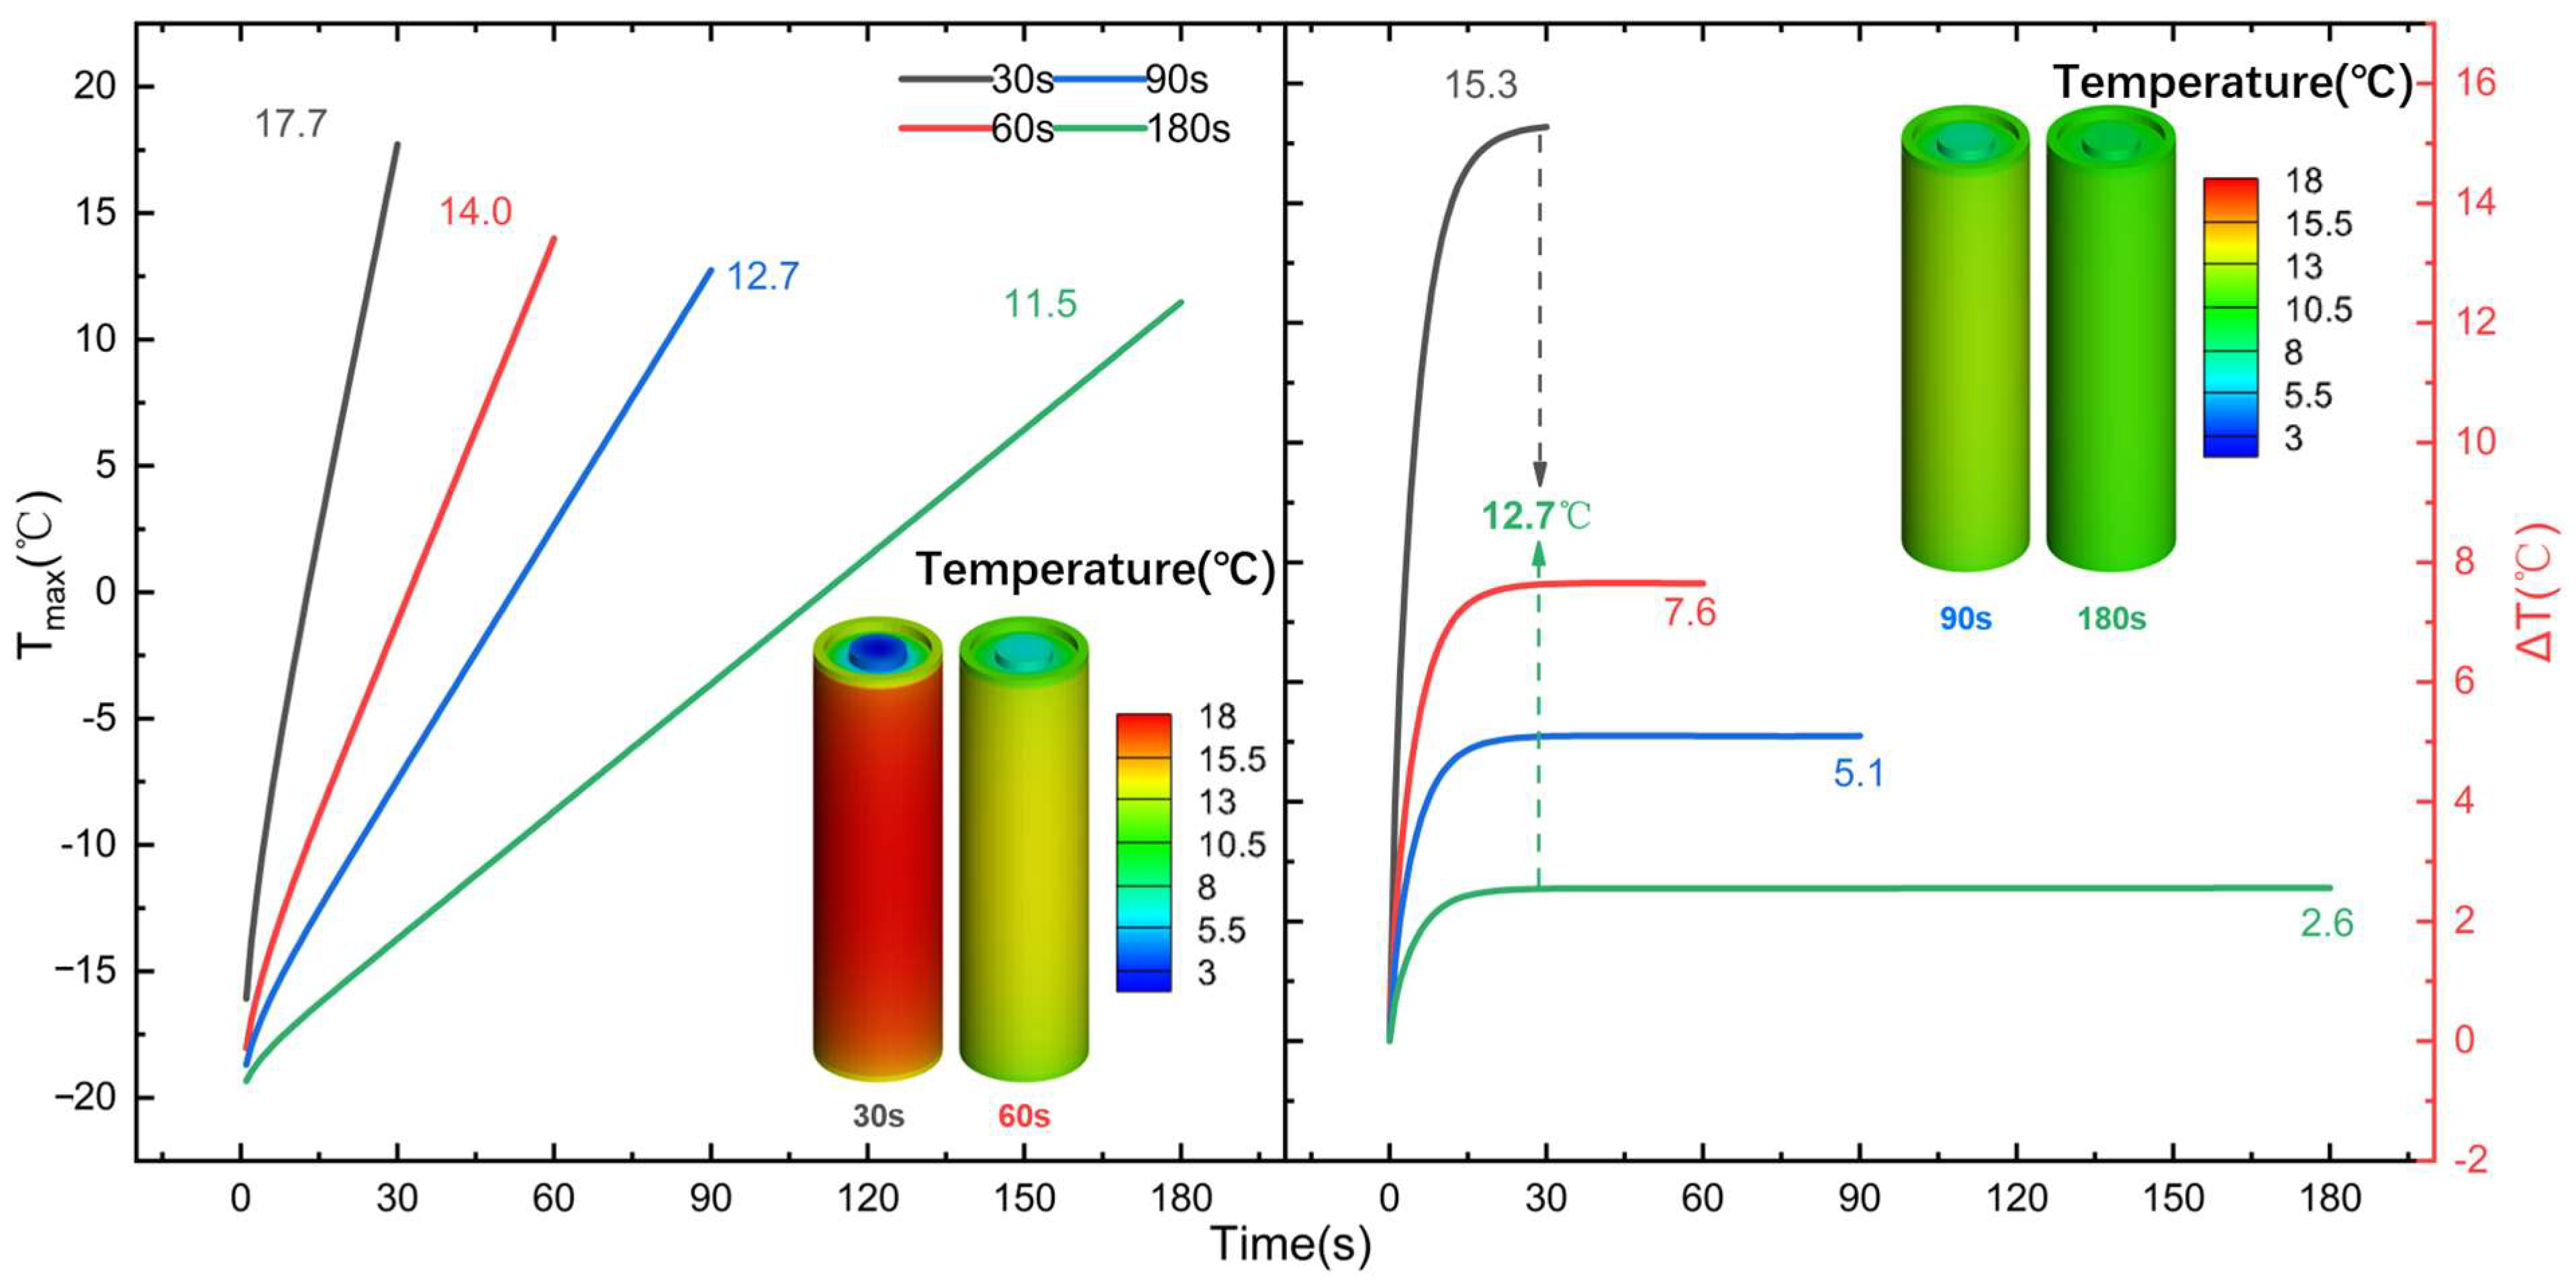
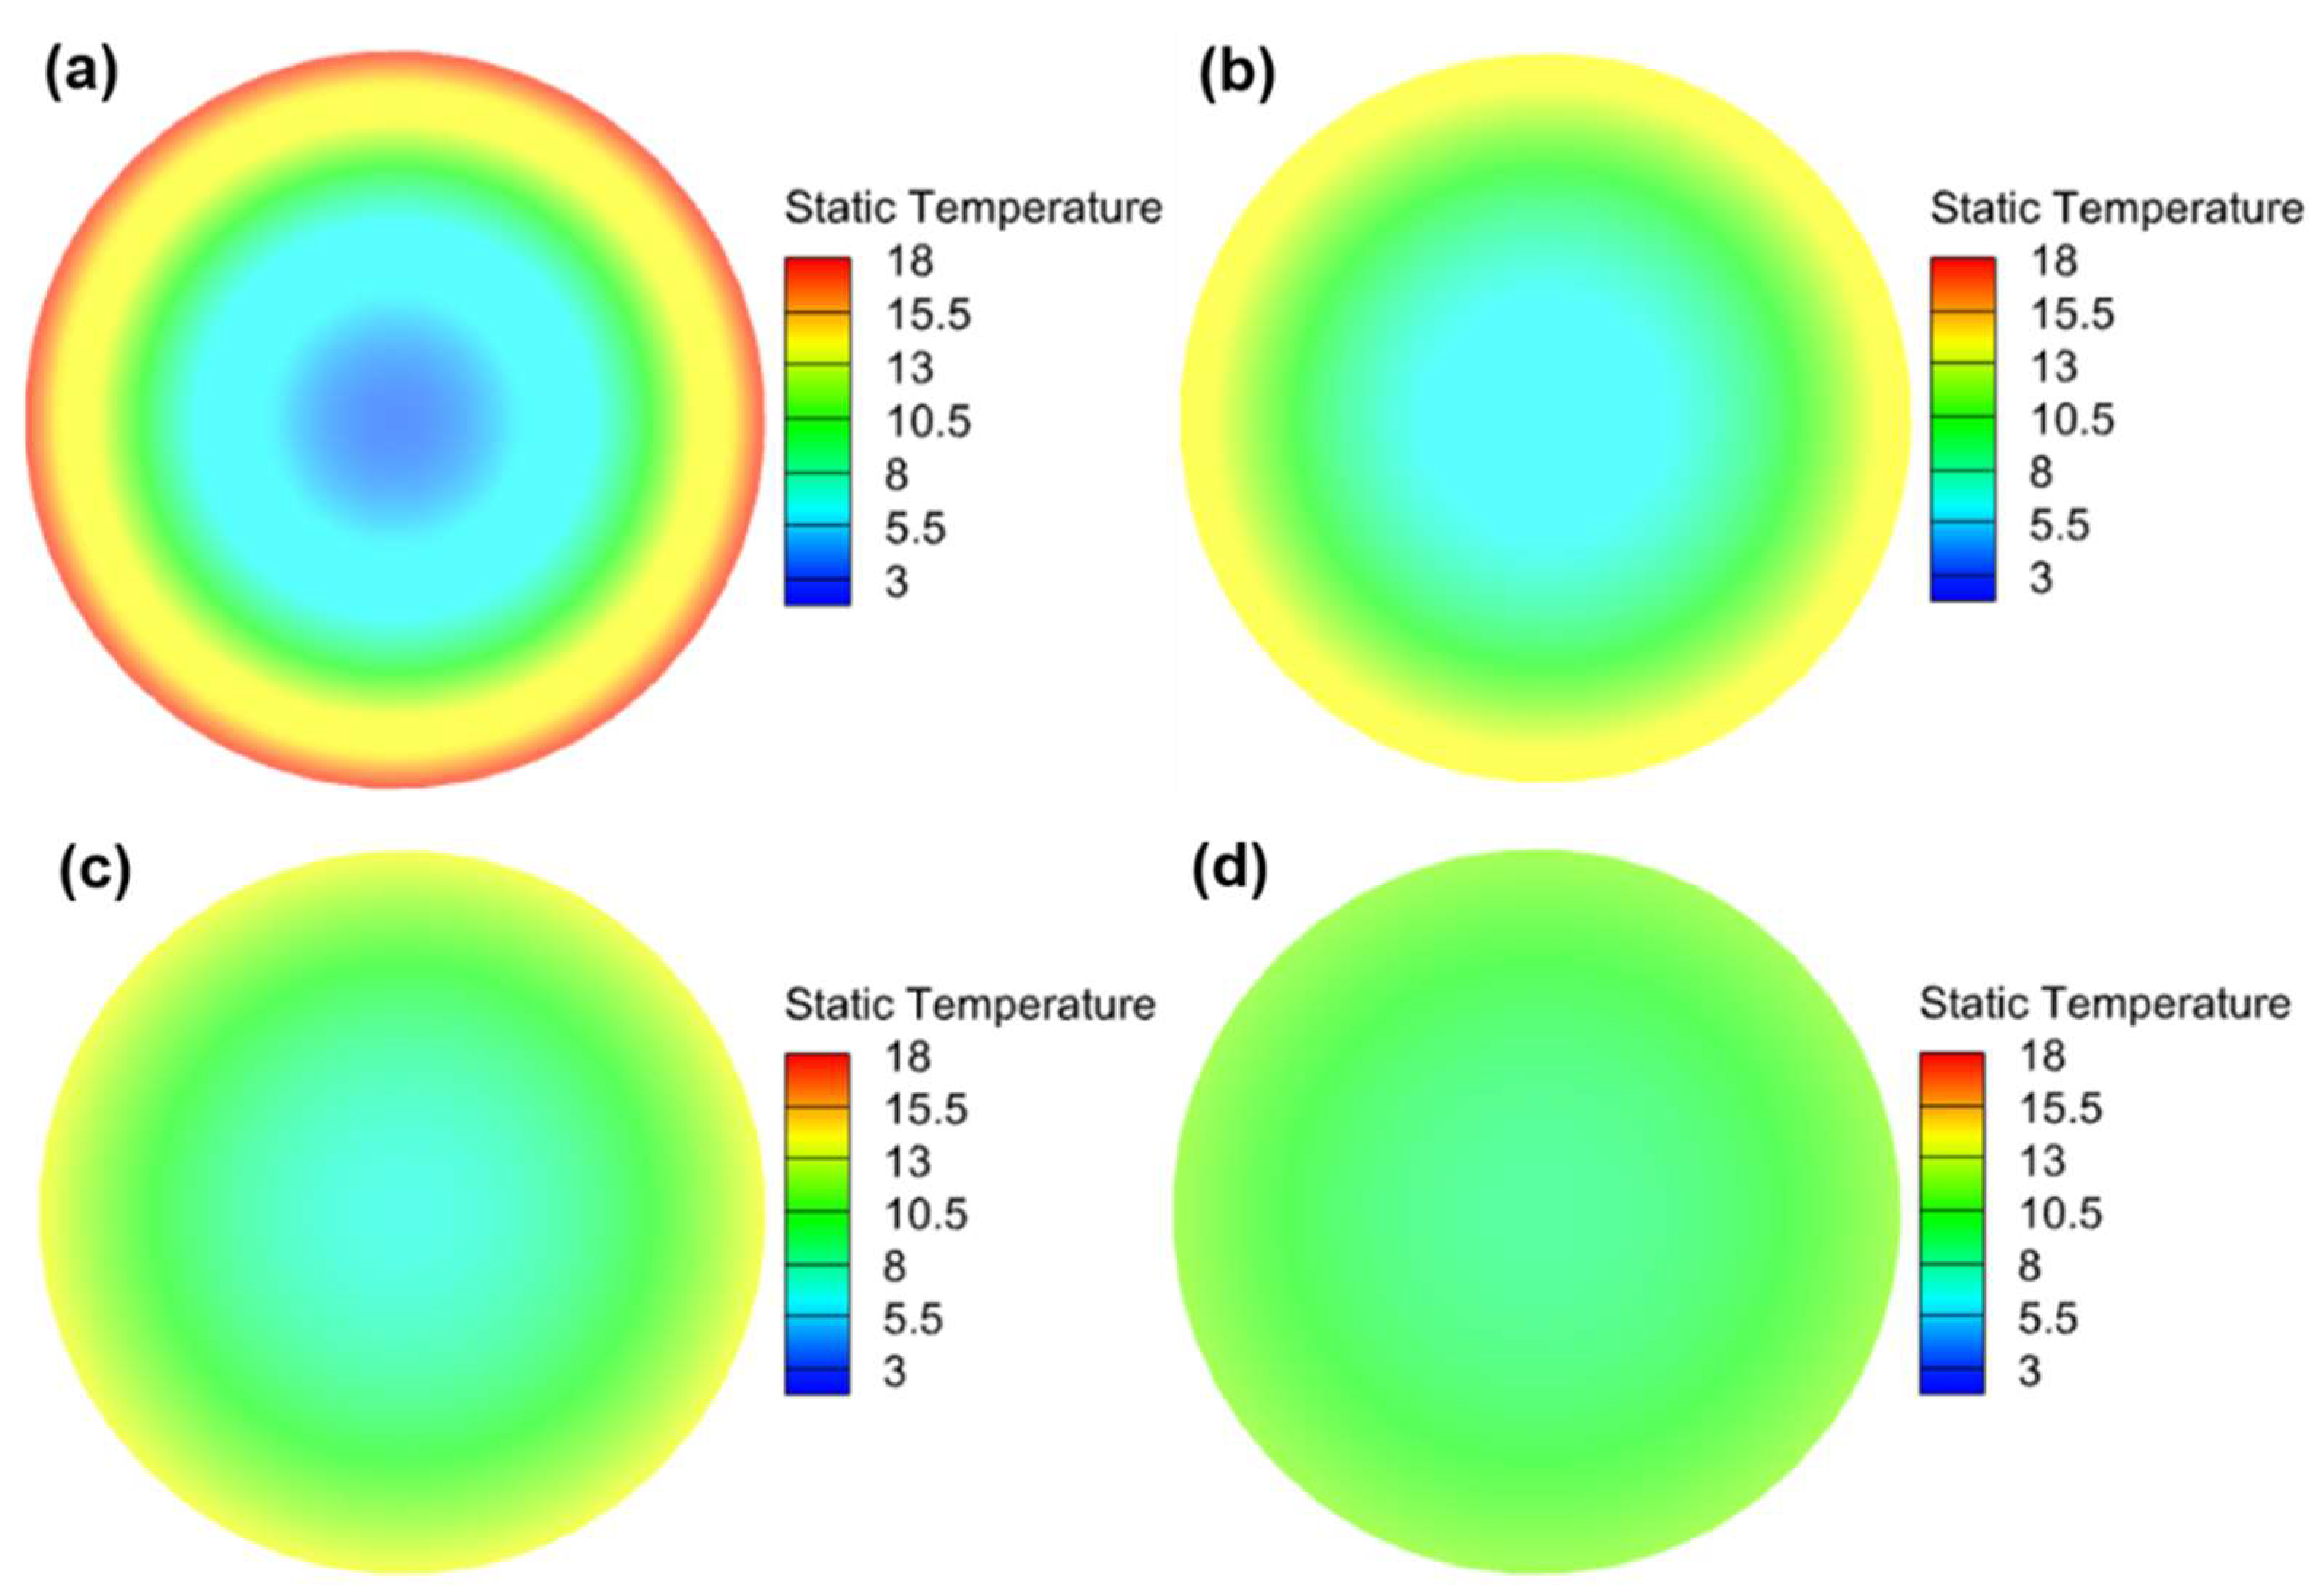
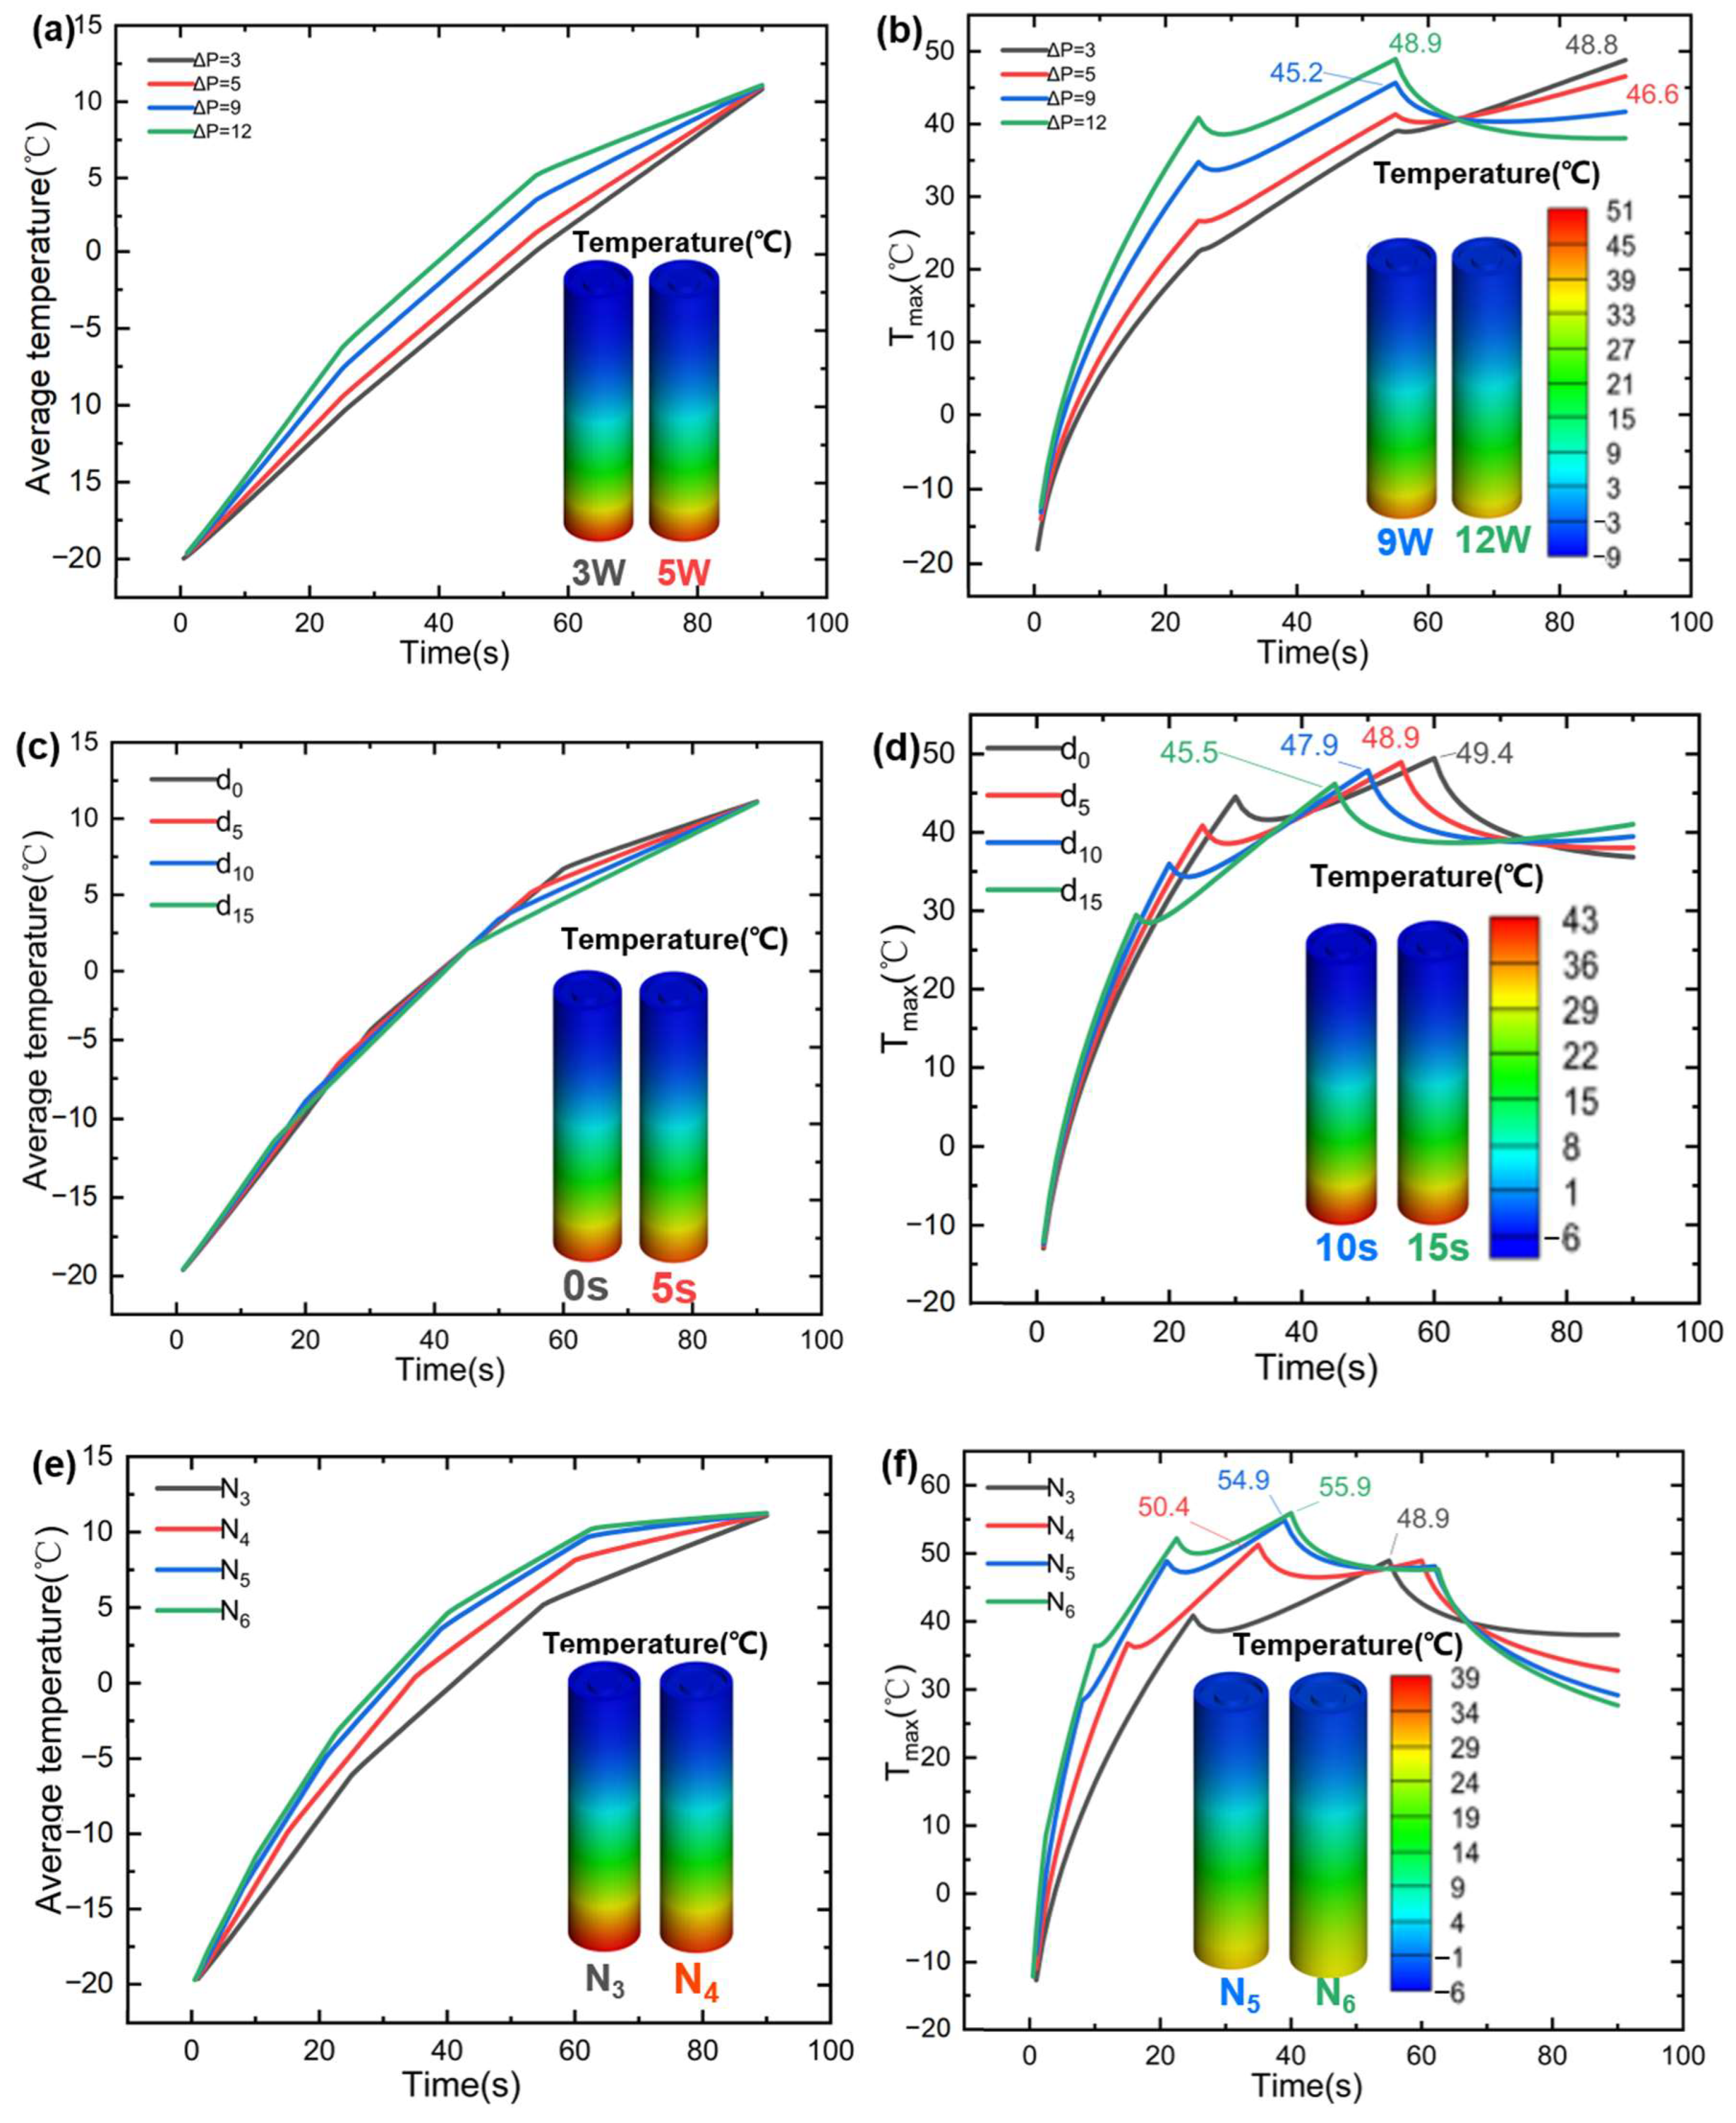
Most studies on low-temperature preheating ignore the problem of the battery’s energy balance; therefore, this paper selects the LCP preheating and HF preheating methods, which are more maturely applied in practice, to analyze the feasibility of low-temperature cold start of Li-ion battery from the standpoint of energy balance. The ECM, NTGK, and Newman models can be used as electrochemical models, and the Newman model, also known as the P2D model, provides a more complete reduction of the transport processes of lithium ions inside the electrode and electrolyte and the electrochemical reactions when the electrode particles are removed/inserted, and the calculated results are more accurate. However, parameters are hard to modify, and the calculation is sophisticated, both of which reduce the tool’s effectiveness. Therefore, this study models the lithium-ion battery in the electrochemical domain using the NTGK empirical model because of its simplicity, its easily modifiable parameters, and its high efficiency of numerical solution. Thermal modeling of Li-ion battery was performed within the MSMD framework to calculate the temperature and energy of Li-ion battery at various temperatures and discharge rates, and the model’s feasibility was tested experimentally. Following that, the parameters influencing the cell temperature uniformity of HF heating were investigated. Finally, the problem of precise temperature control encountered with conventional electric heating film heating was explored, and the variables and optimal level combinations that significantly affect the temperature difference and temperature rise rate were derived using an orthogonalization test method.

2. Materials and Methods

There are relatively few historical studies in the area of the energy balance of a lithium-ion battery when heated in a low-temperature environment. For this purpose, INR18650-25R power-type lithium-ion battery manufactured by Sony was chosen as our object. Voltage and temperature profiles of the lithium-ion battery were experimentally measured at various temperatures and different discharge rates to verify the feasibility of NTGK model. This power type lithium-ion battery is a good choice for comparing the discharge performance of battery below 0 °C at medium and low rates because of the LiFePO4 cathode material. The detailed physical parameters of this battery are tested and listed in Table 1.

2.1. Modeling Domain and Multi-Scale Modeling Schematic

Our studies in this paper investigate the necessity of insulating Li-ion battery at low temperatures and the applicability of various thermal management techniques; hence, the modeling concept is reduced to simulating a single 18650 Li-ion battery, that is, comparing the working conditions of natural convection, forced air cooling, or HF heating of the battery surface by giving the battery different boundary conditions, and then constructing a microchannel cold plate domain on the side of the cylindrical battery to simulate the LCP heating method. For the Li-ion single cell, its discharge process is first considered and divided into positive domain as tap_p, negative domain as tap_n, and cell domain as cell according to the MSMD modeling framework; the microchannel liquid-cooled heating cell model contains the positive domain, negative domain, and main body domain of the cylindrical cell, and the cold plate area contains the cooling aluminum plate domain and fluid domain. Each region is created independently and then combined into a whole by constraint or electrical connection, and the geometry and mesh required for the simulation are shown in Figure 1.
This article employs experimental observations to improve the fit of the battery temperature profile, as specific heat capacity is an essential parameter for the thermal properties of a battery. The internal structure of the cylindrical Li-ion battery consists of a stack of cells with positive electrode, diaphragm, negative electrode, and collector coiled together, so there is a multiplicative difference between the thermal conductivity in the radial direction and the thermal conductivity in the axial direction, and the anisotropic thermal conductivity, density, and specific heat capacity parameters of the battery are assumed to be the average parameters of the body in each domain to simplify the calculation and are listed in Table 2.
A high-quality grid was constructed for the cell based on its geometric model, and the number of grids corresponding to the closest multi-domain simulation was used for the computational results. The reaction mechanism of the Li-ion battery is mainly the electrochemical reaction occurring at the microscopic scale when the lithium ions are stripped/inserted at the electrodes and the transport process between the two electrodes, which is expressed as the heat production and energy output of the Li-ion battery at the macroscopic scale, so this multi-scale coupled model is a difficulty for the modeling. The MSMD is used to separate the modeling concept of the lithium-ion battery operation process into electrochemical field subscale and three-dimensional thermophysical field scale, which can predict its internal temperature and output voltage with reasonable accuracy. On the scale of the cell, the flux equation governing the reaction current is given as:
( σ + φ + ) = j  
( σ φ ) = j
where σ+ and σ are the effective conductivity; φ+ and φ are the phase potentials of the positive and negative electrodes. The microscale exothermic reaction equation and the macroscale heat production equation are connected by the bulk current density j, and their numerical magnitudes are calculated in the subscale electrochemical model. Both the cellular and electrochemical models collaborate to answer the temperature equation by predicting the current flow and providing the source term in the heat transfer equation.
Given its simplicity and widespread confirmation in the literature, the NTGK model was selected to fit the temperature and voltage data obtained from discharging a Li-ion battery at a constant temperature in this research. However, few people have set out to fit the voltage and temperature curves of Li-ion battery at different starting temperatures at low temperatures. Although the NTGK model couples the temperature parameters in the coefficient equations U(DOD) and Y(DOD), the electrochemical reactions inside the Li-ion battery still cannot receive real-time and accurate temperature feedback on the electrochemical reactions. As a result, keeping a tight fit between the discharge and temperature curves across a wide range of temperatures is challenging.

2.2. NTGK Model and Conjugate Heat Transfer Model

According to the NTGK model, the volumetric current transfer density j is directly related to the phase potential. The following equation gives the relationship between the volumetric current flow and U, Y fitting coefficients, electrode layer specific area α, and phase potential:
j = α Y [ U ( φ + φ ) ]  
As fitting coefficients, U and Y are functions of the depth of discharge (DoD) of the lithium-ion battery.
D o D = V o l 600 Q T ( 0 t j d t )
where Vol is the battery volume and QT is the battery capacity in Ah. The voltage response curves of Li-ion battery at varying rates can be measured experimentally for a given battery type, and then the experimental data can be fitted by parameter adjustment of the U and Y functions in Fluent. In this study, the variation of U and Y model parameters as a function of depth of discharge (DoD) is as follows:
U = ( n = 0 5 a n ( D o D ) n ) C 2 ( T T r e f )
Y = ( n = 0 5 b n ( D o D ) n ) exp [ C 1 ( 1 T 1 T r e f ) ]
where C1 and C2 are the coefficients of the NTGK model, indicating the influence of temperature on the feedback related to the battery voltage performance, and Tref is the reference temperature. The fitted parameters of U and Y adjusted by parameters in this paper are as follows:
U = 4.14 1.19 ( D o D ) + 2.51 ( D o D ) 2 8.75 ( D o D ) 3 + 12.56 ( D o D ) 4 6.92 ( D o D ) 5 + 0.0065 ( T T r e f )
Y = [ 33.77 + 97.63 ( D o D ) 677.83 ( D o D ) 2 + 2541.80 ( D o D ) 3 4100.23 ( D o D ) 4 + 2280 ( D o D ) 5 ] exp [ 1300 ( 1 T 1 T r e f ) ]
There is a fair agreement between the simulated and actual data for the voltage and temperature of the Li-ion battery at different discharge rates at 22.4 °C, as shown in Figure 2a,b, but at 3C and 4C high rates, the over-consideration of the temperature effect on the voltage leads to higher voltage prediction in the first half than the experimental value. The graph in Figure 2c predicts the voltage variation curves with time for 1C discharging of the battery at different temperatures, and there is good agreement in the magnitude of energy discharged as in Figure 2d, the magnitude of capacity and the trend of voltage variation in the middle and late stages, except for the drawback that the voltage does not clearly show the rising trend with temperature in the initial section at low temperatures because of the limitation of NTGK model.
The electrochemical heat source equation within the NTGK model cell is defined as:
q E C H = j [ U ( φ + φ ) T d U d T ]
where j [ U ( φ + φ ) ] represents the irreversible heat source term generated by the overpotential and j T d U d T represents the reversible entropic heat source term. Together with the ohmic heat source term in the cell, the total volumetric heat source qECH can be expressed as:
q E C H = j [ U ( φ + φ ) T d U d T ] + σ + φ + φ + + σ φ φ
Newton’s equation for cooling is used to describe the process of heat transfer between the cell and the surrounding air:
q h = h ( T s T )
where qh expresses the heat flux on the battery surface, h is the coefficient of heat transfer between the battery surface and air, Ts denotes the temperature of the cell surface, and T shows the ambient air temperature.
A thinner heating film is used in the simulation work according to the literature [40] and a high thermal conductivity silicone coating is utilized so that the heating film can be considered as the bottom surface of the battery, i.e., the energy of the heating film can be ideally absorbed by the battery in its entirety. Its boundary conditions can be expressed as:
k T | z = q
k is the thermal conductivity, q is the heat flux at the boundary, calculated from P/A, P is the heating power of the heating film, and A is the heating area at the bottom of the cell. T | z represents the temperature rise at z from the bottom of the cell.
For the modeling of the LCP-heated Li-ion cell, the mass conservation equation, the N.S. equation, and the temperature convective diffusion equation were applied to the flow of coolant (hot water) in the flow channel, while the heat conduction equation with no heat source term was used in the aluminum cooling plate. This paper is interested in exploring whether 18650 single cell battery can release as much or more energy after consuming heating energy to achieve energy balance, for how to improve the effect of a certain heating method is not the focus of this paper. Therefore, for the given parameters, such as heating power of HF and coolant inlet temperature and flow rate of LCP, it is only for comparing the temperature rise effect and energy consumption magnitude of the two heating methods. In this research, the three-dimensional geometry was modeled in SolidWorks, and the electrochemical and thermal fields were simulated in ANSYS FLUENT. Both the initial cell temperature and the surrounding environment temperature are set to a cold −20 °C. In both heating strategies, for common insulation materials such as polyurethane, which has a heat transfer coefficient of about 0.5 W/(m2·K), this paper takes a more ideal value of 0.1 W/(m2·K) to highlight the impact of insulation on the performance of lithium battery. The heat transfer conditions at the cell boundary without insulation are simulated as natural convection, and the heat transfer coefficient is taken as 10 W/(m2·K) [41]. The heating power of HF is 60 W and the heating is completed in 90 s. The LCP heats the cell at the same time, the inlet velocity of hot water is set to 1 m/s, the inlet temperature is 20 °C or 30 °C, and the fluid flows in the microchannel inside the cold plate. The time step used in Fluent software to simulate the heating effect of the two heating strategies is 1 s, 10 s is used to calculate the time step for battery discharge, and the maximum iteration step is 20.

3. Results and Discussion

3.1. Necessity of Heating and Thermal Insulation

Under cold conditions, the outputs and discharge capacities of lithium-ion batteries decrease dramatically. Preheating the battery to temperatures above 0 °C using various thermal management techniques will alleviate these issues, but strong convection conditions will still rapidly dissipate the heat of Li-ion battery. In this section, the effects of insulation treatment and heating temperature on the discharge performance of Li-ion battery are explored in order to maintain the ideal temperature of Li-ion battery after cold start. The heat transfer coefficients of 10 W/(m2·K) and 0.1 W/(m2·K) simulate the battery heat transfer boundary conditions under forced convection and insulation conditions, and according to the temperature control idea of two-phase submerged liquid cooling under fluorinated liquid proposed by Li et al. [41,42], i.e., directly submerging the Li-ion battery stack in fluorinated liquid to achieve the purpose of controlling its high temperature at high rates of charging and discharging at high temperatures, this chapter’s prediction of low temperature under two boundary conditions on the discharge performance of lithium-ion monolithic battery can serve as a benchmark for the development of an all-season thermal management concept.
The discharge rate of 0.5C of a single-cell Li-ion battery simulates the application scenario of a cold start of an electric car during a commuting traffic congestion in chilly weather. It can be observed that heating for 75 s can increase the battery starting voltage by 0.2 V from the voltage curves in Figure 3 for the two heat exchange boundary conditions. When forced convection is used for heat exchange, the heat generation power of Li-ion battery is very small due to its 0.5C discharge, and the energy preheated by HF will be rapidly dissipated at the early stages of battery operation. In contrast, thermally shielded Li-ion battery can cause a temperature increase since the discharge began, which improves the gradient between the voltage plateaus at various starting temperatures. Compared with the situation when h is 10 W/(m2·K), the lithium-ion battery can be heated for 90 s under the insulation condition to keep the temperature in the better temperature range of 10 °C~16.4 °C throughout the running process, and the better running temperature makes the lithium-ion cell output energy increase by 10.3% and capacity increase by 5.6%.
The temperature difference generated inside the Li-ion battery at the end of operation is not significant because this paper assumes that the Li-ion battery operates in a uniform temperature field and chooses the average battery temperature after HF heats the battery from the bottom as the cold start temperature. This is demonstrated by the contour diagram of the Li-ion battery discharge temperature at 0.5C after heating for 90 s in Figure 4 The internal temperature differential induced by the battery discharge is not covered in depth later, since it is insignificant in comparison to the heat produced by the lithium-ion battery discharge.
The C-rate in Figure 5 stands for the speed at which an electric vehicle will run for most of its operating time after a cold winter start. With the same settings, the lithium-ion cell’s capacity to generate heat increases at 1C discharge rate. Because lithium-ion cells are temperature-sensitive, the thermal gain brought on by appropriately raising discharge current can increase the amount of energy they can produce. As shown in Figure 5a, the voltage curve of the battery under 1C, the voltage plateau under different heating time decreases significantly more slowly than that under 0.5C. Because the ohmic heat generation power is greater than the heat dissipation power, when the heat exchange condition is forced convection, the heat generated by the lithium-ion cell with higher operating temperature dissipates at a slower rate. Surprisingly, the temperature of the cell with preheating time after 15 s tends to rise. The discharge characteristics and temperature characteristics of the Li-ion cell with insulation are similar to those at 0.5C. The difference is only that the temperature rise rate of the Li-ion cell becomes larger at 1 C, which brings a slight gain in capacity and average power to the Li-ion cell. Since the higher C-Rate increases both the average output power and the internal voltage loss, there is not much change in the magnitude of the discharge energy of the battery at 1C.
The intention of Figure 6 is to simulate application scenarios such as overtaking, hill climbing, and driving onto the highway after a cold start of an electric vehicle. Since the resistance of Li-ion battery becomes larger at low temperatures, a large C-Rate discharge tends to make the battery generate huge heat fast, which is beneficial for Li-ion battery at low temperatures. However, high C-Rate operation at low temperatures will increase the voltage loss of Li-ion batteries. As shown in Figure 6a’s discharge voltage curve, the start-up voltage loss of Li-ion cell is 4.75% compared to 0.5C discharge after heating for 90 s. In spite of this, the lithium-ion cell is still capable of maintaining the entire discharge process operating above 0 °C after preheating for 90 s, which explains that the gain from the increase in temperature compensates for the disadvantage of capacity reduction due to low temperature and high C-Rate discharge. After insulating the surface of the cell, preheating it for 90 s allows the lithium-ion cell to work within a very desirable operating temperature range, this means that EVs can drive farther on the highway. However, it is frightening that higher discharge rates or bigger capacity Li-ion battery, such as series-parallel battery packs, may approach 40 °C or even 60 °C at the conclusion of discharge. This will not only drastically lower their power output, but even lead to thermal runaway.
For electric cars that often run in cold weather, the lithium-ion battery has a violent heat exchange with the cold air while the car is moving. Without insulation treatment, the battery module needs a high C-Rate to keep a reasonable operating temperature range. However, a continuous high C-Rate discharge at low temperature will cause problems like voltage loss and a shorter discharge time. On the contrary, the insulation treatment can improve its mileage reduction issue very well. At 0.5C, the battery cell after 90 s of preheating can be kept at a temperature above 10C for operation, and the energy and capacity discharged will be increased.

3.2. Effect of Heating Method

In this part, we investigated the insulation case’s heating performance for the EV rapid cold start scenario. The simulation employs hot water as the heat transfer fluid in the micro-runner of the aluminum plate, with LCP attached to the side of the cylindrical cell to fully contact the cell. HF is placed at the bottom of the cell to take advantage of the larger axial thermal conductivity of the cylindrical cell to heat the cell to the preset temperature in the shortest possible time. The heating conditions of HF and LCP are listed in Table 3.
Figure 7 depicts the temperature rise curves of the battery following 90 s of heating with two distinct heating procedures. Overall, 20 W heating power of HF is comparable to the heating capacity of LCP with 1 m/s flow rate and inlet temperature of 30 °C hot water, which can raise the average temperature of the battery by 30.9 °C in a relatively short period of time, with a temperature rise rate as high as 26.7 °C/min. However, one thing to watch out for is the common problem of direct contact heating, which means that both heating methods, even though they raise the temperature quickly, can cause a big difference in temperature inside the cell unit, as shown in Figure 8, which illustrates the distribution of cell surface temperatures at various heating times. It is easy to comprehend that such a high heating rate necessitates a heat source with a large heating power to maintain, so despite the choice of the axial direction to preheat the battery with excellent thermal conductivity, the battery still cannot diffuse the heat conducted by HF/LCP to the battery in a short enough time, resulting in the continuous accumulation of heat locally in the battery, thereby accelerating the decline of the cycle life of the Li-ion cell. Contrary to HF, the temperature difference created by LCP heating is less severe, but it is still substantially higher than the standard of 5 °C for single cell temperature difference, and the temperature gradient inside the cell will increase as the inlet temperature of hot water increases.

3.3. Analysis of Energy Balance of Li-Ion Cell When Cold Starting

This chapter’s objective is to examine the ideal cold start temperature of a Li-ion cell and to analyze the cell’s energy balance during cold start. In practice, LCP heating is designed for Li-ion battery modules, and the use of PTC electric heating elements can save time and economic cost. Consequently, the HF heating method was selected in this subsection to examine the energy output rule of the Li-ion battery at varied starting temperatures with insulation, and the computed results are shown in Table 4.
First of all, it is important to mention that in this paper, the thermal resistance between the heating film and the battery is ignored, so the energy of the heating film is considered to be fully absorbed by the battery. According to the formula energy E = Pt = mCp (T − Tinit), where P and Tinit are the heating power of the heating film and the initial temperature of the cell, both are constant values, and t is the heating time. Therefore, energy consumption E ∝ t ∝ mCp (T − Tinit)/P, so it is concluded that energy consumption is a linear function of temperature as depicted by the red discounting in Figure 9b. The energy consumption values in Table 4 are determined according to equation E = Pt. The parameter t is the time required for the heating film to heat the average cell temperature to the cold start temperature, obtained from the simulation results; P is a constant 20 W heating film power.
As depicted in Figure 9a, when the energy demand for heating is met by external energy sources, the discharge energy of the Li-ion battery initially increases as the beginning temperature of the battery discharge rises, and then drops after reaching a maximum between 30 °C and 40 °C. When the energy of heating the cell is from the leftover capacity of the Li-ion cell itself (in this paper, we assume that the SOC of the cell is 100% at cold start), whether heating can bring about an increase in energy is highly correlated with the degree of temperature dependence of the Li-ion cell. For this reason, we define the coefficient of determination C:
C = ( Q T E T ) Q 20
where QT is the energy released by the battery when the starting temperature is T; Q−20 is the energy released by the battery when the starting temperature is −20 °C. ET is the energy consumed to heat the battery to temperature T. (QTET) represents the net energy released by the battery. When C is greater than 1, it means that the single cell energy can use its own energy to make itself fast cold start, and the heating film heating brings positive gain to the lithium-ion battery. When C is less than 1, it means that the heating makes the battery energy increase less than the heating energy consumption.
As shown in Figure 9b, the net output energy of the cell was found to increase (e.g., −20 °C to 30 °C at 0.5C), which means that the energy balance coefficient is C > 1, indicating that the rate of gain of energy brought by HF heating to the Li-ion battery simulated in this paper is faster than the rate of heating power consumption. Nevertheless, heating above a certain temperature will reduce the amount of energy released by the lithium-ion battery, and the power of HF heating is also regarded as additional energy consumption. In addition, with a higher rate of lithium-ion battery discharge at the same temperature, more energy is released from the battery, as discussed in the previous section. In summary, when a Li-ion battery is cold-started, not only do they need good insulation to prolong the discharge time, but they also need to identify the appropriate starting temperature for it to discharge energy to its maximum.

3.4. Optimization of HF Heating Uniformity

A quick cold start of a Li-ion battery requires the battery to absorb heat in a short period of time. Prior simulation results have demonstrated that high-power HF heating places the battery into its optimal operating temperature range. Contrary to the BTMS principle, this leads in significant internal unevenness due to the constraint of axial heat conductivity. Consequently, it is necessary to identify a way for increasing the internal temperature differential of the battery when using HF heating.
According to Table 5, it can be seen that most of the materials inside the Li-ion battery have a large axial thermal conductivity. The value of the average thermal conductivity in the axial direction of the cell can be reasonably taken on the assumption that the cell is filled with different types of electrolytes inside, such as the value of the thermal conductivity in the axial direction of the cylindrical stack estimated in the literature [44] between 66–72. Therefore, the actual value of 35 W/(m·K) and the ideal value of 80 W/(m·K) are selected in this section, as well as two axial thermal conductivities between 35 and 80 that can be obtained in practice.
In the event that the heat flux delivered by HF and the heating period are fixed, and the battery is heated from the same initial temperature, when the value of axial thermal conductivity increases from 35 to 80, for instance, the maximum temperature differential inside the battery may be lowered by 31.9 °C, while the maximum temperature can be reduced by 21.8 °C. The effect of this approach in reducing the temperature difference is quite noticeable. It can be explained from the surface temperature distribution of the cell after heating, as shown in Figure 10, that the cell with greater axial thermal conductivity has a better thermal diffusion capability so that the cell can promptly move the heat accumulated at its bottom to the low temperature region, even under the boundary condition of much larger heat flux. As the thermal conductivity value rises from 35 to 80, the axial temperature gradient falls from 0.95 K/mm to 0.46 K/mm as shown in Figure 11a,b. These are the gains in battery life and safety from increasing thermal conductivity.
Keeping the heating energy consumption constant, properly extending the heating period of HF, and decreasing the heating power are other ways to increase the battery’s safety and longevity. Figure 12 illustrates the battery temperature curve and surface temperature distribution for various heating times (heating power). As noticed from the temperature curve, the temperature differential inside the battery reaches its greatest value during the first 100 s of heating, and thereafter remains nearly constant. After 1.5 min of heating (heating power of 20 W), a significant temperature differential develops between the top and bottom of the battery because the battery can only disperse a tiny portion of the heat produced at the bottom to the upper part of the battery. When the heating time is increased to 10 min (heating power is 3 W), the temperature difference inside the battery decreases dramatically from 61.9 °C to 10.3 °C, and the internal temperature distribution becomes more uniform (as shown in the temperature gradient diagram of the axial direction of the battery in Figure 13); this is true even though the axial thermal conductivity of the battery remains the same. The highest temperature gradient in the axial direction is only 0.3 K/mm. Therefore, sacrificing some waiting time to reduce the heating power of HF could produce a better temperature uniformity.
In addition to the two methods mentioned above, reducing the heat flux at the contact surface by simply increasing the area heated of HF may also be a solution to the dilemma. This part simulates the heating law of the inner four heating hours in 3 min, and the corresponding heating power is reduced from 60 W to 7.5 W while holding the heating power consumption and other parameters constant. This is illustrated in Figure 14. Similarly, the temperature trend exhibits the same regulation as the axial heating within the initial heating period, i.e., the temperature difference rises to the maximum temperature difference corresponding to the radial heat diffusion capacity and then remains basically the same. Undoubtedly, the longer the heating time (the lower the heating power), the smaller the temperature difference and the maximum temperature as illustrated in Figure 15. For the same 90 s (15 W) heating condition, the maximum temperature difference inside the battery can be reduced by 91.8% with the side heating method, which is basically complying with the design concept of BTMS and fast cold start.

3.5. MSP Heating Protocols for HF

In practice, a temperature measurement point is usually placed at the axial midpoint of a cylindrical cell, and the monitored temperature represents the average temperature of the cell. However, with high-power heating, when the temperature of the monitoring point is close to the pre-set temperature, even if the heating is halted immediately, the temperature at the monitoring point will still have a rising ‘inertia’, making it tough to accurately end the temperature at the set temperature. This chapter offers a multi-stage stepped power (MSP) heating protocol that permits the HF to progressively decrease the power, hence limiting the temperature rise rate to a bearable range for a length of time before the heating is complete. Here, we define a parameter δ for the rising rate of cell temperature, unit is °C /min.
During the heating time of 90 s, according to the purpose of MSP heating, three variables closely related to the temperature rise rate and temperature difference are discussed, namely, the power step gradient ΔP, the time stepped gradient of each stage d, and number of heating stages N. Each parameter is set in an equivariant series (gradient is a constant) rule, assuming that the energy consumption of HF is constant. This simplifies the calculations. For example, N3 indicates that the total heating time of 90 s is divided into 3 sub-time intervals; d4 refers to the heating time of each stage in a 4 s gradient increment or decrement; ΔP5 denotes a power stepped gradient of 5 W. To evaluate how to design the variables so that the battery temperature rise rate falls within an acceptable range, it is required to assess the effect of the three elements on the battery’s temperature rise rate and temperature uniformity.
Figure 16 shows the effect of the three parameters on the average and maximum temperature patterns throughout the heating process, keeping the other two parameters constant when investigating each parameter. It must be noted that the curves should focus on the improvement effect brought by the different variables taken to make the average temperature slope and the maximum temperature value. For the last stage of the temperature rise rate, the effects of the power step gradient and the number of heating stages are more significant, as shown in Figure 16a,b. Taking into account the use of high power heating film for fast cold start up where it is also necessary to prevent the temperature from getting too high, for the highest temperature generated during the heating process, as shown in Figure 16d–f, the effects of the power step gradient and the number of heating stages are more significant.
To explore how much the three variables ΔP, d, and N affect the heating temperature difference and temperature rise rate, an equal level orthogonal test scheme with three factors and four levels (L16(43)) without interaction in the literature [47] was employed in this section to investigate the regularity of their effects on the heating effect and to find the level combinations that allow the best temperature control simplicity and heating safety. The set-up of the parameter working conditions satisfies the standard orthogonal table, so no further blank error columns were established, as shown in Table 5. The choice of parameters was based on the previous section, since the heating energy consumption needs to remain the same, and the range of variation of the three parameters is extremely limited, the orthogonal working conditions are shown in Table 6. The indexes used for the analysis are the temperature rise rate of the cell in the last heating phase δ and the maximum temperature difference ΔT. The variation of heating power and heating time for the different phases of the orthogonal design MSP method is defined by the Profile file in Fluent. The obtained simulation results are used to calculate the temperature rise rate δ in the last heating stage, whose value is determined by the ratio of the temperature rise of the cell in the last heating interval to the heating time. The calculated data were based on ultimate variance analysis equations to confirm the degree of influence of the parameters:
φ i j = j = 1 Δ T m a x i j   or   φ i j = j = 1 δ i j
ϕ i j = φ i j n
R j = m a x ( ϕ 1 j ) m i n ( ϕ 1 j )
where φij is the sum of four temperature differences and four average temperature rise rates at the same level, ϕj is the average of each factor at the same level, n is the number of levels of each factor, and Rj is the range of values of ϕj, which can indicate the degree of influence of the factors. The larger Rj is, the more significant the influence of the factor on δ and ΔT. Experimental results and analysis are shown in Table 7 and Table 8.
We can see from the calculated results that the order of the three variables in the MSP heating method on ΔT is ΔP > d > N, and the order of the influence on δ is ΔP > N > d. It follows that the power step gradient is the most significant factor affecting the temperature rise rate and temperature difference. According to the analysis of the orthogonalization simulation results, the parameter configuration ΔP2d4N1 can achieve the optimal temperature difference inside the cell monolith, which can be reduced by 3.64 °C compared with direct heating, and the parameter configuration ΔP4d1N4 can achieve the optimal temperature control operability, i.e., the temperature rise rate of the final heating period can be reduced from 20.6 °C /min to 4.24 °C/min.
Taking the mean value of the level combinations when the temperature difference and temperature rise rate are optimized, respectively, as the parameter combinations obtained from the orthogonal test optimization, that is, the heating condition with a heating time gradient of 2.5 s and stepped power gradient of 5 W in each stage. Considering that the average value of the number of heating stages is not an integer, N4 and N5 were taken approximately, and the results of the experiments were compared. The simulated results show that at N5, the Tmax of the heating process is reduced by 4.09% and the temperature rise rate is reduced by 40.53% compared to direct heating. The simulation and orthogonalization results show that high power heating film can provide an average temperature rise rate of 20.6 °C/min under insulated conditions, better than the 4 °C/min provided by the wide-limit metal film [48], the 12.9 °C/min temperature rise provided by the PCM preheating method [49], and the 6.5 °C/min provided by AC heating [50]. In addition, the MSP heating method allows the heating film to reduce the temperature rise rate to 14 °C/min for a period of time near the end so that the temperature can be easily stopped at a preset temperature.
Following the discussion of HF heating-uniformity in the previous paper, it can be applied to the PTC preheating BTMS before the cold start of EV or the charging and discharging of electronic devices under cold conditions, which can not only improve their performance or safety but also control the temperature precisely and save energy.

4. Conclusions

To predict the discharge performance and heat production characteristics of 18650 Li-ion cell at different temperatures, this paper uses a multi-scale multi-domain (MSMD) approach to model it, with NTGK model applied at a sub-scale to describe the electrochemical characteristics of Li-ion cell. Based on the experimental measurement data, the feasibility of the model is verified in a wide range of temperature and C-Rate from the perspective of curve trend and output energy magnitude. The performance of lithium-ion cells at low temperature and the practicality of different heating methods are explored using the constructed model, and the following conclusions are drawn.
Insulation can improve the discharge performance and energy output of lithium-ion cells. At low temperature, insulation can prevent the heat dissipation of lithium-ion battery in operation, so that the battery discharged at 0.5C rate can increase energy by 10.3% and capacity by 5.6% after preheating for 90 s. However, temperatures above 40 °C will reduce the energy discharged from the battery.
The heating effect of HF with 20 W heating performance is comparable to that of LCP with 30 °C and 1 m/s hot water, with a temperature rise rate as high as 26.7 °C/min. However, regardless of the heating strategy, due to the limitation of heating power and time, it will cause great temperature inhomogeneity inside the battery, especially in the case of HF, and the maximum single temperature difference of 61 °C inside the cell is suspected to cause a safety accident in Li-ion cell. The temperature uniformity of LCP heating is slightly better, but still does not reach the temperature difference limit standard.
The energy balance of lithium-ion battery at low temperature was explored by heating with HF. The energy output of Li-ion cell shows a parabolic trend of first increasing and then decreasing with the increase of starting temperature, and the energy peak becomes higher with the increase of C-rate, corresponding to the higher starting temperature. The simulation results indicate that in the temperature range corresponding to the energy increase of Li-ion battery, the heating energy consumption rate is less than the rate of energy increase of the battery, and the net output energy increase of Li-ion battery can be achieved by 20 W HF heating.
For the poor uniformity of HF heating, the impacts of increasing the axial thermal conductivity of the cell, extending the heating time (reducing the heating power), and increasing the heating area on the internal temperature difference of the cell were investigated. While maintaining the same heating energy consumption, the incremental thermal conductivity of 45 W/(m·K) can reduce the maximum temperature difference inside the cell by 21.8 °C. Extending the heating time by 9 min (reducing the heating power to 3 W) can sharply reduce the internal temperature difference from 61.9 °C to 10.3 °C, and replacing the bottom heating with the side heating can reduce the maximum temperature difference by 91.8%.
In the practical application of high-power heating, it is difficult to control the temperature at the monitoring point to the pre-set value. This paper proposes an MSP heating method, and investigates the effects of power step gradient, step gradient of heating time in each stage, and the number of heating stages on the temperature difference and temperature rise rate in 90 s heating time. The orthogonalized experimental design with equal levels of three factors and four levels was used to derive the optimal combination of levels. Our findings suggested that the highest temperature at the end of heating was reduced by 4.09% and the temperature rise rate was reduced by 40.53% compared to direct heating when the heating condition was used with d of 2.5 s, ΔP of 5 W, and N of 5.

Author Contributions

Investigation, H.H., X.L. and Z.H.; Formal analysis, H.H. and Z.Z.; Software, L.G. and Y.L. (Yang Li); Supervision, Y.L. (Yubai Li) and Y.S.; Writing—original draft, H.H.; Writing—review & editing, H.H., Y.L. (Yubai Li) and Y.S. All authors have read and agreed to the published version of the manuscript.

Funding

This research is funded by the National Natural Science Foundation of China (Grant No. 52106226, 51876027, 52176058) and the Fundamental Research Funds for the Central Universities, China (DUT20RC(3)095, DUT20JC21).

Data Availability Statement

Not applicable.

Conflicts of Interest

The authors declare no conflict of interest.

References

  1. Baskov, V.; Ignatov, A.; Polotnyanschikov, V. Assessing the influence of operating factors on the properties of engine oil and the environmental safety of internal combustion engine. Transp. Res. Procedia 2020, 50, 37–43. [Google Scholar] [CrossRef]
  2. Scrosati, B.; Garche, J. Lithium batteries: Status, prospects and future. J. Power Sources 2010, 195, 2419–2430. [Google Scholar] [CrossRef]
  3. Goodenough, J.B.; Park, K.-S. The Li-Ion Rechargeable Battery: A Perspective. J. Am. Chem. Soc. 2013, 135, 1167–1176. [Google Scholar] [CrossRef]
  4. Patil, M.S.; Panchal, S.; Kim, N.; Lee, M.-Y. Cooling Performance Characteristics of 20 Ah Lithium-Ion Pouch Cell with Cold Plates along Both Surfaces. Energies 2018, 11, 2550. [Google Scholar] [CrossRef] [Green Version]
  5. Jindal, P.; Bhattacharya, J. Review—Understanding the Thermal Runaway Behavior of Li-Ion Batteries through Experimental Techniques. J. Electrochem. Soc. 2019, 166, A2165–A2193. [Google Scholar] [CrossRef]
  6. Ratnakumar, B.; Smart, M.; Surampudi, S. Effects of SEI on the kinetics of lithium intercalation. J. Power Sources 2001, 97–98, 137–139. [Google Scholar] [CrossRef]
  7. Zhang, S.; Xu, K.; Jow, T. Charge and discharge characteristics of a commercial LiCoO2-based 18650 Li-ion battery. J. Power Sources 2006, 160, 1403–1409. [Google Scholar] [CrossRef]
  8. Zhang, W.-J. Structure and performance of LiFePO4 cathode materials: A review. J. Power Sources 2011, 196, 2962–2970. [Google Scholar] [CrossRef]
  9. Petzl, M.; Kasper, M.; Danzer, M.A. Lithium plating in a commercial lithium-ion battery—A low-temperature aging study. J. Power Sources 2015, 275, 799–807. [Google Scholar] [CrossRef]
  10. Li, Z.; Huang, J.; Liaw, B.Y.; Metzler, V.; Zhang, J. A review of lithium deposition in lithium-ion and lithium metal secondary batteries. J. Power Sources 2014, 254, 168–182. [Google Scholar] [CrossRef]
  11. Fleischhammer, M.; Waldmann, T.; Bisle, G.; Hogg, B.-I.; Wohlfahrt-Mehrens, M. Interaction of cyclic ageing at high-rate and low temperatures and safety in lithium-ion batteries. J. Power Sources 2015, 274, 432–439. [Google Scholar] [CrossRef]
  12. Zhang, X.; Li, Z.; Luo, L.; Fan, Y.; Du, Z. A review on thermal management of lithium-ion batteries for electric vehicles. Energy 2021, 238, 121652. [Google Scholar] [CrossRef]
  13. Ji, Y.; Wang, C.Y. Heating strategies for Li-ion batteries operated from subzero temperatures. Electrochimica Acta 2013, 107, 664–674. [Google Scholar] [CrossRef]
  14. Wang, F.; Zhang, J.; Wang, L. Design of electric air-heated box for batteries in electric vehicles. Chin. J. Power Sources 2013, 37, 1184–1187. [Google Scholar]
  15. Hu, X.; Zheng, Y.; Howey, D.A.; Perez, H.; Foley, A.; Pecht, M. Battery warm-up methodologies at subzero temperatures for automotive applications: Recent advances and perspectives. Prog. Energy Combust. Sci. 2019, 77, 100806. [Google Scholar] [CrossRef]
  16. Chacko, S.; Charmer, S. Lithium-Ion Pack Thermal Modeling and Evaluation of Indirect Liquid Cooling for Electric Vehicle Battery Thermal Management, Innovations in Fuel Economy and Sustainable Road Transport; Woodhead Publishing: Cambridge, UK, 2011; pp. 13–21. [Google Scholar] [CrossRef]
  17. Al Hallaj, S.; Selman, J.R.; King, S.W.; Kern, R.S.; Benjamin, M.C.; Barnak, J.P.; Nemanich, R.J.; Davis, R.F. A Novel Thermal Management System for Electric Vehicle Batteries Using Phase-Change Material. J. Electrochem. Soc. 2000, 147, 3231–3454. [Google Scholar] [CrossRef]
  18. Li, G.; Huang, X.; Fu, X.; Yang, Y. Design Research on Battery Heating and Preservation System Based on Liquid Cooling Mode. J. Hunan Univ. Nat. Sci. 2017, 44, 26–33. [Google Scholar]
  19. Rao, Z.; Qian, Z.; Kuang, Y.; Li, Y. Thermal performance of liquid cooling based thermal management system for cylindrical lithium-ion battery module with variable contact surface. Appl. Therm. Eng. 2017, 123, 1514–1522. [Google Scholar] [CrossRef]
  20. Hirano, H.; Tajima, T.; Hasegawa, T.; Sekiguchi, T.; Uchino, M. Boiling liquid battery cooling for electric vehicle. In Proceedings of the 2014 IEEE Conference and Expo Transportation Electrification Asia-Pacific (ITEC Asia-Pacific), Beijing, China, 31 August 2014–3 September 2014; pp. 1–4. [Google Scholar]
  21. Saw, L.H.; Poon, H.M.; Thiam, H.S.; Cai, Z.; Chong, W.T.; Pambudi, N.A.; King, Y.J. Novel thermal management system using mist cooling for lithium-ion battery packs. Appl. Energy 2018, 223, 146–158. [Google Scholar] [CrossRef] [Green Version]
  22. Ping, P.; Peng, R.; Kong, D.; Chen, G.; Wen, J. Investigation on thermal management performance of PCM-fin structure for Li-ion battery module in high-temperature environment. Energy Convers. Manag. 2018, 176, 131–146. [Google Scholar] [CrossRef]
  23. Chopra, K.; Pathak, A.K.; Tyagi, V.; Pandey, A.; Anand, S.; Sari, A. Thermal performance of phase change material integrated heat pipe evacuated tube solar collector system: An experimental assessment. Energy Convers. Manag. 2019, 203, 112205. [Google Scholar] [CrossRef]
  24. Zhong, G.; Zhang, G.; Yang, X.; Li, X.; Wang, Z.; Yang, C.; Yang, C.; Gao, G. Researches of composite phase change material cooling/resistance wire preheating coupling system of a designed 18650-type battery module. Appl. Therm. Eng. 2017, 127, 176–183. [Google Scholar] [CrossRef]
  25. Bai, F.; Chen, M.; Song, W.; Feng, Z.; Li, Y.; Ding, Y. Thermal management performances of PCM/water cooling-plate using for lithium-ion battery module based on non-uniform internal heat source. Appl. Therm. Eng. 2017, 126, 17–27. [Google Scholar] [CrossRef]
  26. Mostafavi, A.; Jain, A. Dual-purpose thermal management of Li-ion cells using solid-state thermoelectric elements. Int. J. Energy Res. 2021, 45, 4303–4313. [Google Scholar] [CrossRef]
  27. Li, J.; Wu, P.; Zhang, C. Study and implementation of thermal management technology for the power batteries of electric vehicles. Automot. Eng. 2016, 38, 22–27. [Google Scholar]
  28. Kalogiannis, T.; Jaguemont, J.; Omar, N.; Van Van Mierlo, J.; Bossche, P.V.D.V.D. A Comparison of Internal and External Preheat Methods for NMC Batteries. World Electr. Veh. J. 2019, 10, 18. [Google Scholar] [CrossRef] [Green Version]
  29. Zhu, C.; Du, L.; Guo, B.; Fan, G.; Lu, F.; Zhang, H.; Liu, K.; Zhang, X. Internal Heating Techniques for Lithium-ion Batteries at Cold Climates: An Overview for Automotive Applications. IEEE Trans. Transp. Electrif. 2022. [Google Scholar] [CrossRef]
  30. Wang, C.-Y.; Zhang, G.; Ge, S.; Xu, T.; Ji, Y.; Yang, X.-G.; Leng, Y. Lithium-ion battery structure that self-heats at low temperatures. Nature 2016, 529, 515–518. [Google Scholar] [CrossRef]
  31. Yang, X.-G.; Liu, T.; Gao, Y.; Ge, S.; Leng, Y.; Wang, D.; Wang, C.-Y. Asymmetric temperature modulation for extreme fast charging of lithium-ion batteries. Joule 2019, 3, 3002–3019. [Google Scholar] [CrossRef]
  32. Wang, C.-Y.; Liu, T.; Yang, X.-G.; Ge, S.; Stanley, N.; Rountree, E.; Leng, Y.; McCarthy, B. Fast charging of energy-dense lithium-ion batteries. Nature 2022, 611, 485–490. [Google Scholar] [CrossRef]
  33. Ye, Y.; Huang, W.; Xu, R.; Xiao, X.; Zhang, W.; Chen, H.; Wan, J.; Liu, F.; Lee, H.; Xu, J. Cold-Starting All-Solid-State Batteries from Room Temperature by Thermally Modulated Current Collector in Sub-Minute. Adv. Mater. 2022, 34, 2202848. [Google Scholar] [CrossRef] [PubMed]
  34. Pesaran, A.; Vlahinos, A.; Stuart, T. Cooling and preheating of batteries in hybrid electric vehicles. In Proceedings of the 6th ASME-JSME Thermal Engineering Joint Conference, Hawaii Island, HI, USA, 16–20 March 2003; pp. 1–7. [Google Scholar]
  35. Li, J.-Q.; Fang, L.; Shi, W.; Jin, X. Layered thermal model with sinusoidal alternate current for cylindrical lithium-ion battery at low temperature. Energy 2018, 148, 247–257. [Google Scholar] [CrossRef]
  36. Zhang, J.; Ge, H.; Li, Z.; Ding, Z. Internal heating of lithium-ion batteries using alternating current based on the heat generation model in frequency domain. J. Power Sources 2015, 273, 1030–1037. [Google Scholar] [CrossRef]
  37. Sefidan, A.M.; Sojoudi, A.; Saha, S.C. Nanofluid-based cooling of cylindrical lithium-ion battery packs employing forced air flow. Int. J. Therm. Sci. 2017, 117, 44–58. [Google Scholar] [CrossRef]
  38. Patil, M.S.; Seo, J.-H.; Lee, M.-Y. A novel dielectric fluid immersion cooling technology for Li-ion battery thermal management. Energy Convers. Manag. 2020, 229, 113715. [Google Scholar] [CrossRef]
  39. Oehler, D.; Bender, J.; Seegert, P.; Wetzel, T. Investigation of the Effective Thermal Conductivity of Cell Stacks of Li-Ion Batteries. Energy Technol. 2021, 9, 2000722. [Google Scholar] [CrossRef]
  40. Zhang, J.; Liu, H.; Zheng, M.; Chen, M.; Zhao, L.; Du, D. Numerical study on a preheating method for lithium-ion batteries under cold weather conditions using phase change materials coupled with heat films. J. Energy Storage 2022, 47, 103651. [Google Scholar] [CrossRef]
  41. Kang, J.; Jia, Y.; Zhu, G.; Wang, J.V.; Huang, B.; Fan, Y. How electrode thicknesses influence performance of cylindrical lithium-ion batteries. J. Energy Storage 2021, 46, 103827. [Google Scholar] [CrossRef]
  42. Li, Y.; Zhou, Z.; Hu, L.; Bai, M.; Gao, L.; Li, Y.; Liu, X.; Li, Y.; Song, Y. Experimental studies of liquid immersion cooling for 18650 lithium-ion battery under different discharging conditions. Case Stud. Therm. Eng. 2022. [Google Scholar] [CrossRef]
  43. Li, Y.; Zhou, Z.; Zhao, J.; Hao, L.; Bai, M.; Li, Y.; Liu, X.; Li, Y.; Song, Y. Three-Dimensional Thermal Simulations of 18650 Lithium-Ion Batteries Cooled by Different Schemes under High Rate Dis-charging and External Shorting Conditions. Energies 2021, 14, 6986. [Google Scholar] [CrossRef]
  44. Buerschaper, R.A. Thermal and Electrical Conductivity of Graphite and Carbon at Low Temperatures. J. Appl. Phys. 1944, 15, 452–454. [Google Scholar] [CrossRef]
  45. Stephan, P.; Kabelac, S.; Kind, M.; Mewes, D.; Schaber, K.; Wetzel, T. VDI-Wärmeatlas: Fachlicher Träger VDI-Gesellschaft Verfahrenstechnik und Chemieingenieurwesen, 12th ed.; Springer: Berlin/Heidelberg, Germany, 2019. [Google Scholar]
  46. Li, Y.; Guo, H.; Qi, F.; Guo, Z.; Li, M.; Tjernberg, L.B. Investigation on liquid cold plate thermal management system with heat pipes for LiFePO4 battery pack in electric vehicles. Appl. Therm. Eng. 2020, 185, 116382. [Google Scholar] [CrossRef]
  47. Li, W.; Xiong, S.; Zhou, X.; Shi, W.; Wang, C.; Lin, X.; Cheng, J. Design of Cylindrical Thermal Dummy Cell for Development of Lithium-Ion Battery Thermal Management System. Energies 2021, 14, 1357. [Google Scholar] [CrossRef]
  48. Lei, Z.; Zhang, C.; Li, J.; Fan, G.; Lin, Z. Preheating method of lithium-ion batteries in an electric vehicle. J. Mod. Power Syst. Clean Energy 2015, 3, 289–296. [Google Scholar] [CrossRef] [Green Version]
  49. Wang, Q.; Jiang, B.; Xue, Q.; Sun, H.; Li, B.; Zou, H.; Yan, Y. Experimental investigation on EV battery cooling and heating by heat pipes. Appl. Therm. Eng. 2014, 88, 54–60. [Google Scholar] [CrossRef]
  50. Shang, Y.; Liu, K.; Cui, N.; Zhang, Q.; Zhang, C. A Sine-Wave Heating Circuit for Automotive Battery Self-Heating at Subzero Temperatures. IEEE Trans. Ind. Inform. 2019, 16, 3355–3365. [Google Scholar] [CrossRef]
Figure 1. Geometric model of (a) lithium-ion single cell or HF heated cell; (b) microchannel cooled water heated cell; (c) grid schematic of lithium-ion single cell; (d) microchannel cooled water heated cell.
Energies 16 00750 g001
Figure 2. Comparison of NTGK model simulation results with experimental data. (a) Voltage curves; (b) Temperature curves at 22.4 °C; (c) voltage curves; (d) histograms of energy for 1C discharge of lithium-ion battery.
Energies 16 00750 g002
Figure 3. Voltage (left) and temperature curve (right) of 0.5C discharge at different heating times: (a) Without insulation; (b) With insulation conditions.
Energies 16 00750 g003
Figure 4. Surface temperature contour of the battery at 0.5C at different moments of discharge: (a) Without insulation; (b) With insulation.
Energies 16 00750 g004
Figure 5. Voltage (left) and temperature curve (right) of 1C discharge at different heating times: (a) Without insulation; (b) With insulation.
Energies 16 00750 g005
Figure 6. Voltage (left) and temperature curve (right) of 2C discharge at different heating times: (a) Without insulation; (b) With insulation conditions.
Energies 16 00750 g006
Figure 7. Temperature profile of two heating methods. (a) Average temperature; (b) Maximum temperature of the cell surface after 90 s of heating by LCP and HF.
Energies 16 00750 g007
Figure 8. Temperature distribution of the cell surface with different heating methods. (a) 20 W HF; (b) 20 °C LCP; (c) 30 °C LCP.
Energies 16 00750 g008
Figure 9. Histogram of energy. Heating energy consumption from (a) External; (b) Battery itself.
Energies 16 00750 g009
Figure 10. Evolution of the temperature and distribution of the internal temperature of the cell with different thermal conductivity: Maximum temperature (Left); Temperature difference (Right).
Energies 16 00750 g010
Figure 11. Cell axial temperature gradient distribution diagram. The cell axial thermal conductivity is (a) 35 W/(m·K); (b) 80 W/(m·K).
Energies 16 00750 g011
Figure 12. Temperature profile and internal temperature distribution of the cell at different heating times (heating power): Maximum temperature (Left); Temperature difference (Right).
Energies 16 00750 g012
Figure 13. Cell axial temperature gradient distribution after heating for 10 min.
Energies 16 00750 g013
Figure 14. Distribution of the internal temperature and surface temperature of the cell at different heating times (heating power) under side heating: Maximum temperature (Left); Temperature difference (Right).
Energies 16 00750 g014
Figure 15. Temperature distribution in the radial direction inside the cell. Heating for (a) 30 s; (b) 60 s; (c) 90 s; (d) 180 s.
Energies 16 00750 g015
Figure 16. Temperature evolution and surface distribution of the cell. (a,b) Power step gradients ΔP; (c,d) Heating time gradients for each stage d; (e,f) Number of heating stages N.
Energies 16 00750 g016
Table 1. Materials and physical parameters of lithium-ion battery.
QuantityValue
Cathode materialLiFePO4
Anode materialGraphite
Electrolyte materialCarbonate based
Diameter (mm)18.33 ± 0.07
Height (mm)64.85 ± 0.15
Weight (g)46.5 ± 0.1
Nominal voltage (V)3.65
Nominal capacity (Ah)2.5
Charge cut-off voltage (V)4.2
Discharge cut-off voltage (V)2.5
Table 2. Physical parameters for cell modeling.
QuantityValue
Heat thermal capacity Cp (J /(kg·K))1250 1
Radial thermal conductivity kr (W/(m·K))0.3 2
Axial thermal conductivity kz (W/(m·K))30 2
Density ρ (kg/m3)2911.7 1
1 Parameters are obtained from experimental measurements. 2 Parameters quoted from the literature [39].
Table 3. Heating conditions.
ParametersUnitValue
LCPTemperature of water(T)°C20, 30
Cold blade thickness (d1)mm5 1
Coolant channel width (l)mm3 1
Coolant channel thickness (d2)mm4 1
Heating FilmPower(P)W20
Warming Time(t)s90
1 Parameters quoted from the literature [43].
Table 4. Calculation results of energy.
−20 °C0 °C10 °C20 °C30 °C40 °C
Energy output at 0.5C (J)33,181.235,221.836,227.537,199.338,175.137,307.7
Energy output at 1C (J)33,322.035,380.136,410.737,369.038,403.839,367.7
Energy output at 2C (J)33,784.235,730.636,634.737,687.038,595.639,509.2
Energy consumption (J)-11801740232029003480
Net energy output at 0.5C (J)-34,041.834,487.534,879.335,275.133,827.7
Net energy output at 1C (J)-34,200.134,670.735,049.035,503.835,887.7
Net energy output at 2C (J)-34,550.634,894.735,36735,695.636,029.2
Table 5. Thermal conductivity of some materials for lithium-ion batteries.
MaterialValue
Graphite coating (Negative electrode)139 W/(m·K) [45]
Copper foil (Negative collector)399 W/(m·K) [45]
Aluminum foil (Positive collector)237 W/(m·K) [46]
Steel AISI 4340 (External steel case)44.5 W/(m·K)
Table 6. Operational conditions of the parameters.
ΔPdN
11 W0 s3
23 W1 s4
35 W3 s5
47 W5 s6
Table 7. Results of orthogonalization test.
Testing TimesΔPdNΔT (°C)δ(°C/min)
111160.2319.86
212259.5719.4
313359.1119.18
414459.2519.31
521257.3316.32
622157.0217.92
723456.3615.04
824356.2411.72
931360.1510.77
1032461.079.19
1133157.8816.17
1234257.6814.7
1341467.513.18
1442363.397.53
1543260.4911.44
1644159.4214.61
Table 8. Analysis of the factors.
ΔPdN
ΔT(°C)K159.5461.3158.64
K256.8660.2658.77
K359.2058.4659.72
K462.7058.1561.05
R5.843.162.41
δ(°C /min)K119.4412.5317.14
K215.2513.5115.47
K312.7115.4612.30
K49.1915.0911.68
R10.252.935.46
Disclaimer/Publisher’s Note: The statements, opinions and data contained in all publications are solely those of the individual author(s) and contributor(s) and not of MDPI and/or the editor(s). MDPI and/or the editor(s) disclaim responsibility for any injury to people or property resulting from any ideas, methods, instructions or products referred to in the content.

