Article

Multi-Objective Optimal Long-Term Operation of Cascade Hydropower for Multi-Market Portfolio and Energy Stored at End of Year

1
Institute of Hydropower & Hydro informatics, Dalian University of Technology, Dalian 116024, China
2
China Yangtze Power Co., Ltd., Yichang 443133, China
3
Kunming Power Exchange Center, Kunming 650011, China
*
Author to whom correspondence should be addressed.
Energies 2023, 16(2), 604; https://doi.org/10.3390/en16020604
Submission received: 3 November 2022 / Revised: 5 December 2022 / Accepted: 27 December 2022 / Published: 4 January 2023
(This article belongs to the Topic Hydroelectric Power)

Abstract

:
Taking into account both market benefits and power grid demand is one of the main challenges for cascade hydropower stations trading on electricity markets and secluding operation plan. This study develops a multi-objective optimal operation model for the long-term operation of cascade hydropower in different markets. Two objectives were formulated for economics benefits and carryover energy storage. One was to maximize the market utility value based on portfolio theory, for which conditional value at risk (CVaR) was applied to measure the risk of multi-markets. Another was the maximization of energy storage at the end of a year. The model was solved efficiently through a multi-objective particle swarm optimization (MOPSO). Under the framework of the MOPSO, the chaotic mutation search mechanism and elite individual retention mechanism were introduced to diversify and accelerate the non-inferior solution sets. Lastly, a dynamic updating of archives was established to collect the non-inferior solution. The proposed model was implemented on the hydropower plants on the Lancang River, which traded on the Yunnan Electricity Market (YEM). The results demonstrated non-inferior solution sets in wet, normal and dry years. A comparison in solution sets revealed an imbalanced mutual restriction between objectives, such that a 2.65 billion CNY increase in market utility costs a 13.96 billion kWh decrease in energy storage. In addition, the non-inferior solution provided various schemes for actual demands based on other evaluating indexes such as the minimum output, power generation and spillage.

Graphical Abstract

1. Introduction

Since the new round of electricity from China in 2015, lots of regions and provinces have established electricity markets and exchange centers. At the end of 2021, the market trading of electricity included 3778.74 billion kWh, accounting for 45.5% of the total social electricity consumption. With the gradual liberalization of the power market, a way to promote power generation consumption through market trading was provided for hydropower stations. Especially in Southwest China, the hydropower-rich provinces, such as Yunnan, Sichuan, Guizhou, etc., have successively carried out electric power reform pilot projects. As the main sending sources for the West-to-East Electricity Transmission (WEET) project, these hydropower plants face multi-party demands besides their own market benefits need: flood control, river navigation and water spillage [1,2,3]. These demands require large carryover storage of cascades. The carryover energy storage at the end of a year is an important state to reflect these demands in the long-term operation of cascade hydropower [4,5]. Under such circumstances, considering both the overall benefits in different markets and the cascade carryover storage in optimizing the generation scheduling for cascades is a practical problem to be solved by the hydropower enterprises. However, this problem becomes much more complicated due to the uncertainty of electricity prices, while market risks should be taken into account. In addition, the hydraulic and market constraints of the cascade hydropower plants increase the complexity further [6].
Despite the benefits of efficiency improvements for power system deregulation, the introduction of electricity markets can also bring about many risks in power trading. Many studies have focused on risk management of the electricity market due to the volatility of market prices. Early studies mainly combined the future market with the node market, and used forward contract with the short-term market to avoid market risks caused by price fluctuations [7,8]. Decision analysis and Monte Carlo simulation have been used to find the optimal combination between markets under economic returns [9,10]. In recent years, with the participation of new energy and increase in power market categories, methods of considering multi-market portfolio optimization have gradually received lots of research attention using two different methods: the mean-variance (MV)-based method, using, for example, the modern portfolio model (MPT) [11,12,13]; and the conditional value at risk (CVaR)-based method [14,15,16,17]. Mean-variance models penalize risk in the objective function, where the measure of risk is the variance of profit, and CVaR models use their own risk definition based on the probability of reaching a minimum profit [12]. Yan et al. [11] a novel portfolio theory-based approach is proposed for optimally managing ES in various markets to maximize benefits and reduce the risk for ES owners. Garcia et al. [12] proposed MPT models which were combined with a generalized autoregressive conditional heteroscedastic (GARCH) prediction technique for a generation company to optimally diversify their energy portfolio. Liu and Wu [13] provided an optimization strategy for power generation companies’ energy allocation based on an MPT quantitative analysis and mathematical derivation of risk-free and risky transactions in the PJM market. Zhao et al. [14] proposed a dynamic multi-stage optimization configuration model for electricity assets based on the conditional value at risk (CVaR) and the impacts of different asset reallocation strategies on the electricity assets configuration effect were analyzed. Zhang et al. [15] designed a risk prevention linkage mechanism of credit evaluation and risk measurement for retailers, including a credit risk measurement model based on the CvaR method for accurately describing the retailers’ credit risk. Hang developed a decision model based on a CVaR methodology, whose object was to maximize the power supplier’s utilities of electricity purchasing and selling. There are other techniques based on the value at risk (VaR) model [18] that have already been implemented in electricity markets [19,20]. However, VaR is not as consistent a risk measurement tool as the CvaR because VaR is neither convex nor sub-additive. The Mean-variance-based and CvaR-based methods mostly focus on risk measurement and management of a single period, and become extremely complicated in multiple periods.
Meanwhile, the operation scheduling for hydropower plants is a typical multi-variable and non-linear problem [21,22,23,24], especially for cascade hydropower plants. The most common main objective of hydropower plants’ optimal operation is to maximize the economic benefits in the electricity market [24], maximize the power generation during conventional scheduling [21,22,23] or maximize the carryover energy storage [5], so it is difficult to take into account both the demand of the power grid and hydropower stations at the same time, and it is not suitable for the actual operation demand of the large cascaded stations. Under these circumstances, optimizing the generation scheduling for cascades in multiple markets, improving the overall benefits and avoiding price risks for the market portfolio, and maximizing the carryover energy storage at the end of the year should be among the vital multi-objective problems to be solved. There is an extensive literature which explores the multi-objectives optimization scheduling of reservoirs, which remains a research hotpot [25,26,27,28]. There are two kinds of method used to solve multi-objective optimization problems, one is the traditional mathematical analytic method, and the other is the evolutionary algorithm. An evolutionary algorithm is a kind of population-based method with a random search method, which has the ability to approach the real Pareto front through continuous evolution. Therefore, it is widely used in solving multi-objective problems, for example, using the Non-dominated Sorting Genetic Algorithm-II (NSGA-II) and population-based algorithms. Among the population-based algorithms, the multi-objective particle swarm optimization algorithm (MOPSO) has the characteristic of fast convergence.
To our knowledge, few studies have considered both the market benefit and power grid demand, especially in the circumstances of China’s electricity market, in which power exchange centers take charge of trading while the power grid takes charge of operations. A recent paper by Lu et al. [29] established a risk analysis method for cascade hydropower to participate in the market, which was coupled with the monthly market and day-ahead market. Different from the work of Liu, we focus on a multi-objective model for a one year operation schedule which suits both the power grid and power exchange center trading, and we use price scenarios to characterize the possible situations of the actual clear price in multiple markets on the premise of knowing the mean and variance of historical price data, which gives the optimal market portfolio with a confidence level. In addition, we analyze the model’s performance under different inflow situations, including flood, normal and dry conditions.
In this paper, a multi-objective optimization model for the long-term operation of hydropower plants were developed, in which one objective was the maximization of market benefits considering the price risk and the other was the maximization of carryover energy storage. The model aimed to give non-inferior sets under typical runoff conditions according to historical runoff data. To fully consider the volatility of multi-market prices, a mean-CvaR-based utility function was constructed to calculate the multi-market revenues and risks in whole schedule periods for the market portfolio. A MOPSO-based framework was proposed to solve the model and several mechanisms, including a chaotic mutation search, elite individual retention and dynamic updating archives, were introduced to accelerate convergence. The developed model was evaluated by optimizing the monthly generation schedules of China’s Xiaowan-Nuozhadu hydropower system during a one-year period. The methodological framework used to investigate this relationship is illustrated in Figure 1.
The contributions of this paper are threefold. (1) We proposed a utility function for a multi-market portfolio which measured the benefits and risk based on the mean-CVaR method in relation to long-term hydropower scheduling. (2) A multi-objective particle swarm optimization algorithm was established with a chaotic mutation search mechanism, elite individual retention mechanism and dynamic updating of archives to accelerate algorithm convergence. (3) The effectiveness of the proposed model was validated by applying it to perform the long-term scheduling of the Xiaowan-Nuozhadu hydropower system in China. Combined with other operation indicators, the non-inferior frontier solution could provide optimal schemes which were adapted to different demands.
The remainder of this study is organized as follows. Section 2 introduces the objectives and constraints. Section 3 explains the methods used to solve the model including the market relative and multi-objective particle swarm optimization algorithm. Section 4 provides a detailed information of the case study. Section 5 includes an analysis and discussion of the case study results. The conclusions are summarized in Section 6.

2. Objectives and Constraints

2.1. Obejctieve

This paper considers two optimization objectives: the maximum market utility function value and maximum carryover storage of cascade stations.
The former expects that the maximum market benefits of cascade hydropower under a minimum risk of loss, which is represented by the utility function value; the latter expects maximize carryover storage of cascade stations which meets the demand of peak regulation and frequency regulation in the scheduling period. This model is a multi-objective optimization problem, which can be expressed as
max F ( x ) = [ f 1 , f 2 ]
where f 1 is the utility function of the cascade stations’ multi-market benefits and can be expressed as
f 1 = t = 1 T U ( t ) = t = 1 T E ( t ) + C V a R ( L o s t ( t ) , β )
where f 2 is the carryover energy storage at the end of the period and can be expressed as
f 2 = E S T
where N refers to the total number of cascade hydropower stations, and n refers to the index number of hydropower stations; T is the total number of scheduling periods, and t is the index number period which is on monthly scale; E ( t ) is the expected multi-market return in period t ; L o s t ( t ) is the lost function in period t ; C V a R ( L o s t ( t ) , β ) is the conditional value at risk under the probability of 1 β in period t ; and E S T is the energy storage of hydropower stations at the end of period T .

2.2. Station Constraint

To solve the objective function, the following constraints must be met:
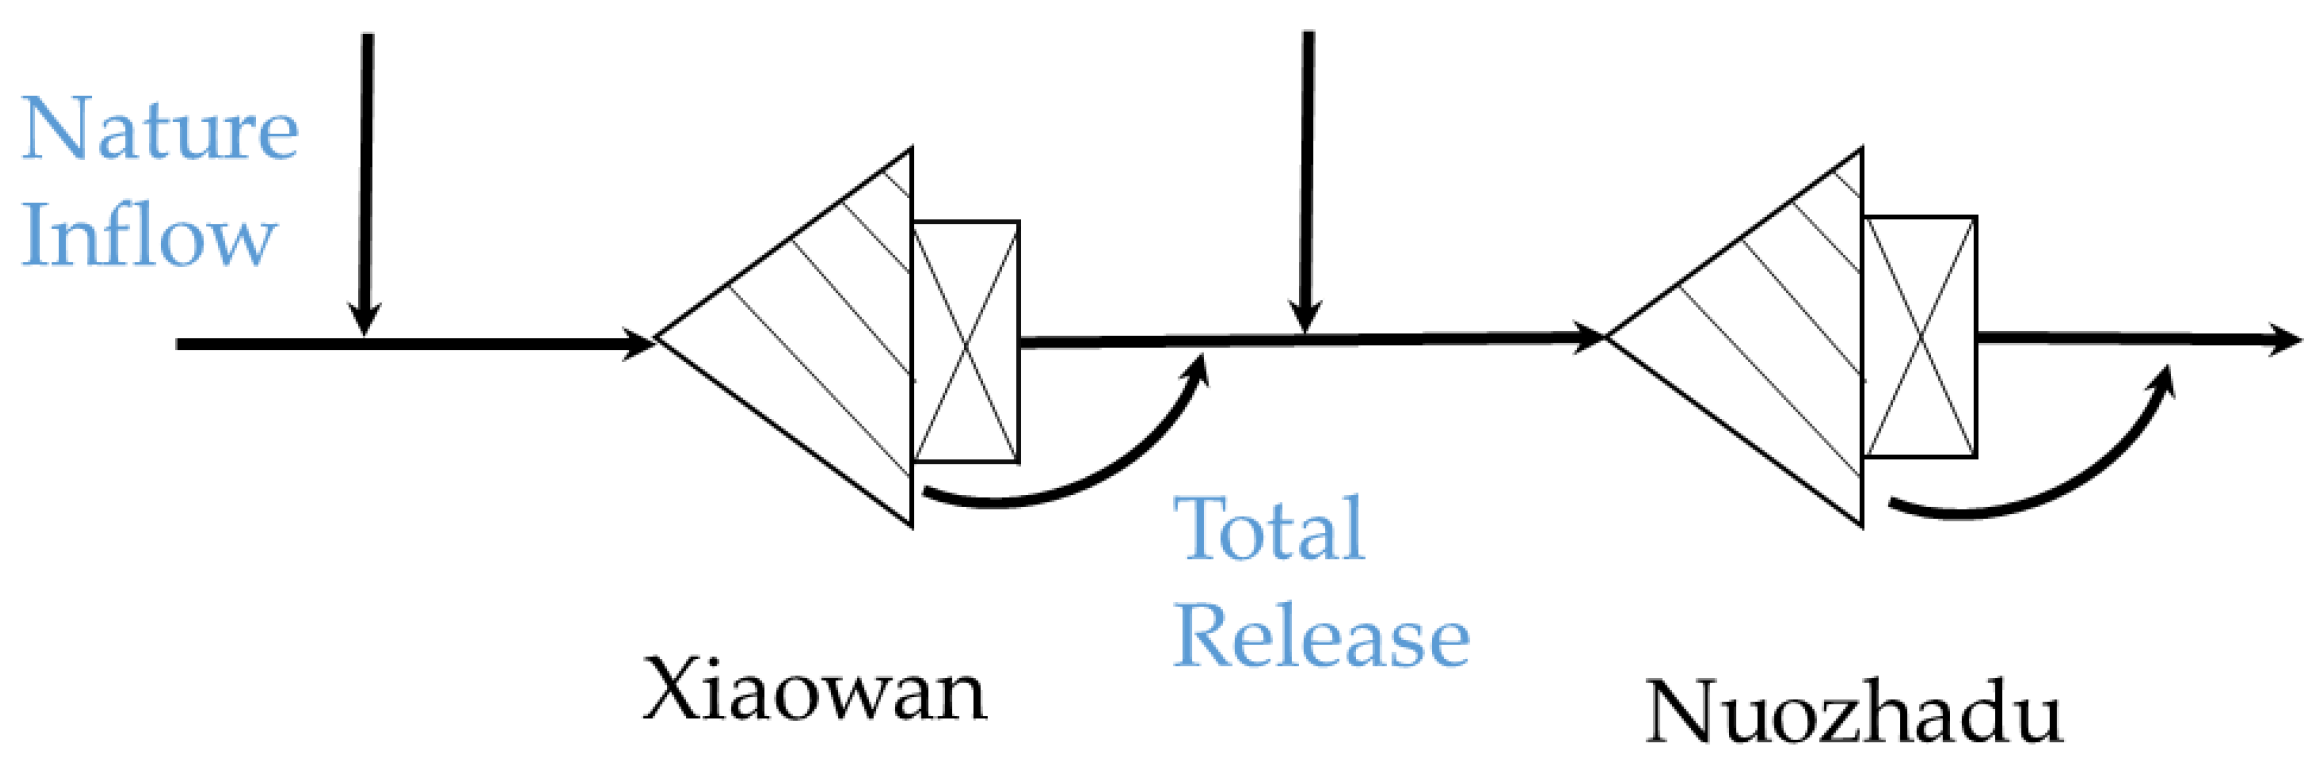
  • Water balance constraint: ensure the water balance of upstream and downstream power stations and adjacent periods, as follows:
    V n t + 1 = V n t + I n t q n t r n t Δ t 3600
    where V n t and V n t + 1 are the storage capacity of hydropower station n in the period t and t + 1 , measured in m 3 ; I n t represents the inflow of hydropower station n in the period t , measured in m 3 / s ; q n t represents the generation flow of hydropower station n in the period t , measured in m 3 / s ; r n t represents the spillage water flow of hydropower station n during the period t , measured in m 3 / s ; and Δ t is the number of hours for the period.
2.
Water level restriction: the water level restriction of hydropower station dispatching ensures that the reservoir operates within a safe and reasonable water level range:
Z n t ¯ Z n t Z n t ¯
where Z n t represents the water level of hydropower station n in the period t ; Z n t ¯ and Z n t ¯ are the lower limit and upper limit of the water level of hydropower station n in the period t , respectively, measured in m.
3.
Output constraint: the upper and lower output limits of the hydropower station are determined according to the nameplate output, maintenance plan, minimum technical output limit, etc., of the hydropower unit:
P n t ¯ P n t P n t ¯
where P n t represents the output of hydropower station n in the period t , measured in W; P n t ¯ and P n t ¯ are the lower and upper output limits of hydropower station n in period, respectively, measured in W.
4.
The turbine flow constraint mainly depends on the overflow capacity of all water turbine units of the hydropower station:
q n t ¯ q n t q n t ¯
where q n t represents the turbine flow of hydropower station n in the period t , measured in m 3 / s ; q n t ¯ and q n t ¯ are the lower limit and upper limit of the turbine flow of hydropower station n in period t , respectively, measured in m 3 / s .
5.
Water discharges constraint: the discharge limit of a hydropower station is related to the discharge capacity of the hydropower units and the discharge capacity of the spillway:
S n t ¯ S n t S n t ¯
where S n t represents the discharge of hydropower station n in period t , measured in m 3 / s ; S n t ¯ , S n t ¯ represent the lower limit and upper limit of the discharge of hydropower station n in period t , respectively, measured in m 3 / s .
6.
Power generation function:
P n t = q n t w r n [ h n t ]
h n t = Z n t 1 + Z n t 2 Z d n t
where h n t represents the average gross water head of station n in period t ; Z d n t is the average tailrace level of station n in period t ; and w r n [ ] represents the water released-energy conversion function of station n .
7.
Carryover energy constraint, based on the expression in [4]:
v u n = v n , T v n , m i n + v u n 1
E S T = n = 1 N v u n η n
η n = T 1 t = 1 T w r n [ h n t ]
where v i , T represents the storage of station n in period T ; v n , m i n is the minimum storage of station; v u n is the sum of the storage of station n and its upstream station, measured in m 3 ; and η i is the average water consumption rate of station n , measured in m 3 / kWh .
8.
The relationship between the water level and reservoir storage:
V n t = f n z v Z n t
where f n z v represents the water level as a function of station storage for station n .
9.
Relationship between the tailrace water level and reservoir discharge:
Z d n t = f n z q q n t
where f n z q represents the tailrace water level as a function of reservoir discharge for station n .
10.
The market electricity of a station is calculated as follows:
Q n t = 3.6 P n t Δ t
where Q n t represents the total market electricity of station n in period t , measured in kWh .

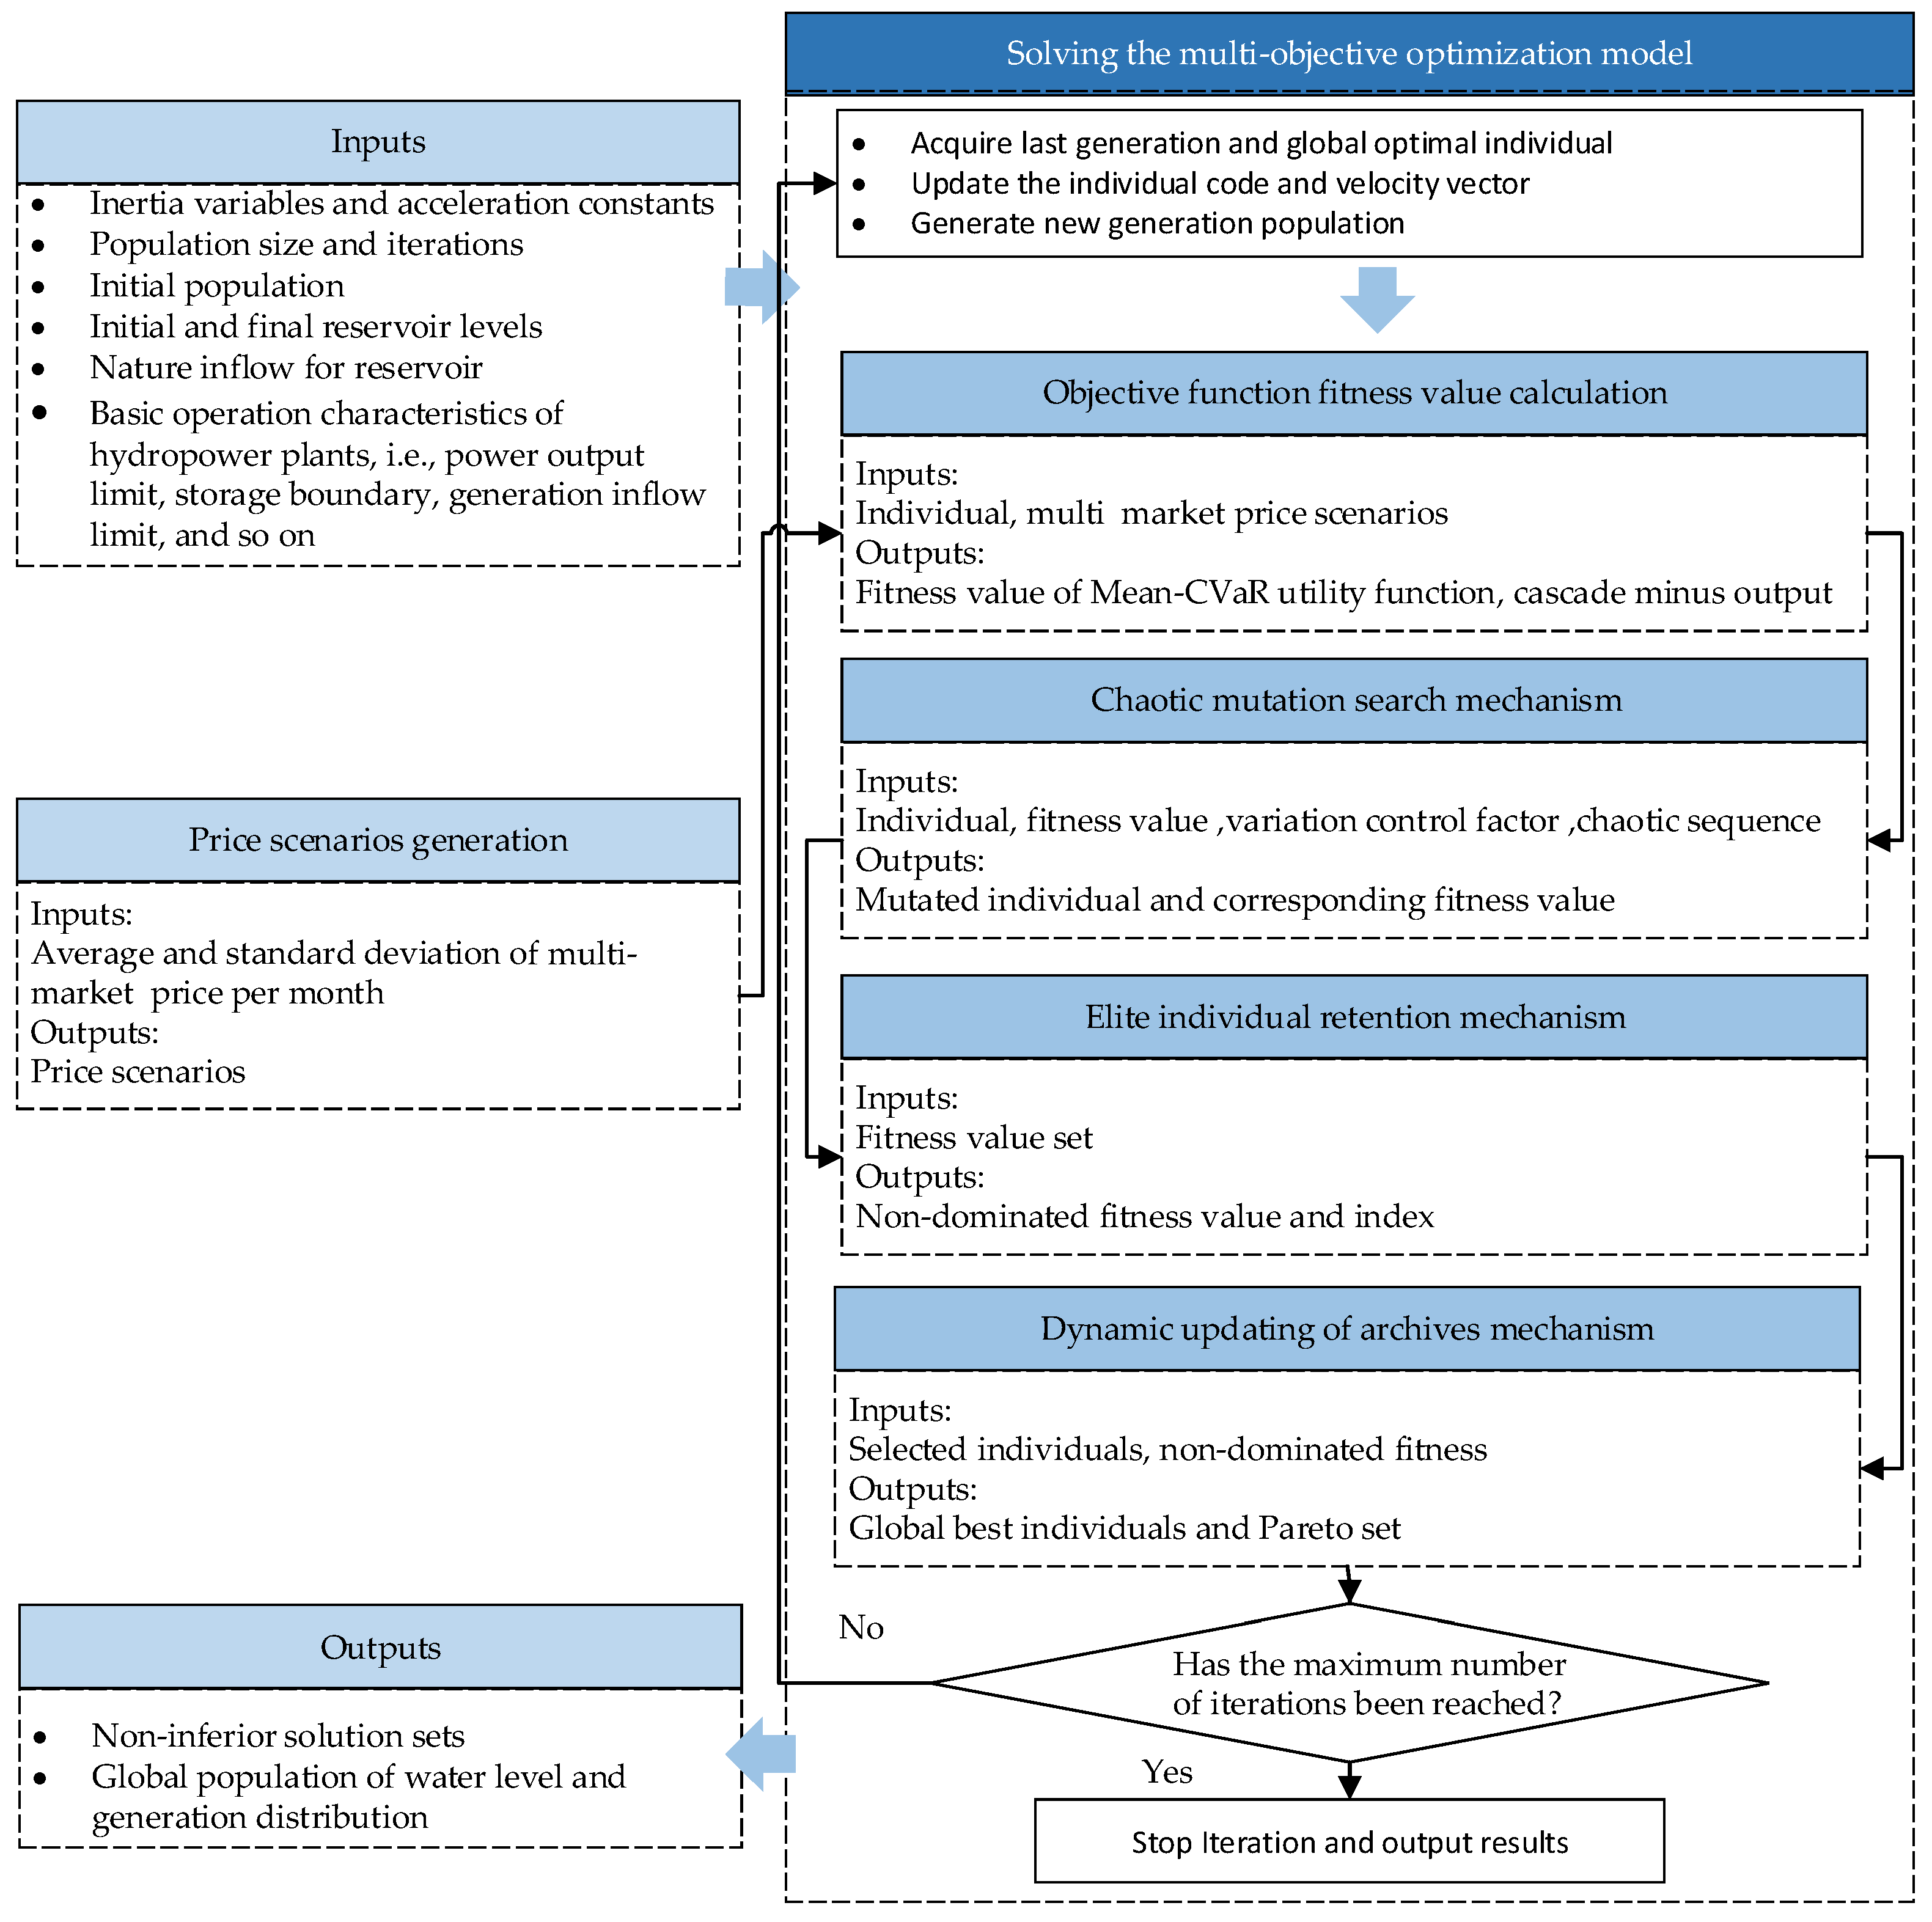
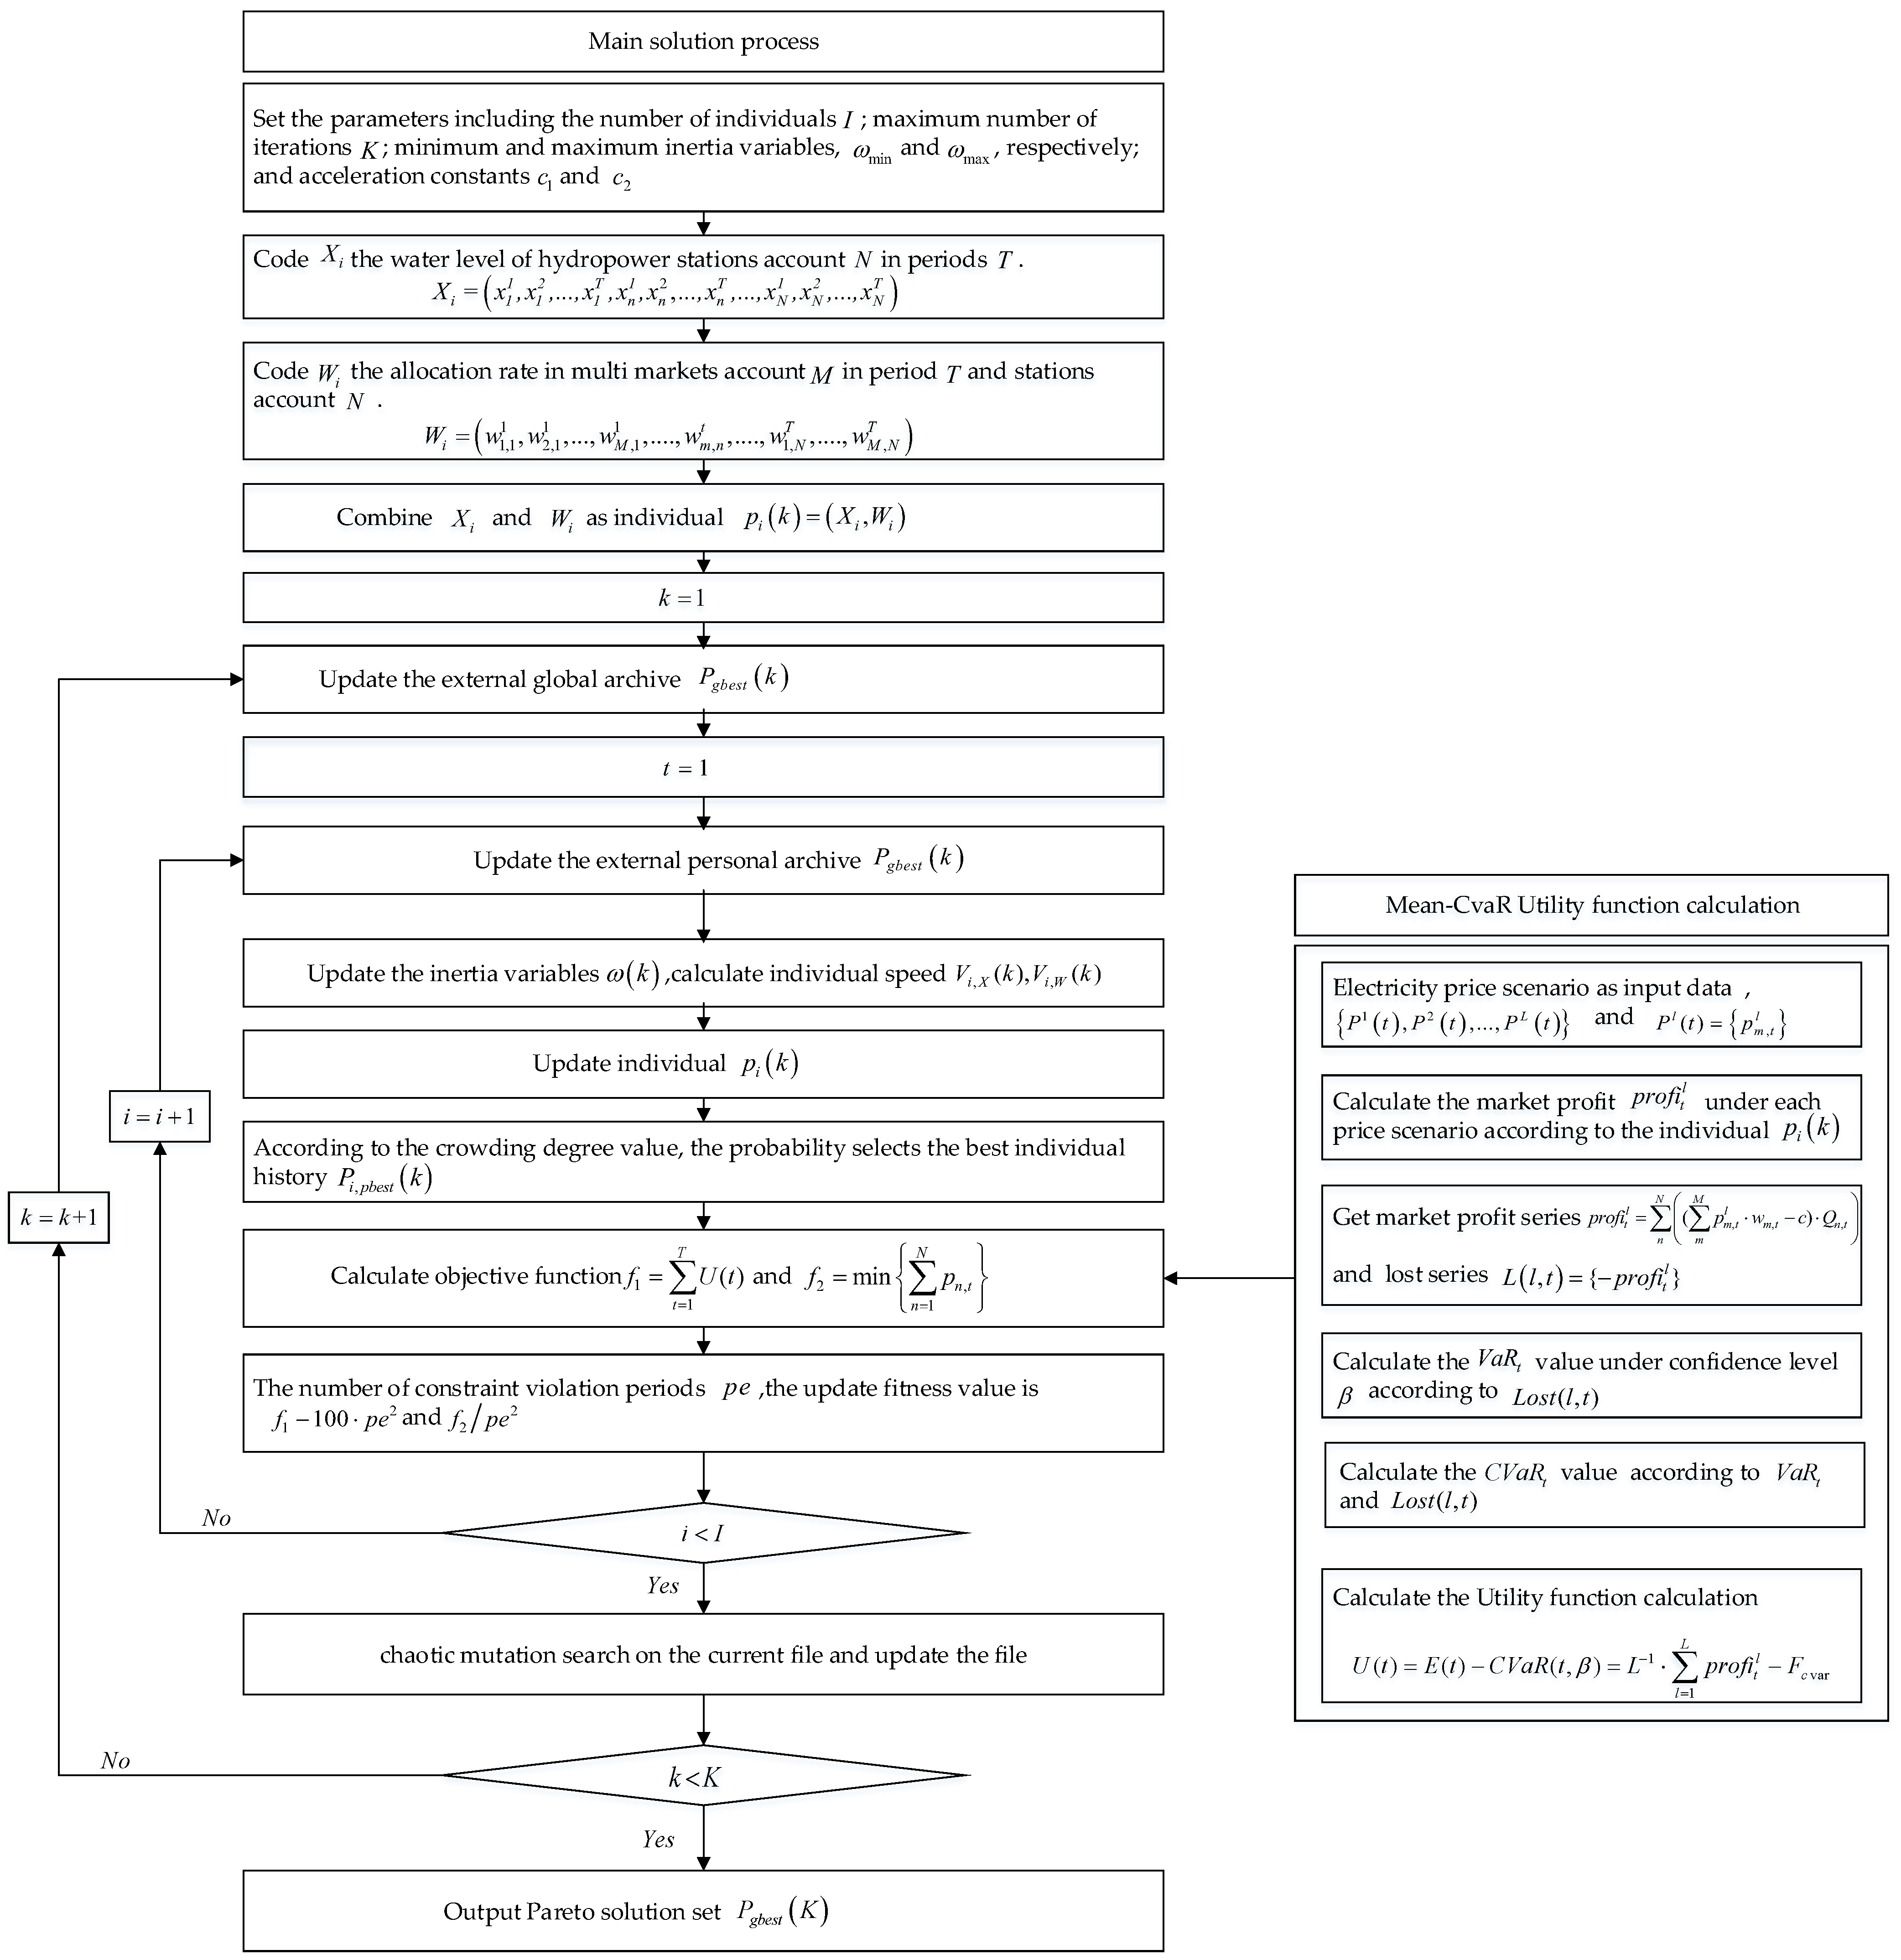
3. Model Solving Method

3.1. Mean-CVaR Market Model

3.1.1. CVaR Model

Let L o s t x , y denote the loss associated with decision variables vector x and random variables vector y . x can be represented as a market portfolio, and vector y stands for the uncertainties affecting the loss. If the probability density function of y is given as p y , the distribution function of loss function will be determined for x , which is given by:
φ ( x , a ) = L o s t ( x , y ) < a p ( y ) d y
Given the confidence level β 0 < β < 1 , the VaR of the portfolio is given by the following expression:
V a R = min a R : φ ( x , α ) > β
It is assumed that a is the VaR for the specified portfolio under confidence level β . Nevertheless, even though regulators and fund managers have widely used VaR, it has some drawbacks. The VaR approach has the undesirable property of a lack of sub-additivity, making it difficult to calculate when using scenarios and, if that is the case, it is a non-convex and non-smooth function with multiple local extreme values [30,31]. Therefore, an alternative measure of losses for VaR with more attractive properties is the conditional value at risk (CVaR) measure [32]. Given confidence level β , the CVaR of the portfolio is given by the following expression:
C V a R = E ( L o s t ( x , y ) > V a R ) = ( 1 β ) 1 L ( x , y ) > V a R f ( x , y ) p ( y ) d y
The Monte Carlo method is generally used to solve the definite integral of a function. Its basic idea is to obtain a large number of experimental solutions of the problem through a large number of random variable samples. On this basis, the statistical characteristics (usually the mean value) of the optimization variables are taken as the solution of the problem [33]. The Monte Carlo method is applied to simulate the cumulative distribution function by taking the L sample scene vector P 1 t , P 2 t , , P L t , in which the vector P l ( t ) = p m , t l , p m , t l represents the possible price value of the market m in period t . Then, the total market value R l ( t ) = P l ( t ) W t , W t = = w m , t , w m , t represents the distribution proportion of market m in period t . We consider L o s t l , t = P ¯ ( t ) W ( t ) R l ( t ) , which means the loss benefits of the forecast and actual possible price in the market, where P ¯ ( t ) represents the average electricity price in period t . We denote F C V a R as an approximation of the CVaR obtained by sampling the probability distribution in L o s t l , t . F C V a R is obtained using the following expression:
F c var = a + ( L ( 1 β ) ) 1 l = 1 L ( L o s t l , t a ) +
where a is the VaR when the CVaR is minimized, c represents the cost of the hydropower station, F c var represents the expected loss of market benefits in the period under confidence level β .
Then, the total market profit of scene l in period t is given with the following expression:
p r o f i t l = n N ( m M p m , t l w m , t c ) Q n , t
where Q n , t is the power generation of station n in period t , measured in kWh , and the cost of hydropower stations is 0 in this paper.

3.1.2. Mean-CVaR Utility Function

Previous modern portfolio theory (MPT) models based on the portfolio theory of Markowitz [34] have allocated energy between spot and contract markets in real markets. Liu and Wu [35] used MPT to allocate energy of risky and non-risky assets in the PJM market. Although MPT has been a rather popular measure of risk in portfolio selection, it has its limitations. One distinguished limitation is that analysis based on variance considers high returns as equally undesirable as low returns because high returns will also contribute to the extreme of variance. Due to the variance limitation, the CvaR can be used to replace variance for measuring risk. Then, the mean-CVaR utility function can be given with the following expression:
E ( t ) = L 1 l = 1 L p r o f i t t l
L o s t ( l , t ) = n = 1 N Q n , t m = 1 M w m , t ( p ¯ m , t p m , t l )
a = q u a n ( L o s t ( l , t ) , 1 β )
U ( t ) = E ( t ) + C V a R ( t , β ) = L 1 l = 1 L p r o f i t l + F c var
where q u a n ( s e q , γ ) represents the quantile of the s e q sequence at confidence level γ , which is the same meaning as the expression of VaR. However, it is hard to consider the risk of whole scheduling periods, as it is much more complicated than calculating the risk of one period. For the sake of simplifying the calculation, we take the minimization of CvaR in period t as the risk measure based on a random price scenario set and take the average value of multi-market profit returns as the expected return. The mean-CVaR utility function obtains the final value by participating in market proportion decision variables and generating a capacity decision.

3.2. Solution of Cascade Multi-Objective Optimization Problem

3.2.1. Standard Particle Swarm Optimization

The particle swarm optimization algorithm is a swarm intelligence optimization algorithm. In the algorithm, particles update their speed and position in the solution space according to the best position of the population and the best position in their history. The speed and position expression formula is as follows:
x i , j k + 1 = x i , j k + v i , j k + 1
v i , j k + 1 = ω v i , j k + c 1 r 1 p i , j k x i , j k + c 2 r 2 g i , j k x i , j k
where, i is the individual number, i = 1 , 2 , 3 , , m ; j is the dimension number, j = 1 , 2 , 3 , , n ; k is the number of iterations; x i , j k + 1 and x i , j k are the individual codes; v i , j k and v i , j k + 1 are the velocity vectors; p i , j k is the single generation optimal individual; g i , j k is the global optimal individual; ω is the inertial variable; c 1 and c 2 are acceleration constants respectively; r 1 and r 2 are the random number subject to a [0, 1] uniform distribution.

3.2.2. Multi-Objective Particle Swarm Optimization Algorithm

At present, the multi-objective particle swarm optimization has been widely used in multi-objective problem solving [36,37]. For the multi-objective model proposed in this paper, a multi-objective particle swarm optimization (MOPSO) algorithm was constructed. In order to obtain a better Pareto efficient frontier solution set, the local search ability was improved through the use of a chaotic mutation search mechanism. The file mechanism based on an elite retention strategy dynamically updates the globally and historically optimal set of non-dominated solutions. The congestion distance selection mechanism was used to determine the globally and historically optimal individuals of each generation to improve the PSO algorithm. Finally, according to the characteristics of the proposed model, an individual coding method based on mapping mechanism was proposed.
  • Chaotic mutation search mechanism
The particle swarm optimization algorithm has a strong global search ability and weak local search ability. Considering that with the increase of the number of iterations, the quality of individuals is greatly improved, and the probability of better individuals nearby is improved, the local search for historical optimal files and global files becomes relatively important. For this reason, the standard uses a relatively mature chaotic cubic map to perform mutation operations on individuals in the file in order to expect to obtain other better solutions or non-inferior solutions. The calculation formula is as follows:
X i = X i ( 1 + ϕ Z n )
Z n = 4 ( Z n 1 ) 3 3 Z n 1
ϕ = 1 ( k 1 ) / k m a x
where ϕ is the variation control factor; Z n is a chaotic sequence, Z n 1 , 1 ; and k and k m a x are the iteration number and maximum iteration number, respectively. If the fitness value of the variant individual is the dominant solution of the original individual it will be replaced, the dominated solution will not be replaced and the non-dominated solution will be replaced according to a certain probability. At the same time, the whole chaotic mutation search mechanism also occurs randomly under a given probability.
  • Elite individual retention mechanism and dynamic updating of archives
For the individuals of the population in the algorithm, the corresponding individual file is established according to the literature to save the non-dominated solution set of individuals in the historical process and provide choices for the next generation of historical optimal individuals. Similarly, the global file includes the storage of non-dominated individuals obtained in the iterative process. The update mechanism of individual files and global files is as follows:
P ( k + 1 ) = P ( k ) x ( k + 1 ) \ p , p , f x f ( p ) P ( k ) , p , f ( p ) f x P ( k ) x ( k + 1 ) , f ( p ) f x
where P ( k + 1 ) , P ( k ) represents the individual files or global files of the k and k + 1 generation; the individual is p in the file; and x ( k + 1 ) is the individual corresponding to the individual file in the generation k + 1 . If individual x ( k + 1 ) in the file is controlled, the controlled individual in the file will be deleted and x ( k + 1 ) will be added to the file. If it is controlled by an individual in the file, the file will remain unchanged. If x ( k + 1 ) is not controlled by individual archives, it will be directly added to the archives.
As the number of iterations increases, the number of individuals in the file increases gradually. To ensure the speed of iterative calculation, we set the number of individuals contained in the file. The strategy of the file update was to perform a non-inferior hierarchical sorting of individuals in the file, and by calculating the individual crowding degree, when the number of files exceeded the limit, the individuals with low crowding degree would be deleted from the file. The crowding degree calculation formula is as follows:
I ( d 1 ) = I ( d N ) = I ( d i ) = o = 1 O I ( i + 1 ) f o I ( i 1 ) f o f o max f o min
where I ( d 1 ) and I ( d N ) are the first and last individuals after sorting, respectively, and N is the total number of current individuals in the file; f o max and f o min are the maximum and minimum values of the file individual, respectively, in the o objective function o , and O is the total number of objective functions in the fitness function; I ( i ) f o is the value of objective function o corresponding to individual i ; and I ( d i ) is the crowding degree value of the individual in the sorted file.
At the same time, based on the crowding degree value, the mechanism of global optimization for each generation selection history and the mechanism of historical optimization for each individual are given. The selection probability for any individual in the file is as follows:
p r o b ( l ) = r s 2 , l = 1 , N 1 r s I ( d l ) i = 2 N 1 I ( d i ) , i = 2 , 3 , , N 1
where r s is a larger value, which was set to 0.7 in our model.

3.3. Overall Solution Framework
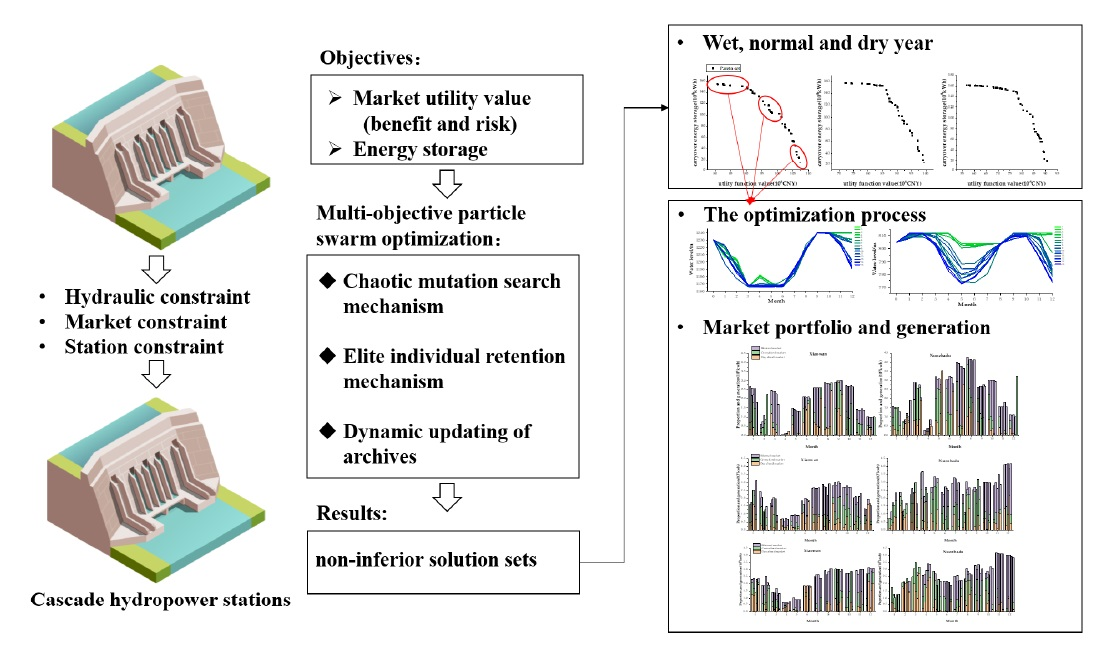
Coupled with the above sections, the overall solution framework of the multi-objective optimal scheduling problem of cascade hydropower stations is shown in Figure 2.

4. Case Study

4.1. Basin Cascade Data

The proposed model was applied to the cascade hydropower plants of the Lancangjiang River in Yunnan Province, China. Seven hydropower plants have been built on the middle and lower Lancangjiang River, with a total installed capacity of 15,915 MW. Figure 3 shows the distribution chart of the middle and lower Lancangjiang River cascade, with reservoir characteristics in Table 1. From May to October the maximum water level of stations is at flood level, while for the rest of the year it is a normal level. Two hydropower plants have long-term regulation abilities in the studied cascade, and they are Xiaowan and Nuozhadu. The storage capacities of the other five reservoirs were much smaller and three of them did not trade on the Yunnan Electricity Market. The cascade power decisions were distributed through the operation of these two large reservoirs.

4.2. Electricity Market Information

The studied Yunnan Electricity Market (YEM) has three majority trading markets: a year-bilateral trading market, a matchmaking trading market and a month-bilateral trading market in long-term market. Based on the public price information of Kunming Power Exchange Center (KPEC), which was the power exchange center of the YEM, the average and the standard deviation of the market price were treated as known and are given in Table 2. The price scenarios were parameterized using the statistical characteristic value in Table 2. The total number of scenarios was 100.

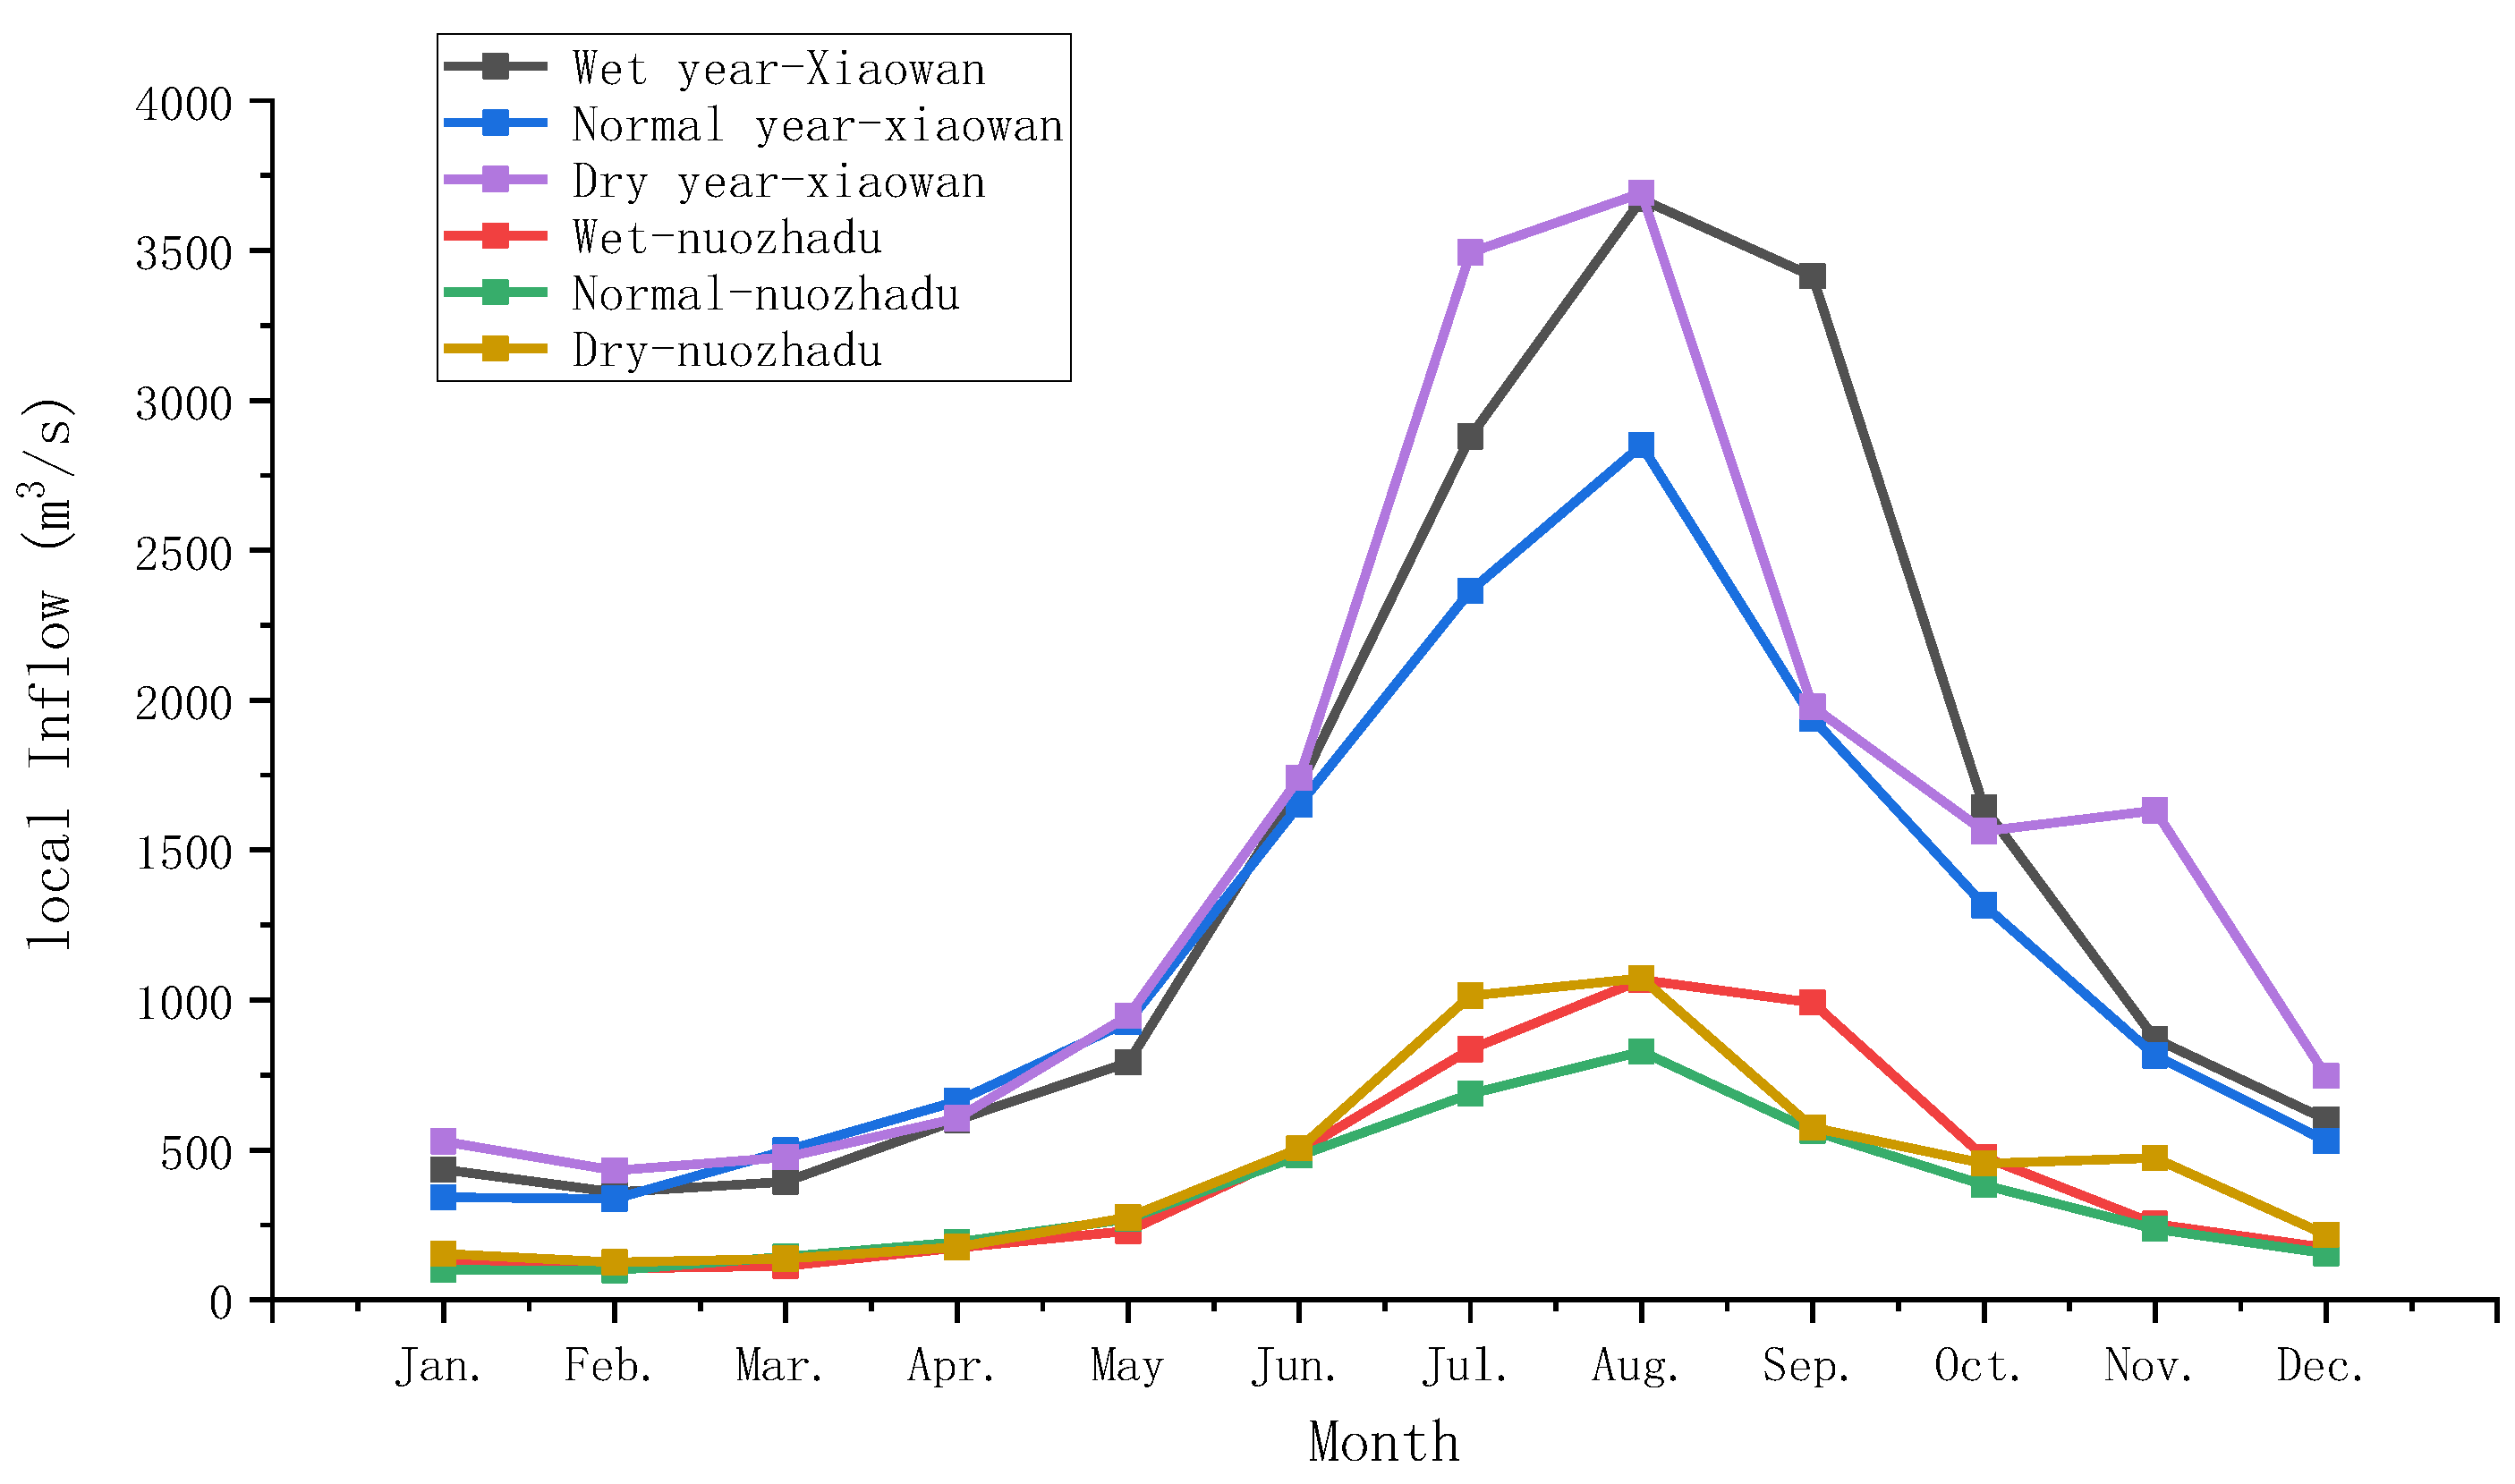
4.3. Inflow Information

In order to verify the effectiveness of the model method in this paper, three different inflow years were selected: a wet year, normal year and dry year. Figure 4 shows the interval inflow of each cascade hydropower station in three typical years.

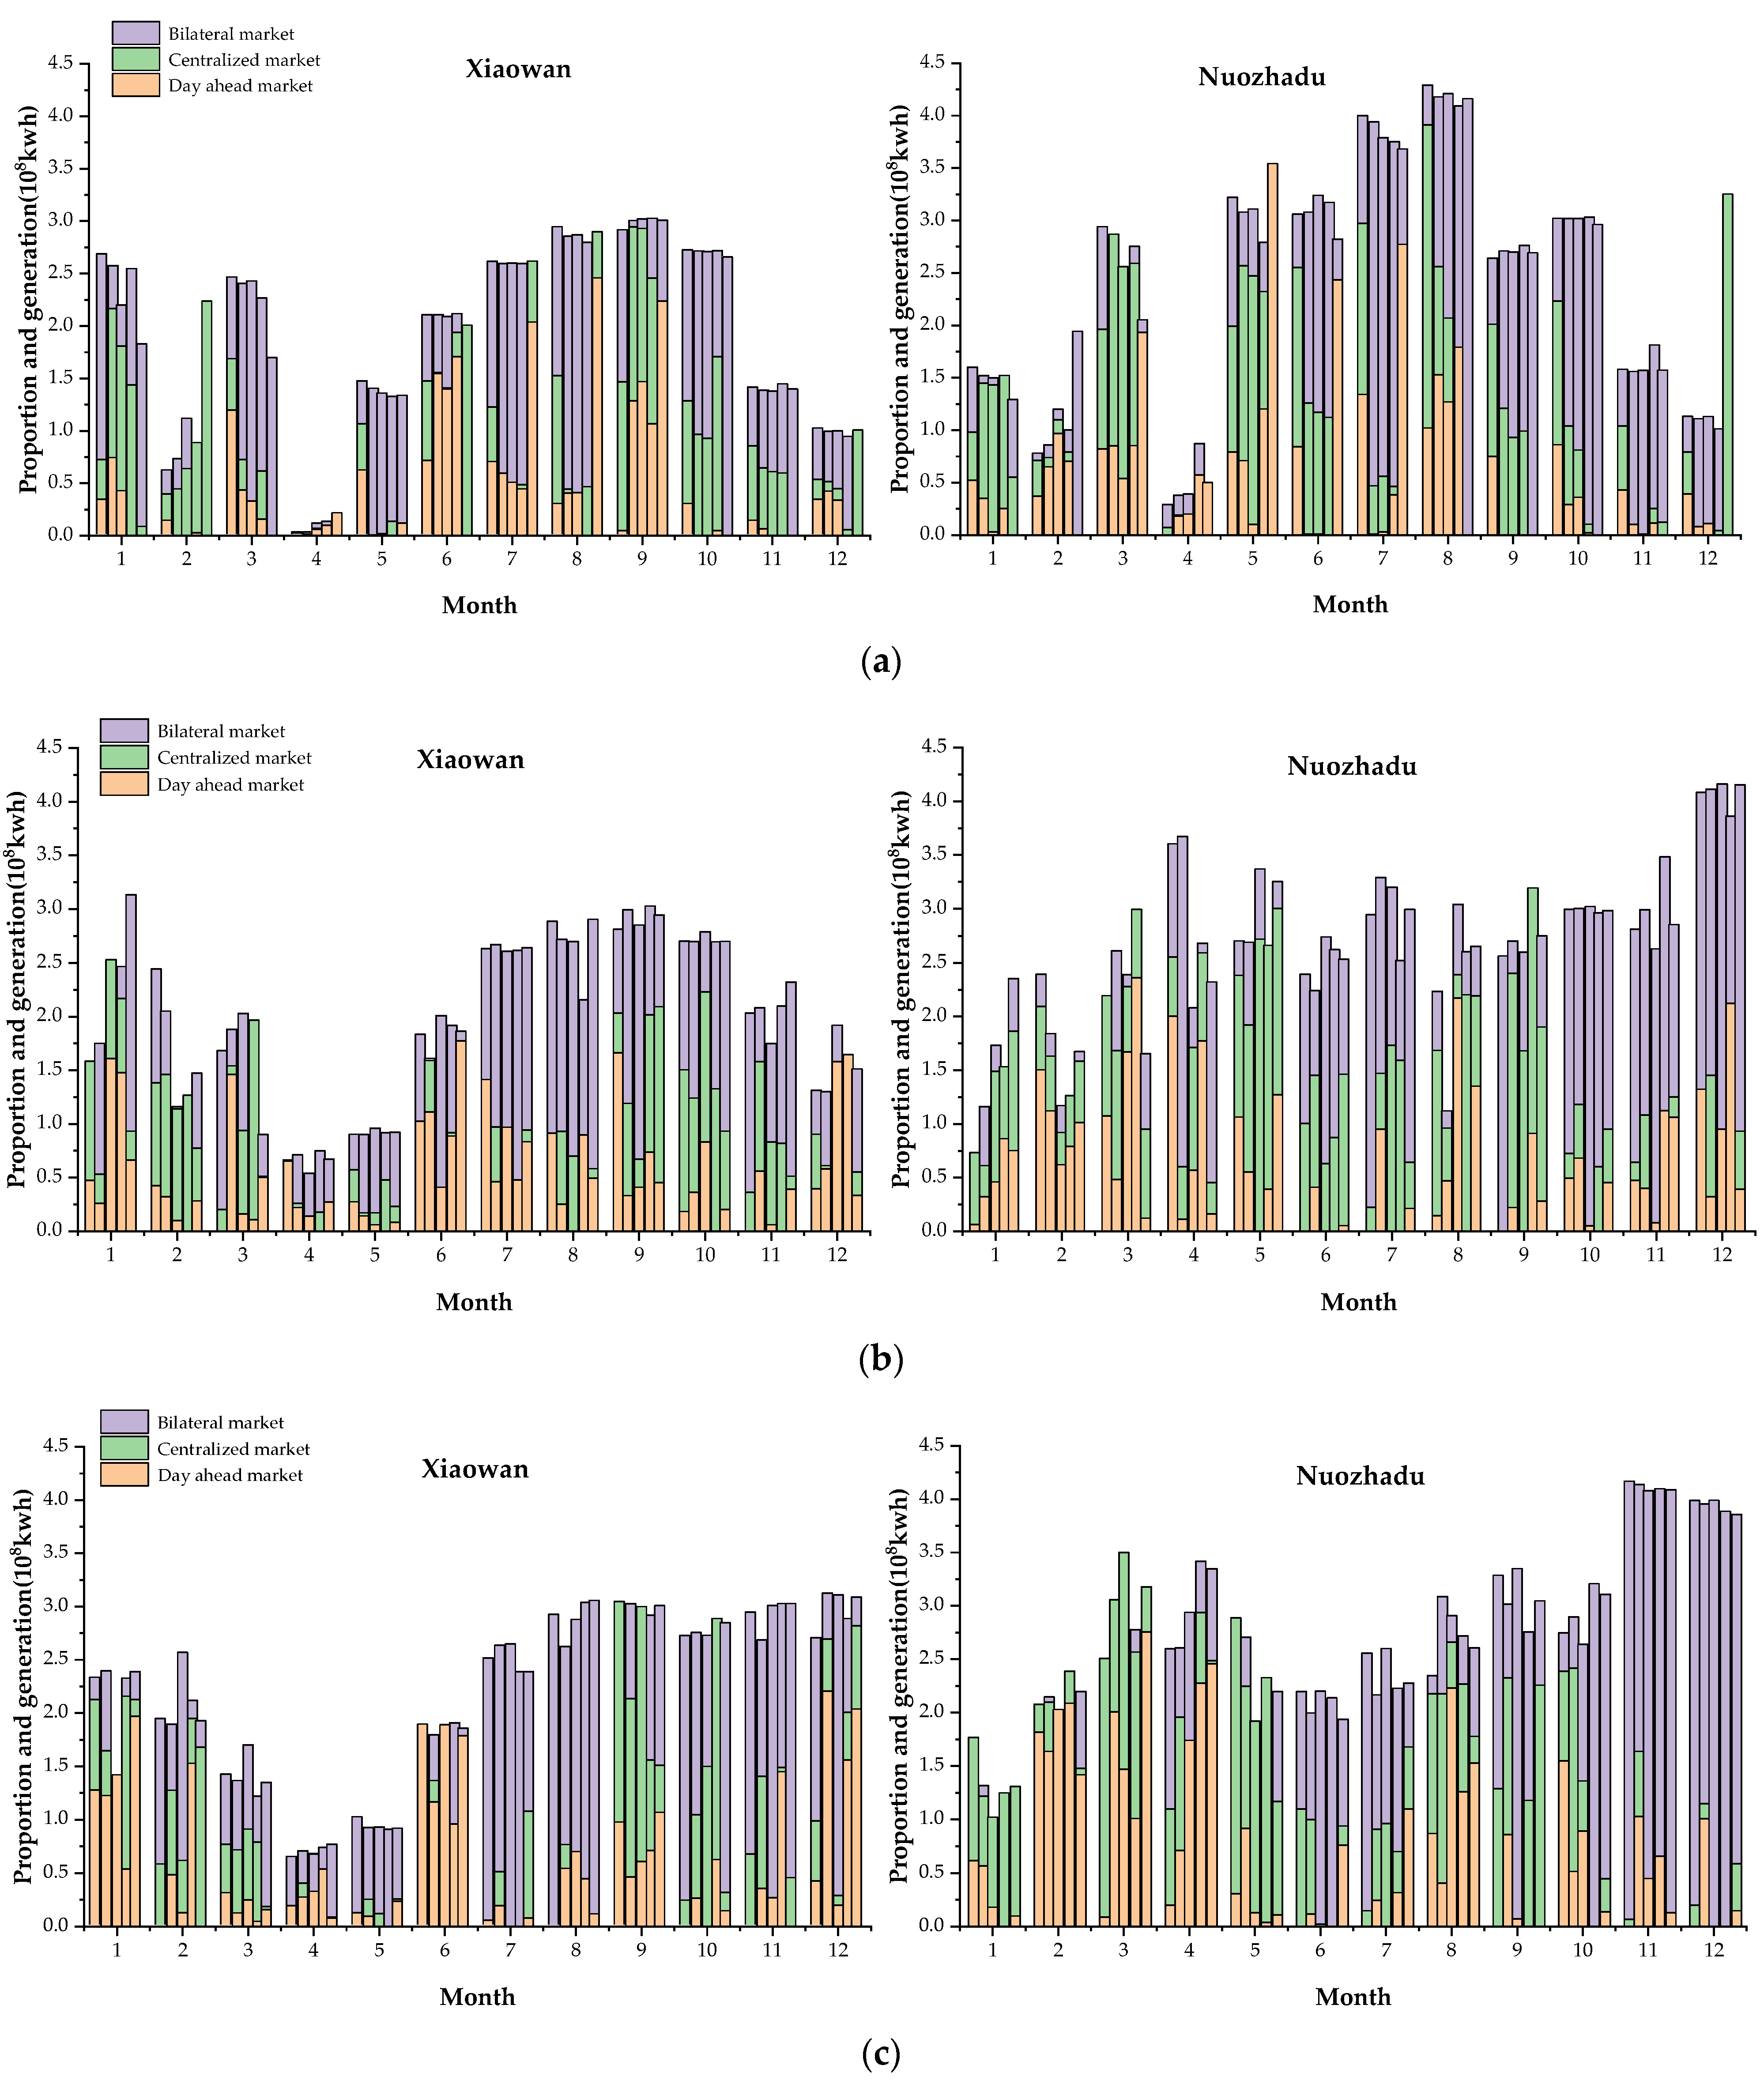
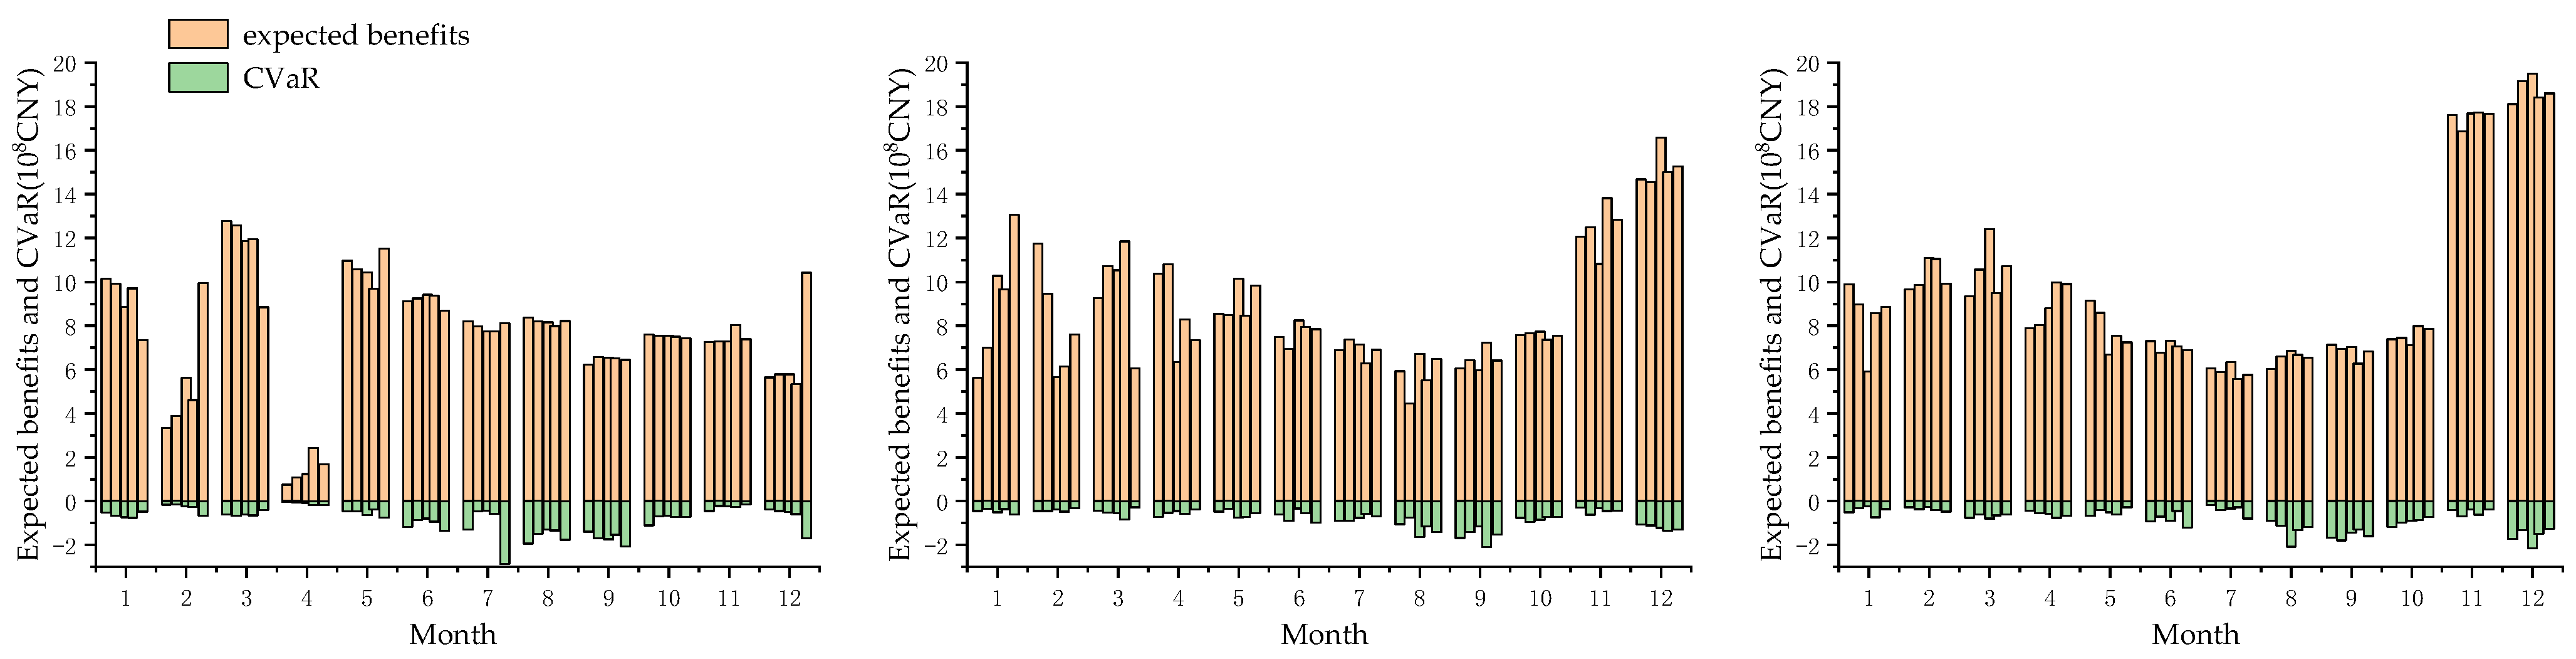
5. Results and Discussion Case Study

This analysis involves the following parts: (1) A non-inferior frontier solution set analysis under different incoming water conditions, (2) a solution set for water level and market proportion analysis and (3) a frontier solution set selection strategy.

5.1. Non-Inferior Frontier Solution Set under Different Incoming Water Conditions

In this paper, the population number was 100, the number of iterations was 500 and the inertia variable was adaptively changed with the iteration process. The purpose was to have a better global search capability in the early stage of the iteration, and focus on a local search at the end of the iteration. Therefore, the maximum inertia variable was set to 0.9 and the minimum inertia variable was set to 0.2, resulting in:
ω k = ω m a x k K ( ω m a x ω m i n )
where ω k is the inertia variable of the time, and k and K are the current iteration number and the maximum iteration number, respectively. The local speed factor was 1.2 and the global speed factor was 0.8. The individual contained two kinds of chromosomes, both of which used floating point coding: One was a water level chromosome; the initial water levels were set to 1230 m for Xiaowan and 805 m for Nuozhadu. The other was the proportion chromosome of risk market participation in the period, which was composed of a multi-dimensional array of reservoirs, which generates constraint satisfaction. Figure 5 shows the non-inferior set in a dry, normal and wet year. It can be seen that:
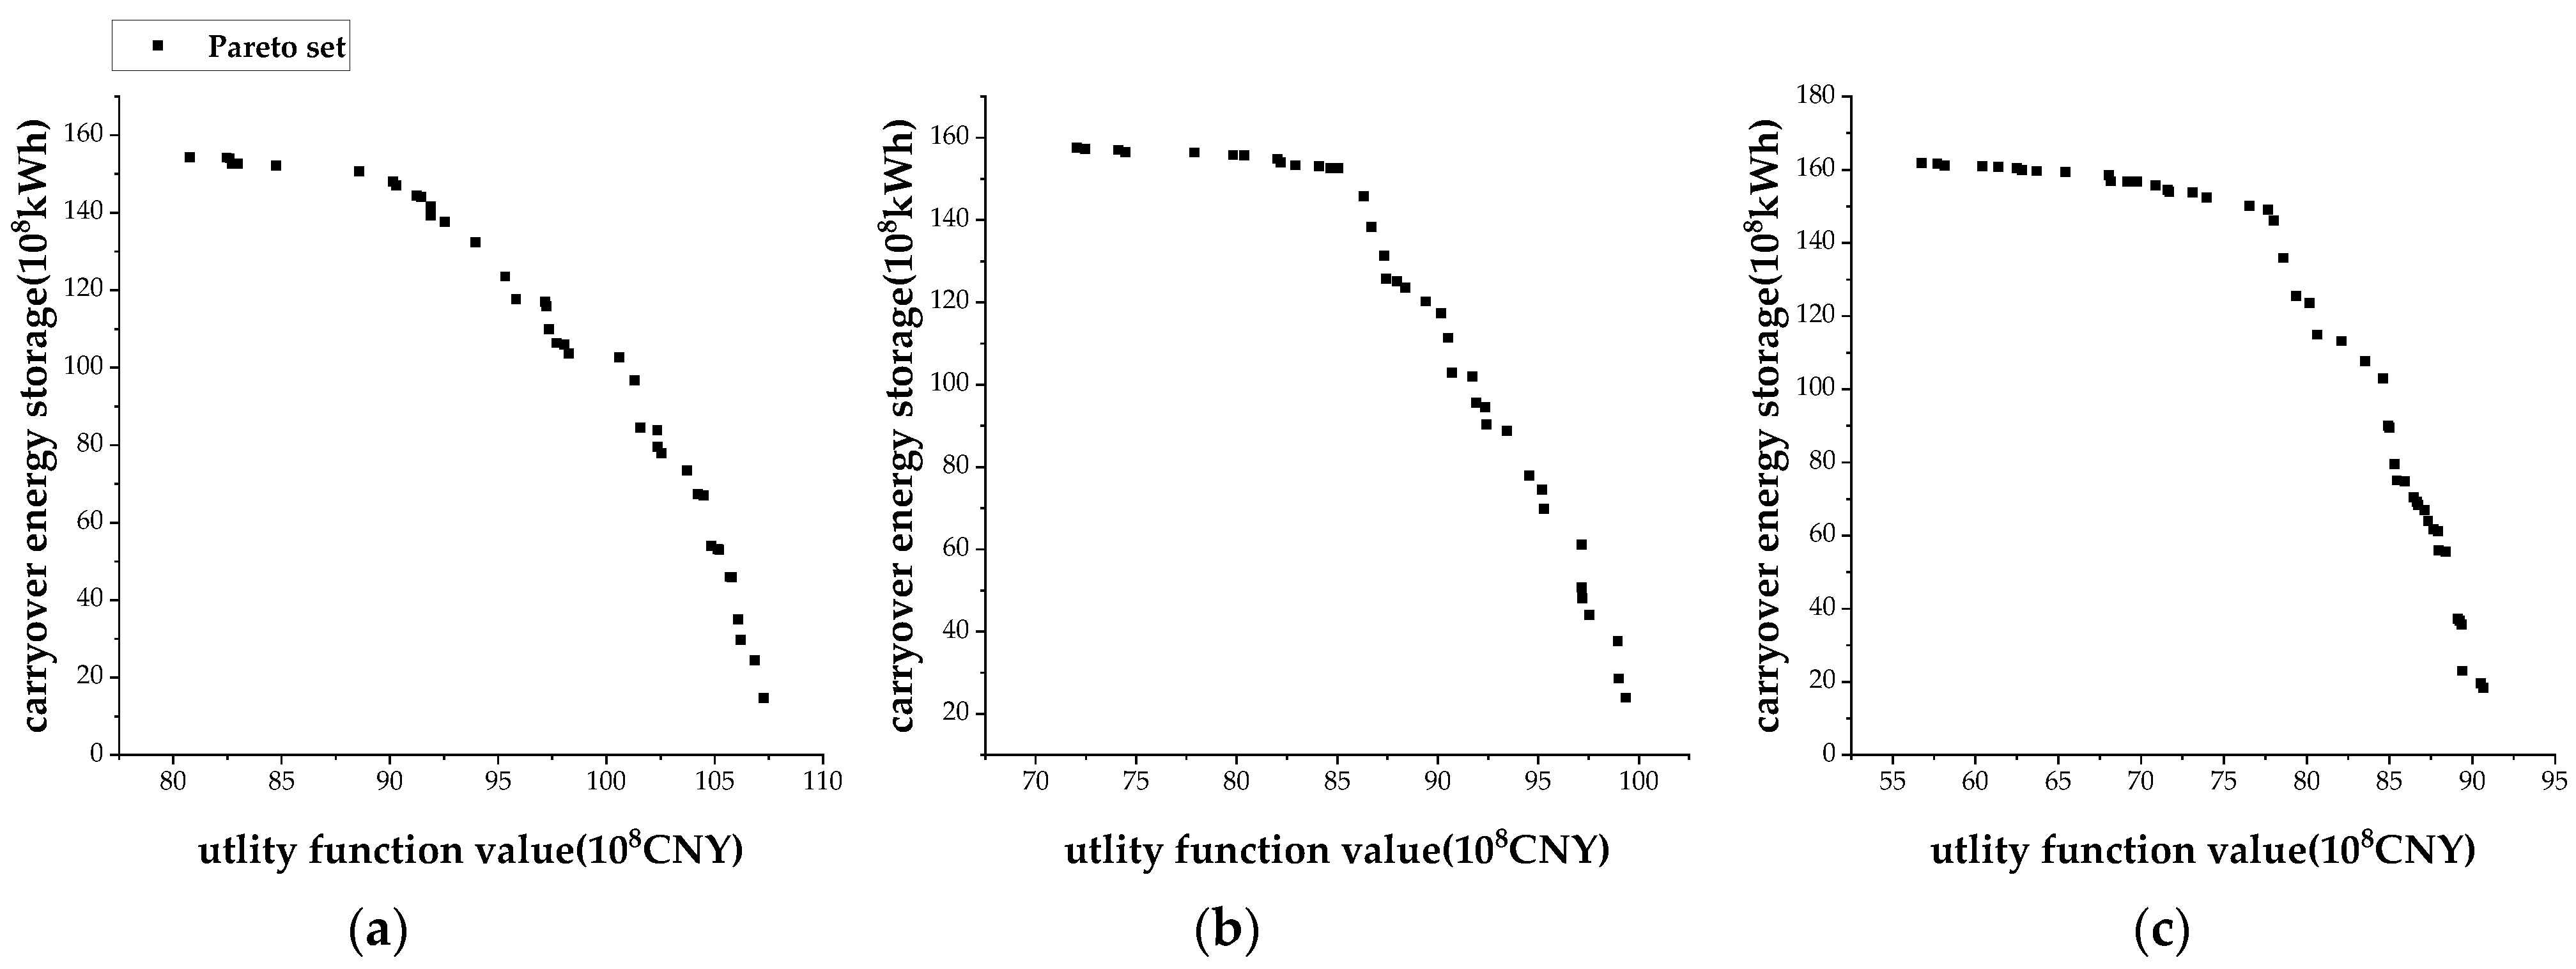
  • Under the different inflow conditions, the trend of the non-inferior set was similar, and the distribution of the overall points was relatively uniform. Figure 5 obviously demonstrated that the maximum and minimum values of the cascade utility function values changed significantly depending on the inflow conditions, i.e., the maximum market utility values in wet and dry years were 10.73 billion CNY and 9.07 billion CNY, respectively, which represents a reduction of 1.66 billion CNY, while the minimum values were 8.07 billion CNY and 5.67 billion CNY, respectively, representing a reduction of 2.40 billion CNY. It was found that the nature inflow has an obvious influence on market benefits but has little impact on the range of carryover energy storage.
  • The two objectives of market utility function value and carryover energy storage were obviously inversely proportional under the three different inflow conditions. With the increase of market utility value, the rate of decreasing carryover energy storage at the end of year increased, which means that it will take more cost of energy storage reduction to improve the market benefits when the benefits increase to a certain level. On the one hand, when the energy storage at the end of year is kept at a high level, the market benefits can be increased at a small cost.
  • The non-inferior set can cover a wider space. Under the three types of water inflow (flood, normal and dry), the range of market utility function was 2.65 billion CNY, 2.73 billion CNY and 3.39 billion CNY, respectively, while the range of carryover energy storage at end of year was 13.95 billion kWh, 13.36 billion kWh and 14.34 billion kWh, respectively.

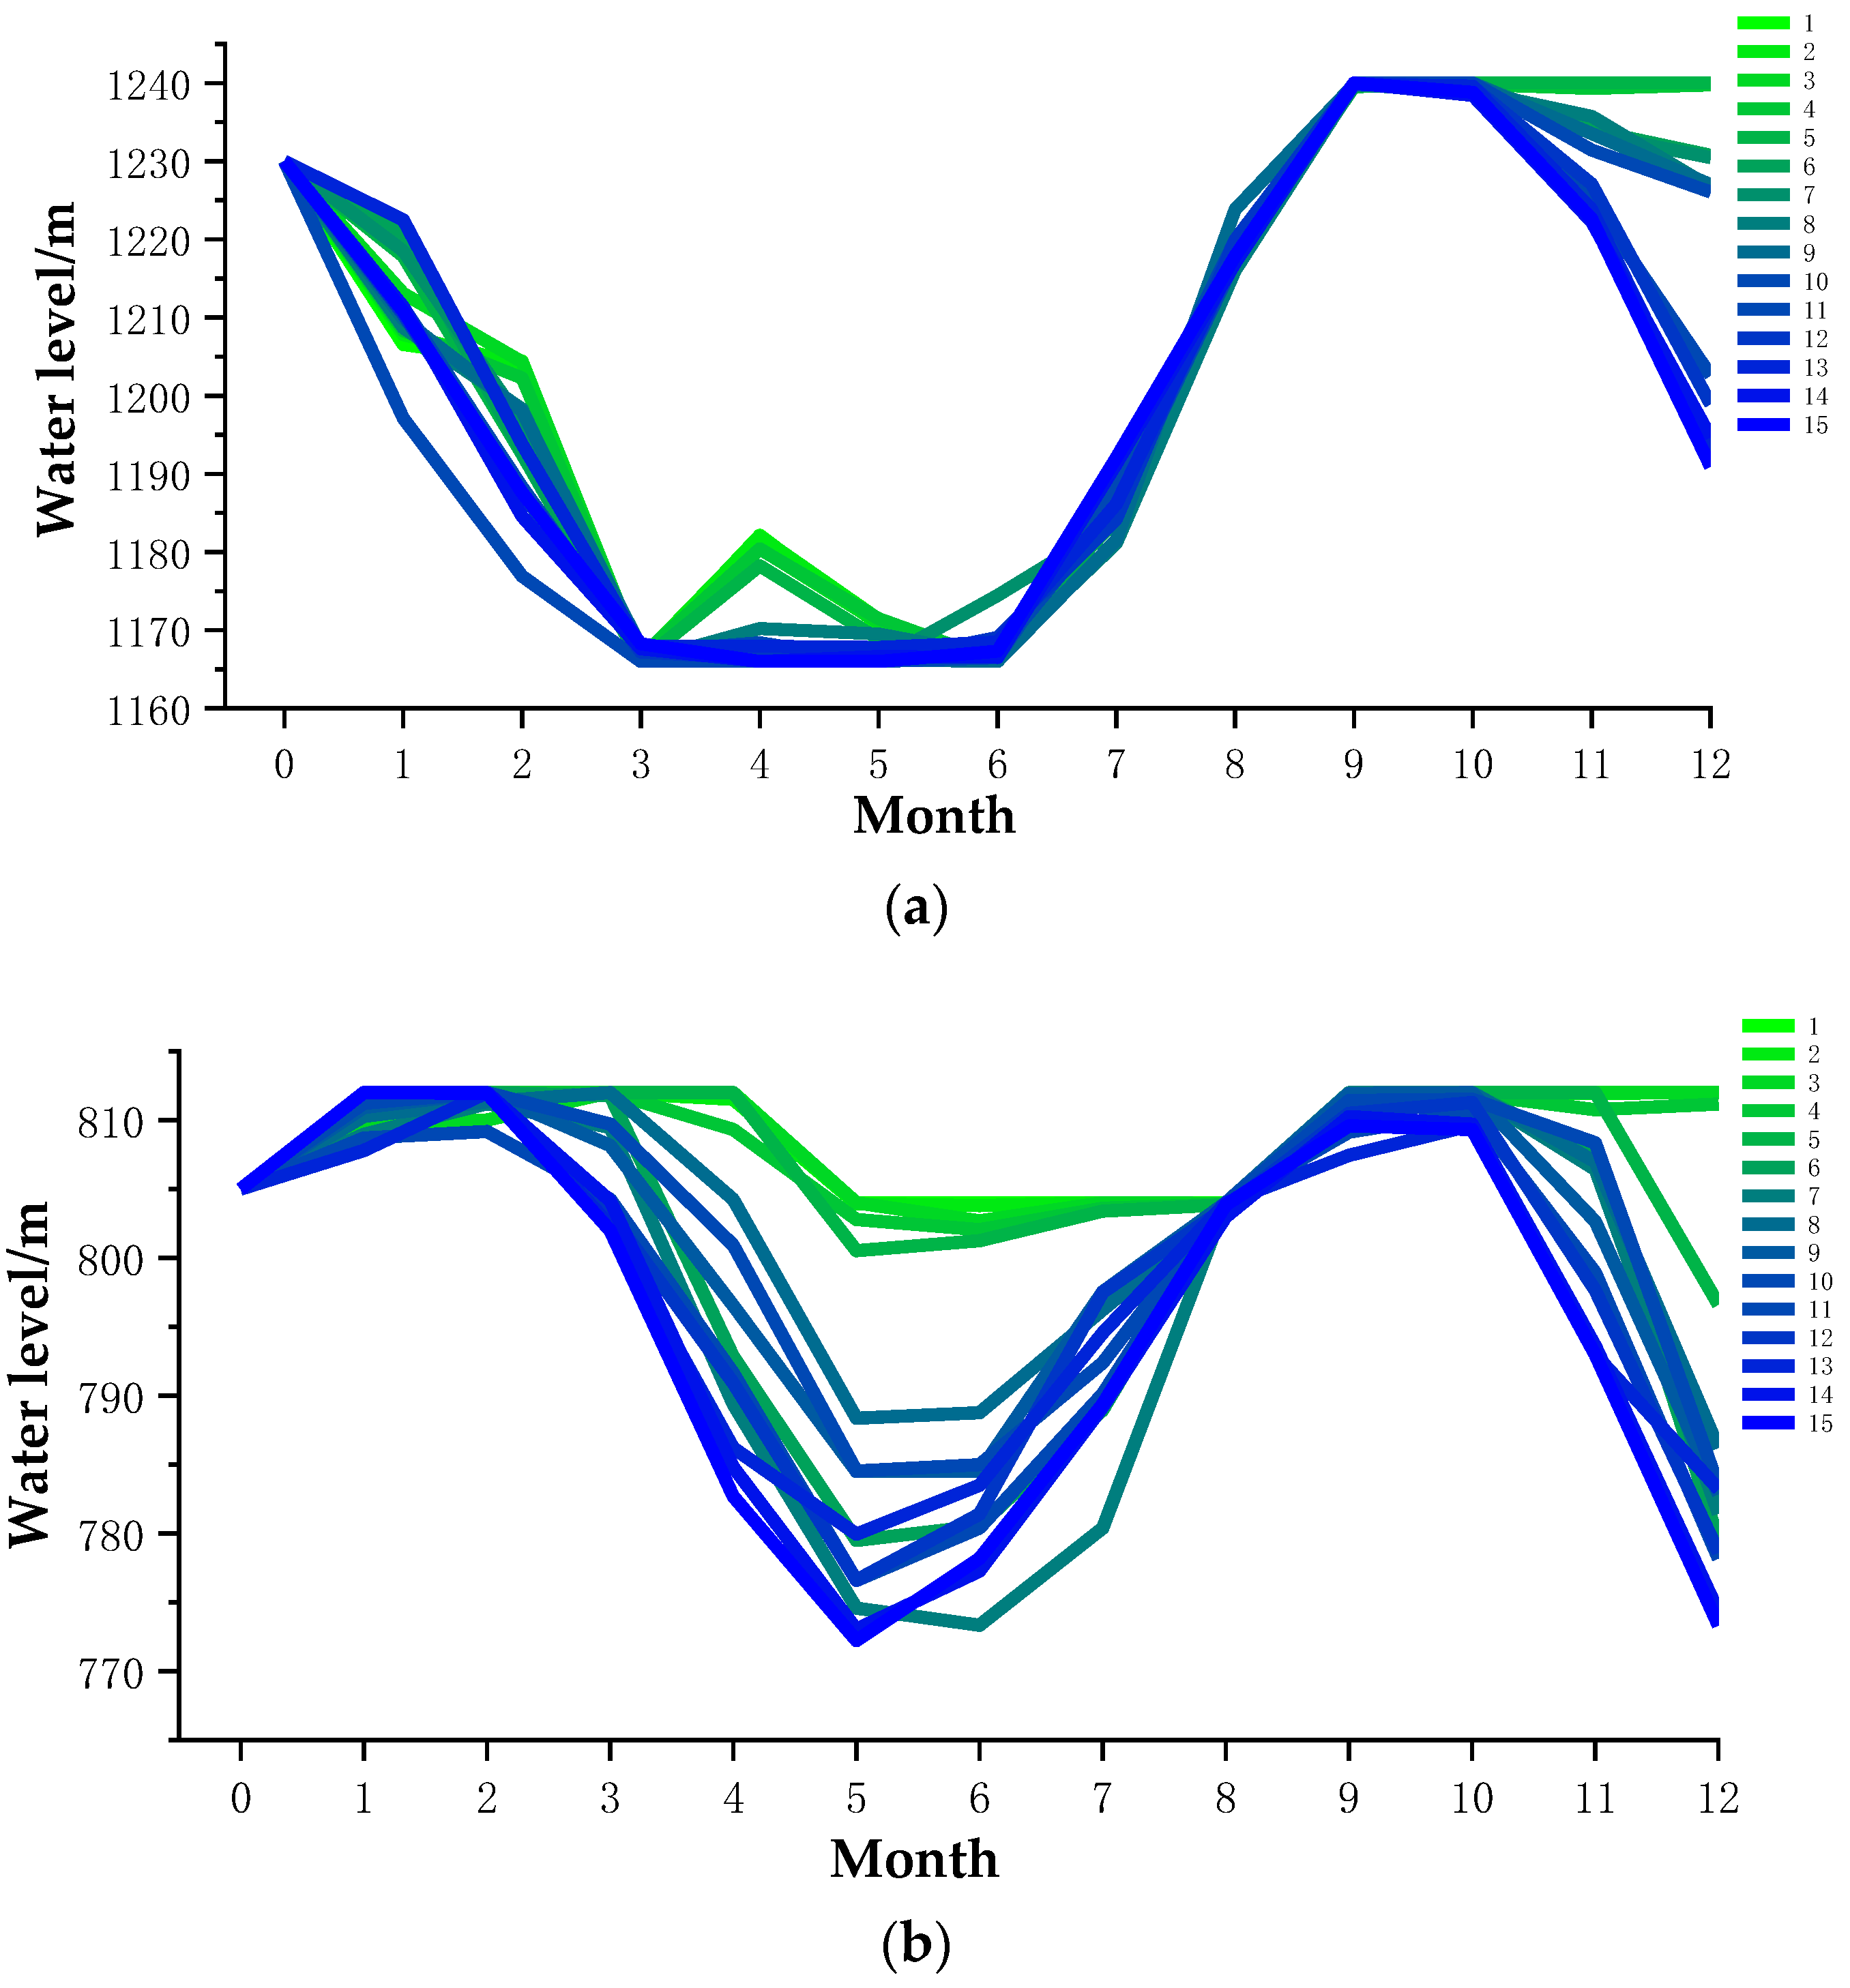
5.2. Operation Analysis in Solution Sets

In this sub-section we take five schemes of points from the leftmost, rightmost and middle of the non-inferior solutions sets under the wet year. These fifteen schemes of solution sets are listed in Table 3, ordered by market utility function value. Corresponding to solution groups in Table 3, the water level of cascade stations are shown in Figure 5, in which the more blue colors represent a greater market utility value of the cascade stations, and the more green colors represent a smaller market utility value of the cascade stations.
It can be seen that the average market utility values was 8.23 billion CNY and the average carryover energy storage was 15.36 billion kWh in schemes 1–5, while in schemes 11–15 the average was 10.64 and 2.99, respectively. It is obvious that the amplitude of market utility values was smaller than that of carryover energy storage. From the perspective of objective values, it was found that the increase in the rate of market benefits was far lower than the decrease in the rate of energy storage, as the increment of market benefits between schemes 5 and 6 was 1.42 billion CNY and the decrement of energy storage was 3.56 billion kWh, while the same values were 0.78 billion CNY and 6.01 billion kWh between schemes 10 and 11. This further explains that the two objectives are in conflict and restrict each other, which indicates that how an operator balances between them will directly affect the overall operation efficiency of the cascade stations now and in the future.
Generally, as shown in Figure 6a, the trend of Xiaowan’s water level curves in different schemes were similar from January to April: in the dry season the water level fell and water vacated the reservoir, while from June to September, in the flood season, the water level rose and water was stored in the reservoir. Under the two objectives of market utility value and energy storage, the water level at the end of year decreased in the schemes which pursued more market benefits. However, the trend of Nuozhadu’s water level curves were quite different in these schemes, and they are shown in Figure 6b. Take schemes 8–15, which pursued the market utility value, as examples: the water levels in the dry season (February to March) fell rapidly to increase the power generation, while the water levels in the flood season (January to October) increased slowly, to take advantage of the large amount of inflow to increase the power generation. On the other hand, the water level of schemes which pursued energy storage at the end of the year were at higher positions relatively to achieve a lower consumption rate to ensure the market utility value.
Figure 7 shows the portfolio proportion and generation in whole scheduling periods and Figure 8 shows the expected benefits and CVaR in whole scheduling periods. In terms of the types of markets hydropower stations choose to participate in, most of the months include two or more types which have considered market portfolios to reduce the value at risk under confidence levels. Combined with Figure 8, although the generation of stations in the flood season (June to October) is larger than in the other seasons (dry and normal), the expected benefits are not greater than the others in terms of the growth of utility function value, which is affected by a low average price. On the other hand, the CVaR increased due to the high power generation during the flood season. Thus, this indicates that the accuracy of the market price forecast is more important in the flood season. It is significant that, in November and December in schemes 11–15, the cascade lowered the water level to gain huge benefits instead of maintaining a high level for storage, which, combined with Figure 6, further explained the mutual constraints between objectives.

5.3. Selection Strategy of Non-Inferior Solution Set

In order to better screen the non-inferior solution for station operators, in this section we selected the power generation, minimum output and spillage energy as the evaluation indexes based on the actual scheduling demand, combined with a non-inferior solution set proposed in Table 3, and analyzed the performance of these schemes according to the previous evaluation indicators, and provided selection suggestions. The evaluation index of the non-inferior solution set is shown in Table 4.
It can be seen from Table 3 that the maximum market utility value was achieved in scheme 15, which was 10.73 billion CNY; the maximum carryover energy storage was achieved by scheme 1, which was 15.43 billion kWh; the maximum power generation was achieved by scheme 13, which was 59.77 billion kWh; the minimum output was achieved by scheme 8, which was 6078.05 MW; and the minimum spillage of energy was achieved by schemes 1, 2, 3 and 5, which had spillage of 0 billion kWh. According to the actual dispatching and market demand, the following suggestions can be given: (1) Considering the stable operation of the power grid, scheme 7 can be suggested, and the minimum system output values were higher than 6000 MW. (2) Taking into account the reduction of water spillage, schemes 1, 2, 3 and 5 can be suggested. (3) Considering the consumption of cascade power generation, schemes 13–15 schemes can be suggested.

6. Conclusions

In this study, we proposed a multi-objective optimization model considering both market benefits and energy storage at the end of the year for cascades in long-term operation schedules. Based on the mean-CVaR model, a utility function was established to measure the market portfolio benefits and risks in monthly trading. A chaotic mutation search mechanism, elite individual retention mechanism and dynamic updating of archives were incorporated into the MOPSO to guarantee the convergence efficiency of the algorithm and improve the diversity of solutions. To evaluate the proposed model, simulations with different inflow years were conducted to evaluate the rationality of the model. The following conclusions were drawn from the analysis:
  • The proposed multi-objective model can give a reasonable non-inferior solution set which considers both the market benefits and energy storage.
  • The optimal solution set reflected the mutual restriction of the objectives (that as market benefits of cascade stations increased, less energy storage for the cascade stations could be maintained at the end of scheduling).
  • The operation analysis revealed an internal relationship between benefits and risk. In a flood season, the benefits were not great, which was affected by low average prices, while the risk was relatively large due to the high power generation.
  • Based on the non-inferior solution, various schemes can be provided according to the different actual needs.
It should be mentioned that the market reform in China is still at an early stage and the number of available samples is relatively small. This paper was based on price distribution assumptions and the price scenarios were generated stochastically instead of using real historical data from markets. Due to the electricity market reform policy, more and more information might be available to the public in the future, so that the interaction characteristics between the markets could be analyzed in detail. The practical application of the proposed methodology can be extended to other objectives demanding detail such as flood control, irrigation and navigation. It is also recommended that further research be extended to cascade stations crossing provinces and regions.

Author Contributions

Conceptualization, H.Y. and J.S.; methodology, H.Y.; software, J.S.; validation, J.S. and C.C.; formal analysis, H.Y. and J.S.; investigation, H.C. and J.L.; writing—original draft preparation, H.Y.; writing—review and editing, J.S. and C.C. All authors have read and agreed to the published version of the manuscript.

Funding

This work was supported by the Fundamental Research Funds for the Central Universities (Nos.DUT22QN224 and DUT22JC21).

Data Availability Statement

The data presented in this study are available on request from the corresponding author. The data are not publicly available and please contact the correspondence author.

Acknowledgments

The writers are very grateful to the anonymous reviewers and editors for their constructive comments.

Conflicts of Interest

The authors declare no conflict of interest.

References

  1. Zhang, Z.; Zhang, S.; Geng, S.; Jiang, Y.; Li, H.; Zhang, D. Application of decision trees to the determination of the year-end level of a carryover storage reservoir based on the iterative dichotomizer 3. Int. J. Electr. Power Energy Syst. 2015, 64, 375–383. [Google Scholar] [CrossRef]
  2. Tan, Q.-F.; Wen, X.; Fang, G.-H.; Wang, Y.-Q.; Qin, G.-H.; Li, H.-M. Long-term optimal operation of cascade hydropower stations based on the utility function of the carryover potential energy. J. Hydrol. 2020, 580, 124359. [Google Scholar] [CrossRef]
  3. Shen, J.; Cheng, C.; Wang, S.; Yuan, X.; Sun, L.; Zhang, J. Multiobjective optimal operations for an interprovincial hydropower system considering peak-shaving demands. Renew. Sustain. Energy Rev. 2020, 120, 109617. [Google Scholar] [CrossRef]
  4. Niu, W.; Wu, X.; Feng, Z.; Shen, J.; Cheng, C. The Optimal Operation Method of Multi-reservoir System Under the Cascade Storage Energy Control. Proc. Chin. Soc. Electr. Eng. 2017, 37, 3139–3147. [Google Scholar]
  5. Zeng, Y.-H.; Jiang, T.-B.; Zhang, Y.-C. A long-term scheduling model for stored energy maximization of Three Gorges cascade hydroelectric stations and its decomposition algorithm. Power Syst. Technol. 2004, 28, 5–8. [Google Scholar]
  6. Shen, J.J.; Cheng, C.T.; Jia, Z.B.; Zhang, Y.; Lv, Q.; Cai, H.X.; Wang, B.-C.; Xie, M.-F. Impacts, challenges and suggestions of the electricity market for hydro-dominated power systems in China. Renew. Energy 2022, 187, 743–759. [Google Scholar] [CrossRef]
  7. Kaye, R.J.; Outhred, H.R.; Bannister, C.H. Forward contracts for the operation of an electricity industry under spot pricing. IEEE Trans. Power Syst. 1990, 5, 46–52. [Google Scholar] [CrossRef]
  8. Bjorgan, R.; Liu, C.C.; Lawarree, J. Financial risk management in a competitive electricity market. IEEE Trans. Power Syst. 1999, 14, 1285–1291. [Google Scholar] [CrossRef]
  9. Sheble, G.B. Decision analysis tools for GENCO dispatchers. IEEE Trans. Power Syst. 1999, 14, 745–750. [Google Scholar] [CrossRef]
  10. Siddiqi, S.N. Project valuation and power portfolio management in a competitive market. IEEE Trans. Power Syst. 2000, 15, 116–121. [Google Scholar] [CrossRef]
  11. Yan, X.; Gu, C.; Wyman-Pain, H.; Li, F. Capacity Share Optimization for Multiservice Energy Storage Management Under Portfolio Theory. IEEE Trans. Ind. Electron. 2019, 66, 1598–1607. [Google Scholar] [CrossRef]
  12. Garcia, R.C.; Gonzalez, V.; Contreras, J.; Custodio, J.E. Applying modern portfolio theory for a dynamic energy portfolio allocation in electricity markets. Electr. Power Syst. Res. 2017, 150, 11–23. [Google Scholar] [CrossRef]
  13. Liu, M.; Wu, F.F. Risk management in a competitive electricity market. Int. J. Electr. Power Energy Syst. 2007, 29, 690–697. [Google Scholar] [CrossRef]
  14. Zhao, W.-H.; Wang, W.; Shi, Q.-S.; Dao, Q. Dynamic multi-stage optimization configuration model for electricity assets based on conditional value at risk. Power Syst. Technol. 2009, 33, 77–82. [Google Scholar]
  15. Zhang, Y.; Zhao, H.; Li, B.; Zhao, Y.; Qi, Z. Research on credit rating and risk measurement of electricity retailers based on Bayesian Best Worst Method-Cloud Model and improved Credit Metrics model in China’s power market. Energy 2022, 252, 124088. [Google Scholar] [CrossRef]
  16. Zhang, X.-P.; Chen, L.; Wu, R.-L. Analysis of multi-period combined bidding of power suppliers based on weighted CVaR. Proc. CSEE 2008, 28, 79–83. [Google Scholar]
  17. Zhang, Q.; Wang, X.; Wang, J. Electricity Purchasing and Selling Risk Decision for Power Supplier Under Real-time Pricing. Autom. Electr. Power Syst. 2010, 34, 22–27. [Google Scholar]
  18. White, H.; Kim, T.-H.; Manganelli, S. VAR for VaR: Measuring tail dependence using multivariate regression quantiles. J. Econom. 2015, 187, 169–188. [Google Scholar] [CrossRef] [Green Version]
  19. Denton, M.; Palmer, A.; Masiello, R.; Skantze, P. Managing market risk in energy. IEEE Trans. Power Syst. 2003, 18, 494–502. [Google Scholar] [CrossRef] [Green Version]
  20. Dahgren, R.; Liu, C.C.; Lawarree, J. Risk assessment in energy trading. IEEE Trans. Power Syst. 2003, 18, 503–511. [Google Scholar] [CrossRef]
  21. Wu, X.; Cheng, C.; Zeng, Y.; Lund, J.R. Centralized versus Distributed Cooperative Operating Rules for Multiple Cascaded Hydropower Reservoirs. J. Water Resour. Plan. Manag. 2016, 142, 05016008. [Google Scholar] [CrossRef]
  22. Wen, X.; Zhou, J.; He, Z.; Wang, C. Long-Term Scheduling of Large-Scale Cascade Hydropower Stations Using Improved Differential Evolution Algorithm. Water 2018, 10, 383. [Google Scholar] [CrossRef] [Green Version]
  23. Cheng, C.-T.; Shen, J.-J.; Wu, X.-Y.; Chau, K.-W. Operation challenges for fast-growing China’s hydropower systems and respondence to energy saving and emission reduction. Renew. Sustain. Energy Rev. 2012, 16, 2386–2393. [Google Scholar] [CrossRef] [Green Version]
  24. Luo, B.; Miao, S.; Cheng, C.; Lei, Y.; Chen, G.; Gao, L. Long-Term Generation Scheduling for Cascade Hydropower Plants Considering Price Correlation between Multiple Markets. Energies 2019, 12, 2239. [Google Scholar] [CrossRef] [Green Version]
  25. Fang, R.; Popole, Z. Multi-objective optimized scheduling model for hydropower reservoir based on improved particle swarm optimization algorithm. Environ. Sci. Pollut. Res. 2020, 27, 12842–12850. [Google Scholar] [CrossRef]
  26. Reddy, M.J.; Kumar, D.N. Multi-objective particle swarm optimization for generating optimal trade-offs in reservoir operation. Hydrol. Process. 2007, 21, 2897–2909. [Google Scholar] [CrossRef]
  27. Reddy, M.J.; Kumar, D.N. Optimal reservoir operation using multi-objective evolutionary algorithm. Water Resour. Manag. 2006, 20, 861–878. [Google Scholar] [CrossRef] [Green Version]
  28. Feng, Z.-K.; Liu, D.; Niu, W.-J.; Jiang, Z.-Q.; Luo, B.; Miao, S.-M. Multi-Objective Operation of Cascade Hydropower Reservoirs Using TOPSIS and Gravitational Search Algorithm with Opposition Learning and Mutation. Water 2019, 11, 2040. [Google Scholar] [CrossRef] [Green Version]
  29. Lu, J.; Li, G.; Cheng, C.; Yu, H. Risk Analysis Method of Cascade Plants Operation in Medium Term Based on Mul-ti-Scale Market and Settlement Rules. IEEE Access 2020, 8, 90730–90740. [Google Scholar] [CrossRef]
  30. Mausser, H.; Rosen, D.; Ieee, I. Beyond VaR: From Measuring Risk to Managing Risk. In Proceedings of the IEEE/IAFE Conference on Computational Intelligence for Financial Engineering (CIFE), New York, NY, USA, 28–30 March 1999; pp. 163–178. [Google Scholar] [CrossRef]
  31. Artzner, P.; Delbaen, F.; Eber, J.M.; Heath, D. Coherent measures of risk. Math. Financ. 1999, 9, 203–228. [Google Scholar] [CrossRef]
  32. Rockafellar, R.T.; Uryasev, S. Conditional value-at-risk for general loss distributions. J. Bank. Financ. 2002, 26, 1443–1471. [Google Scholar] [CrossRef]
  33. Duenas, P.; Reneses, J.; Barquin, J. Dealing with multi-factor uncertainty in electricity markets by combining Monte Carlo simulation with spatial interpolation techniques. Iet Gener. Transm. Distrib. 2011, 5, 323–331. [Google Scholar] [CrossRef]
  34. Markowitz, H.M. Foundations of Portfolio Theory. J. Financ. 1991, 46, 469–477. [Google Scholar] [CrossRef]
  35. Liu, M.; Wu, F.F. Portfolio optimization in electricity markets. Electr. Power Syst. Res. 2007, 77, 1000–1009. [Google Scholar] [CrossRef]
  36. Zhao, S.Z.; Suganthan, P.N. Two-lbests based multi-objective particle swarm optimizer. Eng. Optim. 2011, 43, 1–17. [Google Scholar] [CrossRef]
  37. Abido, M.A. Multiobjective particle swarm optimization for environmental/economic dispatch problem. Electr. Power Syst. Res. 2009, 79, 1105–1113. [Google Scholar] [CrossRef]
Figure 1. Methodological framework of the proposed optimization model.
Energies 16 00604 g001
Figure 2. Multi-objective Particle Swarm Optimization Solution Framework.
Energies 16 00604 g002
Figure 3. The distribution chart of Xiaowan and Nuozhadu.
Energies 16 00604 g003
Figure 4. The monthly local inflow of each reservoir in wet, normal and dry years.
Energies 16 00604 g004
Figure 5. The non-inferior set result under different inflow years: (a) wet year, (b) normal year, (c) dry year.
Energies 16 00604 g005
Figure 6. The optimization process of regulating reservoirs in schemes 1 to 15. (a) Xiaowan; (b) Nuozhadu.
Energies 16 00604 g006
Figure 7. Market portfolio and generation of regulating reservoirs in schemes 1 to 15. (a) Schemes 1–5; (b) Schemes 6–10; (c) Schemes 11–15.
Energies 16 00604 g007
Figure 8. Expected benefits and CVaR of cascade reservoirs in schemes 1 to 15.
Energies 16 00604 g008
Table 1. Characteristics of hydropower plants.
Plant NameInstalled Capacity (MW)Normal Level (m)Flood Control Level (m)Dead Level (m)Maximum Discharge
(m3/s)
Maximum
Generation Flow (m3/s)
Xiaowan4200.001240.001236.001166.0020,683.002202.00
Nuozhadu5850.00812.00804.00765.0027,418.003240.00
Table 2. The parameters of market clear price for multi-markets in a different month (CNY/MWh).
MonthCentralized MarketBilateral MarketDay Ahead Market
Avg.Std.Avg.Std.Avg.Std.
Jan.239.8212.19234.888.53244.153.27
Feb.242.2914.3233.952.56246.35.88
Mar.240.1113.02234.852.46237.7710.25
Apr.240.0712.56246.346.52240.1612.17
May236.0113.01231.232.67238.819.42
Jun.174.5816.79172.041.83186.5823.12
Jul.123.6117.21120.011.86131.2529.59
Aug.114.7118.26112.691.79123.5434.29
Sep.114.6618.8104.579.97126.440.79
Oct.125.6416.05132.276.46148.0932.64
Nov236.7515.62249.272.38250.2514.23
Dec.244.9619.92275.0315.67270.1718.38
Note: Avg. indicates the average value of the market clear price; Std. indicates the standard deviation of the market clear price.
Table 3. Non-inferior set of two objective functions.
Non-Inferior Set
Scheme Number
f 1 /Billion CNY f 2 /Billion kWh
18.0815.43
28.2515.42
38.2615.41
48.2715.27
58.3015.27
69.7211.71
79.7211.58
89.7311.00
99.7710.64
109.8010.6
1110.584.59
1210.613.50
1310.622.98
1410.682.45
1510.731.47
Table 4. Evaluation index of non-inferior solution set.
Non-Inferior Set
Number
Evaluation Index
Minimum Output
/MW
Power Generation
/Billion kWh
Spillage Energy
/Billion kWh
1459.2951.260.00
2670.1551.310.00
3875.4051.290.00
41587.2951.420.04
51259.8453.270.00
65264.1055.340.62
76078.0555.000.57
84386.5655.970.43
95632.4955.920.77
104639.7056.090.55
115369.6458.961.20
125583.6159.121.60
135074.7259.771.02
145520.0859.361.84
155394.7259.562.15
Disclaimer/Publisher’s Note: The statements, opinions and data contained in all publications are solely those of the individual author(s) and contributor(s) and not of MDPI and/or the editor(s). MDPI and/or the editor(s) disclaim responsibility for any injury to people or property resulting from any ideas, methods, instructions or products referred to in the content.

