Article

In Situ Airtightness Measurement Using Compressed Air Flow Characteristics

1
Energy ICT Research Department, Korea Institute of Energy Research, Daejeon 34129, Republic of Korea
2
Department of Architectural Engineering, Chungnam National University, Daejeon 34134, Republic of Korea
*
Author to whom correspondence should be addressed.
Energies 2023, 16(19), 6975; https://doi.org/10.3390/en16196975
Submission received: 13 September 2023 / Revised: 5 October 2023 / Accepted: 5 October 2023 / Published: 6 October 2023
(This article belongs to the Section B: Energy and Environment)

Abstract

:
The airtightness of a building has a significant impact on energy savings, structural longevity, and indoor air quality for occupants. Therefore, it is essential to accurately measure the airtightness of buildings, though the widely used fan pressurization method suffers from several shortcomings. For this reason, transient methods have recently emerged to assess airtightness by monitoring pressure changes over time, but studies using transient methods in this field are rare. In this study, we selected three representative buildings to conduct field tests to verify the practical applicability of the improved transient method. To verify the results of the transient method, we conducted a comparison experiment with the blower door test: a widely used measurement method. When measuring the effective leakage area, the average standard deviation of the transient method was 0.903 cm2, which was much smaller than the blower door test result of 1.488 cm2. In addition, the recorded standard errors ranged from 0.197 cm2 to 0.816 cm2 for the transient method and from 0.269 cm2 to 1.801 cm2 for the blower door test. Notably, the transitional method was more reproducible than the blower door test while showing similar accuracy. Given these results, it is expected that the improved transitional method can be used to evaluate airtightness performance in the field.

1. Introduction

Buildings with prolonged operational durations may experience degradation in their insulation and airtightness attributes. Such deterioration can result in elevated energy consumption and potentially jeopardize the safety of the building’s occupants [1,2]. The importance of airtightness in established structures is well-recognized due to its direct impact on energy consumption for both heating and cooling purposes [3,4]. According to the U.S. Department of Energy, moisture infiltration through the building envelope results in significant energy losses, which can be 25–40% of the energy used for heating and cooling [5,6]. Raman [7] estimates that about 23% of the total heating energy used in U.S. residential and commercial buildings and about 14% of the total cooling energy used is due to infiltration. The envelope of a degraded airtight building may not be adequately ventilated, which can lead to condensation and dramatically reduce the life of the building. Furthermore, variations in airtightness may cause inaccuracies in the air conditioning system design, thereby hindering the provision of healthy indoor air quality for occupants. Consequently, it is critical to accurately assess the airtightness of existing structures and implement appropriate corrective measures.
There are many approaches to the measurement of a building’s airtightness, but the most commonly applied methods are the tracer gas technique [8,9,10,11] and the fan pressurization method [12,13], incorporating a blower door [14]. Both methods are representative of the steady method in which the leakage area is measured by continuously injecting air into the test space [15]. In the fan pressure technique, a fan is attached to the exterior door of a building and pressurized or depressurized to determine the level of infiltration by measuring the volume of air (Q) from the fan when the pressure difference between the inside and the outside (ΔP) reaches a predetermined value. This method typically works within a range of 10–60 Pa to minimize disturbances from external wind or buoyancy. However, this method has the drawback that the leakage of the opening gap cannot be measured as it is installed in the opening frame without any leakage [16]. Furthermore, the actual flow rate through the fan is influenced by both fan speed and space leakage, which necessitates pre-calibration. As the measurement area expands and the fan size increases, airtightness can be compromised.
Mattsson introduced the transient method to overcome certain shortcomings [17]. In the transient method, a chamber of a specific size or volume of air is pressurized to a particular level before sealing the air supply channel. The pressure in the surrounding structure decreases due to air leaks once the desired pressure level is reached. Pressure decay is measured over time, and gas laws are used to relate the time derivative of the pressure difference to the change in mass per unit of time.
To ensure the reproducibility of this experiment, Lee et al. [18] suggested a novel experimental method employing the transient technique proposed earlier. In this study, the effective leakage area was calculated using the air expansion from a compressed rigid tank into a room. This was performed by recording the pressure changes in the chamber and room simultaneously [18,19]. The effectiveness of the transient method was investigated by performing experiments in a classified laboratory under various conditions. However, the use of the transient method in practical applications is not discussed because there were no tests conducted in the field.
In real buildings, there are many variables that affect the buoyancy effect, construction problems, and ventilation. These variables may lead to results that are inconsistent with those obtained in the laboratory. Therefore, it is necessary to conduct various field tests to minimize influencing factors and verify their applicability to the field. In this study, three real buildings were selected to perform field measurements to verify the applicability of the proposed experimental method to the field. The three sites were selected based on their different uses and sizes in order to take measurements under different conditions. In addition, a comparative experiment was conducted under the same conditions as the existing, widely used blower door test to verify the accuracy of the proposed experimental method. The results of these field measurements verify the accuracy and reproducibility of the proposed experimental method and are expected to contribute to the accurate measurement of airtightness in buildings in the future.

2. Numerical Method

2.1. Transient Method

The airflow through a leak is primarily defined by the power law form in relation to the pressure difference. This relationship can be expressed as follows:
Q l e a k = C Δ P R n ,
Assuming that the flow at a given reference pressure, Δ P , is similar to the orifice flow, the effective leakage area (ELA), A e f f , can be calculated using the basic Bernoulli equation. The equation is expressed as follows:
Q l e a k = A e f f 2 Δ P R ρ
The rate of leakage can be expressed using the equation of mass continuity, as follows:
d m R d t + d m C d t = ρ R Q l e a k ,
where m R and m C are the masses of air in the test space and chamber, respectively. The mass of air leaving the pressurized volume due to leakage can be expressed as the leakage volume. Using the gas law, the mass and density can be written as:
m = P · V R a · T       o r     ρ = P R a · T ,
Substituting Equation (4) into Equation (2), the leakage rate can be written as follows. From the equation below, it can be seen that in order to measure the leakage, the values of V R , P R and T R (the volume, pressure and temperature of the test space) and V C , P C and T C (the volume, pressure and temperature of the chamber) are required.
1 ρ V R R d d t P R T R + V C V R d d t P C T C = Q l e a k ,
Equation (3) can be integrated over the indoor pressure change period, Δ t , and the expression after integration can be substituted into Equation (2) and written as:
A e f f 0 Δ t 2 ρ Δ P R d t = m C , 0 m C , Δ t + m R , 0 m R , Δ t ,
The change in room mass can be simplified using the density ratio of the air blown out through the solenoid valve, and finally, the effective leakage area can be expressed by:
A e f f = V C ρ R / 2 0 Δ t Δ P R d t   P C , 0 P a t m 1 n 1 ,

2.2. Fan Pressrization with Blower Door

ASTM E779-10 [13] was used to calculate the ELA for the blower door test. By correcting the air leakage coefficient C in Equation (1) to standard conditions (20 °C and sea level E = 0 m), it can be written as follows:
C o = C μ μ o 2 n 1 ρ ρ o 1 n ,
The ELA was calculated from the corrected air leakage coefficient and the pressure exponent using a reference pressure, d P r as shown in Equation (9):
A e f f = C o ρ o 2 1 2   d P r n 1 2 ,

3. Outline of the Field Measurement

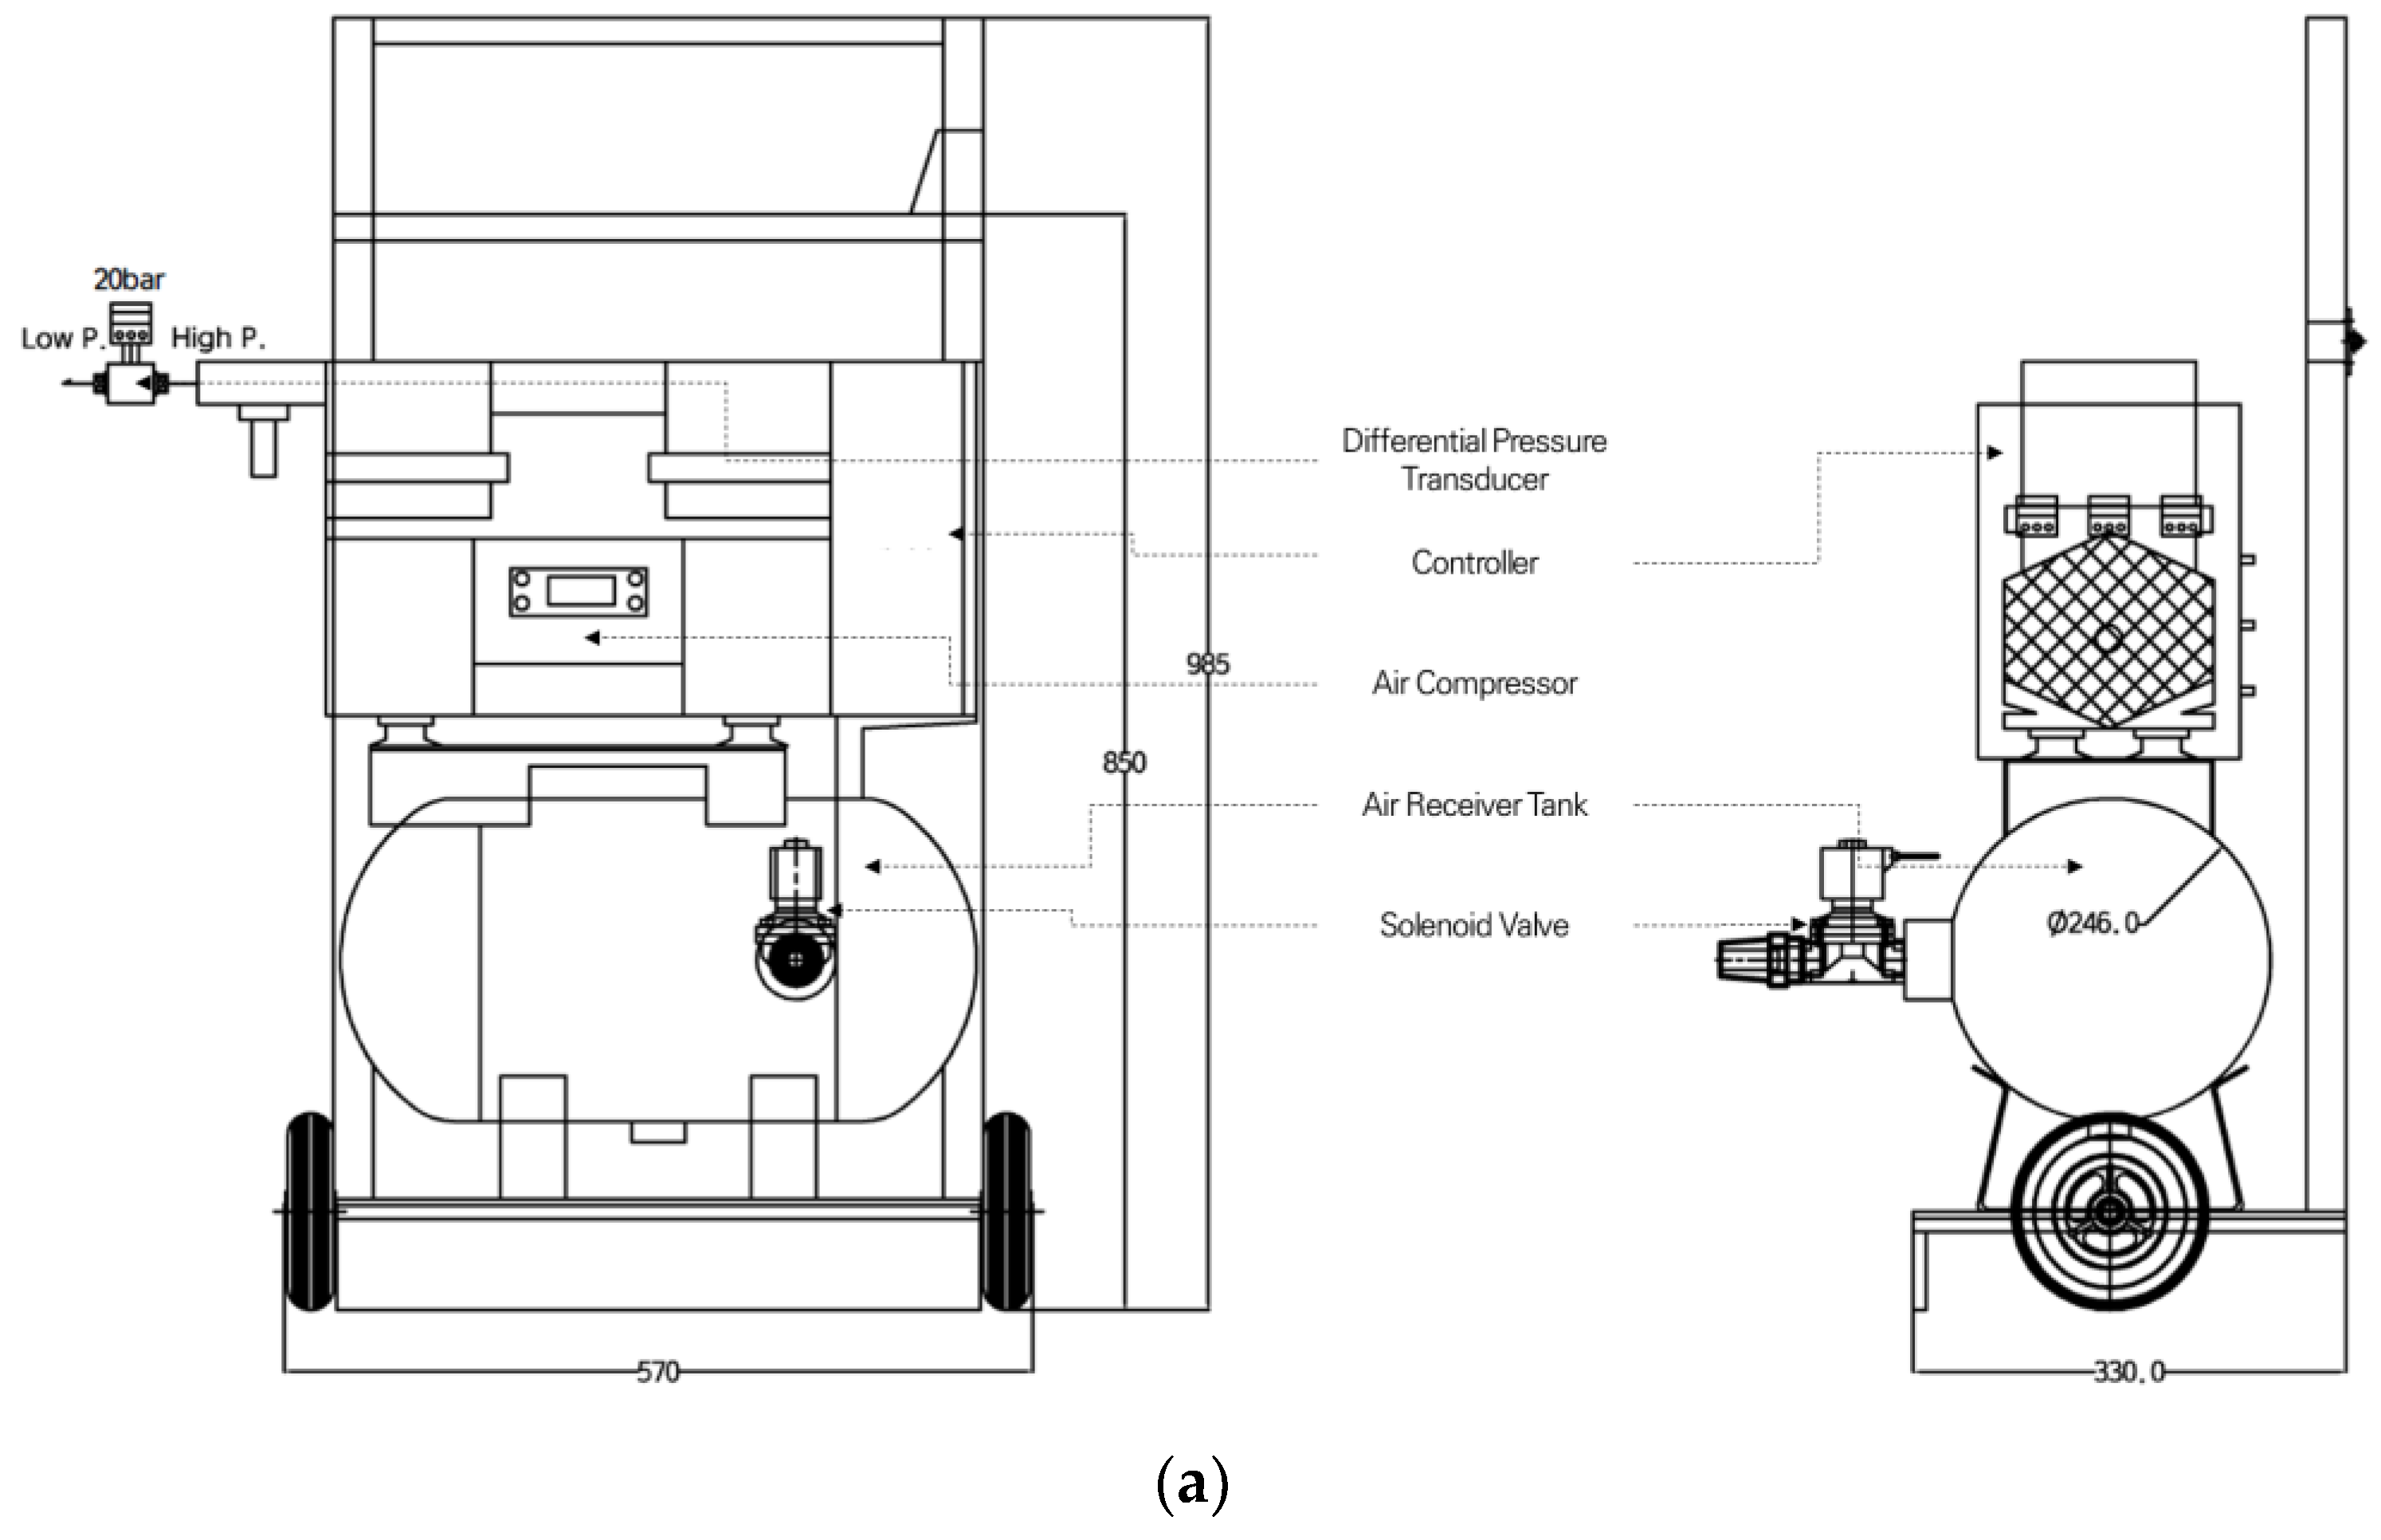
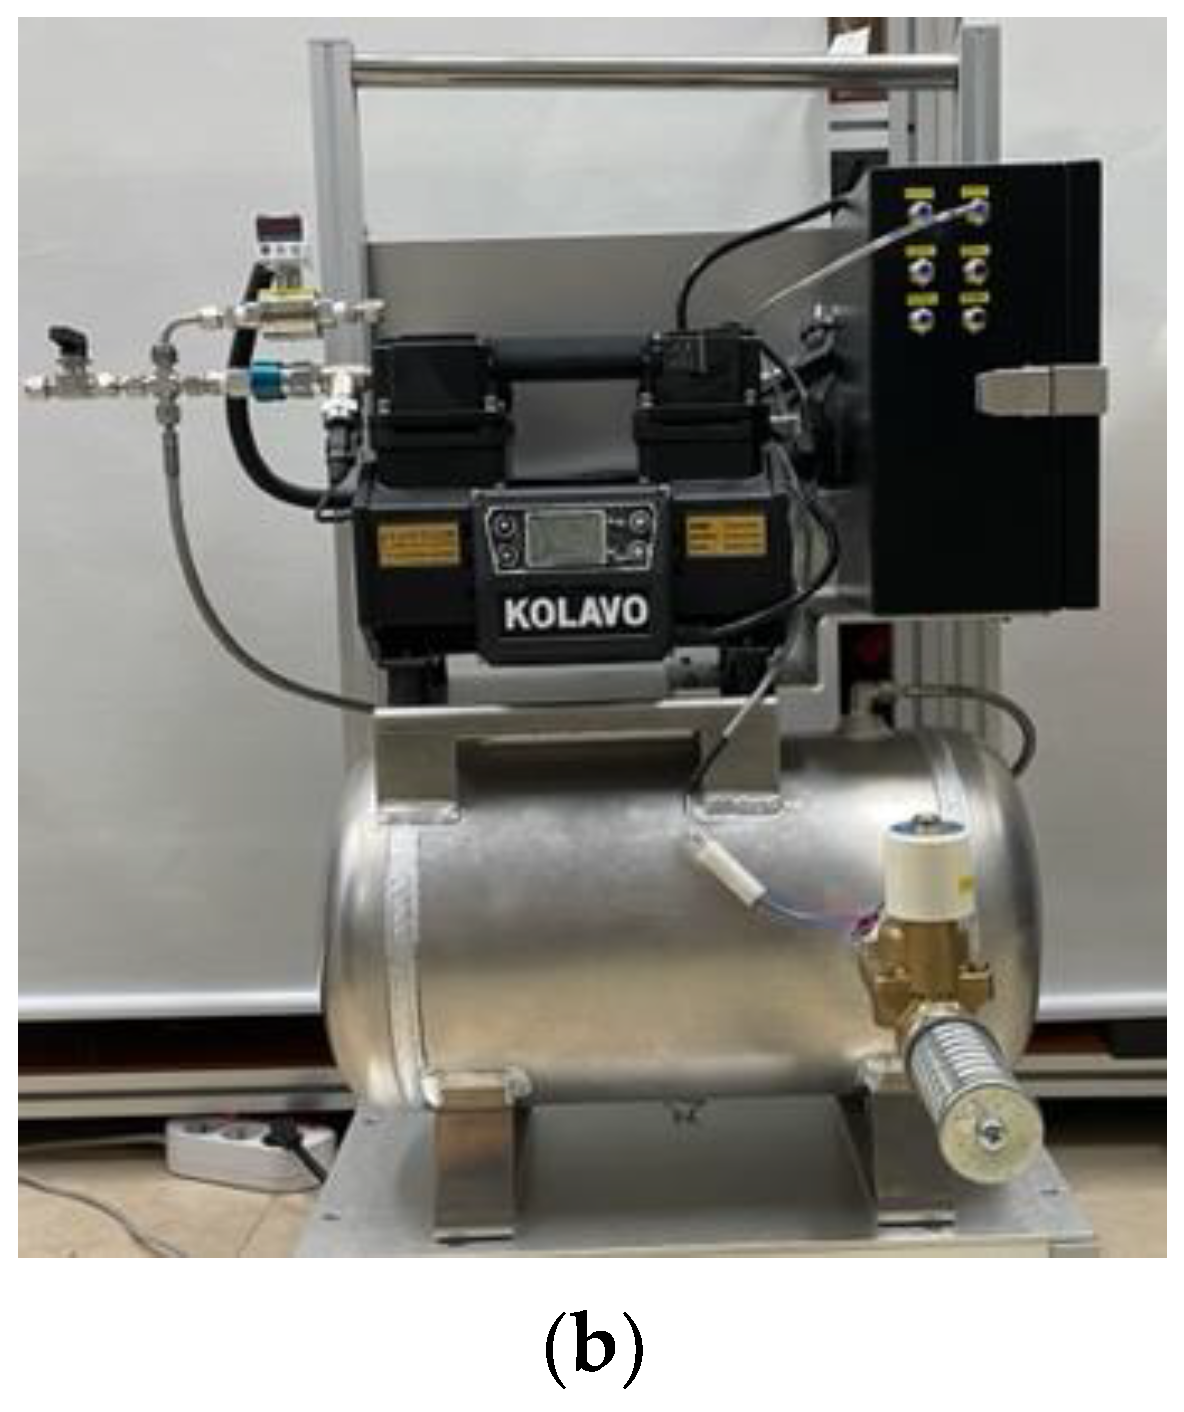
3.1. Experimental Equipment

To evaluate the accuracy and reproducibility of the transient method, we selected the blower door test, which is a representative method of the steady state method, and con-ducted a comparative experiment. Both test methods were repeated five times under the same conditions. The blower door test apparatus was the EU6100 from Retrotec, Everson, WA, USA. A detailed specification of the test apparatus is given in Table 1.
The transient test apparatus consisted of a rigid air receiver tank with a volume of 20 L equipped with a solenoid valve with a large orifice that opened when a trigger signal was given, allowing the compressed air in the chamber to enter the room within a short period of time.
The pressure changes in the chamber and in the test space were measured using a differential pressure transducer. A detailed specification of the components of the test apparatus used in the field test is given in Table 2, and a schematic diagram and photograph of the test apparatus are shown in Figure 1.

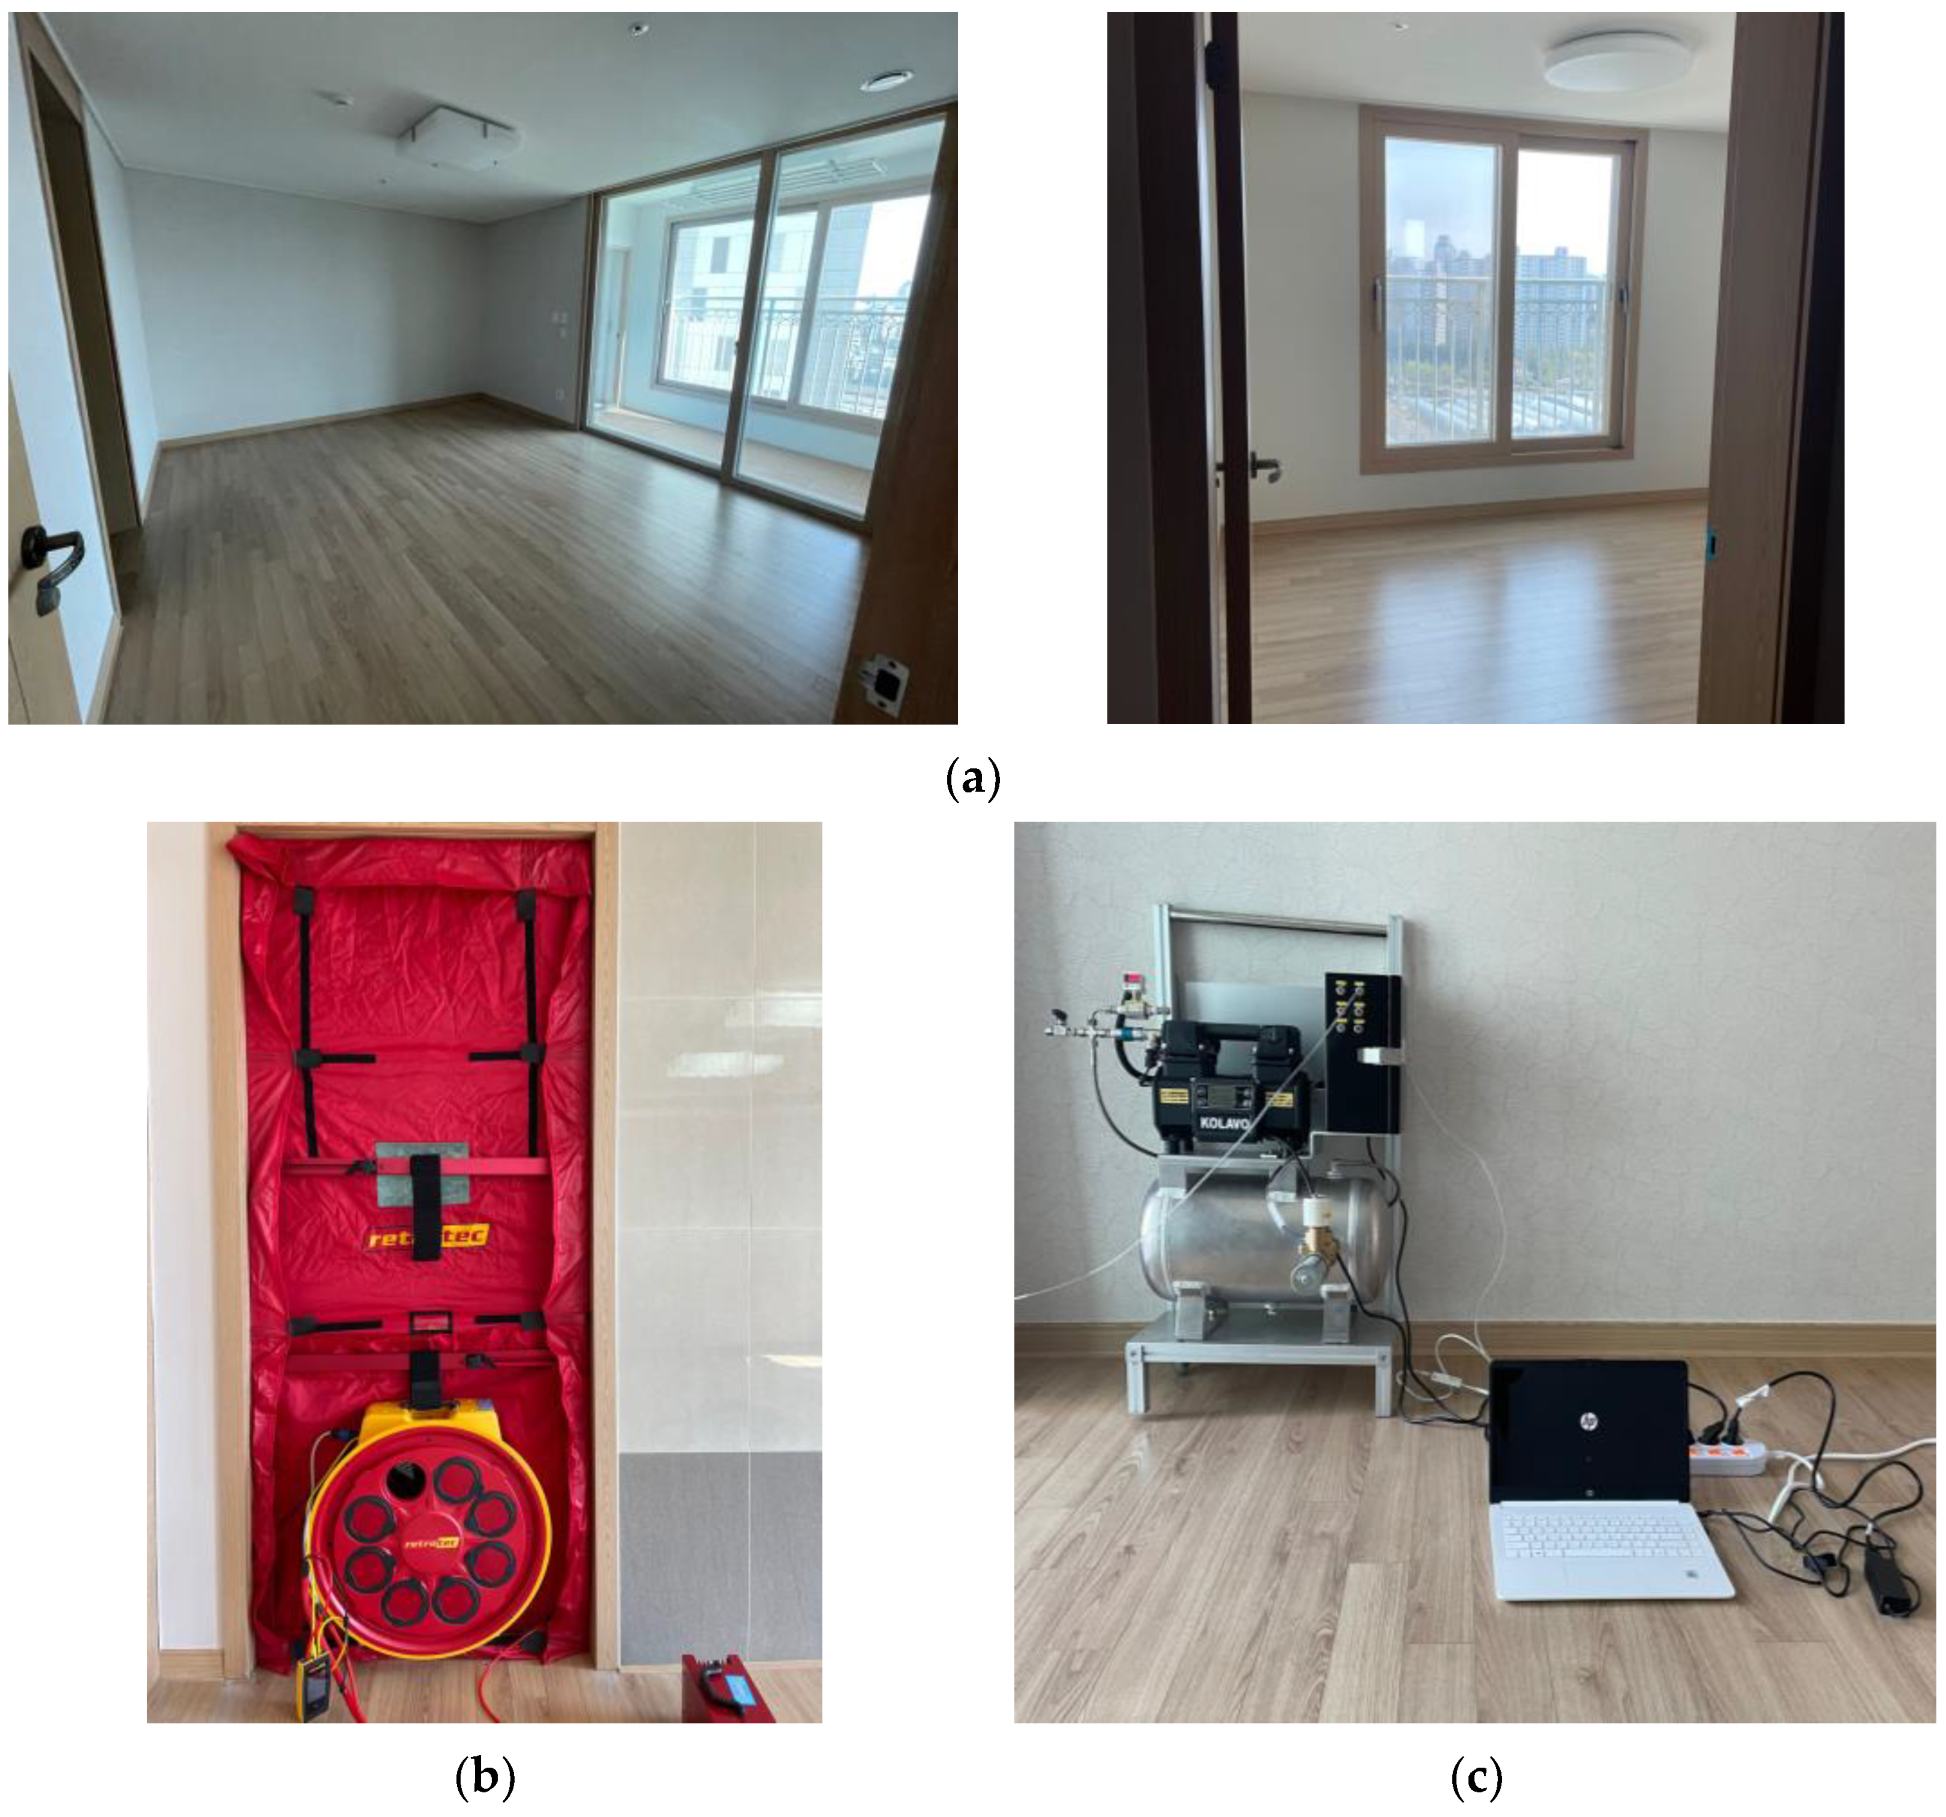
3.2. Description of Experimental Buildings

In this study, a field test was conducted to evaluate the applicability of the transient method. Three actual buildings with different uses were selected for testing. The first building was a residential building with a basement and two floors located in Daejeon, Korea, and the test was conducted on a part of the ground floor due to the size of the chamber. The second building was an apartment building in Daejeon, Korea, and the 84-type was selected for the middle floor, the 13th floor. The 84-type is the most representative type of apartment in Korea, which means that the main living space is 84 m2. The building consisted of a living room and kitchen, two toilets, and three rooms, with a total volume of about 195.39 m3, which was limited by the experimental device we built. Therefore, due to the size of the rooms, we tested in three rooms. The third building was an office building in Daejeon, and the test area was the same as the other buildings. At all three sites, the tests were conducted in a limited number of rooms, but all the rooms were suitable for the experiments because they were in direct contact with the outside air. This is because the main areas of moisture penetration in the buildings were the joints between the exterior walls and ceilings and between the window and door frames [20].
Based on the measured spaces, the volumes varied from a minimum of 13.46 m3 to 41.49 m3. By measuring spaces of different sizes, it was possible to estimate the allowable measurement space based on the capacity of the air receiver tank mounted on the experimental apparatus. It was also possible to estimate the minimum required tank capacity or the minimum required initial chamber pressure condition for spaces with different amounts of leakage. In the future, it may be possible to establish guidelines for the minimum air receiver tank capacity required to measure large spaces. An overview of these buildings and the conditions under which these measurements were carried out is given in Table 3.
Figure 2 shows the measurement space in Case B and a photo of the experimental equipment in this case.

4. Results and Discussion

To compare the results acquired from the blower door test and the transient method, five experiments were conducted under the same conditions. The initial pressure of the chamber was set based on the volume of each test subject. However, the leakage resulted in a Δ P variation, and a corresponding differential pressure condition was used to compare the ELA.
With regard to Cases A–C, the standard deviation and standard error of the ELA between these two measurement methods were assessed by analyzing the pressure variations in the test space and the chamber. The standard error was calculated using the following Equation (10):
Standard   Error   SE = 1 n   V a r x = s n ,

4.1. Experimental Results in Case A

For Case A, Δ P was approximately 14 Pa when the initial chamber pressure, P C , 0 , was set to 3 bar. A comparison of the results between the two experimental methods was made on the basis of ELA@10 Pa, and the experimental results are shown in Figure 3. The mean ELA@10 Pa for the blower door test was 97.456 cm2 with associated standard deviation and standard error values of 4.039 cm2 and 1.806 cm2, respectively, as shown in Figure 3b. Similarly, for the transient method, the mean ELA@10 Pa was 103.611 cm2, with accompanying standard deviation and standard error values of 1.825 cm2 and 0.816 cm2, respectively. Although the mean ELA@10 Pa between these two methods differed by 7.169%, the proposed method exhibited a lower standard error of 0.99 cm2 and a higher standard deviation in the blower door test than the blower door test result. Thus, it can be concluded that the measured result of the transient method is significant.

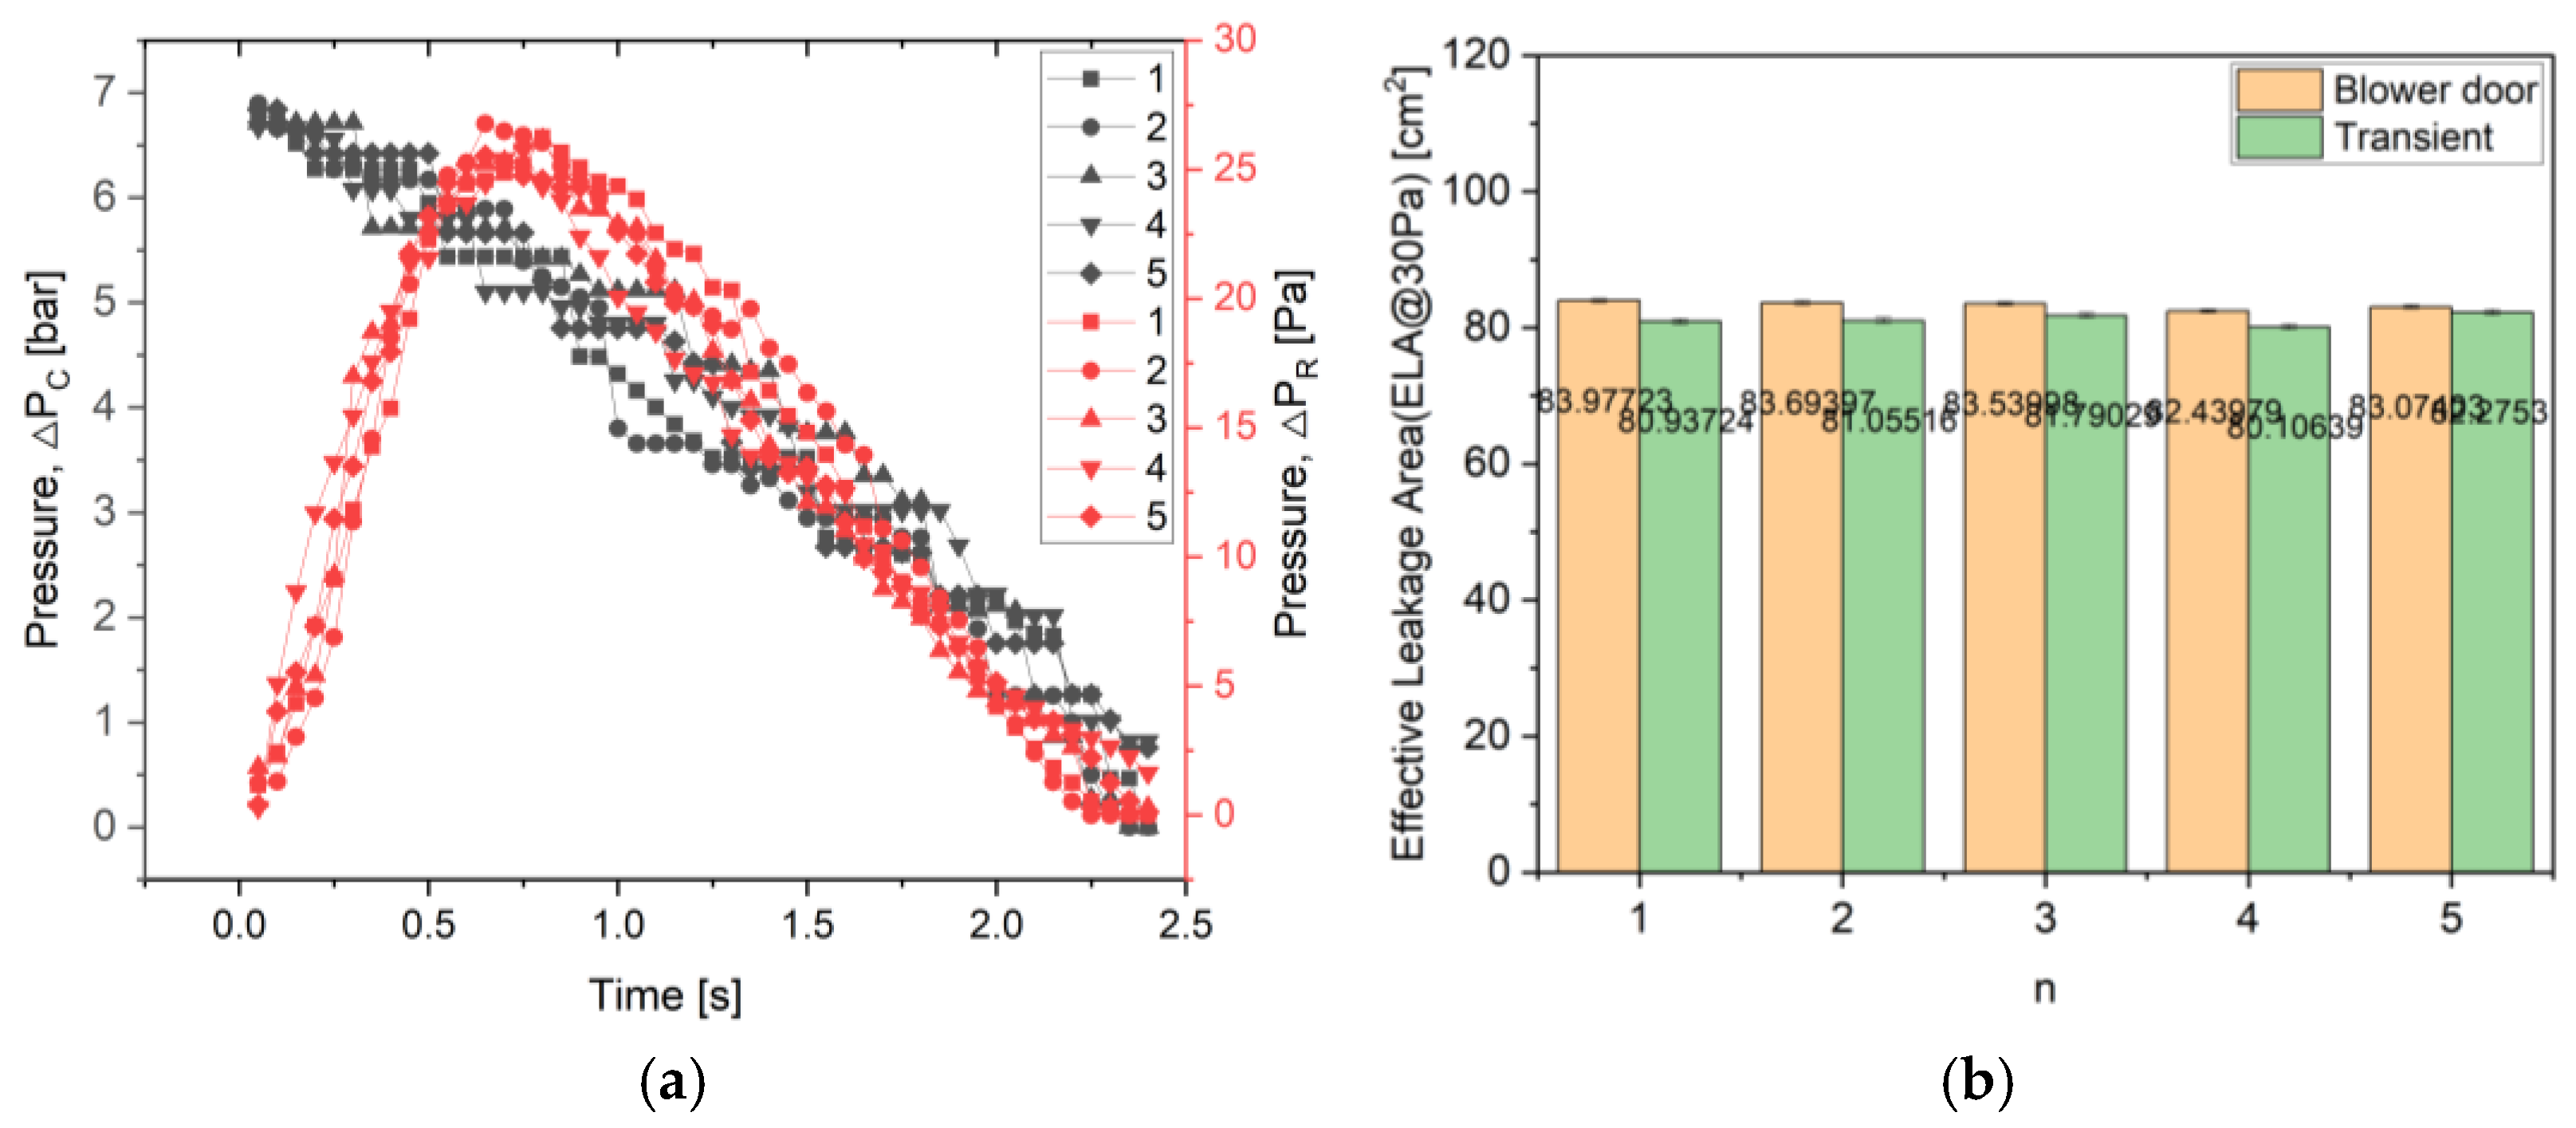
4.2. Experimental Results in Case B

For Case B, the demonstration building had a larger floor area than the other cases, which restricted the use of the experimental apparatus to measure the entire space. Consequently, the test area was partitioned based on the walls, and assessments were performed in each of the three rooms.
Firstly, for the principal room, which occupied the greatest area, the pressure difference between the chamber and the test area was established within 2.5 s, as depicted in Figure 4a. The measurements were compared based on ELA@30 Pa, which indicated a pressure difference of 30 Pa when the initial chamber pressure was 7 bar.
Figure 4b displays the average ELA@30 Pa for the blower door test, which was 83.345 cm2, along with the associated standard deviation and standard error values of 0.603 cm2 and 0.269 cm2, respectively. The transient method yielded an average ELA@30 Pa of 81.233 cm2, with an associated standard deviation and standard error values of 0.834 cm2 and 0.373 cm2, respectively. The difference between these measurements was small at 2.112 cm2, which seems significant due to the small standard error and similarity of the results.
Secondly, Figure 5 and Figure 6 display the experimental results from rooms 1 and 2. Both test rooms had the same opening area. The initial pressure in both rooms was 5 bar, the ΔP was 25 Pa, and the ELA@30 Pa was approximately 71 cm2, so the results were comparable.
In room 1, the blower door test resulted in a mean ELA@30 Pa of 70.554 cm2, with a standard deviation and a standard error of 0.691 cm2 and 0.309 cm2, respectively. This transient method yielded a mean ELA@30 Pa of 72.899 cm2, which differed only slightly by 3.32% from the conventional measurement method.
However, it showed a more consistent outcome compared to the blower door test, with a standard deviation and standard error of 0.441 cm2 and 0.197 cm2, respectively. As shown in Figure 6b, room 2 produced comparable results, with the ELA@30 Pa means of these two experimental techniques being 68.174 cm2 and 70.510 cm2, respectively. The difference between the ELA@30 Pa means was insignificant at 2.336 cm2. In addition, the standard error of the proposed method was 0.435 cm2, which is similar to the standard error of the blower door test at 0.276 cm2.
Based on these measurement results, it is evident that the airtightness of each room can be maintained at a similar level without any deviation. The airtightness level of each building is compared further in Section 4.4.
Conversely, the 84-type, which has a dedicated area of 84 m2, is the most preferred category of apartments in Korea. In the initial experimental section, trials were executed in singular areas because of the capacity restriction of the air chamber. However, with the potential expansion of the chamber to over twice the size of the current experimental unit, it is anticipated that the entire apartment could be assessed.

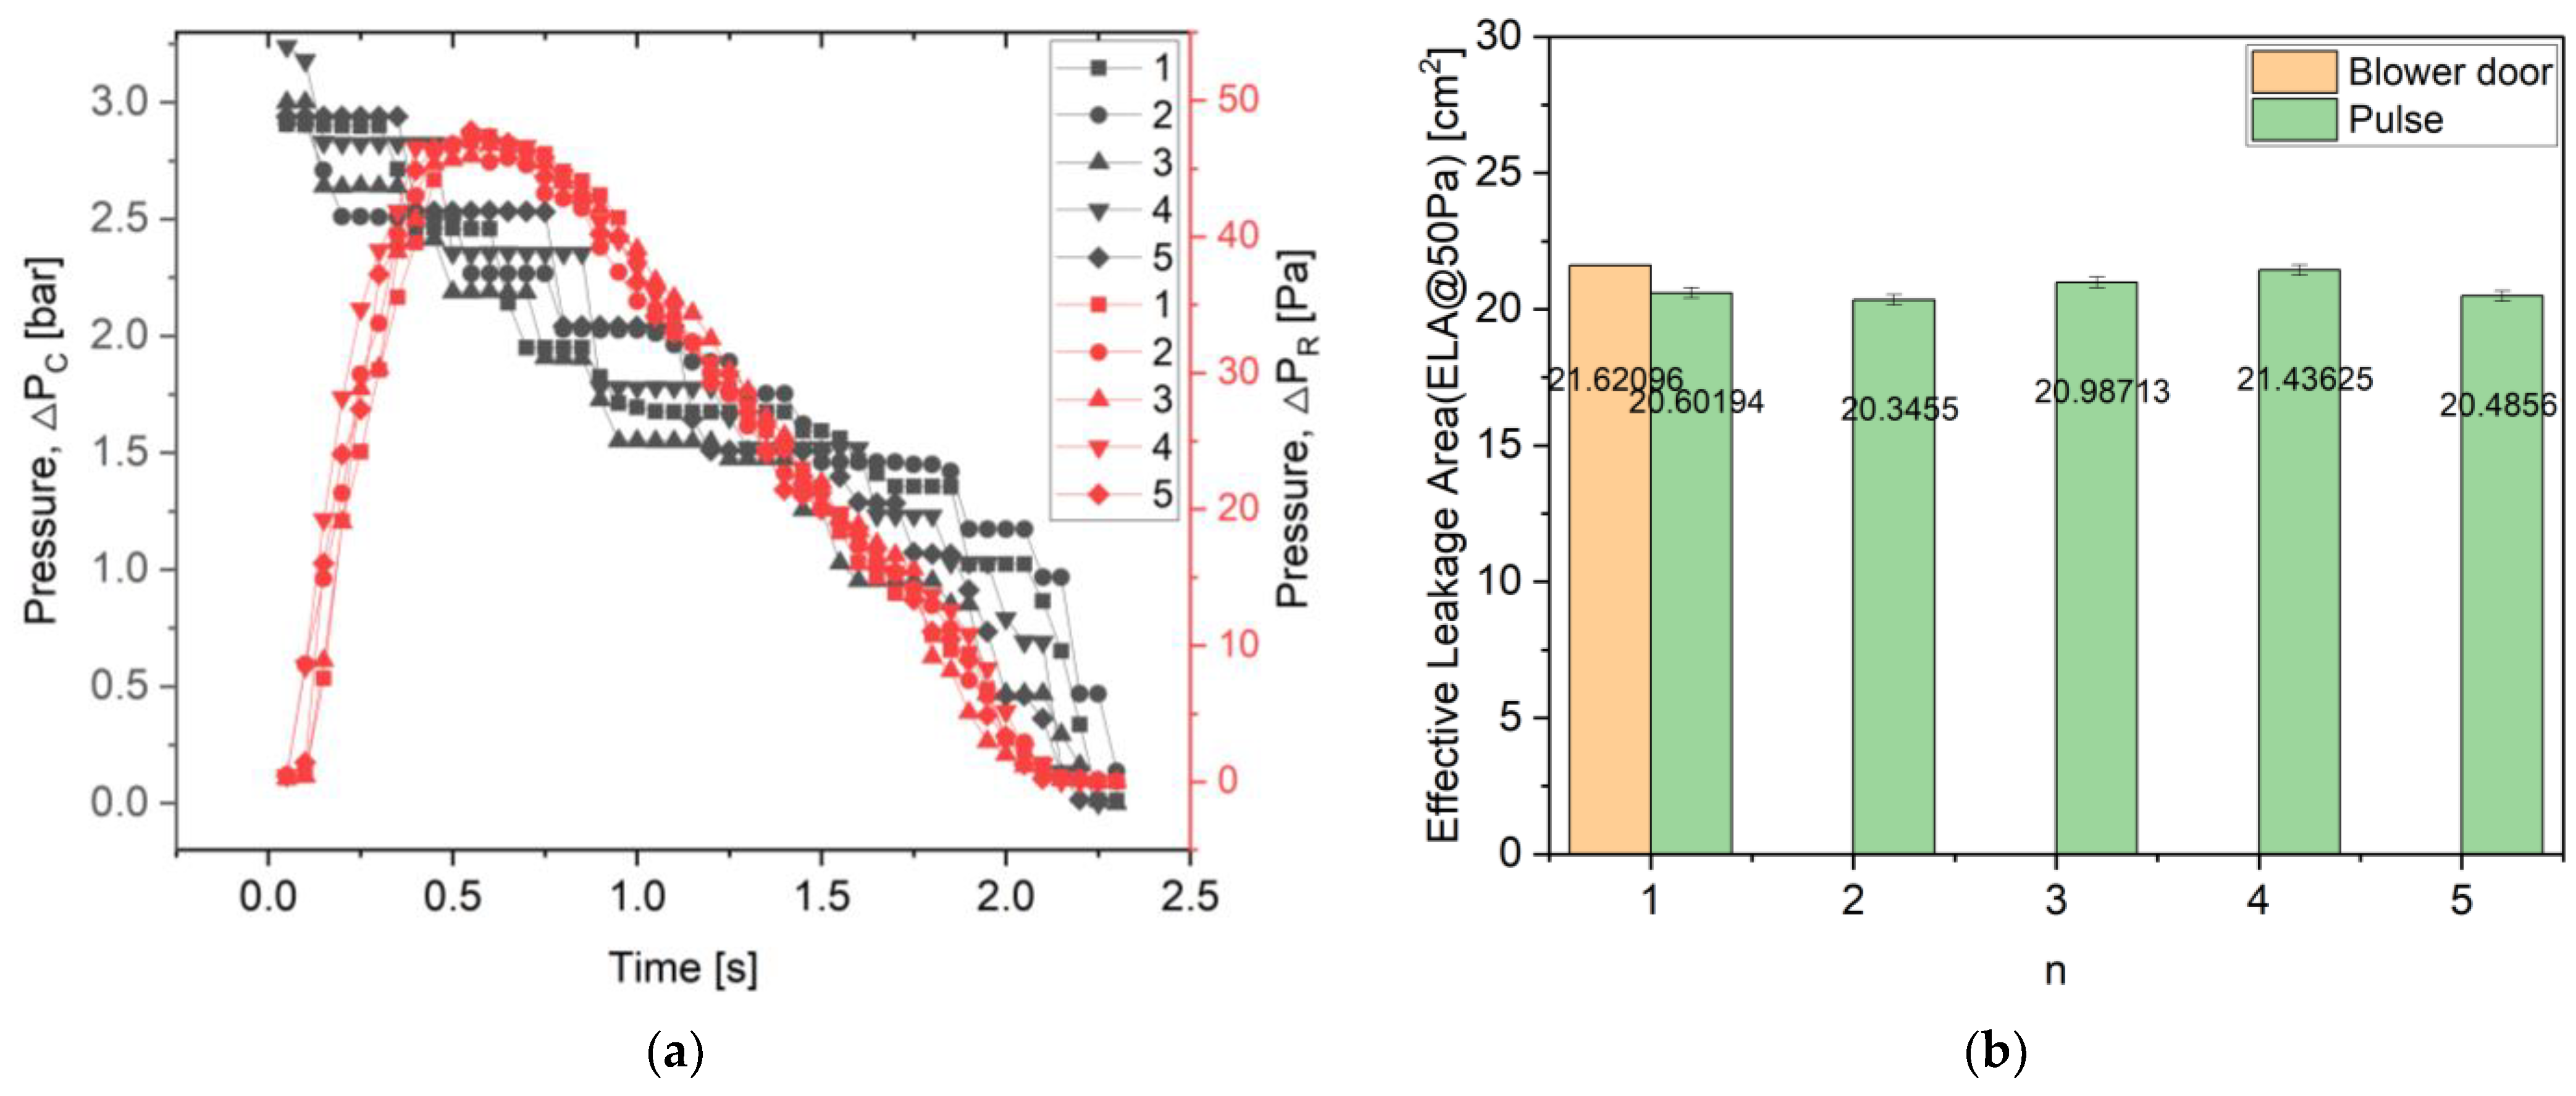
4.3. Experimental Results in Case C

For Case C, Δ P was approximately 50 Pa when the initial chamber pressure, P C , 0 , was set to 3 bar. The comparison of the results between the two experimental methods was made on the basis of ELA@50 Pa, and the experimental results are shown in Figure 7. Due to experimental space constraints, only one blower test was performed, and the ELA@50 Pa was 21.621 cm2. For the transient method, the mean ELA@50 Pa was 20.771 cm2, with accompanying standard deviation and standard error values of 0.442 cm2 and 0.198 cm2, respectively. The difference between these two experimental methods was approximately 4%, indicating a high similarity. The proposed experimental method displayed a low standard error, implying high reproducibility in the field. Therefore, it can be concluded that the measurement results of the transition method demonstrated significant values.

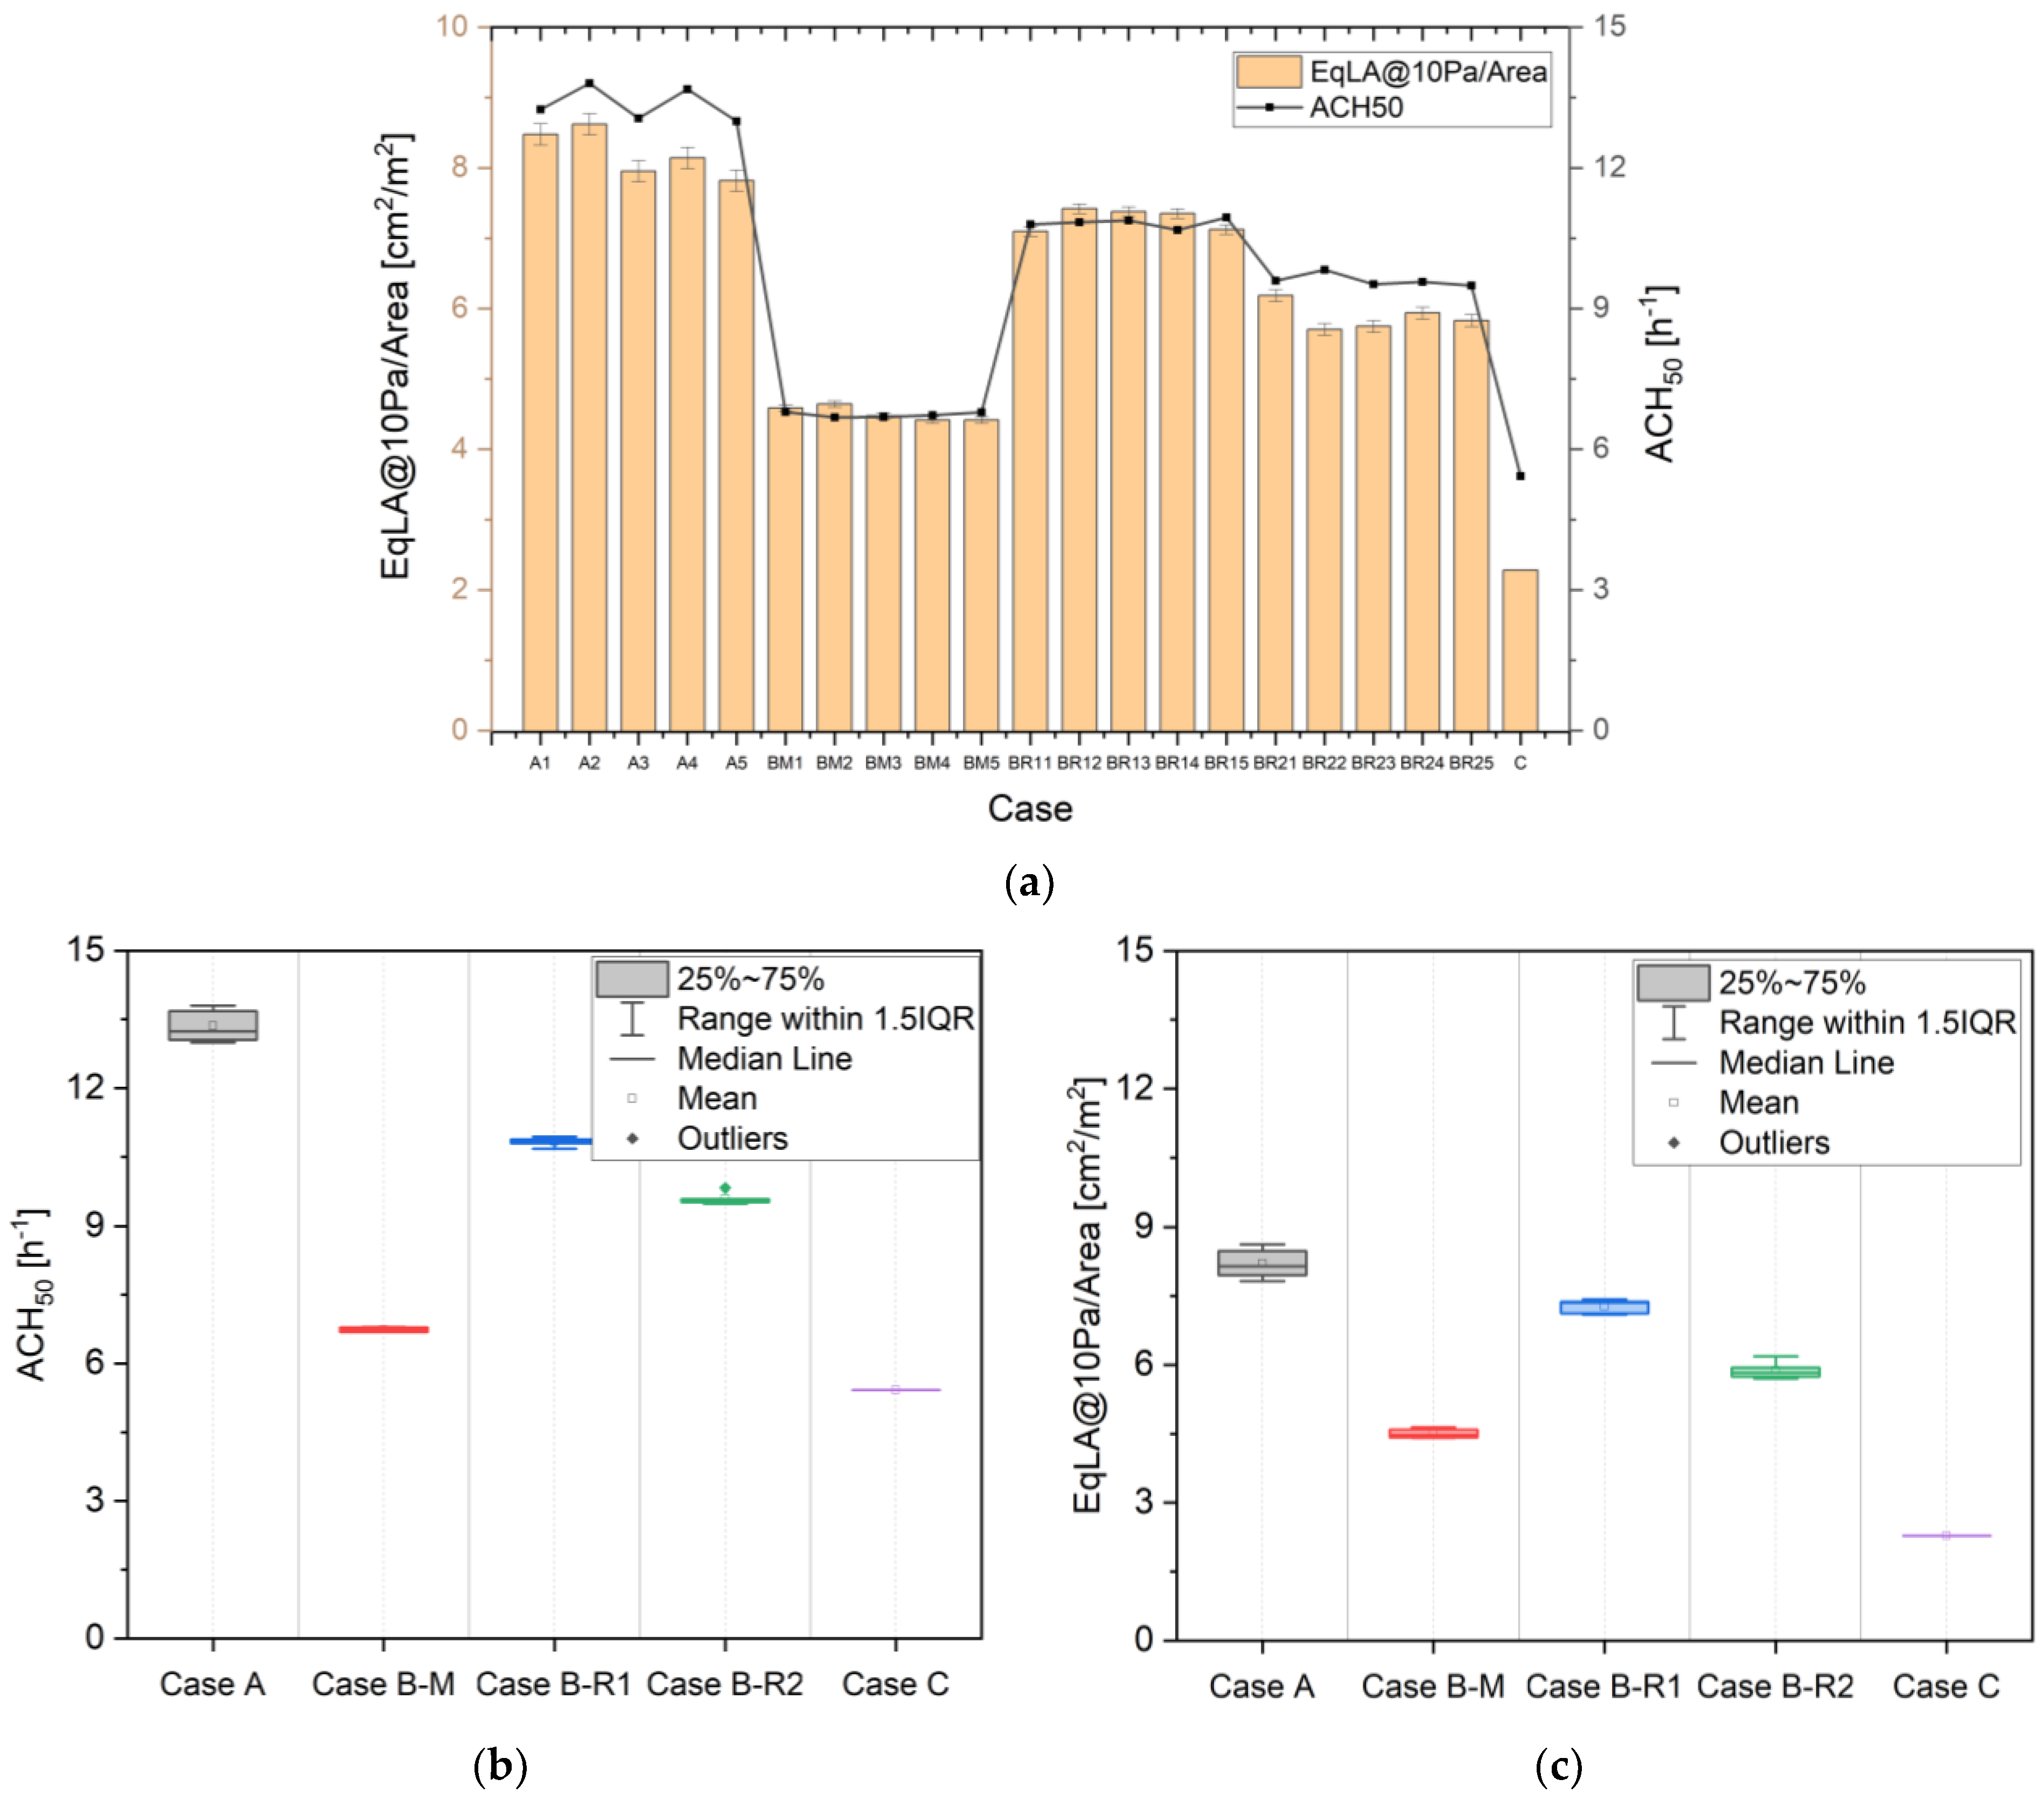
4.4. Compare Leakage Results by Case

Since the ELA value was calculated differently depending on the area of the measurement space and the level of leakage, for absolute comparison, the ELA was divided by the floor area to compare the airtightness performance of the measured buildings. As the equivalent leakage area (EqLA) differed for each case, it was calculated and compared accordingly. The EqLA for each building is a measure of the leakage area established by the National Research Council of Canada (NRC) to determine the size of the hole that corresponds to the amount of leakage at 10 Pa. The EqLA is an objective measure of the building’s air leakage, and it is useful for comparing buildings based on their air exchange rates. The results of the airtightness comparison for each case are shown in Table 4 and Figure 8.
When comparing the air tightness case by case based on the EqLA@10 Pa/Area, Case C had the best air tightness with 2.28 cm2/m2, followed by Case B with a range of 4.51–7.28 cm2/m2. Case A had the lowest airtightness with a range of 7.82–8.62 cm2/m2. The standard errors for each case were 0.152, 0.0458, 0.068 and 0.0859 cm2/m2, respectively. The measurement results also differed significantly from the airtightness performance criteria of ASHRAE Standard 62 [21]. The reason why Δ P was not high despite the small area of the test chamber was due to high leakage. However, by increasing the initial pressure of the air chamber or increasing the capacity of the air chamber, field tests may be possible in buildings with large floor areas or high leakage.

5. Conclusions

The airtightness of a building is a very important factor in reducing heating and cooling energy, preventing condensation, and maintaining durability. In this study, a comparative airtightness test was carried out on actual buildings to investigate the applicability of the proposed transient method for measuring the airtightness of buildings in the field. The blower door test, which is often chosen as the conventional measurement method, was chosen as the comparison group to evaluate the accuracy, for which more than five repeated experiments were performed. Therefore, we wanted to confirm that this new measurement method, which complements the shortcomings of the existing measurement method, can produce significant results in the field. The main conclusions are as follows:
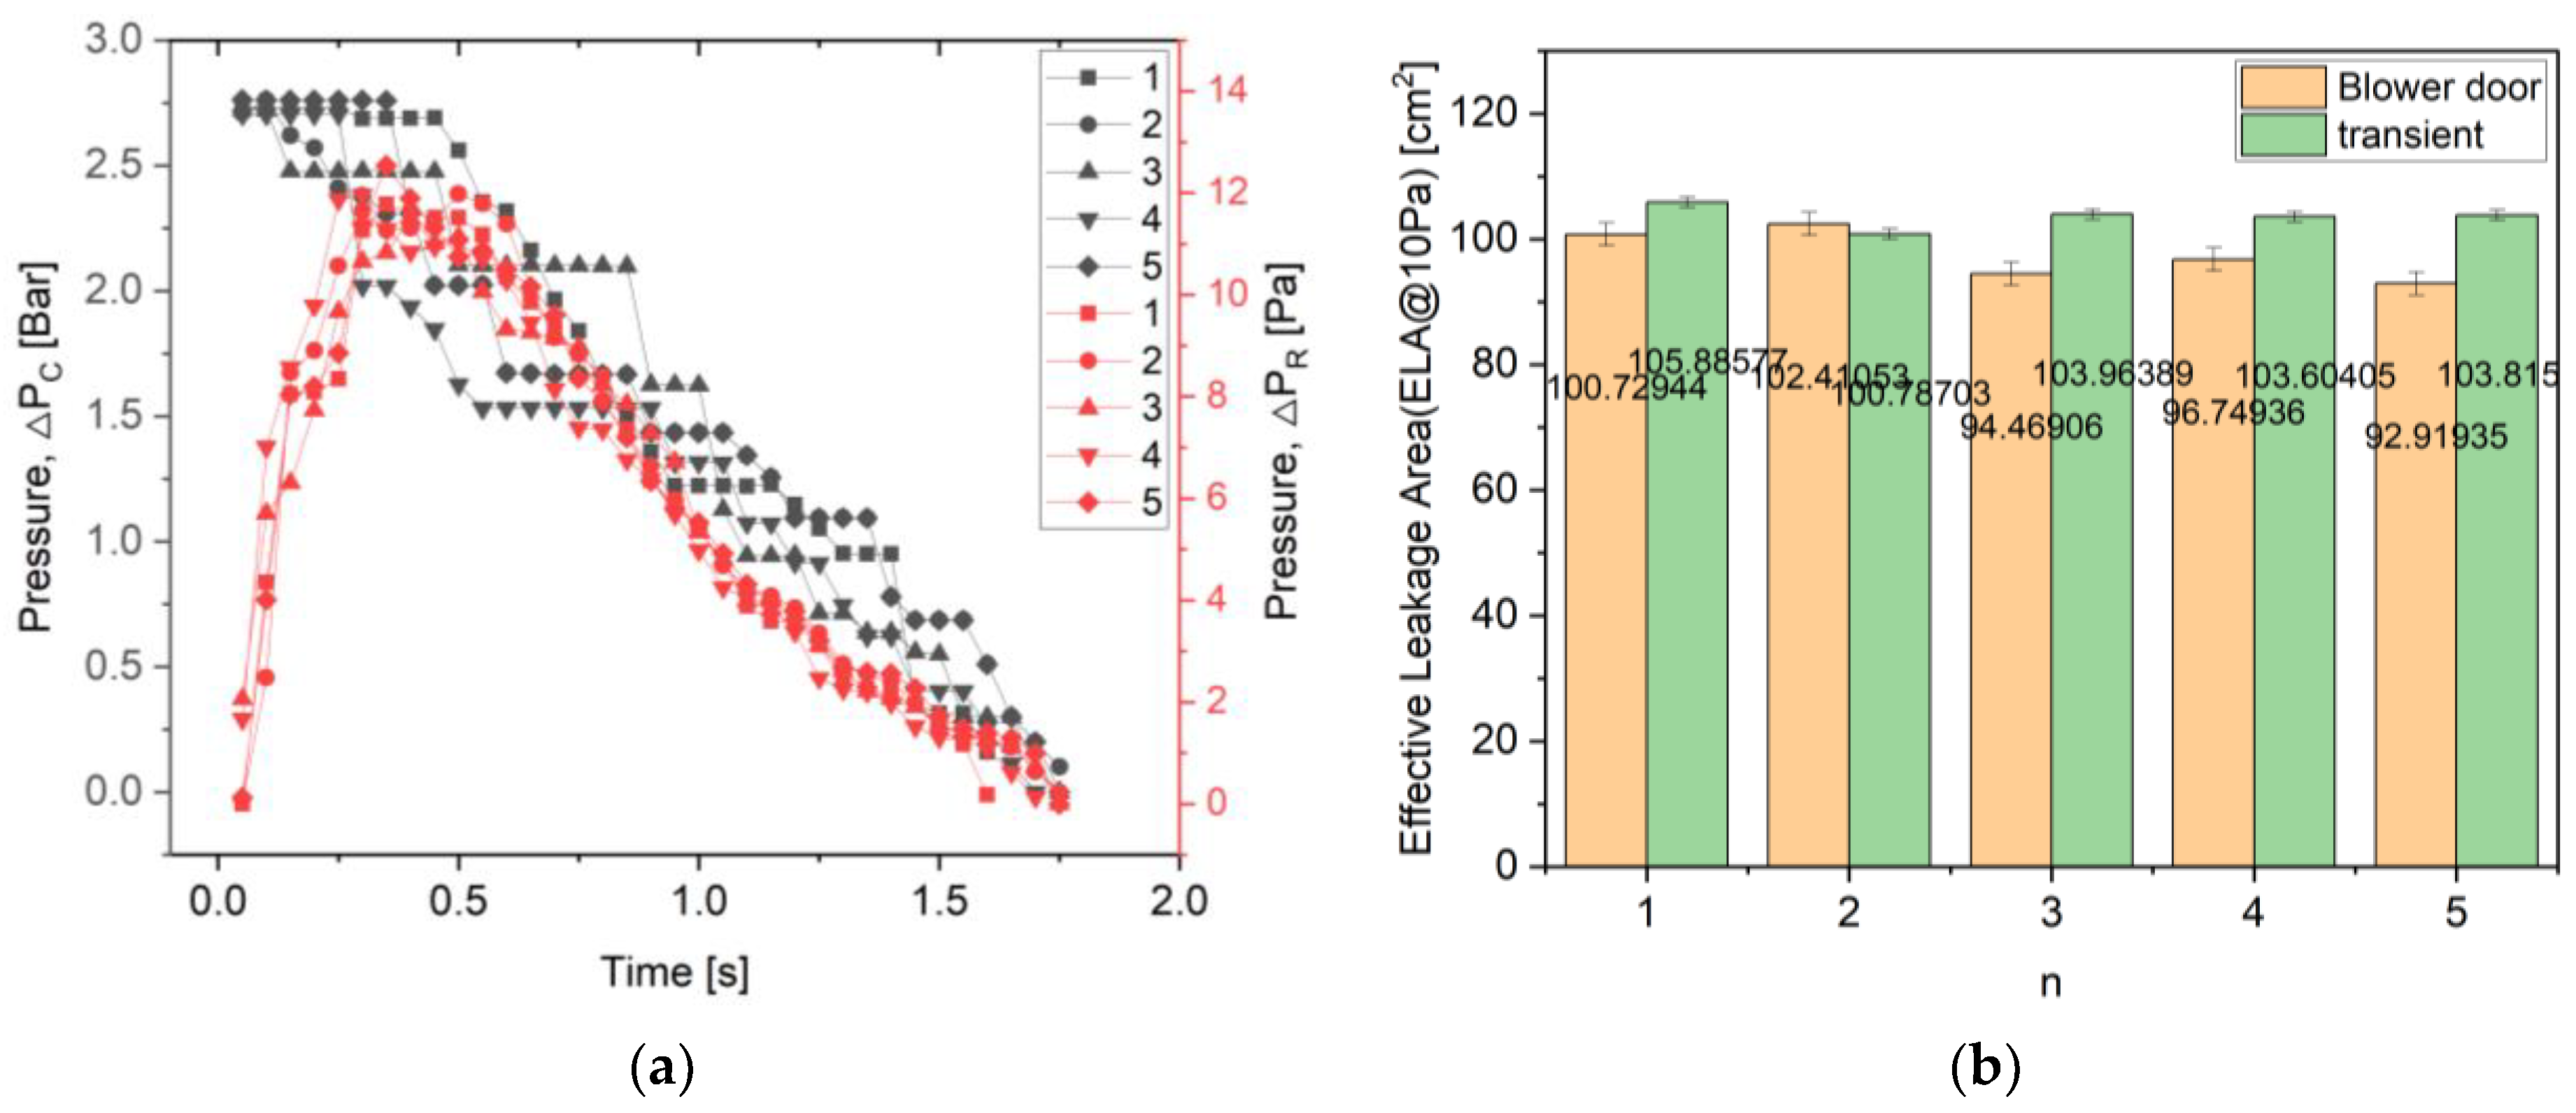
  • After conducting experiments on three real buildings, Case A showed a higher reproducibility with standard errors of 1.806 cm2 and 1.449 cm2 for the blower door and transient methods, respectively;
  • In Case B, the experiments were divided into three rooms, taking into account the measurement space, and the standard errors of the blower door and transient methods were 0.230–0.251 cm2 and 0.197–0.435 cm2, respectively, showing a similar level of precision to the existing experimental method, and the average error rate of ELA@30 Pa between the two experimental methods was 3.04–5.03%, which was also significant;
  • In case C, the average error rate of ELA@50 Pa between the two experimental methods was 3.93% (0.85 cm2), and the standard error of the proposed method was 0.198 cm2, showing high accuracy and precision and confirming that it can be applied to real buildings.
The standard error of the actual measurements showed a higher reproducibility with the transient method, from 0.197 cm2 to 0.816 cm2 and from 0.269 cm2 to 1.801 cm2 for the blower door test. Considering that the blower door test takes more than 20 min per case, the ease of repeating the transient test, which takes a few seconds, is a great advantage for on-site diagnoses. All three demonstration sites were existing buildings completed at least 5 years ago, and their airtightness performance was poorly measured, which limited the measurements with the experimental equipment developed in this study, but it also confirmed that it is possible to measure in different spaces by increasing the initial chamber pressure or increasing the capacity of the air receiver tank.
In future research, we aim to construct a sealed test chamber to estimate the leakage area and verify the accuracy of the test equipment for higher accuracy verification. In addition, field experiments should be conducted on a wider range of cases to establish minimum guidelines for the initial pressure or capacity of airtight test chambers in buildings with large leakage areas or high leakage volumes. This can enable the transient method to be reviewed for measuring airtightness in buildings and hopefully lead to more accurate field measurements.

Author Contributions

Conceptualization, S.H.; methodology, S.H.; validation, S.H., H.J., J.L. and J.K.; formal analysis, S.H.; investigation, S.H.; resources, S.H.; writing—original draft preparation, S.H.; writing—review and editing, H.J., J.L. and J.K.; visualization, S.H.; supervision, J.L., J.K.; funding acquisition, J.K. All authors have read and agreed to the published version of the manuscript.

Funding

This research was funded by the Korea Agency for Infrastructure Technology Advancement (KAIA), grant funded by the Ministry of Land, Infrastructure and Transport, grant number RS-2019-KA153277.

Conflicts of Interest

The authors declare no conflict of interest.

Nomenclature

Q l e a k Leakage flow rate
CConstant
nPressure exponential constant
mMass
VVolume
ρAir density
RGas constant
TTemperature
PAbsolute pressure
∆PGuage pressure
tTime
A e f f Effective leakage area (ELA)
RRoom
atmAtmosphere
0Initial state

References

  1. Han, S.; Jeong, H.; Lee, J.; Kim, J. Proposed Existing Building Diagnosis Framework for Energy Efficiency Improvement. Case Stud. Therm. Eng. 2023, 49, 103232. [Google Scholar] [CrossRef]
  2. Jun, Y.J.; Ahn, S.H.; Park, K.S. Improvement Effect of Green Remodeling and Building Value Assessment Criteria for Aging Public Buildings. Energies 2021, 14, 1200. [Google Scholar] [CrossRef]
  3. Etheridge, D. A Perspective on Fifty Years of Natural Ventilation Research. Build. Environ. 2015, 91, 51–60. [Google Scholar] [CrossRef]
  4. Zheng, X.; Mazzon, J.; Wallis, I.; Wood, C.J. Airtightness Measurement of an Outdoor Chamber Using the Pulse and Blower Door Methods under Various Wind and Leakage Scenarios. Build. Environ. 2020, 179, 106950. [Google Scholar] [CrossRef]
  5. Air Sealing Your Home|Department of Energy. Available online: https://www.energy.gov/energysaver/air-sealing-your-home (accessed on 1 September 2023).
  6. Energy Star AIR SEALING Building Envelope Improvements. Available online: https://www.energystar.gov/ia/home_improvement/home_sealing/AirSealingFS_2005 (accessed on 1 September 2023).
  7. Raman, G.; Chelliah, K.; Prakash, M.; Muehleisen, R.T. Detection and Quantification of Building Air Infiltration Using Remote Acoustic Methods. In Proceedings of the INTERNOISE 2014—43rd International Congress on Noise Control Engineering: Improving the World through Noise Control, Melbourne, Australia, 16–19 November 2014. [Google Scholar]
  8. ASTM E741-23; Standard Test Method for Determining Air Change in a Single Zone by Means of a Tracer Gas Dilution. American Society for Testing and Materials: West Conshohocken, PA, USA, 2006; p. 11. [CrossRef]
  9. ISO 12569:2017; Thermal Performance of Buildings and Materials—Determination of Specific Airflow Rate in Buildings—Tracer Gas Dilution Method. International Organization for Standardization: Geneva, Switzerland, 2017. Available online: https://www.iso.org/standard/69817.html (accessed on 17 January 2023).
  10. Roberts, B.M.; Allinson, D.; Lomas, K.J. Evaluating Methods for Estimating Whole House Air Infiltration Rates in Summer: Implications for Overheating and Indoor Air Quality. Int. J. Build. Pathol. Adapt. 2023, 41, 45–72. [Google Scholar] [CrossRef]
  11. ISO 20485:2017; Non-Destructive Testing—Leak Testing—Tracer Gas Method. International Organization for Standardization: Geneva, Switzerland, 2017. Available online: https://www.iso.org/standard/68190.html (accessed on 17 January 2023).
  12. ISO 9972:2015; Thermal Performance of Buildings—Determination of Air Permeability of Buildings—Fan Pressurization Method. International Organization for Standardization: Geneva, Switzerland, 2015. Available online: https://www.iso.org/standard/55718.html (accessed on 17 January 2023).
  13. ASTM E779-03; Standard Test Method for Determining Air Leakage Rate by Fan Pressurization. American Society for Testing and Materials: West Conshohocken, PA, USA, 1999; pp. 12959–19428. [CrossRef]
  14. Lucchino, E.C.; Gennaro, G.; Favoino, F.; Goia, F. Applicability and Evaluation of Airtightness Prediction Method Using Pressure Differences under Actual Climate Conditions. Build. Environ. 2022, 78, 109704. [Google Scholar] [CrossRef]
  15. Carey, P.S.; Etheridge, D.W. Leakage Measurements Using Unsteady Techniques with Particular Reference to Large Buildings. Build. Serv. Eng. Res. Technol. 2001, 22, 69–82. [Google Scholar] [CrossRef]
  16. Seddon, H.; Zhong, H. An Investigation into the Efficacy of the Pulse Method of Airtightness Testing in New Build and Passivhaus Properties. Energy Build. 2023, 295, 113270. [Google Scholar] [CrossRef]
  17. Mattsson, B.; Claesson, J. A Transient Pressurization Method for Measurements of Airtightness. J. Build. Phys. 2007, 31, 35–53. [Google Scholar] [CrossRef]
  18. Lee, M.J.; Kim, N.I.; Ryou, H.S. Air Tightness Measurement with Transient Methods Using Sudden Expansion from a Compressed Chamber. Build. Environ. 2011, 46, 1937–1945. [Google Scholar] [CrossRef]
  19. Bae, S.; Moon, H.; Lee, M.J.; Kim, N.I.; Ryou, H.S. Improvement in the Applicability of the Air Tightness Measurement Using a Sudden Expansion of Compressed Air. Build. Environ. 2013, 61, 133–139. [Google Scholar] [CrossRef]
  20. Chan, W.R.; Joh, J.; Sherman, M.H. Analysis of Air Leakage Measurements of US Houses. Energy Build. 2013, 66, 616–625. [Google Scholar] [CrossRef]
  21. ANSI/ASHRAE Standard 62.1; Ventilation for Acceptable Indoor Air Quality. American National Standards Institute, American Society of Heating, Refrigerating and Air-Conditioning Engineers: Atlanta, GA, USA, 1999; pp. 404–636.
Figure 1. (a) Experimental apparatus drawings; (b) Photo of the experimental apparatus.
Energies 16 06975 g001aEnergies 16 06975 g001b
Figure 2. Photographs of (a) The measurement space, (b) Blower door test, and (c) Transient method test equipment in Case B.
Energies 16 06975 g002
Figure 3. (a) Repeated experimental results for the chamber and room pressures ( Δ P C , 0 = 3 bar); (b) Comparison of the blower door test and transient method experiment results in Case A.
Energies 16 06975 g003
Figure 4. (a) Repeated experimental results for the chamber and room pressures ( Δ P C , 0 = 7 bar); (b) Comparison of the blower door test and the transient method experiment results in the main room of Case B.
Energies 16 06975 g004
Figure 5. (a) Repeated experimental results for the chamber and room pressures ( Δ P C , 0 = 5 bar); (b) Comparison of the blower door test and transient method experiment results in room 1 of Case B.
Energies 16 06975 g005
Figure 6. (a) Repeated experimental results for the chamber and room pressures ( Δ P C , 0 = 5 bar); (b) Comparison of the blower door test and transient method experiment results in room 2 of Case B.
Energies 16 06975 g006
Figure 7. (a) Repeated experimental results for the chamber and room pressures ( Δ P C , 0 = 3 bar); (b) Comparison of the blower door test and transient method experiment results in Case C.
Energies 16 06975 g007
Figure 8. (a) Comparison of EqLA@10 Pa/Area and ACH50 results between cases; (b) Comparison of the distribution of ACH50 results across cases; (c) Comparison of the distribution of EqLA@10 Pa/Area results across cases.
Energies 16 06975 g008
Table 1. Detailed specifications of blower door.
ComponentParametersValues
GaugeModelDM32W
Pressure range−2488 Pa to +2488 Pa
Pressure accuracy±0.4% of pressure reading
or ±0.07 Pa @ 22 degree (C)
FanModelEU6100
Flow accuracy±5%
Table 2. Detailed specifications of the experimental apparatus.
ComponentParametersValues
Air receiver tankModelALT20
Volume20 L
MaterialAluminum
Solenoid valveModelHPW 2510-20
OrificeØ25
Pressure0.05–2.04 MPa (0.5–20 kgf/cm2)
Air compressorModelKOLAVO-DC660
Pressure0.3–0.9 MPa
Flow125 L/min
Differential pressure transducerModelSMA Series
Range0–3.5 MPa(chamber),
0–100 Pa(room)
Accuracy±3% FS (chamber), ±5% FS (room)
Table 3. Outline of experimental buildings.
ComponentResidential BuildingNon-Residential Building
Case ACase BCase C
AddressDaejeon, KoreaDaejeon, KoreaDaejeon, Korea
Experiment floor1st13th1st
StructureReinforced concrete structureReinforced concrete wall structureReinforced concrete structure
Floor area [m2]11.8884.95 (total),
18.04, 10.59, 9.48 (each room)
6.12
Ceiling height [m]2.32.32.2
Opening size [m2]① Window: 2.1 × 0.6 = 1.26
② Door: 1.0 × 2.1 = 2.1
① Main room: 3.1 × 2.1 = 6.51
② Room1, 2: 2.0 × 2.1 = 4.2
Door: 1.0 × 2.1 = 2.1
Date of experiment27 January 20218 April 202126 August 2020
Table 4. Comparison of airtightness values by case.
DivisionFloor Area
(m2)
ELA@4 Pa
(cm2)
EqLA@10 Pa
(cm2)
EqLA@10 Pa/Area
(cm2/m2)
ACH50
(h−1)
Case A11.8890.2397.468.213.36
Case BMain room18.0479.6981.324.516.74
Room 19.4867.6868.977.2810.83
Room 210.5957.7962.295.889.60
Case C6.1210.8913.962.285.43
Disclaimer/Publisher’s Note: The statements, opinions and data contained in all publications are solely those of the individual author(s) and contributor(s) and not of MDPI and/or the editor(s). MDPI and/or the editor(s) disclaim responsibility for any injury to people or property resulting from any ideas, methods, instructions or products referred to in the content.

