Article

Neural-Network-Based Time Control for Microwave Oven Heating of Food Products Distributed by a Solar-Powered Vending Machine with Energy Management Considerations

by
Ioan Mihail Savaniu
1,
Alexandru-Polifron Chiriță
2,
Oana Tonciu
1,*,
Magdalena Culcea
3 and
Ancuta Neagu
1
1
Faculty of Mechanical Engineering and Robotics in Construction, Technical University of Civil Engineering Bucharest, 59 Plevnei Str., 010223 Bucharest, Romania
2
National Institute of Research & Development for Optoelectronics/INOE 2000, Subsidiary Hydraulics and Pneumatics Research Institute/IHP, Cutitul de Argint 14, 040558 Bucharest, Romania
3
Faculty of Building Services, Technical University of Civil Engineering Bucharest, 66 Pache Protopopescu Blvd., 020396 Bucharest, Romania
*
Author to whom correspondence should be addressed.
Energies 2023, 16(19), 6953; https://doi.org/10.3390/en16196953
Submission received: 31 August 2023 / Revised: 26 September 2023 / Accepted: 30 September 2023 / Published: 5 October 2023
(This article belongs to the Section A: Sustainable Energy)

Abstract

:
This article presents novel research on the utilization of a neural-network-based time control system for microwave oven heating of food items within a solar-powered vending machine. The research aims to explore the control of heating time for various food products, considering multiple variables. The neural network controller is calibrated through extensive experimentation, allowing it to accurately predict optimal heating times based on input parameters such as food type, weight, initial temperature, water content, and desired doneness level. The results demonstrate that the neural-network-controlled microwave oven achieves precise and desirable heating durations, mitigating the risk of overheating and ensuring superior food quality and taste. Moreover, the solar-powered vending machine showcases a commitment to sustainable energy sources, effectively reducing dependence on non-renewable energy and minimizing greenhouse gas emissions. To maintain food quality and freshness, a food refrigeration unit is integrated into the vending machine, employing load-balancing technology to control the refrigeration chamber’s temperature effectively. Energy efficiency is prioritized in both the refrigeration unit and the microwave oven through intelligent algorithms and system optimization. The combination of a neural-network-controlled microwave oven, a solar-powered vending machine, and a food refrigeration unit introduces a novel and sustainable approach to food preparation and energy management.

1. Introduction

Currently, post the COVID-19 pandemic, activities are resumed both at workplaces and in public and entertainment spaces (parks, shows, etc.). The provision of food that is appropriate to human activities, fresh and warm, is of major importance for the health of the population. In order to provide hot food as close as possible to the workplace or outdoor activities, we have developed an energy-independent hot food delivery system. The delivery system is energy-autonomous and provides both cooked products and products which are heated straight away for immediate consumption. The delivery system can also deliver cold products in case they are consumed later or in another location. Stand-alone systems for the delivery of hot products are becoming an alternative for fast food restaurants.
Thus, according to Ref. [1], communities are moving towards healthier products in vending machines due to the lower prices of the sold products. In cases where energy-efficient systems are used, the prices of products will be lower than for similar products in the hospitality system. Energy-independent vending systems equipped with photovoltaic panels have several advantages, such as reduced electricity costs, the possibility to be located anywhere, easy relocation, ease of installation, independence from the local electricity grid, being environmentally friendly, and reduced CO2 emissions [2,3].
The market for energy-independent vending systems is in its infancy but is expected to grow significantly in the coming years. According to Refs. [4,5], the global smart vending machine market will reach USD 21.4 billion by 2030. The global, post-COVID-19, smart vending machine market, which was worth USD 9.2 billion in 2022, is estimated to reach a value of USD 21.4 billion by 2030, growing at a compound annual growth rate (CAGR) of 11.1% during the analysis period 2022–2030. The heated products market is estimated to grow at 11.4% CAGR and reach USD 22.1 billion by 2030. Given the continued post-pandemic recovery, the growth of the snacks segment shows a CAGR of 10.3% for the period 2022–2030.
In recent years, advancements in technology have revolutionized various aspects of our daily lives, including the way we prepare and consume food. One such area of innovation is the control of heating time in microwave ovens, specifically for different food items with varying water content. One of the most common power sources for microwave ovens is magnetrons. The spectrum of the microwaves generated by magnetrons depends on the food that is heated, the position of the food, and may even vary between individual ovens of the same model. This is the reason heating food in a microwave oven is unpredictable [6]. Simultaneous heat and mass transfer phenomena appear when the moisture transport takes place inside the solid during food processes such as microwave heating. The packaged foods in cold storage are considered porous media with small pores [7].
Factors influencing microwave heating of products, according to research presented in Microwave Heating: Alternative Thermal Process Technology for Food Application [8], can be: microwave frequency (there is a dependence between the dielectric properties of the product and the frequency of the applied field); product humidity (water influences the dielectric properties of the products); final temperature of the products (the higher the final temperature, the more water evaporates and the dielectric of the products is affected); product density (the more porous the product, the lower the dielectric properties due to the lower dielectric properties of the air incorporated in the material); dissolved salts (dissolved salts in products drive the loss factor as salts are conductors of the electromagnetic field).
This article aims to explore the utilization of a neural network to regulate the heating process in a microwave oven [9] integrated within a solar-powered vending machine. Additionally, this article (research) will discuss the significance of food refrigeration through a refrigeration unit and the efficient management of energy consumption in both the refrigeration unit and the microwave oven.
The neural network used in this context is calibrated using experimental results, where various food products are tested to determine the optimal heating time for achieving desired outcomes [10], unlike in the case of a traditional system where the product is heated each time without considering its specific characteristics. Through machine learning techniques, the neural network learns to correlate input parameters such as food type, weight, initial temperature, water content, and even desired level of doneness with the desired heating time. This calibration process ensures that the neural network provides accurate predictions for optimal heating, taking into account the specific characteristics of the food items. By employing machine learning algorithms [11], the neural network can process input data and generate accurate predictions for the ideal heating duration [12], allowing the microwave oven to adapt to various food characteristics. The network’s calibration is achieved through extensive experimentation, ensuring that the system’s performance aligns with empirical results. This intriguing solution enables the microwave oven to achieve perfectly heated meals while minimizing the risk of overheating.
Furthermore, the use of a solar-powered vending machine demonstrates a commitment to sustainable energy sources. The vending machine’s electrical energy is supplied by a group of solar panels, harnessing the power of the sun to generate electricity. This approach not only reduces dependence on non-renewable energy but also mitigates environmental impact by minimizing greenhouse gas emissions. By utilizing solar energy, the vending machine contributes to a greener and more sustainable future.
To maintain food quality and prevent spoilage, the vending machine incorporates a food refrigeration unit. This unit employs advanced refrigeration technology to maintain a low temperature within the cooled chamber of the vending machine, ensuring that the food items remain fresh and unaltered. By controlling the temperature effectively, the refrigeration unit safeguards the nutritional value and taste of the food, enhancing the overall consumer experience. Moreover, the refrigeration unit is designed with energy efficiency in mind, utilizing advanced cooling techniques to minimize energy consumption while still providing optimal food refrigeration.
Efficient energy management is crucial in both the refrigeration unit and the microwave oven to maximize the system’s performance and minimize energy consumption. By employing intelligent algorithms and optimizing the operation of these devices [13], energy efficiency can be significantly enhanced. This includes strategies such as load balancing, temperature regulation, and system optimization, all geared towards minimizing wastage and promoting sustainability [14]. Moreover, the vending machine is equipped with energy storage systems, such as batteries, which store excess solar energy during peak production hours and utilize it during periods of lower solar availability, ensuring a continuous and reliable power supply of the vending machine subsystems.

2. Materials and Methods

The research was carried out on the SVIEE energy efficient vending machine prototype installed and studied at The Technical University of Civil Engineering of Bucharest (UTCB), illustrated in Figure 1. This study continues the research on consumption optimization in the case of an energy-independent vending system. In the article Study on Energy Efficiency of an Off-Grid Vending Machine with Compact Heat Exchangers and Low GWP Refrigerant Powered by Solar Energy [15], the research on the efficiency of the thermally insulated enclosure and the refrigeration system of the experimental model developed for the study of energy-independent vending systems was presented. Research on optimizing the operation of independent energy sales systems has also focused on the influence of the DC–AC inverter [16] and heat transfer in the experimental model of the independent energy sales system [17]. This article presents the research on the optimization of the electrical energy consumption of the heating system of the products to be delivered by the vending machine. The studied SVIEE prototype has the following subsystems: photovoltaic panel array; solar energy storage battery array; command and control system; thermally insulated enclosure; cooling system; product heating system; resistance structure.
The analysis of the electrical scheme of the vending machine confirms the need to carry out research to make energy consumption more efficient for both the cooling system and the product heating system. Optimization of the energy consumption of the heating system is necessary in order to save as many resources as possible for the product cooling system. Switching off the cooling system when the vending machine contains products in the thermally insulated enclosure leads to product spoilage. The energy balance is very sensitive, as the system can also be affected by climatic factors (cloudiness) leading to a decrease in electricity production. The presented study aims at controlling the heating system by controlling the heating time of the products to be delivered using a neural network developed and trained for this purpose.
Components illustrated in Figure 2 of the electrical system of the energy-independent vending machine: 1—solar panels, type TSM, 405 DE09. 08, maximum power 405 W; 2—accumulators, type Victron GEL 12 v 130 AH; 3—battery balancer, type Victron; 4—MPPT, type Victron 150/70 Tr; 5—inverter, type Victron Phoenix 5000 W 48 V–230 V; 6—microwave oven, type M2A/28A vending machines; 7—compressor, type Embraco NEU6181U; 8—vaporizer, type Guyan GNKF 850 YAN; 9—condenser, type ELCO; 10—command and control system, manufactured by us. The energy flow produced by the array of photovoltaic panels sent to the battery bank is managed by the MPPT type charge controller. MPPT controllers are known for their efficiency in converting the voltage from the photovoltaic panels to the battery charging voltage. The DC/DC conversion efficiency of these systems is 98% [18]. A battery balancer integrated between the four batteries was used to balance the charging or discharging of the battery bank.
For heating the products delivered by the energy-independent vending machine, a microwave oven specially built for model M2A/28A vending machines [19] was adopted and installed. This microwave oven is in the category of those without a rotating table and is equipped with two mirror-mounted magnets. The components of the oven are shown in Figure 3. The oven is equipped with a stainless-steel outer casing; 1—side door; 2—wave stirrer; 3—motorized pallet for the evacuation of heated products; 4—outer casing; 5—upper magnetron; 6—wave stirrer; 7—lower magnetron; 8—front door. The microwave oven is manufactured in such a way that it allows the products to be introduced through the automated side door from the refrigerating chamber and to be discharged, after heating, in a direction perpendicular to the direction of introduction of the products, through the automated front door. The discharge is performed by pushing with the help of a motorized pallet. The oven has a power of 2000 W and uses two LG 2M286-23TAG 1050 W magnetrons with a microwave frequency of 2450 +/− 50 MHz.
In order to obtain the necessary data to train the neural network, we carried out practical tests on electricity consumption by heating different products in the microwave oven for different time periods. For easier testing, the microwave oven was removed from the vending machine and tested in the laboratory, but it was powered from the electrical system of the vending machine. The test stand, shown in Figure 4, consists of: 1—microwave oven; 2—automated door opening system; 3—HIOCHI PW3198 analysis device; 4—laptop; 5—controller for adjusting the heating time.
The HIOKI PW3198 power quality analyzer has the measurement accuracy voltage: ±0.1% of nominal voltage; current: ±0.2% rdg. ± 0.1% f.s. + current sensor accuracy; active power: ±0.2% rdg. ± 0.1% f.s. + current sensor accuracy [20]. The equipment, throughout the duration of the tests, collected data on supply voltage, current, and electrical energy absorbed by the microwave oven. The data stored in the storage medium of the equipment were analyzed with the PQ ONE software version 10.2.0, which allows the presentation of the values of the electrical energy absorbed by the microwave oven in graphical or tabular form. On the basis of preliminary tests and calibration of the experimental stand, we found that there is a time of about 5–6 s before the magnetron enters the nominal operating mode. Taking this into account, the minimum heating time was 10 s [21].
The temperature measurement of the products was carried out with a contact thermometer (measuring range—50–300 degrees Celsius; measuring accuracy +/− 0.1 degrees Celsius), an infrared thermometer (measuring range—20–380 degrees Celsius; measuring accuracy +/− 2 degrees Celsius). The surface temperature analysis of the products in the pots was carried out with an FILR C5 thermal imaging camera. The weighing of the products was carried out with a scale with an accuracy of +/− 1 g. For the tests, we considered three types of products packed in crates with a size of 187 mm × 137 mm × 37 mm. The heated products are: P1—boiled rice; P2—pasta with tomato sauce; P3—sausage and cheese sandwich. The test procedure involved the following steps: preparation of the product plastic recipients; storage of the recipients in the cold room; removal from the cold room; weighing of the product plastic recipient; determination of the starting temperature of the product; introduction of the recipient into the microwave oven; heating of the microwave oven for the programmed time; removal of the plastic recipient; determination of the stopping temperature of the product in the heated areas. The products were stored in the refrigerator premises of the vending machine.

3. Results

3.1. Electrical and Thermal

The HIOKI PW3198 power quality analyzer determines the active power during tests, as shown in Figure 4 and Figure 5. We have a single phase 2 wire 1P2W, and the effective RMS (root mean square) electrical quantities were determined using the formulas [16]:
U r m s = 1 M S = 0 M 1 ( U S ) 2   V
I r m s = 1 M S = 0 M 1 ( I S ) 2
P = 1 M S = 0 M 1 ( U S × I S )
W P = k 1 h P
where Urms—root mean square voltage; Irms—root mean square current; P—active power; WP—active energy; M—number of samples per cycle; h—measurement time; k—coefficient for converting to 1 h. For the frequency of 50 Hz, at which the microwave oven operated, according to IEC61000-4-30 [22], we calculated from the approx. 200 ms aggregation of 10 waveforms. The microwave oven test stand, shown in Figure 5, consists of: 1—microwave oven; 2—automated door opening system; 3—HIOCHI PW3198 analysis device; 4—laptop; 5—controller for adjusting the heating time.
The analysis of the thermal images, shown in Figure 6, shows that the products are not uniformly heated due to their different porosity, density, and humidity. The microwave heating of products is largely dependent on the amount of water present in the product [8,23], which was also found in experimental research. Microwave heating is volume heating, and the temperature measurement of the heated product was carried out by using a contact thermometer which was inserted into the volume of the product as shown in Figure 7 (right).
In Figure 8a,b and Figure 9a,b we show the HIOKI PW3198 device recordings for voltage, current, power and energy obtained for the heating test of product P1—rice pilaf witch heating time of 10 s, 20 s, 30 s (the blue and white triangle represents the start and end of a test).
After performing the heating tests for the set of nine prepared plastic recipients (C1–C9), we obtained the values shown in Figure 10, Figure 11 and Figure 12. The tests were repeated four times for the same type of products and under the same test conditions. The values shown represent the arithmetic mean of the values obtained from the tests.

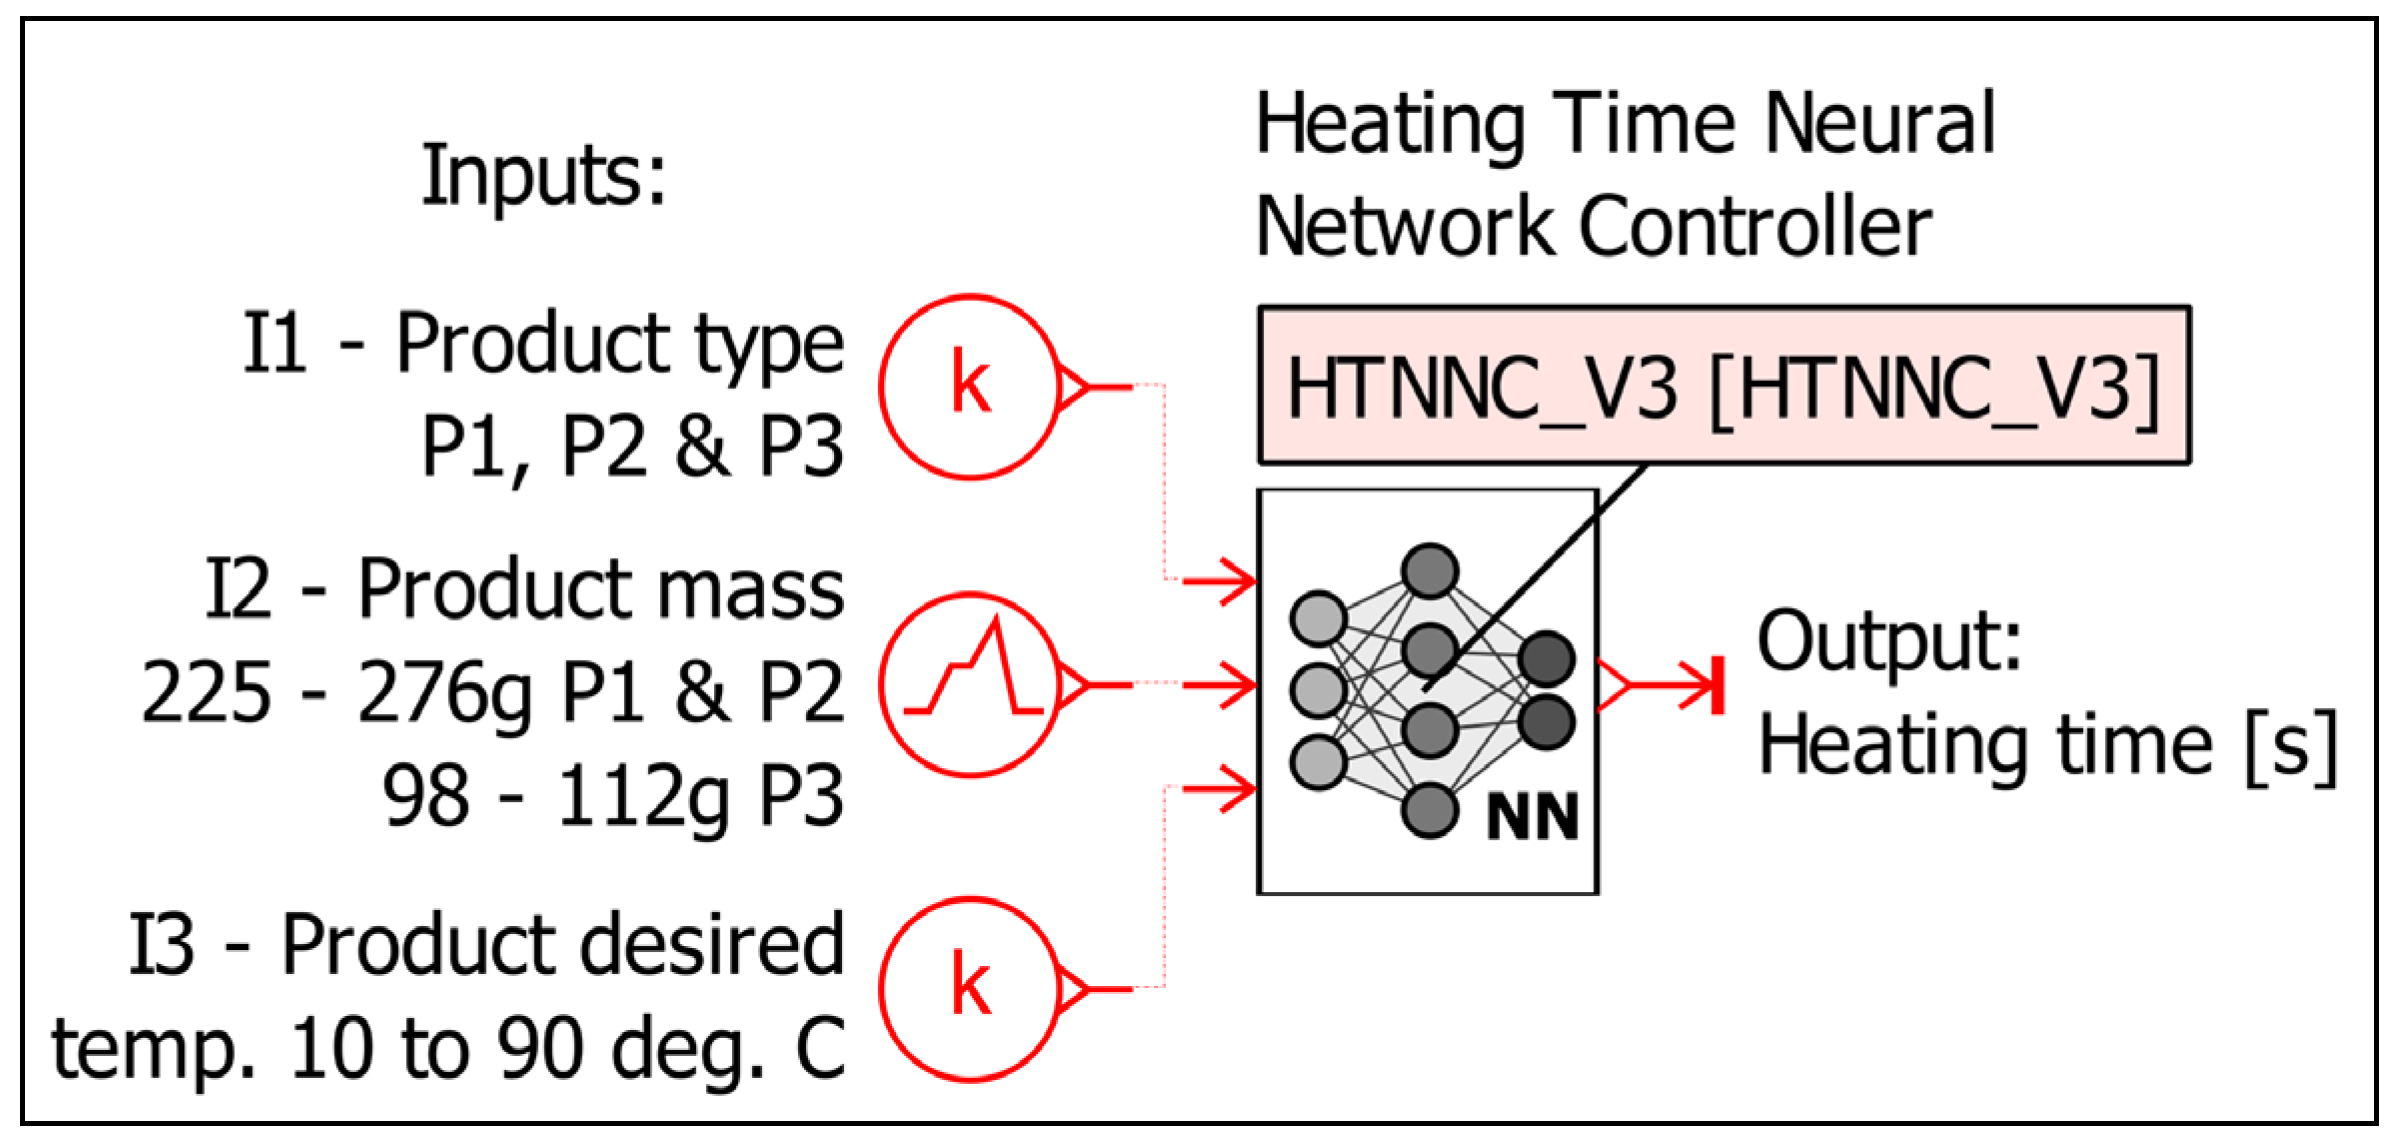
3.2. Neural Network Controller

In this section of the paper, two numerical simulations were performed using the Simcenter AMESim numerical simulation software to optimize the management of the energy used and for training, validation, and virtual implementation of the Heating Time Neural Network Controller (HTNNC) for the microwave oven.
The first numerical simulation, the Energy Management Controller (EMC), is focused on the energy management, which considered the charge level of the vending machine batteries and the next day’s sunshine level resulting from nebulosity predictions to limit the maximum heating temperature of the products in order to conserve energy. The simulation’s logic involved three inputs: X for battery charge range, Y for next-day sunshine level, and desired value of product heating temperature. The simulation network effectively limits the product heating temperature command based on these inputs. This limited temperature command is later used as one of the inputs (I3) for the second numerical simulation, the HTNNC. Figure 13 showcases the structure of the first numerical simulation network, highlighting its logic, parameters, and components, while Figure 14 presents the equation and graph of the sunshine level from the next-day nebulosity function.
In the second numerical simulation, the Heating Time Neural Network Controller (HTNNC) was developed as an innovative approach to determine the precise heating time required for various food products. This intelligent neural network was trained to make decisions based on three critical inputs. Firstly, I1 represented the product type, encompassing different categories denoted as P1, P2, and P3. Secondly, I2 represented the product mass, which varied for different product types, ranging from 225 g to 275 g for P1 and P2 and from 98 g to 112 g for P3. Lastly, I3 served as the input for the product’s desired temperature, an essential parameter that significantly influences the heating process. It is worth noting that the product’s desired temperature input was acquired from the output of the Energy Management Controller (EMC), which optimizes the product’s heating temperature based on the vending machine’s battery charge level and next-day sunshine level.
To train the HTNNC, an extensive and comprehensive set of experiments was meticulously conducted, encompassing 9 experiments for each distinct product type, thereby resulting in a total of 27 experiments. The training process involved gathering vast amounts of data to feed into the neural network, allowing it to learn and make accurate predictions for optimal heating times based on the product’s characteristics. The training and validation methodology for this neural network is elaborately presented in the following set of figures. These figures provide an insightful visual representation of the experimental data, the model setup, training parameters, and the overall performance of the neural network during the training process. Through these rigorous experiments and validation procedures, the HTNNC is refined and honed to achieve exceptional precision and reliability in determining the heating time for various food items within the solar-powered vending machine’s microwave oven.
Figure 15, Figure 16 and Figure 17 present visual insights into the experimental and training data of the HTNNC. In Figure 15, the curves highlight the experimental and training data specifically related to Product Type 1. Similarly, Figure 16 is for Product Type 2, and Figure 17 is for Product Type 3.
These figures (Figure 15, Figure 16 and Figure 17) graphically display the relationships between the product type, product mass, product temperature, and the corresponding heating time. Through these visualizations, patterns and trends can be observed, enabling the neural network to effectively learn and make accurate predictions based on these inputs. The experimental data, when combined with advanced machine learning techniques, play a pivotal role in refining the HTNNC’s ability to precisely determine the optimal heating time for each unique food product, contributing to the overall efficiency and quality.
Figure 18 illustrates the neural network builder with the training and validation data of the new neural network. In this figure, one can identify the 18 data sets that are used and the 4 variables of the neural network.
Figure 19 outlines the training parameters used in the training process. The training parameters include critical settings such as learning rate and batch size, which directly influence the network’s ability to generalize and make accurate predictions. By carefully adjusting these parameters, researchers and developers can achieve an optimal balance between avoiding overfitting and underfitting, ultimately leading to a well-trained and efficient neural network model [24].
Figure 20 showcases the model setup and training monitor for the HTNNC, offering crucial details about the neural network’s architecture and training progress. With a large number of training epochs (50,000) representing the number of times the entire data set is used to train a neural network [25], this figure highlights the dedication to fine-tuning the HTNNC model to achieve exceptional accuracy in determining heating times for various food products. The representation of six layers in the neural network indicates a deep learning architecture [26], enabling the network to capture intricate patterns and relationships between inputs and outputs. The HTNNC model is designed with three inputs, representing product type, product mass, and desired temperature, which collectively contribute to precise heating time predictions. The single output corresponds to the heating time, a fundamental parameter to ensure optimal and efficient food preparation in the solar-powered vending machine. By providing insights into the network’s structure and extensive training process, Figure 20 demonstrates the sophistication and effectiveness of the HTNNC training by displaying a very small training mean squared error with a maximum value of 10−3 at the end of the training process.
Figure 21 provides additional information about the trained neural network model; showcasing the model manager for HTNNC_V3, it provides a comprehensive overview of the neural network’s performance and architecture. The training fidelity and validation fidelity, both of 99.4%, underscore the remarkable accuracy achieved by the HTNNC_V3 model in predicting heating times for diverse food products. The model’s exceptional fidelity demonstrates its ability to generalize effectively and make precise decisions based on the input parameters [27]. The training duration of 533 s indicates the computational efficiency of the training process, ensuring fast and effective development of the model. The neural network’s architecture, consisting of six layers of dense type, each with 100 neurons activated by the rectified linear unit (ReLU) function, which is the most-used activation function [28], working well when the system shows saturated behavior, enables the model to capture complex relationships and patterns within the input data. Overall, the ReLU has become the preferred choice for most hidden layers in modern neural networks due to its simplicity, effectiveness, and ability to tackle gradient issues by mitigating the vanishing gradient problem [29].
Figure 22 displays the plot of the training results using static data. Since all the gray dots on the graph—representing the experimental data—and the neural network output—depicted with red dots—overlap perfectly, the training results are excellent, and assessment is also given by the linear correlation coefficient (Pearson) [30]—“fidelity index—100%”—on the left side of the image.
Figure 23 presents a graphical X–Y plot of the training results. Since all points are on the ideal line, this means a perfect fit resulted from excellent training and well-chosen training parameters.
Figure 24 displays the error distribution plot resulting from the training process, which is the difference between the predicted output of the neural network and the true value from the result set (training data). The control error of average temperature for this application is very small, reaching 0.004 °C, and the maximum error is 0.015 °C.
Following the neural network model’s successful validation, this model was exported as a submodel, which was integrated in the numerical simulation no. 2 that is presented in Figure 25. This figure showcases the simulation network of the completed HTNNC, which is responsible for controlling the heating time of the food products in the microwave oven.

4. Discussions

This section of the article presents four figures that encapsulate the outcomes of the study’s simulations and provide insights into the performance of the proposed methodologies.
Figure 26 is generated from a Monte Carlo study whose results were plotted in the form of a response surface. The results of this study are not extraordinarily accurate because some interpolation was performed between the 100 runs of the study; still, the results are accurate enough for this application.
Figure 26 represents a complex result from the first numerical simulation, the EMC. The graph plots the battery charge range with values between zero and one on the X-axis, next-day sunshine level with values between zero and one on the Y-axis, and the product heating temperature command in °C on the Z-axis, depicted in various colors. This visualization offers a comprehensive understanding of how battery charge and predicted next-day sunshine levels limit the product heating temperature command, providing essential insights into the interplay between energy availability and maximum heating temperatures of the food products. Also in the same figure, one can see how, regardless of the next-day sunshine level, if the batteries are discharged below 30%, the vending machine will deliver unheated food products to keep enough energy for the refrigeration unit. On the other side, if the batteries are charged above 60%, the vending machine will deliver the food heated to the temperature the customer wants, but not higher than 90 °C.
Figure 27, Figure 28 and Figure 29 are the results of the second numerical simulation, the HTNNC, which focuses on predicting the optimal heating time of food products depending on their mass and the desired temperature. These figures are also plotted as response surfaces, only, unlike in Figure 14, the results presented by them are much more precise because they result from a batch simulation and each of them has 161 runs with a step of 0.5 °C.
Graphing product mass in grams on the X-axis, heating time in seconds on the Y-axis, and product temperature in °C in color on Z-axis, Figure 15 illustrates the relationship between these variables for product 1. The visual representation showcases how variations in product mass and heating time impact the resulting product temperature, offering valuable insights into the heating process’s dynamics and efficiency.
In Figure 27, one can see how for the same heating time, if the mass of the product increases, the temperature decreases. Unfortunately, the same trend is not noticed in the case of Figure 28 and Figure 29, most likely due to the inconsistency with which the experimental data were acquired, caused by the type of product and its inhomogeneity, or due to the too small size of the data set that was used for training and validation of the neural network.
Similar to Figure 27, Figure 28 presents product 2’s heating process. The graph presents different heating dynamics for product 2 in comparison with product 1, revealing unique characteristics and trends in the heating behavior.
Figure 29 presents the heating process for product 3, mirroring the format of Figure 27 and Figure 28. By visualizing the relationship between product mass, heating time, and product temperature, this figure sheds light on how the heating characteristics differ for product 3 compared to the other two products.

5. Conclusions

The Results and Discussions sections of this article showcase a comprehensive analysis through a set of graphs, offering valuable insights into the outcomes of simulations and the effectiveness of proposed methodologies. The combination of response surfaces, dynamic heating analyses, and neural-network-driven predictions empowers this study with a comprehensive perspective on food heating within the solar-powered vending machine context. The insights gained from these graphs contribute to advancing our understanding of energy-efficient food heating, paving the way for more precise control strategies and sustainable approaches in the field of food processing and energy management.
By leveraging a well-calibrated neural network, the HTNNC can accurately determine the optimal heating time for each food product, ensuring exceptional quality, taste, and energy efficiency in the microwave oven heating process. By combining the information from the Energy Management Controller and the HTNNC, the microwave oven is equipped with an intelligent neural-network-based system that optimizes the heating time for various food products based on their type, mass, and desired temperature. This advanced control system ensures precise and efficient food preparation, enhancing the overall quality and taste while also promoting sustainable energy practices through the use of a solar-powered vending machine. The results of this study demonstrate the potential of such technological advancements in revolutionizing food processing and energy management for a greener and more sustainable future of solar-powered vending machines.
Through meticulous experimentation and numerical simulations, this study demonstrates the accuracy and effectiveness of the neural-network-controlled microwave oven in achieving precise heating durations for various food products. The incorporation of intelligent algorithms, coupled with a commitment to sustainable energy sources and energy management practices, underlines the promising prospects for a greener and more efficient future in the food preparation and energy consumption of solar-powered vending machines.
The integration of scientific rigor and innovative technologies in this research underscores the potential to revolutionize traditional food processing methods. The presented results, figures, and discussions highlight the intricate relationships between input parameters, heating times, and temperatures, offering a holistic understanding of the proposed systems’ capabilities and their broader implications for sustainable food production and the energy optimization of solar-powered vending machines.
The combination of the neural-network-controlled heating time of the microwave oven, powered by a solar energy vending machine, with a food refrigeration unit introduces a novel and sustainable approach to food preparation and energy management of solar-powered vending machines. The neural network’s ability to adapt to different food types, water content, and desired doneness levels allows for precise heating control, ensuring optimal quality and taste. The integration of solar panels and efficient energy management techniques promotes sustainability, reducing environmental impact and optimizing energy consumption. By embracing these technological advancements, we can pave the way for a greener, more efficient, and delicious future.
In conclusion, this article presents a comprehensive exploration of a novel approach to food heating in a microwave oven within a solar-powered vending machine, driven by neural-network-based control systems. The integration of advanced technologies, including the Energy Management Controller and the Heating Time Neural Network Controller, showcases the potential to enhance food quality, energy efficiency, and sustainability in food processing of solar-powered vending machines.

Author Contributions

Conceptualization, I.M.S. and A.-P.C.; methodology, I.M.S., A.-P.C., O.T. and M.C.; software, A.-P.C.; validation, A.-P.C., O.T., I.M.S. and M.C.; formal analysis, I.M.S. and A.-P.C.; investigation, A.-P.C., O.T., I.M.S. and M.C.; resources, A.-P.C., M.C. and A.N.; data curation, A.-P.C., O.T., I.M.S., M.C. and A.N.; writing—original draft preparation, I.M.S., A.-P.C., O.T. and A.N.; writing—review and editing, I.M.S., A.-P.C., O.T. and A.N.; visualization, A.-P.C. and I.M.S.; supervision, I.M.S.; project administration, I.M.S.; funding acquisition, A.N. All authors have read and agreed to the published version of the manuscript.

Funding

This work was financially supported in part by the Competitiveness Operational Program—project name: Innovative Energy Efficient Sales Systems for Urban Areas (acronym, SVIEE, MySMIS code 121420), a co-financed project from the European Regional Development Fund by Operational Program Competitiveness.

Data Availability Statement

Not applicable.

Conflicts of Interest

The authors declare no conflict of interest.

References

  1. Hasan, H.; Faris, M.A.-I.E.; Mohamad, M.N.; Al Dhaheri, A.S.; Hashim, M.; Stojanovska, L.; Al Daour, R.; Rashid, M.; El-Farra, L.; Alsuwaidi, A.; et al. Consumption, Attitudes, and Trends of Vending Machine Foods at a University Campus: A Cross-Sectional Study. Foods 2021, 10, 2122. [Google Scholar] [CrossRef] [PubMed]
  2. Anker. How Can Solar Powered Vending Machines Help Get More Profit? Available online: https://www.anker.com/blogs/solar/solar-powered-vending-machines (accessed on 20 July 2023).
  3. EcoFriend. Solar Energy Powers Awesome Vending Machines. Available online: https://ecofriend.com/solar-energy-powers-awesome-vending-machines.html (accessed on 20 July 2023).
  4. Research and Markets. Intelligent Vending Machines: Global Strategic Business Report. Available online: https://www.researchandmarkets.com/reports/3301146/intelligent-vending-machines-global-strategic?gclid=EAIaIQobChMI8pqNmdrogAMVxepRCh08qALVEAAYASAAEgIz8vD_BwE#product--toc (accessed on 20 July 2023).
  5. EU Green Public Procurement Criteria for Food, Catering Services and Vending Machines. Available online: https://circabc.europa.eu/ui/group/44278090-3fae-4515-bcc2-44fd57c1d0d1/library/9cd7f542-d33c-43f6-91af-b3838c08c395/details (accessed on 20 July 2023).
  6. Zhou, X.; Pedrow, P.D.; Tang, Z.; Bohnet, S.; Sablani, S.S.; Tang, J. Heating performance of microwave ovens powered by magnetron and solid-state generators. Innov. Food Sci. Emerg. Technol. 2023, 83, 103240. [Google Scholar] [CrossRef]
  7. Datta, A.K. Porous media approaches to studying simultaneous heat and mass transfer in food processes. I: Problem formulations. J. Food Eng. 2007, 80, 80–95. [Google Scholar] [CrossRef]
  8. Verma, D.K.; Mahanti, N.K.; Thakur, M.; Chakraborty, S.; Srivastav, P.P. Microwave Heating: Alternative Thermal Process Technology for Food Application. In Emerging Thermal and Nonthermal Technologies in Food Processing; Apple Academic Press: Palm Bay, FL, USA, 2020. [Google Scholar] [CrossRef]
  9. Li, J.; Xiong, Q.; Wang, K.; Shi, X.; Liang, S.; Gao, M. Temperature Control During Microwave Heating Process by Sliding Mode Neural Network. Dry. Technol. 2015, 34, 215–226. [Google Scholar] [CrossRef]
  10. Lee, S.; Cho, S.; Kim, S.-H.; Kim, J.; Chae, S.; Jeong, H.; Kim, T. Deep Neural Network Approach for Prediction of Heating Energy Consumption in Old Houses. Energies 2021, 14, 122. [Google Scholar] [CrossRef]
  11. Nabipour, M.; Nayyeri, P.; Jabani, H.; Mosavi, A.; Salwana, E.; Shahab, S. Deep Learning for Stock Market Prediction. Entropy 2020, 22, 840. [Google Scholar] [CrossRef]
  12. Chen, C.R.; Ramaswamy, H.S. Analysis of critical control points in deviant thermal processes using artificial neural networks. J. Food Eng. 2003, 57, 225–235. [Google Scholar] [CrossRef]
  13. Kollia, I.; Stevenson, J.; Kollias, S. AI-Enabled Efficient and Safe Food Supply Chain. Electronics 2021, 10, 1223. [Google Scholar] [CrossRef]
  14. Sharma, S.; Gahlawat, V.K.; Rahul, K.; Mor, R.S.; Malik, M. Sustainable Innovations in the Food Industry through Artificial Intelligence and Big Data Analytics. Logistics 2021, 5, 66. [Google Scholar] [CrossRef]
  15. Calota, R.; Savaniu, M.; Girip, A.; Nastase, I.; Georgescu, M.R.; Tonciu, O. Study on Energy Efficiency of an Off-Grid Vending Machine with Compact Heat Exchangers and Low GWP Refrigerant Powered by Solar Energy. Energies 2022, 15, 4433. [Google Scholar] [CrossRef]
  16. Culcea, M.; Darie, E.; Gheorghe, S.; Pecsi, R.; Savaniu, M.I. The influence of a DC-AC inverter used in a stand-alone vending machine equipped with photovoltaic panels. In IOP Conference Series: Earth and Environmental Science, Proceedings of the 8th Conference of the Sustainable Solutions for Energy and Environment EENVIRO 2022, Bucharest, Romania, 16–21 October 2022; IOP Publishing Ltd.: Bristol, UK, 2023; Volume 1185. [Google Scholar] [CrossRef]
  17. Calotă, R.; Girip, A.; Ilie, A.; Glavă, G.; Savaniu, M. Study on the heat transfer with regard to an off-grid vending machine having a low impact on the environment. In IOP Conference Series: Earth and Environmental Science, Proceedings of the 8th Conference of the Sustainable Solutions for Energy and Environment EENVIRO 2022, Bucharest, Romania, 16–21 October 2022; IOP Publishing Ltd.: Bristol, UK, 2023; Volume 1185, p. 1185. [Google Scholar] [CrossRef]
  18. Victron Energy. MPPT Solar Charger Manual; Victron Energy, B.V., Ed.; Victron Energy Manuals Publishing House: Almere, The Netherlands, 2021. [Google Scholar]
  19. Available online: http://www.chinaxhwb.com/ (accessed on 20 July 2023).
  20. Available online: https://www.hioki.com/global/products/pqa/power-quality/id_5824 (accessed on 20 July 2023).
  21. Available online: https://www.hioki.com/global/support/download/software/versionup/detail/id_562 (accessed on 20 July 2023).
  22. EN 61000-4-30:2009; Electromagnetic Compatibility (EMC)—Part 4-30: Testing and Measurement Techniques—Power Quality Measurement Methods. Slovenian Institute for Standardization: Ljubljana, Slovenia, 2009.
  23. Zaica, A.; Nedelcu, A.; Ciupercă, R.; Popa, L.; Păun, A.; Lazăr, G.; Ștefan, V.; Petcu, A.; Zaica, A. Theoretical aspects of the aeration drying process with application in the hay technology. Ann. Univ. Craiova—Agric. Mont. Cadastre Ser. 2015, 45, 259–267. [Google Scholar]
  24. Ikeuchi, D.; Vargas-Uscategui, A.; Wu, X.; King, P.C. Data-Efficient Neural Network for Track Profile Modelling in Cold Spray Additive Manufacturing. Appl. Sci. 2021, 11, 1654. [Google Scholar] [CrossRef]
  25. Xu, C.; Coen-Pirani, P.; Jiang, X. Empirical Study of Overfitting in Deep Learning for Predicting Breast Cancer Metastasis. Cancers 2023, 15, 1969. [Google Scholar] [CrossRef] [PubMed]
  26. Alom, M.Z.; Taha, T.M.; Yakopcic, C.; Westberg, S.; Sidike, P.; Nasrin, M.S.; Hasan, M.; Van Essen, B.C.; Awwal, A.A.S.; Asari, V.K. A State-of-the-Art Survey on Deep Learning Theory and Architectures. Electronics 2019, 8, 292. [Google Scholar] [CrossRef]
  27. Zhang, X.; Xie, F.; Ji, T.; Zhu, Z.; Zheng, Y. Multi-fidelity deep neural network surrogate model for aerodynamic shape optimization. Comput. Methods Appl. Mech. Eng. 2021, 373, 113485. [Google Scholar] [CrossRef]
  28. Ryu, S.; Noh, J.; Kim, H. Deep Neural Network Based Demand Side Short Term Load Forecasting. Energies 2017, 10, 3. [Google Scholar] [CrossRef]
  29. Bilal, M.A.; Wang, Y.; Ji, Y.; Akhter, M.P.; Liu, H. Earthquake Detection Using Stacked Normalized Recurrent Neural Network (SNRNN). Appl. Sci. 2023, 13, 8121. [Google Scholar] [CrossRef]
  30. Huang, C.-J.; Kuo, P.-H. A Deep CNN-LSTM Model for Particulate Matter (PM2.5) Forecasting in Smart Cities. Sensors 2018, 18, 2220. [Google Scholar] [CrossRef] [PubMed]
Figure 1. Prototype SVIEE energy-independent vending system.
Energies 16 06953 g001
Figure 2. Electrical system of the SVIEE vendomat.
Energies 16 06953 g002
Figure 3. Schematic diagram of microwave oven.
Energies 16 06953 g003
Figure 4. Schematic diagram of microwave oven test stand.
Energies 16 06953 g004
Figure 5. Microwave oven test stand.
Energies 16 06953 g005
Figure 6. Surface temperature of products before heating and after heating.
Energies 16 06953 g006
Figure 7. Plastic recipients prepared with tested products (left). Equipment used for temperature measurement (right).
Energies 16 06953 g007
Figure 8. (a) Voltage during tests obtained from the power quality analyzer. (b) Current during tests obtained from the power quality analyzer.
Energies 16 06953 g008
Figure 9. (a)Power during tests obtained from the power quality analyzer. (b) Energy during tests obtained from the power quality analyzer.
Energies 16 06953 g009
Figure 10. Data obtained for product P1 (boiled rice).
Energies 16 06953 g010
Figure 11. Data obtained for product P2 (pasta with tomato sauce).
Energies 16 06953 g011
Figure 12. Data obtained for product P3 (sausage and cheese sandwich).
Energies 16 06953 g012
Figure 13. Simulation network of the Energy Management Controller (EMC).
Energies 16 06953 g013
Figure 14. Sunshine level from the next-day nebulosity function output.
Energies 16 06953 g014
Figure 15. Experimental and training data for Product Type 1.
Energies 16 06953 g015
Figure 16. Experimental and training data for Product Type 2.
Energies 16 06953 g016
Figure 17. Experimental and training data for Product Type 3.
Energies 16 06953 g017
Figure 18. Input of data in the neural network builder.
Energies 16 06953 g018
Figure 19. The training parameters of the HTNNC.
Energies 16 06953 g019
Figure 20. The model setup and training monitor for the HTNNC.
Energies 16 06953 g020
Figure 21. Model manager for HTNNC_V3.
Energies 16 06953 g021
Figure 22. The plot of the training results using static data.
Energies 16 06953 g022
Figure 23. Graphical X–Y plot of the training results.
Energies 16 06953 g023
Figure 24. The error distribution plot.
Energies 16 06953 g024
Figure 25. The simulation network of the completed HTNNC.
Energies 16 06953 g025
Figure 26. Maximum product heating temperature.
Energies 16 06953 g026
Figure 27. Product 1 temperature vs. product mass and heating time.
Energies 16 06953 g027
Figure 28. Product 2 temperature vs. product mass and heating time.
Energies 16 06953 g028
Figure 29. Product 3 temperature vs. product mass and heating time.
Energies 16 06953 g029
Disclaimer/Publisher’s Note: The statements, opinions and data contained in all publications are solely those of the individual author(s) and contributor(s) and not of MDPI and/or the editor(s). MDPI and/or the editor(s) disclaim responsibility for any injury to people or property resulting from any ideas, methods, instructions or products referred to in the content.

