Abstract
In this paper, the performance of an innovative micro-combined cooling, heating, and power (CCHP) system, based on an internal combustion engine fueled with syngas from woody biomass, is analyzed. In particular, a numerical model, which considers a direct coupling between the internal combustion engine and the gasifier as a novel aspect, was developed, validated and applied to three different case studies to perform an energetic, economic and environmental analysis. For each considered case, the CCHP system was equipped with a reversible electric air–water pump and a back-up boiler. The energy analysis shows that the user characterized by a high uniformity of the thermal load exploits the CCHP system in the optimal way as it allows for the highest thermal self-consumption rate. On the contrary, for the cases in which the thermal request is not uniform, a high electric surplus is recorded. In this case, the adoption of the heat pump allows to compensate for this disadvantage by recovering the electric surplus, thus achieving a thermal integration and CO2 emissions reduction of about 15.8% with respect to the case in which no heat pump is used. Overall, the results demonstrate the affordability of the biomass-based CCHP system, which is of increasing importance in this period of contingent international political crisis.
1. Introduction
For preventing the severe effects of climate change, regulations on global greenhouse gas (GHG) emissions have been proposed over the years in various countries. Starting from the United Nations (UN) Kyoto Protocol in late 1997 [], policies related to CO2 emissions reduction have undergone rapid acceleration over the years, and with the Paris Agreement [] adopted in 2015, the achievement of the net ‘zero’ emissions target by 2050 and the mean global temperature rise below 2 °C above pre-industrial levels have been fixed. To meet these objectives, governments are promoting the use of clean fuels in power and propulsion systems [,], and supporting the increase in renewable energy share in the energy mix, and new targets for improving power and propulsion systems energy efficiency have been established.
In this context, the transition towards more decentralized and flexible power systems is gaining interest, wherein CHP (Combined Heating and Power) and CCHP (Combined Cooling Heating and Power) generation systems represent a practical solution, especially for micro-scale applications []. The advantages in terms of CO2 reduction derived from the use of CHP/CCHP technology in comparison with conventional energy supply methods, which adopt electricity from the grid and fossil fuel for heating via boiler technology, have been demonstrated in several works [,,]. These advantages are further enhanced when the CHP/CCHP system is powered with alternative fuels instead of the fossil ones and uses an internal combustion engine (ICE) for power generation. In fact, ICE offers the advantages of flexibility, adaptability for frequent starts and stops, and the capacity to run at partial load. Therefore, it is a proven, dependable, and economically feasible technology []. In addition, research efforts are currently aimed at improving engines’ efficiency. On the other hand, cleaner fuels for feeding internal combustion engines are drawing much attention from researchers []. Among them, natural gas, hydrogen, ammonia, and in general, biofuels obtained through the use of renewable energy are being widely investigated [,,]. Syngas, in particular, can be derived via the gasification processes from natural gas, heavy oil as well as from biomass; it is mainly composed of hydrogen (H2) and carbon monoxide (CO). Therefore, it can be used as the intermediate step in the transition from carbon-based to hydrogen-based fuels. In this study, syngas obtained from biomass gasification is considered, as in addition to its neutral effect on the atmospheric carbon dioxide concentration during its life cycle, it is versatile and can be used to directly feed the ICE with minimal structural modification to the engine and a proper control unit calibration while also taking into account the fuel injection system. However, there are certain technical challenges in the use of syngas in the internal combustion engines. These arise due to the low energy density of the syngas and the variability in its composition, which can cause a significant de-rating of the engines and combustion instability. Moreover, the level of integration between the gasifier and the engine may affect the performance of the CCHP system and the economic feasibility with respect to the separate production. To advance the existing technology and offer novel solutions for increasing competition in the energy market, these issues require in-depth analyses [].
Numerical modeling is a very useful tool for the evaluation and optimization of the CHP/CCHP system performance. This is demonstrated by the growing use of numerical approaches in most of the recent literature, which aim at modeling each single component of the power plant as well as the integrated system. These models include lumped-parameters, as well as 1D and 3D approaches; the most appropriate model is chosen depending on the purpose of the analysis. For instance, Wiemann et al. [] developed a homogeneous single-zone model for evaluating work, heat, product gas composition, and thermal efficiency as well as the optimal ignition time to guarantee the best performance of the engine. Costa et al. [] developed a CFD model of a CI engine operating with combined syngas and biodiesel by focusing not only on de-rating effects under the dual-fuel powering mode but also on pollutant emissions. For all those cases in which system optimization is requested and/or for the implementation of a model-based controller of the integrated system, the advantage derived from the low computational effort and the need for real-time operation necessitate the adoption of simple models for the gasifier and the adoption of 0-1D models for the ICE. Costa et al. [], for instance, considered a micro-CHP system made of a gasifier, a syngas cleaning system and a spark ignition internal combustion engine working as a co-generator. They modeled the whole biomass-to-energy chain within the Thermoflex™ environment, and simultaneously, improved the prediction of the ICE performance through a properly developed and validated one-dimensional (1D) model in GT-Suite®. Similarly, Puig-Arnavat et al. [] developed a model for a small and a medium-scale trigeneration plant, composed of a gasifier, an internal combustion engine and two different absorption chillers: single and double-effect chillers. They tested various biomass compositions and considered different configurations and operating conditions in order to perform a techno-economic evaluation. Finally, a number of studies were carried out by Li et al. [,] with simple models of gasification unit based on a ‘3-reaction model’ of the power generation unit based on manufacturer database and empirical correlations for part-load operation; they analyzed and investigated various configurations, which included integration with organic Rankine cycles, solar devices, heat pumps and proposed multi-criteria optimization [].
However, one aspect that is poorly investigated, both from a modeling and an experimental point of view, is the degree of integration between the gasifier and the ICE in the gasifier–engine–generator system as well as the waste heat recovery of syngas. In most configurations, the syngas produced in the gasifier is stored in a fuel tank, and subsequently, it is used to feed the engine [] so that the engine and the gasifier are uncoupled. This approach enables the optimization of the gasification parameters and relatively high efficiencies are achieved. When a higher degree of integration occurs between the gasifier and the engine, the flow rate of syngas directly feeds the ICE after passing through some post-treatment devices, and the gasifier operating point varies according to the engine load request. This configuration increases the system efficiency owing to the recovery and self-utilization of waste heat in gasification process. However, the high degree of integration of the systems increases model complexity; in fact, unstable operation may occur due to the flow conditions through the gasifier system, wherein the pressure drops across the gasifier systems and then the gas temperature drops at the gasifier outlet. In addition, pulsating gas flows when the engine operates at partial loads should be considered []. Research on this systems category is rare, and to the best of the authors’ knowledge, coupled gasifier-ICE systems have been investigated only in Li et al. []. In a recent work, the authors developed a numerical model of a CCHP system, characterized by a spark ignition engine coupled with an updraft gasifier, which produces syngas obtained from dry solid wood chips []. The numerical model, based on a lumped-parameters approach, considers a variable woody biomass composition and predicts system performance at full and partial load. Data collected from an existing plant, located in Calabria, were used to validate the gasifier-ICE subsystem, and an application to a heath user facility was investigated.
In this research, the model is extended in order to investigate the feasibility of the proposed system from an energetic, economic and environmental perspective for three different typical energy users, characterized by different electric and thermal load variability. In addition, an optimization procedure is developed to improve the techno-economic system performance. In the analyzed cases, a reversible electric air–water heat pump was adopted with the aim to exploit the possible electric surplus, providing heating and cooling energy integrations. This solution is expected to increase the energy self-consumption rate of the system and minimize the use of auxiliary boilers based on fossil fuels. The goal is to assess the system’s performance under various demand scenarios, and to evaluate the benefits and drawbacks of using a system with or without a reversible heat pump. This paper is organized in the following way: the system’s configuration and operating plan are first provided. The modeling technique is then briefly summarized, and the requirements for energy, economic, and environmental factors are reviewed. Third, the system’s performance in cooling and heating modes is examined. Fourth, the system’s performance is assessed annually and seasonally. The key findings are discussed in the Summary and Conclusions section.
2. Materials and Methods
In the current application, three different energy users are considered. A thermal-driven strategy is adopted for winter and intermediate season and a cooling-driven strategy is proposed for summer. The focus is on the thermal load which is highly uniform on a daily basis for the health center, while for the hotel, and more significantly for the residential user, it is highly non-uniform. The CCHP system is integrated with a reversible electric air–water pump for exploiting the electric surplus for heating and cooling integration and with a back-up boiler for thermal integration. Moreover, the system is connected to the grid for electric energy integration and/or for feeding the grid itself when electric surplus occurs. Details on plant configuration, modeling and analysis are given in the following sub-sections.
2.1. Plant Description
The layout of the CCHP plant is displayed in Figure 1. The main plant components are an updraft gasifier, which produces syngas used in a spark ignition internal combustion engine (ICE) connected to an electric load; an absorption chiller (AC) connected to a refrigeration user; a thermal user, which exploits the engine thermal power using several heat exchangers (HEX). For all the analyzed cases, the system is coupled with a reversible air–water heat pump, which exploits the electric surplus by providing heating and cooling energy integrations. An auxiliary boiler and connection to the grid are also included for thermal and electric integration, respectively. Details on components description, performance and specifications can be found in Appendix A.
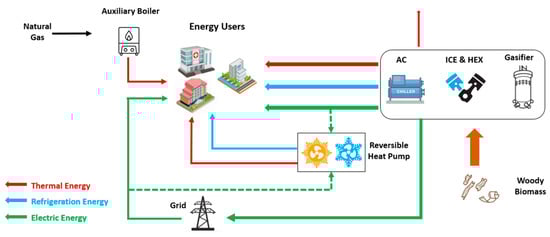
Figure 1.
Layout and energy fluxes of the CCHP system.
2.2. Numerical Model
A lumped-parameters approach was adopted to model the micro-CCHP system. The model predicts the system performance at full and partial loads with different types of biomass. Detailed discussion on model equations can be found in []; only a brief summary is included in this paper for the sake of clarity.
The model includes the gasification unit, which predicts the syngas composition, its lower heating value and cold gas efficiency (CGE), and the thermal power recovered by the syngas cooling according to the equations summarized in Table 1.

Table 1.
Gasifier model equations.
In the above equations, the parameters a1, b1, a2 and b2 (Equations (2)–(4)) were obtained as a function of the equivalence ratio () with a calibration procedure at the experimental test rig; the reactor temperature () was measured using a thermocouple on the gasifier; the syngas mass flow rate (), in Equation (9) was evaluated as follows:
where is the ash mass flow rate predicted as a fraction of the biomass flow rate, is the air mass flow rate to the gasifier, and is calculated as a function of . In Equation (10), and , are the temperatures of the syngas at the inlet and outlet of the heat exchanger HEX2 (Figure A2), respectively; the inlet temperature was measured using a k-type thermocouple (405 °C), and the outlet temperature was evaluated with the ε-NTU method [].
As for ICE, the main equations implemented in the model are reported in Table 2; a more detailed description can be found in [].
Table 2.
ICE model equations.
In the above equations, V is the instantaneous cylinder volume and γ is the specific heat ratio as a function of temperature, evaluated through the approach proposed by Krieger and Borman []. , which represents the rate of energy released by the fuel, was obtained using the Wiebe function [], and the heat transfer rate to the walls was evaluated using the Annand correlation [].
The absorption chiller AC was modeled by implementing the energy balance and the refrigeration power as follows (Table 3).
Table 3.
AC model equations.
is the thermal power absorbed by the chiller and is the cooling power dissipated through the evaporative cooling tower. is obtained from the thermal power provided by ICE and the gasification unit.
Finally, biomass electric efficiency, biomass thermal efficiency and biomass ICE thermal efficiency are used to evaluate the overall system performance as reported in Table 4.
Table 4.
CCHP performance evaluation.
Figure 2 describes how all the model equations interact with one another. The gasifier model calculates the syngas properties (Gasifier Box), and uses the composition and thermochemical characteristics of the raw biomass as input. The engine model (Internal Engine Box) determines the electric and thermal power as well as engine efficiency on the basis of syngas properties and flow rates. A comparison of the required and supplied electric power is carried out with a tolerance of 0.1% in order to assess the biomass flow rate. To assess the thermal power to the chiller (Absorption Chiller Box), engine output data are employed. The next step is to calculate the total CCHP system efficiencies, which are specified in Equations (21)–(24).
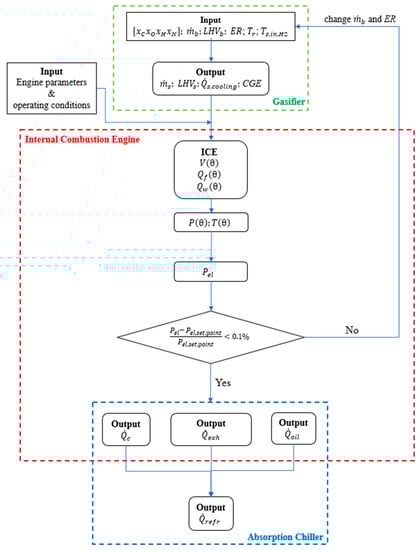
Figure 2.
Numerical model of the working principle of the system [].
2.3. System Operating Strategy
The micro-CCHP energy production is evaluated on an hourly basis by considering partial load operations. A thermal-driven strategy is adopted during the winter and intermediate seasons. This strategy is considered suitable for the selected energy users, which are characterized by thermal loads that are significantly higher than the electric ones. A cooling-driven strategy is considered during the summer.
During winter and intermediate seasons, the thermal request is primarily satisfied by heat provided by the micro-CCHP system, while thermal integration is satisfied by the reversible heat pump. The heat pump operates with the electric surplus produced by the system; if this is not sufficient to cover the thermal demand, electric energy is supplied from the grid. The grid also provides the electric integration when the system is unable to cover the users’ electric demand. On the contrary, the unexploited electric surplus is injected into the grid.
In the summer season, an auxiliary boiler covers the thermal demand, and the AC unit satisfies the cooling demand as long as the production matches the request. In this scenario, the cooling integration is guaranteed by the reversible heat pump, driven by the electric surplus produced by the system, and only if necessary, supported by the grid.
The reversible air–water heat pump was selected for satisfying the energy demands, which cannot otherwise be covered solely by the AC.
2.4. Economic Analysis
Two economic parameters are used for evaluating the feasibility of the biomass-based micro-CCHP system: the net present value (NPV) and the payback period (PBP). The NPV is defined as
where stands for investment, is cash flows at the kth year (the difference between revenues and costs), i is discount rate, and n is investment term. NPV values larger than 0 ensure economic viability; moreover, the bigger the NPV value, the greater the economic gain. The PBP is the period of time during which the initial investment will match the discounted cash flows. The economic benefit increases as the PBP decreases.
PBP is obtained using the following equation:
Table 5 presents the main assumptions for the economic analysis.
Table 5.
Main assumptions for the economic analysis [,,].
2.5. Environmental Analysis
The environmental analysis aims at evaluating the CO2 emissions from syngas and natural gas combustion in the ICE and back-up boiler, respectively.
CO2 emissions from the syngas combustion in the ICE are evaluated by considering the following global reaction of combustion:
A general chemical composition is considered for the syngas, and the coefficients , , and are computed using the syngas chemical composition obtained with the gasification sub-model. The exhaust gas composition is determined by adopting a fuel–air thermodynamic model from the literature [,], and the operating conditions of the ICE as well as the thermophysical properties of the syngas produced by the gasification process are considered. The detailed description of the model can be found in Kirkpatrick [].
CO2 emissions from natural gas combustion in the auxiliary boiler are computed by considering the following global combustion reaction:
The consumption of natural gas, , is evaluated as follows:
where is the auxiliary boiler thermal power, denotes the boiler efficiency (90%), and corresponds to the lower heating value of natural gas (35.9 MJ/Nm3).
The interaction between the developed sub-models for the evaluation of the energy, economic and environmental performance of the system coupled with the reversible heat pump is reported in the flow chart of Figure 3.
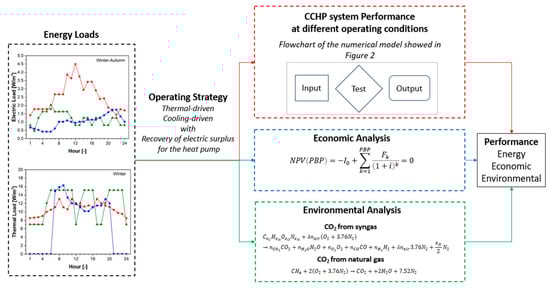
Figure 3.
Flow chart for the evaluation of the energy, economic and environmental performance of the system coupled with a reversible heat pump.
3. Results and Discussion
3.1. Energy Users’ Characteristics: Health Center, Hotel and Residential Building
The energy performance and economic feasibility of the micro-CCHP system are evaluated for three different types of users: a health center, a hotel, and a residential building. The hourly thermal, electric and cooling loads of typical days in winter, spring, summer and autumn are shown in Figure 4 [,,].
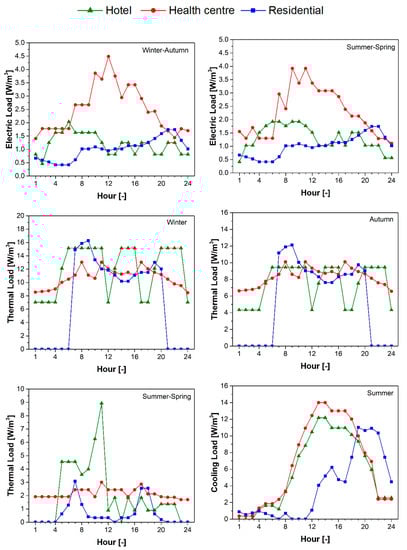
Figure 4.
Daily profiles of electric, thermal and cooling loads of a hotel, a health center and a residential building during a typical day in winter, spring, summer, and autumn [].
In winter, the thermal load includes both the space heating and hot water request, while in summer and in the intermediate seasons, the thermal load is lower due to the presence of only hot water demand. The electrical load shows similar profiles for the all seasons and includes domestic lighting system and appliances. The cooling load includes air conditioning and applies to the summer season. The yearly energy requests for each user are shown in Table 6.
Table 6.
Yearly energy requests of the energy users [].
3.2. Techno-Economic Optimization
A preliminary analysis is required for the coupling between the micro-CCHP system equipped with the reversible heat pump and the energetic users, to evaluate economic viability and energy performance. For this purpose, the multi-objective optimization is used for the evaluation of the optimal volume of the energy users that could be fed by the investigated CCHP system. Three parameters were selected as objectives, the payback period (PBP), the heating (HeatHP) and the cooling (CoolHP) provided by the heat pump when it is driven via the electric surplus. In particular, a shorter PBP improves economic benefits, while high heating and cooling energy provided by the heat pump in the electric-surplus mode improves the energy self-consumption rate of the entire system and decreases the dependence on the natural gas used in back-up boilers.
Figure 5 shows PBP as a function of the volume ranging from 5.000 m3 to 20.000 m3.
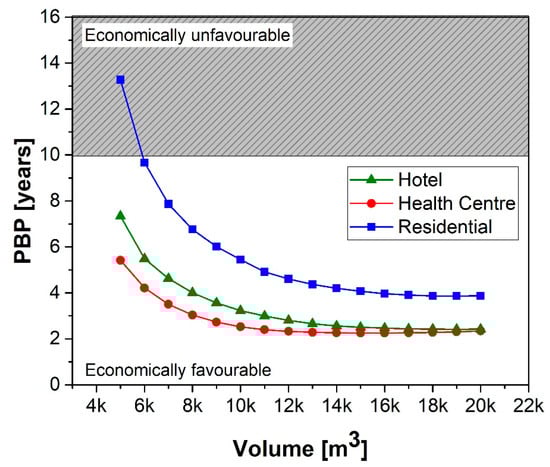
Figure 5.
Influence of the volume of the energy users on PBP.
The economic analysis highlights that PBP decreases with the increase in the volume for all users, since the economic revenue increases due to the avoidance of the production costs of electricity and natural gas. The residential building guarantees cost-effective operations with a payback period that is lower than 10 years for a volume ranging from 6.000 m3 to 20.000 m3, whereas the health center and the hotel show economically favorable operations for the entire range of volumes considered.
The cooling and heating rate provided by the heat pump supplied via the electric surplus are displayed in Figure 6. For low volumes, i.e., low energy demand, no integration from the heat pump is requested as the energy load is completely satisfied by the system. When the volume increases, and hence the energy load, integration from the heat pump is requested, and the electric surplus provided by the system is adequate to drive the heat pump. This integration, however, reaches a maximum, and then decreases. In fact, with the increase in energy demand, heating and cooling provided by solely by the heat pump decreases since the available electric surplus diminishes. In this case, grid integration is necessary for feeding the heat pump. In particular, the maximum value of heating is observed for the residential user, and it is obtained for an optimal volume of about 16.000 m3, whereas the maximum cooling is recorded for the hotel, which corresponds to an optimal volume of 14.000 m3.
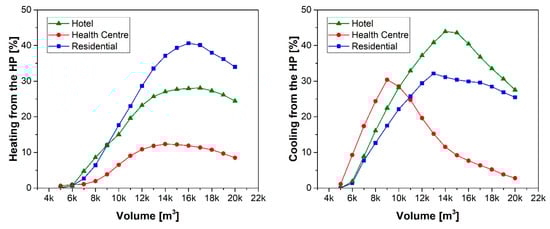
Figure 6.
Cooling and heating rate provided by the heat pump supplied via the electric surplus.
To define the proper value of energy user volume, an optimization criterion is necessary to find a suitable trade-off between energy and economic performance. Here, the “minimum distance” criterion is used. It consists of the evaluation of the minimum distance between the design point belonging to Pareto frontier and the ideal point; this was adopted for volume optimization []. The ideal point is defined by minimum PBP, maximum heating from heat pump (HeatHP), and maximum cooling from heat pump (CoolHP). The user volume is obtained using the minimization of the dimensionless distance of the design points to the ideal point as follows:
where the subscript i corresponds to the generic ith volume of the energetic user that guarantees heating for the heat pump HeatHPi, the cooling from the heat pump CoolHPi, and payback period PBPi. The subscript max and min refer to maximum and minimum of the selected objective functions, respectively. It is important to highlight that for each value of the energy user volume, several elements remain unchanged in the analysis: the energy system (comprising the updraft gasifier, the spark ignition ICE, and the absorption chiller), the energy user, and the operating strategy (thermal-driven strategy for each user on winter and the intermediate seasons, and a cooling-driven strategy for summer).
The dimensionless minimum distance plot versus the volume of the energy users is shown in Figure 7. The proposed criterion suggests the adoption of a volume of 15,000 m3 for the hotel and residential users, and a volume of 11,000 m3 for the health center. For these optimal volumes, the payback period is 2.5 years for the hotel, 2.4 years for the health center, and 4.1 years for the residential building.
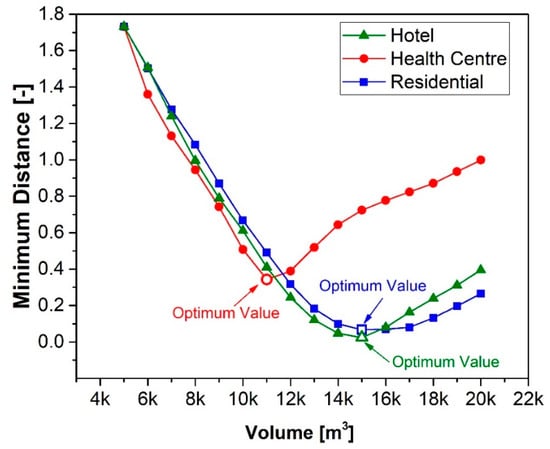
Figure 7.
Dimensionless minimum distance as a function of the volume of the energy users.
3.3. Yearly Energy Performance Evaluation
The energy performance of the micro-CCHP system coupled with the reversible heat pump for the optimal configurations is analyzed in terms of yearly electric and thermal energy flows. Figure 8 shows the yearly thermal balance of the micro-CCHP system for the three energy users. The health center exploits the highest thermal self-consumption rate provided by the gasification-ICE units (82.9%) and the lowest thermal integration by the heat pump driven by the ICE (9.1%). On the contrary, the residential user shows the lowest thermal self-consumption rate (52.4%) and the highest thermal integration from the heat pump driven by the ICE (40.4%).
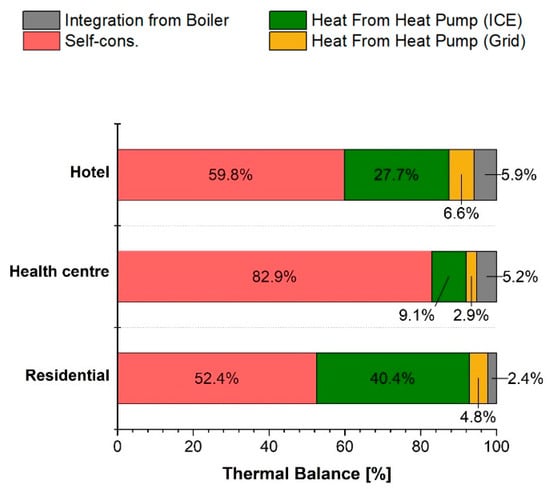
Figure 8.
Thermal balance of the micro-CCHP system for the three energy users.
The electric balance on a yearly basis is displayed in Figure 9. The adoption of the heat pump enhances the electric self-consumption rate. In fact, for the hotel, the self-consumption rate increases from 46.1% (lighting and electrical devices) to 74.7% when the electric surplus is used for heating and cooling via the heat pump. Similarly, the self-consumption rate increases from 66.0% to 75.4% for the health center, and from 45.1% to 81.7% for the residential user.
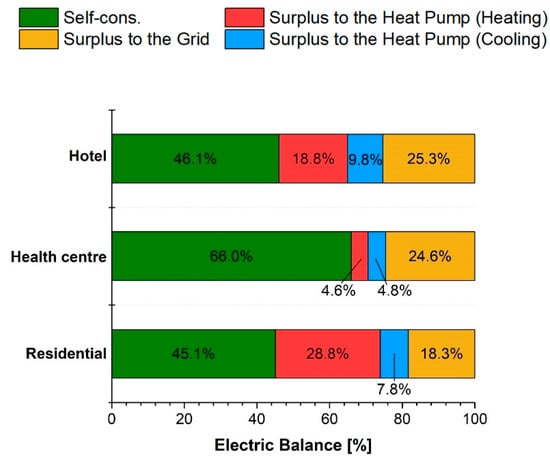
Figure 9.
Electric balance of the micro-CCHP system for the three energy users.
The adoption of the reversible heat pump coupled with ICE improves the energy self-consumption rate of the entire system, especially for the residential user. This effect minimizes the use of a back-up boiler and reduces the electric surplus to the grid, thereby having beneficial environmental impact. This can be seen in Figure 10, which shows the CO2 reduction obtained with the adoption of the heat pump driven via the electric surplus with respect to a micro-CCHP system that shares identical components, energy loads, performance and operating strategies, in the absence of the reversible heat pump for cooling and thermal integrations. In the latter case, thermal integration is provided by a back-up boiler supplied via natural gas, while cooling integration is guaranteed by a conventional compression chiller supplied via electric energy from the grid. The residential user shows the highest CO2 reduction since the operation of the back-up boiler is minimum. On the contrary, the health center, which is characterized by a weak exploitation of the electric surplus for driving the heat pump, shows the lowest CO2 reduction.
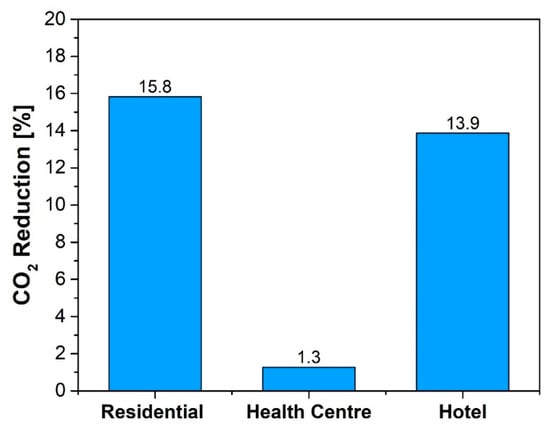
Figure 10.
CO2 reduction obtained by adopting the reversible heat pump for three energy users.
Devices for storing cold, heat and electricity are not indispensable for the energy request and for the optimal volume selected for the users investigated. The thermal-driven strategy adopted during winter, spring and autumn allows to minimize the thermal surplus. This aspect will be better highlighted in the next section, in which an hourly energy balance is presented only for the health center user.
3.4. Hourly Energy Performance for the Health Center
To investigate the behavior of the optimized system in more detail, an hourly energy balance is presented only for the health center user. Figure 11 shows the thermal balance in typical days of the winter, summer and intermediate seasons, Figure 12 shows the electric balance for the four seasons, whereas Figure 13 depicts the cooling balance in summer.
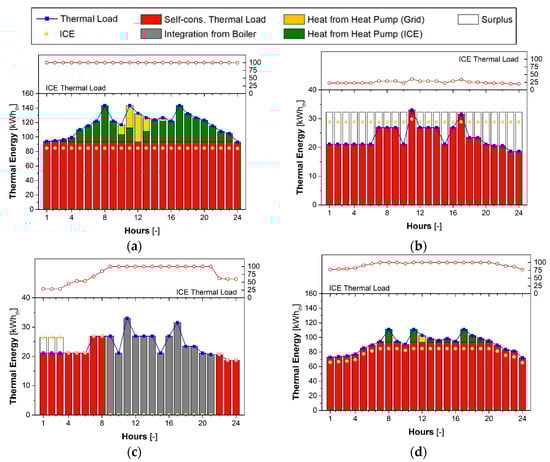
Figure 11.
Hourly thermal balance of the micro-CCHP system in winter (a), spring (b), summer (c) and autumn (d).
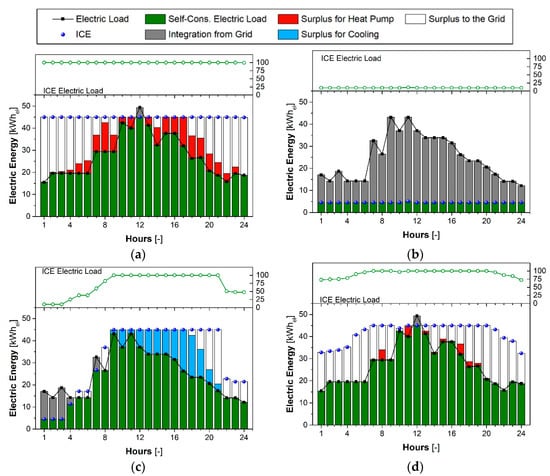
Figure 12.
Hourly electric balance of the micro-CCHP system in winter (a), spring (b), summer (c) and autumn (d).
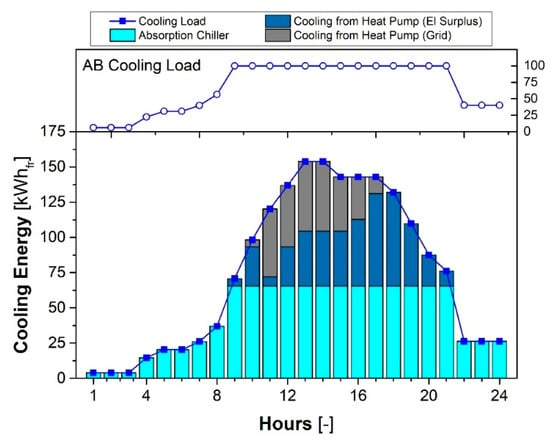
Figure 13.
Hourly cooling balance of the micro-CCHP system in summer.
In winter, the micro-CCHP system works at high-rated operating conditions all day (Figure 11a), owing to the high thermal energy request, satisfying the 96.2% of the daily thermal load. In particular, the thermal power provided by the gasification-ICE units is 79.2%, whereas the heat pump provides 17.0% of power. Even though the micro-CCHP system works at nominal operating conditions, the ICE electric power supplying the heat pump is not sufficient to satisfy completely the thermal request, and a slight thermal integration from the heat pump driven by the grid, amounting to 3.8% is needed. As for the electric request, this is almost completely satisfied by the system and the heat pump is driven by the electric surplus for about 11.8% of the electric production, while part of electric production is fed into the grid (about 27.5%, Figure 12a).
In spring, the micro-CHP system is forced to work close to minimum load (Lel = 10%) due to low thermal demand and a significant amount of heat (about 26.8% of the production) is dumped (Figure 11b). In this ICE operating condition, the electric self-consumption rate is low and equal to 18.2% of the electric load, while the remaining part is taken from the grid (Figure 12b).
In summer, the cooling-driven strategy is adopted. The micro-CCHP system is capable of satisfying the thermal request for 11 h per day, providing 42.0% of the thermal load (Figure 11c). However, from 9:00 am to 9:00 pm, where the cooling request is significant (Figure 13) and the micro-CCHP system is forced to work at nominal operating conditions driving the AC, the thermal load is not satisfied by the system. In this time interval, a thermal integration from the auxiliary boiler amounting to 58.0% is necessary, whereas the AC works at nominal operating conditions, providing a cooling power of 70 kW (Figure 13). Furthermore, the ICE unit supplies the heat pump for 13 h per day. Nevertheless, the micro-CCHP system and the heat pump in electric surplus mode are not capable of satisfying the cooling request. Therefore, the heat pump operation in grid mode for the cooling integration is necessary. The AC and the heat pump in electric surplus mode satisfy 59.7% and 24.8% of the cooling demand, respectively. The electric self-consumption rate amounts to 92.3%, whereas 16.3% of the electric production is used to drive the heat pump for the corresponding cooling production and 12.4% of the electric production is injected into the grid (Figure 12c). A slight electric integration of about 7.7% of the electric demand is necessary.
Finally, in a typical autumn day, the biomass micro-CCHP system covers for the most part the thermal load. In particular, the gasification-ICE unit satisfies 95.8% of the request, whereas the heat pump in electric surplus and in gride modes satisfies the complementary part for the 3.8% and 0.4%, respectively (Figure 11d). Also, the electric demand is almost completely satisfied, and 0.2% of the production is exploited to drive the heat pump. The amount of electricity injected into the grid is 32.3% of the electric production (Figure 12d).
It is worth noting that a thermal energy storage (TES), a cold energy storage (CES) and an electric energy storage (EES) are not necessary for this system adopted for supplying the users investigated. In fact, the thermal-driven strategy used during the winter, spring and autumn allows to minimize the thermal surplus and to maximize the self-consumption rate. The only season in which a moderate thermal surplus that could be stored is spring; however, this quantity cannot be used as no thermal integrations is needed during this season.
The cooling-driven strategy adopted during the summer allows to completely satisfy the demand and avoid a cooling surplus. This result justifies the absence of a CES.
Also, an EES is not essential for this system. Despite the electric surplus being available during the year, it cannot be used when needed as the electricity produced by the engine entirely covers the demand. Only during spring, a substantial amount of electric integration is necessary. However, during this season the electric surplus is not available.
4. Summary and Conclusions
A CCHP plant, based on an ICE fueled with the syngas produced via an updraft gasifier, was modeled at full and partial load and applied to three different energy users in order to perform an energy, economic and environmental analysis. The investigated energy users are a health center, a hotel, and a residential building, which are characterized by different thermal and electric loads.
The following conclusions can be drawn from the performed analysis:
- From a techno-economic optimization of the CCHP system, the optimal volumes, which guarantee the lowest payback period and the highest heating and cooling from the heat pump are 15,000 m3 for both the hotel and residential users, and 11,000 m3 for the health center. By considering the current prices of electricity and natural gas, payback periods of 2.4, 2.5 and 4.1 years were determined for the health center, the hotel and the residential building, respectively;
- By following a thermal-driven strategy for each user on winter and intermediate seasons and a cooling-driven strategy for summer, an energy analysis was conducted; it was found that, on a yearly basis, the health center, which is characterized by a highly uniform thermal load, exploits the CCHP system in the optimal way as it allows for the highest thermal self-consumption rate;
- On the contrary, the residential user, which has a high degree of non-uniformity in the thermal request, shows the lowest thermal self-consumption rate, and consequently, a high electric surplus;
- The adoption of the electric heat pump helps to improve the electric self-consumption rate. In fact, for the health center, the thermal load increases from 82.9% to 92%, while for the residential building, it increases from 52.4% to 92.8%. Therefore, in the latter case, more significant improvements occur (40.4%);
- This advantage of adopting the heat pump directly correlates with CO2 emission reduction; for the residential user, it amounts to 15.8% where heat integration is higher, and for the health center, it amounts to 1.3% when the heat pump thermal integration is the lowest, with respect to the case in which no heat pump is used.
To conclude, the analyzed biomass-based CCHP system, integrated with a heat pump, is characterized by a high percentage of energy self-consumption rate, which lowers the dependence on the electric grid, and saves fossil fuel in the auxiliary boiler. This can help to promote the diffusion of a more decentralized and flexible power generation systems based on renewable sources.
Author Contributions
Conceptualization, D.P., T.C. and P.M.; methodology, D.P. and T.C.; software, D.P.; formal analysis, T.C.; investigation, D.P. and P.M.; data curation, D.P.; writing—original draft preparation, D.P.; writing—review and editing, T.C.; visualization, D.P. and T.C.; supervision, S.B.; project administration, S.B.; funding acquisition, S.B. and F.P. All authors have read and agreed to the published version of the manuscript.
Funding
This research was funded by REGIONE CALABRIA under the framework of the project POR CALABRIA FESR 2014/2020: Wood Gasifier for Trigeneration Plant”, grant number CUP J18C17000590006.
Data Availability Statement
The data presented in this study are available on request from the corresponding author. The data are not publicly available due to industrial confidentiality.
Conflicts of Interest
The authors declare no conflict of interest.
Nomenclature
| CGE | cold gas efficiency [-] |
| cp | specific heat [J/kg K] |
| E | electrical energy [J] |
| ER | equivalence ratio [-] |
| LHV | lower heating value [J/kg] |
| mass flow rate [kg/s] | |
| ni | number of moles |
| p | cylinder pressure [N/m2] |
| P | power [W] |
| Q | thermal energy [J] |
| thermal power [W] | |
| T | temperature [K] |
| V | cylinder displaced volume [m3] |
| xi | species molar fraction [-] |
| yi | species mass fraction [-] |
| Acronyms | |
| AC | absorption chiller |
| CCHP | combined cooling, heating and power |
| CES | cold energy storage |
| CoolHP | cooling from heat pump |
| COP | coefficient of performance |
| DC | dry cooler |
| EES | electric energy storage |
| HeatHP | heating from heat pump |
| HEX | heat exchanger |
| ICE | internal combustion engine |
| PBP | payback period |
| TES | thermal energy storage |
| UG | updraft gasifier |
| Greek symbols | |
| α | air/fuel ratio |
| γ | specific heat ratio [-] |
| η | efficiency [-] |
| θ | crank angle [deg] |
| Subscripts | |
| abs | absorbed |
| b | biomass |
| cool | coolant |
| el | electrical |
| exh | exhaust |
| gas | gasifier |
| in | inlet |
| jh | engine jacket/head |
| out | outlet |
| r | reactor |
| refr | refrigeration |
| s | syngas |
| st | stoichiometric |
| th | thermal |
Appendix A
The gasifier is a counter-flow reactor (updraft), which is fed by the wood chips from the top, while the air is blown from the bottom. The produced syngas is cooled using a heat exchanger, and after passing the gas filter, it enters the engine, whereas the solids are removed from the bottom. The wood/syngas path is displayed in Figure A1.
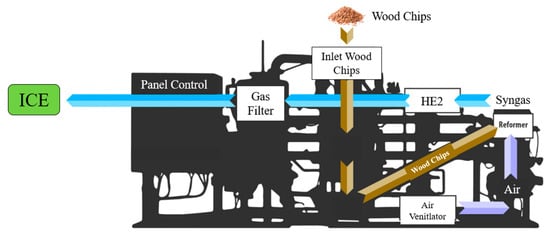
Figure A1.
Layout of the gasification process (adapted from []).
It is well known that the updraft gasifier is characterized by higher tar production due to lower residence time with respect to the downdraft gasifier. However, the analysis carried out on the syngas stream resulted in a very low tar concentration, and no issues were observed in the heat exchanger nor in the engine during the system operation for over 7 years. Furthermore, data sheet provided by the manufacturer [] confirmed that tar concentration is <100 mg/Nm3.
The gasifier performance vary with wood composition; for the investigated case, it is reported in Table A1.
Table A1.
Chemical composition and LHV of biomass.
Table A1.
Chemical composition and LHV of biomass.
| Composition (% in Mass) | Lower Heating Value | ||||
|---|---|---|---|---|---|
| C | H | O | Ash | Moisture | LHV (MJ/kg) |
| 48.0 | 5.8 | 45.2 | 0.4 | 8.5 | 16.8 |
With this wood composition, the gasifier performance are summarized in Table A2.
Table A2.
Updraft gasifier specifications.
Table A2.
Updraft gasifier specifications.
| Wood Consumption | 45 kg/h |
| Syngas composition | |
| CO | 24.9% |
| H2 | 18.5% |
| CH4 | 2.3% |
| CO | 10.0% |
| N2 | 43.8% |
| Lower heating value | 5.7 MJ/kg |
| Mass flow rate | 107.6 kg/h |
| Performance characteristics | |
| Thermal power recovered from syngas cooling | 10.6 kW |
| Cold gas efficiency | 82.6% |
Table A3 provides information on the ICE specifications. At 1500 rpm, the engine produces 45 kWel and 85 kWth of electrical and thermal power, respectively. Heat is recovered from the lubricating fluid, the exhaust gas, and the engine cooling system.
Table A3.
Engine specifications.
Table A3.
Engine specifications.
| 8 Cylinder, V-Type, 4-Stroke, Spark Ignition | |
|---|---|
| Displacement | 5700 cc |
| Rated speed | 1500 rpm |
| Rated electrical power | 45 kW |
| Rated thermal power | 85 kW |
| Electrical efficiency | 26.9% |
| Thermal efficiency | 50.6% |
| Total efficiency | 77.5% |
The gasifier and engine performance, reported in Table A2 and Table A3, respectively, were predicted using the numerical model developed in previous work [].
The absorption chiller (AC) is a single effect lithium bromide–water (LiBr—H2O) type, which requires a thermal power of 100 kW and a refrigeration power of 70 kW at nominal conditions. The temperature of the water entering the chiller ranges from 75 to 95 °C.
Details on heat recovery from the syngas and the engine can be found in []; in this paper, they are reported in Figure A2. Heat is recovered from the engine cooling system through a heat exchanger (HEX1) and from the hot syngas through a water/syngas heat exchanger (HEX2). The plant hot water is used, via a heat exchanger (HEX6), in the absorption chiller (AC), and its flow rate is regulated with a thermo-electric three-way valve (V3) with the aim to control the refrigeration power and to guarantee the maximum efficiency at partial loads. Flow rates from HEX1 and HEX2 are mixed and sent to the thermal load. As for the engine cooling system, the coolant is warmed by the lubricant, engine jacket/heat, and exhaust gas. A three-way valve (V1) controls the coolant flow rate so that a part of it is routed into the heat exchanger (HEX5) within the absorption chiller and some of it is bypassed. Both flow rates are combined at the heat exchanger’s outlet, and then pass via a coolant/water heat exchanger (HEX1) before returning to the ICE cooling circuit. The dry-cooler (DC) is used to entirely discharge the thermal surplus into the environment. Figure A2 also depicts the system’s state points at which plant water flow rates and temperatures were recorded and computed.
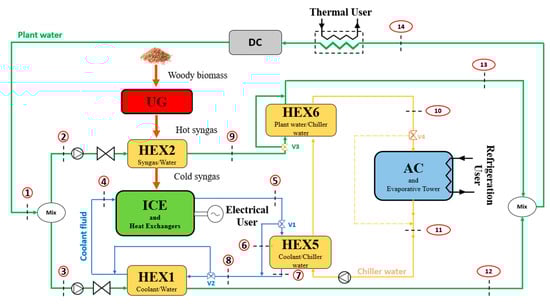
Figure A2.
Thermal layout of the biomass-based CCHP plant [].
References
- Kyoto Protocol to the United Nations Framework Convention on Climate Change. 1998. Available online: https://unfccc.int/resource/docs/convkp/kpeng.pdf (accessed on 14 April 2023).
- Paris Agreement. 2015. Available online: https://sustainabledevelopment.un.org/content/documents/17853paris_agreement.pdf (accessed on 14 April 2023).
- Kalghatgi, G. Is It Really the End of Internal Combustion Engines and Petroleum in Transport? Appl. Energy 2018, 225, 965–974. [Google Scholar] [CrossRef]
- Leach, F.; Kalghatgi, G.; Stone, R.; Miles, P. The scope for improving the efficiency and environmental impact of internal combustion engines. Transp. Eng. 2020, 1, 100005. [Google Scholar] [CrossRef]
- 3EED. Directive 2012/27/EU of the European Parliament and of the Council of 25 October 2012 on Energy Efficiency. Off. J. Eur. Union 2012, 1–56. [Google Scholar] [CrossRef]
- Hamzehkolaei, F.T.; Amjady, N. A techno-economic assessment for replacement of conventional fossil fuel based technologies in animal farms with biogas fueled CHP units. Renew. Energy 2018, 118, 602–614. [Google Scholar] [CrossRef]
- Haydargil, D.; Abuşoğlu, A. A comparative thermoeconomic cost accounting analysis and evaluation of biogas engine-powered cogeneration. Energy 2018, 159, 97–114. [Google Scholar] [CrossRef]
- La Villetta, M.; Costa, M.; Cirillo, D.; Massarotti, N.; Vanoli, L. Performance analysis of a biomass powered micro-cogeneration system based on gasification and syngas conversion in a reciprocating engine. Energy Convers. Manag. 2018, 175, 33–48. [Google Scholar] [CrossRef]
- Falbo, L.; Perrone, D.; Morrone, P.; Algieri, A. Integration of biodiesel internal combustion engines and transcritical organic Rankine cycles for waste-heat recovery in small-scale applications. Int. J. Energy Res. 2022, 46, 5235–5249. [Google Scholar] [CrossRef]
- Paykani, A.; Chehrmonavari, H.; Tsolakis, A.; Alger, T.; Northrop, W.F.; Reitz, R.D. Synthesis gas as a fuel for internal combustion engines in transportation. Prog. Energy Combust. Sci. 2022, 90, 100995. [Google Scholar] [CrossRef]
- Nadaleti, W.C.; Przybyla, G. Emissions and performance of a spark-ignition gas engine generator operating with hydrogen-rich syngas, methane and biogas blends for application in southern Brazilian rice industries. Energy 2018, 154, 38–51. [Google Scholar] [CrossRef]
- Bae, C.; Kin, J. Alternative fuels for internal combustion engines. Proc. Combust. Inst. 2017, 36, 3389–3413. [Google Scholar] [CrossRef]
- Ahrenfeldt, J.; Thomsen, T.P.; Henriksen, U.; Clausen, L.R. Biomass gasification cogeneration—A review of state of the art technology and near future perspectives. Appl. Therm. Eng. 2013, 50, 1407–1417. [Google Scholar] [CrossRef]
- Wiemann, S.; Hegner, R.; Atakan, B.; Schulz, C.; Kaiser, S.A. Combined production of power and syngas in an internal combustion engine–Experiments and simulations in SI and HCCI mode. Fuel 2018, 215, 40–45. [Google Scholar] [CrossRef]
- Costa, M.; La Villetta, M.; Massarotti, N.; Piazzullo, D.; Rocco, V. Numerical analysis of a compression ignition engine powered in the dual-fuel mode with syngas and biodiesel. Energy 2017, 137, 969–979. [Google Scholar] [CrossRef]
- Costa, M.; Rocco, V.; Caputo, C.; Cirillo, D.; Di Blasio, G.; La Villetta, M.; Martoriello, G.; Tuccillo, R. Model based optimization of the control strategy of a gasifier coupled with a spark ignition engine in a biomass powered cogeneration system. Appl. Therm. Eng. 2019, 160, 114083. [Google Scholar] [CrossRef]
- Puig-Arnavat, M.; Bruno, J.C.; Coronas, A. Modeling of trigeneration configurations based on biomass gasification and comparison of performance. Appl. Energy 2014, 114, 845–856. [Google Scholar] [CrossRef]
- Li, C.Y.; Deethayat, T.; Wu, J.Y.; Kiatsiriroat, T.; Wang, R.Z. Simulation and evaluation of a biomass gasification-based combined cooling, heating, and power system integrated with an organic Rankine cycle. Energy 2018, 158, 238–255. [Google Scholar] [CrossRef]
- Li, C.Y.; Wu, J.Y.; Chavasint, C.; Sampattagul, S.; Kiatsiriroat, T.; Wang, R.Z. Multi-criteria optimization for a biomass gasification-integrated combined cooling, heating, and power system based on life-cycle assessment. Energy Convers. Manag. 2018, 178, 383–399. [Google Scholar] [CrossRef]
- Wang, J.J.; Yang, K.; Xu, Z.L.; Fu, C. Energy and exergy analyses of an integrated CCHP system with biomass air gasification. Appl. Energy 2015, 142, 317–327. [Google Scholar] [CrossRef]
- Caligiuri, C.; Renzi, M.; Antolini, D.; Patuzzi, F.; Baratieri, M. Diesel fuel substitution using forestry biomass producer gas: Effects of dual fuel combustion on performance and emissions of a micro-CHP system. J. Energy Inst. 2021, 98, 334–345. [Google Scholar] [CrossRef]
- Li, C.Y.; Shen, Y.; Wu, J.Y.; Dai, Y.J.; Wang, C.H. Experimental and modeling investigation of an integrated biomass gasifier–engine–generator system for power generation and waste heat recovery. Energy Convers. Manag. 2019, 199, 112023. [Google Scholar] [CrossRef]
- Perrone, D.; Castiglione, T.; Morrone, P.; Pantano, F.; Bova, S. Numerical and Experimental Assessment of a Micro-Combined Cooling Heat and Power (Cchp) System Based on Biomass Gasification. Appl. Therma Eng. 2022, 219, 119600. [Google Scholar] [CrossRef]
- Cengel, Y.A. Heat Transfer: A Practical Approach, 2nd ed.; McGraw-Hill: New York, NY, USA, 2002. [Google Scholar]
- Klein, M. A Specific Heat Ratio Model and Compression Ratio Estimation. Ph.D. Thesis, Department of Electrical Engineering, Linkoping University, Linköping, Sweden, 2004. [Google Scholar]
- Heywood, J.B. Internal Combustion Engine Fundamentals, 2nd ed.; Mc-Graw Hill Education: New York, NY, USA, 2018. [Google Scholar]
- Wegener, M.; Malmquist, A.; Isalgue, A.; Martin, A.; Arranz, P.; Camara, O.; Velo, E. A techno-economic optimization model of a biomass-based CCHP/heat pump system under evolving climate conditions. Energy Convers. Manag. 2020, 223, 113256. [Google Scholar] [CrossRef]
- Perrone, D.; Algieri, A.; Morrone, P.; Castiglione, T. Energy and economic investigation of a biodiesel-fired engine for micro-scale cogeneration. Energies 2021, 14, 496. [Google Scholar] [CrossRef]
- Prezzi dei Combustibili Legnosi. 2022. Available online: https://www.aielenergia.it/public/pubblicazioni/209_M_P_1-2022ia_2.pdf (accessed on 28 April 2023).
- Kirkpatrick, A.T. Internal Combustion Engines: Applied Thermosciences, 4th ed.; Wiley: Hoboken, NJ, USA, 2020. [Google Scholar]
- Muccillo, M.; Gimelli, A. Experimental development, 1D CFD simulation and energetic analysis of a 15 kw micro-CHP unit based on reciprocating internal combustion engine. Appl. Therm. Eng. 2014, 71, 760–770. [Google Scholar] [CrossRef]
- Gimelli, A.; Muccillo, M. Optimization criteria for cogeneration systems: Multi-objective approach and application in an hospital facility. Appl. Energy 2013, 104, 910–923. [Google Scholar] [CrossRef]
- Morrone, P.; Amelio, M.; Algieri, A.; Perrone, D. Hybrid biomass and natural gas combined cycles: Energy analysis and comparison between different plant configurations. Energy Convers. Manag. 2022, 267, 115874. [Google Scholar] [CrossRef]
- SpannerRe2. Available online: https://www.holz-kraft.com/it/ (accessed on 5 July 2023).
Disclaimer/Publisher’s Note: The statements, opinions and data contained in all publications are solely those of the individual author(s) and contributor(s) and not of MDPI and/or the editor(s). MDPI and/or the editor(s) disclaim responsibility for any injury to people or property resulting from any ideas, methods, instructions or products referred to in the content. |
© 2023 by the authors. Licensee MDPI, Basel, Switzerland. This article is an open access article distributed under the terms and conditions of the Creative Commons Attribution (CC BY) license (https://creativecommons.org/licenses/by/4.0/).