Article

Numerical Analysis of Oil Lubrication and Cooling of Roller Thrust Bearing in High-Performance Mixed-Flow Pump

1
Centre of Hydraulic Research, Jana Sigmunda 313, 78349 Lutin, Czech Republic
2
SIGMA Research and Development Institute, Jana Sigmunda 313, 78349 Lutin, Czech Republic
*
Author to whom correspondence should be addressed.
Energies 2023, 16(19), 6890; https://doi.org/10.3390/en16196890
Submission received: 24 August 2023 / Revised: 26 September 2023 / Accepted: 27 September 2023 / Published: 29 September 2023
(This article belongs to the Section H: Geo-Energy)

Abstract

:
This article deals with the numerical simulation of an oil–air multiphase flow inside the thrust bearing of a high-performance mixed-flow pump, including both the lubrication effects and the cooling of the oil by the water-cooling system based on spiral piping. The bearing is lubricated by the oil bath method with partially submersed rollers. Very complex full 3D geometry is modelled in all details, but for modelling purposes, the impacts of some model simplifications on the results are tested. The comprehensive CFD analysis is based on fully transient simulations, taking into account the different rotational speeds and different coordinate systems of all rotating components. The oil distribution on the bearing ring and roller walls as well as the oil temperature are discussed in detail. The results demonstrate that the designed cooling system is efficient in keeping the bearing and oil temperatures at safe values to guarantee bearing rating life even at extreme climatic conditions. The simulations present a comprehensive way of solving complex problems of the bearing and its cooling system applicable to engineering practice. The results of the simulations indicate also that the complexity of the computational domain and bearing clearances have a significant impact on the obtained results.

1. Introduction

Thrust bearings are widely used in many engineering applications, when the significant axial forces acting on a rotor shaft have to be caught. The position of the rotor shaft is usually the horizontal or vertical one, though inclined positions are also possible. The position of the shaft and the bearing influences dramatically the two most important features of the bearing performance: the lubrication and cooling, which are the key factors for the bearing rating life and efficiency. There are a lot of studies concerning the ball or roller bearings, which could be related to this study. Wu, W., Hu, J. et al. [1,2,3,4,5] studied extensively the air–oil two-phase flow inside the oil jet-lubricated ball bearing both experimentally and by the numerical simulations. They investigated the air–oil distribution inside the bearing and found its correlation with the heat transfer and temperature distribution. They also considered the influence of the rotational speed and multiple-nozzle configuration on the oil volume fraction distribution. The heat transfer inside the ball bearing with one nozzle inlet was also investigated at high rotational speeds by Yan et al. [6]. The authors primarily focused on the influence of cage parameters, such as the pocket’s shape, methods of guiding and clearances. Ma et al. [7] studied the flow and heat balance of the high-speed ball bearing under the oil–air lubrication with a focus on the formation of an oil film in the oil pipe nozzle. Their CFD results were verified by temperature measurements in the test bearing. An interesting study of the effect of nozzle oil supply on the sound field characteristics of full ceramic ball bearings can be found in [8], yet the individual rotation of the rolling balls is not considered.
Typically, the numerical simulations include all the 3D geometry of the bearing so as to capture the oil supply position. In special cases, some simplifications using the periodicity boundary conditions can be used, as shown in [9], where the oil–air ratio is set to a constant empirical value, and so only one rotational periodicity segment of the bearing is modelled. Also, in [10], where the flow in the oil nozzle and the space bounded by the cage and the inner race are considered, the flow is solved as a periodic one based on the physical spacing of the oil supply holes. Peterson et al. [11] studied numerically the fluid drag losses in the deep groove ball bearing and in the radial needle roller bearing and compared them with experimental data. For their calculations, they used one angular segment of the bearing with three rolling elements.
Lubrication of the radial needle roller bearing with an inner oil supply nozzle is studied in [12], with the full 3D geometry model. A comprehensive study of the oil–air two-phase flow inside the cylindrical roller bearing with one or two inner nozzles comes from Gao et al. [13,14], who studied the oil distribution and drag and churning losses inside a high-speed cylindrical roller bearing. Concerning the individual rotation of the rolling cylinders, it was not considered for a real 3D model of the bearing, but its effect was verified by an in-line configuration representing the straight box with several cylinders and using the periodic boundary conditions. Self-rotation of the rollers was ignored also in the study of flow and thermal phenomena inside a cylindrical roller bearing with one inner nozzle [15]. Zhu et al. [16] investigated experimentally and numerically the two-phase flow in two-row tapered roller bearings with the inner as well as the outer ring rib structure under the condition of loss of lubrication. They found that the two-row tapered roller bearings with the outer ring rib structure give better lubrication conditions. A special approach was used in the work of Feldermann et al. [17], where the hydraulic losses in the radial cylindrical roller bearing were calculated with a hybrid computational scheme. The results from a course grid full 3D model were mapped to a less expensive single bearing chamber (domain between two adjacent rolling elements), which enabled them to describe the flow field in detail.
The numerical simulations contained in the references mentioned above commonly use the VOF (Volume of Fluid) model of the multiphase flow [18]. This model is very robust and easy to implement, but in reality, it solves only the equation for the volume fraction of the liquid component and does not consider the formation of the liquid particles, their interaction and the formation of the continuous film. An advanced study of the oil–gas mixture can be found in [19], where the movement of the oil droplets and formation of the oil film is examined in the chamber behind the roller bearing.
As already stated, there are a lot of studies concerning the ball or roller bearings, which could be related to this study. Still, most of them are of the oil jet-lubricated ones and there is a lack of studies concerning the oil bath-lubricated bearings. There, some new phenomena should be addressed, e.g., splash effects [20,21,22,23] similar to the gearboxes, or pumping effects of the bearing. Both of these phenomena are significantly influenced by the oil level in the oil chamber and both are highly important for correct lubricating and cooling of the bearing. Liebrecht et al. [24] studied experimentally and numerically the performance and the drag and churning losses inside the tapered roller bearing with a vertically oriented shaft at two different oil bath levels and they founded that the oil level affects the drag and churning losses significantly, especially at high rotational speeds. A comprehensive study of a multiphase flow inside the fully submerged tapered roller bearing with a vertically oriented shaft was done by Maccioni et al. [25,26]. They used the Hirt aeration model [27] inside the OpenFOAM CFD code to make the numerical simulations and applied a special sapphire bearing outer ring and fluorescent polystyrene particles inside the test rig to monitor in detail the pumping effects by means of PIV.
Some more references that could be related to this study can be added here. Two of them, [28,29], are devoted to the improvement of the computational methodology focused on the lubricated mechanical components including the rolling bearings and on the optimum meshing strategies. The other references are devoted to the journal bearings [30,31,32,33,34] and the fluid film thrust bearings [35,36,37,38]. Though these bearings are out of the scope of the previous detailed description of literary sources, they share a similar methodology when modelling the lubrication and cooling processes.
The aim of this study is to model numerically the flow and thermal phenomena inside the thrust bearing housing of the high-performance mixed-flow pump under extreme climatic conditions, including both the lubrication effects and the cooling of the oil by the water-cooling system based on the spiral piping. To verify the numerical simulation, temperatures measured in the housing could be compared with the calculated values, but, because of a lack of input power at the test rig, data only for the reduced speed and heat production are available. A brief description of the tapered roller thrust bearing and the entire housing is presented in the next section, followed by a description of the physical models and numerical tools used. The results of simulations are presented in detail in the last section, including the comprehensive graphical work. In Discussion, the results are summarized with some conclusions based on the presented facts.

2. Case and Material Description

In this study, the CFD analysis of fluid flow and heat transfer inside the thrust bearing housing of the vertical mixed-flow pump is presented. The bearing housing is installed on the top of the pump (Figure 1), over the welded 90° elbow. There are two bearings inside the whole assembly shown in Figure 2. The upper one is the support double-row spherical roller bearing, which is lubricated with the oil from the upper side; this bearing is not an object of this study. The lower bearing is the single-row spherical roller one and not only treats the axial loads, but also has a radial load capacity. It is lubricated using the oil bath system. This bearing and its chamber are the main objects of this study. The bearing housing is equipped with a cooling system based on the spiral piping, inside which the pressurized cold water circulates. In the sectional view, the spiral piping forms a scheme of 5 × 3 pipes (radial × axial directions). The inner diameter of the spiral piping is 15 mm.
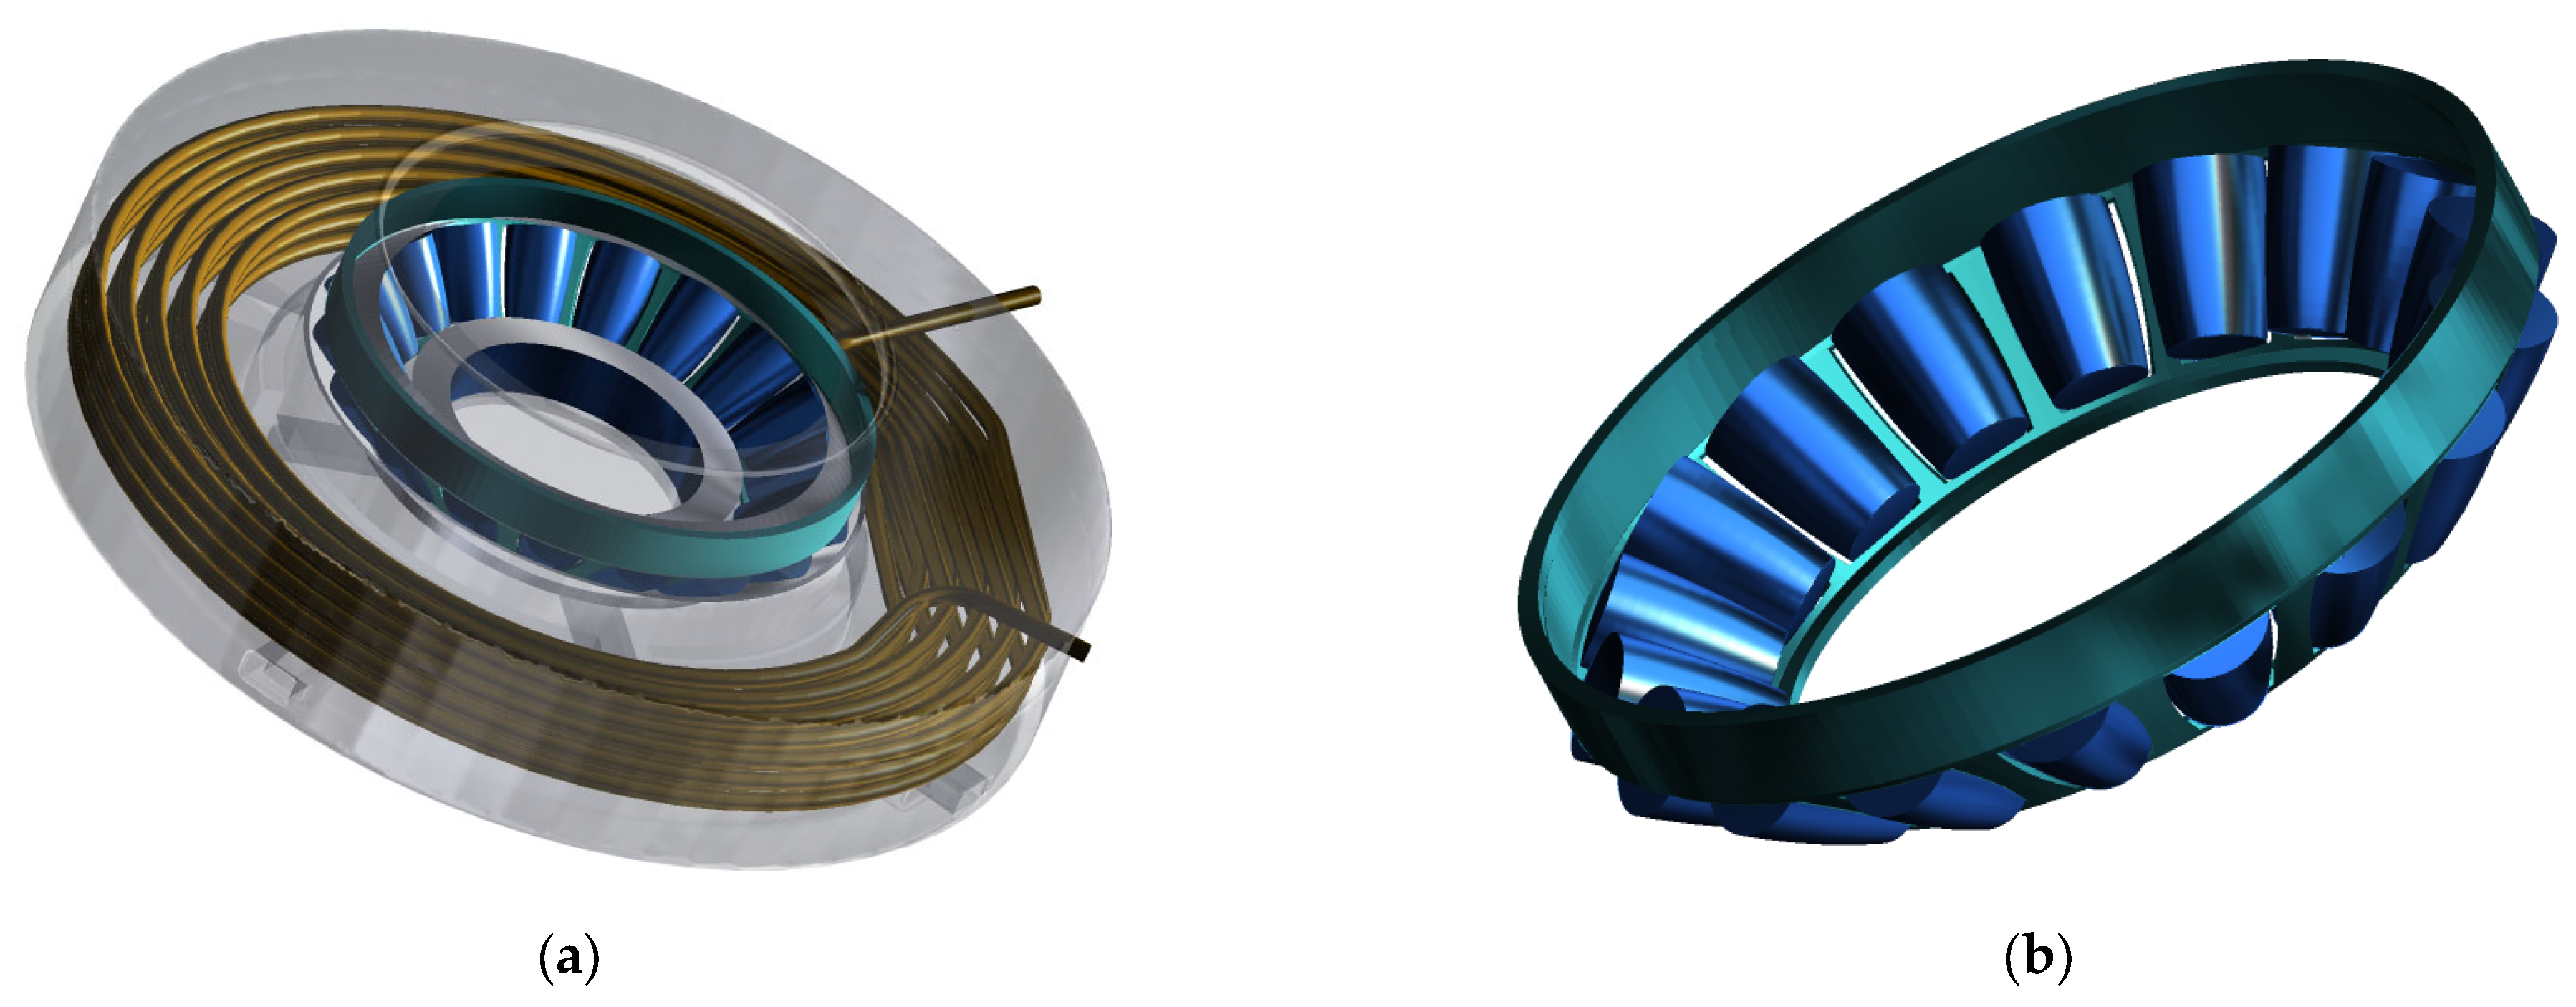
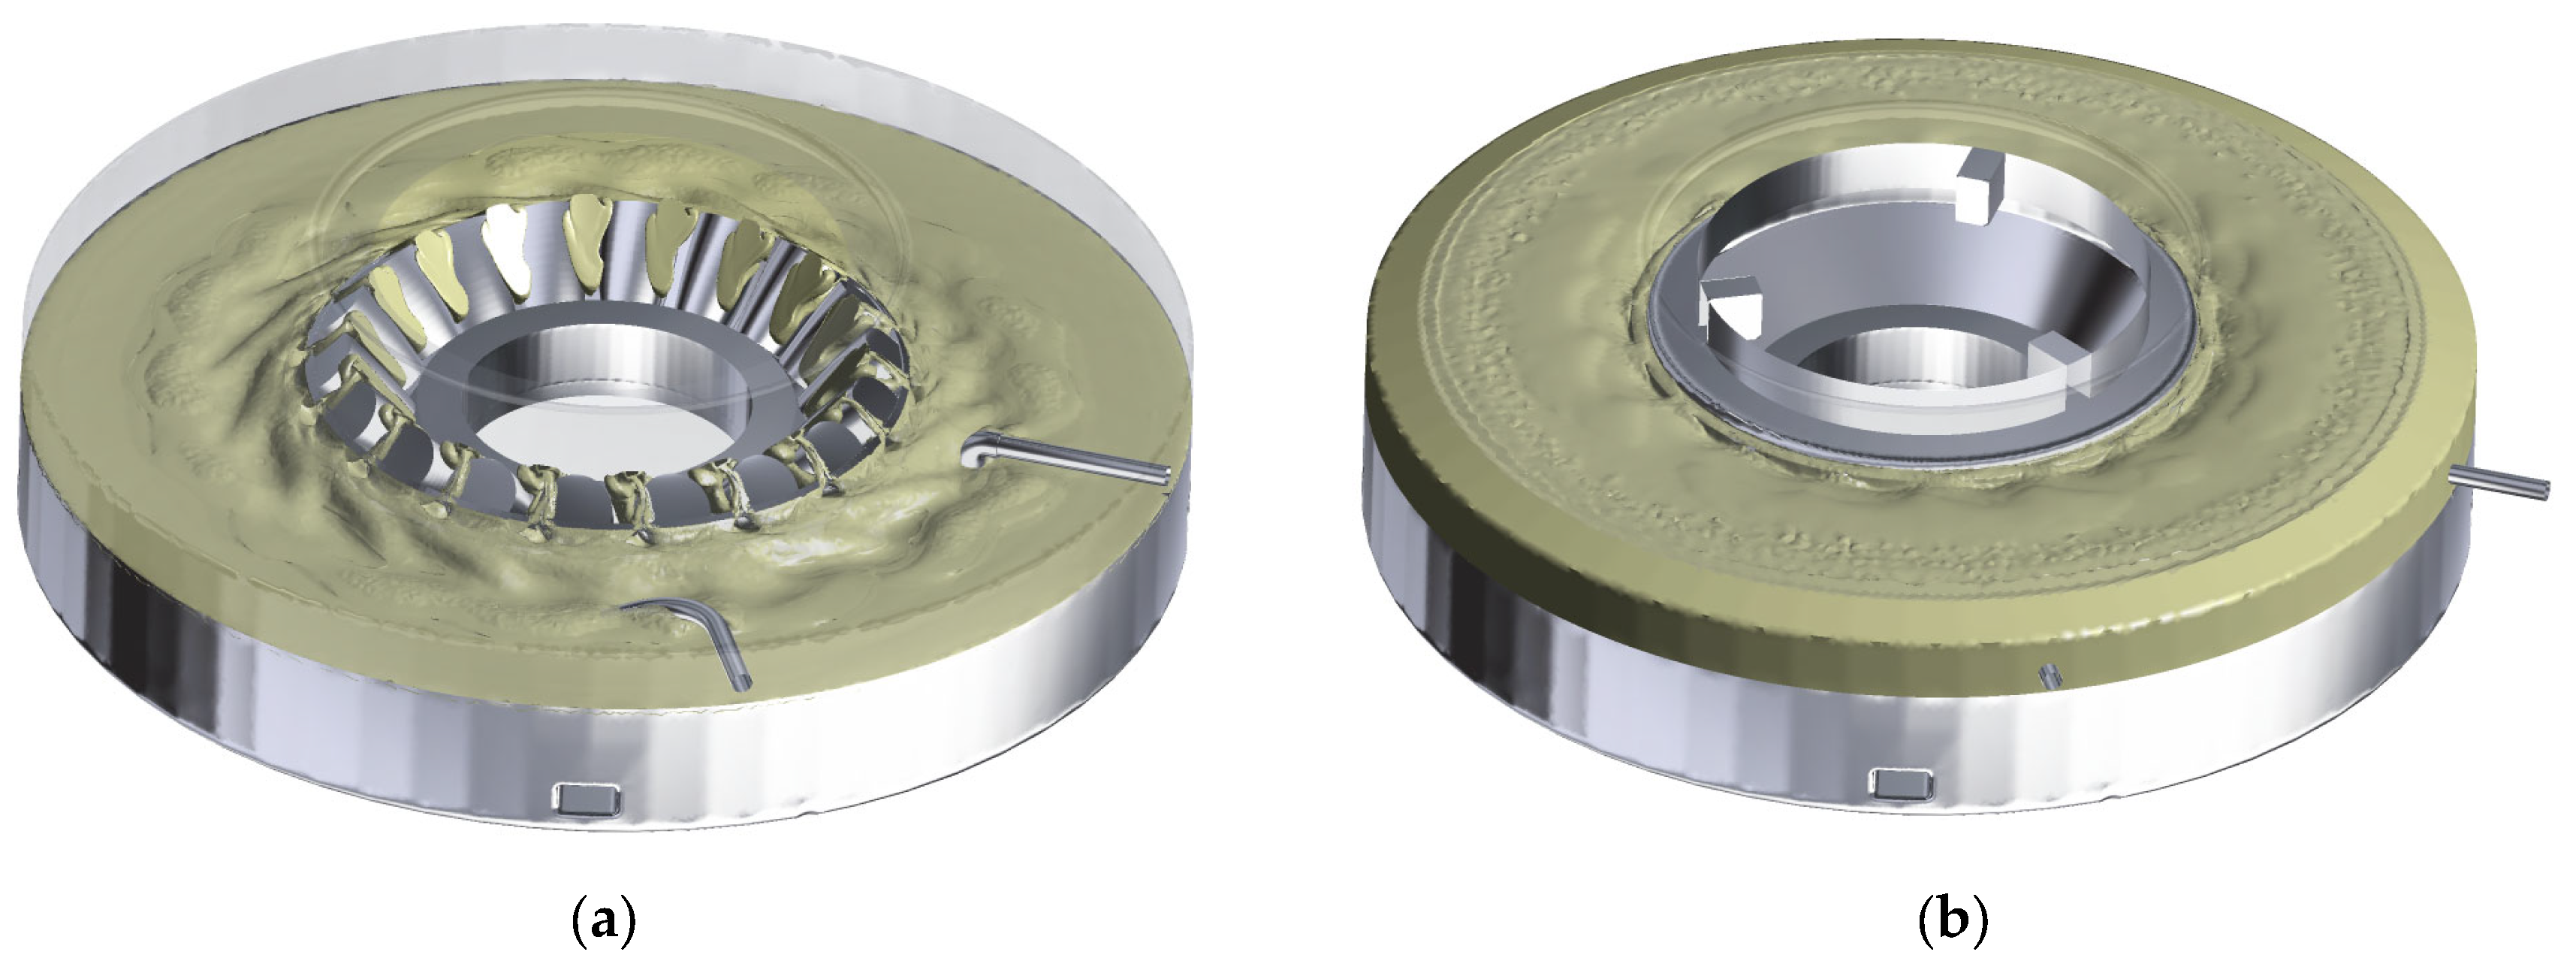
The geometry of the computational domain is derived from 2D drawings and a full 3D model created in the SOLIDWORKS 2022 3D CAD system. Because of the reasonable computational demands, the geometry has been a little bit simplified (mainly bolts, nuts, weld joints and unnecessary small piping have been removed). Still, the computational domain keeps full 3D shapes of hydraulic surfaces, without any simplifications by symmetry planes or periodic conditions. Figure 3 shows the computational model of the thrust bearing housing including four channels, which lead the oil from the chamber to the bottom part of bearing (Figure 3b). Also, all necessary details of the cooling spiral have been preserved for the credible analysis (Figure 4). Because of meshing strategies and the computational model, some simplifications of the bearing geometry had to be done, especially concerning the roller geometry and clearances between rollers and races. These simplifications will be described in more detail within the following paragraphs.
The parameters of the bearing are listed in Table 1. The bearing represents a slight modification of the industrial SKF 29460E (SKF Lubrication Systems CZ, Chodov, Czech Republic) thrust bearing, but, as already said, some simplifications of the bearing geometry had to be made. Consequently, the impacts of different model simplifications on the results have been tested. In the first stage, the roller guide cage was not considered in the simulation, and the gap between rollers and races was increased to 0.9 mm. During the subsequent steps, the cage geometry was added and the gap between rollers and races was decreased to 0.34 mm. All rollers are centered in the cage pocket and in the middle of the races. Concerning the rotary speeds of the rollers and of the cage [39], they changed only slightly according to the geometry modifications, so at the end, reference speeds obtained from the frequency data provided by the original bearing manufacturer were used, according to Table 1. Differences between experimental and all theoretical values of the rotary speeds still remained below 5%.
Four materials were considered: three fluids (oil and air inside the housing, water inside the cooling pipe) and one solid material (stainless steel, representing the wall of the cooling pipe). The physical properties of water are described by the IAPWS industrial formulation IF-97 [40], and the air is treated as the ideal gas. Because of unsatisfactory knowledge of the oil’s thermodynamic state, it is described as the constant property liquid with reference values at the temperature of 40 °C [41]. The physical properties of the oil, OL-J46/ISO VG 46 (PARAMO, a.s., Pardubice, Czech Republic) and the stainless steel, 1.4541/AISI 321 (BODEN-MATTE, s.r.o., Vsetin, Czech Republic) are described in Table 2. It must be mentioned that only single values of the density, specific heat capacity and thermal conductivity are used in the oil description. According to the producer, these quantities vary in the required temperature range by 10% maximum. On the other hand, the kinematic viscosity changes considerably. So, in the simulations, the oil density, specific heat capacity and thermal conductivity are considered to be constant in the full range of temperatures. For the oil viscosity, the viscosity index and viscosity values for the temperatures 60 °C and 80 °C have been used to create a simple expression describing the changes of oil viscosity in the required range of simulation temperatures (Figure 5).

3. Numerical Methods

The ANSYS CFX, 2020R2 software package [42] was applied to solve the transport equations, including the gravity and thermal effect. The calculation is based on the Reynolds-averaged Navier–Stokes equations (RANSs). Because of the relatively small (subsonic) velocities inside the oil, the effects of oil compressibility could be omitted. The flow is considered to be fully unsteady. Generally, for unsteady flows, the governing equations (URANS) can be expressed as
U i x i = 0 , ρ U i t + ( ρ U i U j ) x j = P x i + x j μ + μ t U i x j + U j x i + S M , i ,
where Ui are Reynolds-averaged velocity components in the 3D Cartesian coordinate system, P is the Reynolds-averaged static pressure, ρ is the fluid density, μ is the dynamic viscosity, μt is the turbulent viscosity derived from the turbulence model and SM is the general momentum source term.
The SST turbulence model, which combines advantages of both the high- and the low-Reynolds-number turbulence models, has been applied. It links the formulation of the standard k-ε and k-ω models using two blending functions (F1 and F2) dependent on the wall distance. The following governing equations can be applied:
ρ k t + ( ρ U j k ) x j = x j μ + μ t σ k 3 k x j + P k   β * ρ k ω , ρ ω t + ( ρ U j ω ) x j = x j μ + μ t σ ω 3 ω x j + γ ρ μ t P k   β 3 ρ ω 2 + 1 F 1 2 ρ σ ω 2 ω   k x j   ω x j ,
where
P k = μ t U i x j + U j x i U i x j  
is the turbulence production term, k is the turbulent kinetic energy and ω is the turbulent frequency. In this formulation, the turbulent viscosity is defined in the following way:
μ t = ρ a 1 k m a x ( a 1 ω , S F 2 ) ,
where S is the strain rate. More details of Menter’s SST model, including the definition and discussion of the blending functions and all used constants (a, β, σ, γ), can be found in [42,43,44]. To cover a wide range of the non-dimensional wall-adjacent grid height y+ during an unsteady flow, an automatic wall treatment has been applied.
The conservation equation of temperature for the mixture phase is based on the mixture total energy conservation equation.
ρ H t + ( ρ U j H ) x j = P t + x j λ T x j + x j τ j i U i + S E ,   τ i j = μ + μ t U i x j + U j x i 2 3 U r x r δ i j ,   τ i j = μ + μ t U i x j + U j x i 2 3 U r x r δ i j ,
where H is the total enthalpy, λ is the thermal conductivity, T is the temperature and SE is the general heat source term. τij is the viscous stress tensor.
The numerical solution of free-surface flow inside the housing was carried out by means of the Volume of Fluid (VOF) method based on the monitoring of the volume fraction of both fluids (oil and air). Buoyancy parameters are related to the density difference and the standard gravity constant. The non-homogenous multiphase model was used for the velocity fields, with different velocity components for the oil and air fractions. The high-resolution scheme of the second order was used for the momentum equations and the first-order scheme was used for the turbulence numerics.
Inside the computational domain, there are both the stationary parts and the parts rotating with different rotational speeds. The Multiple Frame of Reference (MFR) capability and the fully unsteady model of flow with moving meshes have been used to capture the interactions between stationary parts and the rotating components. In principle, the computational domain has four subdomains: the bearing itself, the bearing housing, the steel part of the cooling spiral and, finally, the water inside the cooling spiral. All subdomains except the bearing are defined as the stationary ones. The bearing is defined as a rotating domain that rotates around the main axis with the rotary speed of the cage. The inner ring is therefore considered to be a rotating wall that rotates against the cage and set of rollers with a positive rotary speed of 276 rpm. On the other hand, the outer ring must be defined as the counter-rotating wall. Every roller has its individual axis of rotation inside the bearing domain and rotates around this axis with the rotary speed of 1558 rpm. The simulation is fully unsteady and the time discretization is based on the second-order backward Euler scheme. The timestep represents the revolution of the cage by 1°. The root mean square residuals are set to be less than 10−5, but the maximum number of inner iterations per one timestep is limited to 10.
All hydraulic surfaces are considered to be smooth, without prescribed roughness. Boundary conditions are specified as follows: At the cooling pipe inlet, the normal velocity, turbulent kinetic energy and its dissipation rate have been set according to the prescribed mass flow rate, the estimated turbulence intensity of 5% and the eddy length scale of 1 mm. At the outlet (end of the pipe), the pressure outlet boundary condition has been set. Because extreme climatic conditions have been considered for the test case, water with the temperature 35 °C is supplied at the spiral inlet from the pump discharge with the available pressure difference representing the pump discharge head of 30 m. As there are some pressure losses in the external part of the cooling pipes, the water mass flow rate is set to 0.56 kg/s, which corresponds to the pressure loss difference, representing 26.3 m of water column. Because the temperature of the air in the pump station building can reach up to 45 °C, there would be only a minimum temperature gradient, and so the housing walls have been treated as the adiabatic ones. Just on the roller and race walls, the overall heat flux of 5000 W has been equally prescribed, representing estimated mechanical losses in the bearing. Additional hydraulic losses are generated naturally by the calculated flow phenomena and viscous forces and are the object of the CFD simulation.
With all these settings, the flow inside the computational domain is fully turbulent, with the Reynolds number about 6.6 × 10⁴ in the cooling spiral and in the range from 1 × 10⁵ to 7 × 10⁵ in the bearing and its housing.
The hybrid multiblock computational grids were created in the ANSYS ICEM, 2020R2 software tool and represent approximately 70–90 million nodes. These grids were created in order to be isotropic enough, as required by the advanced turbulence model used for the simulations, but they also should fulfill the rules for sufficiently low values of y+ at the solid walls. In fact, no typical grid dependence study has been done, because the topology and quality of the grid are much more important in these simulations than the simple number of grid points. The main differences in the topology are due to the presence of the cage, but from the point of view of the mesh quality, the treatment of the rounded parts close to the rollers and races is the most critical task to be handled. So, parameters like the aspect ratio and skewness have been preferred, and the meshes are limited in their size just by the request to be able to work within the computer operating memory of 1 TB. Figure 6 shows details of the computational grid of the roller and on the bearing housing, whereas Figure 7 shows the grid structure around the roller, between the inner and outer races. To generate the prismatic elements in the location of radial clearance, the pre-inflation method was used, forming the prismatic elements first and then adding the tetrahedral elements in the remaining space. With the gap between rollers and races decreased to 0.34 mm, the distance of the first grid points from the wall is about 7.5 μm. With the decreasing width of the gap between rollers and races, the size of the computational grid dramatically increases, because both the pre-inflation method and the post-inflation method (prisms are formed from the already existing tetrahedral grid) require a sufficiently small global element size to be able to create the double-prismatic layer mesh inside the gap. This means that the size of the elements in the whole bearing must be very small. From this point of view, the gap size of 0.34 mm appeared to be limiting for the computer memory.

4. Results

The focus of this paper is on the flow phenomena inside the bearing itself as well as inside the bearing housing, sufficient lubrication conditions and the heat transfer resulting in temperature changes inside the whole assembly. Of course, some other important features have been considered, e.g., the hydraulic losses or the efficiency of the cooling system.

4.1. Roller Kinematics and Lubrication

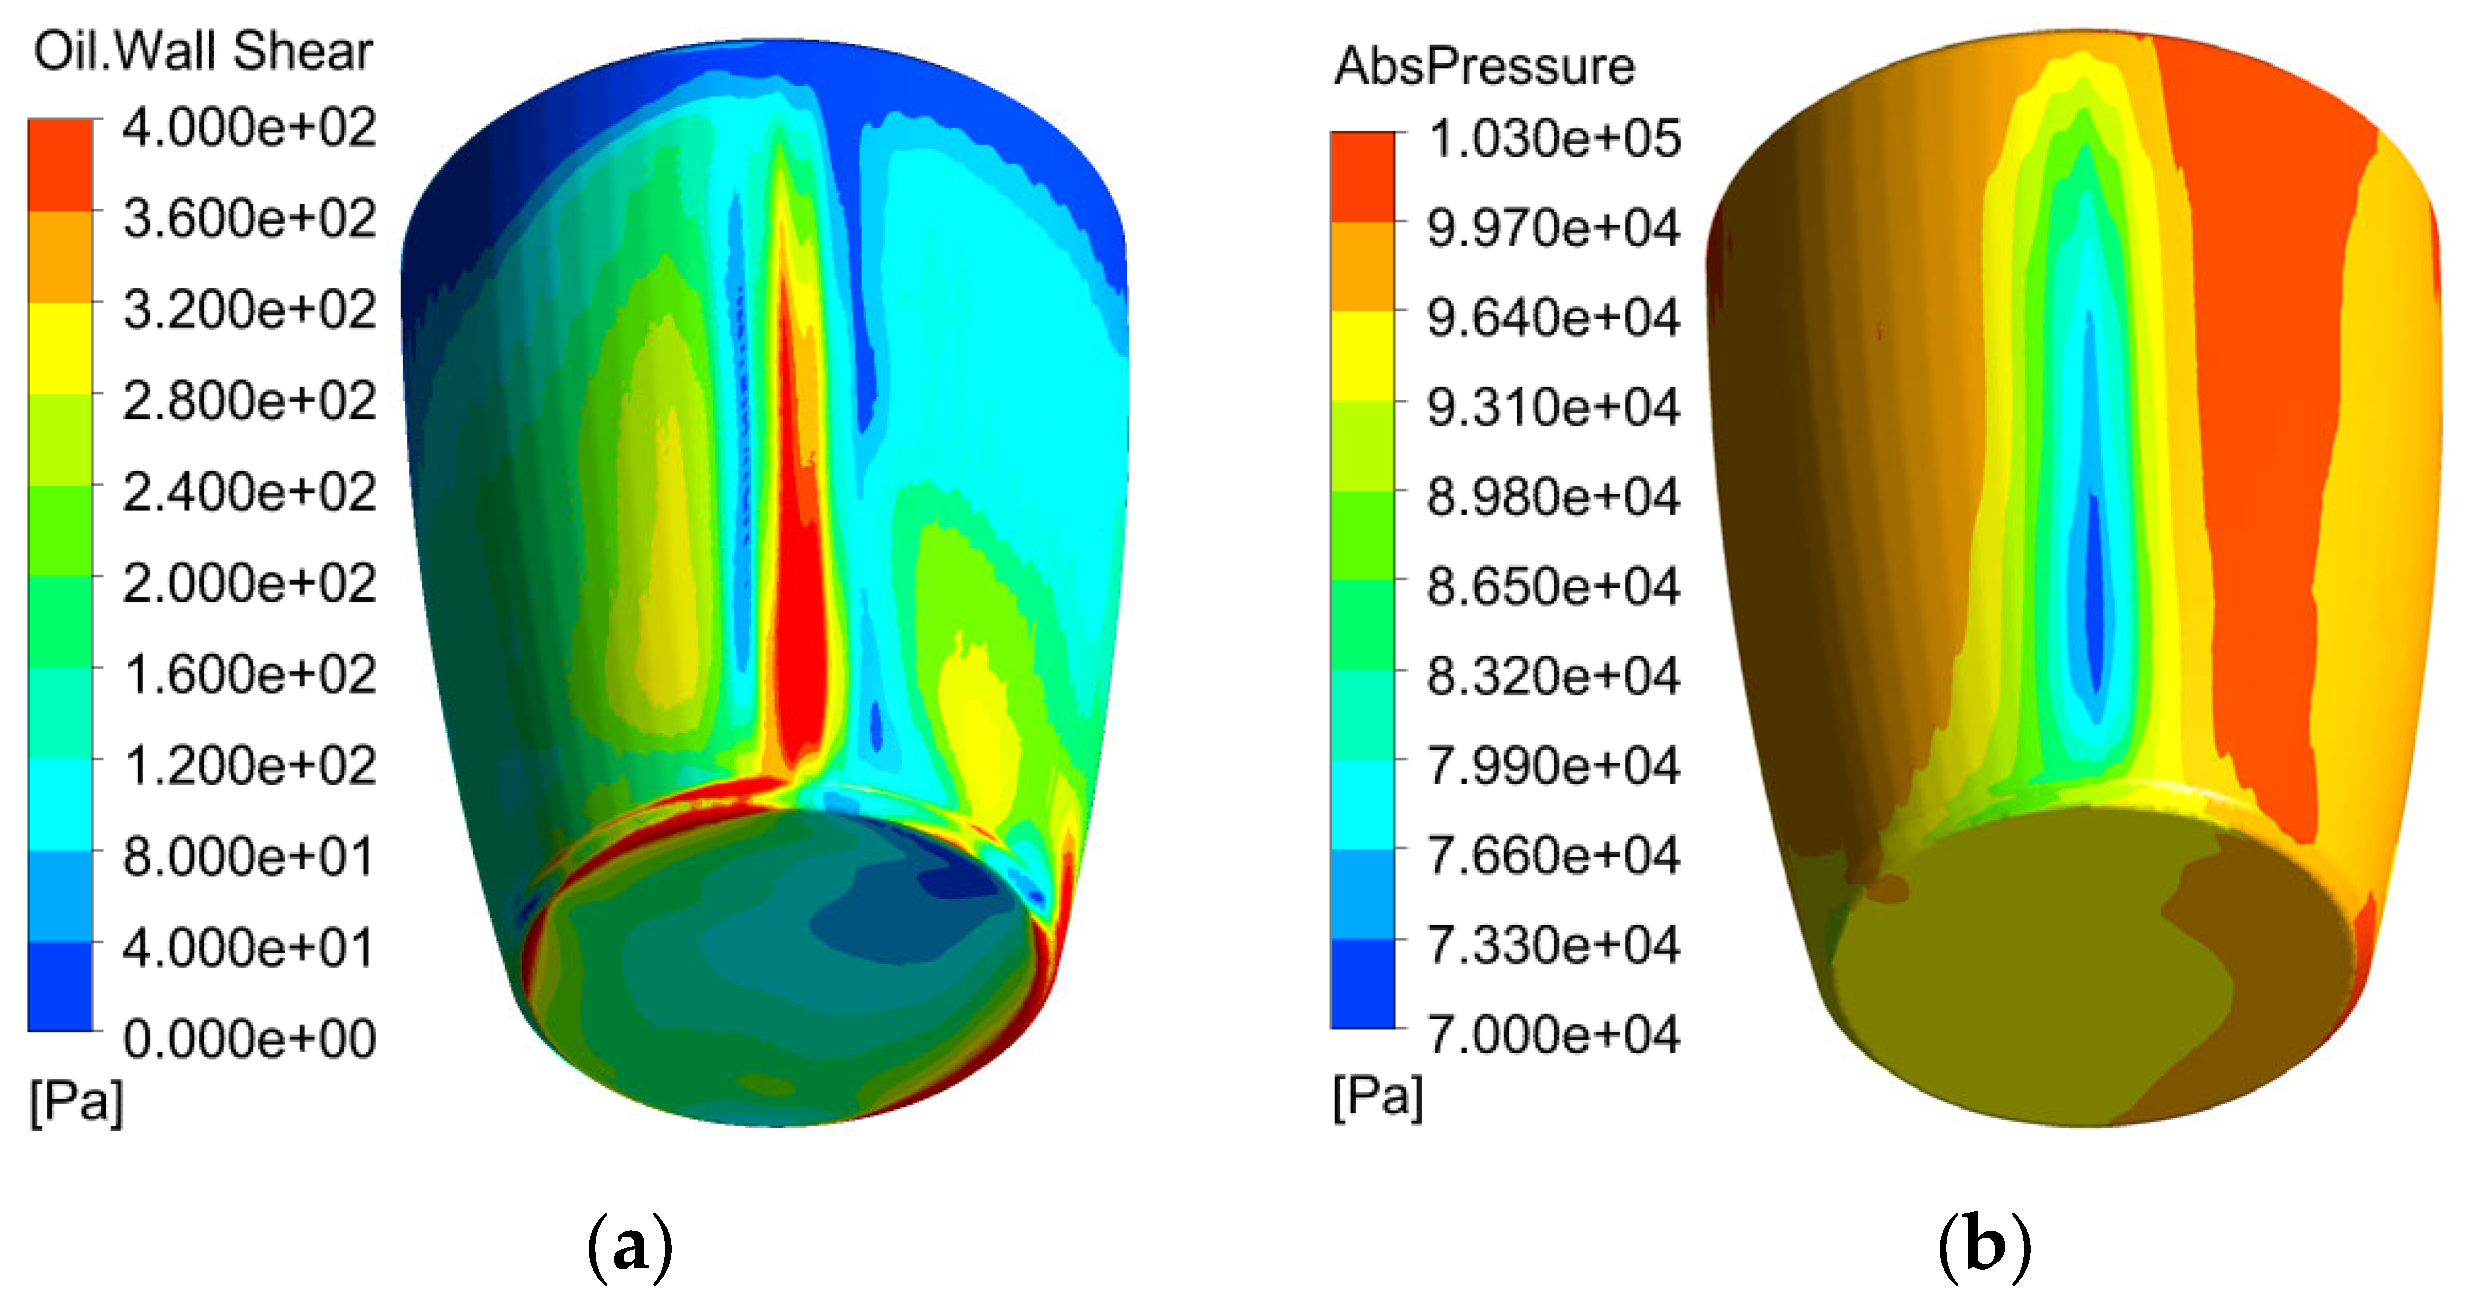
Thrust roller bearing lubrication based on the oil bath method with partially submersed rollers relies on the significant pumping effect caused by the rotation of the rollers and centrifugal and hydrodynamic forces acting on the oil phase. From that point, the kinematics of flow inside the bearing plays an important role. As has been already said, inside the bearing, there are both the stationary parts and the parts rotating with different rotational speeds. The bearing is defined as a rotating domain that rotates around the main axis with the rotary speed of the cage. The inner ring is therefore considered to be a rotating wall, which rotates faster than the cage and rollers; on the other hand, the outer ring is defined as the counter-rotating wall inside the rotating frame of reference. Every roller has its individual axis of rotation inside the bearing domain and rotates around this axis. Velocities, pressure and wall shear stress on one typical roller are show in Figure 8 and Figure 9, facing the roller from the direction of the outer raceway. At the contact zone, there is a very complex pattern of surface streamlines with the minimum pressure and maximum shear stress. It must be pointed out that the velocities are related to the cage’s moving reference frame.
Though the cylindrical roller has a very uniform ratio γ (the ratio of the local roller diameter to the local pitch diameter) and the roller rotational speed is uniform all along its length, still the contact zone is not uniform along the roller length and the low-pressure region is wider in the lower part of the roller. This can be linked with the different distribution of the lubricating oil, as can be seen in Figure 10, where the oil volume fraction on the roller surface is shown for the standard oil level (SOL) as indicated in Figure 2.
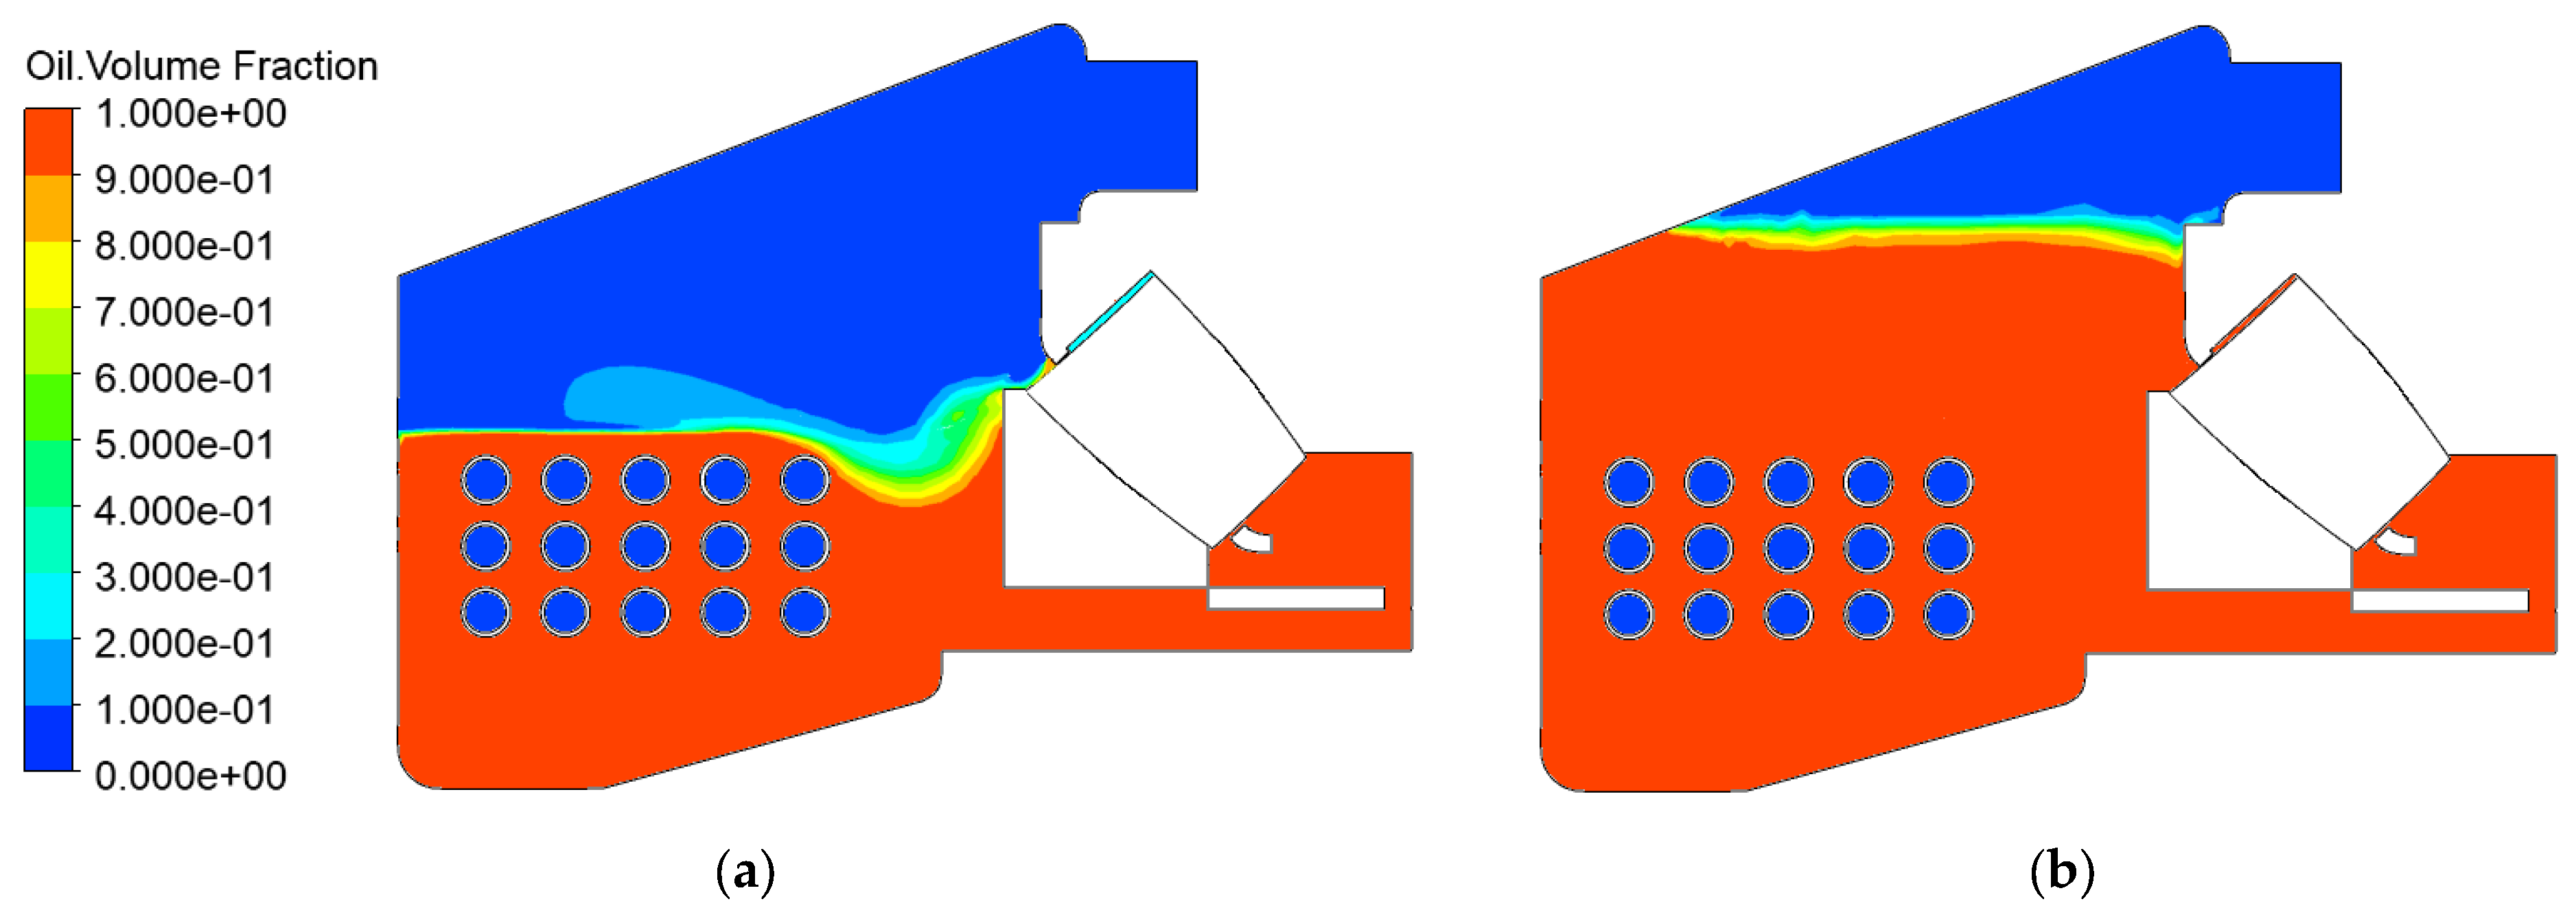
In this study, the main results are devoted to the standard oil level, which corresponds to the half-flooded bearing. Still, the fully flooded case (high oil level, HOL) has been also investigated, so as to find the influence of the oil level on the temperature distribution and hydraulic losses in the bearing. Figure 11 shows the oil level inside the bearing and its housing for both the SOL and HOL cases. The computational oil level is somewhat imaginary; it is represented by the iso-surface with the oil volume fraction equal to 0.5. Due to the rotation of the bearing rollers, in the case of the SOL, the oil level has quite a complicated shape, with the mixture of oil and air close to the rollers. Close to the bearing itself, the cloud of the oil–air mixture can be observed, with the oil droplets splashed over the oil-free level. These clouds are unsteady, with the dominant frequency of the oil level changes, which corresponds to the cage rotational speed. Of course, in the case of the HOL, the oil level is less influenced by the roller kinematics and the rollers are fully covered with oil. Figure 12 shows the oil volume fraction distribution in the cross-section of the bearing housing, which comes through the axis of the bearing revolution for both the SOL and HOL cases.
In the case of the HOL, there is still a mixture of oil and air on the oil level. In reality, such a mixture can result in a foam, which could easily leak through the air vent, located on the cover of the bearing housing (Figure 2a, upper left part of the picture), so in this case the air vent should be located in a more appropriate place.

4.2. Temperature Distribution and Cooling System Efficiency

One of the most important integral parameters in this study are the temperatures inside the computational domain—this means the temperature of the oil in the housing and bearing itself, and the temperature of the water inside the cooling spiral. At the spiral inlet, the water, with a maximum temperature of 35 °C, is supplied from the pump discharge with the water mass flow rate set to 0.56 kg/s.
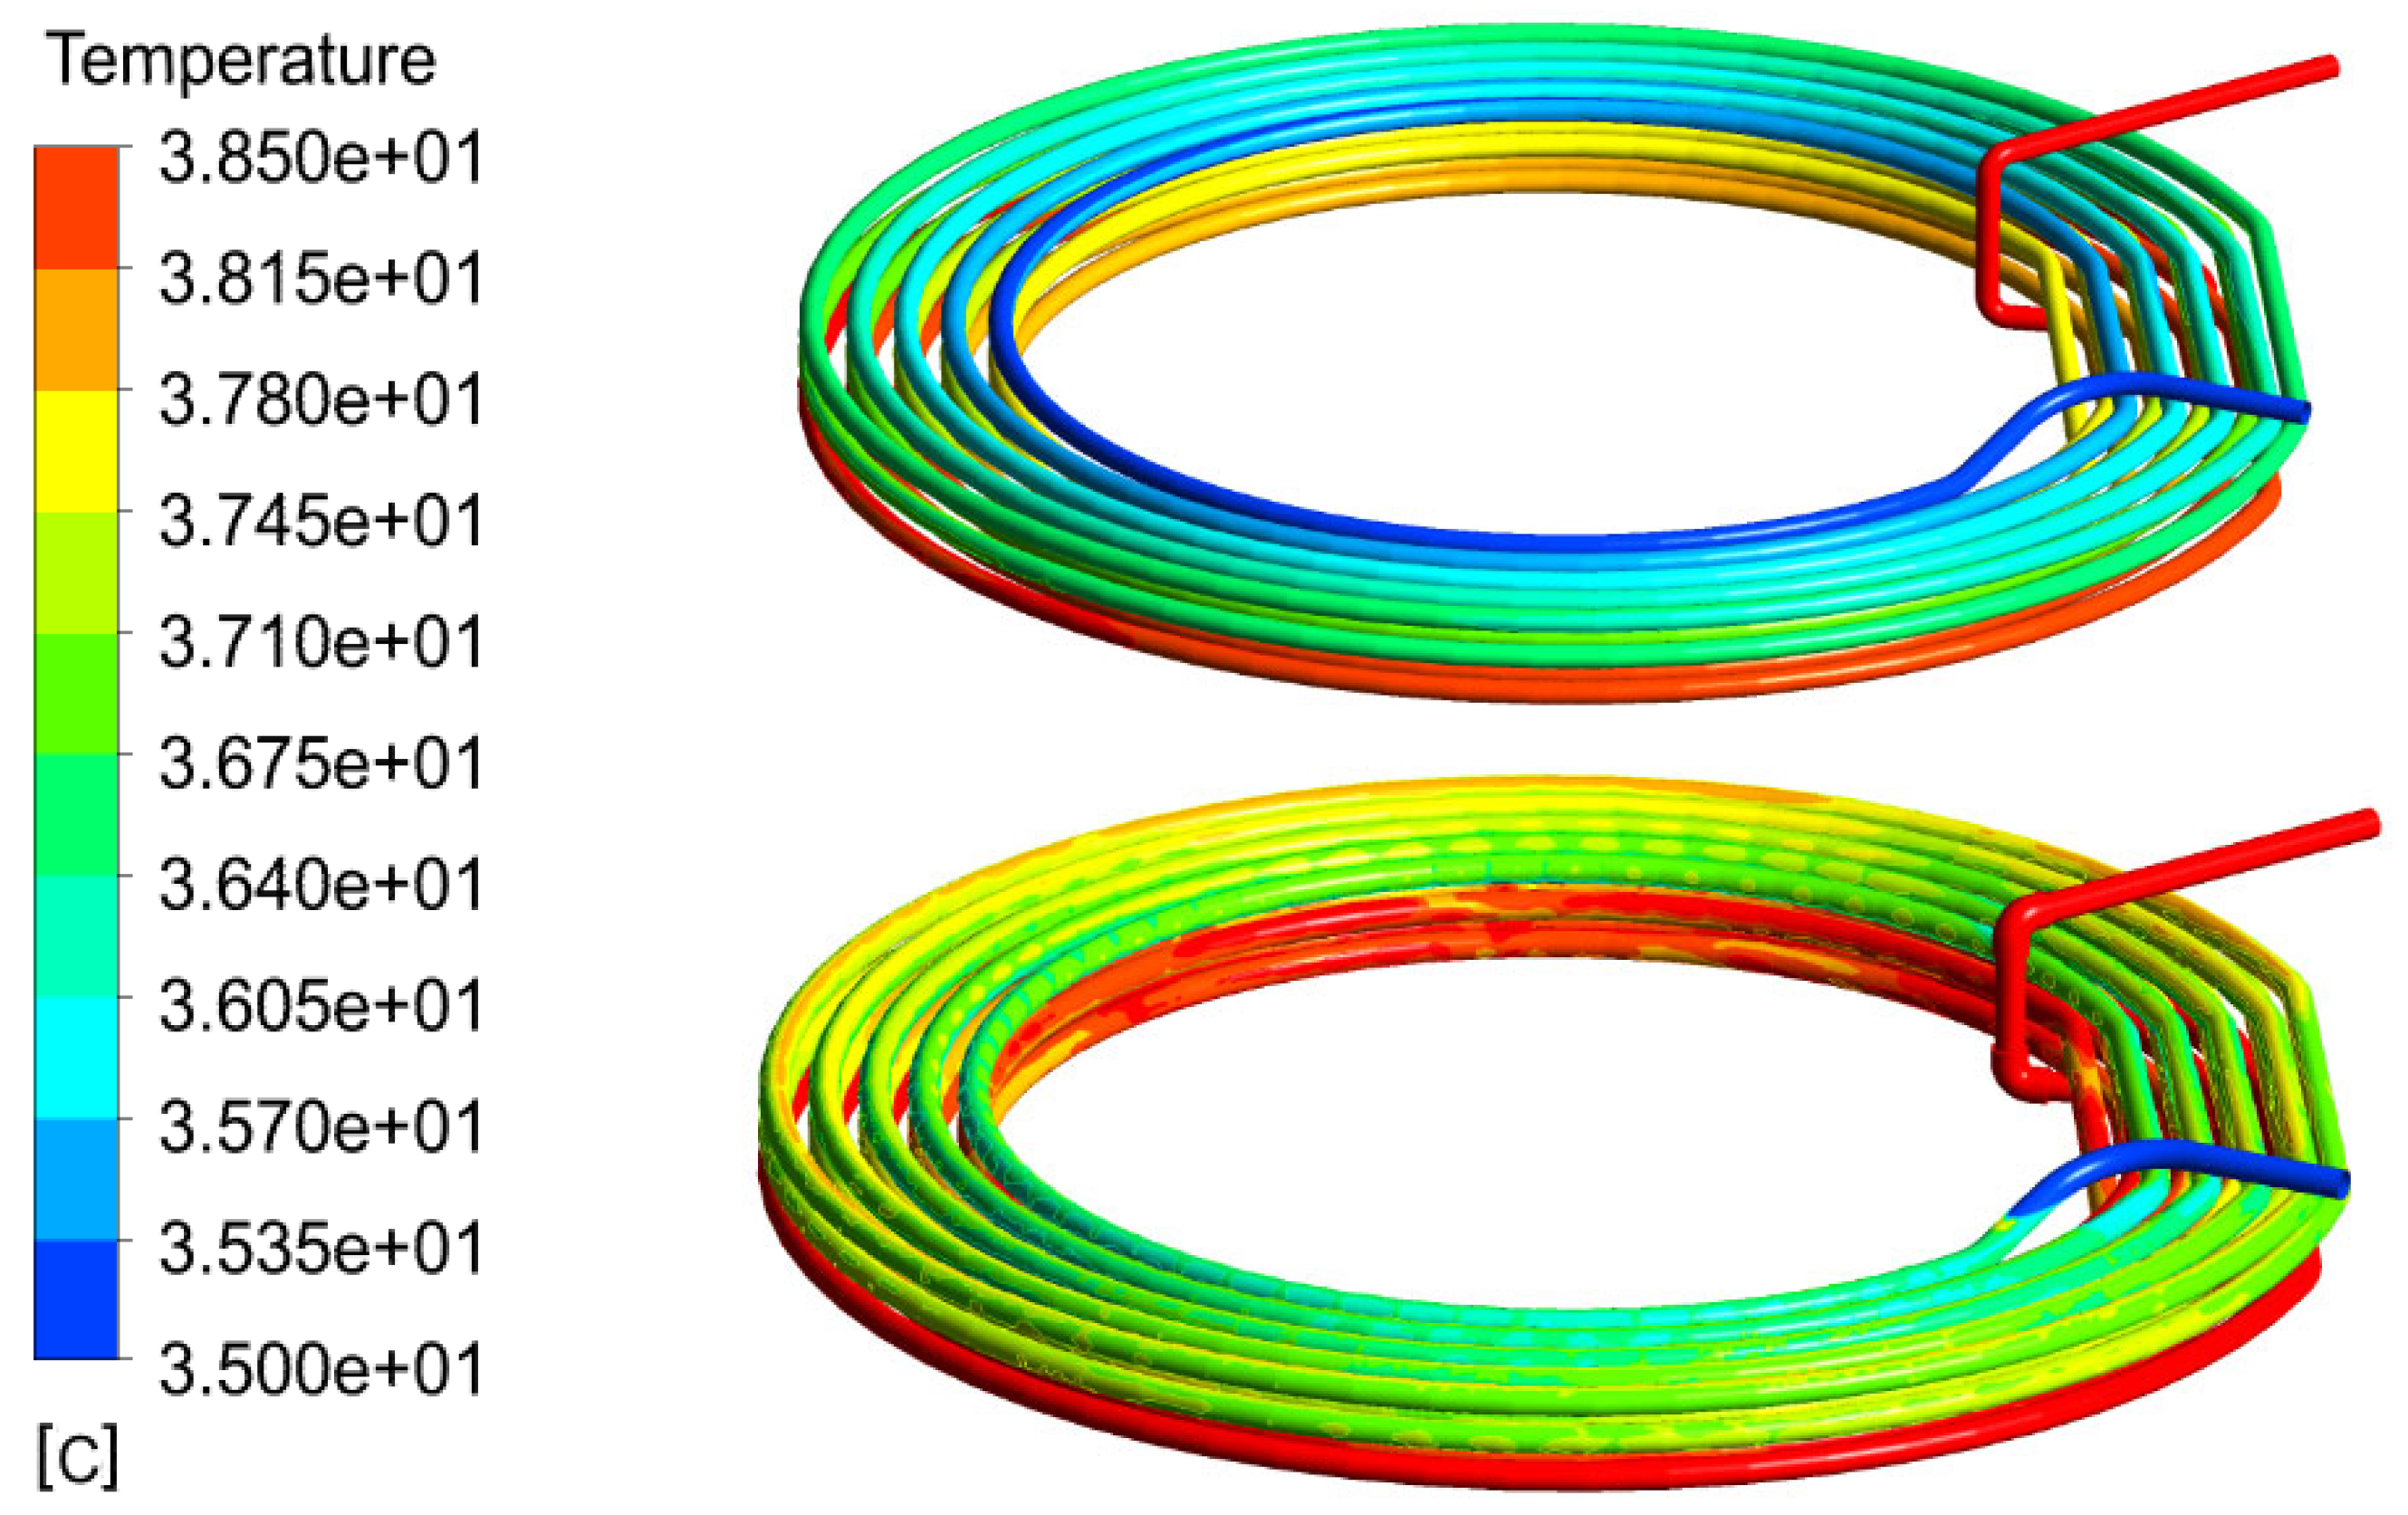
In the case of the SOL, the temperature of the water at the spiral outlet reaches 38.51 °C. With the water’s specific heat capacity, the overall heat flux conducted by water is about 8051 W. According to the estimated axial load and bearing manufacturers’ data, the overall heat flux from the bearing’s mechanical losses of 5000 W has been prescribed on the roller and race walls. So, resulting hydraulic power losses inside the bearing itself and inside the housing and channels feeding the bearing with oil represent about 3051 W. It is difficult to separate these losses between the bearing itself and the remaining bearing housing, especially in the case of the SOL, because they include also the losses due to the splash effects and interaction of the oil–air mixture with the oil surface. The value estimated by the manufacturer for the drag power losses of the bearing itself is about 490 W. The remaining hydraulic losses of 2561 W seem to be quite high, but it must be considered that they also include significant pressure losses when the oil flows around the cooling spiral and in the return channels. Figure 13 shows the temperature distribution on the wall inside the cooling spiral, and the temperature distribution on the outer surface of the cooling spiral. There is a temperature difference through the steel wall, decreasing along the spiral length. This means that the main and most intensive cooling process is realized in the starting (upper) part of the cooling spiral.
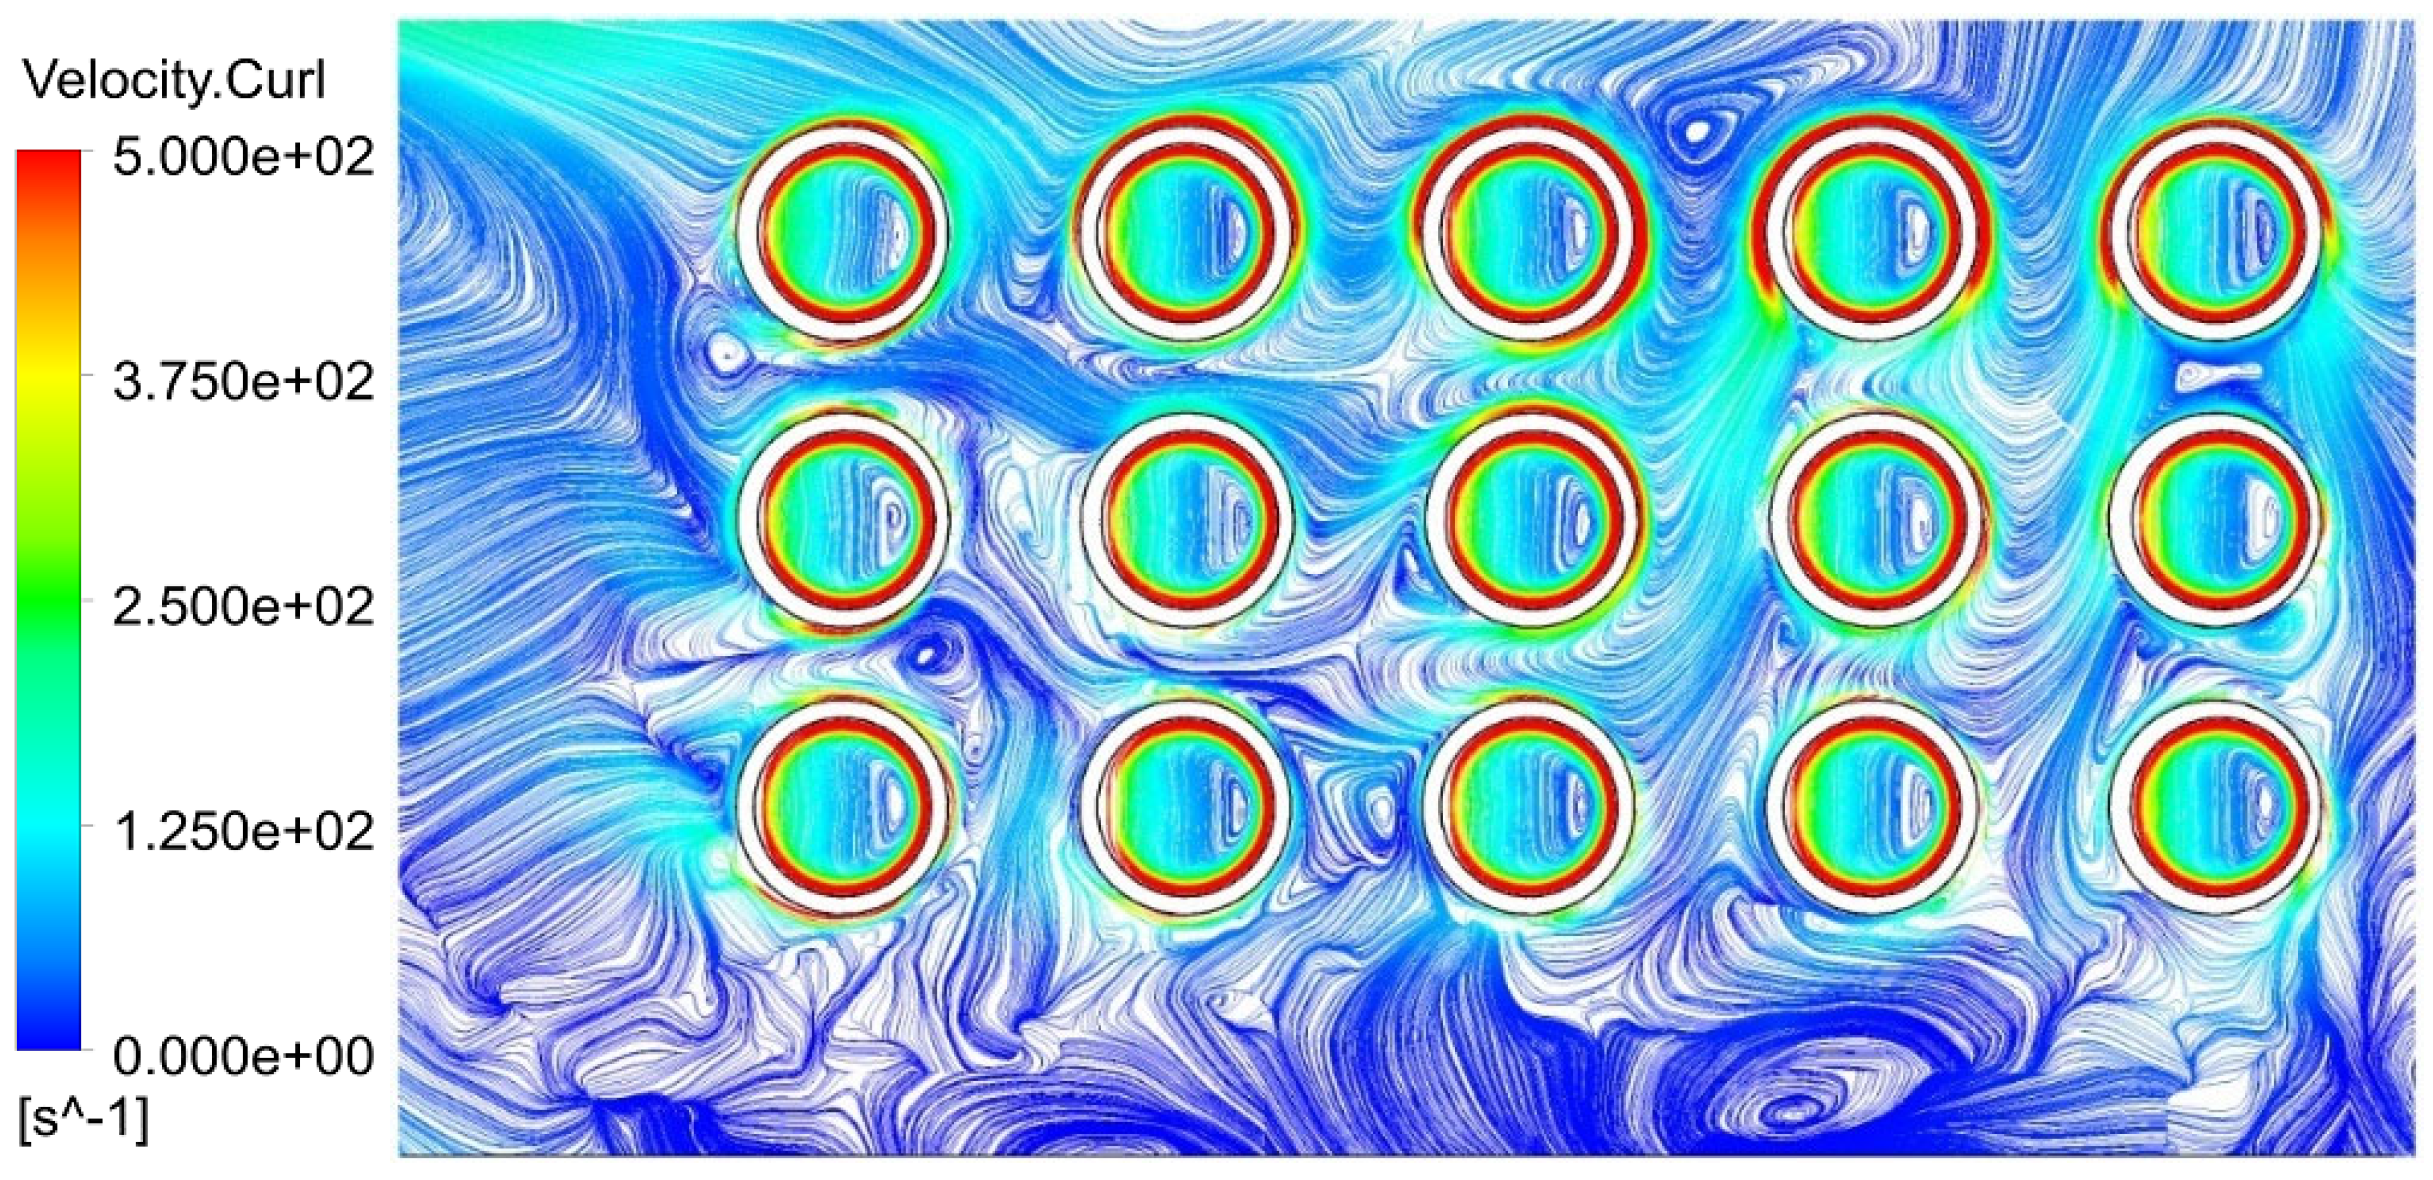
Concerning the cooling effects of the spiral pipe, the velocity and vorticity of the flow field play a very important role. A very complex pattern of turbulent vortices can be observed in the vicinity of the spiral piping. Details of the velocity field in the vicinity of the cooling spiral can be seen in Figure 14 and Figure 15, showing the velocity streamlines and the characteristic lines of velocity circulation in the cross-section of bearing housing. Inside the pipes, a pair of dominant vortices can be found, typical for the curved channels, but outside the pipes, it can be seen how the pipes influence one another in the flow field. As expected, the highest circulation of the velocity field can be found in the boundary layer of the pipes (this quantity indicates the boundary layer thickness in a good manner). It can be seen that the boundary layer thickness on the pipe’s outer wall changes significantly based on the complex flow interactions. Figure 16 shows the velocity streamlines close to the bearing housing wall. A very complex flow pattern results from the presence of the spiral pipe as well as the ribs in the housing bottom.
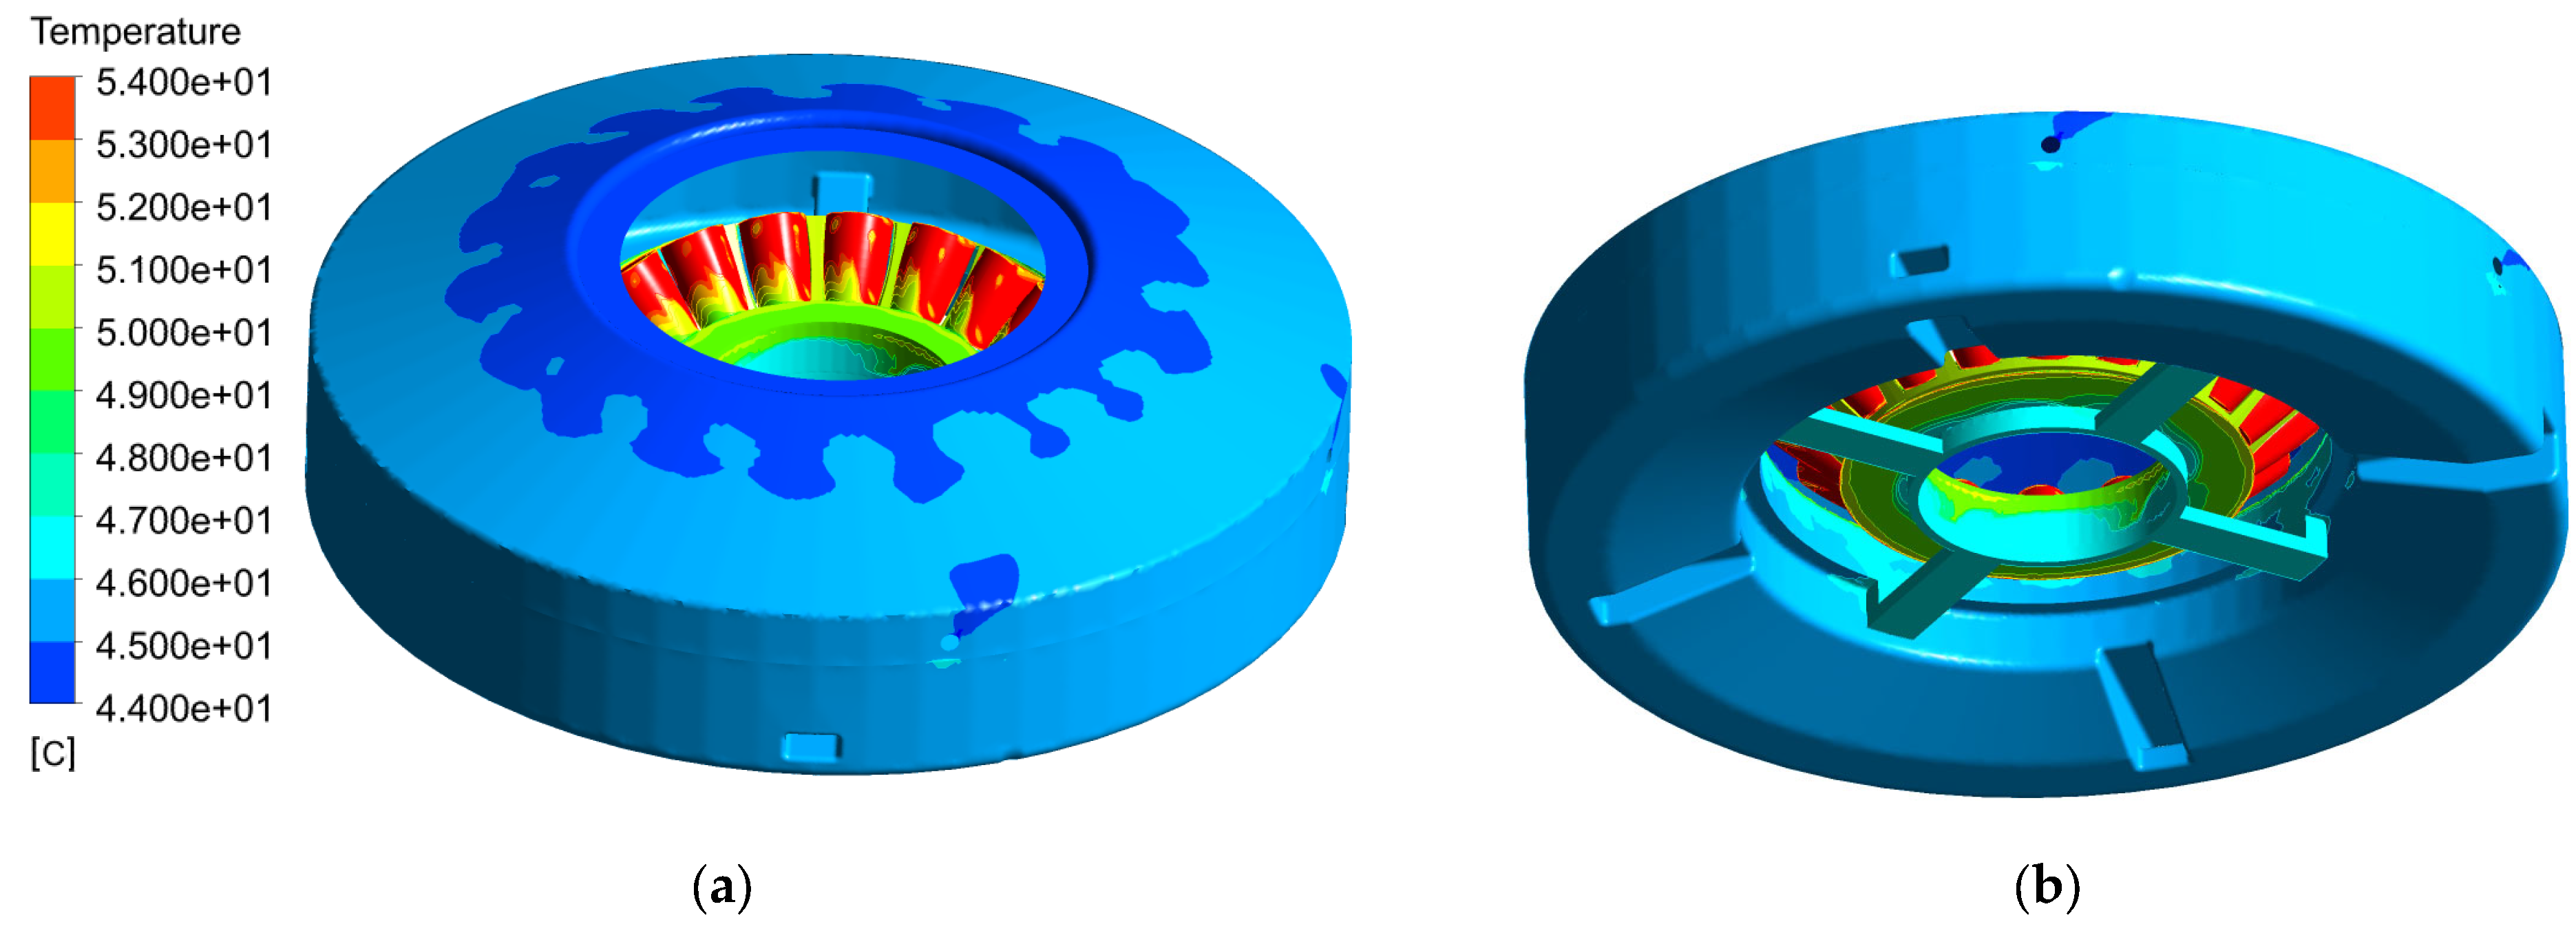
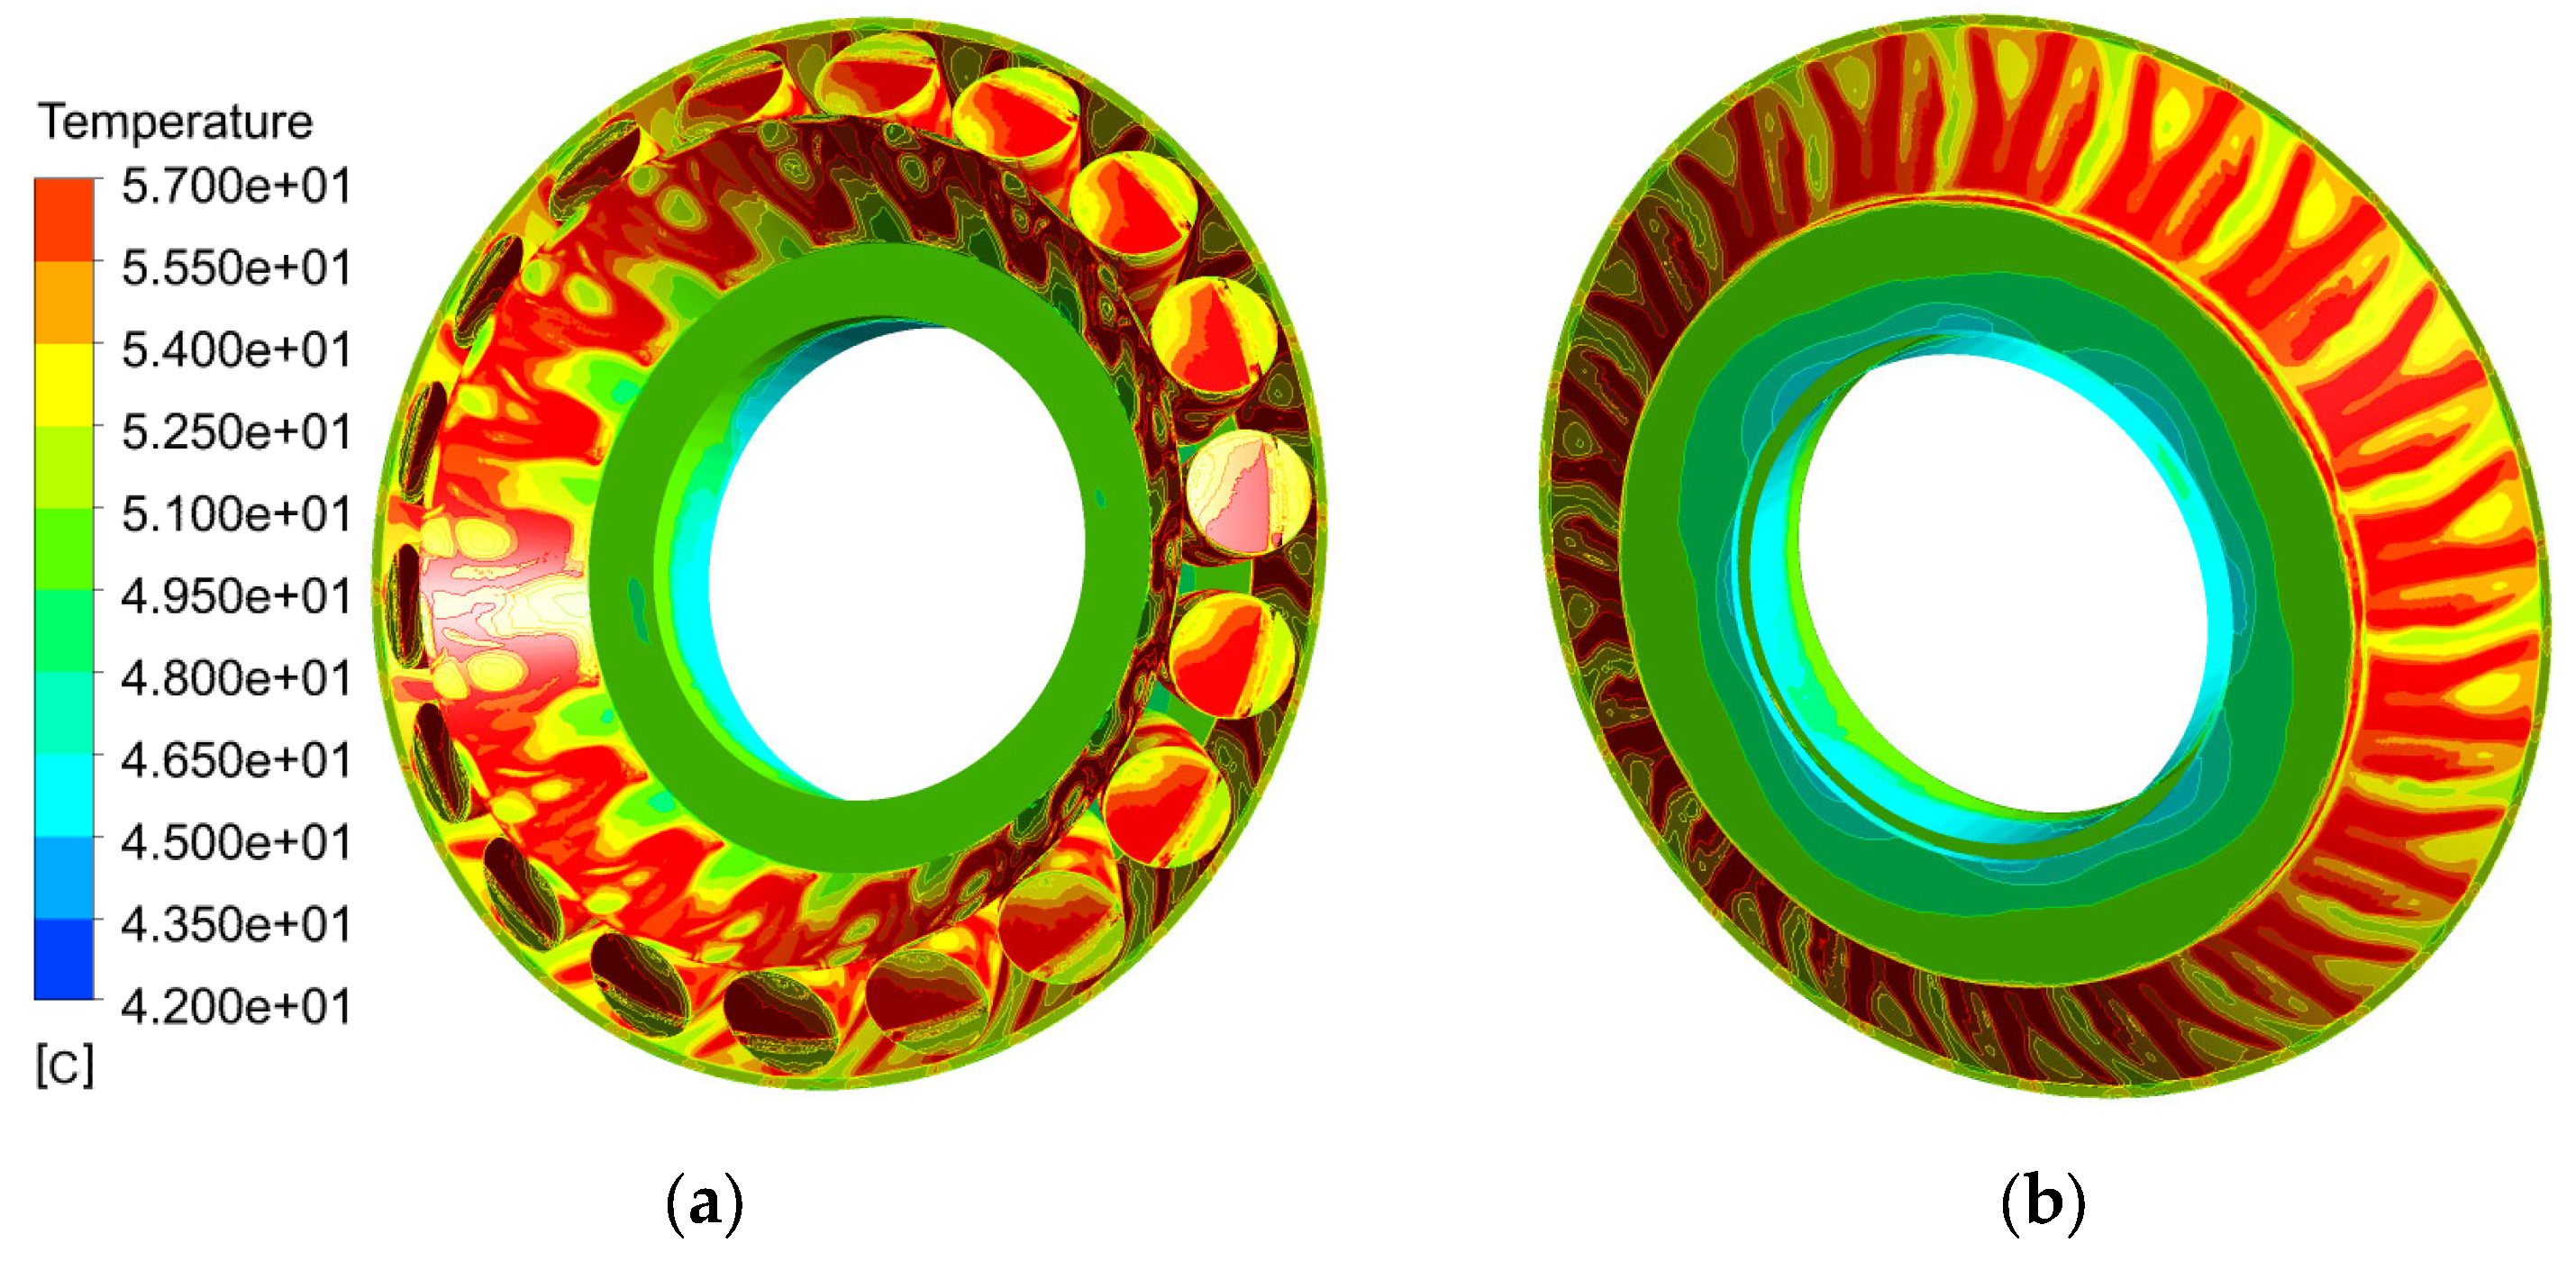
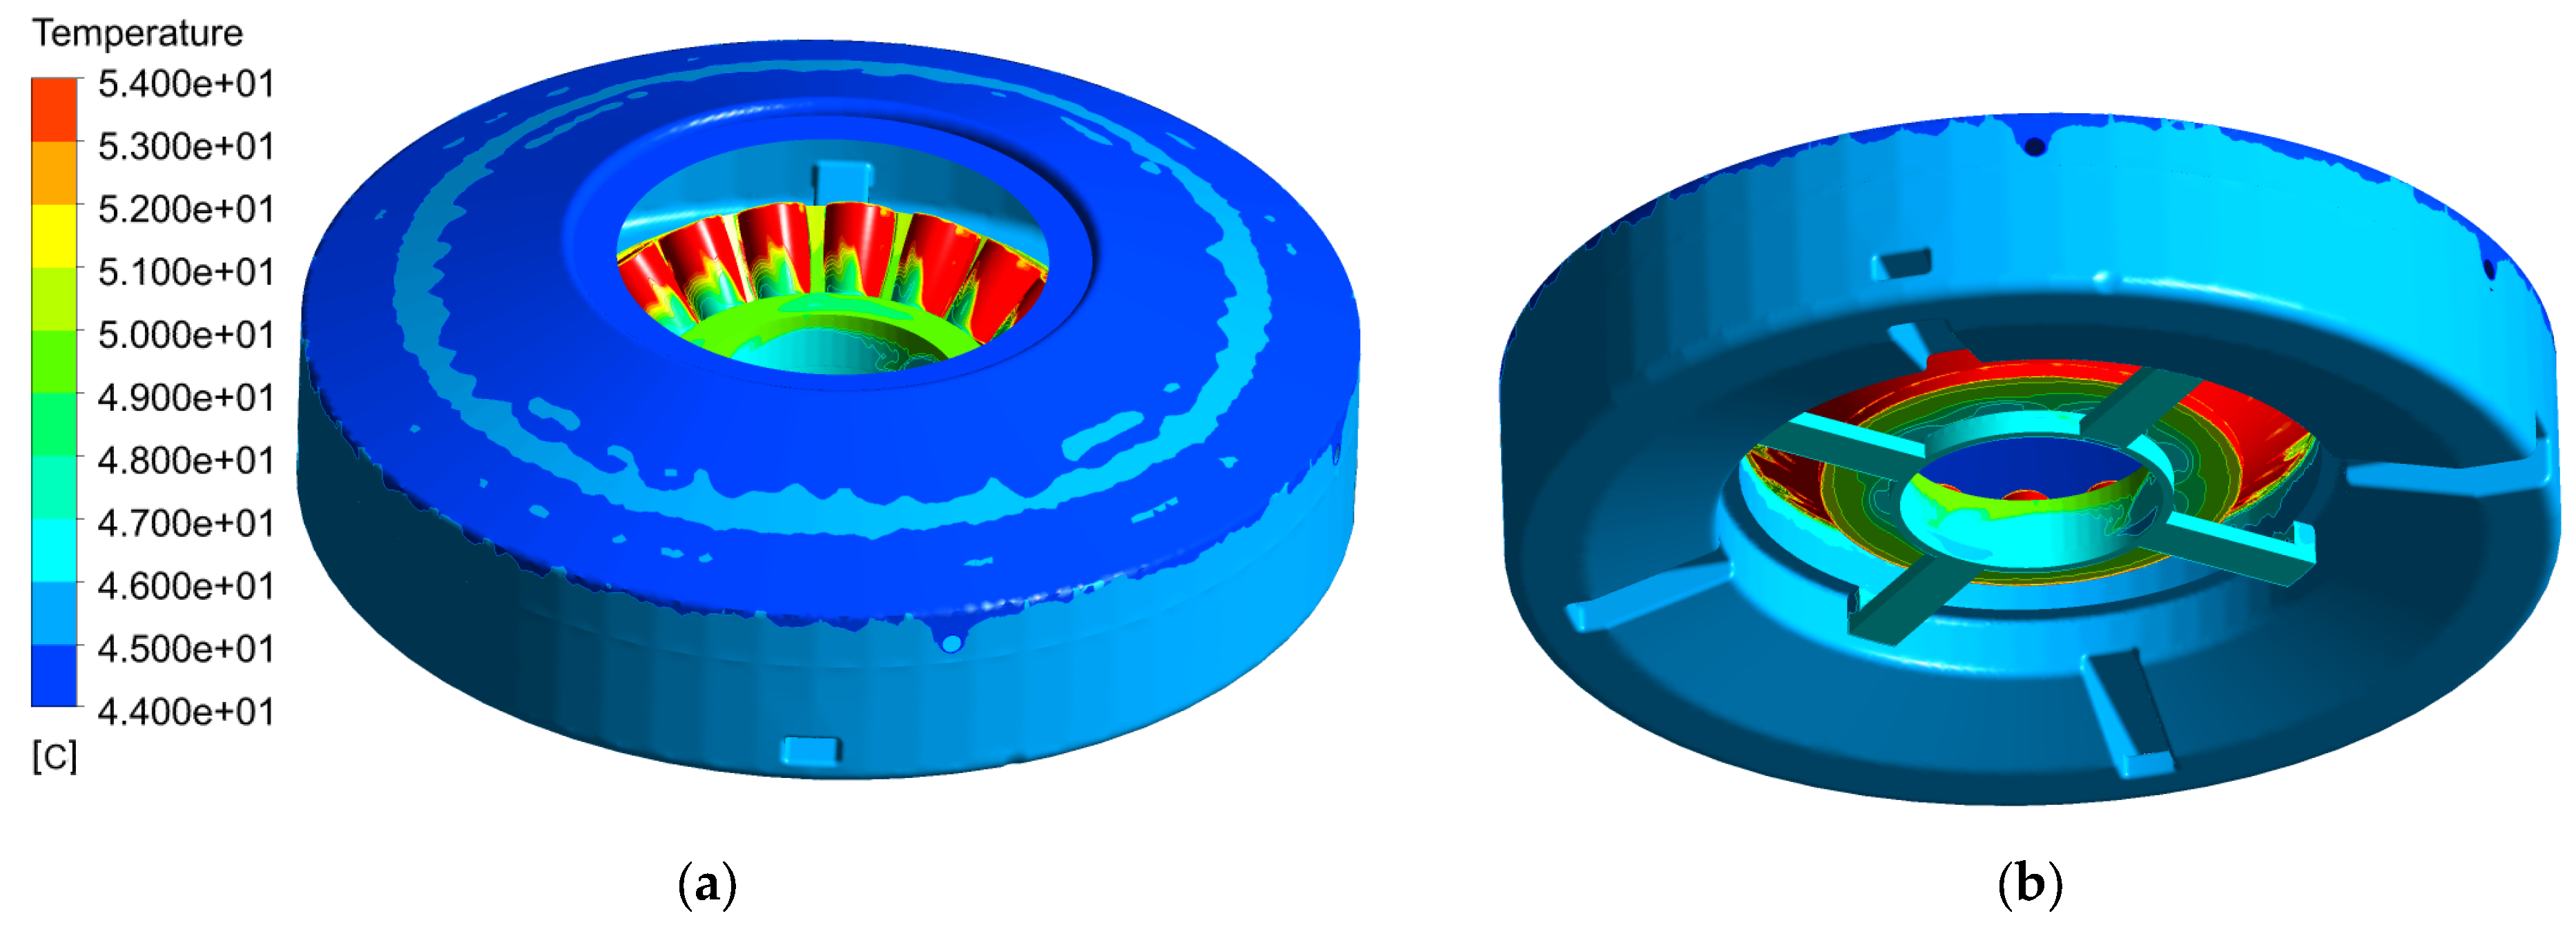
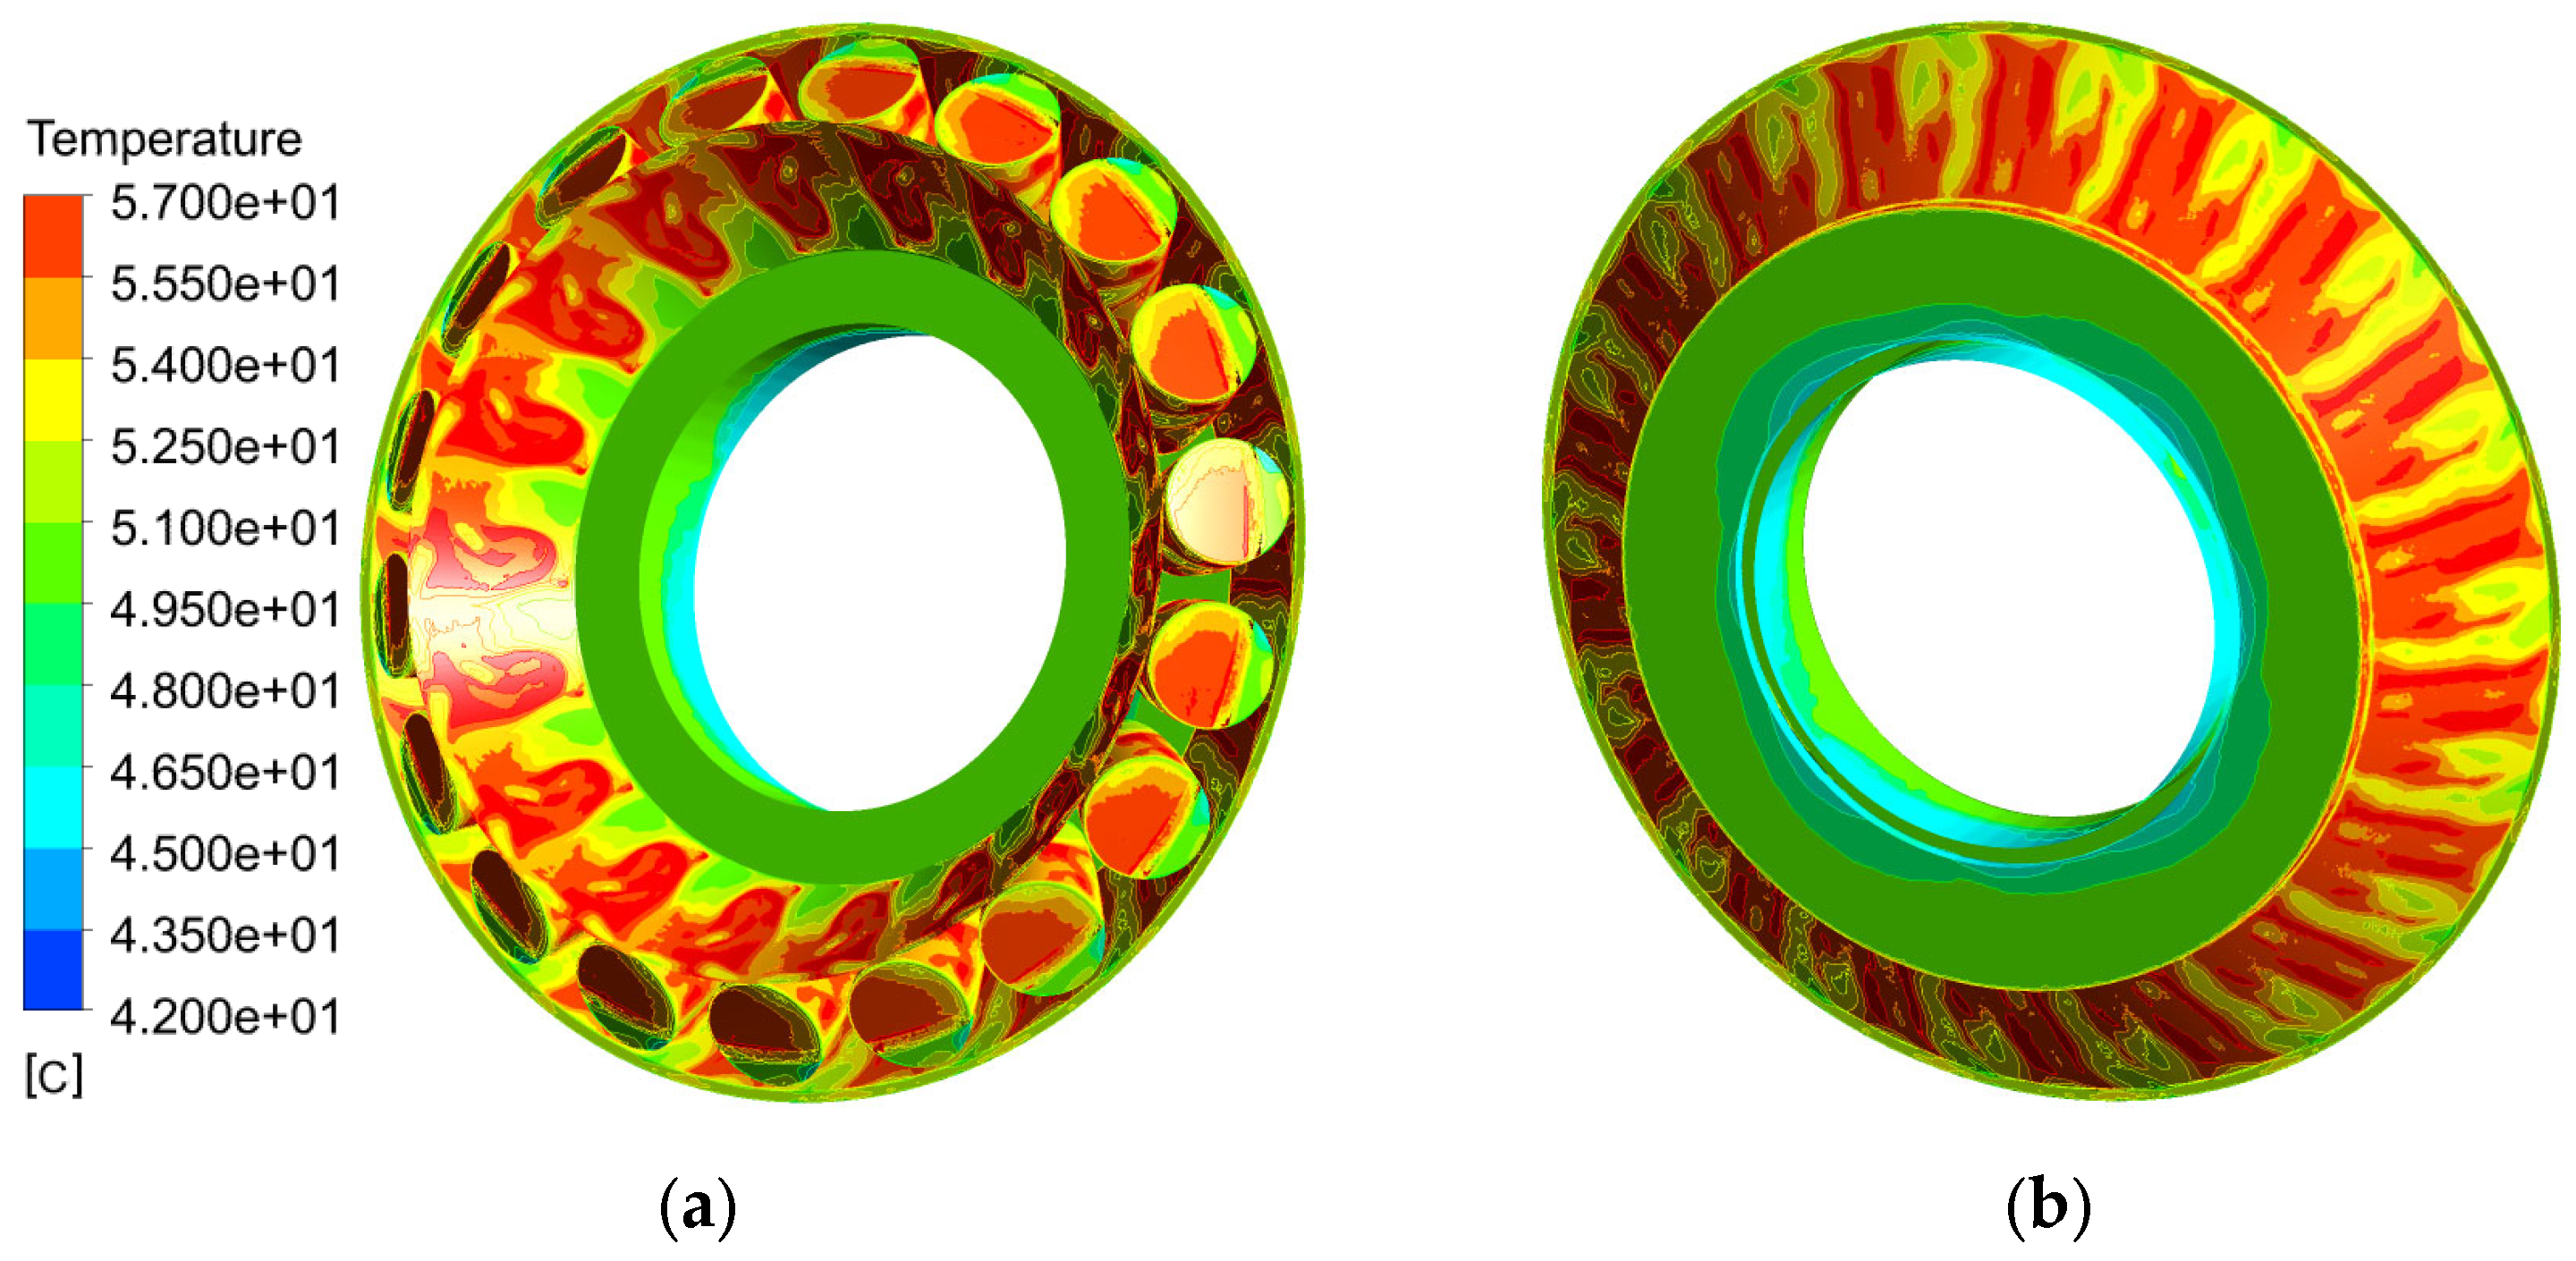
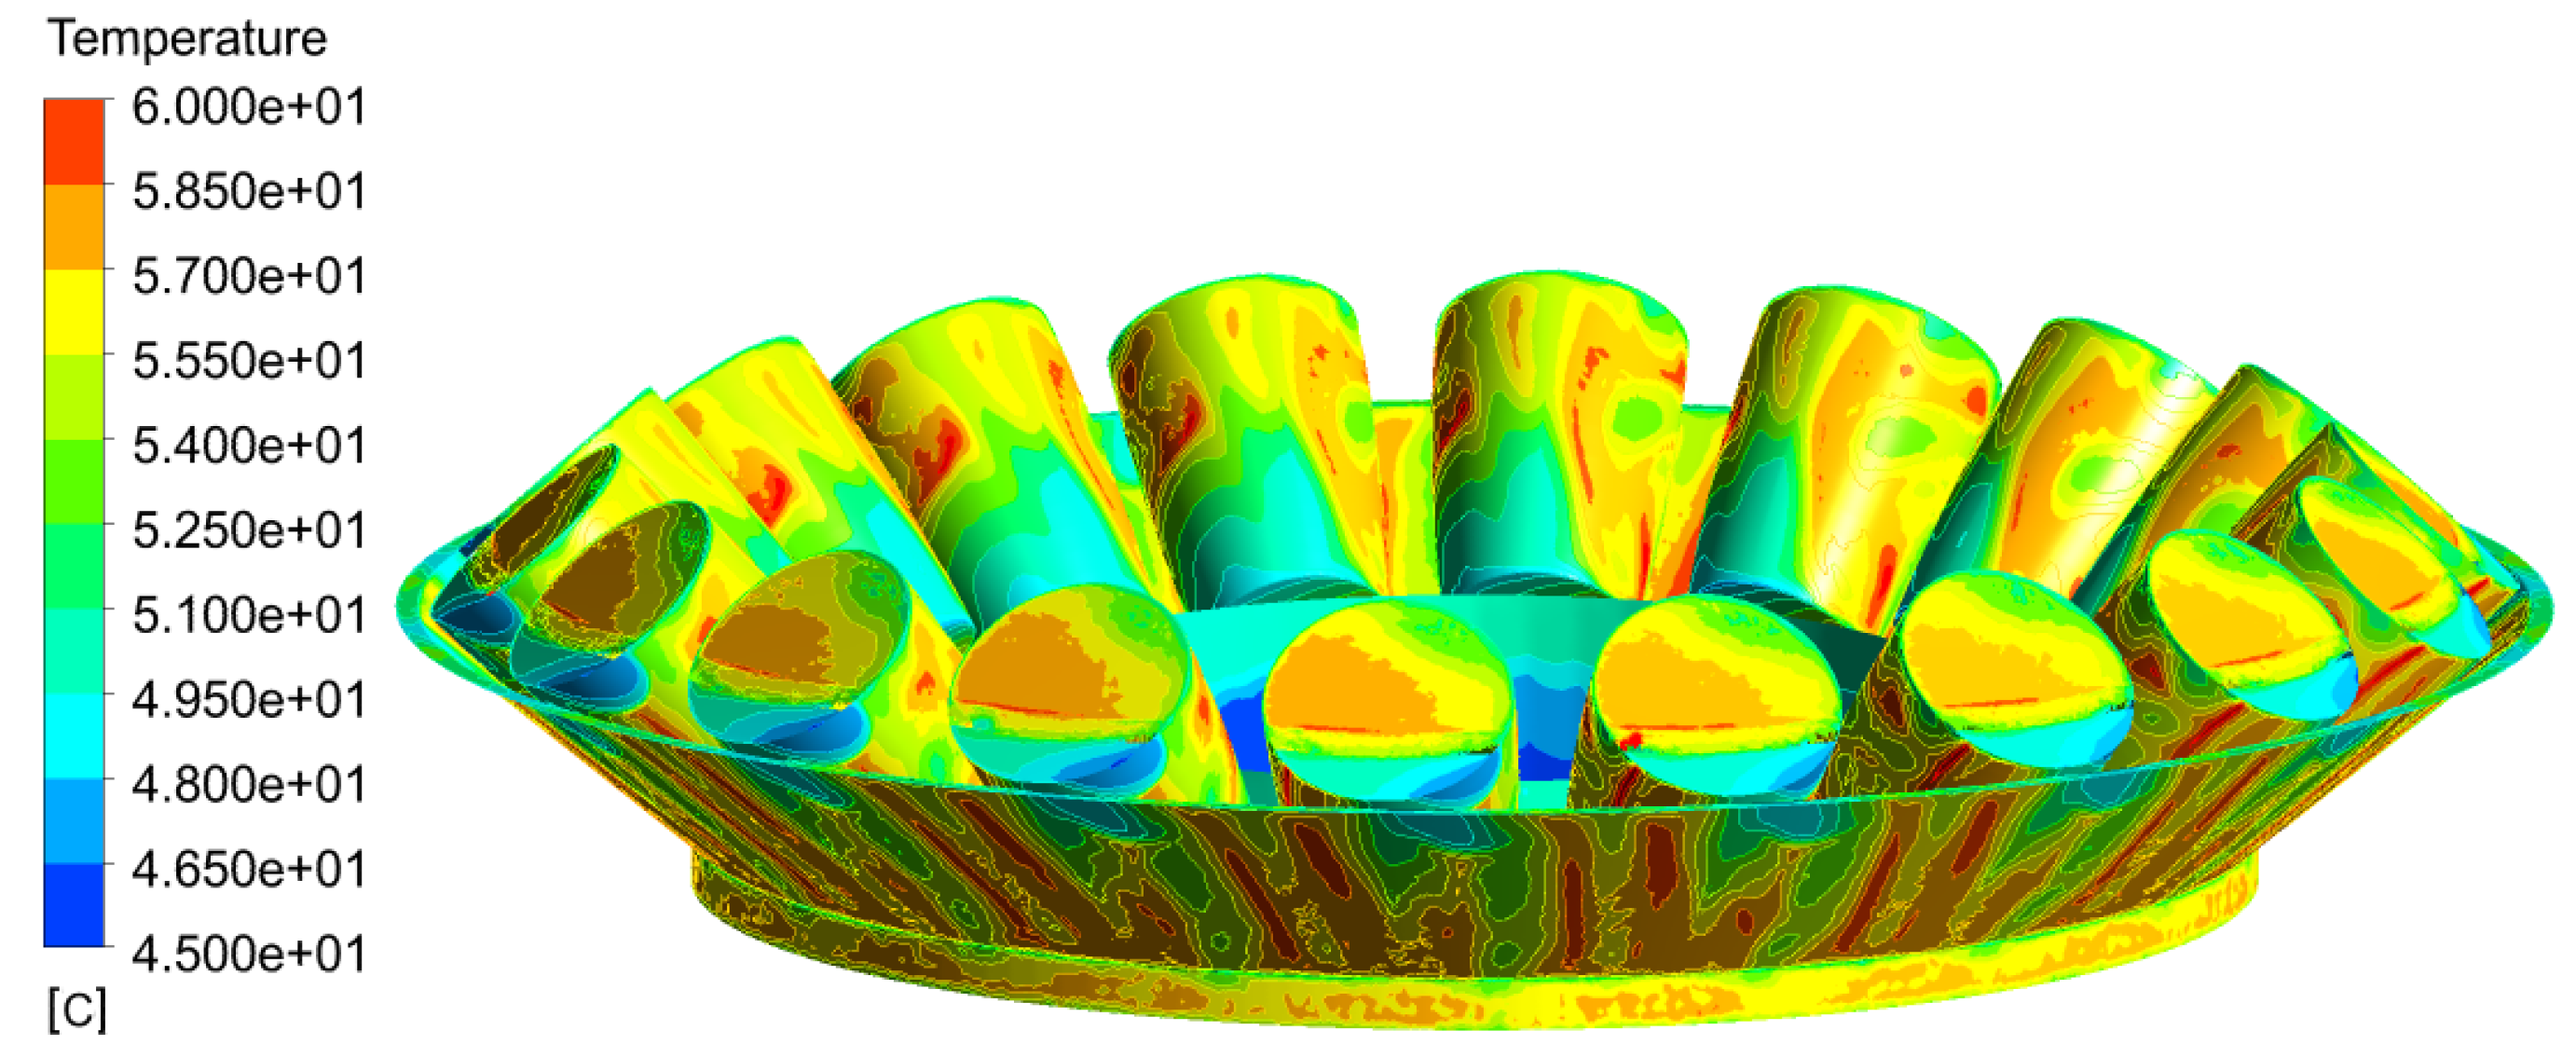
The temperature distribution on the housing walls and on the working walls of the bearing is shown in Figure 17 and Figure 18. To enable better visualization, the reduced temperature scales have been used and the cage walls have been hidden. Though the temperature of the housing is sufficiently uniform, the highest temperatures can be found, of course, on the rotating walls of the bearing, due to the main mechanical and hydraulic losses. The majority of the bearing’s working surfaces (rollers and races) keep the temperature below 57 °C, but at the top of the rollers, in the region with minimum lubrication, the temperature maximum of 78 °C can be found; this is shown in detail in Figure 19.
In the case of the HOL, the temperature of the water at the spiral outlet reaches 38.92 °C. With the water’s specific heat capacity, the overall heat flux conducted by the water is about 8992 W. With the unchanged mechanical losses of 5000 W, the resulting hydraulic power losses inside the bearing itself and inside the housing and channels feeding the bearing with oil represent about 3992 W. The value estimated by the manufacturer for the drag power losses of the fully flooded bearing itself is about 906 W. Remaining hydraulic losses of 3086 W are higher than the losses derived for the SOL case, probably because of the increased wetted surface of the housing, around which the rotating oil flows. On the other hand, in this case, the hydraulic losses from the splashing effects are lowered. The temperature distribution on the housing walls and on the working walls of the fully flooded bearing is shown in Figure 20 and Figure 21. Similarly to Figure 17 and Figure 18, the reduced temperature scales have been used and the cage walls have been hidden. Compared to the case of the half-flooded bearing, there is a larger area of lower temperature on the housing top. The explanation could have to do with the fact that in the case of the half-flooded bearing, the heat transfer between oil and air is more intensive due to the splashing effects, as can be seen in Figure 22. Similarly to the SOL case, the majority of the bearing’s working surfaces (rollers and races) keep their temperatures below 57 °C, but due to the presence of oil inside the whole bearing, the temperature on the rollers and races is more uniform compared to SOL, and the temperature maximum reaches about 61 °C (Figure 23).

5. Discussion

As has been indicated in the Introduction, the aim of this study is to model numerically the flow and thermal phenomena inside the complete set of a thrust bearing and its housing under extreme climatic conditions, including both the lubrication effects and the cooling of the oil by the water-cooling system based on spiral piping. It is natural and clear that the methodology used in this work has been inspired by the authors cited in the Introduction. The novelty of the presented paper is the complexity of tools used to describe the solved problem in a form applicable to engineering practice. The objective was to use commonly available computational sources without the necessity of a supercomputer infrastructure, but still to keep the physical model as complex as possible. All the calculations have been done using a computational workstation with 1 TB of memory and dual AMD (Advanced Micro Devices, Inc., Santa Clara, CA, USA) EPYC 24-Core processors. The typical computational time per one timestep is about 5–7 min.
The numerical simulations confirm that the designed cooling system is sufficient to keep the bearing and oil temperatures at safe values to guarantee bearing rating life even at extreme climatic conditions. But, they also confirm that all physical phenomena, from turbulence, multiphase buoyant flow, fully unsteady velocity and temperature fields, high vorticity of oil close to the cooler, up to all properly rotating components in the bearing play a significant role and should be simultaneously considered. Simulations also indicate that the complexity of the computational domain and bearing clearances have a significant impact on the obtained results. No typical grid dependence study changing the global density of the mesh was done, because the topology and quality of the grid in the most critical regions are much more important than the simple number of grid points. The main difference in the topology was due to the presence of the cage; the other changes can be linked to the reduction of the size of the clearance between rollers and raceways. This clearance started with the width of 0.9 mm, then it was lowered to 0.54 mm. The final size of the clearance was 0.34 mm, which appeared to be limiting for the computer memory, because with the decreasing width of the gap between rollers and races, the size of the computational grid dramatically increases.
To evaluate the influence of the changes described above, one exact integral value was selected, which represents the mass flow rate through the bearing itself in the case of the HOL. This value was evaluated at the bottom of the bearing and the results can be found in Table 3. There was a significant change in the mass flow rate due to the presence of the cage (decrease by 2.65%); the changes in the clearance resulted in additional successive decreases, by 2% and 0.37%.
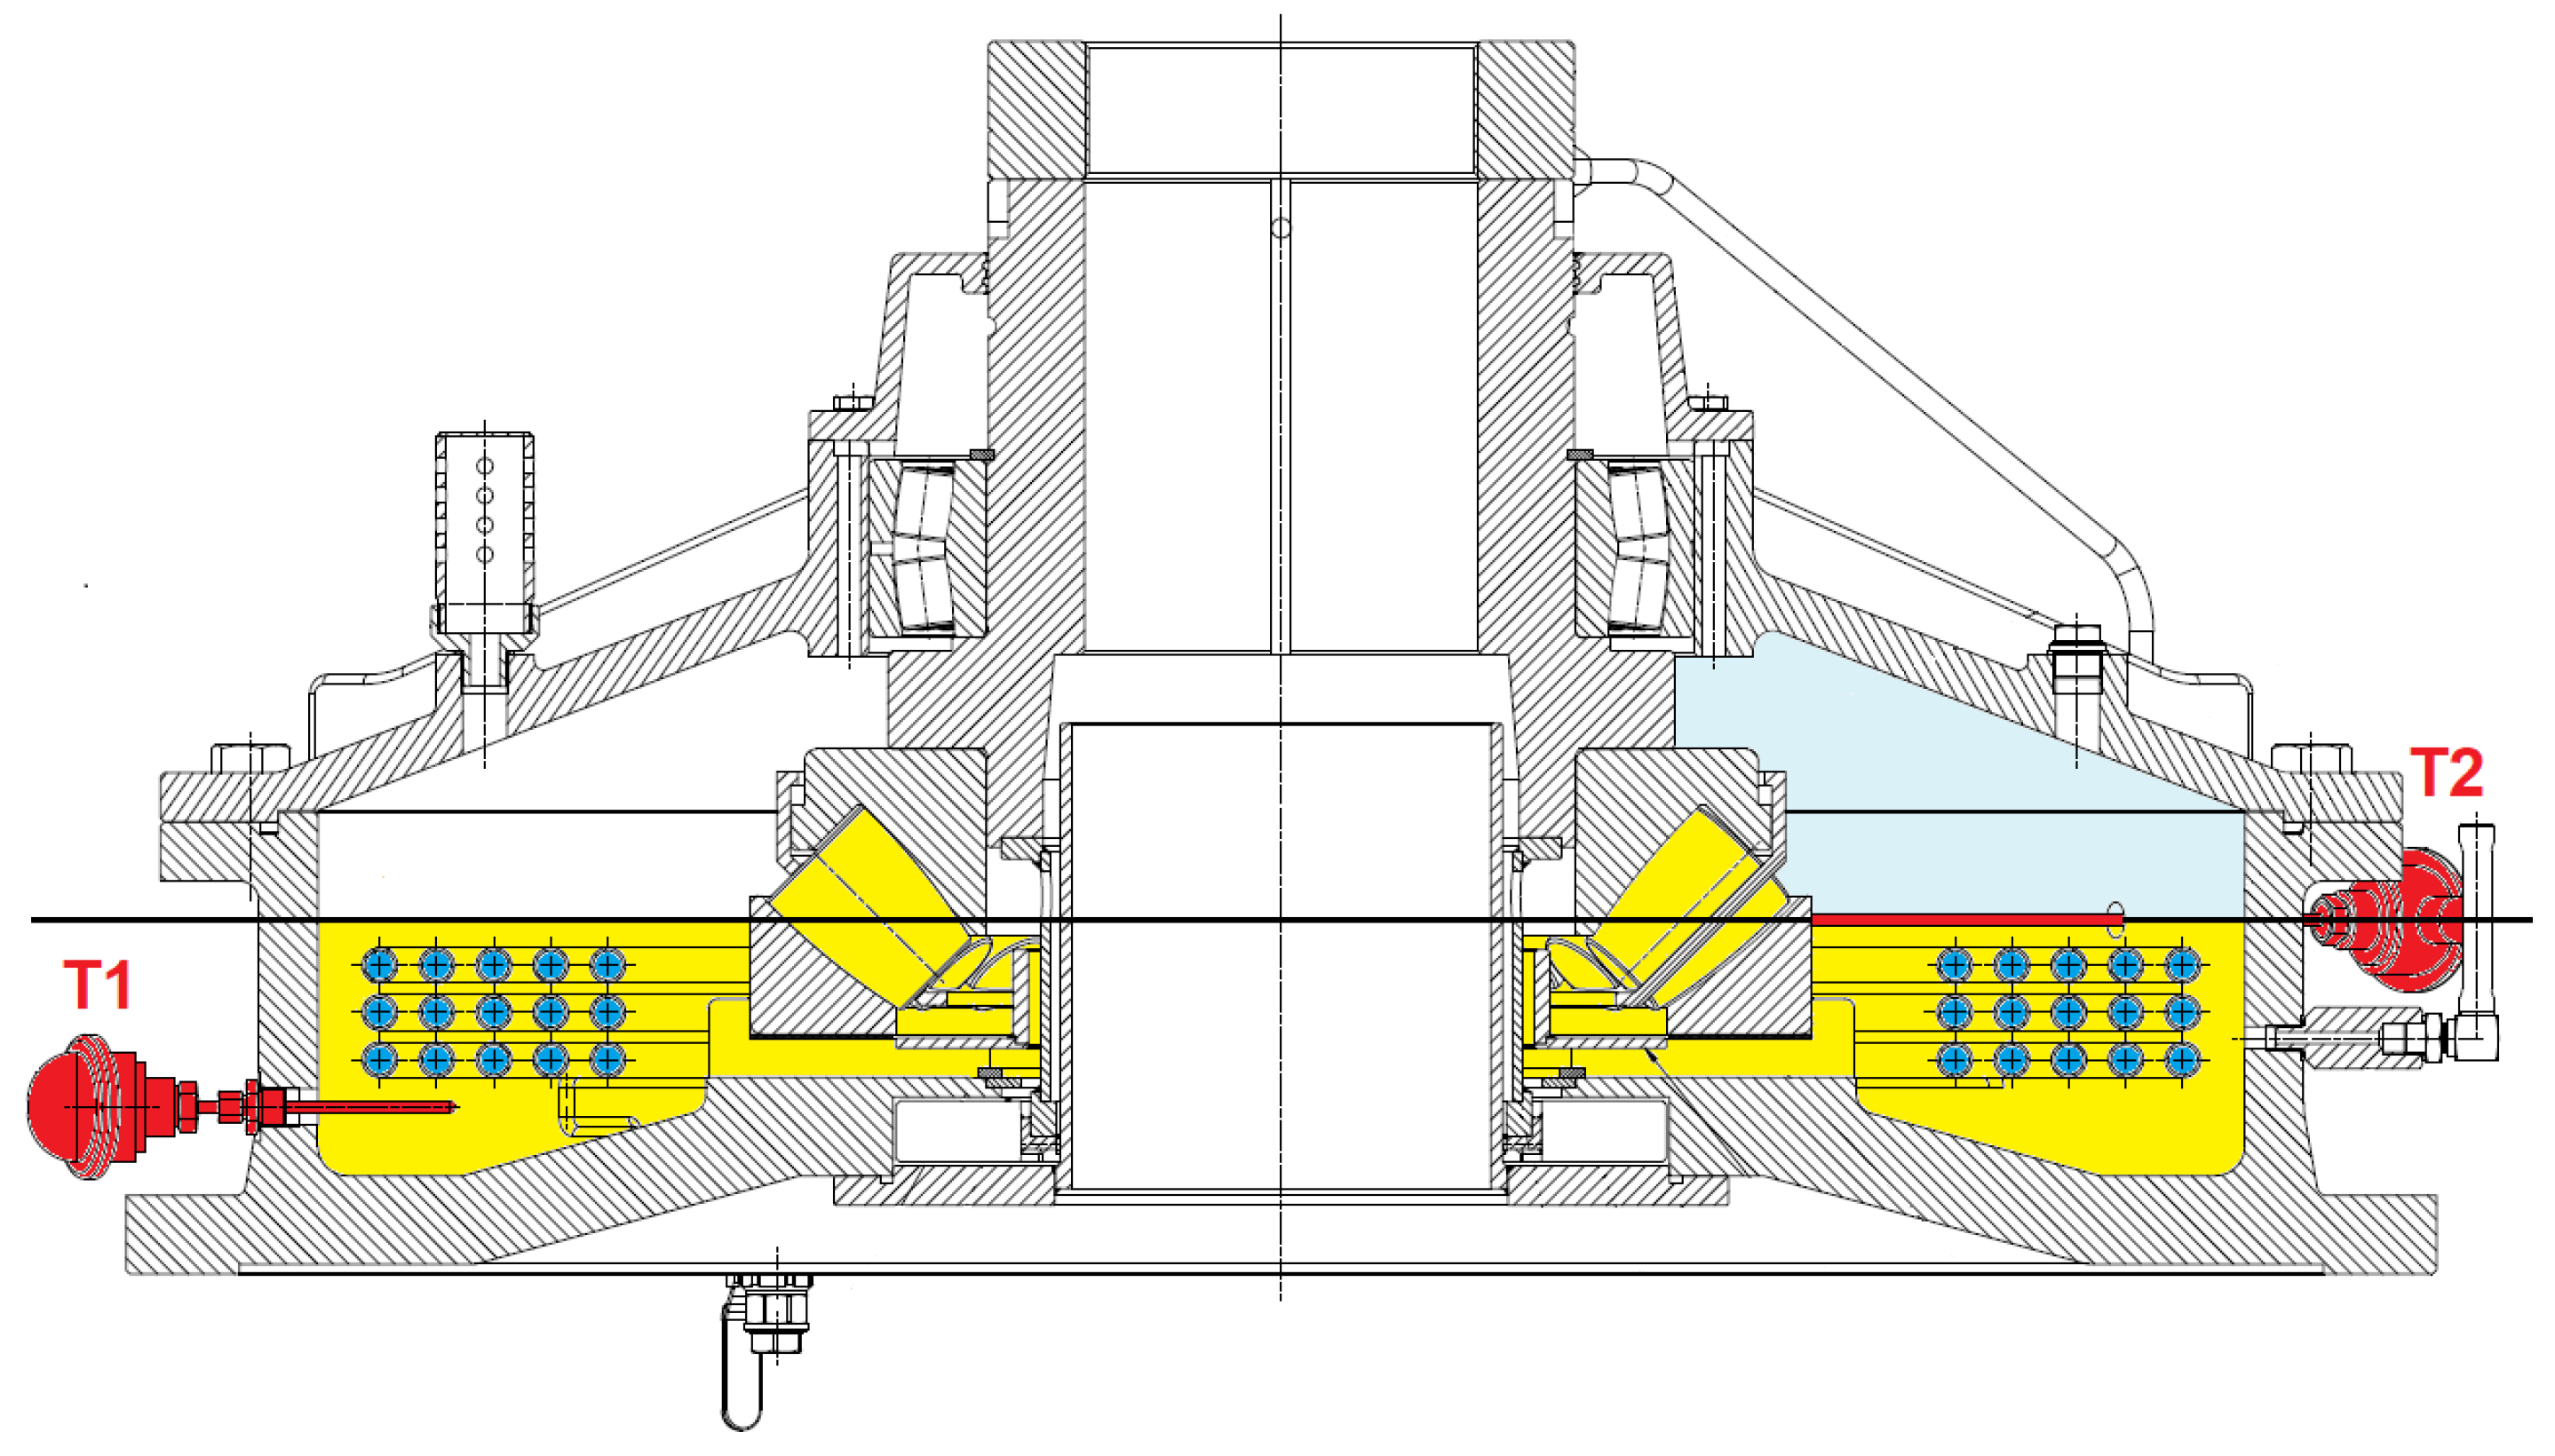
There is also a possibility to verify the simulation results by comparing the calculated temperatures with the measurements. The experiments were done with a real pump in the testing laboratories of the pump manufacturer SIGMA GROUP a.s., Lutin, CZ) with the following reduced parameters: shaft speed 266 rpm, water temperature 16.9 °C, ambient temperature 26.0 °C, standard oil level. For this reason, the numerical simulation was done for the same parameters, with the results shown in Table 4. There are two measurement positions, T1 and T2, described in Figure 24. The thermometer T1 measured the oil temperature in a free space, the thermometer T2 measured the oil temperature on the wall of the bearing. There are differences between the calculated and measured temperatures of 0.3 °C in position T1 and 0.4 °C in position T2. This is a good agreement, considering the fact that in the simulation, the housing wall was treated as the adiabatic one and the calculated temperatures were a little bit unsteady, which changed the values by about ±0.2 °C during the bearing revolutions.

Author Contributions

Conceptualization, M.S. and P.A.; methodology, M.S. and P.A.; CFD, M.S.; validation, M.S. and P.A.; investigation, M.S.; writing—original draft preparation, M.S.; writing—review and editing, M.S. and P.A.; visualization, M.S.; project administration, P.A.; funding acquisition, P.A. All authors have read and agreed to the published version of the manuscript.

Funding

This research was funded by the Ministry of Industry and Trade of the Czech Republic, funding ID 28645413.

Data Availability Statement

The data presented in this study are available on request from the corresponding author. The data are not publicly available due to the huge size of the datasets.

Conflicts of Interest

The authors declare no conflict of interest.

References

  1. Hu, J.; Wu, W.; Wu, M.; Yuan, S. Numerical investigation of the air–oil two-phase flow inside an oil-jet lubricated ball bearing. Int. J. Heat Mass Transf. 2014, 68, 85–93. [Google Scholar] [CrossRef]
  2. Wu, W.; Hu, C.; Hu, J.; Yuan, S. Jet cooling for rolling bearings: Flow visualization and temperature distribution. Appl. Therm. Eng. 2016, 105, 217–224. [Google Scholar] [CrossRef]
  3. Wu, W.; Hu, C.; Hu, J.; Yuan, S.; Zhang, R. Jet cooling characteristics for ball bearings using the VOF multiphase model. Int. J. Therm. Sci. 2017, 116, 150–158. [Google Scholar] [CrossRef]
  4. Wu, W.; Hu, J.; Yuan, S.; Hu, C. Numerical and experimental investigation of the stratified air-oil flow inside ball bearings. Int. J. Heat Mass Transf. 2016, 103, 619–626. [Google Scholar] [CrossRef]
  5. Wu, W.; Wei, C.; Yuan, S. Numerical simulation of ball bearing flow field using the moving particle semi-implicit method. Eng. Appl. Comput. Fluid Mech. 2022, 16, 215–228. [Google Scholar] [CrossRef]
  6. Yan, K.; Wang, Y.; Zhu, Y.; Hong, J.; Zhai, Q. Investigation on heat dissipation characteristic of ball bearing cage and inside cavity at ultra high rotation speed. Tribol. Int. 2016, 93, 470–481. [Google Scholar] [CrossRef]
  7. Ma, X.; Zhang, M.; Yang, F.; Xue, Y.; Gu, R.; Guo, N. Analysis of Circulation Characteristics and Heat Balance of High-Speed Rolling Bearing under Oil-Air Lubrication. Lubricants 2023, 11, 136. [Google Scholar] [CrossRef]
  8. Sun, J.; Fang, X.; Yao, J.; Guan, R.; Zhang, Z.; Zhang, G. Study on the Effect of Oil Supply on the Sound Field Characteristics of Full Ceramic Ball Bearings under Oil Lubrication. Lubricants 2023, 11, 146. [Google Scholar] [CrossRef]
  9. Zhu, G.; Li, L.; Xue, M.; Liu, T. A full-domain fluidic-thermal approach for a high-speed PMSM considering the bearing components. IET Electr. Power Appl. 2021, 16, 169–177. [Google Scholar] [CrossRef]
  10. Adeniyi, A.; Morvan, H.; Simmons, K. A Computational Fluid Dynamics Simulation of Oil–Air Flow Between the Cage and Inner Race of an Aeroengine Bearing. J. Eng. Gas Turbines Power 2017, 139, 012506. [Google Scholar] [CrossRef]
  11. Peterson, W.; Russell, T.; Sadeghi, F.; Berhan, M.T. Experimental and analytical investigation of fluid drag losses in rolling element bearings. Tribol. Int. 2021, 161, 107106. [Google Scholar] [CrossRef]
  12. Raju, K.S.; Veettil, M.P.; Ray, S.; Shi, F. Needle Roller Bearing Lubricant Flow CFD Simulations; SAE Technical Papers; SAE: Warrendale, PA, USA, 2013. [Google Scholar] [CrossRef]
  13. Gao, W.; Nelias, D.; Li, K.; Liu, Z.; Lyu, Y. A multiphase computational study of oil distribution inside roller bearings with under-race lubrication. Tribol. Int. 2019, 140, 105862. [Google Scholar] [CrossRef]
  14. Gao, W.; Lyu, Y.; Liu, Z.; Nelias, D. Validation and application of a numerical approach for the estimation of drag and churning losses in high speed roller bearings. Appl. Therm. Eng. 2019, 153, 390–397. [Google Scholar] [CrossRef]
  15. Tong, B.; Wang, G.; Sun, X. Investigation of the Fluid-Solid Thermal Coupling for Rolling Bearing under Oil-Air Lubrication. Adv. Mech. Eng. 2015, 7, 835036. [Google Scholar] [CrossRef]
  16. Zhu, W.; Zhu, R.; Tang, X.; Lu, F.; Bai, X.; Wu, X.; Li, F. CFD-Based Analysis of Oil and Gas Two-Phase Flow Characteristics in Double-Row Tapered Roller Bearings with Different Rib Structures. Appl. Sci. 2022, 12, 1156. [Google Scholar] [CrossRef]
  17. Feldermann, A.; Fischer, D.; Neumann, S.; Jacobs, G. Determination of hydraulic losses in radial cylindrical roller bearings using CFD simulations. Tribol. Int. 2017, 113, 245–251. [Google Scholar] [CrossRef]
  18. Hirt, C.W.; Nichols, B.D. Volume of fluid (VOF) method for the dynamics of free boundaries. J. Comput. Phys. 1981, 39, 201–225. [Google Scholar] [CrossRef]
  19. Zhao, J.; Liu, Z.; Lu, Y.; Hu, J. Numerical Modeling of Unsteady Oil Film Motion Characteristics in Bearing Chambers. Int. J. Turbo Jet Eng. 2015, 32, 233–245. [Google Scholar] [CrossRef]
  20. Lu, F.; Wang., M.; Liu, W.; Bao, H.; Zhu, R. CFD-based calculation method of convective heat transfer coefficient of spiral bevel gear in intermediate gearbox under splash lubrication. Ind. Lubr. Tribol. 2021, 73, 470–476. [Google Scholar] [CrossRef]
  21. Legrady, B.; Taesch, M.; Tschirschnitz, G.; Mieth, C.F. Prediction of churning losses in an industrial gear box with spiral bevel gears using the smoothed particle hydrodynamic method. Forsch Ingenieurwes 2022, 86, 379–388. [Google Scholar] [CrossRef]
  22. Mastrone, M.N.; Hartono, E.A.; Chernoray, V.; Concli, F. Oil distribution and churning losses of gearboxes: Experimental and numerical analysis. Tribol. Int. 2020, 151, 106496. [Google Scholar] [CrossRef]
  23. Cao, Z.; Chen, Y.; Su, T.; Liu, H.; Zang, L. Improvement in DCT Shaft Lubrication through CFD Method. SAE Int. J. Fuels Lubr. 2018, 11, 219–228. [Google Scholar] [CrossRef]
  24. Liebrecht, J.; Si, X.; Sauer, B.; Schwarze, H. Investigation of Drag and Churning Losses on Tapered Roller Bearings. J. Mech. Eng. 2015, 616, 399–408. [Google Scholar] [CrossRef]
  25. Maccioni, L.; Chernoray, V.G.; Mastrone, M.N.; Bohnert, C.; Concli, F. Study of the impact of aeration on the lubricant behavior in a tapered roller bearing: Innovative numerical modelling and validation via particle image velocimetry. Tribol. Int. 2022, 165, 107301. [Google Scholar] [CrossRef]
  26. Maccioni, L.; Chernoray, V.G.; Bohnert, C.; Concli, F. Particle Image Velocimetry measurements inside a tapered roller bearing with an outer ring made of sapphire: Design and operation of an innovative test rig. Tribol. Int. 2022, 165, 107313. [Google Scholar] [CrossRef]
  27. Hirt, C.W. Modeling Turbulent Entrainment of Air at a Free Surface; Report 01-12; Flow Science, Inc.: Santa Fe, NM, USA, 2012. [Google Scholar]
  28. Concli, F.; Schaefer, C.T.; Bohnert, C. Innovative Meshing Strategies for Bearing Lubrication Simulations. Lubricants 2020, 8, 46. [Google Scholar] [CrossRef]
  29. Maccioni, L.; Concli, F. Computational Fluid Dynamics Applied to Lubricated Mechanical Components: Review of the Approaches to Simulate Gears, Bearings, and Pumps. Appl. Sci. 2020, 10, 8810. [Google Scholar] [CrossRef]
  30. Liu, H.; Xu, H.; Ellison, P.E.; Jin, Z. Application of Computational Fluid Dynamics and Fluid–Structure Interaction Method to the Lubrication Study of a Rotor–Bearing System. Tribol. Lett. 2010, 38, 325–336. [Google Scholar] [CrossRef]
  31. Tauviqirrahman, M.; Jamari, J.; Wibowo, B.S.; Fauzan, H.M.; Muchammad, M. Multiphase Computational Fluid Dynamics Analysis of Hydrodynamic Journal Bearing Under the Combined Influence of Texture and Slip. Lubricants 2019, 7, 97. [Google Scholar] [CrossRef]
  32. Tauviqirrahman, M.; Jamari, J.; Wicaksono, A.A.; Muchammad, M.; Susilowati, S.; Ngatilah, Y.; Pujiastuti, C. CFD Analysis of Journal Bearing with a Heterogeneous Rough/Smooth Surface. Lubricants 2021, 9, 88. [Google Scholar] [CrossRef]
  33. Dhande, D.Y.; Pande, D.W. Multiphase flow analysis of hydrodynamic journal bearing using CFD coupled Fluid Structure Interaction considering cavitation. J. King Saud Univ. Eng. Sci. 2018, 30, 345–354. [Google Scholar] [CrossRef]
  34. Chatterton, S.; Pennacchi, P.; Vania, A.; Dang, P.V. Cooled Pads for Tilting-Pad Journal Bearings. Lubricants 2019, 7, 92. [Google Scholar] [CrossRef]
  35. Papadopoulos, C.I.; Kaiktsis, L.; Fillon, M. Computational Fluid Dynamics Thermohydrodynamic Analysis of Three-Dimensional Sector-Pad Thrust Bearings with Rectangular Dimples. ASME J. Tribol. 2014, 136, 011702. [Google Scholar] [CrossRef]
  36. Charitopoulos, A.G.; Visser, R.; Eling, R.; Papadopoulos, C.I. Design Optimization of an Automotive Turbocharger Thrust Bearing Using a CFD-Based THD Computational Approach. Lubricants 2018, 6, 21. [Google Scholar] [CrossRef]
  37. Liu, X.; Li, C.; Du, J. The Fluid-Structure-Thermal Performance Analysis of Gas Foil Thrust Bearing by Using Computational Fluid Dynamics. Lubricants 2022, 10, 294. [Google Scholar] [CrossRef]
  38. Ran, H.; Dai, P.; Yan, S.; Wang, F.; Yao, X.; Wang, J.; Zuo, G. Flow Mechanisms and Lubrication Performance of Water-Lubricated Thrust Bearings with Herringbone Grooves. Lubricants 2022, 10, 182. [Google Scholar] [CrossRef]
  39. Harris, T.A.; Kotzalas, M.N. Advanced Concepts of Bearing Technology: Rolling Bearing Analysis, 5th ed.; Taylor & Francis Press: New York, NY, USA, 2006. [Google Scholar]
  40. Wagner, W.; Cooper, J.R.; Dittmann, A.; Kijima, J.; Kretzschmar, H.-J.; Kruse, A.; Mareš, R.; Oguchi, K.; Sato, H.; Stöcker, I.; et al. The IAPWS Industrial Formulation 1997 for the Thermodynamic Properties of Water and Steam. ASME J. Eng. Gas Turbines Power 2000, 122, 150–182. [Google Scholar] [CrossRef]
  41. Paramo Industrial Lubricants; PARAMO a.s.: Pardubice, Czech Republic, 2017. Available online: http://paramo.com.hr/pdf/Paramo-Industrial-lubricants.pdf (accessed on 27 June 2023).
  42. ANSYS. CFX-Solver Theory Guide Release 2020 R1; ANSYS, Inc.: Canonsburg, PA, USA, 2020. [Google Scholar]
  43. Menter, F.R. Two-equation eddy-viscosity turbulence models for engineering applications. AIAA J. 1994, 32, 1598–1605. [Google Scholar] [CrossRef]
  44. Raje, P.; Sinha, K. Anisotropic SST turbulence model for shock-boundary layer interaction. Comput. Fluids 2021, 228, 105072. [Google Scholar] [CrossRef]
Figure 1. (a) View in 3D of pump with bearing housing; (b) detail of bearing housing design.
Energies 16 06890 g001
Figure 2. Sectional view. (a) Standard oil level (SOL) and high oil level (HOL); (b) computational domain representing bearing housing with return channels (in light blue and yellow colors).
Energies 16 06890 g002
Figure 3. Computational 3D model. (a) Top view with uncovered bearing; (b) bottom view with detail of oil return channels.
Energies 16 06890 g003
Figure 4. Details of computational model. (a) Shape and position of cooling spiral; (b) rollers with cage.
Energies 16 06890 g004
Figure 5. Oil kinematic viscosity as a function of local temperature.
Energies 16 06890 g005
Figure 6. Details of computational grid. (a) Roller surface mesh; (b) housing mesh.
Energies 16 06890 g006
Figure 7. Details of computational model. (a) Radial and cage clearances; (b) radial clearance mesh topology.
Energies 16 06890 g007
Figure 8. Velocity streamlines on one roller viewed from cage’s moving reference frame, direction from outer raceway. SOL. (a) Inner raceway is viewed; (b) outer raceway is viewed.
Energies 16 06890 g008
Figure 9. Distribution of wall shear stress and absolute pressure on one roller viewed in direction from outer raceway. SOL. (a) Wall shear stress; (b) absolute pressure.
Energies 16 06890 g009
Figure 10. Distribution of oil volume fraction on one roller. SOL.
Energies 16 06890 g010
Figure 11. Oil level during the rotation of bearing. (a) SOL; (b) HOL.
Energies 16 06890 g011
Figure 12. Distribution of oil volume fraction inside bearing and housing. Cross-section. (a) SOL; (b) HOL.
Energies 16 06890 g012
Figure 13. Distribution of temperature on inner wall (top) and outer wall (bottom) of cooling spiral. SOL.
Energies 16 06890 g013
Figure 14. Velocity streamlines in vicinity of cooling spiral. Cross-section of bearing housing. SOL.
Energies 16 06890 g014
Figure 15. Circulation of velocity characteristic lines in vicinity of cooling spiral. Cross-section of bearing housing. SOL.
Energies 16 06890 g015
Figure 16. Velocity streamlines close to housing wall. Bottom view. SOL.
Energies 16 06890 g016
Figure 17. Distribution of temperature on bearing housing. SOL. (a) Top view; (b) bottom view.
Energies 16 06890 g017
Figure 18. Distribution of temperature inside bearing. SOL. (a) Top view; (b) bottom view.
Energies 16 06890 g018
Figure 19. Location of maximum temperatures inside bearing. SOL.
Energies 16 06890 g019
Figure 20. Distribution of temperature on bearing housing. HOL. (a) Top view; (b) bottom view.
Energies 16 06890 g020
Figure 21. Distribution of temperature inside bearing. HOL. (a) Top view; (b) bottom view.
Energies 16 06890 g021
Figure 22. Distribution of temperature inside bearing and housing. Cross-section. (a) SOL; (b) HOL.
Energies 16 06890 g022
Figure 23. Location of maximum temperatures inside bearing. HOL.
Energies 16 06890 g023
Figure 24. Temperature measurement positions (in red). SOL, reduced parameters. Oil is highlighted in yellow, air in light blue, thermometers in red.
Energies 16 06890 g024
Table 1. Roller bearing specifications.
StructureDimension/Number
Inner diameter/mm300
Outer diameter/mm540
Number of rollers/-18
Roller maximum diameter/mm69
Inner ring rotary speed/rpm497
Roller rotary speed/rpm1558
Cage rotary speed/rpm221
Table 2. Material properties of oil and steel.
PropertyOL-J46/ISO VG461.4541/AISI 321
Density/kg m−38637900
Specific heat capacity/J kg−1 K−11983500
Thermal conductivity/W m−1 K−10.133315
Kinematic viscosity at 40° C/m2 s−147.33 × 10⁻⁶-
Viscosity index/-95-
Table 3. Mass flow rate through bearing. HOL.
Radial ClearanceCageNumber of Grid PointsOil Mass Flow Rate
0.9/mmNo67.3/mil.5.67/kg s−1
0.9/mmYes71.8/mil.5.52/kg s−1
0.54/mmYes78.1/mil.5.41/kg s−1
0.34/mmYes90.4/mil.5.39/kg s−1
Table 4. Comparison of measured and calculated temperatures. SOL, reduced parameters.
Measurement PositionExperimentCalculation
T131.0/°C31.3/°C
T231.8/°C32.2/°C
Disclaimer/Publisher’s Note: The statements, opinions and data contained in all publications are solely those of the individual author(s) and contributor(s) and not of MDPI and/or the editor(s). MDPI and/or the editor(s) disclaim responsibility for any injury to people or property resulting from any ideas, methods, instructions or products referred to in the content.