Abstract
The Benxi Formation is one of the most important gas-producing layers in the Ganquan–Fuxian area, but the complex gas–water distribution and lack of sandstone have severely constrained natural gas exploration and development in this area. This study analyzed the structure, paleogeomorphology, sedimentary facies, reservoir closures, and gas–water distribution of the Benxi Formation in the study area through drilling, coring, logging, seismic surveying, and experimental testing. The results show that the gas reservoirs in the Benxi Formation are mainly lithologic traps distributed along NW-trending barrier sandstones, with a small portion of updip pinchout closures. The water layers are mainly composed of thin sandstones with a single-layer thickness of less than 2 m, which are tidal-channel or barrier-margin microfacies sandstones. The water saturation in some thick sandstones is related to the activity and destruction of large individual faults. The dry layers are tight sandstones with porosity of less than 3.2%, mainly associated with high amounts of volcaniclastic matrix and lithic fragments, as well as compaction. The charging of the underlying high-quality Ordovician limestone reservoirs by carboniferous source rocks in the Benxi Formation reduces the probability of gas accumulation in Benxi sandstone. Based on the control of sedimentary facies and physical properties on gas accumulation, favorable reservoir distributions were predicted using seismic attributes and gas detection methods, providing the basis for the next phase of natural gas exploration and development in this area.
1. Introduction
The Ganquan–Fuxian area is located in the southeastern Ordos Basin and has an area of approximately 2700 km2. In addition to the main gas reservoir of the Benxi Formation, the Ordovician karst reservoir is a gas-producing reservoir in western Ganquan County. By the end of December 2021, 68 wells had been tested in the Benxi Formation, 40 of which obtained various natural gas flows and 28 of which reached commercial flows, with daily gas production exceeding 50 × 104 m3 for many wells. However, some wells did not encounter sandstone, and some drilled sandstone tested as dry or water-rich layers. Therefore, the gas accumulation pattern in the Benxi Formation is very complex, resulting in high exploration and development risks.
Previous studies have extensively investigated the gas accumulation features of the Paleozoic reservoirs in the Ordos Basin. It is widely accepted that Ordos Basin natural gas originates from Paleozoic coals [1], featuring extensive hydrocarbon generation coverage and large-scale gas accumulation [1,2]. The major gas-charging period was during the Late Jurassic to the Early Cretaceous periods [3,4,5]. The Benxi Formation is the first set of marine clastic rock strata on the North China Craton formed after the denudation of the Early Paleozoic carbonate strata for approximately 140 million years [6]. The lithology is mainly composed of quartz sandstone interbedded with mudstone and minor coal seams. The main pore types in sandstone are residual intergranular pores and intergranular dissolution pores [7,8]. Most studies suggest that the gas-bearing Benxi Formation reservoirs have ultralow porosity and ultralow permeability [9], while some regard them as quasi-continuous tight gas reservoirs [10]. The average porosity and permeability of the gas-bearing Benxi Formation sandstones in the Ganquan–Fuxian area are 2.9% and 0.8141 × 10⁻³ μm2, respectively, indicating extra-low porosity and permeability [9,11]. The lower limit of effective reservoir porosity is 4%, and that of permeability is 0.07 × 10⁻³ μm2 [12]. Previous studies have investigated the reservoir characteristics and diagenetic evolution of Benxi Formation sandstone using various experimental techniques and established a quantitative model for pore evolution [9]. It is believed that processes including sedimentation, compaction, early cementation, dissolution, and late cementation have together controlled the porosity changes in the Benxi Formation reservoirs [13]. The diagenetic fluid properties and source-rock conditions of the Benxi Formation have jointly affected the development of dissolution pores. The gas content in the reservoirs is controlled by multiple factors, and the evaluation of gas-reservoir potential needs to consider the differences in depositional environments [14]. During the depositional period of the Benxi Formation, the Ordos Basin was in a marine–continental transitional sedimentary environment. With frequent shoreline movements, previous studies investigated the depositional environments of the Benxi Formation using methods such as establishing a sequence stratigraphic framework [15]. The microfacies of the Benxi Formation sandstone reservoirs in the central–southern basin are mostly barrier-bar sandstones [5,16], with some possible tidal-channel, tidal-delta [17], fan-delta [18], or shallow-water-deltaic sandstones [19]. There are two opinions on the provenance direction of the Benxi Formation in the Yan’an area. Some suggest that the provenance direction of the Benxi Formation in the Yan’an area is mainly northeast, with clastic materials being sourced from the Yinshan Orogenic Belt and the southern margin of the North China Craton [8]. However, others argue that the provenance is mainly the metamorphic rock-enriched East Qilian and West Qinling Orogenic Belts in the southwest [20,21]. The Benxi Formation reservoirs are predominantly under-pressured to normally pressured, with local areas of weak overpressure [15,18,22,23]. The above studies have elucidated the basic characteristics of the Benxi Formation reservoirs from various perspectives, but the discussions on the key factors controlling reservoir development and gas–water distribution patterns are insufficient, making it difficult to guide exploration and development in the Ganquan–Fuxian area.
This study comprehensively utilizes geological, well-logging, seismic, and test data to analyze the structure, paleogeomorphology, source rock, sedimentary facies, and reservoir characteristics of the Benxi Formation gas reservoirs; clarifies the key factors controlling gas accumulation and gas–water distribution; and further proposes favorable exploration and development areas for the Benxi Formation based on these analyses.
2. Geological Settings and Data
The Ordos Basin is divided into six first-order tectonic units [21]: Yimeng Uplift, Weibei Uplift, Jinxi Bending Fold Belt, Yishan Slope, Tianhuan Depression, and Western Thrust Fault Belt (Figure 1a). The study area is located on the Yishan Slope [22], whose overall tectonic morphology is high in the east and low in the west, high in the north and low in the south, forming a gentle monocline dipping to the west (Figure 1b). It is characterized by poorly developed faults [23,24], weak magmatic activity, flat strata, and barely developed folds. During the Late Carboniferous Benxi Period, in the study area, marine–continental transitional facies developed [23,25,26,27], including sandstone, coal seams, dark mudstone, and limestone, representing overall coastal debris deposition, with sandstone mainly occurring as barrier [28,29,30], tidal-channel, and shallow-shoal microfacies [31,32,33,34] (Figure 2). The Paleozoic hydrocarbon source rocks in the study area were coal-bearing formations, mainly occurring in the Benxi Formation and Shanxi Formation, with widespread planar distributions, thicknesses of 5–20 m, and depositional environments with interactive marine–continental sedimentation, so that the source rocks generally include plant and brachiopod fossil assemblages [11,35,36]. The source rock lithology is dominated by coal, followed by dark mudstone. The caprocks are composed of Benxi mudstones and Taiyuan micrite limestones (Figure 1c).
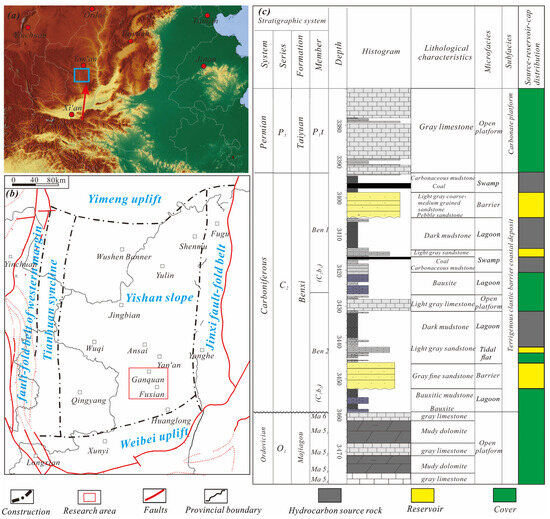
Figure 1.
(a) The location of the Ordos Basin; (b) the substructural units and location map of the Ganquan–Fuxian area in the Ordos Basin; (c) stratigraphy, lithology, and sedimentary facies from the Ordovician to Permian in the study area.
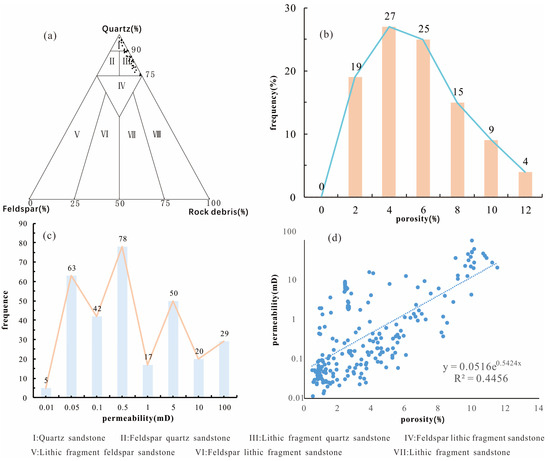
Figure 2.
(a) Triangular diagram of quartz, feldspar, and cuttings in the sandstone of the Benxi Formation in the study area; (b) histogram of the porosity distribution of the Benxi Formation in the study area; (c) permeability distribution histogram of the Benxi Formation in the study area; (d) relationship between porosity and permeability in the Benxi sandstone reservoirs in the study area.
The reservoirs in the study area were mainly composed of grayish white fine conglomerates, pebbly sandstone, and coarse to fine sandstone. Various sedimentary structures had been developed, including normal grading, tabular cross bedding, trough cross bedding, low-angle cross bedding or parallel bedding, and bioturbation. The sandstone bottom boundaries were mostly sharp contacts or scour to mudstone, with less gradual transitions. The clastic components were predominantly quartz, over 90% (Figure 2a), and mostly monocrystalline quartz with minor quartzite and chert grains and sporadic volcanic or sedimentary rock fragments. The detrital components were subangular to subrounded, with moderate to good sorting. The measured porosity of sandstone cores was mainly distributed between 2% and 8% (Figure 2b), with an average of 3.75%, a maximum of 12.94% and a minimum of 1.46%; the measured permeability mainly ranged from 0.05 to 5 mD (Figure 2c), with an average of 1.15 mD, a maximum of 96.1 mD and a minimum of 0.01 mD. Porosity and permeability showed a weak correlation, with a coefficient R2 of 0.4456 (Figure 2d). The cements were calcareous with point or line contacts, containing intergranular dissolution pores and illite intercrystalline micropores. In addition, the Benxi Formation in the study area mainly contained lenticular lithologic gas reservoirs.
The 2D seismic data, well logging data and some experimental data used in this study were provided by Shaanxi Yanchang Petroleum (Group) Co., Ltd., Yan’an, China. The 2D seismic data were acquired, processed and interpreted by the Bureau of Geophysical Prospecting INC., China National Petroleum Corporation, Zhuozhou, China, consisting of 35 2D seismic survey lines extending along valleys with uneven line spacing of approximately 3–10 km. A total of 360 wells were drilled, and the well logging suites included natural gamma ray (GR), spontaneous potential (SP), acoustic transit time (AC), and resistivity (RT). In addition to some physical rock samples collected and analyzed in this project, the remaining sample tests were completed by Shaanxi Yanchang Petroleum (Group) Co., Ltd.
The rock physical property test, casting thin section, and scanning electron microscope techniques involved in this paper were completed by the Xi’an Alberta Environmental Analysis and Testing Technology Co., Ltd, Xi’an City, China and the State Key Laboratory of Continental Dynamics of Northwest University, Xi’an City, China. The water saturation of rocks is determined using a fluid saturation meter (BH-1). The relationship curve between gas–water relative permeability and water saturation was mapped using an HBXS-70 high-temperature and high-pressure two-phase fluid experiment. The scanning electron microscope used was a field emission scanning electron microscope, model FEI Quanta 400 FEG.
3. Relationship between Gas Well Distribution and Coal Source Rocks
To study the relationship between the gas reservoirs of the Benxi Formation and hydrocarbon source rocks, a well production rate map superimposed on an isopach map of the Benxi Formation (Figure 3) and a cumulative thickness map of the coal seams of the Benxi Formation (Figure 4) in the Ganquan–Fuxian block were constructed. Figure 3 can also be considered a paleogeomorphologic map of when the Benxi Formation was deposited. This shows that during Benxi Formation deposition, the top of the Ordovician strata displayed an overall ancient karst slope dipping to the northeast, superimposed with two ancient karst highlands and depressions extending to the northwest and arranged parallel to each other. The producing wells are mainly distributed on the slopes between the ancient karst depressions and highlands in the northeastern part of the study area.
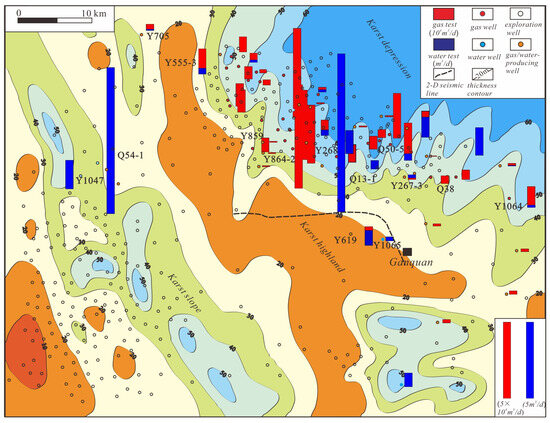
Figure 3.
The isopach map of the Benxi Formation, superimposed with well gas productivity in the Ganquan–Fuxian area.
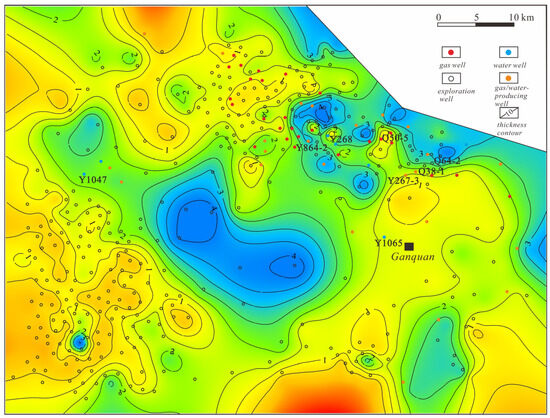
Figure 4.
Thickness map of cumulative coal seams of the Benxi Formation in the Ganquan–Fuxian area.
Figure 4 shows that the cumulative thickness of the coal measure source rocks in this area was generally 1–5 m. The coal-thickened areas of 3–5 m were located in the central and northeast parts of the study area and did not overlap the intensive distribution of producing wells in the Benxi Formation. Thus, the distribution of source rocks is not the main factor controlling the enrichment of gas reservoirs in the Benxi Formation in the study area.
4. Relationship between the Distribution and Structure of High-Yield Gas Wells
The top and bottom surfaces of the Benxi Formation in the study area are both west-dipping slopes, locally superimposed with a small nose-like structure in the east, with the axial part 10–25 m higher than the flanks. The bottom structural contour of the Benxi Formation has a slightly greater flexure than the top. Comparing Figure 3 and Figure 5, it can be seen that the distribution of producing wells and high-production wells has no obvious correlation with the local nose structure on the top of the Benxi Formation. Although there are local elevational differences of approximately 10–25 m between the convex and concave noses on the top of the Benxi Formation, both gas wells and dry holes occur on both noses (Figure 5). Wells with daily production exceeding 500,000 cubic meters are located both in the ancient convex nose, e.g., Well Q50-5, and in the concave nose, e.g., Well Y864-2. Most sandstone gas reservoirs in the Benxi Formation have lenticular traps, with only a few having updip pinch-out traps. Therefore, structure is not one of the main factors controlling reservoir enrichment in the Benxi Formation in the study area.
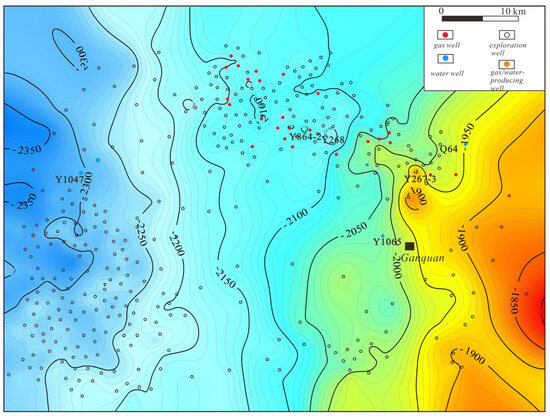
Figure 5.
Structural map of the top Benxi Formation in the study area.
5. Relationship between the Distribution of High-Yield Gas Wells and Paleogeomorphology and the Source-Reservoir Allocation of the Lower Paleozoic Strata
To further study the relationship between paleogeomorphology and hydrocarbon reservoirs, a paleogeologic map of the pre-carboniferous strata in the study area was compiled (Figure 6a). This map shows that the exposed strata at the top of the Ordovician Majiagou Formation changed progressively from northeast to southwest in the study area, consisting of submembers Ma6, Ma 51, Ma 52, Ma 53, and Ma 54, among which the most strongly eroded Ma 54 outcrop area was roughly consistent with the ancient karst grooves in Figure 3. The gas-producing wells in the Benxi Formation are mainly distributed in the Ma6 submember. The main reason for the lack of gas pools in the southwestern part of the study area is that the Ordovician limestone in this area formed gas reservoirs, which diluted or hindered the formation of sandstone gas pools in the Benxi Formation. The Paleozoic source rocks are juxtaposed with the underlying Paleozoic carbonate rocks, forming a favorable source-reservoir configuration and facilitating hydrocarbon accumulation in the Ma 5 carbonate reservoirs of the Ordovician Ma 51, Ma 52, and Ma 53, which shunted part of the natural gas migration and accumulation, thus reducing the probability of enrichment in the Benxi Formation (Figure 6b). In fact, the Ordovician Majiagou Formation in the southwestern Ganquan–Fuxian area is the main producing zone. Therefore, paleogeomorphology is one of the main factors controlling the enrichment of reservoirs in the Benxi Formation in the study area. The eastern paleokarst depression is dominated by reservoirs in the Benxi Formation, while the western depression has combined reservoirs in both the Benxi Formation and Ordovician Majiagou Formation.
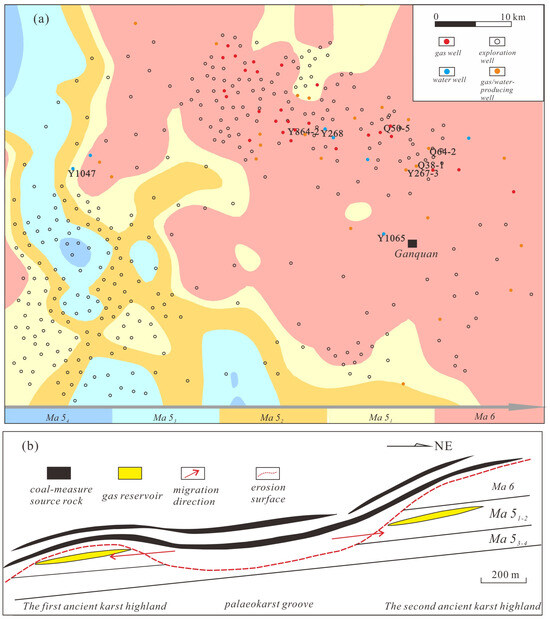
Figure 6.
(a) Pre-carboniferous paleogeological map. (b) A sketch chart of the Ordovician gas-pool-formation model in the southwestern study area.
6. Control of Sedimentary Facies and Reservoir Distribution on Gas Reservoirs
The Benxi Formation in the study area is a tidal flat-lagoon-barrier depositional system, with sand bodies exhibiting a northwest-trending depositional chain [9]. In terms of paleogeomorphology, barrier bars were mainly distributed on the slopes between ancient karst highlands and grooves. Multiple stages of sand bodies were vertically stacked. Both the Ben 1 (upper) and Ben 2 (lower) members developed eastern and western barrier bars, respectively (Figure 7). Some tidal flat, channel, and tidal delta sandstone facies occurred between the barrier margins and between barriers [30,31]. The existence of double barriers [37,38,39] may be related to sea level rise and barrier migration during the early and middle depositional stages of the Benxi Formation [40] or to the occurrence of relatively strong hydrodynamic conditions between ancient karst highlands and grooves. With the sea level rise, the barrier in the Ben 2 member migrated approximately 5 km southwest compared to that in the Ben 1 member.
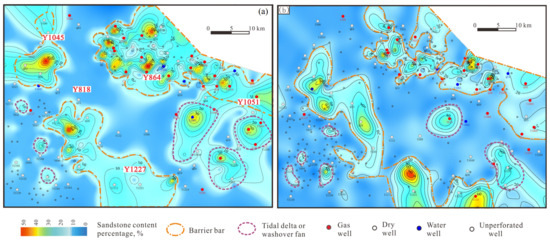
Figure 7.
The sandstone content percentage and depositional facies map of Ben 1 (a) and Ben 2 (b) in the Ganquan–Fuxian area.
The gas-producing wells in the Benxi Formation are mainly located within thick sand bodies with favorable petrophysical properties inside barrier sand ridges, showing very good correlation with the sandstone microfacies. Due to the aforementioned shunting effect of reservoirs in the Ordovician on gas supply, gas-bearing reservoirs in the Benxi Formation in the study area occurred mainly in the eastern barrier sandstones, while the western barrier sandstones are only locally gas-bearing. Well logging interpretations indicate that some wells in the western barrier have gas pay potential in the Benxi Formation, but fewer gas wells would be needed as the gas-bearing layers are thinner and smaller than those in the eastern barrier. The tidal flat and lagoonal subfacies of the Benxi Formation between the two barriers have poorly developed sandstones and very low potential to produce gas.
Therefore, reservoirs in the Benxi Formation in the study area are mainly distributed in thicker sandstones inside barrier sandstones. The eastern barrier has a better gas-bearing capacity than the western barrier, with a greater thickness, area, and number of lenticular gas pools.
7. The Distribution of Gas-Bearing, Water-Bearing, and Dry Sandstone and Its Controlling Factors
7.1. Logging Identification of the Gas-Bearing, Water-Bearing, and Dry Layers in the Benxi Formation
Testing was completed for a total of 61 wells in the entire area in the Benxi Formation. Based on the test results and the well logging interpretation, we made cross-plots of water saturation vs. porosity (Figure 8a) and resistivity vs. acoustic (Figure 8b) to determine the well logging criteria for identifying gas-bearing, water-bearing, and dry layers in the Benxi Formation in the study area.
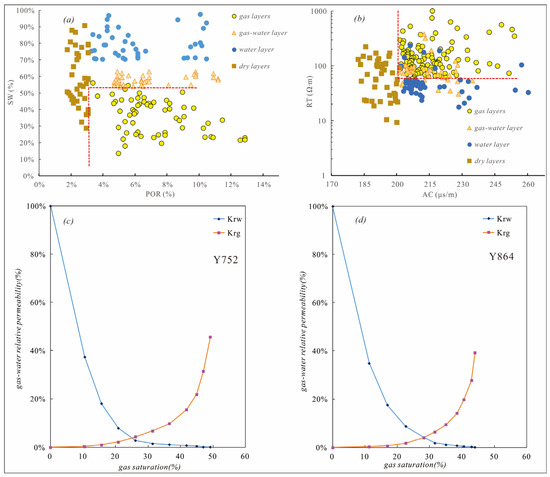
Figure 8.
Identification diagram of gas, water, and dry sandstone in the Benxi Fm. (a) Cross-plots of porosity (POR) vs. water saturation (SW); (b) cross-plots of acoustic (AC) vs. resistivity (RT); (c) and (d) relative water–gas phase permeability curves of WellsY753 and Y864 of the Benxi Formation in the study area.
The gas-bearing sandstones in the Benxi Formation had effective porosity POR ≥ 3.2%, water saturation Sw < 52%, acoustic transit time AC between 200 and 260 μs/m, and deep induction resistivity RT between 60 and 1000 Ωm. Gas–water transition zones had POR ≥ 3.2% and Sw = 52–60%; gas- and water-bearing layers had POR ≥ 3.2% and 60% < Sw ≤ 72%; water-bearing layers had POR > 3.2% and Sw > 72%; and dry layers had POR < 3.2%.
The relative gas–water phase permeability analysis of two sandstone samples from the Benxi Formation in the study area indicated that the water saturations of the gas–water transition zones are 58–88% and 49–90%, respectively, and pure gas zones have Sw values less than 49–58% (Figure 8c,d), which is quite close to the well logging criteria.
7.2. Distribution of Gas Reservoirs in the Benxi Formation
Based on the above well logging criteria for identifying gas-bearing, water-bearing, and dry layers, we identified gas-bearing layers and gas–water transition layers in the Benxi Formation for all 360 wells in the area and statistically analyzed the depth, thickness, average porosity, and water saturation of each gas-bearing layer, providing the basis for analyzing gas–water distribution patterns and predicting favorable areas for development.
According to the comprehensive well logging interpretation, cumulative thickness maps of gas zones and water-bearing layers in the Benxi Formation in the study area were generated. Taking the effective thickness and average porosity maps of gas zones in the Ben 1 member as an example, gas zones were mainly distributed in the northern part of the eastern barrier, with a maximum gas accumulation thickness of approximately 16 m. Individual gas pools had isolated oval shapes of 2 km × 3 km axes, with approximately 26 isolated pools in the eastern barrier, mostly exhibiting a northwestern chain-like distribution, and only 6 isolated barrier pools in the western barrier (Figure 9). The thickness of most single gas-bearing sandstone layers was greater than 4 m. The average porosity of sandstones at the centers of barrier bars was higher, generally above 3.2% at gas well locations, with a maximum of approximately 8%.
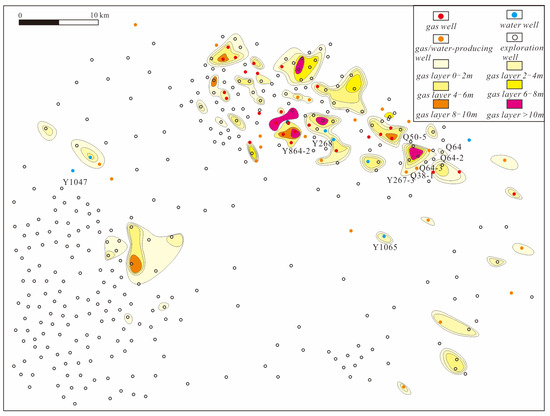
Figure 9.
Effective thickness map of the gas reservoir of Ben 1 Mem.
In well-linked cross-sections of gas pools, the gas-bearing sandstones showed lenticular distributions, extending approximately 2–5 km, with alternating gas-bearing, water-bearing, and dry layers within the same stratigraphic interval, reflecting pronounced heterogeneity for some sand bodies (Figure 10). The gas pools were predominantly lenticular traps, with occasional updip pinch-out traps with edge or bottom water.
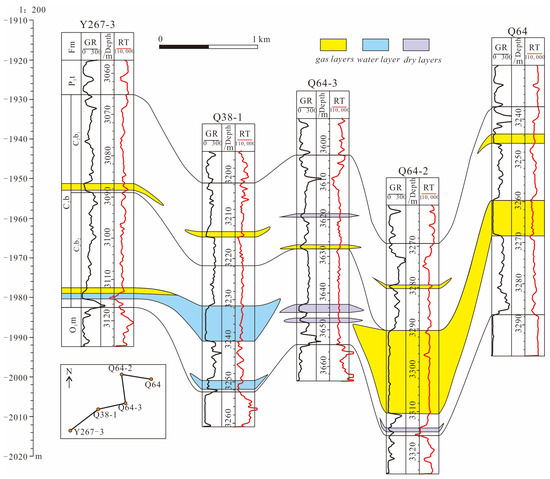
Figure 10.
Gas reservoir profile of the Benxi Formation across Well Q267-3-Q38-1-Y64-3-Y64-2-Q64 in the southern part of the eastern barrier bar.
7.3. Distribution of Water-Bearing Layers and Genesis of the Thick Water-Bearing Layers in the Benxi Formation
Water-bearing sandstones are mainly distributed in thinner deposits on barrier margins (Figure 11). Except for at wells Y1047 and Y268, the cumulative sand thickness of the water-bearing layers in the Benxi Formation is less than 5 m, and mostly less than 2 m for an individual sandstone. This may be related to the higher mud content, lower porosity, insufficient gas-bearing saturation, and poorer gas-reservoir-forming conditions in thin sandstone layers. Except for well Y1065, water-producing wells were located in areas with average sandstone porosities less than 3.2%.
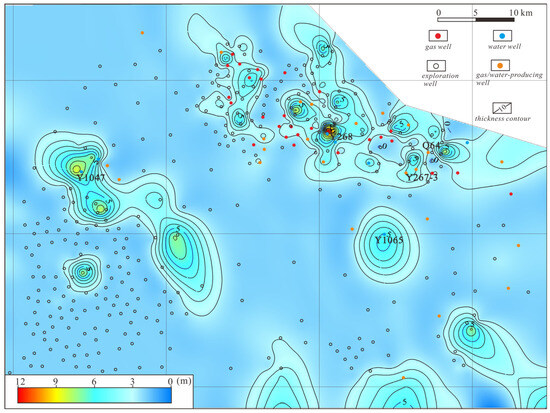
Figure 11.
Aqueous sandstone thickness map of the Benxi Formation in the Ganquan–Fuxian area.
Thicker water-bearing layers seldom occur. For example, an 8.3 m water-bearing layer was encountered in the Benxi 2 member at Well Q38-1, with surrounding wells showing gas-bearing sandstone (Figure 10). Based on 2D seismic data, there are tensile–shear faults cutting through the Paleozoic strata in the study area, extending northeast, with fault offsets of approximately 150 ms (approximately 200 m) in places (Figure 12), terminating upward below the top Permian surface. Such NE-trending faults cutting through sub-Permian strata are also visible in 3D seismic data along the southern margin of the basin [41]. Since there is no 2D seismic line crossing well Q38-1 in Figure 10, it is speculated that the thick water-bearing sandstone in this well may be related to reservoir destruction by a fault connecting the upper and lower water-bearing sandstones to the Benxi Formation. However, the high-water-production area in Figure 3 coincides precisely with the NE extension of the major fault zone in Figure 12.
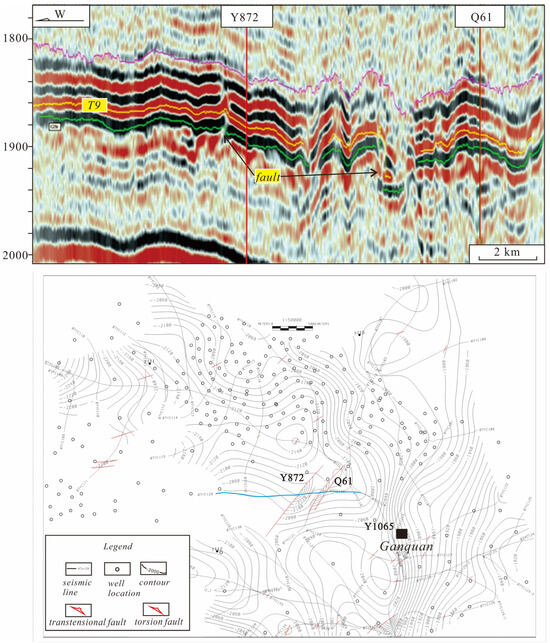
Figure 12.
The 07YC120 conventional seismic profile in the Ganquan area and isoline map of the top structure of the Benxi Formation in the study area.
7.4. Discussion on the Cause of Dry Sandstones in the Benxi Formation
The dry sandstones in the Benxi Formation are sandstones that did not produce fluids during testing due to poor reservoir properties, with AC log values less than 200 μs/m and calculated porosities less than 3.2% (Figure 8a,b).
Core examinations show that there are two types of sandstones in the Benxi Formation in the Ganquan–Fuxian area: “white sandstones” and “black sandstones”. The former are light gray sandstones with relatively thick single layers or cumulative thicknesses, accounting for approximately 90% of the sandstones; they are generally coarse-grained and dominated by medium- to coarse-grained sandstones and gravelly sandstones. The latter “black sandstones” are dark gray sandstones with thin single bed thicknesses, generally 0.2–2 m; they contribute only approximately 10% of the total sandstone thickness, are generally fine-grained and dominated by medium- to fine-grained tight sandstones, occur in the Ben 1 member and/or the Ben 2 member, and are often interbedded within white sandstones and transitional with them. The “black” and “white” sandstones have similar well logging responses and are difficult to distinguish.
Cast thin sections show that the white sandstones contain over 90% quartz, generally 95%, representing pure quartz arenite sandstones, with plane porosities of 6–10% and mainly residual intergranular pores and dissolution pores in the rock fragments and mud cements (Figure 13a–d). The black sandstones are tuffaceous sandstones and lithic quartz sandstones with 70–90% quartz and abundant volcanic lithic fragments and a volcanic dust matrix; they clearly have fewer components and a lower textural maturity than the white sandstones. The black sandstones have plane porosities of 0–1% with dense volcanic matrix cements (Figure 13e,f) and higher amounts of volcanic lithic fragments and acidic volcanic clasts (Figure 13g,h). Some cores also contain dark gray volcaniclastic tuff, e.g., a 0.3 m interval of dark gray volcanic pebble tuff within Benxi Formation sandy mudstone in the 5th round core of Well Y377, which has zero plane porosity in cast thin sections. The above analysis indicates that the dark gray tuffaceous sandstones are one cause of the dry layers in the Benxi Formation.
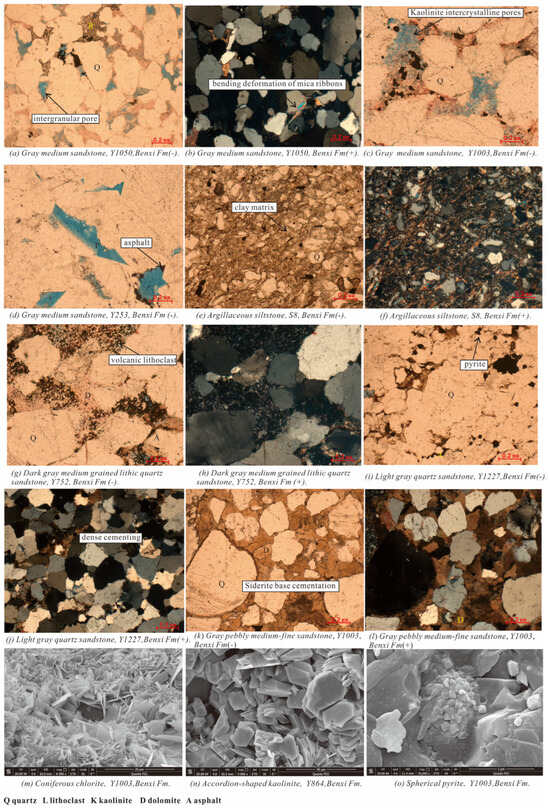
Figure 13.
Photomicrographs of cast thin slices of gas sandstone from (a–d) and dry sandstone from (e–l) of the Benxi Formation. Blue indicates pores. SEM photographs show secondary minerals and cements such as chlorite, kaolinite, and pyrite from (m–o).
In addition, some white sandstones also have very poor reservoir properties, as shown by cast thin sections, with quartz content above 90% and moderate to good roundness and sorting, but the grain contacts are linear or sutured, with clay cements and 0 to 1% plane porosity, and isolated pores formed by rock fragment dissolution are often filled with asphalt and pyrite. The cause of the tight nature of this rock is strong compaction during late diagenesis (Figure 13i,j). Locally, calcite matrix cements are present, which reduce substantial porosity during early diagenesis (Figure 13k,l).
Therefore, the causes of reservoir sandstone compaction are complex. In addition to a small portion of dry layers relating to volcanic eruptions and tuffaceous impurities, some result from early carbonate cementation, while others relate to late diagenetic compaction [14,25]. Overall, however, the distributions of tight sandstones in the Benxi Formation exhibit multiscale and highly heterogeneous characteristics. For example, Well Shi8, located approximately 2 km north of the study area, has the highest production in the Benxi Formation, with a calculated open flow of over 1 million m3/day. Coring of the entire Benxi interval shows 7.5 m of barrier sandstone and gravelly sandstone in the Ben 1 member and 5 m in the Ben 2 member, among which the Benxi 2 member has 3 m of grayish white gravelly sandstone overlaid by 2 m of tuffaceous fine-grained black sandstone. No black sandstone was observed in other parts of the Benxi Formation. The 2 m tight black sandstone did not affect the high productivity of this well. In a 2 cm diameter Benxi Formation sandstone core sample from Well Y253, the plane porosity reached 8% in a 1 mm field of view (Figure 13d), while plane porosity was only 2% or 5% in another 1 mm field of view in the same sample, indicating a significant subcentimeter-scale heterogeneity in effective porosity and an uneven planar distribution below the resolution of well logs, which had 0.1 m to 0.125 m sampling intervals. Therefore, using cast thin sections to study the causes of dry layers has limitations. From the perspectives of lithology and depositional facies, in addition to tuffaceous impurities degrading reservoir quality, poorer reservoir properties of sandstones on barrier margins and some small tidal channels, which have weaker hydrodynamics and higher mud content, are also among the main causes of dry layers. Different factors may be responsible for the poor reservoir quality of thick, massive quartzitic sandstones in the adjacent Yichuan area, which requires dedicated study from the perspective of reservoir formation mechanisms.
8. Prediction of Favorable Gas Reservoir Area
Based on the paleogeomorphology, barrier sand body thickness and distribution, 2D seismic attributes, and generalized attenuation gas detection results, maps of individual favorable factors were overlaid to delineate favorable reservoir areas [42]. Areas where three or more favorable factors overlapped were defined as a Class I favorable areas of gas reservoir formation, whereas two favorable factors indicated Class II, and one favorable factor indicated Class III. The distribution area of the Ma 6 member of the Ordovician Majiagou Formation is favorable for the prevention of Benxi coal methane from entering the Ordovician strata and helps gas accumulation solely in the Benxi Formation, thus representing one favorable factor. Sand bodies over 4 m thick with average porosities above 3.2% within the Ben 1 or 2 members inside the barrier bars have a high probability of gas accumulation, representing another favorable factor.
Well-calibrated 1D forward seismic modeling based on poststack seismic amplitudes [43,44] showed that weak root mean square (RMS) amplitudes within a 20 ms window above the bottom of the Shanxi Formation P1s and strong RMS amplitudes within a 10 ms window straddling upward from the bottom of the Benxi Formation C2b positively correlated with sandstone thickness in the Ben 1 and 2 members, respectively. The dominant frequency of the Benxi Formation in 2D seismic data was 35 Hz, reducing to 15–20 Hz when gas-bearing [45]. Therefore, the sandstone thickness distribution interpreted from 2D seismic data and possible gas attenuation zones also provided references for delineating favorable reservoir regions.
Taking the prediction of the favorable reservoir areas in the Ben 1 member in the Ganquan–Fuxian area as an example, the favorable zones are distributed along the Benxi Formation barrier bars on the paleokarst slopes at the top of the Ordovician strata. The Class I and II favorable zones are mainly located in the eastern barrier bar, where the Ma 6 member is present, while the western barrier bar only has Class III favorable zones. Based on the favorable zones and existing well pattern, six oblique development wells are proposed (Figure 14).
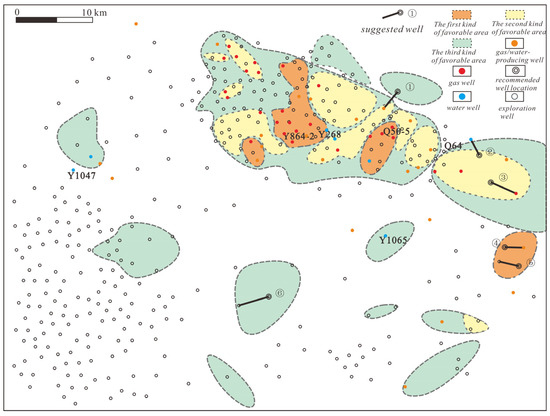
Figure 14.
Prediction map of favorable gas-reservoir-forming areas of Ben 1 Mem in the Ganquan–Fuxian area.
9. Conclusions
(1) The paleogeomorphology of the top of the Ordovician surface and the distribution of Benxi Formation barrier sand bars are two main factors controlling reservoir enrichment in the Ganquan–Fuxian area. Gas reservoirs in the Benxi Formation are mainly located in the second barrier underlain by the Ma6 member, while the formation of gas reservoirs in the Ordovician diluted the gas reservoir in the first barrier bar.
(2) Thick sandstones with good gas-bearing properties and high productivity occur at the centers of barrier bars, with a maximum single gas sandstone thickness close to 16 m and daily gas production exceeding 0.5 million m3 in high-yield wells. The water content in sandstone is mainly distributed at barrier bar margins and locations with thinner cumulative sandstone thicknesses (<4 m) and lower average porosities (<3.2%). Occasional thick aqueous sandstones in the Benxi Formation are related to large local faults.
(3) Integrated reservoir identification shows that Class I favorable reservoirs in the Benxi Formation occur mainly in the eastern barrier bar; Class II favorable reservoirs are mostly adjacent to Class I and are also concentrated in the eastern barrier bar; and Class III favorable reservoirs are primarily distributed in the western barrier bar.
Author Contributions
Conceptualization, M.S., X.M. and R.P.; Methodology, M.S., T.Q. and Y.F.; Software, X.M. and X.G.; Data curation, Y.F.; Writing—original draft, M.S. All authors have read and agreed to the published version of the manuscript.
Funding
This research was funded by the Shaanxi Yanchang Petroleum (Group) Corp. Ltd., grant number KT1321SFW0001.
Data Availability Statement
Not applicable.
Conflicts of Interest
The authors declare no conflict of interest.
References
- Dai, J.; Li, J.; Luo, X.; Zhang, W.; Hu, G.; Ma, C.; Guo, J.; Ge, S. Stable Carbon Isotope Compositions and Source Rock Geochemistry of the Giant Gas Accumulations in the Ordos Basin, China. Org. Geochem. 2005, 36, 1617–1635. [Google Scholar] [CrossRef]
- Zhai, G.-Y.; Wang, Y.-F.; Zhou, Z.; Yu, S.-F.; Chen, X.-L.; Zhang, Y.-X. Exploration and Research Progress of Shale Gas in China. China Geol. 2018, 1, 257–272. [Google Scholar] [CrossRef]
- Lu, J.; Zhao, L.; Li, Y.; Li, X.; He, Q.; Ma, Z. Geochemical Characteristics of Coal Measure Source Rocks of Upper Carboniferous Benxi Formation in Daning-Jixian Area, Eastern Margin of Ordos Basin. Pet. Sci. Technol. 2023, 1–21. [Google Scholar] [CrossRef]
- Zhang, Y.; Jiang, S.; He, Z.; Wang, Y.; Guo, M.; Zhu, G.; Cai, D.; Lu, S.; Xiao, D.; Li, Y.; et al. Characteristics of Heterogeneous Diagenesis and Modification to Physical Properties of Upper Paleozoic Tight Gas Reservoir in Eastern Ordos Basin. J. Pet. Sci. Eng. 2022, 208, 109243. [Google Scholar] [CrossRef]
- Su, N.; Song, F.; Qiu, L.; Zhang, W. Diagenetic Evolution and Densification Mechanism of the Upper Paleozoic Tight Sandstones in the Ordos Basin, Northern China. J. Asian Earth Sci. 2021, 205, 104613. [Google Scholar] [CrossRef]
- Zheng, D.; Pang, X.; Jiang, F.; Liu, T.; Shao, X.; Huyan, Y. Characteristics and Controlling Factors of Tight Sandstone Gas Reservoirs in the Upper Paleozoic Strata of Linxing Area in the Ordos Basin, China. J. Nat. Gas Sci. Eng. 2020, 75, 103135. [Google Scholar] [CrossRef]
- Li, G.; Guo, Y.; Wang, H.; Li, M.; Han, J.; Yang, X. Sedimentology and Paleoenvironmental Characteristics of Fine-grained Sediments in Coal-bearing Strata in the Eastern Ordos Basin: A Case Study of the Exploratory Well in the Zizhou Area. Acta Geol. Sin. Engl. Ed. 2023, 97, 1181–1195. [Google Scholar] [CrossRef]
- Zhang, L.; Zhao, Q.; Peng, S.; Qiu, Z.; Feng, C.; Zhang, Q.; Wang, Y.; Dong, D.; Zhou, S. Paleoenvironment and Organic Matter Accumulation Mechanism of Marine–Continental Transitional Shales: Outcrop Characterizations of the Carboniferous–Permian Strata, Ordos Basin, North China. Energies 2021, 14, 7445. [Google Scholar] [CrossRef]
- Chen, R.; Wang, F.; Li, Z.; Evans, N.J.; Chen, H.; Wei, X. Late Paleozoic Provenance Shift in the East-Central Ordos Basin: Implications for the Tectonic Evolution of the North China Craton. J. Asian Earth Sci. 2021, 215, 104799. [Google Scholar] [CrossRef]
- Xu, X.; Li, X.; Yang, W.; Cao, Y.; Ma, H.; He, A.; Tang, H.; Zhu, B.; Zhu, Y. Diagenesis and Pore Evolution Model of Tight Sandstone Gas Reservoirs of Benxi Formation in the South-Central Ordos Basin, China. Energy Sources Part A Recovery Util. Environ. Eff. 2021, 43, 1–18. [Google Scholar] [CrossRef]
- Li, Y.; Tang, D.; Wu, P.; Niu, X.; Wang, K.; Qiao, P.; Wang, Z. Continuous Unconventional Natural Gas Accumulations of Carboniferous-Permian Coal-Bearing Strata in the Linxing Area, Northeastern Ordos Basin, China. J. Nat. Gas Sci. Eng. 2016, 36, 314–327. [Google Scholar] [CrossRef]
- Wang, L.; Lv, D.; Zhang, Z.; Hower, J.C.; Raji, M.; Zhang, Y.; Shen, Y.; Gao, J. Geochronology, Mineralogy, and Geochemistry of the Tonsteins from the Permo-Carboniferous Benxi Formation, Ordos Basin, North China Craton. Acta Geol. Sin. Engl. Ed. 2023. [Google Scholar] [CrossRef]
- Simms, A.R.; Anderson, J.B.; Blum, M. Barrier-Island Aggradation via Inlet Migration: Mustang Island, Texas. Sediment. Geol. 2006, 187, 105–125. [Google Scholar] [CrossRef]
- Wang, J.; Jiang, F.; Hu, Q.; Zhang, C.; Yang, X.; Mo, W.; Wang, X.; Qi, Z. A Quantitative Model and Controlling Factors of Secondary Pore Development for Tight Sandstone Reservoirs in the Carboniferous Benxi Formation, Ordos Basin, China. Mar. Pet. Geol. 2023, 148, 106034. [Google Scholar] [CrossRef]
- Xu, L.; Li, Y.; Sun, X.; Li, Z.; Gao, S.; Hu, W.; Zhang, Y. Geological Controls on Gas Content in Tidal Flats-Lagoonal and Deltaic Shales in the Northeastern Ordos Basin. Geoenergy Sci. Eng. 2023, 221, 111291. [Google Scholar] [CrossRef]
- Fu, S.; Liu, Z.; Guo, Y.-R.; Ge, J.-W.; Xu, X.-M. Lacustrine Paleoshoreline Determination under Established Sequence Stratigraphic Framework and Its Controls on Sand Bodies and Hydrocarbon Accumulations. Mar. Pet. Geol. 2019, 110, 497–517. [Google Scholar] [CrossRef]
- Zhao, W.; Wen, Z.; Zhang, H.; Wu, C.; Liu, Y.; Song, H.; Zhang, L.; Xi, Y.; Sun, L. Integrated Assessment of Marine-Continental Transitional Facies Shale Gas of the Carboniferous Benxi Formation in the Eastern Ordos Basin. Energies 2021, 14, 8500. [Google Scholar] [CrossRef]
- Zhang, L.; Dong, D.; Qiu, Z.; Wu, C.; Zhang, Q.; Wang, Y.; Liu, D.; Deng, Z.; Zhou, S.; Pan, S. Sedimentology and Geochemistry of Carboniferous-Permian Marine-Continental Transitional Shales in the Eastern Ordos Basin, North China. Palaeogeogr. Palaeoclimatol. Palaeoecol. 2021, 571, 110389. [Google Scholar] [CrossRef]
- De Swart, H.E.; Zimmerman, J.T.F. Morphodynamics of Tidal Inlet Systems. Annu. Rev. Fluid Mech. 2009, 41, 203–229. [Google Scholar] [CrossRef]
- Bridges, P.H. Lower Silurian Transgressive Barrier Islands, Southwest Wales. Sedimentology 1976, 23, 347–362. [Google Scholar] [CrossRef]
- Chen, A.; Zou, H.; Ogg, J.G.; Yang, S.; Hou, M.; Jiang, X.; Xu, S.; Zhang, X. Source-to-Sink of Late Carboniferous Ordos Basin: Constraints on Crustal Accretion Margins Converting to Orogenic Belts Bounding the North China Block. Geosci. Front. 2020, 11, 2031–2052. [Google Scholar] [CrossRef]
- Wang, J.; Jiang, F.; Zhang, C.; Song, Z.; Mo, W. Study on the Pore Structure and Fractal Dimension of Tight Sandstone in Coal Measures. Energy Fuels 2021, 35, 3887–3898. [Google Scholar] [CrossRef]
- Yang, B.; Qu, H.; Pu, R.; Tian, X.; Yang, H.; Dong, W.; Chen, Y. Controlling Effects of Tight Reservoir Micropore Structures on Seepage Ability: A Case Study of the Upper Paleozoic of the Eastern Ordos Basin, China. Acta Geol. Sin. Engl. Ed. 2020, 94, 322–336. [Google Scholar] [CrossRef]
- Zhao, J.; Zhang, W.; Li, J.; Cao, Q.; Fan, Y. Genesis of Tight Sand Gas in the Ordos Basin, China. Org. Geochem. 2014, 74, 76–84. [Google Scholar] [CrossRef]
- Dong, X.; Meng, X.; Pu, R. Impacts of Mineralogy and Pore Throat Structure on the Movable Fluid of Tight Sandstone Gas Reservoirs in Coal Measure Strata: A Case Study of the Shanxi Formation along the Southeastern Margin of the Ordos Basin. J. Pet. Sci. Eng. 2023, 220, 111257. [Google Scholar] [CrossRef]
- Jiang, F.; Pang, X.; Guo, F.; Guo, J. Critical Conditions for Natural Gas Charging and Delineation of Effective Gas Source Rocks for Tight Sandstone Reservoirs. Geol. J. 2016, 51, 113–124. [Google Scholar] [CrossRef]
- Fan, C.; Cao, J.; Luo, J.; Li, S.; Wu, S.; Dai, L.; Hou, J.; Mao, Q. Heterogeneity and Influencing Factors of Marine Gravity Flow Tight Sandstone under Abnormally High Pressure: A Case Study from the Miocene Huangliu Formation Reservoirs in LD10 Area, Yinggehai Basin, South China Sea. Pet. Explor. Dev. 2021, 48, 1048–1062. [Google Scholar] [CrossRef]
- Wang, M.; Tang, H.; Zhao, F.; Liu, S.; Yang, Y.; Zhang, L.; Liao, J.; Lu, H. Controlling Factor Analysis and Prediction of the Quality of Tight Sandstone Reservoirs: A Case Study of the He8 Member in the Eastern Sulige Gas Field, Ordos Basin, China. J. Nat. Gas Sci. Eng. 2017, 46, 680–698. [Google Scholar] [CrossRef]
- Wang, H.; Chen, M.; Wei, S.; Lu, Y.; Nie, Z.; Li, Y. The Influence of Barrier Coastal Sedimentary System Lost Circulation in Sandstone. J. Pet. Sci. Eng. 2020, 185, 106654. [Google Scholar] [CrossRef]
- Dong, Z.; Zhang, J.; Tang, X.; Liu, G.; Dang, W.; Liu, Y.; Tao, J.; Su, Z. Origin and Diffusion of the Over-Mature Transitional Natural Gas in Multiple Lithologic Reservoirs: A Case Study of Carboniferous-Permian Strata in the Southeastern Margin of Ordos Basin. Int. J. Coal Geol. 2020, 219, 103380. [Google Scholar] [CrossRef]
- Li, Y.; Gao, X.; Meng, S.; Wu, P.; Niu, X.; Qiao, P.; Elsworth, D. Diagenetic Sequences of Continuously Deposited Tight Sandstones in Various Environments: A Case Study from Upper Paleozoic Sandstones in the Linxing Area, Eastern Ordos Basin, China. Bulletin 2019, 103, 2757–2783. [Google Scholar] [CrossRef]
- Reddering, J.S.V. An Inlet Sequence Produced by Migration of a Small Microtidal Inlet against Longshore Drift: The Keurbooms Inlet, South Africa. Sedimentology 1983, 30, 201–218. [Google Scholar] [CrossRef]
- Otvos, E.G. Coastal Barriers—Nomenclature, Processes, and Classification Issues. Geomorphology 2012, 139–140, 39–52. [Google Scholar] [CrossRef]
- Green, A.N.; Cooper, J.A.G.; Leuci, R.; Thackeray, Z. Formation and Preservation of an Overstepped Segmented Lagoon Complex on a High-Energy Continental Shelf. Sedimentology 2013, 60, 1755–1768. [Google Scholar] [CrossRef]
- Loureiro, C.; Ferreira, Ó.; Cooper, J.A.G. Extreme Erosion on High-Energy Embayed Beaches: Influence of Megarips and Storm Grouping. Geomorphology 2012, 139–140, 155–171. [Google Scholar] [CrossRef]
- Moslow, T.F.; Tye, R.S. Recognition and Characterization of Holocene Tidal Inlet Sequences. Mar. Geol. 1985, 63, 129–151. [Google Scholar] [CrossRef]
- Hobday, D.K.; Horne, J.C. Tidally Influenced Barrier Island and Estuarine Sedimentation in the Upper Carboniferous of Southern West Virginia. Sediment. Geol. 1977, 18, 97–122. [Google Scholar] [CrossRef]
- Galloway, W.E. Reservoir Facies Architecture of Microtidal Barrier Systems. Bulletin 1986, 70, 787–808. [Google Scholar] [CrossRef]
- Liu, X.; Wang, F.; Liu, B.; Tian, J.; Shang, T.; Ma, J.; Zhang, Z.; Zhang, X. Factors Controlling Hydrocarbon Accumulation in Jurassic Reservoirs in the Southwest Ordos Basin, NW China. Acta Geol. Sin. Engl. Ed. 2020, 94, 467–484. [Google Scholar] [CrossRef]
- Wang, Q.; Wang, X.; Zeng, X. Research on Reservoir Characteristics and Main Controlling Factors of Longwangmiao Formation of Cambrian in Sichuan Basin. Front. Earth Sci. 2022, 10, 885637. [Google Scholar] [CrossRef]
- Wang, J.; Li, Z.; Chen, C.; Meng, C. Predicting Gas Content in Coalbed Methane Reservoirs Using Seismic Waveform Indication Inversion: A Case Study from the Upper Carboniferous Benxi Formation, Eastern Ordos Basin, China. Acta Geophys. 2022, 70, 623–638. [Google Scholar] [CrossRef]
- Tomazelli, L.J.; Dillenburg, S.R. Dillenburg Sedimentary Facies and Stratigraphy of a Last Interglacial Coastal Barrier in South Brazil. Mar. Geol. 2007, 244, 33–45. [Google Scholar] [CrossRef]
- Sun, N.; Pan, J.; Zhou, S.; Jiao, C. Characteristics of Faults and Their Significance in Controlling the Oil Accumulations in Honghe Field, Ordos Basin. Interpretation 2019, 7, T195–T206. [Google Scholar] [CrossRef]
- Pu, R.; Han, Q.; Xu, P. Cases of Generalized Low-Frequency Shadows of Tight Gas Reservoirs. Interpretation 2021, 9, B65–B76. [Google Scholar] [CrossRef]
- Chen, Q.; Sidney, S. Seismic Attribute Technology for Reservoir Forecasting and Monitoring. Lead. Edge 1997, 16, 445–448. [Google Scholar] [CrossRef]
Disclaimer/Publisher’s Note: The statements, opinions and data contained in all publications are solely those of the individual author(s) and contributor(s) and not of MDPI and/or the editor(s). MDPI and/or the editor(s) disclaim responsibility for any injury to people or property resulting from any ideas, methods, instructions or products referred to in the content. |
© 2023 by the authors. Licensee MDPI, Basel, Switzerland. This article is an open access article distributed under the terms and conditions of the Creative Commons Attribution (CC BY) license (https://creativecommons.org/licenses/by/4.0/).