Abstract
Against the background of climate protection and the rising costs of a fossil-fuel-based energy supply, the interest in the energy performance and indoor climate of buildings in real operation is rising. This paper, therefore, deals with the indoor climate investigation of two medium-sized office buildings in Germany by taking measurements over a whole year. These relate to one new building and one refurbished building. Sensors of various types were installed and operated in a large number of office rooms, so that in total results are available for over 100 rooms, typically occupied by one or two persons. The analysis focuses on the indoor temperature in summer and the air quality in winter based on the CO2 concentration. The comfort classes according to DIN EN 16798 including the adaptive comfort approach are used as a basis to cluster the results. Both buildings have movable sun protection and openable windows but no facilities for active cooling. They, thus, represent a large number of existing ‘low tech’ office buildings in Germany and central Europe. The results reflect the respective building concepts but also show a wide range between the rooms due to the user preferences and behaviour. The refurbished building shows better results, especially in terms of air quality but also in terms of summer room temperatures. This underlines the benefit of the targeted measures as a result of an analysis of the deficits in the existing building before the refurbishment. The additional measures for decentralised mechanical ventilation and passive cooling are having positive effects. As part of the projects, further measures to improve the indoor climate were investigated in both buildings. In one case, this involved CO2 traffic lights to stimulate personal window ventilation in winter, and in the other, the use of newly developed individual ceiling fans supports convective heat dissipation on the human body during hot spells in summer. The positive effect could be demonstrated for both measures.
1. Introduction
Against the background of climate protection and the rising costs of a fossil fuel-based energy supply, the interest in the energy performance and indoor climate of buildings in real operation is rising. Namely, the ‘performance gap’ is defined as the difference between measured performance and predictions becomes a focus [1]. The recent draft of the recast of the Energy Performance of Buildings Directive of the European Commission highlights the need for energy consumption and air quality monitoring to address this topic on a broader scale [2]. National and regional initiatives postulate a duty for monitoring [3] and define monitoring as a precondition for funding [4]. A rising number of companies offer suitable platforms and field monitoring services to building owners, mainly those in the commercial sector owning a large building portfolio with high energy consumption.
Monitoring indoor climate has become an issue namely for residential buildings in the context of increased air tightness of buildings in heating dominated countries [5]. Here, the focus lies on ensuring sufficient ventilation to avoid moisture damage and a concentration of air pollutants during the heating season. Monitoring indoor climate in office buildings has its background in legal obligations for providing healthy working environments (e.g., minimum and maximum temperatures) on the one hand, and the monetary interest of an employer to profit from high productivity by a stimulating working environment without thermal stress and insufficient air quality on the other [6]. Monitoring the indoor climate is a precondition to interpret the energy consumption data of a building correctly [7,8,9].
The predicted climate change with rising global temperatures and the increasing number of hot summers in central Europe over the last 20 years have created great interest in monitoring summer thermal comfort in buildings, namely in those countries typically not applying air condition in offices as standard in their building stock, including in new buildings [10]. Ambient temperatures are increasing and at the same time people’s expectations regarding thermal comfort in offices are rising, e.g., due to the area-wide introduction of air conditioning in private and public transport and retrofitting of air conditioning in private homes. A large number of existing office buildings do not have efficient shading (external blinds, overhangs, solar control glass, etc.). Moveable blinds are in many cases not part of building automation systems or the automation is inactive due to conflicts with user preferences for undisturbed visual contact to the ambient [11]. When people manually close blinds due to rising indoor temperatures it is typically too late to avoid overheating. Passive cooling by night ventilation is often not implemented as conflicts concerning weather protection and security increase the investment costs. The potential of passive cooling by night ventilation drastically decreases, when nocturnal outdoor temperatures do not drop below 20 °C (tropical nights, [10]). Due to the decreasing temperature differences between indoor and outdoor, suitable airflow rates drastically have to be increased.
From this background, the paper addresses indoor comfort monitoring in two typical, medium-sized office buildings in Germany that do not have air conditioning. One building is new; one is a refurbishment. To avoid anomalous results mainly based on individual room usage and user behaviour, a relatively large number of rooms have been monitored to allow findings characterising the total building. In the absence of central ventilation systems, it was not possible to investigate whole building data based on sensors in the return air. The investigation aims to correlate the indoor comfort to the building concept (architecture, building construction, and technical services), the building management and the user behaviour, and to answer the question about the suitability of ‘low tech buildings’ for the predicted future climatic conditions in central Europe [12]. There are technical opportunities for using renewables for cooling to cover the rising demands in Europe, namely in the Mediterranean regions [13,14,15].
Following this introduction, the article first describes the two buildings and the respective monitoring system (Section 2). The evaluation methodology is described in Section 3 and the results are presented in Section 4. The two final sections discuss the results and point out the potential in the context of climate change and the amended 2011 EC Energy Performance Directive [2].
2. Case Study Buildings
The investigations took place in 2019 and 2022 in two office buildings at different locations in Germany in the context of independent research projects at the University of Wuppertal. The buildings represent contemporary construction in new buildings or in the refurbishment of existing buildings and are used by the owners themselves. An overview of the characteristics of the buildings, the relevant building technology, and the monitoring is provided in Table 1.
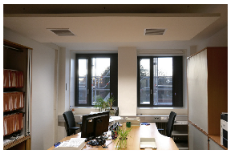
The new building of the Mettmann District Administration (KVM), which was constructed in 2017, consists of four two-storey building wings that are connected via circulation areas. The majority of the rooms are single or double offices with orientation towards east and west. The planning goal was a building with simple building services and low maintenance and operating costs. Against this background, ventilation and refrigeration technology, as well as complex building automation, were dispensed [16].
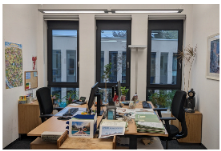
The building in Dillingen (LRAD) is the renovation of a public administration building from the 1960s that was completed in 2021. The existing building was renovated in the course of a structural extension. This included a curtain wall and new windows. From the experiences of inadequate high summer temperatures in the offices, one focus of the renovation was on passive cooling measures: per each façade segment, one opaque window sash is automated and motorised for night ventilation, while a second transparent part is operated manually. Each office has two of such segments; refer to the indoor picture in Table 1. Introducing the opaque window sash reduces the transparent area by 15%. Above the windows is a decentral ventilation unit with heat recovery but no cooling or heating function, which is controlled manually by the occupants. A special feature is the provision of individual ceiling fans per workplace to improve summer thermal comfort [17]. The fans are installed within suspended acoustic panels and controlled manually with variable speed. The building serves as a pilot project for these new systems.
Both buildings are typical massive constructions. It is important to note that the window-to-floor area of the typical offices differs, with the higher value being found for the KVM offices with floor-to-ceiling windows; refer to the picture in Table 1. Both buildings apply heat-protection triple glazing and externally mounted movable sun protection. Whereas translucent textile blinds are used at the KVM building, venetian blinds are used for the LRAD building.

Table 1.
Characteristics of the investigated office buildings, the service technology, and the monitoring approach.
Table 1.
Characteristics of the investigated office buildings, the service technology, and the monitoring approach.
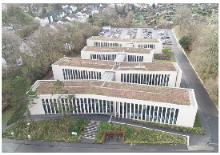 | 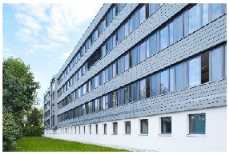 | |
 |  | |
| Pictures: Kreisverwaltung Mettmann | Pictures: Landratsamt Dillingen | |
| Abbreviation | KVM | LRAD |
| User and owner | local authority | local authority |
| New/renovation | New | Renovation |
| City, country | Mettmann, DE | Dillingen, DE |
| Meteorological station nearby | Düsseldorf, DE | Dillingen, DE |
| Year of construction | 2017 | 2019 (renovation) |
| Number of storeys | 2 | 4 |
| Net floor area | 4686 m2 | 3919 m2 |
| Main office type | two-person office | two-person office |
| Typical office area | 17 m2 | 20 m2 |
| Window to floor area ratio | 0.35 | 0.22 |
| Typical weekday office hours | 8 a.m. to 4 p.m. | 8 a.m. to 4 p.m. |
| Heating | pellet boiler; radiators | district heating; radiators |
| Cooling | no measures | free night ventilation with central control; individual ceiling fans with manual control |
| Ventilation | window ventilation only | decentral supply and exhaust air unit with heat recovery; window ventilation |
| Shading | external canvas blinds—automatic control with manual override; manual interior glare screens | external venetian blinds—automatic control with manual override |
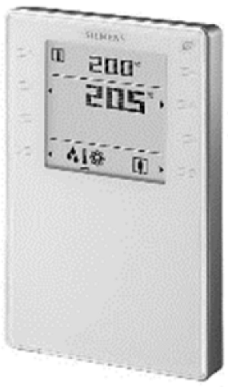
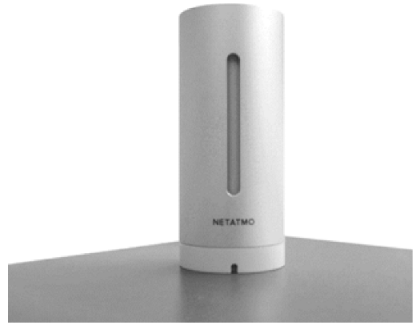
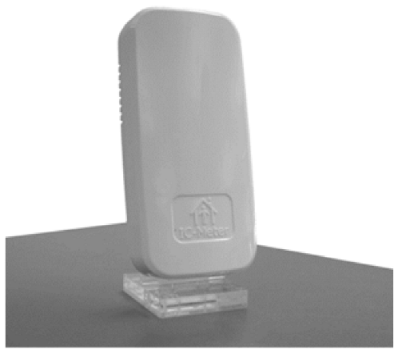
| Monitoring device | Netatmo [18] | building automation/IC Meter [19] |
| Monitored offices | 35 (temp., hum., CO2), 1 (hum., CO2) | 85 (temp)/6 (temp., hum., CO2) |
| Monitoring period | January 2019–December 2019 | January 2022–December 2022 |
3. Monitoring Methodology
3.1. Monitoring Systems
For both buildings, measurement data is available for at least one year with a time resolution of 5 min. The buildings are located at two different sites and monitoring took place in different years. The year of 2019 was one of the hottest summers in Germany, thereby creating more thermal stress for the KVM building (Tamb,max 39.5 °C) compared to LRAD (Tamb,max 35.5 °C), monitored in 2022. None of the locations are characterised by high summer humidity, so the thermal comfort is mainly effected by the temperature. The weather data for the analyses were obtained from the nearest station of the German Weather Service with a temporal resolution of 10 min (see Table 1). The building users were informed in advance about the measurements and consent was obtained. This is important as some of the data may allow analysis of personal presents and activity. The evaluation and presentation of the results is anonymous with respect to individual occupants.
Different monitoring hardware was used in the two buildings, as shown in Table 2. The background is the fact that both projects were independent with different actors and work focus and performed in different years. In the LRAD building, the new building management system (BMS) installed as part of the refurbishment was designed for continuous measurement and storage of indoor climate data: temperatures were recorded in 85 office rooms with an eastern or western orientation, and humidity and CO2 concentration were additionally recorded in 6 selected rooms. The sensor technology is integrated into the surface-mounted room control elements at a height of 1.5 m. Occupants can read data from the display to check and compare data with the individual perception. Power is supplied via the KNX bus. Since temperature measurement in BMS systems is usually used for control purposes only, comparatively inexpensive NTC sensors are applied, which means that the measurement is not very precise (±0.8 K). Therefore, measurement accuracy and the dynamic behaviour were checked in the six special rooms using supplementary measurements with IC meters; refer to Table 2 and the discussion in Section 4.3 [19]. These are variable installed room-climate data loggers that transmit their measured values via a GSM modem or optionally via WiFi. GSM operation allows data transmission independent of the building’s WiFi network, which is advantageous with regard to data protection and data security of the respective networks on site. The digital measurement technology is based on a CMOS chip for all measured variables (Sensirion SHT21). A main power connection at the device location is required for operation.
Table 2.
Features of the monitoring system (BMS: building management system).
In the KVM building, continuous recording and storage of indoor climate data was not part of the building automation. In order to, nevertheless, record a large number of rooms, a comparatively inexpensive, decentral measuring technology from the smart home sector was used (Netatmo [18]). This consists of a base unit with four sensors (temperature, humidity, CO2, and sound level) to which up to three substations in other rooms are connected via radio transmission (no sound level recording). The base station is supplied by the mains, while the substations work with batteries. In the KVM building, a total of 36 offices with a west or east orientation were recorded and evaluated. The devices were positioned on the desks but far enough from direct interference with waste heat from equipment or persons. The data were recorded and stored as instantaneous values at 5 min intervals in the manufacturer cloud. A mobile phone or a browser app can be used for real-time visualisation, but information was not opened for the occupants. The digital sensor technology works similarly to that in the IC meters. In the case of CO2 measurement with infrared sensors, a weekly ‘recalibration’ is automatically carried out by evaluating the measurement data combined with the assumption that the lowest measured value in the week reaches the usual outdoor air concentration (approx. 400 ppm). The systems proved to be reliable and sufficiently accurate. A random sample test in the climate chamber confirmed the manufacturer’s specifications with regard to temperatures. The radio connection of the substations forces compromises in the installation in order to achieve sufficient signal quality. On the other hand, there is the advantage of lower costs than with fully solitary sensor technology. Ultimately, with a limited budget the number of possible samples and, thus, the significance of the results are reduced.
3.2. Data Analysis
The evaluation of the indoor climate data was carried out on a room-by-room basis and in relation to the respective usage times (6 a.m. to 4 p.m.) on weekdays, as shown in Table 1. It should be noted that, against the background of possible ‘employee monitoring’, no direct presence recording was carried out in the examined rooms. In this respect, times without occupancy during the usual room usage times are also included.
For simplified communication and interpretation, the data were compiled and graphically prepared according to the quality categories for the parameters room temperature, relative humidity, and CO2 concentration in DIN EN 16798-1:2022 [20]. It should be noted that in this new standard the requirements for air quality are less stringent than in the older DIN EN 15251:2012 [21] while the criteria for room temperature and humidity remain the same. Normatively, category 2 should be aimed for in new buildings or extensive refurbishments, with minor exceedances considered tolerable (below 5% of the period of use).
When interpreting the measured room temperature, it can be roughly seen as the operative temperature in the sense of the standard; see also Section 4.3. The normative procedure for non-cooled buildings is based on the adaptive comfort model [22]. Here, the limit temperatures of the respective category are derived based on the daily running mean of the outdoor temperatures of the past 7 days. This procedure usually leads to a more favourable assessment than a consideration with fixed upper temperature limits of 25.5 °C (category 1), 26 °C (2), or 27 °C (3), as applied for air-conditioned buildings (Table B2 in [20], Table 3).
Table 3.
Indoor climate classification system based on DIN EN 16798-1 [20].
4. Results
In the following, the results are presented first in relation to the entire building and then room-based to analyse the homogeneity or the scattering of the results for each building. All data refer to the daily time of utilisation during workdays, as shown in Table 1.
4.1. Overall Building Performance
For both buildings, the year-round temperature measurement data of all rooms were evaluated on the basis of hourly mean values. Figure 1 shows the results in the characteristic diagram of the normative requirements according to the adaptive thermal comfort model. The room measurement data are plotted against the daily running mean of the outdoor temperature according to formula B2, DIN EN 16798-1 [20]. The lines mark the upper and lower limits of the respective comfort category.
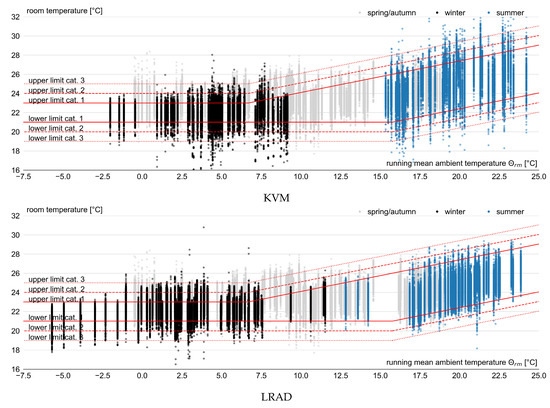
Figure 1.
Correlation between the room temperatures and the running mean ambient temperature for all monitored rooms of the two buildings over a full year. The three seasons are defined as follows: Jan./Feb./Nov./Dec. = winter, Jun./Jul./Aug. = summer, Mar./Apr./May./Sep./Oct. = spring/autumn.
Both buildings have comparatively high winter room temperatures. These result from the individual preferences of the users, as all rooms are equipped with radiators and adjustable thermostatic valves. Significantly lower values indicate rooms that are not used at times, where the thermostatic valves have been throttled accordingly (1–2% of the time). Critically low humidity values did not occur (<1% of the time). Therefore, a graphical representation was omitted.
During summer outdoor conditions, the KVM building experiences room temperatures above the category two limits during 4% of the time, while this is negligible for the LRAD building. While the offices in the KVM building do not comply with the upper temperature limit for category one for more than 10% of working hours in summer, this is only 1% in the LRAD building. A total of 10% of the working hours correspond to about 50 h.
In summer, the user influence in both projects consists of the use of the movable sunshade, window ventilation, and the door position. In the morning, temperatures fall below the lower threshold because of manually tilted windows during the night (KVM) or automated opening of the flaps for night ventilation (LRAD) but are generally not considered critical.
The results for the air quality reflect the difference between window ventilation alone at the KVM building and the room-by-room ventilation units in the façade of the LRAD building, as shown in Figure 2. The ventilators are designed for an airflow rate of 60 m³/h. They, thus, realise a hygienic minimum air exchange with a heat supply efficiency of about 60% but do not fully replace occasional additional ventilation via the windows. According to the experiences, users switch on the ventilation mainly during the heating season. High CO2 concentrations far above 1750 ppm (upper limit category 3) occur particularly frequently in the KVM building when the outside temperatures drop well below 20 °C. The reason for this is the decreasing thermal comfort during winter window ventilation: the colder the outdoor air, the greater the loss of comfort due to the cold air entering, so that the users refrain from using it. With the ventilation unit, cold air intake is largely prevented by the temperature increase in the heat recovery. Over the core winter months (Nov. to Feb., working hours only), the CO2 concentration is only above the limit value of category 2 for 10% of the time, compared to 26% for the KVM building. Not only the frequency differs but also the amount exceeding and the peaks. During the summer period, the differences in the results for the two buildings are significantly smaller compared to the winter months. Windows are often kept tilted without loss of comfort or even with an increase in comfort due to increased air velocity; refer to Section 5.2.
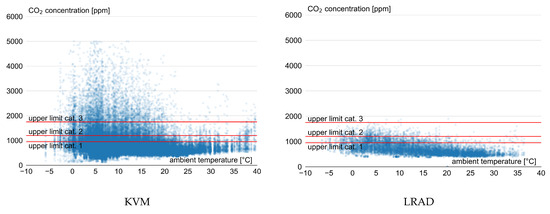
Figure 2.
Correlation between the CO2 concentration and the ambient temperature for all monitored rooms of the two buildings over a full year. The difference in the low values (400 ppm and below) reflect the different self-calibration methods of the sensors.
A summary of the indoor climate classification for both buildings is given in Table 4, separated for the core winter and summer months.
Table 4.
Classification of selected comfort parameters according to DIN EN 16798-1 for both buildings during the core winter and summer months.
4.2. Room-Based Indoor Climate Classification
For the following room-by-room evaluation, only the summer case with its upper temperature limits is considered. In addition to the limit values according to the adaptive thermal comfort model, evaluations were carried out with the fixed temperature values according to Table 3. Figure 3 underlines the consistently good summer thermal comfort in the 91 rooms in the LRAD building (100% in category 1 and 2), but also the predominantly good conditions in the 35 rooms monitored in the KVM project (96%). Considering fixed upper temperature limits decreases the positive picture in both cases, as seen in Figure 4: whereas 75% of the working hours remain in the best two categories in the case of KVM, the corresponding ratio is 85% for LRAD. In addition to the classification, it must also be taken into account here that there are notable periods of very high exceedances in the KVM building.
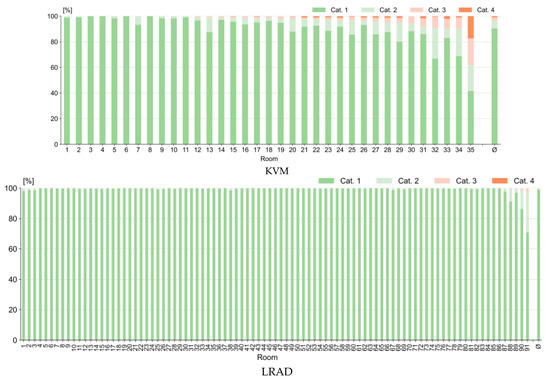
Figure 3.
Room-based classification of the room temperature or all rooms monitored for the summer period between June and July for both buildings using the upper temperature limit of the adaptive thermal comfort model.
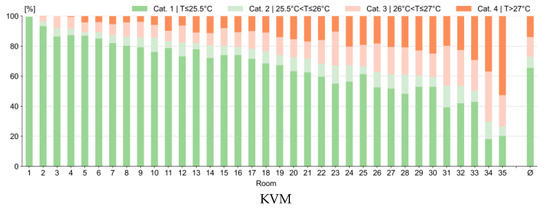
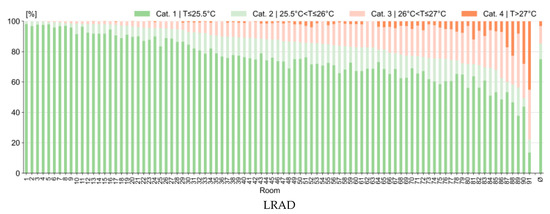
Figure 4.
Room-based classification of the room temperature or all rooms monitored for the summer period between June and July for both buildings using fixed upper temperature limits.
The adaptive comfort approach results in a significantly more favourable rating for both buildings compared to fixed upper temperature limits as valid for air-conditioned buildings. This seems plausible against the background that usually the expectations on a cooled building are different from those of its non-cooled counterpart. In this respect, the wording ‘passive cooling’ may create expectations comparable to ‘active cooling’, which often cannot be fulfilled in practical operation. On the other hand, at indoor temperatures of more than 28 °C the upper boundaries of the adaptive comfort approach appear questionable in describing thermal comfort, if no additional measures such as personal fans are applied; refer to Section 5.2.
The room-by-room observation of the air quality in winter also shows a heterogeneous picture, Figure 5. Long-term measurements are available for thirty-six rooms in the KVM building and for the six reference rooms in the LRAD project. Due to the much smaller number of rooms with CO2 monitoring for the LRAD project the resilience of the comparison is limited but tendencies can be observed. None of the rooms in the LRAD building has CO2 concentrations above 1750 ppm. This is the case for the majority of the rooms in the KVM building, although with varying frequency. The absence of mechanical ventilation results in a wide variation depending on user behaviour, occupation, and occupancy density: there are offices with very good air quality, as well as those with very poor air quality because of windows which do not open automatically.
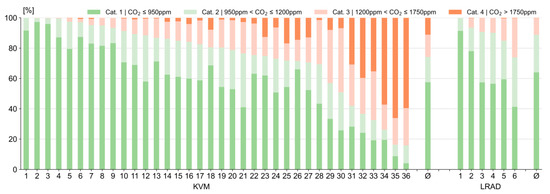
Figure 5.
Room-based classification of the CO2 concentration of all rooms monitored for the winter period between November and February in both buildings.
4.3. BMS Data Suitability
For a critical analysis of the BMS data, additional IC meters were set up at the workplaces in six sample rooms over a period of six months (Nov. 2021–Apr. 2022) and placed in such a way that no direct sunlight or waste heat from equipment influence the measurement. Figure 6 shows a comparison of the measured sensor outputs of all six rooms based on hourly mean values. While the measurement of CO2 concentration consistently provides comparable values, significant differences occur for the temperature measurement and, consequently, for the relative humidity as well. Figure 7 illustrates the behaviour based on two example weeks in one of the reference rooms. With the desk placed IC-Meters the general temperature level is 0.5 to 1 K higher, and peaks become more significant. Besides the absolute deviations, the influence of the thermal coupling of the sensor housing of the BMS panel to the thermal mass of the wall obviously reduce the temperature peaks. In contrast, the sensors at the workstations have ventilated, free-standing housings with negligible thermal inertia. Taking the BMS data for classifying the thermal comfort results in a slightly better evaluation. The differences in the temperatures are reflected in a consistent deviation of the relative humidity with lower values detected by the IC meters.
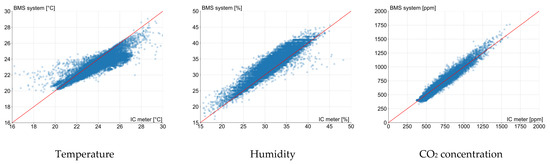
Figure 6.
Comparison of the measurement results from the BMS system and desk placed IC meters for the 6 reference rooms of the LRAD building for a period between Nov. and Apr. (hourly data resolution).
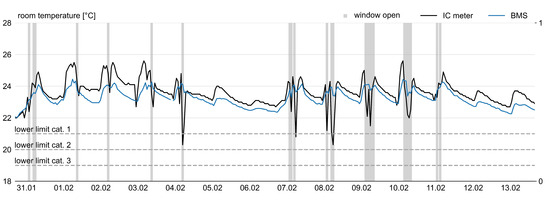
Figure 7.
Example of the hourly development of the room temperature in one of the six reference rooms of the LRAD building for a period of 14 days in winter. The grey bars mark the window opening (0 = closed; -1 = open).
5. Discussion
The results of the two projects have shown differences and similarities. The challenge in projects of this kind under summer conditions is to ensure comfortable room temperatures despite not using air conditioning. Under winter conditions, on the other hand, the focus is on indoor air quality. This applies equally to refurbishments and new construction projects, as the expectations of the users are identical.
5.1. Comparison
The new KVM building with its larger glass surfaces per room floor area turns out to be more sensitive to high summer temperatures, despite moveable external sun protection. The floor-to-ceiling windows increase the summer heat load without improving the daylight conditions. The design data just met the national legal requirements for summer heat protection. The results per room scatter with user behaviour. Without modifying the glazing area, there is potential for improvement in a less transparent fabric for the textile blinds and its consistent automation (e.g., increased set point for wind velocity) or a more consistent application by the users. Limitations are given by the user preferences with respect to visual contact to the environment [23].
The measures taken in the renovation of the LRAD building have underlined their effectiveness in both, summer thermal comfort and winter ventilation, to overcome the deficits of the former existing building. This includes reduction of the glazed façade areas and introduction of night ventilation as well as the façade integrated decentral mechanical ventilation. In the refurbishment project with constant users, it is an advantage that the conditions have improved significantly compared to the previously existing deficiencies and, thus, users tend to show a positive basic attitude [24].
The provision and storage of indoor climate data via the BMS proved to be a fundamentally viable way of continuous quality assurance. However, in the present case, this was associated with limitations in the accuracy and reliability of data storage. The decentral monitoring systems proved to be sufficiently accurate and reliable regarding data transfer and storage. This also applies for the low-budget consumer product thereby opening a potential for monitoring and indoor climate quality assurance in existing buildings without a comparable BMS functionality.
In addition to the monitoring data analysis interviews with the users in both buildings underline that high summer temperatures are fundamentally more complained about than poor air quality in winter. Apart from the fact that humans do not directly sense CO2, this is because poor air quality is primarily perceived when entering a room, rather than a continuous deterioration during its use. Beside the individual use of blinds and opening of windows another reason for the significant differences between individual rooms is the position of the office doors to the corridor [16]. Different corporate cultures as well as personal preferences have an effect. An open door promotes air exchange with the circulation areas and taps thermal storage masses in addition to that in the office. The door position was not recorded during the measurements.
5.2. Individual Measures
With ‘CO2 traffic lights’ temporarily used on the work desks in the KVM project, it could be shown that winter air quality was significantly improved (24% on average more within category 1 and 2) at low investment costs by targeted visual and/or acoustic cues to stimulate individual window ventilation, as shown in Figure 8 and Figure 9. Similar effects might be possible by using the warning functionality of the mobile phone apps for the cloud-based indoor climate monitoring systems without individual displays. It is to be expected that the increased use of window ventilation will increase the heating energy consumption. It was found to be 20% lower than predicted in the case of the KVM building in the period not using the CO2 traffic lights. Due to the Coronavirus pandemic, the necessary measurements with CO2 traffic lights over a longer period could not be carried out. The worldwide pandemic has raised the interested in CO2 traffic lights to stimulated window ventilation. Increased ventilation reduces the aerosol content in the room air [25]. Aerosol contamination was found to be the major path of infection in rooms occupied by multiple persons.
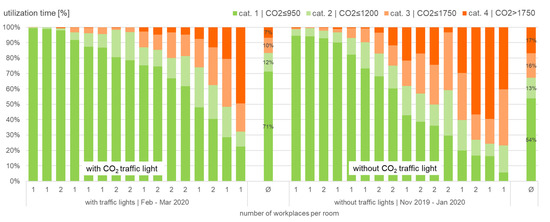
Figure 8.
Room-based classification of the CO2 concentration for 16 rooms in the KVM building with (left, Feb.–Mar. 2020) and without (right, Nov. 2019–Jan. 2020) the use of CO2 traffic lights on the desks of the workplaces.
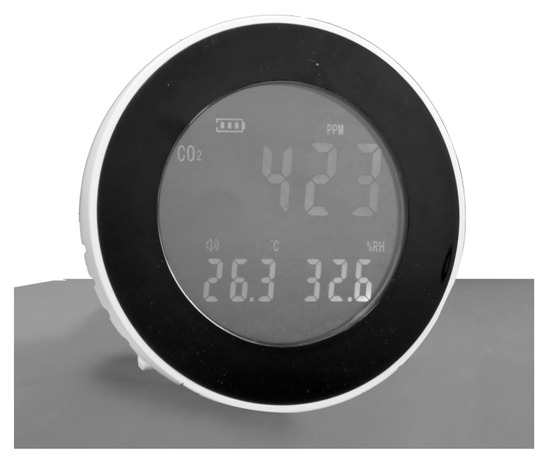
Figure 9.
Example of an individual work desk indoor climate panel incl. CO2 traffic-light function.
In the LRAD building, newly developed ceiling fans were additionally used above the individual workplaces; refer to Table 1 and Figure 10. About 150 fans were installed as an integrated part of acoustic panels. The fans are activated individually by the users with the opportunity of variable speeds. The operation of the fans under summer conditions causes increased air movement around the human body to about 0.25 to 0.5 m/s, compared to almost no or very low air movement without fan operation (<0.1 m/s). They are designed in such a way that the conditions at the opposite workplace in the same room are not affected. Figure 11 illustrates the behaviour based on 9 days of operation in a test office. Whereas the schedule operated fan generates an air velocity of about 0.3 m/s at the head level of a seated person, the velocity at the opposed desk without fan operation remains low with 0.1 m/s. The fan power consumption is very low at 4 W. Due to the high energy efficiency of the DC drives, noise emissions also remain low. The systems were developed as part of a research project at the University of Wuppertal together with industry partners and used for the first time at LRAD [17]. The use of the fans does not change the air temperature in the room but it does increase the heat transfer to the human body by increased convection. The improvement is, therefore, not reflected in the temperature statistics but only in user surveys. These were carried out and underline the positive effect in user satisfaction [24]. According to DIN EN 16798-1, increasing the air speed in the occupied area by 0.6 m/s at room temperatures above 25 °C raises the acceptance range under high temperature conditions by 1.2 K under the precondition of individual control, as shown in Table B.1.3-1 in [20].
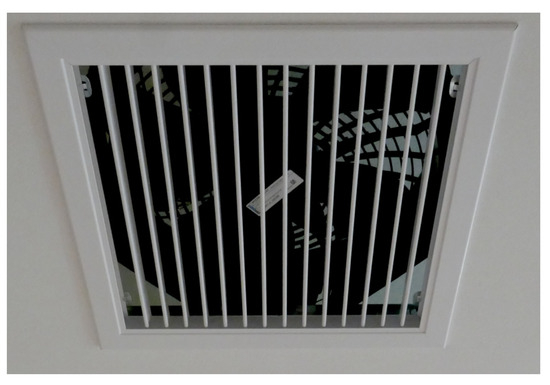
Figure 10.
Detail of an individual ceiling fan in the LRAD building. An adjustable grid was applied below the fan to allow focsing the air movement to the workplaces.
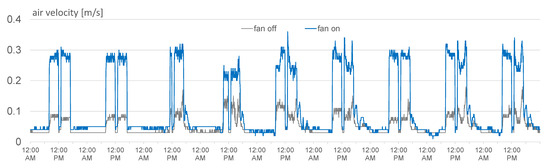
Figure 11.
A total of 9 days of measuring the air velocity in 1.1 m height above the floor (=shoulder of a seated person) at two opposed workplaces in a test office with a desk distance of 2.15 m. One fan was automatically switched using a fixed daily schedule; the other fan always remains out of operation.
6. Conclusions
The investigation aims to correlate the indoor comfort to the building concept (architecture, building construction, technical services, and building management) and the user behaviour to answer the question about suitability of the strategies, namely for the predicted climate change.
The study based on two office buildings in Germany has highlighted key challenges in the new construction and refurbishment of this type of building. In view of climate change, it is becoming increasingly difficult to fully operate such buildings in the expected summer comfort range in central Europe with efficient shading and air-based passive cooling measures alone. At indoor temperatures of more than 28 °C the upper boundaries of the adaptive comfort approach appear questionable in describing thermal comfort. Therefore, planners should not design buildings at the limits of current legal requirements [26]. Namely, large glazed areas without solar-control glass or fixed shading decrease the robustness of a building and makes it more sensitive to non-appropriate operation of moveable shading or windows [27].
Suitable future climate data sets are available on national or international scales to evaluate the thermal performance in advance considering increased ambient temperatures and heat waves [28,29]. Within the framework of IEA EBC Annex 80, a set of free downloadable weather data sets for representative worldwide regions have recently been made available [30]. The legal requirements for summer thermal protection may be increased so as to not create the erroneous expectation that building just within the legal limits in practice achieves a positive rating by the users. Improvements are necessary so that decentralised air condition systems are not retrofitted and energy consumption will increase accordingly [31]. Introducing individual ceiling fans per workplace was found to be a suitable measure to extend the range of acceptance for higher indoor temperature as one measure of personal control [17,24].
Adequate winter air quality without operating a mechanical ventilation system is very much dependent on the handling of window opening as long as no automation is undertaken. Motor-operated windows and their automation mean a high investment and a complex automation task [12,31]. Automatic window opening may temporarily create local discomfort near the facade. Discomfort created by automatic control stimulates conflicts with user preferences whereas discomfort created by manual control is found to be more accepted [32]. Against this background, introducing CO2 traffic lights at the workplaces combined with manual window handling in each room can achieve significant improvements at low investment and fewer conflicts.
In contrast to the buildings studied, the vast majority of office buildings in Germany are not used by the owners themselves but are rented properties. While owner–occupiers complain to the planners, dissatisfaction in rented properties may lead to rent reductions or vacancies and, thus, to direct economic consequences for the owners. The operation of office buildings should not reduce the performance of employees through thermal stress or poor air quality. In this respect, measures should be taken if the monitored conditions are not mainly caused by inadequate user behaviour.
The 2021 amendment of the EC Energy Performance Directive indicates that, for new office buildings, a monitoring system for indoor air quality is mandatory [2]. Existing buildings should be equipped within the framework of major renovation, such as the LRAD example. With the large number of measurements of rooms per building, it could be shown that results can differ significantly. In this respect, it does not seem appropriate to use reference rooms for an assessment of an entire building. This should be taken into account for the planning of a BMS. In addition, care must be taken to qualify the measuring points, as they are now used for more than just control purposes [7].
Author Contributions
Writing K.V., Investigation, K.V. and T.V. and data curation M.K. All authors have read and agreed to the published version of the manuscript.
Funding
The KVM was investigated as part of a grant from the European Regional Development Fund (ERDF) ‘Investments in Growth and Employment’ in conjunction with funding from the Ministry of Home Affairs, Municipal Affairs, Building and Equality of the State of North Rhine-Westphalia (MHKBG NRW), grant reference EFRE-0400129. The measurements in the LRAD building were the subject of a grant from the Federal Ministry of Economy and Climate Action (BMWK) under grant reference 03ET1563D.
Acknowledgments
The authors would like to thank the building owners and users for their positive cooperation and support.
Conflicts of Interest
The authors declare no conflict of interest.
References
- de Wilde, P. The gap between predicted and measured energy performance of buildings: A framework for investigation. Autom. Constr. 2014, 41, 40–49. [Google Scholar] [CrossRef]
- Proposal for the Recast of the Directive of the European Parliament and of the Council on the Energy Performance of Buildings (Recast, 2021). Available online: https://eur-lex.europa.eu/legal-content/EN/TXT/?uri=CELEX%3A52021PC0802&qid=1641802763889 (accessed on 18 September 2023).
- Gesetz zur Weiterentwicklung des Klimaschutzes in Baden-Württemberg, Landtag von Baden-Württemberg, Drucksache 16/8993. 2021. Available online: https://www.landtag-bw.de/files/live/sites/LTBW/files/dokumente/WP16/Drucksachen/8000/16_8993_D.pdf (accessed on 18 September 2023).
- Example: German Federal Subsidies for Energy and Resource Efficiency in the Commercial Sector. Available online: https://www.kfw.de/PDF/Download-Center/F%C3%B6rderprogramme-(Inlandsf%C3%B6rderung)/PDF-Dokumente/6000004390_M_295_Anlage_TMA_Modul2.pdf (accessed on 18 September 2023).
- Salis, L.C.R.; Abadie, M.; Wargocki, P.; Rode, C. Towards the definition of indicators for assessment of indoor air quality and energy performance in low-energy residential buildings. Energy Build. 2017, 152, 492–502. [Google Scholar] [CrossRef]
- Wyon, D.P. The Effects of Indoor Air Quality on Performance and Productivity. Indoor Air 2004, 14, 92–101. [Google Scholar] [CrossRef] [PubMed]
- Loomans, M.G.L.C.; Mishra, A.S.; Kooi, L. Long-term monitoring for indoor climate assessment—The association between objective and subjective data. Build. Environ. 2020, 179, 106978. [Google Scholar] [CrossRef]
- Calì, D.; Kindler, E.; Ebrahimy, R.; Bacher, P.; Hu, K.; Østrup, M.L.; Bachalarz, M.; Madsen, H. Climify.org: An online solution for easy control and monitoring of the indoor environment. E3S Web Conf. 2019, 111, 05006. [Google Scholar] [CrossRef]
- Raimondo, D.; Corgnati, S.P.; Olesen, B. Measurement and Description of Total Energy Use and Indoor Climate Quality in Buildings Applied to an Office Building by Field Monitoring, CLIMA 2013. Available online: https://www.researchgate.net/publication/273131735_Measurement_and_Description_of_Total_Energy_Use_and_Indoor_Climate_Quality_in_Buildings_Applied_to_an_Office_Building_by_Field_Monitoring (accessed on 18 September 2023).
- Künz, C.; Voss, K. Klimadaten und Klimawandel—Untersuchungen zum Einfluss auf den Energiebedarf, den Leistungsbedarf und den thermischen Komfort von Gebäuden. Bauphysik 2012, 34, 189–196. [Google Scholar] [CrossRef]
- Rissetto, R.; Rambow, R.; Schweiker, M. Assessing comfort in the workplace: A unified theory of behavioural and thermal expectations. Build. Environ. 2022, 216, 109015. [Google Scholar] [CrossRef]
- Hugentobler, W.; Widerin, P.; Junghans, L.; Bruijn, W. Do Healthy Buildings Need Technology? In Proceedings of the Healthy Buildings 2016, Ghent, Belgium, 3–8 July 2016; Available online: https://www.isiaq.org/docs/Proceedings.pdf (accessed on 18 September 2023).
- Balaras, C.A.; Grossmann, G.; Henning, H.-M.; Ferreira, C.A.I.; Podesser, E.; Wang, L.; Wiemken, E. Solar air conditioning in Europe—An overview. Renew. Sustain. Energy Rev. 2007, 11, 299–314. [Google Scholar] [CrossRef]
- Santamouris, M. (Ed.) Cooling Energy Solutions for Buildings and Cities; World Scientific: Singapore, 2019; ISBN 978-981-323-696-7. [Google Scholar] [CrossRef]
- Werber, S. European space cooling demands. Energy 2016, 110, 148–156. [Google Scholar] [CrossRef]
- Voss, K.; Nengel, N.; Berges, M.; Kirant-Mitic, T. Dezentrales Monitoring als Beitrag zur Verbesserung des Raumklimas und der Betriebsführung von Nichtwohngebäuden. Bauphysik 2021, 43, 314–325. [Google Scholar] [CrossRef]
- Voss, K.; Voß, T.; Otto, J.; Schweiker, M.; Rodriguez-Ubinaz, E. Investigation of ceiling fans for improving summer thermal comfort. In Proceedings of the 2nd Central European Symposium on Building Physics, Vienna, Austria, 9–11 September 2013; Available online: https://www.researchgate.net/publication/256802634_Investigation_of_ceiling_fans_for_improving_summer_thermal_comfort#fullTe (accessed on 8 September 2023).
- Available online: https://www.ic-meter.com/uk/ (accessed on 5 September 2023).
- Available online: https://www.netatmo.com/de-de/smart-weather-station (accessed on 5 September 2023).
- DIN EN 16798-1:2022; Energy Performance of Buildings—Ventilation for Buildings—Part 1: Indoor Environmental Input Parameters for Design and Assessment of Energy Performance of Buildings Addressing Indoor Air Quality, Thermal Environment, Lighting and Acoustics. Beuth Publisher: Berlin, Germany, 2022.
- DIN EN 15251:2012; Indoor Environmental Input Parameters for Design and Assessment of Energy Performance of Buildings Addressing Indoor Air Quality, Thermal Environment, Lighting and Acoustics. Beuth Publisher: Berlin, Germany, 2012.
- Schweiker, M.; Brasche, S.; Bischof, W.; Hawighorst, M.; Voss, K.; Wagner, A. Development and validation of a methodology to challenge the adaptive comfort model. Build. Environ. 2012, 49, 336–347. [Google Scholar] [CrossRef]
- Ghadeer, D.; Voss, K. Optimizing Automated Shading System by Exploring Occupant Behaviour and Comfort in Office Environment. In Proceedings of the Healthy Buildings, Aachen, Germany, 11–14 June 2023. [Google Scholar]
- Knudsen, M.; Rissetto, R.; Carbonare, N.; Wagner, A.; Schweiker, M. Comfort and Economic Viability of Personal Ceiling Fans Assisted by Night Ventilation in a Renovated Office Building. Buildings 2023, 13, 589. [Google Scholar] [CrossRef]
- Hobeika, N.; Garcia-Sanchez, C.; Bluyssen, P.M. Assessing Indoor Air Quality and Ventilation to Limit Aerosol Dispersion—Literature Review. Buildings 2023, 13, 742. [Google Scholar] [CrossRef]
- Attia, S.; Benzidane, C.; Rahif, R.; Amaripadath, D.; Hamdy, M.; Holzer, P.; Koch, A.; Maas, A.; Moosberger, S.; Petersen, S.; et al. Overheating calculation methods, criteria, and indicators in European regulation for residential buildings. Energy Build. 2023, 292, 113170. [Google Scholar] [CrossRef]
- Karjalainen, S. Should we design buildings that are less sensitive to occupant behaviour? A simulation study of effects of behaviour and design on office energy consumption. Energy Effic. 2016, 9, 1257–1270. [Google Scholar] [CrossRef]
- Future Climate Test Reference Years for Germany. Available online: https://www.bbsr-geg.bund.de/GEGPortal/DE/Regelungen/Testreferenzjahre/TRY2011/TRY2011Projekt/01_start.html?nn=4054034&cms_pos=2 (accessed on 5 September 2023).
- Software to Generate Future Climate Data Sets Worldwide. Available online: https://meteonorm.com/ (accessed on 5 September 2023).
- Future Climate Data Sets for International Reference Locations. Available online: https://annex80.iea-ebc.org/weather-data (accessed on 5 September 2023).
- Walther, K.; Kalpkirmaz Rizaoglu, I.; Kirant-Mitic, T.; Derbas, G. Building 2226 on the Test Bench—Simulation Study on the Relocated 2226 Building by Baumschlager Eberle, Building Simulation 2021—Bruges. Available online: https://www.btga-arch.uni-wuppertal.de/fileadmin/architektur/btga-arch/06_Ver%C3%B6ffentlichungen/Vortr%C3%A4ge/bs2021_2226_report_wuppertal_210620.pdf (accessed on 23 September 2023).
- Luo, M.; Cao, B.; Wenjie, J.; Ouyang, Q.; Lin, B.; Zhu, Y. The underlying linkage between personal control and thermal comfort: Psychological or physical effects? Energy Build. 2016, 111, 56–63. [Google Scholar] [CrossRef]
Disclaimer/Publisher’s Note: The statements, opinions and data contained in all publications are solely those of the individual author(s) and contributor(s) and not of MDPI and/or the editor(s). MDPI and/or the editor(s) disclaim responsibility for any injury to people or property resulting from any ideas, methods, instructions or products referred to in the content. |
© 2023 by the authors. Licensee MDPI, Basel, Switzerland. This article is an open access article distributed under the terms and conditions of the Creative Commons Attribution (CC BY) license (https://creativecommons.org/licenses/by/4.0/).