1. Introduction
Agricultural production in the Mediterranean area includes a wide range of products (milk, olive oil, industrial crops, fruits, etc.). Due to established Mediterranean dietary preferences, the cultivation of vegetables and fruits holds a leading position in domestic agricultural production, reaching approximately 35% of the total production. Although the overall area of cultivated fields has not significantly changed during the past decade, greenhouse fields have shown a slight tendency of expansion and, since 2007, an increasing number of investments in state-of-the-art greenhouses have occurred [
1]. Similar trends regarding the replacement of conventional agriculture with various types of protected cropping have been noted in other European regions during the same period [
2]. European countries such as Spain and the Netherlands are leaders in the market of greenhouses, while France, Italy, and Greece follow in terms of construction and expertise [
3].
Cultivation in greenhouses allows for the accurate adjustment of environmental conditions, which contributes to higher yields and the enhanced quality of products [
4]. More specifically, greenhouses have attracted global agricultural interest due to their ability to meet the demand for the year-round production of high-quality goods, making effective and sustainable use of the resources available (water, energy, etc.) [
2]. Precise control of the greenhouse environment is achieved by adjusting growing factors such as temperature, light, and humidity. Among these factors, internal temperature is the most vital, affecting optimal plant growth and efficient production. It has been found that most essential biological and physiological activities of plants slow down at temperatures around 7 °C and terminate at 0 °C. Therefore, greenhouse temperatures are constantly controlled through appropriate systems of heating and cooling [
5].
Although protected cropping offers significant benefits when compared to open-field cultivation, it is also linked to certain difficulties that need to be considered. The extensive amounts of energy required for the maintenance of a stable cultivation environment remains one of the most important issues in greenhouse production, situating modern protected agriculture among the most energy-intensive fields within the agricultural industry [
2,
6]. According to the existing literature, the energy required for maintaining climate conditions in greenhouses incurs the second highest operational costs, following labor [
7]. In areas with cold climates, energy costs can even reach 80% of the remaining expenses when the labor force is excluded. Most of this energy is consumed for heating purposes. Other major operational costs, apart from heating and labor expenses, relate to capital investment, raw materials, marketing, and humidity control [
7]. Other studies also confirm that heating costs when operating greenhouses can constitute up to 40% of the total production expenses. Thus, one of the main goals of contemporary greenhouse applications is to substantially reduce energy costs [
3].
The evaluation of future investments in the protected agriculture sector requires the accurate estimation of greenhouse energy costs. The development and utilization of thermal models is an approximate and cost-effective way to improve the management of greenhouses and draw conclusions concerning the feasibility of possible investments [
8]. The improvement of prediction accuracy is possible when thermal models are used. These models consider three fundamental factors: the meteorological conditions of the area, the cultivation requirements of the plants, and the technical characteristics of the greenhouse [
3]. More specifically, among the climatic factors, it is mainly the regional ambient temperature and solar radiation that affect plant growth and determine energy demands. As far as the cultivation of crops is concerned, the specific temperature cultivation range, which varies for different products, plays a vital role in achieving optimal productivity and delivering year-round output. Finally, the technical characteristics of the greenhouse construction, linked to the covering material and shading system, determine the amount of heat lost during production. Combining the aforementioned factors, three modes of greenhouse operation can be identified: heating is required when the ambient temperature is lower than the minimum setpoint temperature of the plant cultivation range, cooling is essential when the ambient temperature is higher than the maximum setpoint temperature, and there is no need for heating or cooling when the ambient temperature lies within the plant cultivation range.
So far, several studies have been conducted that aim to estimate heating requirements during the protected cultivation of vegetables. Most of the existing publications refer to specific case studies, in which mathematical models are proposed for calculating the annual thermal needs of greenhouses. For example, in a recent study, the annual heating requirements for the production of three vegetables typically grown in greenhouses were estimated, employing the GREENHEAT model and considering a greenhouse located in Saskatoon, Canada. The results indicated that the energy demanded for greenhouse heating to cultivate pepper, cucumber, and tomato was 487, 460, and 413 kWh/m
2 per year, respectively. The increased energy requirements were attributed to the higher optimal cultivation temperature ranges of the plant species [
8]. In another research paper, a case study of greenhouses located in five different regions of Turkey was conducted and the heating requirements were determined, taking into consideration the local climatic data. An assumption was made that the inside air temperature considered optimal for vegetable growth was 16 °C. The total annual energy requirements were found to lie within the range of 100–290 kWh/m
2, according to the region. Total hourly and annual costs per hectare were also calculated and were found to be, on average, USD 29/h and USD 151/year, respectively [
5]. Another, more extensive comparative research paper focused on the estimation of energy needed for the production of greenhouse tomatoes in 56 locations with different latitudes. The structure of the greenhouses was considered to be constant to avoid fluctuation (Venlo-type state-of-the-art greenhouse) and the minimum optimal ambient temperature for tomato production was set at 14 °C. The findings showed that annual heating demands, which correspond to the most important tomato producers, were located within the range of 45–236 kWh/m
2. The countries with the highest energy needs were Estonia, Finland, Lithuania, and Latvia, with values over 444 kWh/m
2 per year, whereas the countries with the lowest heating requirements were Malta, Lebanon, Israel, and Egypt, with values between 16 and 36 kWh/m
2 per year. The model proposed in the paper can be used as a simple tool to estimate heating requirements and evaluate possible investments in tomato greenhouses within the Mediterranean area [
9].
Modern greenhouses with heating capabilities are already spread all over Europe and it is known that energy management is a crucial part of their function. Nevertheless, there are limited data available regarding energy requirements for heating purposes, as well as optimal operational greenhouse interior temperatures. The reason for this lack of information is either that cultivators do not keep track of such information or that they avoid sharing it [
9]. The research already conducted on the topic is not very extensive, since most of the existing publications refer to case studies, which either focus on the production of a specific product in greenhouses (e.g., tomatoes, as mentioned above) or are locally limited to a certain region/country (e.g., Turkey) [
5,
9]. There is a general lack of holistic studies simultaneously examining the effects of greenhouse location, the product cultivated, and the greenhouse construction characteristics on the total energy consumption.
This paper is based on the recent work by Tataraki et al. [
3,
10], which is further extended here. Although Tataraki et al. mainly deal with combined heat and power generation for greenhouse applications, a limited part of their research refers to energy estimation using thermal models. In the first study [
10], a simple, steady-state model was developed for estimating the thermal energy required for the heating and cooling of a greenhouse, considering product temperature needs and meteorological data. The analysis was conducted for three locations in Greece and for two different products, tomato and cucumber. The feasibility of combined cooling and heating power systems in greenhouses was further assessed. In the second study [
3], a comparative analysis was performed to investigate the potential of cogeneration among all EU countries and cost effectiveness in the protected cultivation sector. In this context, heating and cooling requirements were estimated for an accepted cultivation range limited to 15–25 °C, which corresponds to tomato production.
The current manuscript extends the work of Tataraki et al. [
3], estimating annual heating and cooling demands for nine different products with temperature cultivation ranges from 10 to 30 °C, along with the required heating, cooling, and zero-energy periods. The greenhouse thermal model suggested in Tataraki’s study [
10] serves as a modeling foundation in the current research. In Tataraki’s papers, a greenhouse case study with specific technical data was assumed, whereas, in the current study, specific emphasis is placed on evaluating the effect of various greenhouse construction characteristics on annual energy needs.
Thus, the main objective of this study is to estimate and compare the annual heating and cooling demands for producing commonly cultivated products in Europe, along with the required heating, cooling, or zero-energy periods.
The main innovation of this paper is the suggestion of a simple model that allows for the prediction of energy requirements for various types of greenhouses in Europe, according to their technical characteristics, the geographical location, and the cultivation specifications of the selected plants.
2. Materials and Methods
2.1. Greenhouse Thermal Model
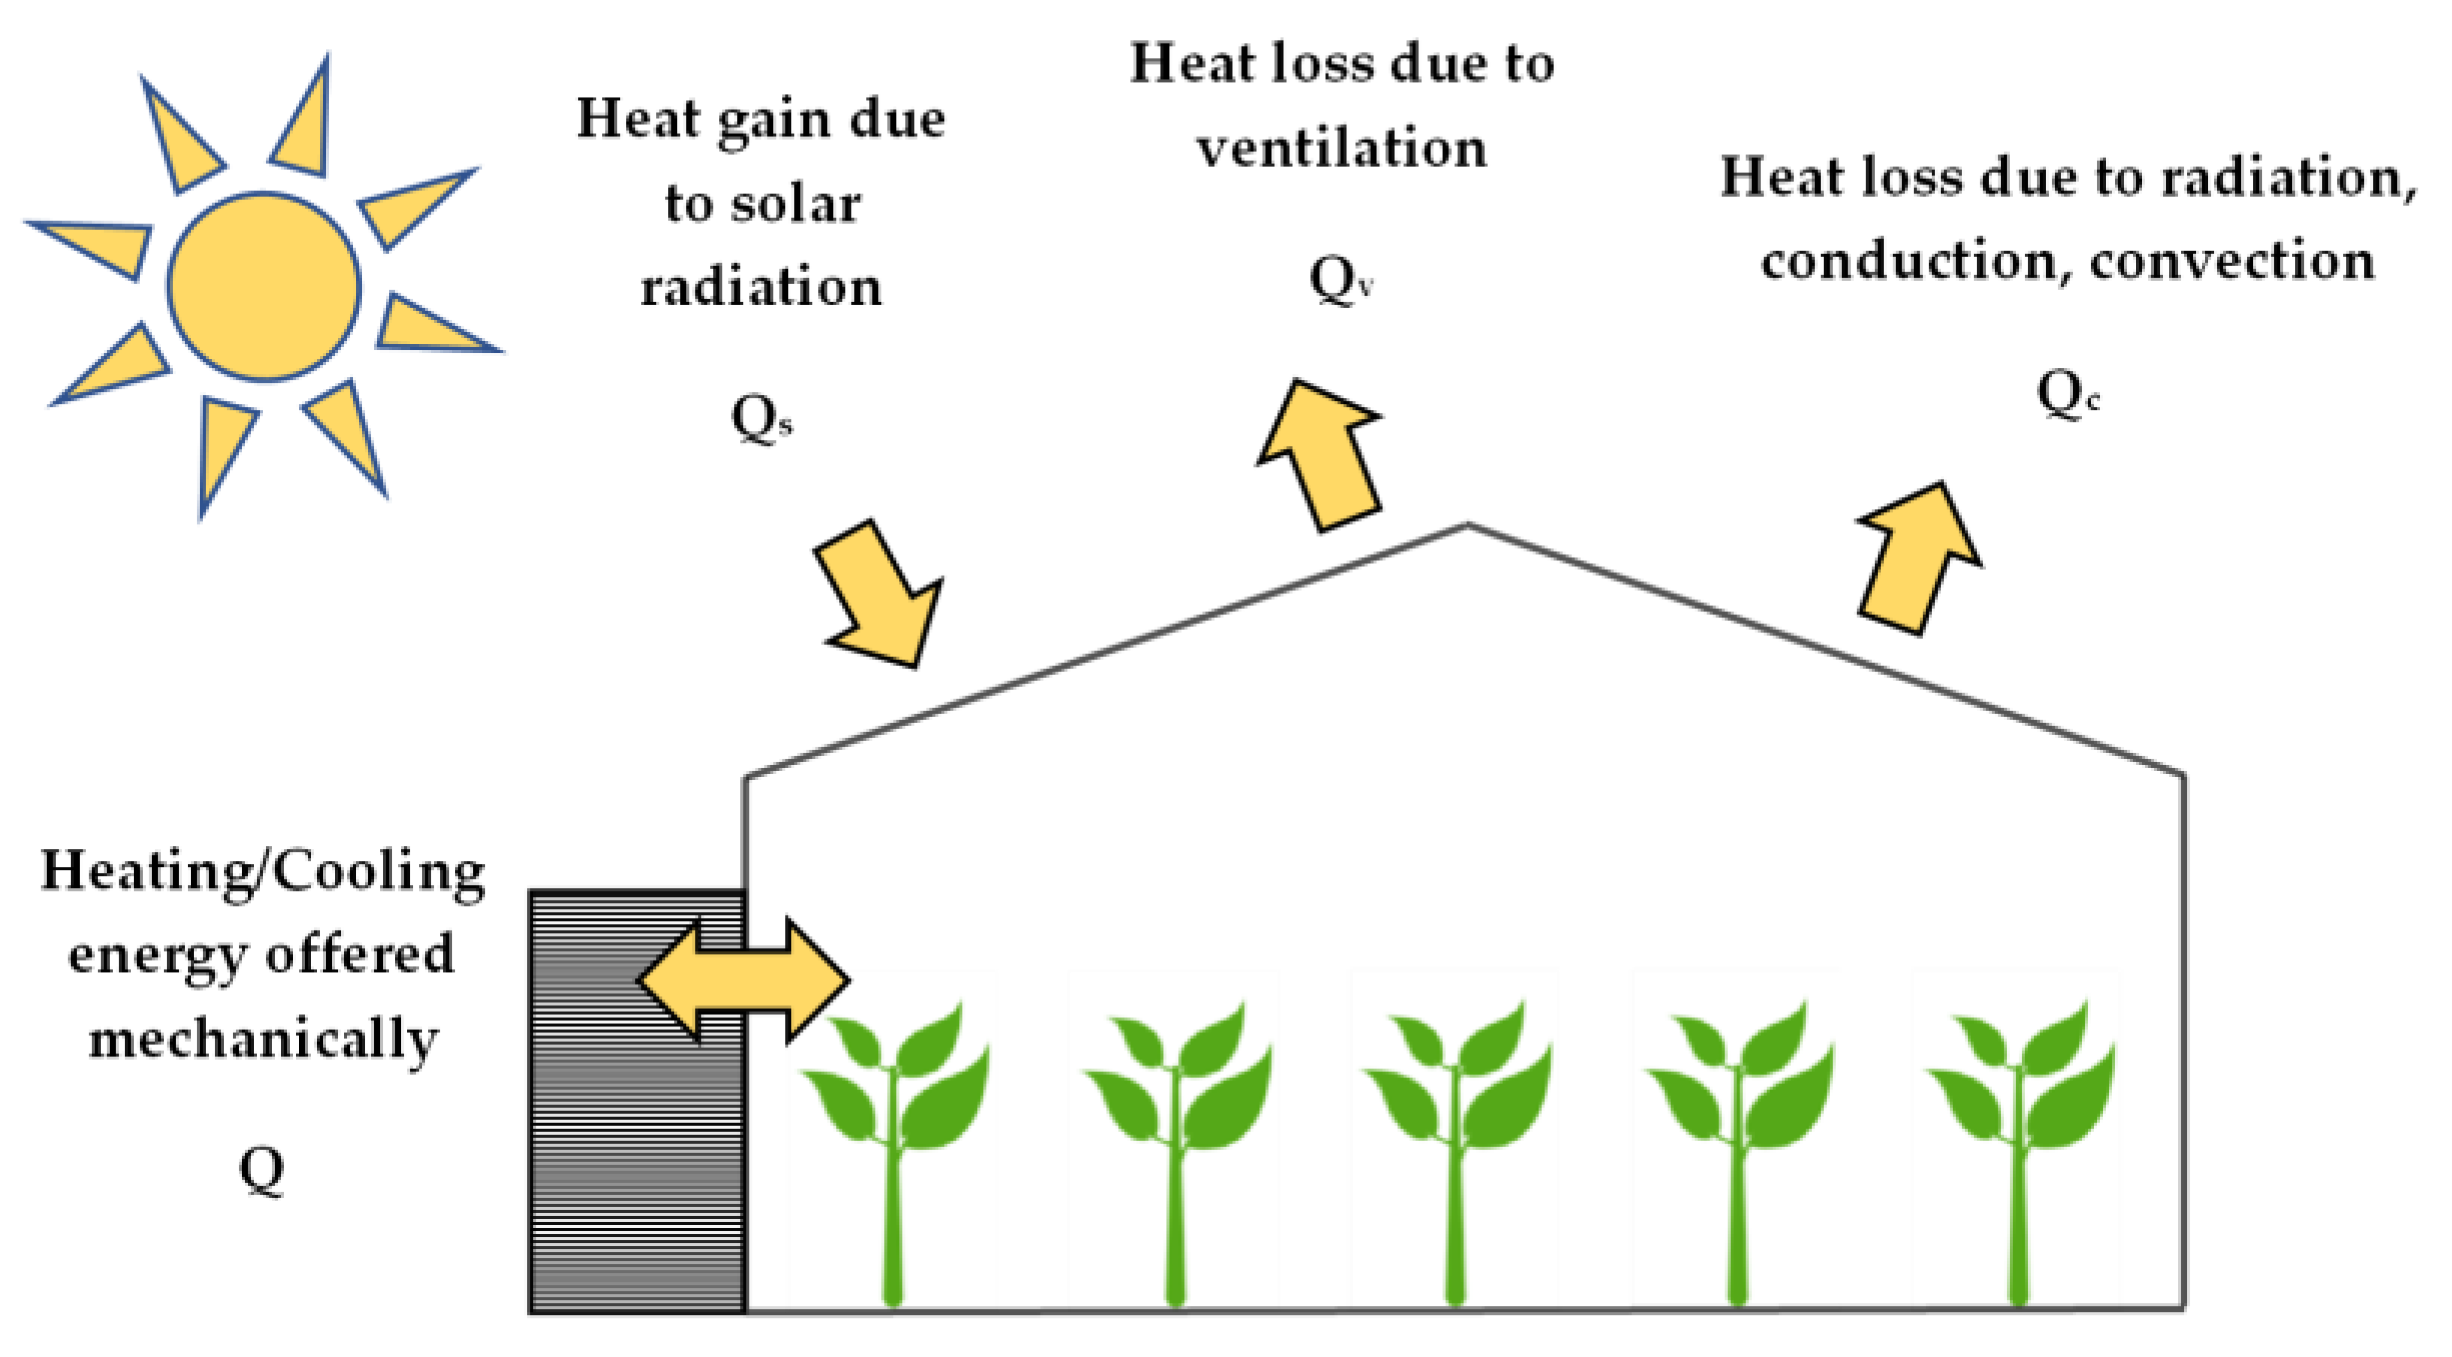
The estimation of the heating and cooling requirements of protected cultivation is based on a mathematical model that can be applied to the greenhouse environment system and describes the heat transfer processes that take place. The quasi-steady-state model is based on the energy balances of the greenhouse and on energy transport phenomena [
11]. Heat loss in a greenhouse mainly occurs in two ways: (a) by radiation, conduction, and convection, and (b) by ventilation.
The overall greenhouse ventilation comprises infiltration and controlled ventilation. Infiltration includes the unwanted heat exchange, which happens through small gaps in the greenhouse covering material and cannot be controlled [
12]. However, significant heat transfer in a greenhouse occurs through controlled ventilation; this can either be natural or mechanical and allows for the regulation of indoor temperature and humidity.
The natural source of heat gain is solar radiation. From the total radiation that reaches the surface of a greenhouse, one part is reflected by the covering material, and the other part is transmitted through it. From the inserted energy, one part is absorbed and the remainder is reflected into the environment. Absorbed energy is the energy that contributes to the heat balance, by raising or maintaining the greenhouse temperature.
The energy exchange that occurs in a typical greenhouse is illustrated in
Figure 1. Since the current study mainly refers to high-tech, commercial-scale hydroponic greenhouses, heat transfer between the indoor air and the ground is considered negligible due to the assumption that flooring material with high thermal insulation properties is used.
Energy balance in a greenhouse can be described by the following equation:
where:
Qs kWh/m2/d—the heat gain due to solar radiation;
Q kWh/m2/d—the energy mechanically offered to or removed from the greenhouse;
Qc kWh/m2/d—the heat loss due to radiation, conduction, and convection; and
Qv kWh/m2/d—the heat loss due to ventilation.
The energy
Q required to maintain the interior greenhouse air temperature within specific limits is either offered to the greenhouse (
Q > 0), in the case of heating, or removed from it (
Q < 0), in the case of cooling. Concerning greenhouse heating, boilers or air unit heaters are commonly used systems, whereas, for cooling heat pumps, the fan–pad and fog–mist methods are often employed [
12].
The heat due to solar radiation transmitted through the greenhouse covering material can be determined using the following equation:
where:
Qs kWh/m2/d—the heat gain due to solar radiation;
τ the transmittance of the greenhouse cover;
α the overall effective absorbance of the greenhouse; and
S kWh/m2/d—the amount of solar radiation.
If the greenhouse cover consists of a single material, the transmittance value is the one referring to that material. For greenhouse covers containing two different materials (e.g., single glass and thermal curtains), the total transmittance (τ) is the product of the two values related to the materials (τ1 × τ2).
Heat loss due to radiation, conduction, and convection is given by the following equation:
where:
Qc kWh/m2/d—the heat loss due to radiation, conduction, and convection;
Uc kW/m2K—the greenhouse heat loss coefficient due to radiation, conduction,
and convection;
T °C—the required interior greenhouse temperature; and
Tα °C—the ambient temperature.
Heat loss due to ventilation (
Qv) includes both the heat loss due to infiltration (unwanted heat loss due to air leakage) and the heat loss due to ventilation that is handled by the greenhouse’s controlling systems. It is given by the following equation:
where:
Qv kWh/m2/d—the heat loss due to ventilation;
m kg/s/m2—the mass flow rate of air;
Cp J/kgK—the specific heat capacity of air;
T °C—the interior greenhouse’s required temperature;
Tα °C—the ambient temperature;
N s−1—the ventilation rate;
ρ kg/m3—the density of the air; and
H m—the greenhouse height.
During periods during which a greenhouse is tightly closed and ventilation is not allowed (e.g., winter), Qv takes its minimum value and is equal to the heat loss due to infiltration. On the other hand, during periods when ventilation is needed (e.g., summer), the value of Qv is larger than the heat loss due to infiltration.
The greenhouse heat loss coefficient due to ventilation (
Uv) can be defined as:
So, Equation (4) can be rewritten as:
Consequently, the greenhouse overall heat loss coefficient (
UL) can be defined as:
where:
UL kW/m2K—the greenhouse overall heat loss coefficient;
Uc kW/m2K—the greenhouse heat loss coefficient due to radiation, conduction,
and convention; and
Uv kW/m2K—the greenhouse heat loss coefficient due to ventilation.
The determination of the total greenhouse energy demands for the cultivation of a plant species in a certain region depends on three main factors:
- (a)
the meteorological conditions of the region, mainly the ambient air temperature and solar radiation;
- (b)
the required environmental conditions for the cultivation of the plant, primarily, the optimal temperature range; and
- (c)
the construction characteristics of the greenhouse—specifically, the overall heat loss coefficient, the transmittance of the cover, the transmittance of the additional shadowing cover, and the overall effective absorbance value [
3,
13].
In this work, the following greenhouse thermal model is proposed for the determination of greenhouse heating and cooling requirements when protected cultivation is in progress. Daily greenhouse heating and cooling energy requirements are given by the following equations, the development of which was based on the existing literature [
3,
14]:
where:
Qh,j kWh/m2/d—the greenhouse daily heating load during day j;
j the number of the day of the year (j = 1, … 365);
UL kW/m2K—the greenhouse effective overall heat loss coefficient;
Tsp,min °C—the minimum required optimal product cultivation temperature;
Tj °C—the daily average ambient temperature during day j;
Tsp,max °C—the maximum required optimal product cultivation temperature;
τ1 the transmittance of the greenhouse cover;
α the overall effective absorbance of the greenhouse;
Sj kWh/m2/d—the daily total solar radiation during day j;
Qc,j kWh/m2/d—the greenhouse daily cooling load during day j; and
τ2 the transmittance of the additional shadowing cover during hot days.
The minimum required optimal product cultivation temperature Tsp,min (minimum greenhouse setpoint temperature) is the difference between the average plant cultivation temperature (Tp) and the cultivation temperature range (ΔTp), whereas the maximum optimal required product cultivation temperature (maximum greenhouse setpoint temperature) is the sum of the average plant cultivation temperature (Tp) and the cultivation temperature range (ΔTp).
The annual heating and cooling requirements of a greenhouse are calculated by the following equations:
Apart from the total annual heating and cooling requirements, the maximum heating power and cooling power, which are related to the size of the heating and cooling system, are calculated as follows:
where:
Ph kW/m2—the maximum heating power;
Qh,j kWh/m2/d—the greenhouse daily heating load during day j;
Pc kW/m2—the maximum cooling power; and
Qc,j kWh/m2/d—the greenhouse daily cooling load during day j.
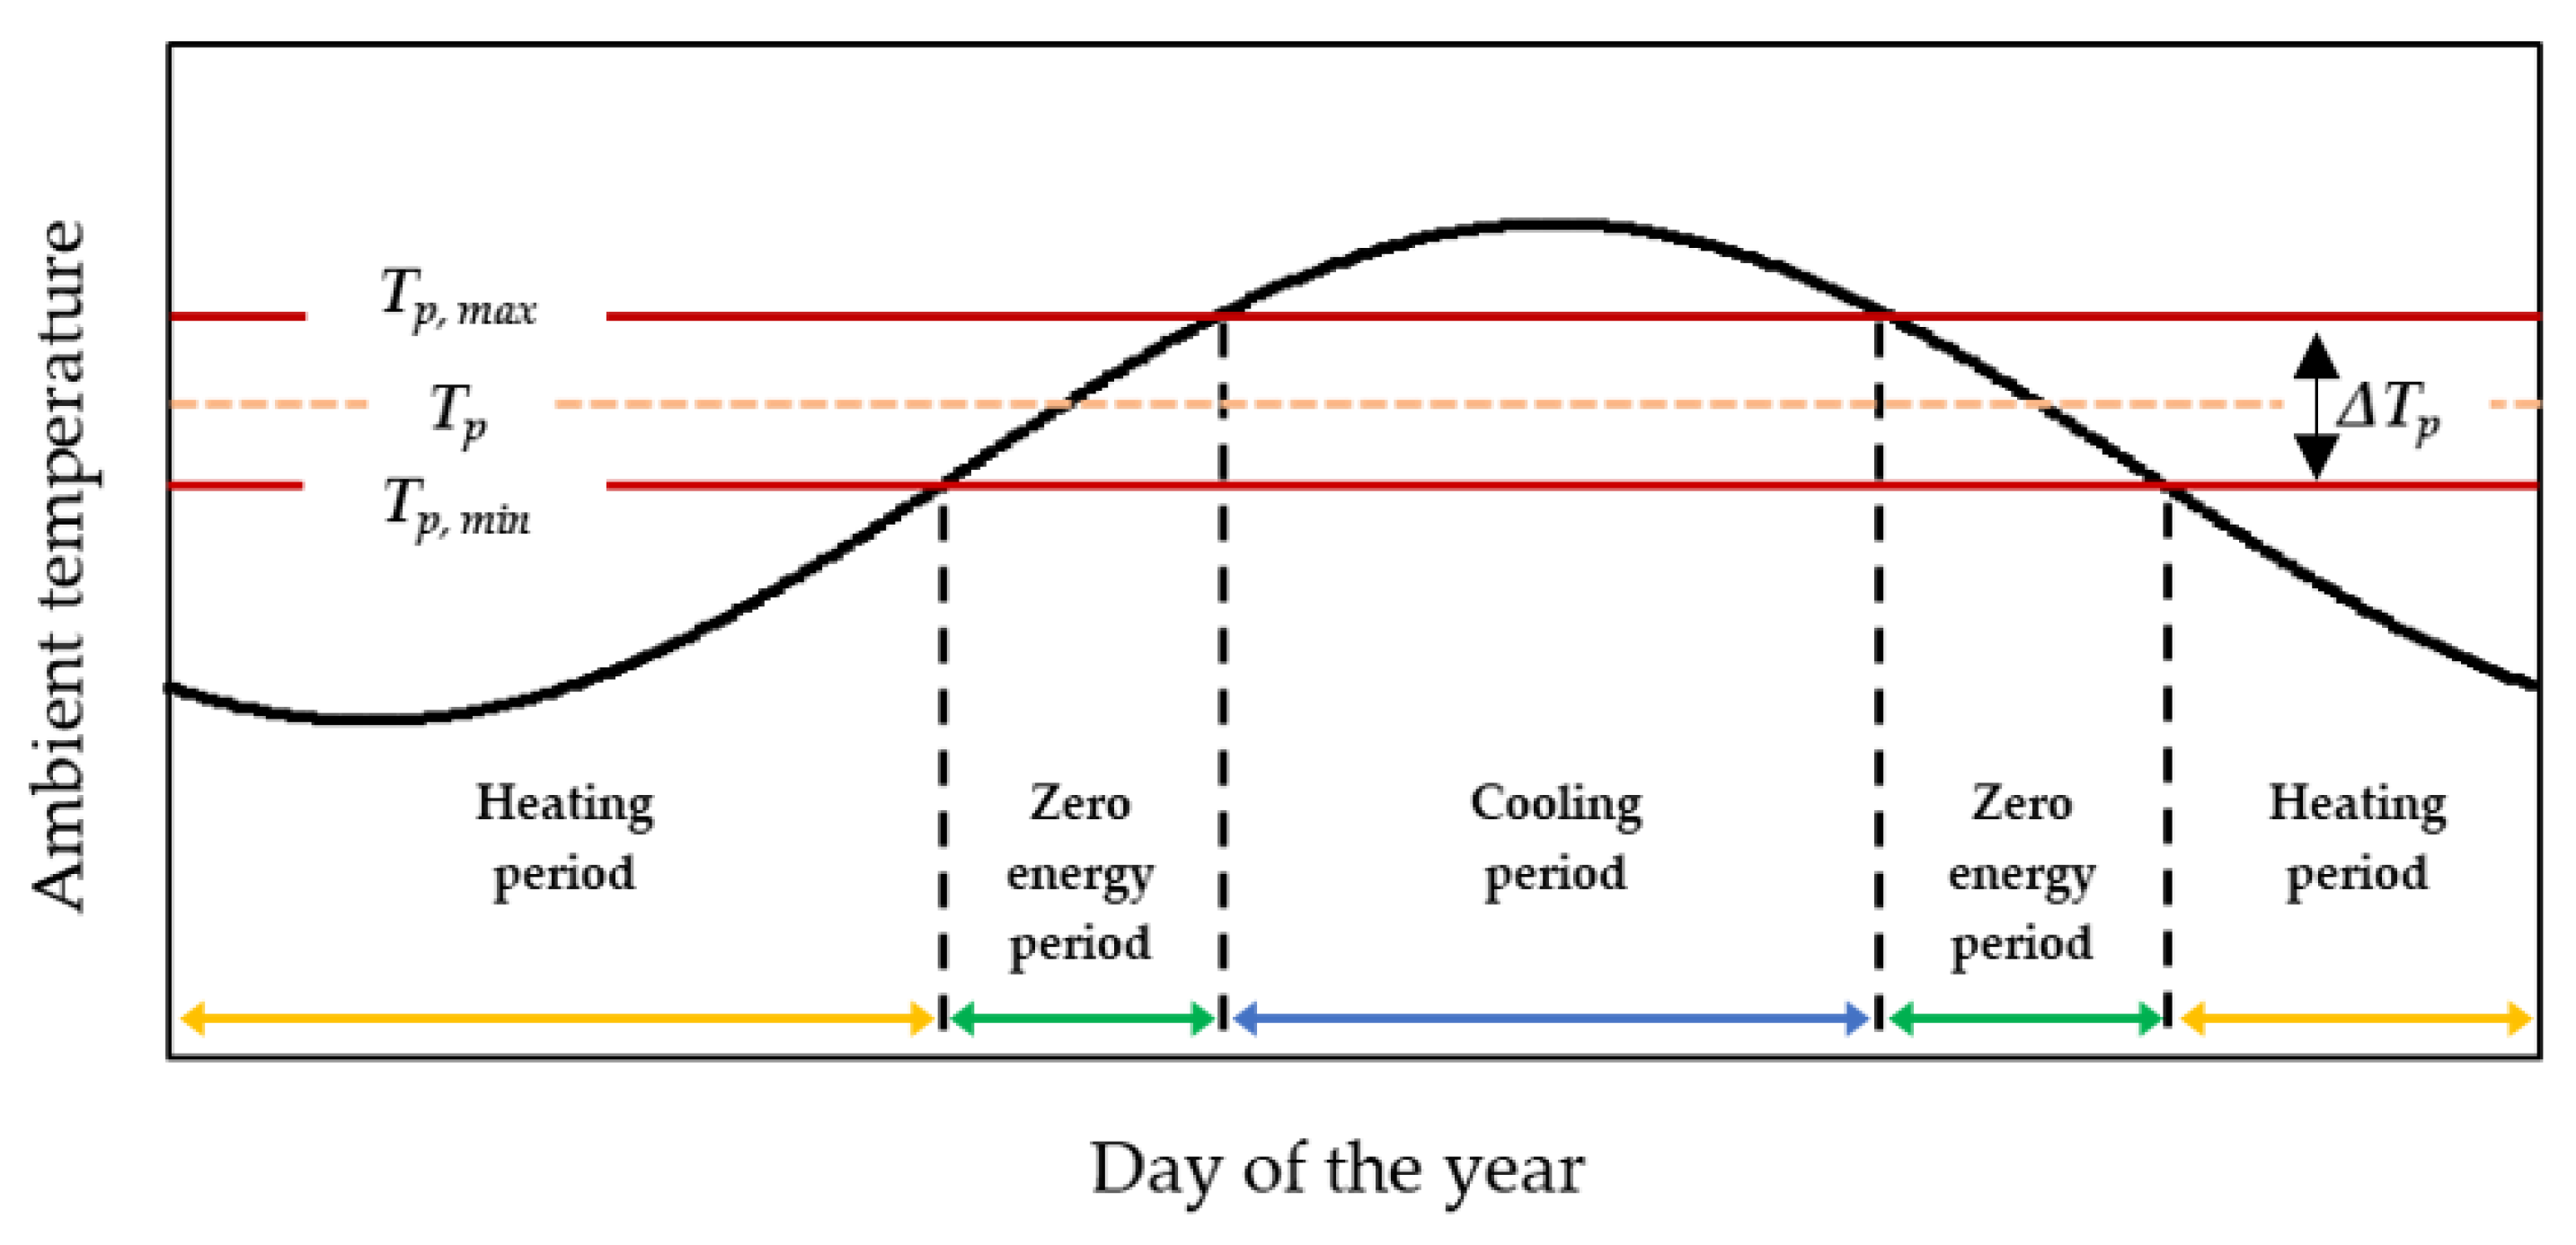
Knowledge of annual thermal requirements is crucial for the estimation of the total annual energy costs related to the operation of a greenhouse, in order that it can produce certain products all year round. However, thermal requirements are not evenly distributed throughout an operational year. Therefore, it is important to know the exact periods when heating, cooling, or no energy are needed. A typical greenhouse requires heating when the ambient temperature is lower than the minimum setpoint temperature (
Ta,j <
Tsp,min) and cooling when the ambient temperature is higher than the maximum setpoint temperature of the cultivated plant (
Ta,j >
Tsp,max). Consequently, an operational year of a greenhouse consists of three different time periods, defined by different energy needs (
Figure 2):
- (a)
periods during which greenhouse heating is required (heating periods) (τh);
- (b)
periods during which greenhouse cooling is required (cooling periods) (τc); and
- (c)
periods during which zero energy is required (zero-energy-requirement periods) (τz).
In order to utilize the thermal model equations proposed in this article (i.e., (8) and (9)), it is essential to have information concerning three kinds of parameters:
- (a)
the environmental conditions of the location;
- (b)
the cultivation requirements of the plants; and
- (c)
the technical characteristics of the greenhouse.
2.2. Greenhouse Construction Characteristics
Greenhouse design parameters, such as the covering material, glazing, etc., significantly affect the overall amount of energy consumed during its operation. Assessing greenhouse construction factors before proceeding with protected cultivation can lead to significant energy savings and the elimination of total production costs [
6]. The main attributes linked to the greenhouse construction characteristics are:
- (a)
the overall heat loss coefficient (UL);
- (b)
the transmittance of the greenhouse cover (τ1);
- (c)
the transmittance of the additional shadowing cover utilized during hot days (τ2); and
- (d)
the overall effective absorbance of the greenhouse (α).
According to Equation (7) presented above, the overall heat loss coefficient of a greenhouse is the sum of the heat loss coefficient due to radiation, conduction, and convection (Uc) and the heat loss coefficient due to ventilation (Uv).
Approximate heat loss values due to radiation, conduction, and convection for different covering materials are shown in
Table 1.
When the greenhouse is tightly closed, and natural or mechanical ventilation is not allowed, the heat loss coefficient due to ventilation (
Uv) equals the heat loss coefficient due to infiltration. In this case, the infiltration rate and the heat loss coefficient due to infiltration are considered; they vary according to the material and the construction of the greenhouse. Typical values are shown in
Table 2.
Transmittance (
τ1) values for the most common greenhouse covering materials are summarized in
Table 3.
Thermal curtains, often referred to as thermal blankets or screens, are materials used in cold weather conditions to cover the greenhouse rooftop and occasionally the walls. They operate as a thermal barrier between the indoor and outdoor environments of the greenhouse and they are used with the aim of reducing the amount of heat lost, which mainly occurs during the night. The average light transmission of the most common curtain materials is approximately 40% [
17]. To estimate the total transmission of single glass and double polyethylene when combined with thermal curtains as a covering material, 0.40 was multiplied by the simple covering material’s transmittance (0.86 and 0.71, respectively).
On hot days, additional greenhouse covers called shading nets are often used to protect plants from high levels of solar radiation. The transmittance of the net mainly depends on its color. Specific values according to the type of shading net utilized are shown in
Table 4 [
18].
In a study conducted in 2011, a greenhouse producing tomatoes was treated as a solar collector for calculating the solar radiation absorbance. The absorber plate was considered to be the floor soil and the collector cover was treated as though it consisted of three different semi-transparent layers (the plants, the water vapor, and the rooftop covering material). The solar radiation absorption of each component of the greenhouse is shown in
Table 5 [
19]. From the total absorbance of the greenhouse, one part is used as sensible heat to increase the greenhouse temperature (Equation (2)) and the remainder contributes to the evapotranspiration of the cultivated plants.
2.3. Cultivated Greenhouse Plants and Optimal Growth Conditions
Plant development generally depends on numerous factors. Ambient temperature is one of the most important parameters that determines the growth of a plant and the rate of its metabolic reactions [
20]. This is because the two basic functions of plants, photosynthesis and respiration, can only take place within a specific temperature range. Depending on the plant species, there are differences in the temperature limits within which normal growth is achieved. Each species is characterized by a minimum, a maximum, and an optimum temperature value. Acute or chronic exposure to extreme temperatures has been proven to significantly affect the functions of plants, such as development, pollination, and reproduction [
21].
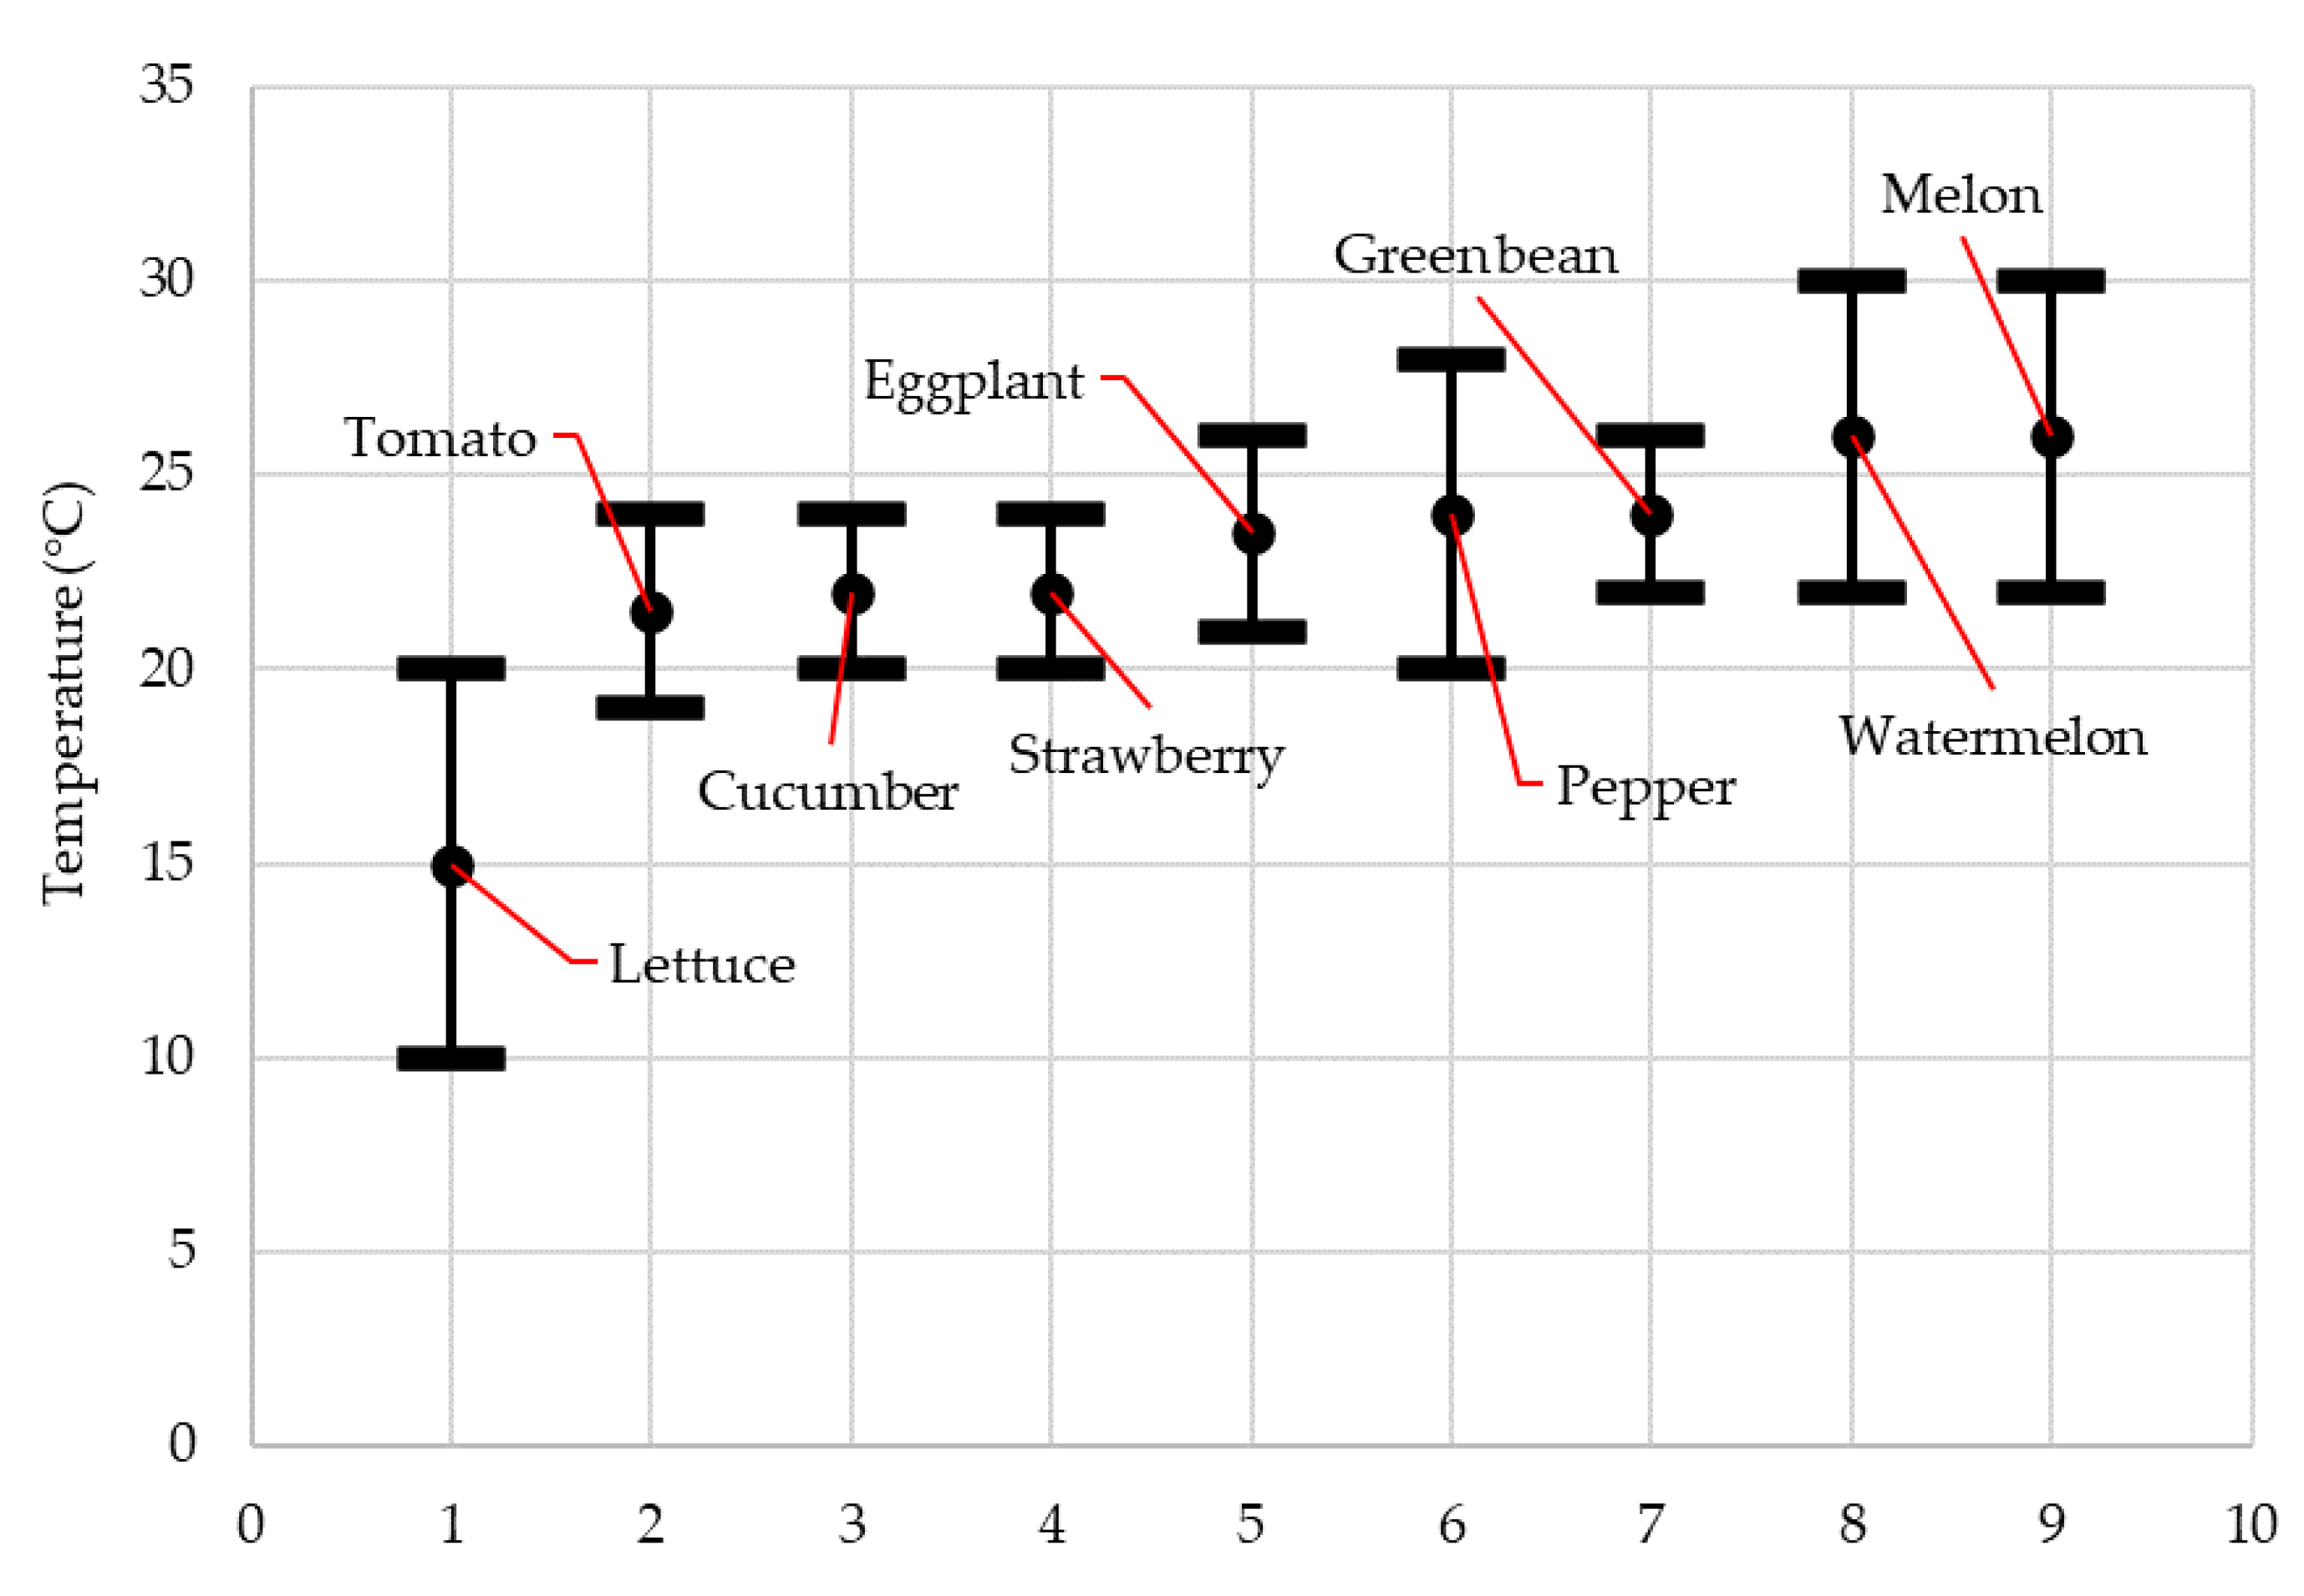
In this study, nine plants were examined, all of which are typically grown under controlled conditions in European countries (tomato, cucumber, pepper, lettuce, eggplant, strawberry, watermelon, melon, and green bean). For each species, the optimum cultivation temperature range (the setpoint temperature
Tsp and the accepted cultivation range Δ
Tc) were determined, according to the literature. The setpoint temperature is the mean of the temperature range. The results are summarized in
Table 6 and
Figure 3.
2.4. EU Meteorological Model
Estimating total greenhouse heating and cooling needs by utilizing the thermal model equations proposed in
Section 2.1 requires the consideration of specific temperature and solar radiation data. Ambient temperature and solar radiation are climatological characteristics that present seasonal variation and can be described using appropriate trigonometric functions [
14]. In this article, the following cosine functions were employed to calculate the daily average temperature and solar radiation values for each European country.
where:
Tj °C—the daily average ambient temperature during day j;
Tm °C—the annual average ambient temperature;
ΔT °C—the annual ambient temperature variation;
j the number of the day of the year (j = 1, … 365);
tto the day of the year with the lowest temperature value;
Sj kWh/m2/d—the daily total solar radiation during day j;
Sm kWh/m2/d—the daily average solar radiation during day j;
ΔS kWh/m2/d—the annual solar radiation variation; and
tso the day of the year with the lowest solar radiation value.
Actual meteorological data (daily ambient temperature and solar radiation records) referring to a 10-year period (2008–2018) for all 27 European countries were retrieved from Copernicus Climate Service ERA5 reanalysis [
26]. Equations (14) and (15) were fitted to these data and their six parameters were estimated. Three of the parameters are related to the ambient temperature and the other three to the solar radiation conditions. The parameters are as follows:
- (a)
annual average ambient air temperature (Tm);
- (b)
annual ambient air temperature variation (ΔT);
- (c)
day of the year that presents the lowest ambient temperature values (tto);
- (d)
annual average solar radiation (Sm);
- (e)
annual solar radiation variation (ΔS); and
- (f)
day of the year that presents the lowest radiation values (tso).
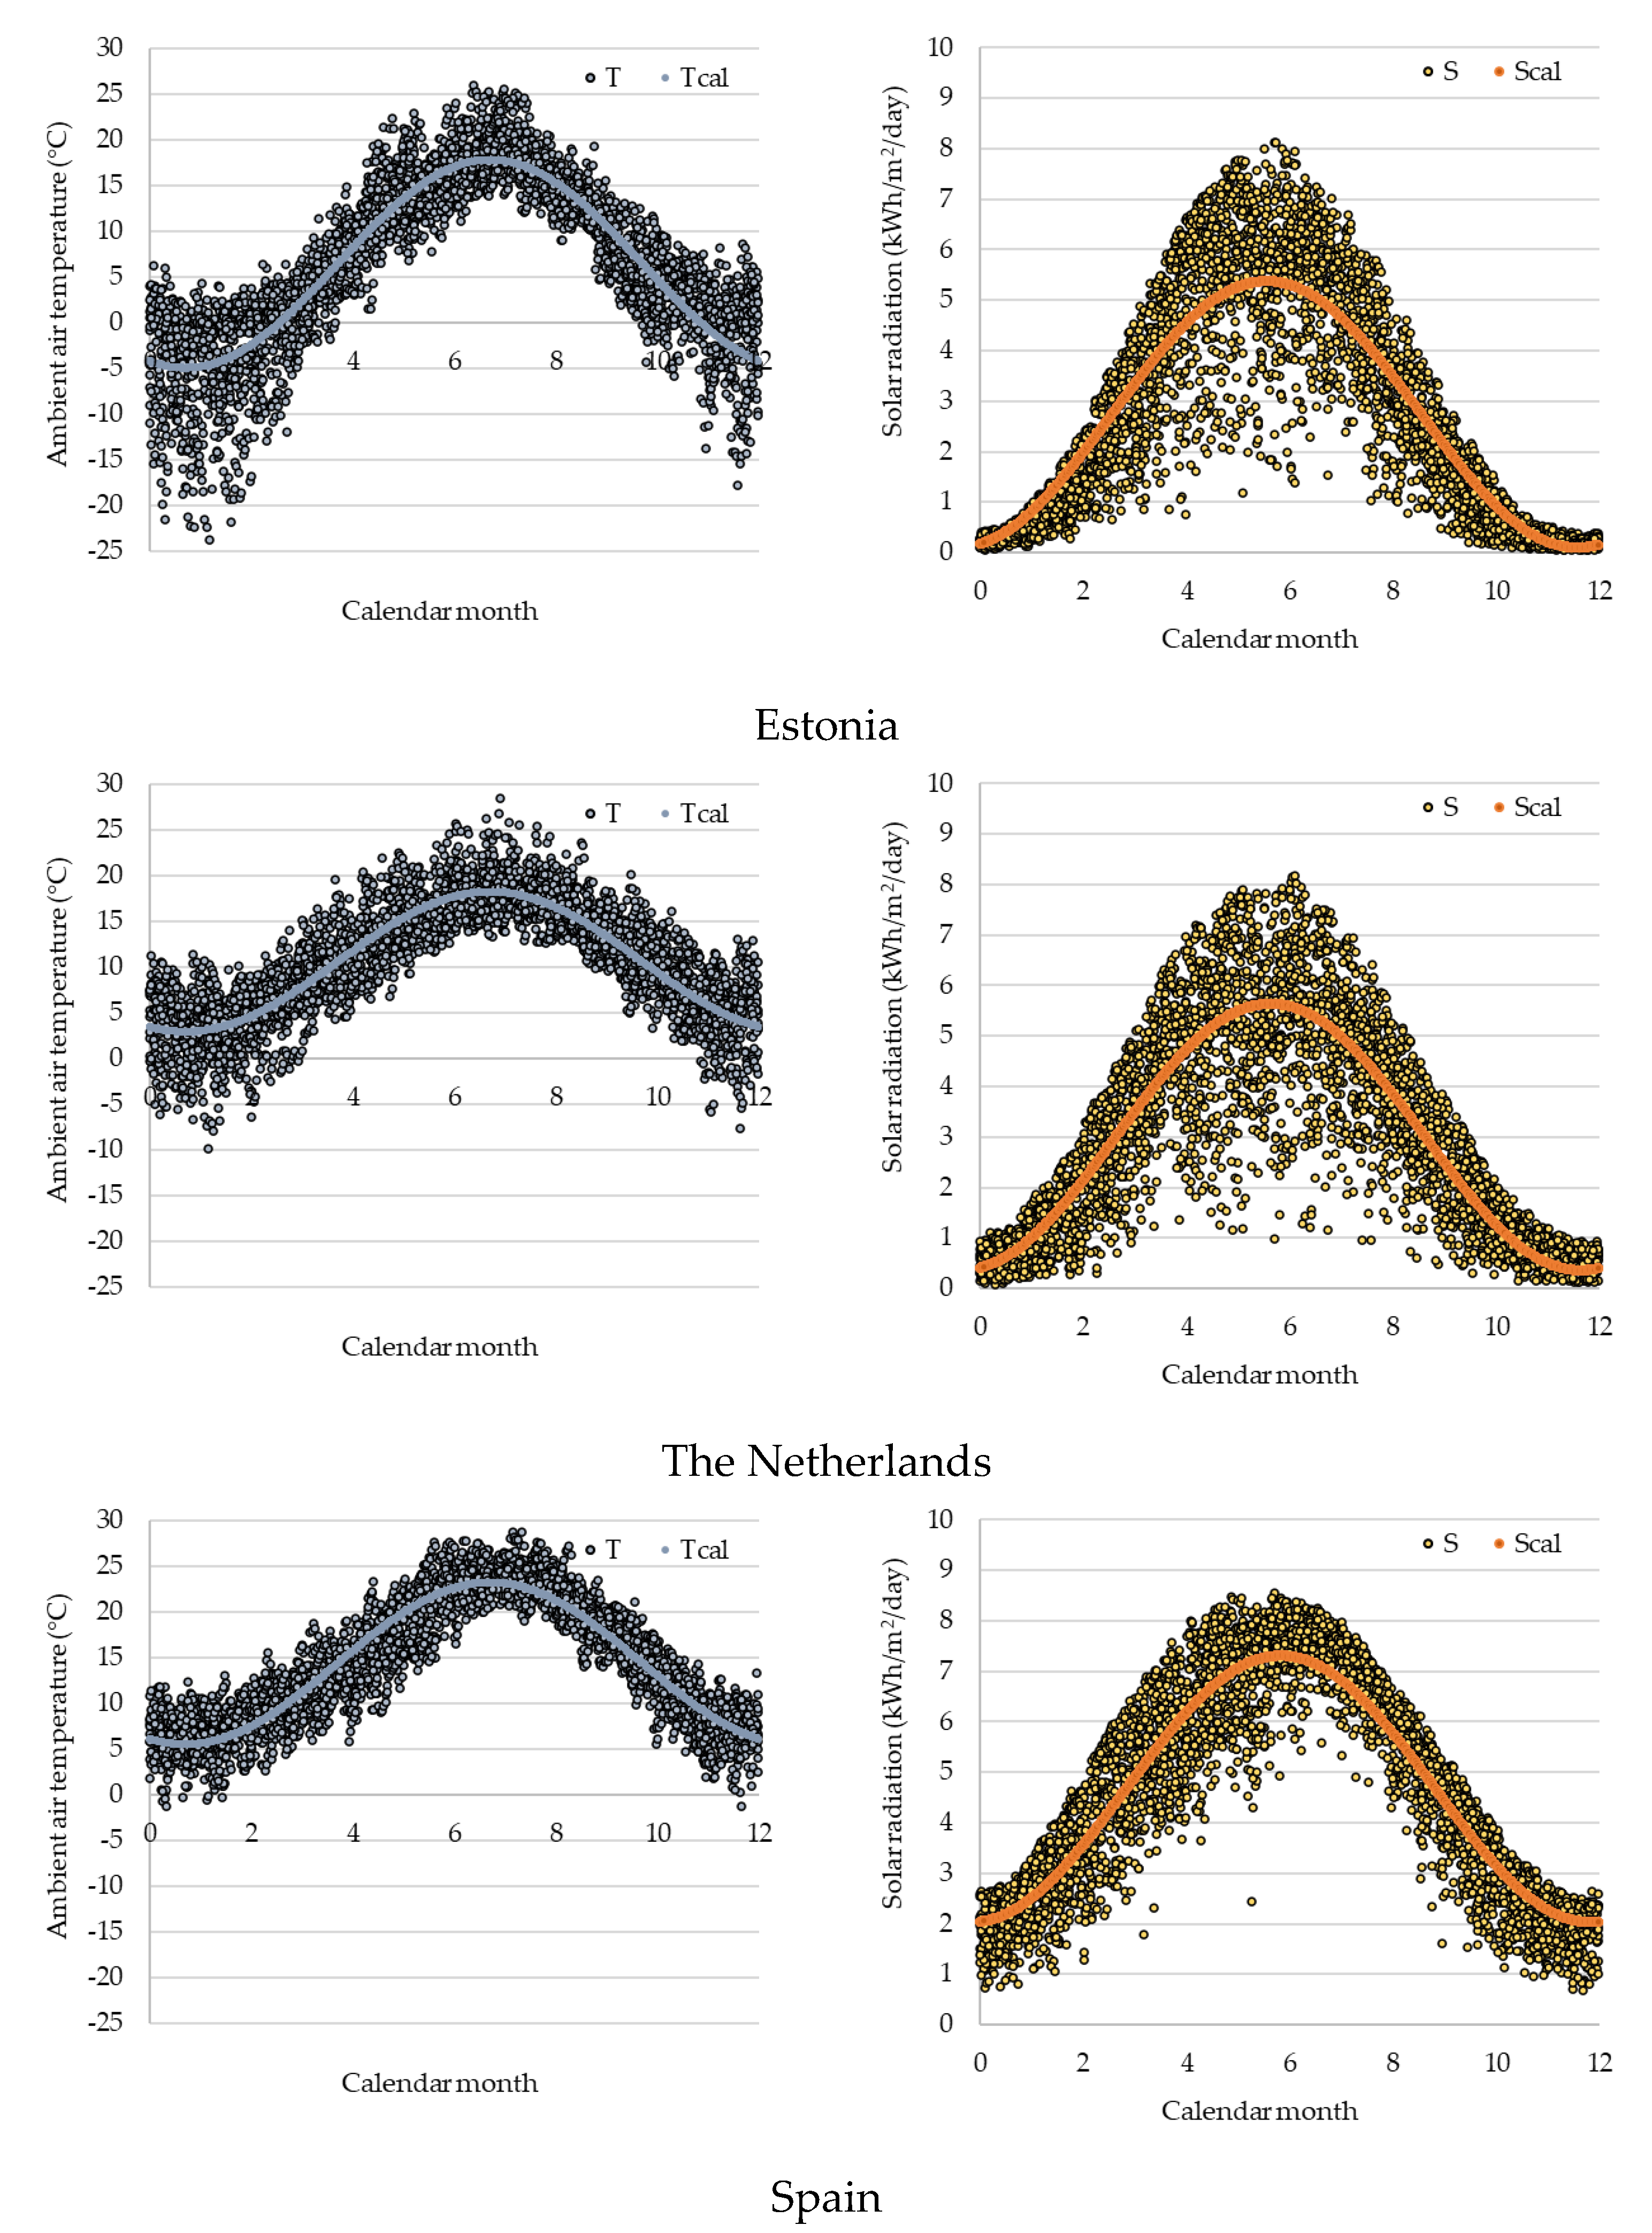
Table 7 shows the meteorological parameters estimated for the 27 European countries, after the simulation of daily ambient temperature and solar radiation data of the years 2008 to 2018, using the seasonal meteorological model proposed (Equations (14) and (15)).
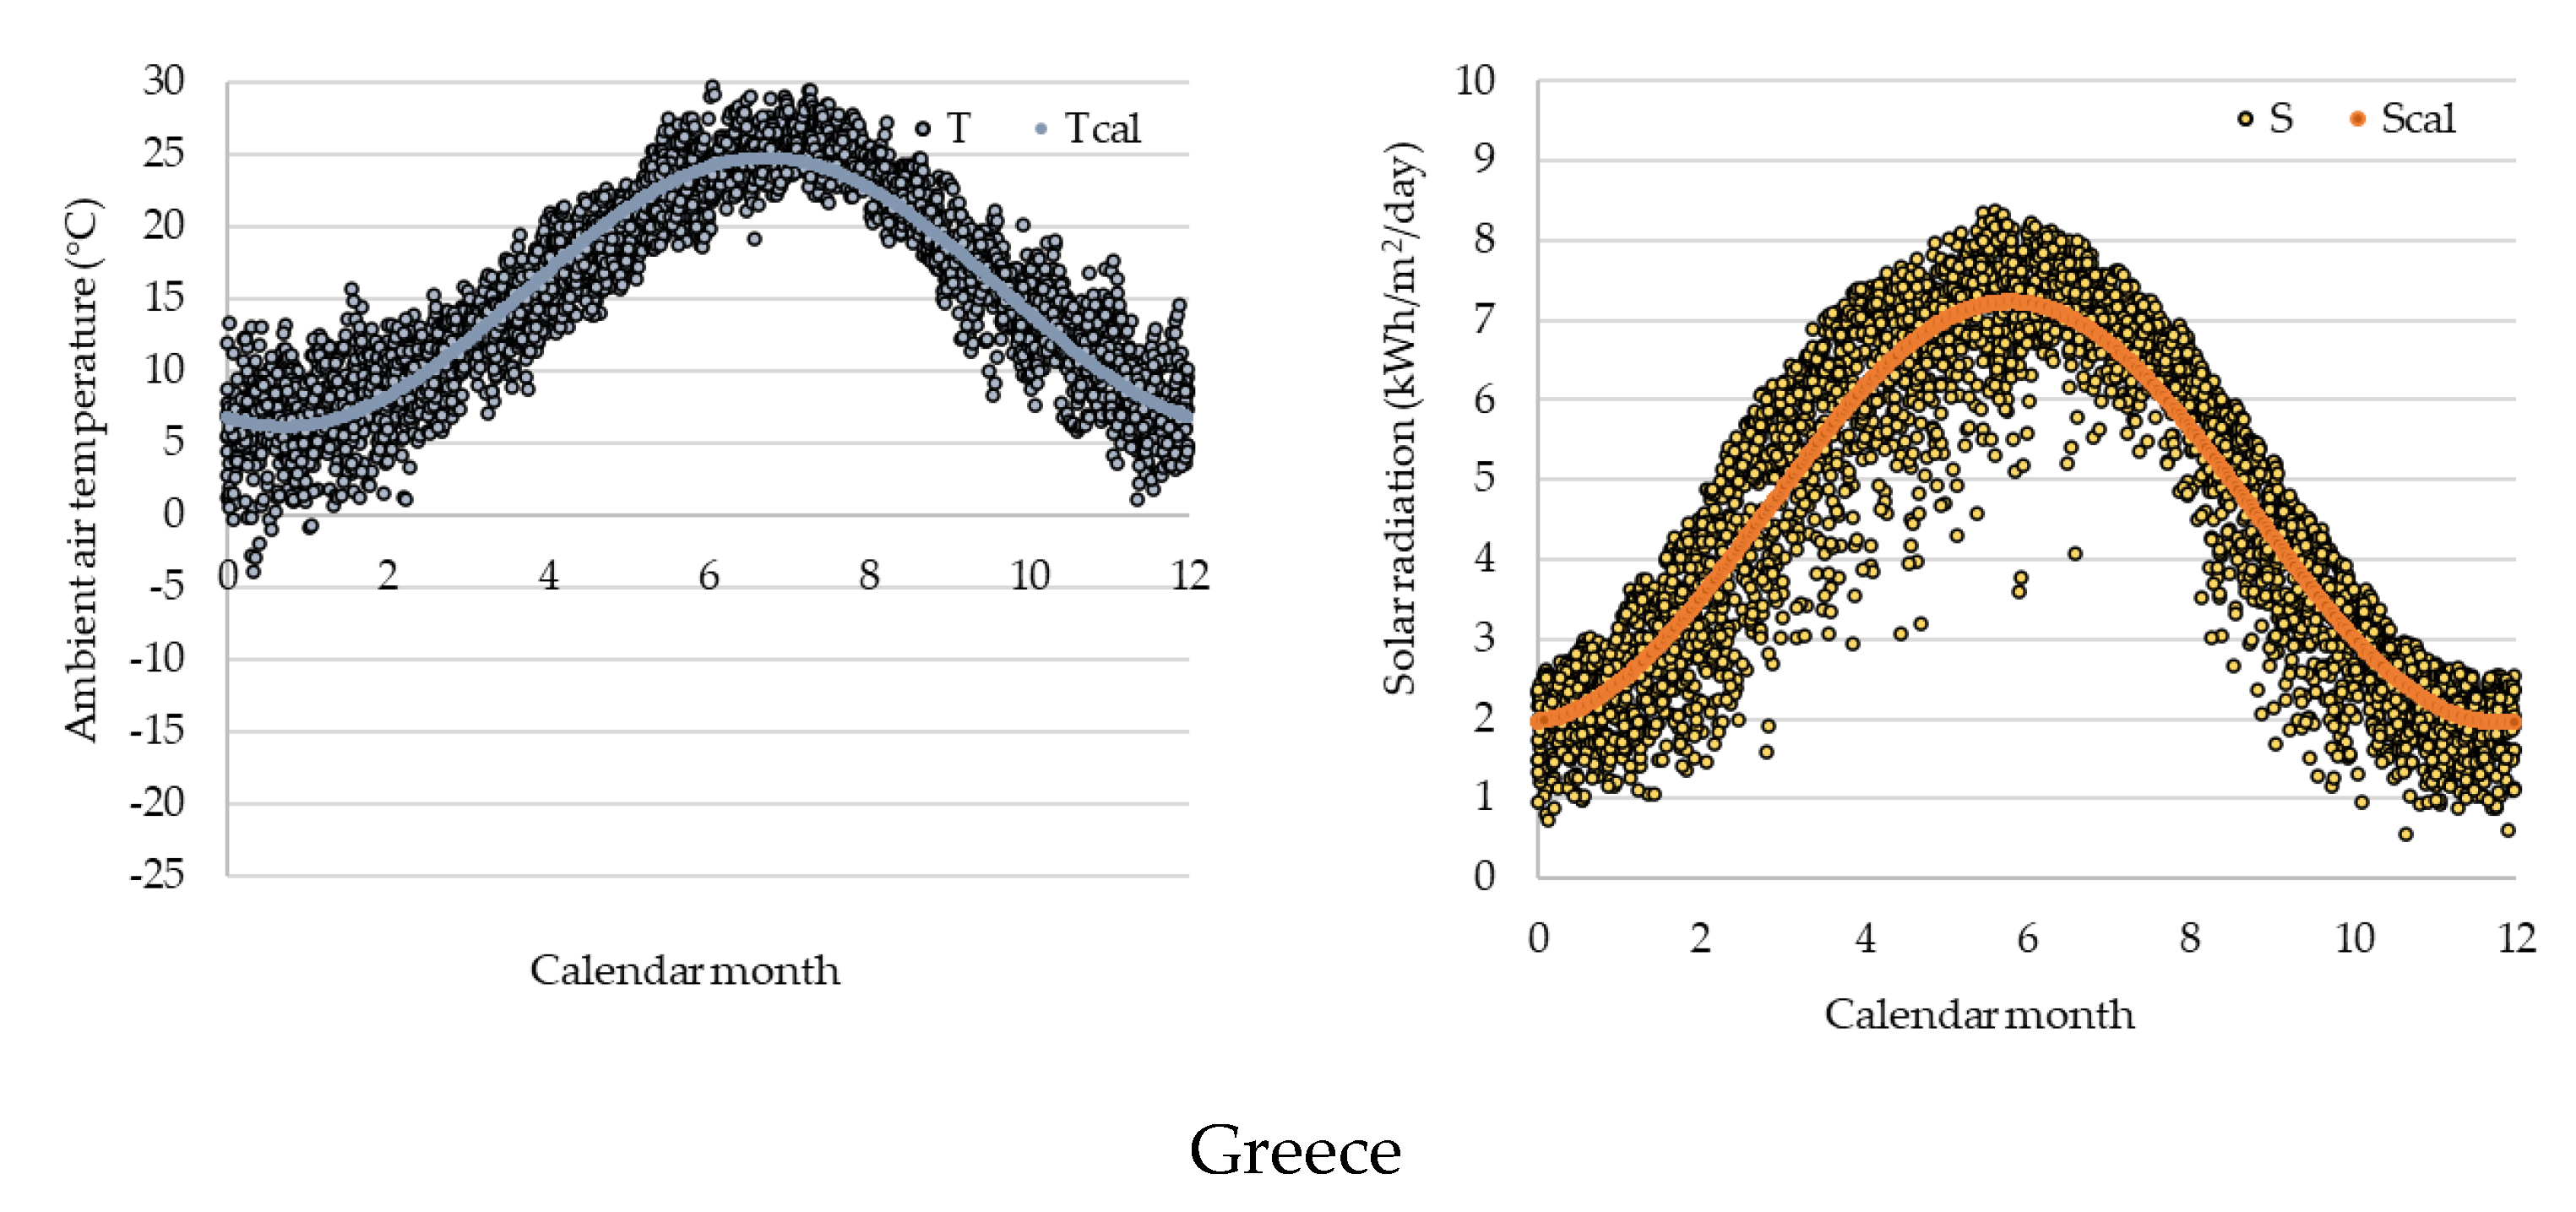
Figure 4 illustrates the simulated ambient temperature and solar radiation values for four European countries (Estonia, Netherlands, Spain, and Greece), which derive from a 10-year analysis (2008–2018).
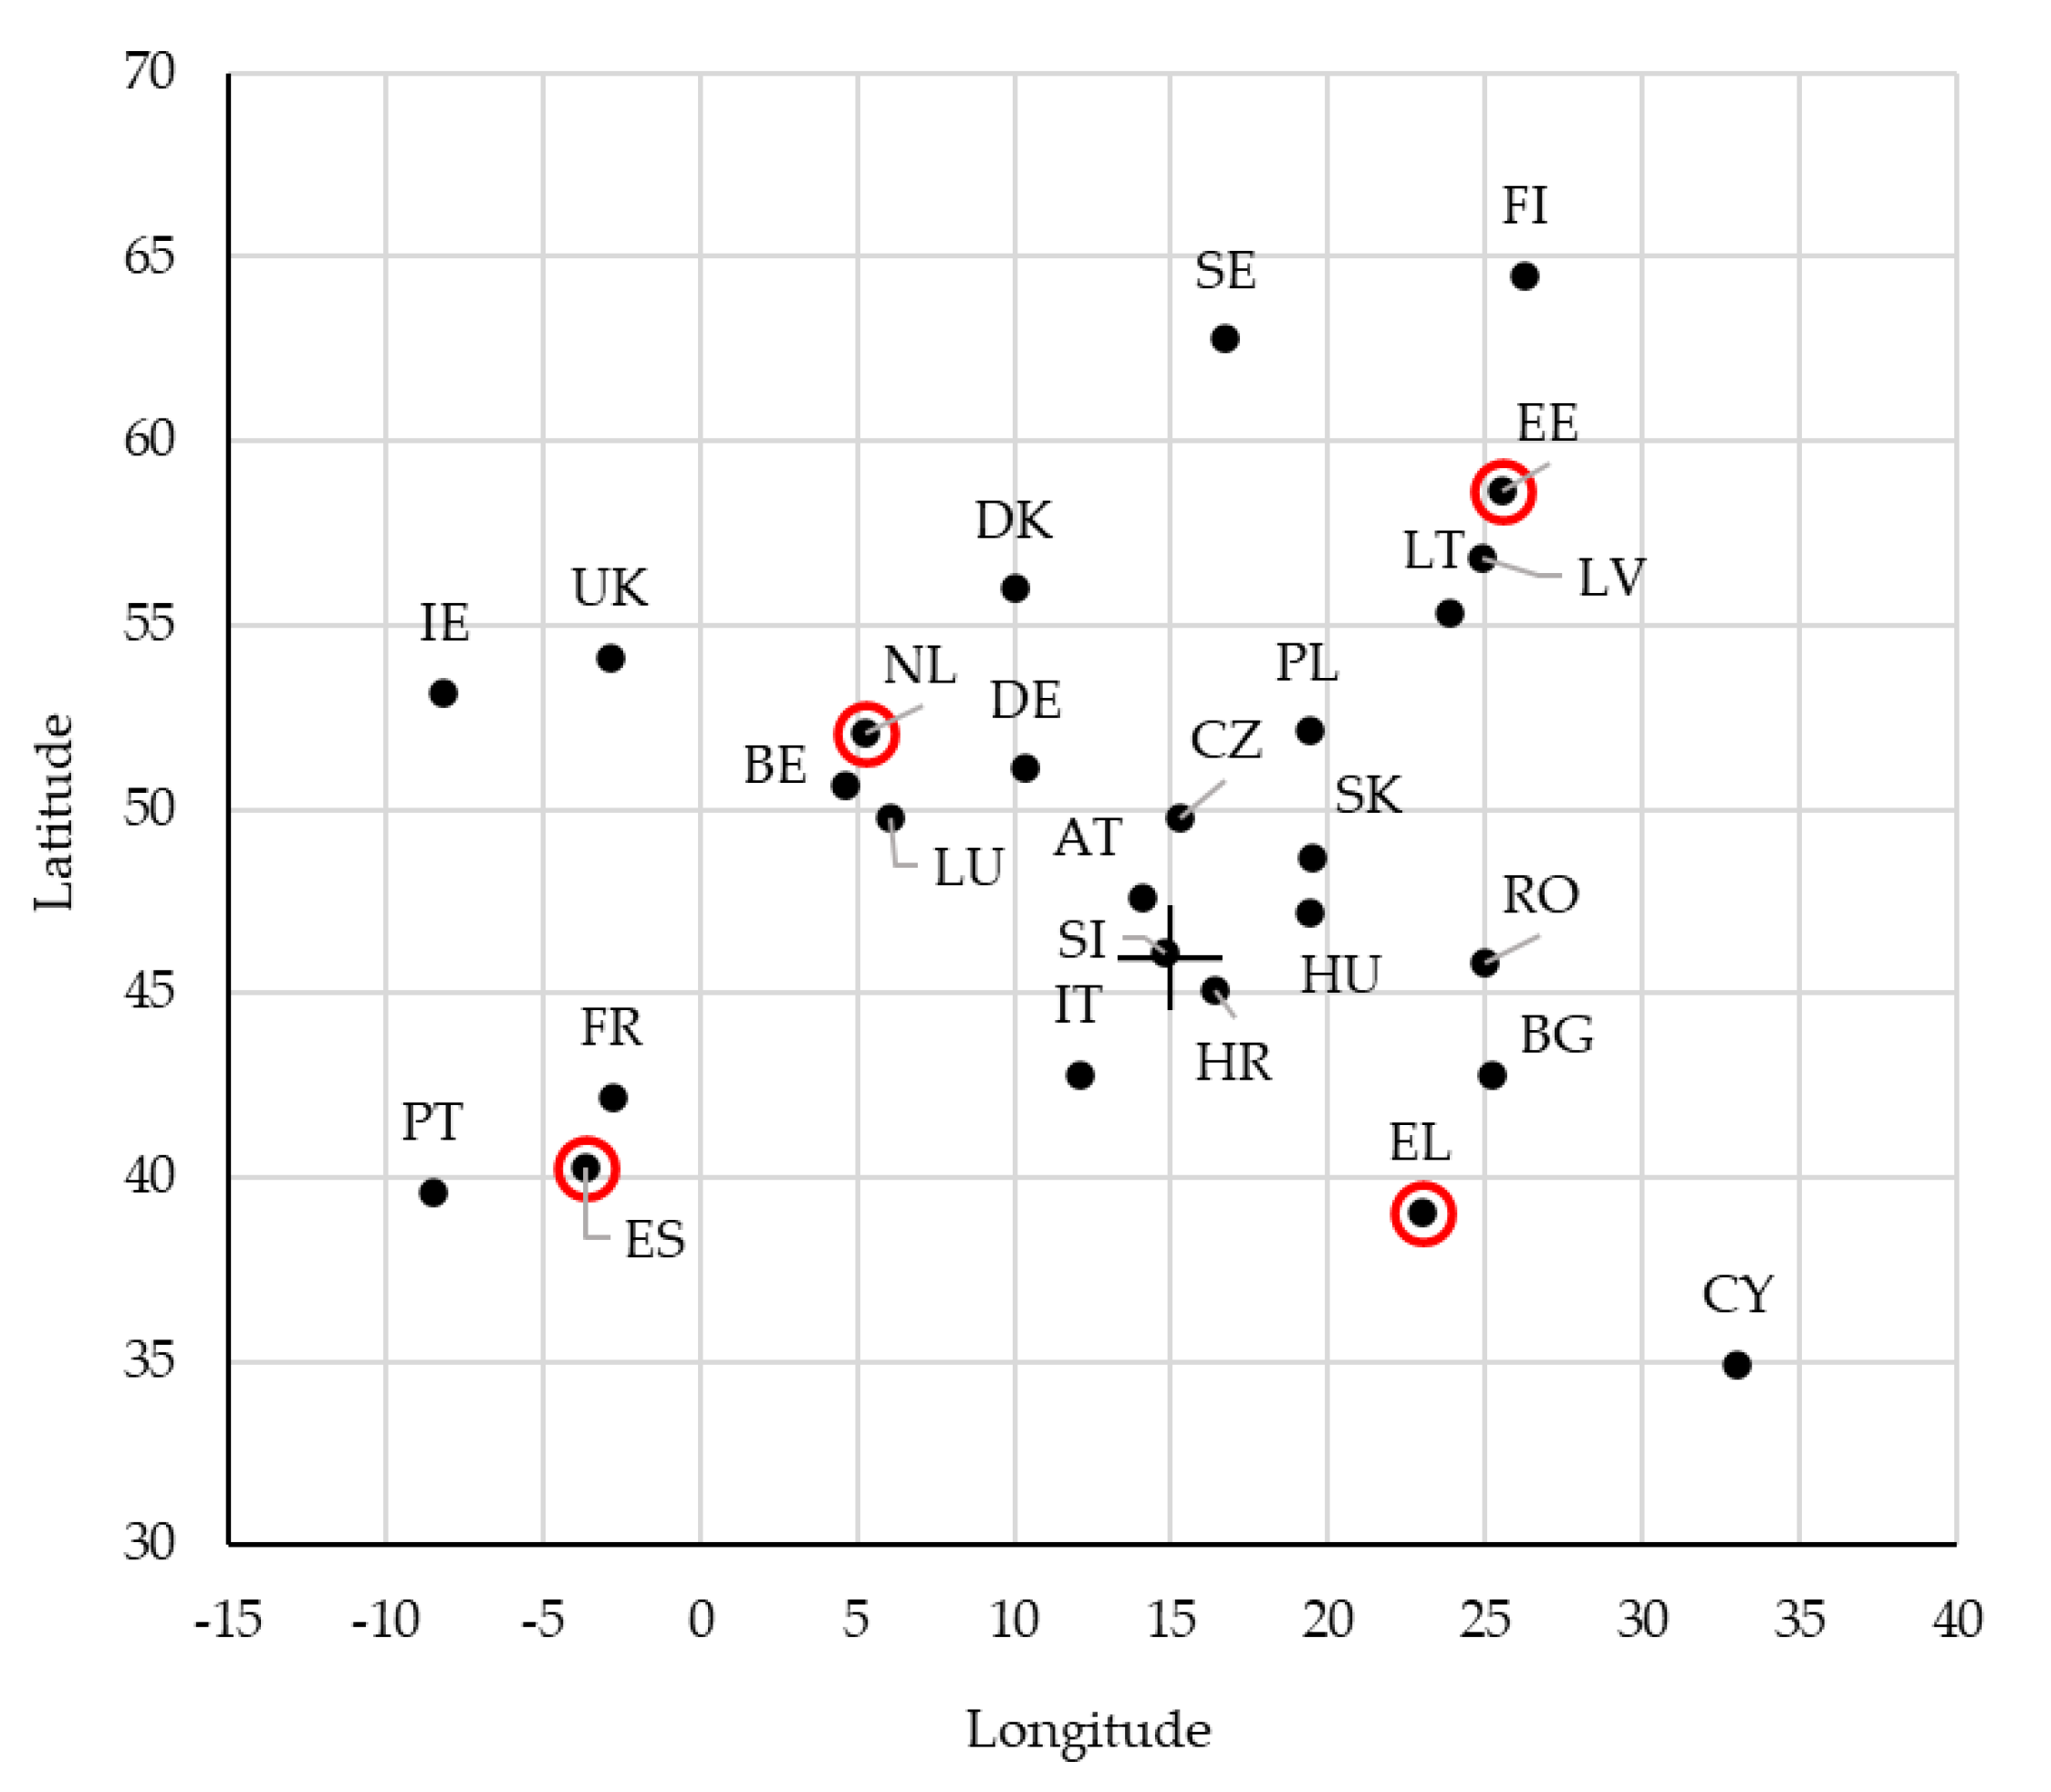
Geographical data referring to all European countries are presented in
Table 8. Taking into consideration the fact that cultivation zones are generally situated beyond urban areas, geographical coordinates were approached considering the geographical center of each country. As expected, European countries differ in their longitude and latitude values.
Figure 5 illustrates the relative positions of EU countries according to their geographical coordinates, forming the European map. The four countries, the temperature and solar radiation data of which were presented previously (
Figure 4), are highlighted.
2.5. Energy Requirements Model
The information flow diagram presented in
Figure 6 summarizes the models proposed in
Section 2.1,
Section 2.2,
Section 2.3 and
Section 2.4. A total of six parameters related to the countries’ meteorological data can be inserted into the seasonal meteorological model equations proposed in
Section 2.4 to calculate the daily average ambient temperature and solar radiation values. Moreover, the greenhouse thermal model proposed in
Section 2.1 requires an input of eight attributes, which are linked to the country-based meteorological data, the greenhouse technical characteristics, and the plant cultivation specifications; they allow for the estimation of annual energy requirements, as well as the required heating, cooling, and zero-energy operating periods.
3. Results and Discussion
3.1. Heating and Cooling Requirements
Based on the proposed model (
Section 2.5), the greenhouse technical characteristics (
Section 2.2), the required temperature conditions (
Section 2.3), and the country meteorological data (
Section 2.4), annual heating and cooling requirements are calculated.
The greenhouse technical data used in the mathematical model are shown in
Table 9. The value of the heat loss coefficient due to radiation, conduction, and convection used (4 kW/m
2K) corresponds to the average value of the coefficient for different covering materials, as shown in
Table 1. The heat loss coefficient due to ventilation (5 kW/m
2K) was estimated as a sum of the heat loss coefficient due to infiltration (2 kW/m
2K,
Table 2) and the heat loss coefficient due to the ventilation of the greenhouse (3 kW/m
2K). Thus, it is supposed that the heat loss coefficient due to ventilation is 50% higher than the heat loss coefficient due to infiltration. The overall heat loss coefficient (9 kW/m
2K) is the sum of the two coefficients (
Uc + Uv). A greenhouse constructed of rigid acrylic with double walls was assumed; therefore, the transmittance value
τ1 was set at 0.75, whereas the value of transmittance
τ2 (0.40) corresponds to the average value of
Table 4.
Annual heating and cooling requirements are presented in
Table 10 and
Table 11, respectively.
To calculate the annual heating and cooling requirements for the nine plants, the optimal temperature range for each plant was considered, as presented in
Table 6. Assuming that our goal is to provide optimal temperature conditions for the cultivated crops to ensure high-yield and high-quality products, the temperature range for all plants is limited to the optimal area, rather than the wider temperature range in which cultivation can be achieved. This means that the ranges proposed for each plant are narrower than the ranges beyond which actual damage is expected to happen. It is supposed that, even if the indoor greenhouse temperature falls below the minimum required plant temperature for a few hours, this will not have destructive consequences for the plants.
The results indicate that the heating requirements for the cultivation of the products examined range from 0 to 700 kWh/m2/y, whereas the cooling requirements range from 0 to 387 kWh/m2/y. The production of watermelons, melons, and green beans is correlated with higher average amounts of heating energy (334 kWh/m2/y), followed by eggplants (307 kWh/m2/y). On the other hand, lettuce is linked to the highest amounts of average cooling energy (90 kWh/m2/y), followed by tomatoes, cucumbers, and strawberries (37 kWh/m2/y). These findings were reasonable, since watermelons, melons, and green beans have the highest setpoint temperatures (24–26 °C), whereas lettuce has the lowest one (15 °C).
Focusing on the location of the greenhouse production, the countries that present the highest average values of heating energy are Finland, Sweden, Estonia, and Latvia (618, 555, 453, and 435 kWh/m2/y, respectively), whereas the countries with the highest average cooling requirements are Cyprus, Greece, Spain, and Portugal (211, 94, 71, and 69 kWh/m2/y, respectively). It was proven that the amount of energy needed for heating and cooling in a specific region are negatively correlated. For example, Finland is the country with the highest heating needs, but also presents zero cooling needs, whereas Cyprus, which requires the highest energy for cooling among EU countries, has the lowest heating requirements for the cultivation of the nine plants examined. The cultivation of watermelons, melons, and green beans in Finland and Sweden requires the maximum energy for heating purposes (700 and 636 kWh/m2/y, respectively), whereas the production of lettuce in southern countries (Cyprus, Greece, Portugal, Spain) has zero heating demands. Conversely, regarding cooling requirements, the cultivation of lettuce in Cyprus requires maximum amounts of energy for cooling (387 kWh/m2/y), followed by the production of tomatoes, cucumbers, and strawberries in the same country (255 kWh/m2/y). It is obvious that, in order to save energy, the ideal products for cultivation in southern countries are the ones with high optimal temperature cultivation ranges, whereas products with lower temperature ranges are a better fit for cultivation in northern countries.
Apart from energy requirements, a highly important factor for evaluating future investments in the greenhouse sector is knowing the greenhouse operating time. The operating time significantly affects productivity and other economic attributes that are vital in the process of greenhouse design. Usually, the operating period of a greenhouse includes heating periods and zero-energy-requirement periods. Because most greenhouses do not have cooling systems, they pause their operations during periods when cooling is needed.
Table 12,
Table 13 and
Table 14 present the heating, cooling, and zero-energy-requirement periods for the cultivation of the nine species in European countries. It was found that the production of watermelons, melons, and green beans in Finland has the longest heating period (8.6 months), followed by the production of the same products in Sweden (8.5 months). Cyprus and Portugal are the countries that present the shortest heating periods. The latter ones range from 0 to 4 months, depending on the product, with lettuce being the product with the shortest heating periods in general. On the other hand, the country with the longest cooling periods is Cyprus (4.8 to 8.4 months, according to the product), whereas northern countries such as Finland and Sweden had an average of zero cooling periods for all products. Regarding zero-energy-requirement periods, the Netherlands and Ireland were the countries that showed the highest average of zero-energy periods (5.4 months per year), whereas Finland presented the lowest average (3.9 months per year).
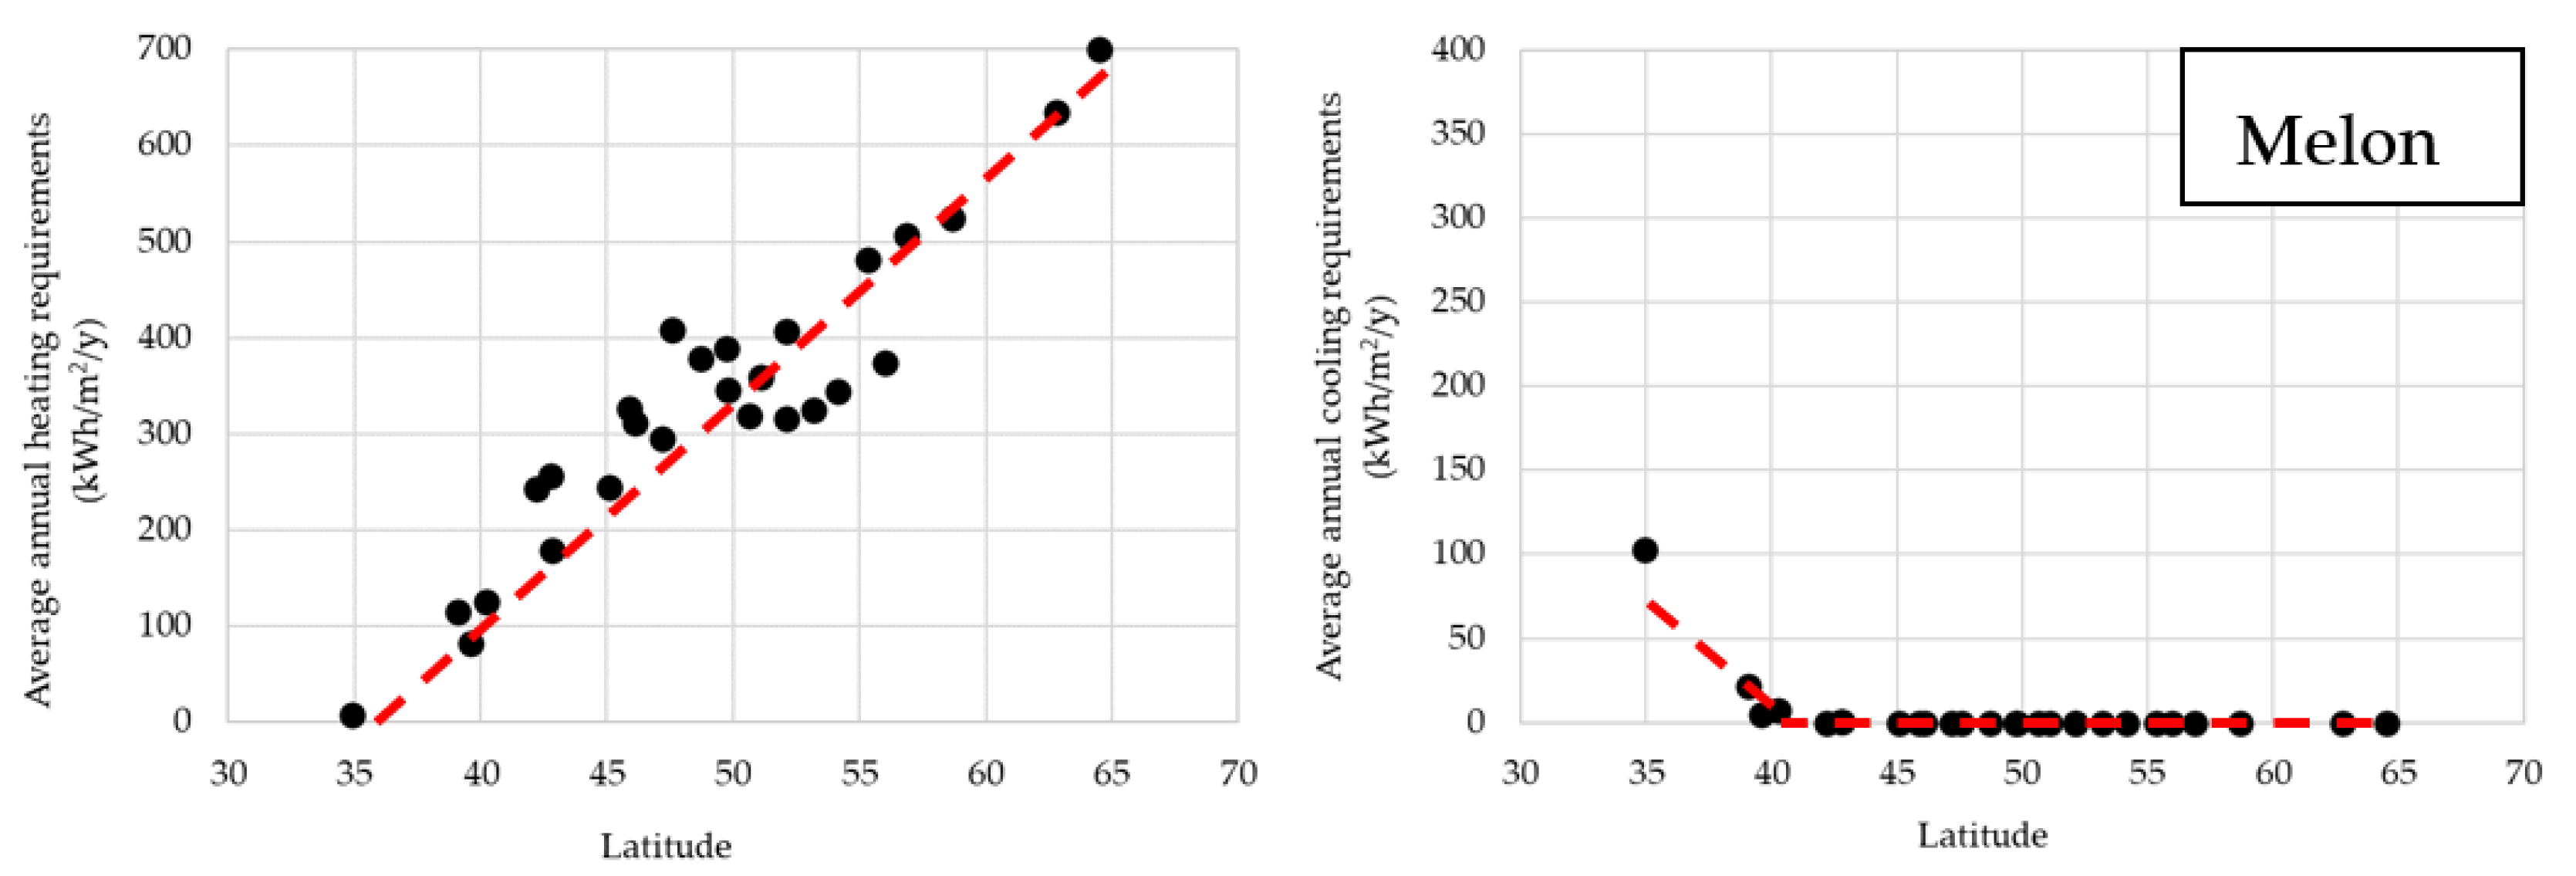
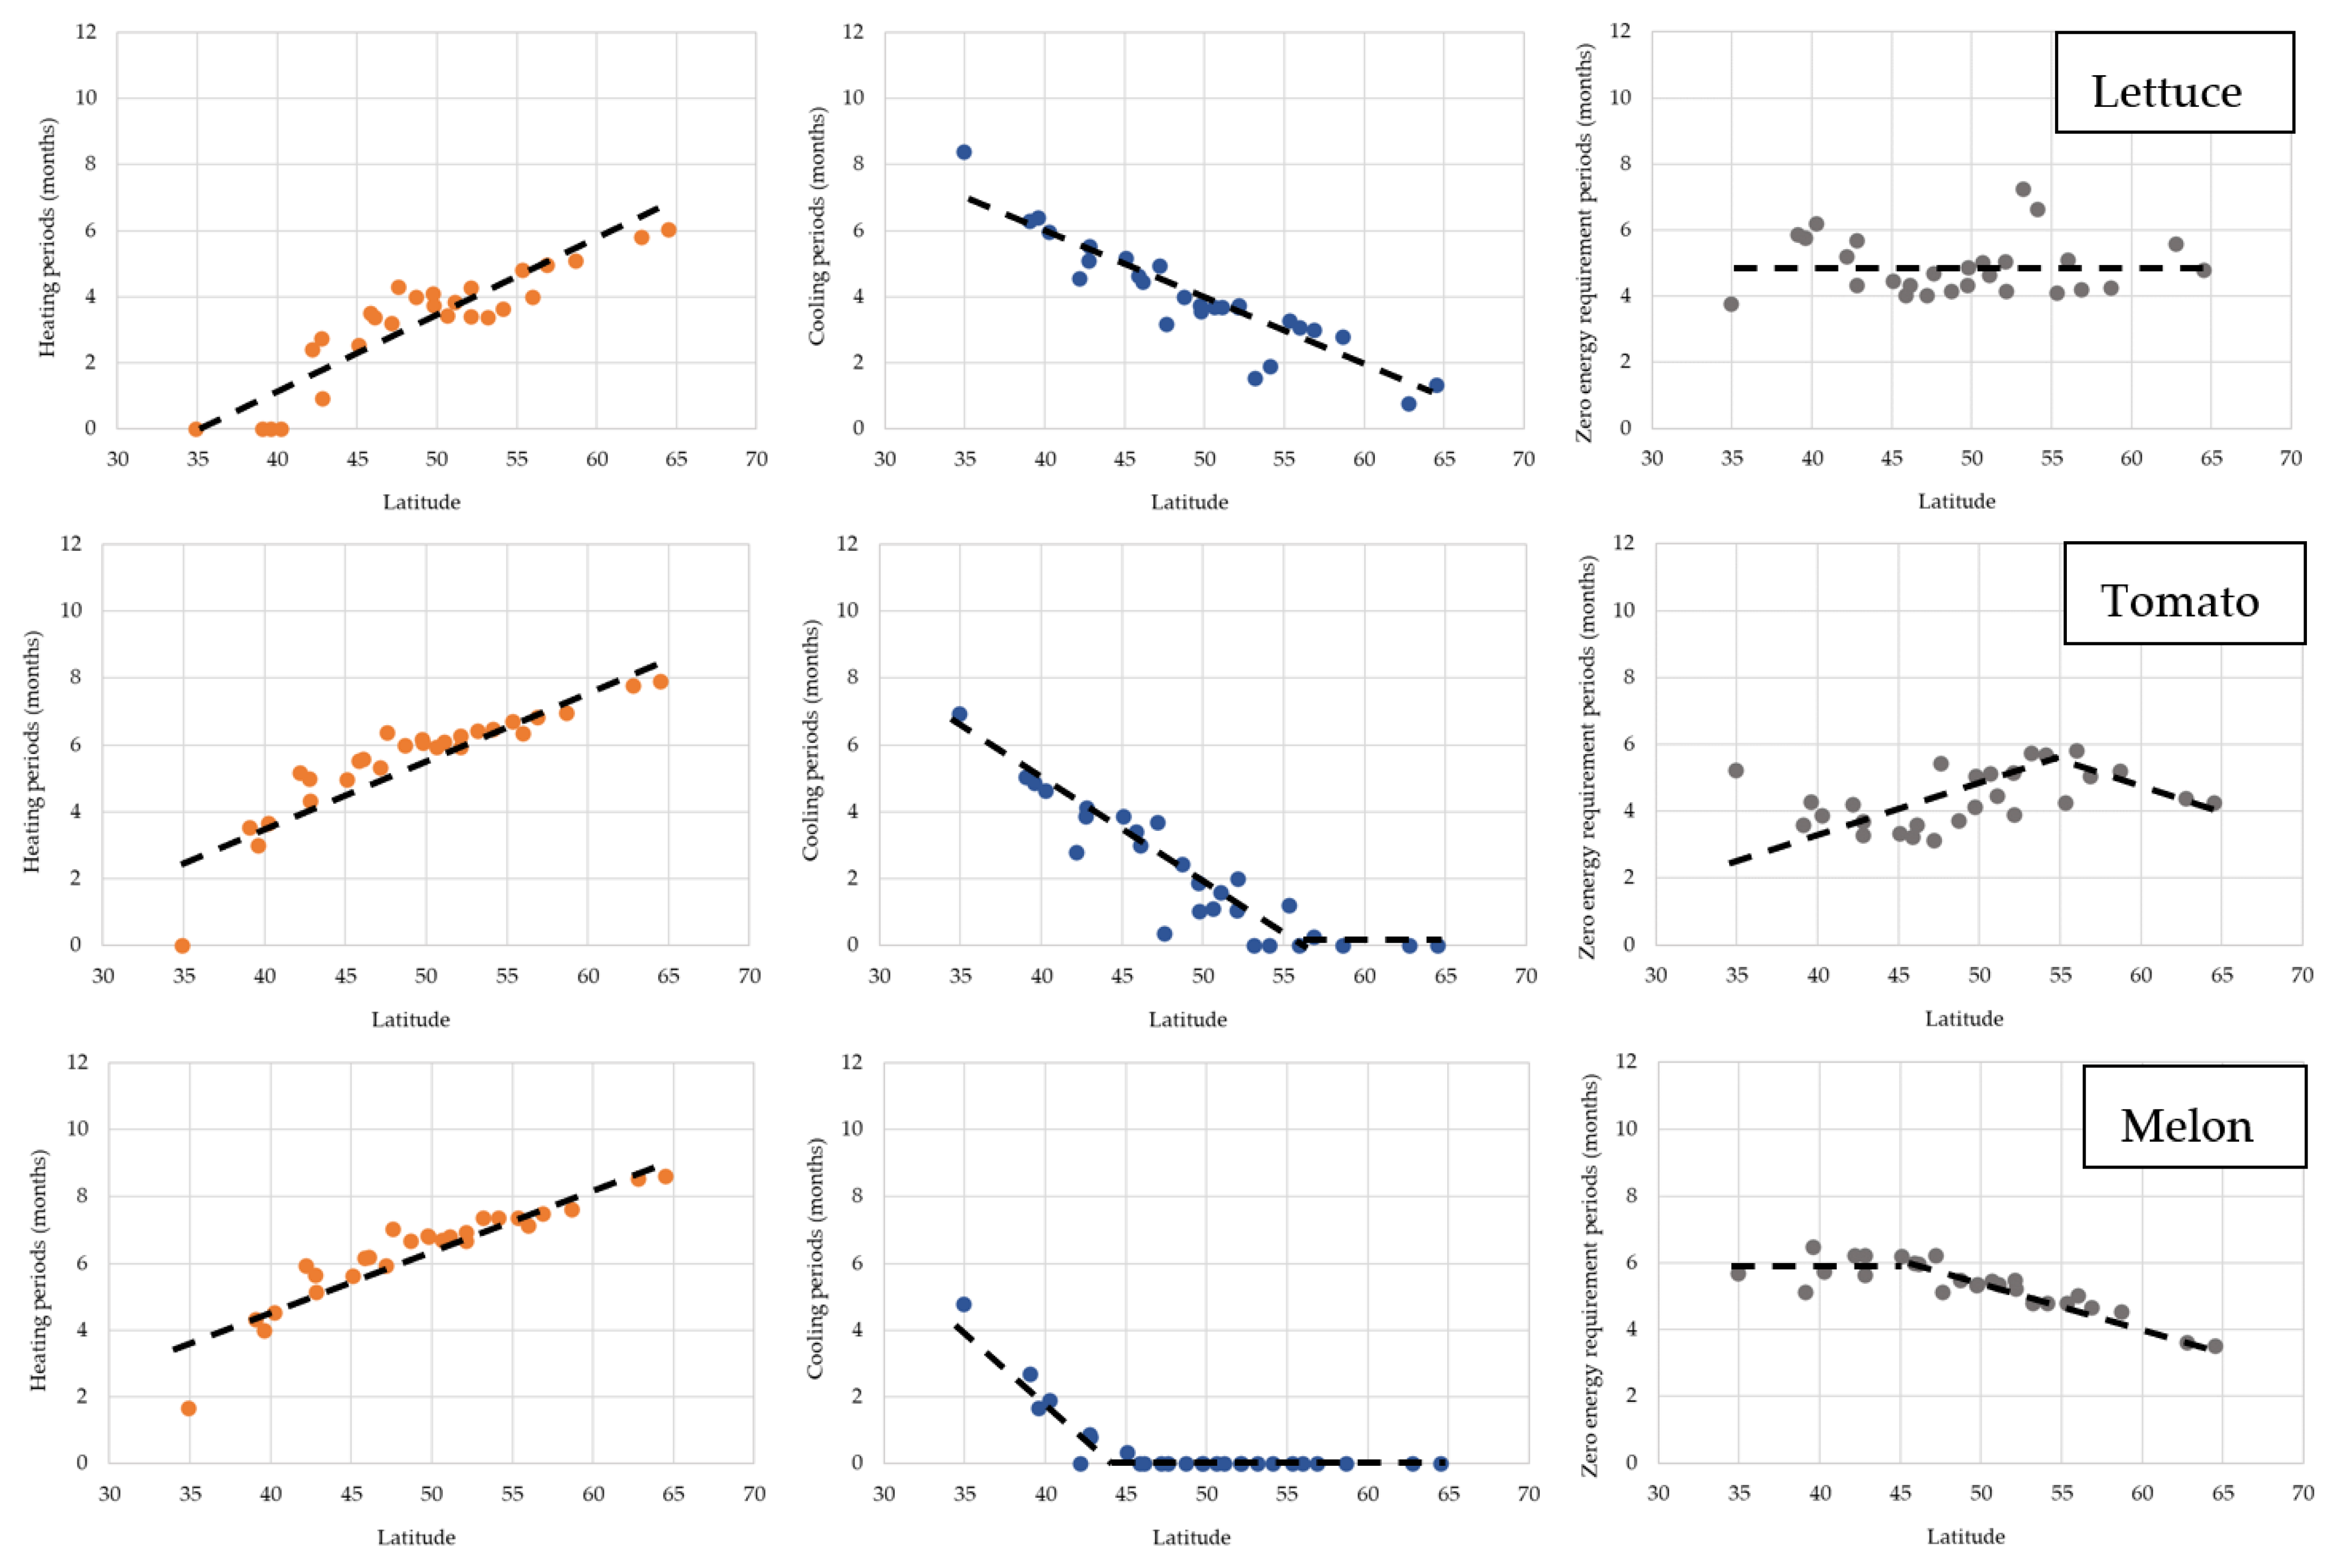
Figure 7 and
Figure 8 further visualize the above results by plotting the heating and cooling requirements for EU countries for three products (lettuce, tomato, and melon). The main conclusions are as follows. For all three products, we can see that heating requirements present an increasing, linear correlation with latitude, whereas cooling requirements tend to decrease as latitude increases (
Figure 7). Throughout the year, heating and cooling periods follow similar linear correlations with latitude, as seen in
Figure 8. Heating periods show an upward trend as countries become more northern, whereas cooling periods present opposite decreasing tendencies. For a certain country, adding together heating, cooling, and zero-energy periods results in a whole year of greenhouse operations. As seen in
Figure 7, the only product that requires an amount of energy for cooling purposes in most of the countries is lettuce. It is obvious that melon only needs minor greenhouse cooling in very southern countries (Cyprus and Greece), where temperatures can be extremely high in summer. On the other hand, the cultivation of tomatoes only requires cooling in countries with latitudes below 50 degrees. In most cases, since cooling requirements are limited and in order to save energy and reduce costs, greenhouses tend to pause their operations when temperatures are too high and cooling is needed. Another option in such cases is the selection of species that require high cultivation temperatures, which eliminates the need to pause the production procedure.
3.2. Simple Mathematical Model
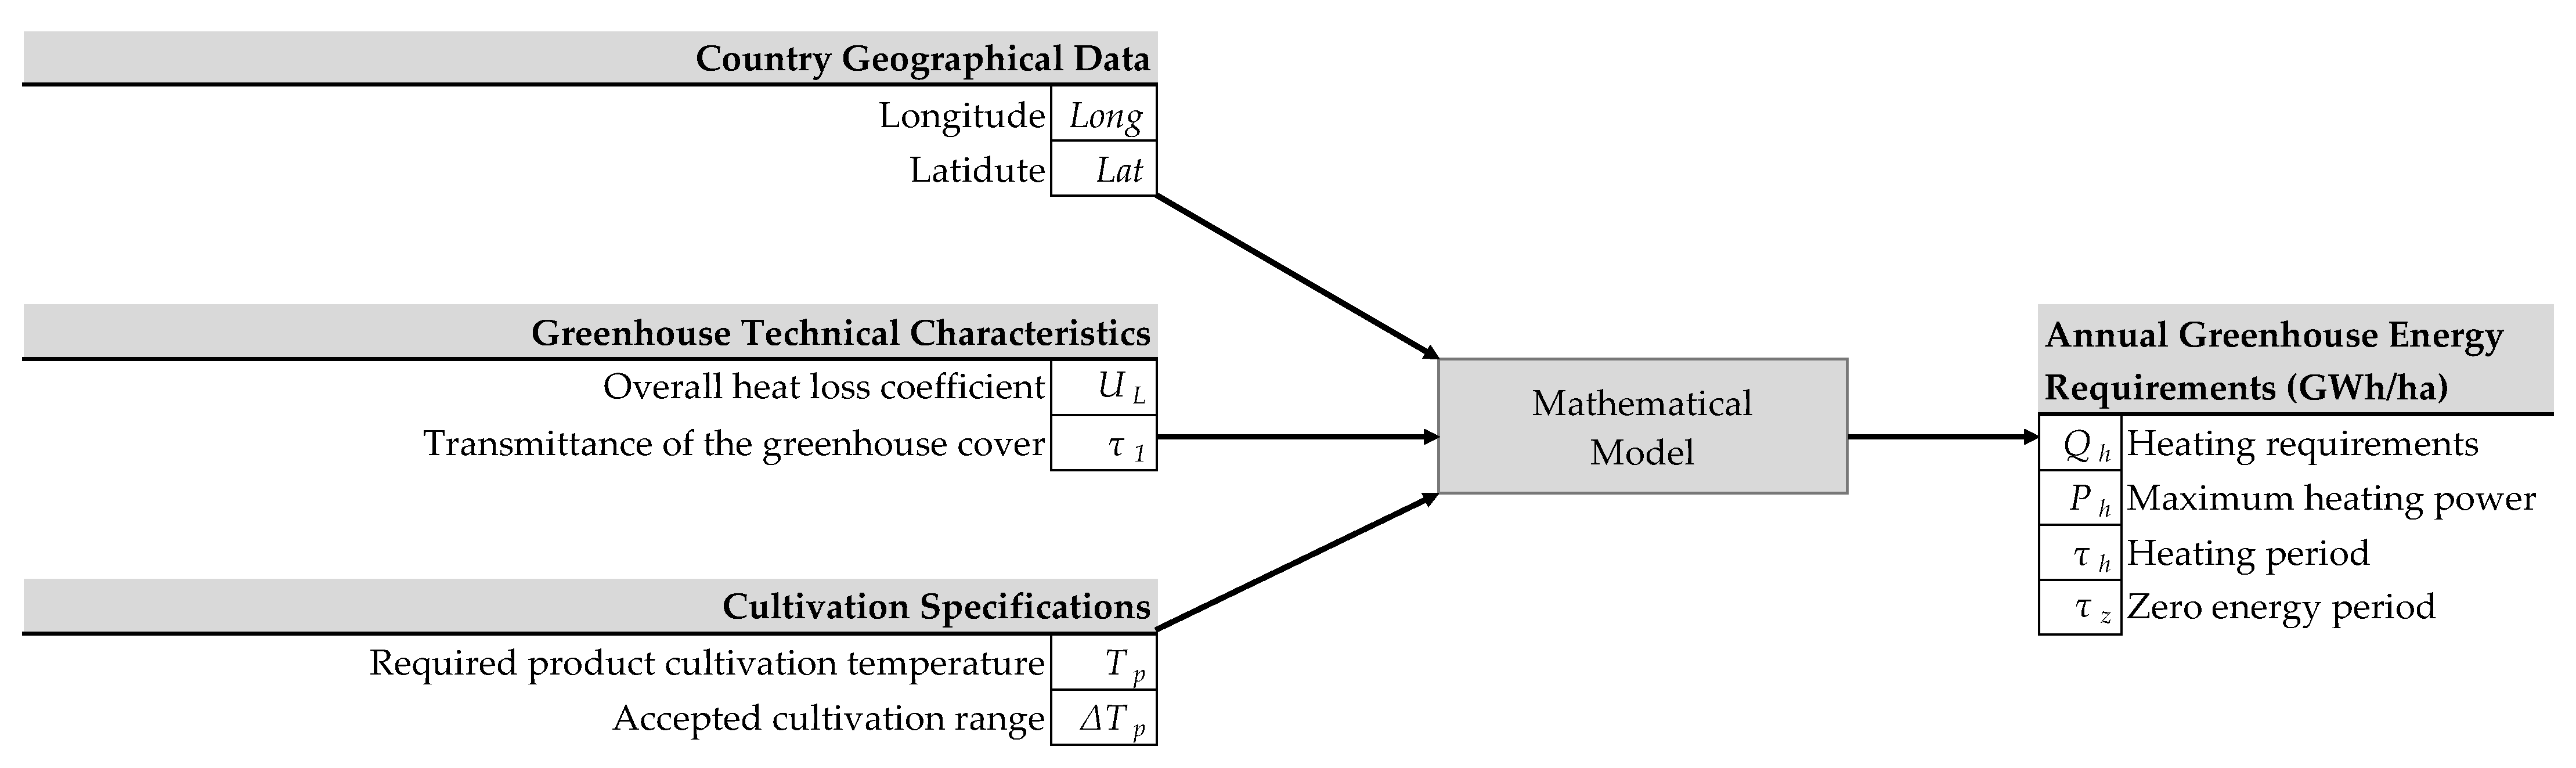
The energy requirements estimated in the previous section for various countries (different geographical coordinates) and for various products (different temperature conditions) can be repeated for various greenhouses (different technical characteristics) to derive a complete answer to the problem of estimating the energy requirements of greenhouses in Europe.
Since these data are numerous and difficult to use in the form of tables or figures, a simple model was fitted, and these results are summarized in
Table 15. That is, when the factors in
Table 16 are known, the heating requirements, the maximum heating power, the heating period, and the zero-energy period are estimated using simple equations.
Table 16 also shows the range of variation in which the fitting was performed, and the model estimates are valid. In
Table 15, the variables are normalized with respect to their means in
Table 16.
Moreover,
Figure 9 presents the model information flow diagram.
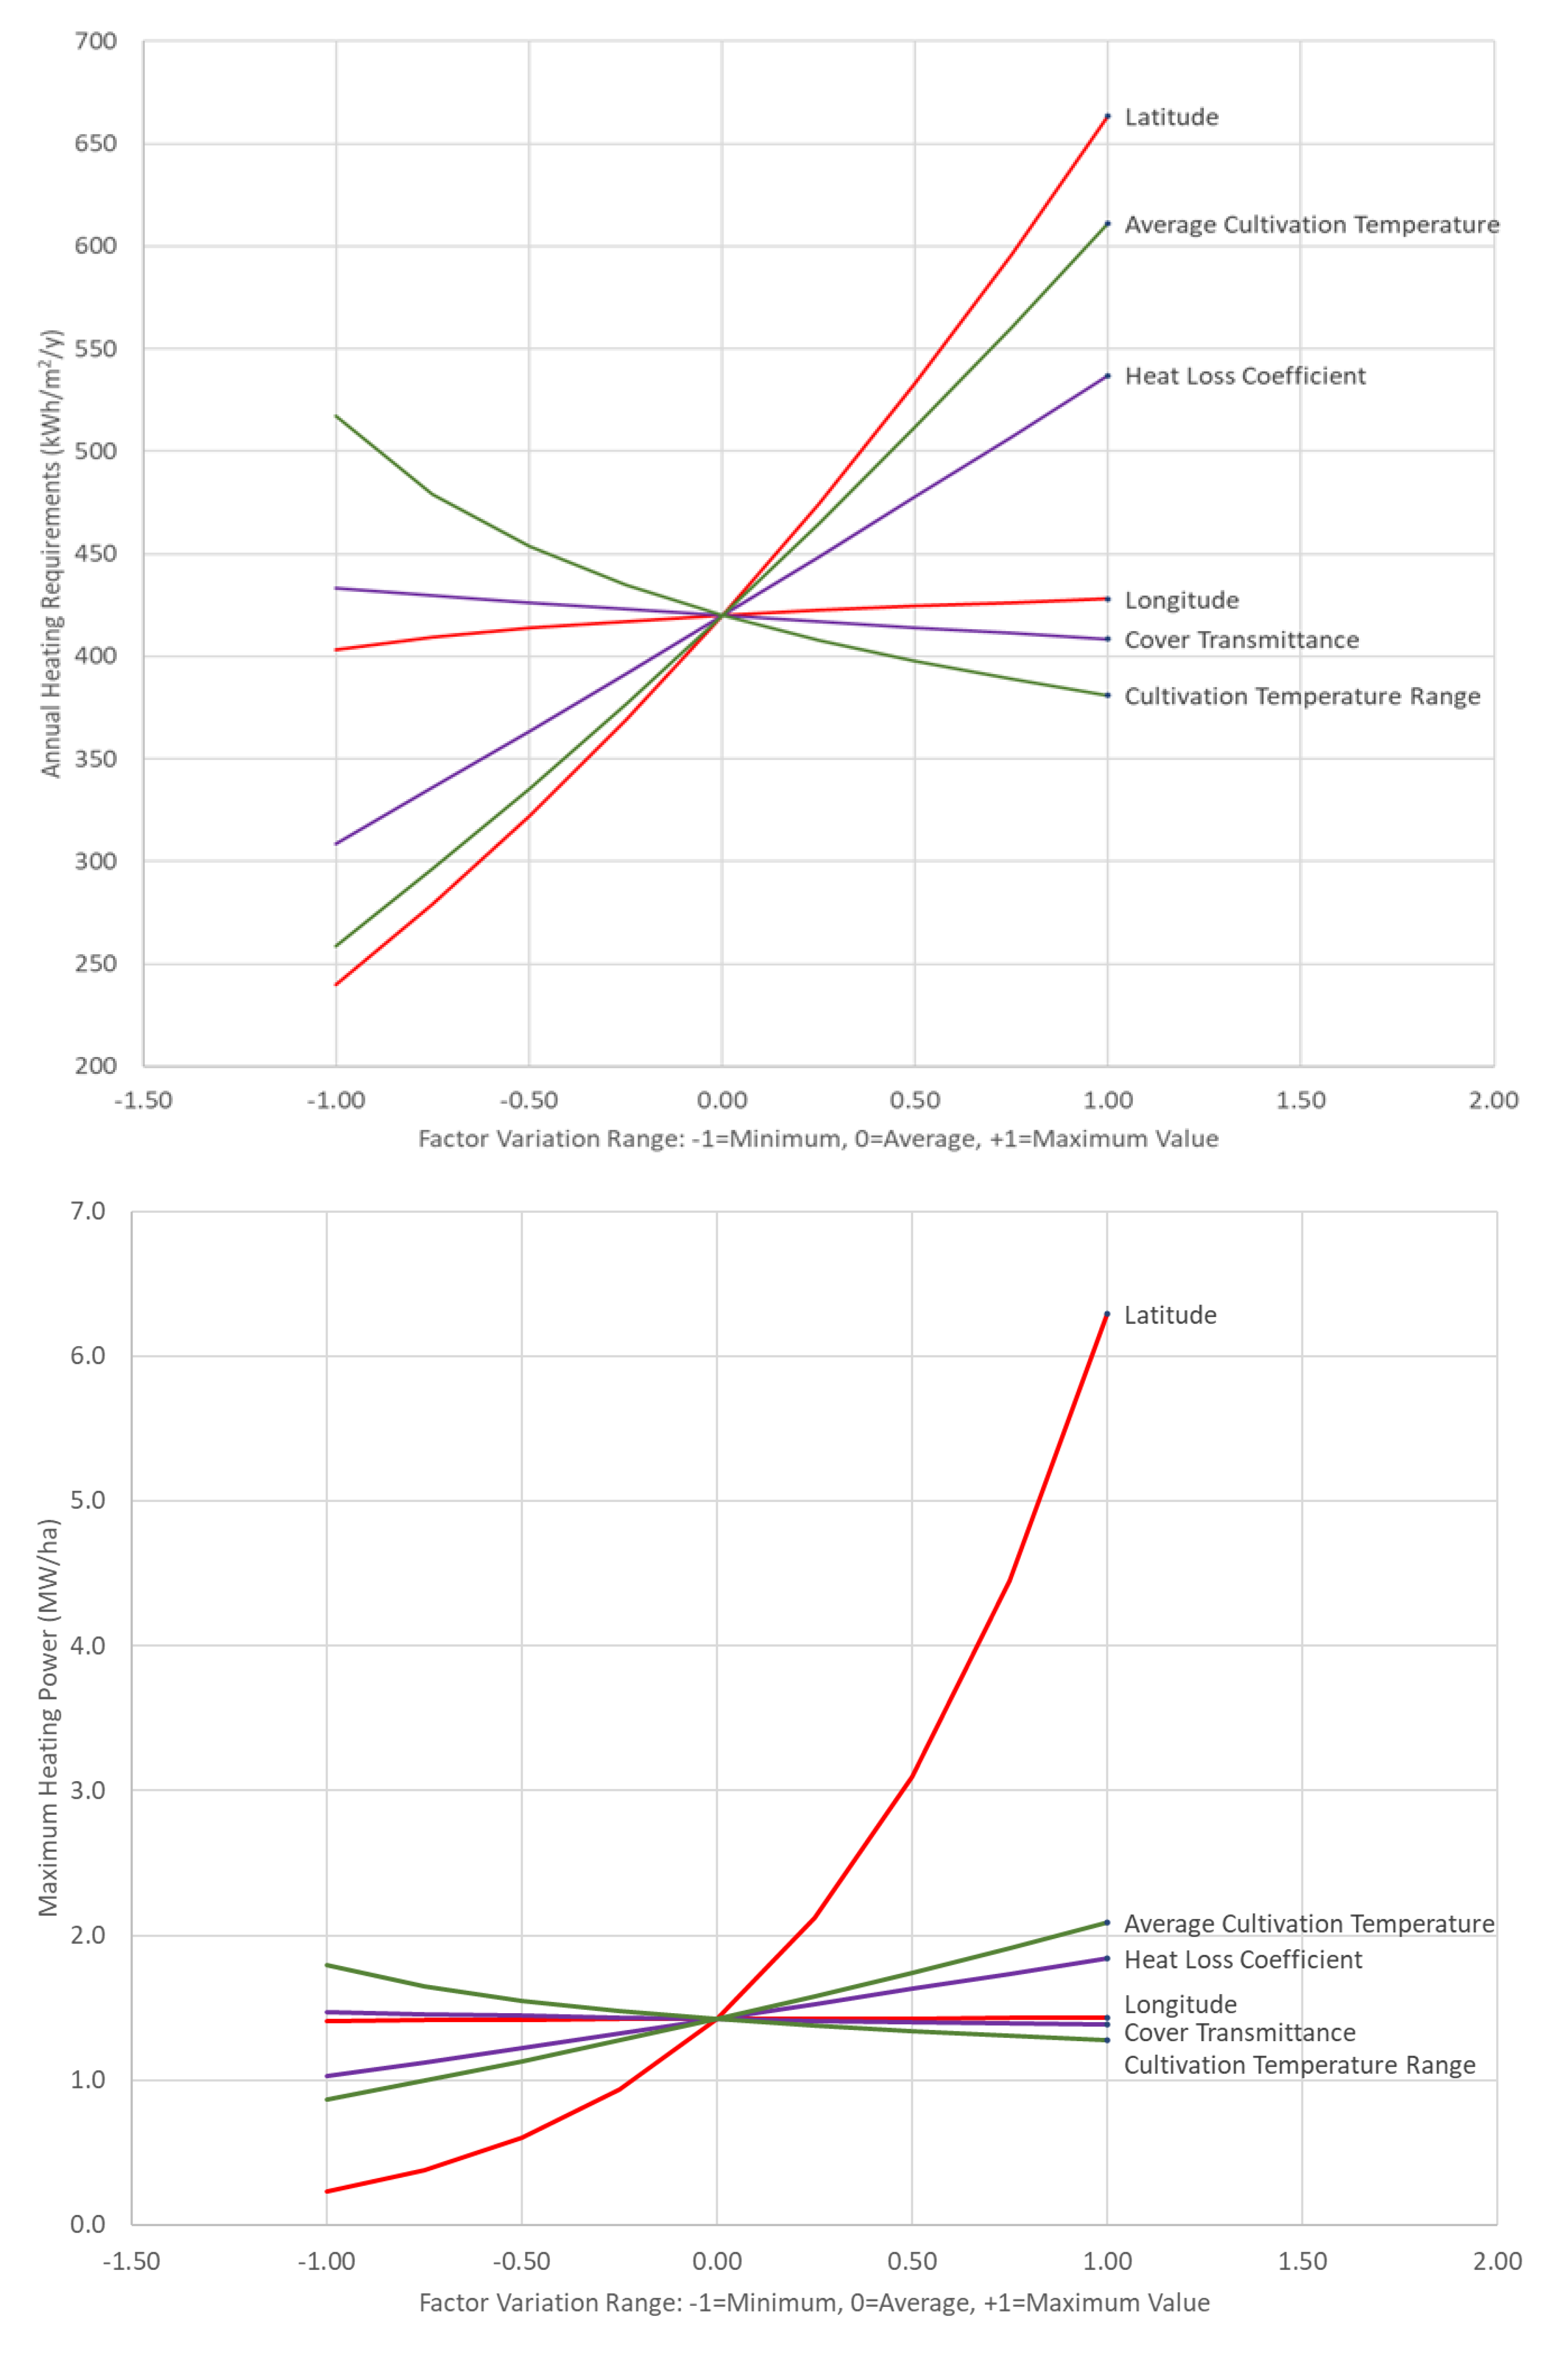
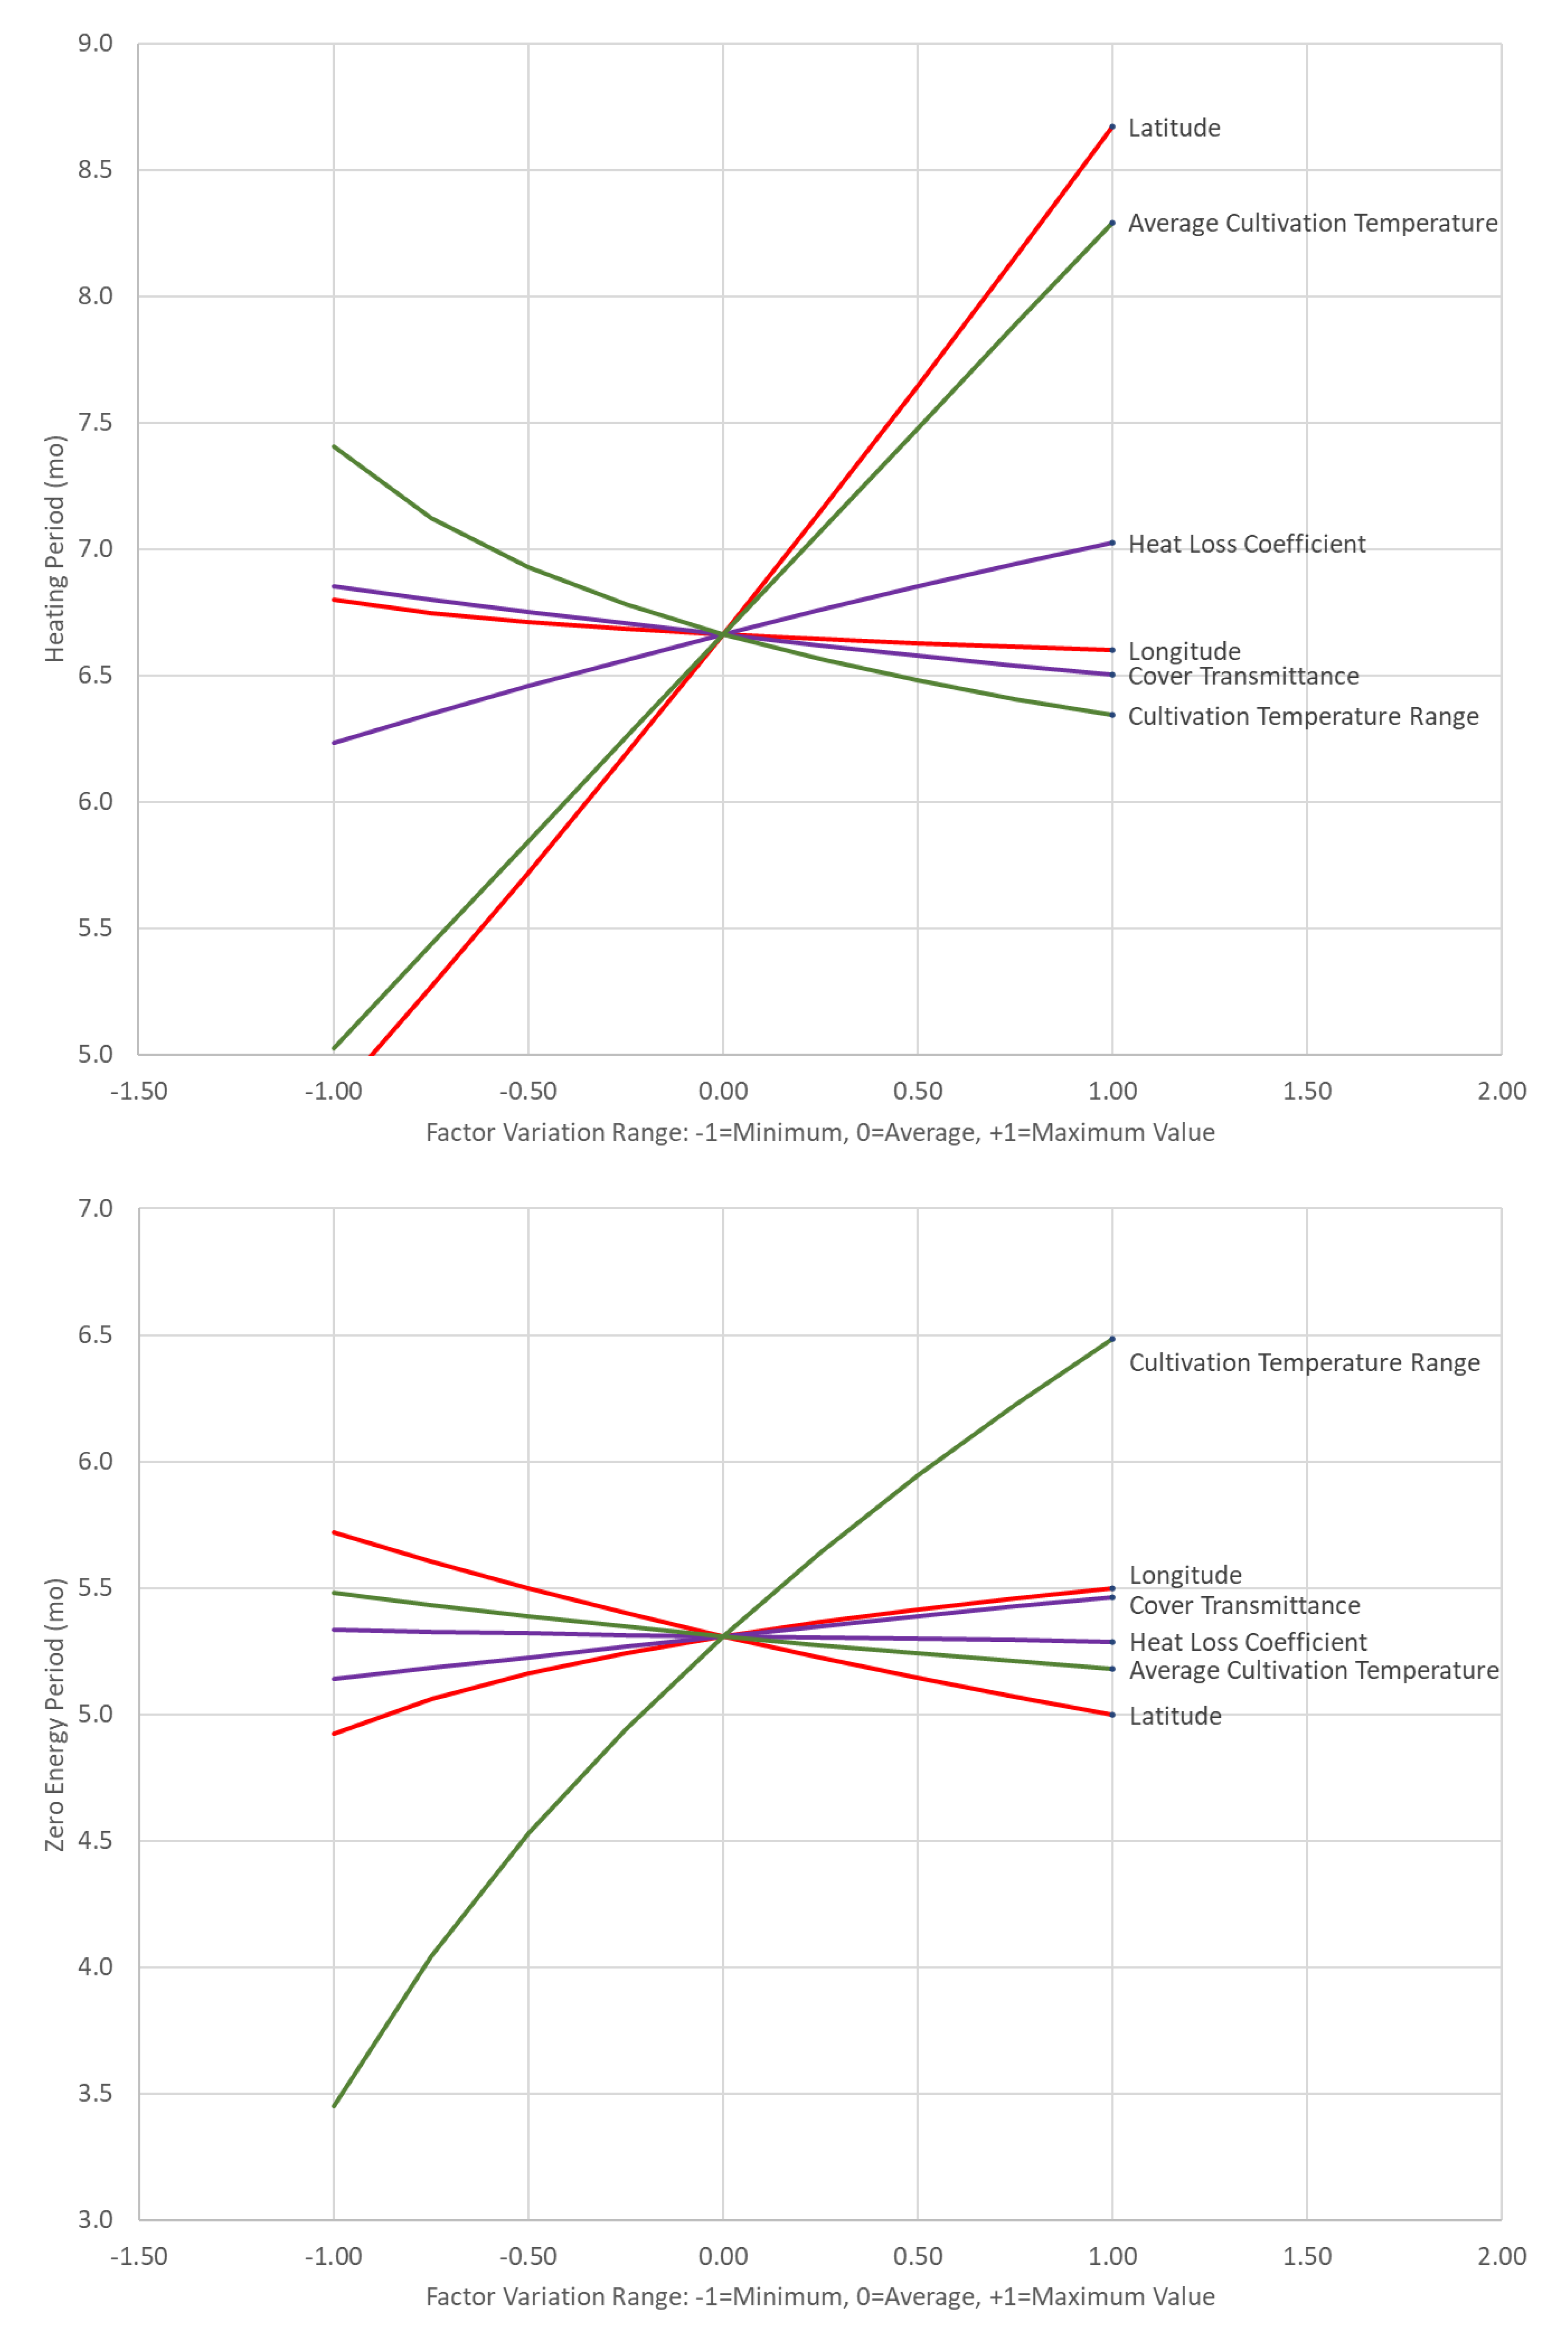
A sensitivity analysis is considered in
Figure 10 and
Figure 11 to determine the range of variation of the estimates for heating requirements, the maximum heating power, the heating period, and the zero-energy period and to compare the effect of the factors on these values.
Figure 10 refers to the energy requirements and the maximum heating power while
Figure 11 refers to the required annual heating and zero-energy periods.
The main conclusions are summarized as follows:
The most important factor affecting greenhouse heating requirements is the latitude of the greenhouse location, followed by the average plant cultivation temperature. For latitude values ranging from 40 to 60 degrees, annual heating requirements are estimated to be between 2.4 and 6.6 GWh/ha, whereas, for average cultivation temperatures lying within the range of 15 to 25 °C, annual heating requirements are estimated to fall between 2.6 and 6.1 GWh/ha (
Figure 10).
Other factors, such as longitude and the transmittance of the greenhouse cover, do not significantly affect heating energy needs. Furthermore, the results demonstrate that smaller cultivation temperature ranges are correlated with larger heating requirements, whereas larger temperature ranges are linked to lower energy requirements (
Figure 10).
The maximum heating power of a greenhouse mainly depends on the latitude of the greenhouse site, ranging from 0.2 to 6.3 MW/ha for latitudes between 40 and 60 degrees. An average latitude of 50 degrees is correlated with a maximum heating power of 1.5 MW/ha and, above that point, an exponential rise in the maximum power is observed as the latitude increases up to 60 degrees. The other factors are of secondary importance (
Figure 10).
From the results presented in
Figure 11, it is clear that latitude is also the dominant factor influencing the heating period of a greenhouse. In general, higher latitudes contribute to longer heating periods, with the minimum heating period being five months for latitude values of 40 degrees and the maximum heating period of nine months appearing for latitude values of 60 degrees.
The average cultivation temperatures of plants also significantly affect the greenhouse heating time, followed by the heat loss coefficient. The cultivation temperature range is negatively correlated with the heating time fraction, similarly to heating needs, and it can be concluded that the longitude and greenhouse cover transmittance values do not play a significant role in heating time fractions (
Figure 11).
The results show that the cultivation temperature range linked to the plant species is the main factor affecting zero-energy periods, with an average value of 3 °C corresponding to a zero-energy-requirement period of 5.3 months. In total, the range of zero energy periods lies between 3.5 and 6.5 months according to the temperature range of the cultivation (
Figure 11). The rest of the factors make a less significant contribution to zero-energy periods, with latitude being the next most important.
Greenhouse energy requirements, the maximum heating power, and heating and cooling periods are not only affected by the geographical coordinates of the site, but also by other factors such as the local climate, the special morphology of the area, etc. The current evaluation does not consider specific local factors. In any case, if the model is applied in such instances, some discrepancies may occur.
Finally, the model estimations are compared with the data from the literature, shown in
Figure 12, to validate the accuracy of the proposed model. Data from Garcia et al. [
14] refer to existing greenhouses in various European countries, while data from Tataraki et al. [
3] refer to simulated data. The main conclusion is that the predictions of annual greenhouse heating needs based on the model suggested in this paper are very similar to the existing data. More specifically, when comparing our results to estimates made by Tataraki et al. for seven European countries, the model proposed in this study tends to slightly overestimate annual heating needs. Overall, both the simulated and real-time greenhouse literature data lie within a range of 20% of the results proposed in this paper, which proves the accuracy of the mathematical model suggested.
4. Conclusions
The proposed simple model proved effective in predicting the thermal energy requirements of greenhouses in Europe. The model estimates the annual heating requirements and the maximum required heating power, along with the corresponding heating and zero-energy operating periods. It is based on the greenhouse technical data (overall heat loss coefficient, cover transmission, sensible absorbance), the cultivation conditions (temperature range), and the meteorological data (solar radiation and ambient temperature) according to the site characteristics (longitude and latitude).
The model estimates proved adequate in comparison with a detailed simulation of the greenhouse thermal performance and also agreed with real data from the literature.
In a sensitivity analysis, the proposed model revealed the effects of various factors on greenhouse energy requirements.
More specifically, the most significant factors that affect annual greenhouse heating requirements are, in order of importance: the latitude of the greenhouse site and the average plant cultivation temperature, whereas the longitude of the location and the transmittance of the greenhouse cover do not significantly affect heating-based energy needs. The maximum required heating power is crucial for the determination of the size of the greenhouse heating system and was proven to be exclusively affected by latitude. Moreover, the results showed that latitude is the dominant factor that influences the heating period of a greenhouse. The effects of longitude and greenhouse cover transmittance were not found to have any significant effect on the heating time fractions of greenhouses. Zero-energy-requirement periods were found to be primarily influenced by the cultivation temperature range of the plant species, as well as by the latitude.
Furthermore, this work delineates the range of greenhouse energy requirements in Europe for various products, that is:
The annual heating requirements for the cultivation of the products investigated range from 0 to 700 kWh/m2, whereas the annual cooling requirements range from 0 to 387 kWh/m2. The products that require the largest amounts of energy for heating are watermelons, melons, and green beans, whereas lettuce requires the lowest amounts of energy for heating, but the highest amount of energy for cooling purposes.
Concerning the greenhouse operating periods, this study showed that the production of watermelons, melons, and green beans in Finland and Sweden has the longest heating period (8.6 and 8.5 months per year, respectively). On the other hand, the production of lettuce in Cyprus exhibits the longest cooling periods (4.8 months per year).
The model can reliably be used to estimate the greenhouse energy requirements for preliminary process design and investment appraisal.


