Article

Internet-Distributed Hardware-in-the-Loop Simulation Platform for Plug-In Fuel Cell Hybrid Vehicles

1
School of Vehicle Engineering, Chongqing University of Technology, Chongqing 400054, China
2
School of Electrical and Electronic Engineering, Chongqing University of Technology, Chongqing 400054, China
*
Author to whom correspondence should be addressed.
Energies 2023, 16(18), 6755; https://doi.org/10.3390/en16186755
Submission received: 4 September 2023 / Revised: 18 September 2023 / Accepted: 20 September 2023 / Published: 21 September 2023
(This article belongs to the Special Issue Advanced Modeling and Optimization of Electrical Drives Technology)

Abstract

:
In order to simulate a PHEV’s dynamic characteristics with high fidelity and study the degradation process of a PHEV’s power sources in real-world driving conditions, an Internet-distributed hardware-in-the-loop (ID-HIL) simulation platform for PHEVs is established. It connects several geographically distributed hardware-in-the-loop (HIL) subsystems (including an in-loop vehicle, Cloud server, driving motor, fuel cells, and lithium battery) via the Internet to simulate the powertrain of a plug-in fuel cell hybrid vehicle (PHEV). In the proposed ID-HIL system, the in-loop vehicle without a hybrid powertrain can simulate a PHEV’s dynamic characteristics. Meanwhile, the other in-loop subsystems can work in the same way as if they were on board. Thus, the degradation process of the power sources, such as the fuel cells and lithium battery, can be studied in real-world driving conditions. A 21 km on-road driving test proves the ID-HIL’s feasibility and fidelity.

1. Introduction

Plug-in hybrid vehicles usually have high-capacity energy storage systems [1], such as lithium batteries, which can replace much fuel consumption with electric energy from the power grid [2]. This topology is combined with a fuel cell stack [3], which can improve energy efficiency and eliminate exhaust emissions [4]. The high cost and short life cycle of the lithium battery and fuel cells hamper their application in the automotive industry [5]. Related study could greatly benefit if these power source degradation processes [6] could be observed on a high-fidelity simulation platform [7]. Thus, this research proposes an Internet-distributed hardware-in-the-loop (ID-HIL) simulation platform to solve this problem.
Specifically, the current studies on power source degradation usually rely on fixed driving cycles [8], such as NEDC and UDDS, which cannot reflect the diversity of local driving conditions. For example, the driving conditions of Chongqing are full of mountainous urban driving conditions. Thus, the ID-HIL simulation platform is supposed to test the power sources on a real-world driving cycle and observe their degradation process in real-time application.
The existing simulation platform for PHEVs includes three major trends [9]: (1) hardware simulation, (2) software simulation, and (3) hardware-in-the-loop (HIL) simulation. The hardware simulation usually develops a complete hybrid powertrain, which can achieve high simulation fidelity but usually has a relatively high price [10]. At the other extreme, the software simulation’s cost is relatively low but at the cost of simulation fidelity [11]. The HIL simulation could be seen as a compromise or a mixture of software simulation and hardware simulation. Some parts of a HIL system are hardware, while the others are software simulated [12].
The traditional HIL simulation platform’s subsystems are usually deployed at the same site [13], such as an experiment lab. This arrangement can simplify the installation process, but it requires more effort for topology reconfiguration, such as from a setup for serial PHEVs to a new one for parallel PHEVs. Moreover, it could not eliminate the reliance on predefined driving cycles, which hamper its fidelity compared to real-world driving cycles.
Thus, the proposed ID-HIL simulation platform employs the Internet, including wired connections and a wireless 5G connection, to connect different in-loop subsystems (including vehicle, Cloud server, driving motor, fuel cells, and lithium battery) to work together and simulate a hybrid power system’s dynamic outputs. Specifically, the in-loop vehicle, which has no hybrid powertrain, can simulate the PHEV’s dynamic characteristics. Meanwhile, other in-loop subsystems, which are not mounted on the vehicle, can operate as if they are on board. Thus, the ID-HIL provides a high-fidelity simulation platform to study the degradation process of the PHEV’s power sources in real-world driving conditions.
The rest of the paper is organized as follows. Section 2 introduces the overview and network configuration of the ID-HIL system, including the client-side prediction method to reduce network delay. Section 3 introduces each in-loop subsystem, including the battery and fuel cell degradation models. Section 4 establishes a 21 km on-road driving test to validate the feasibility of the ID-HIL system.

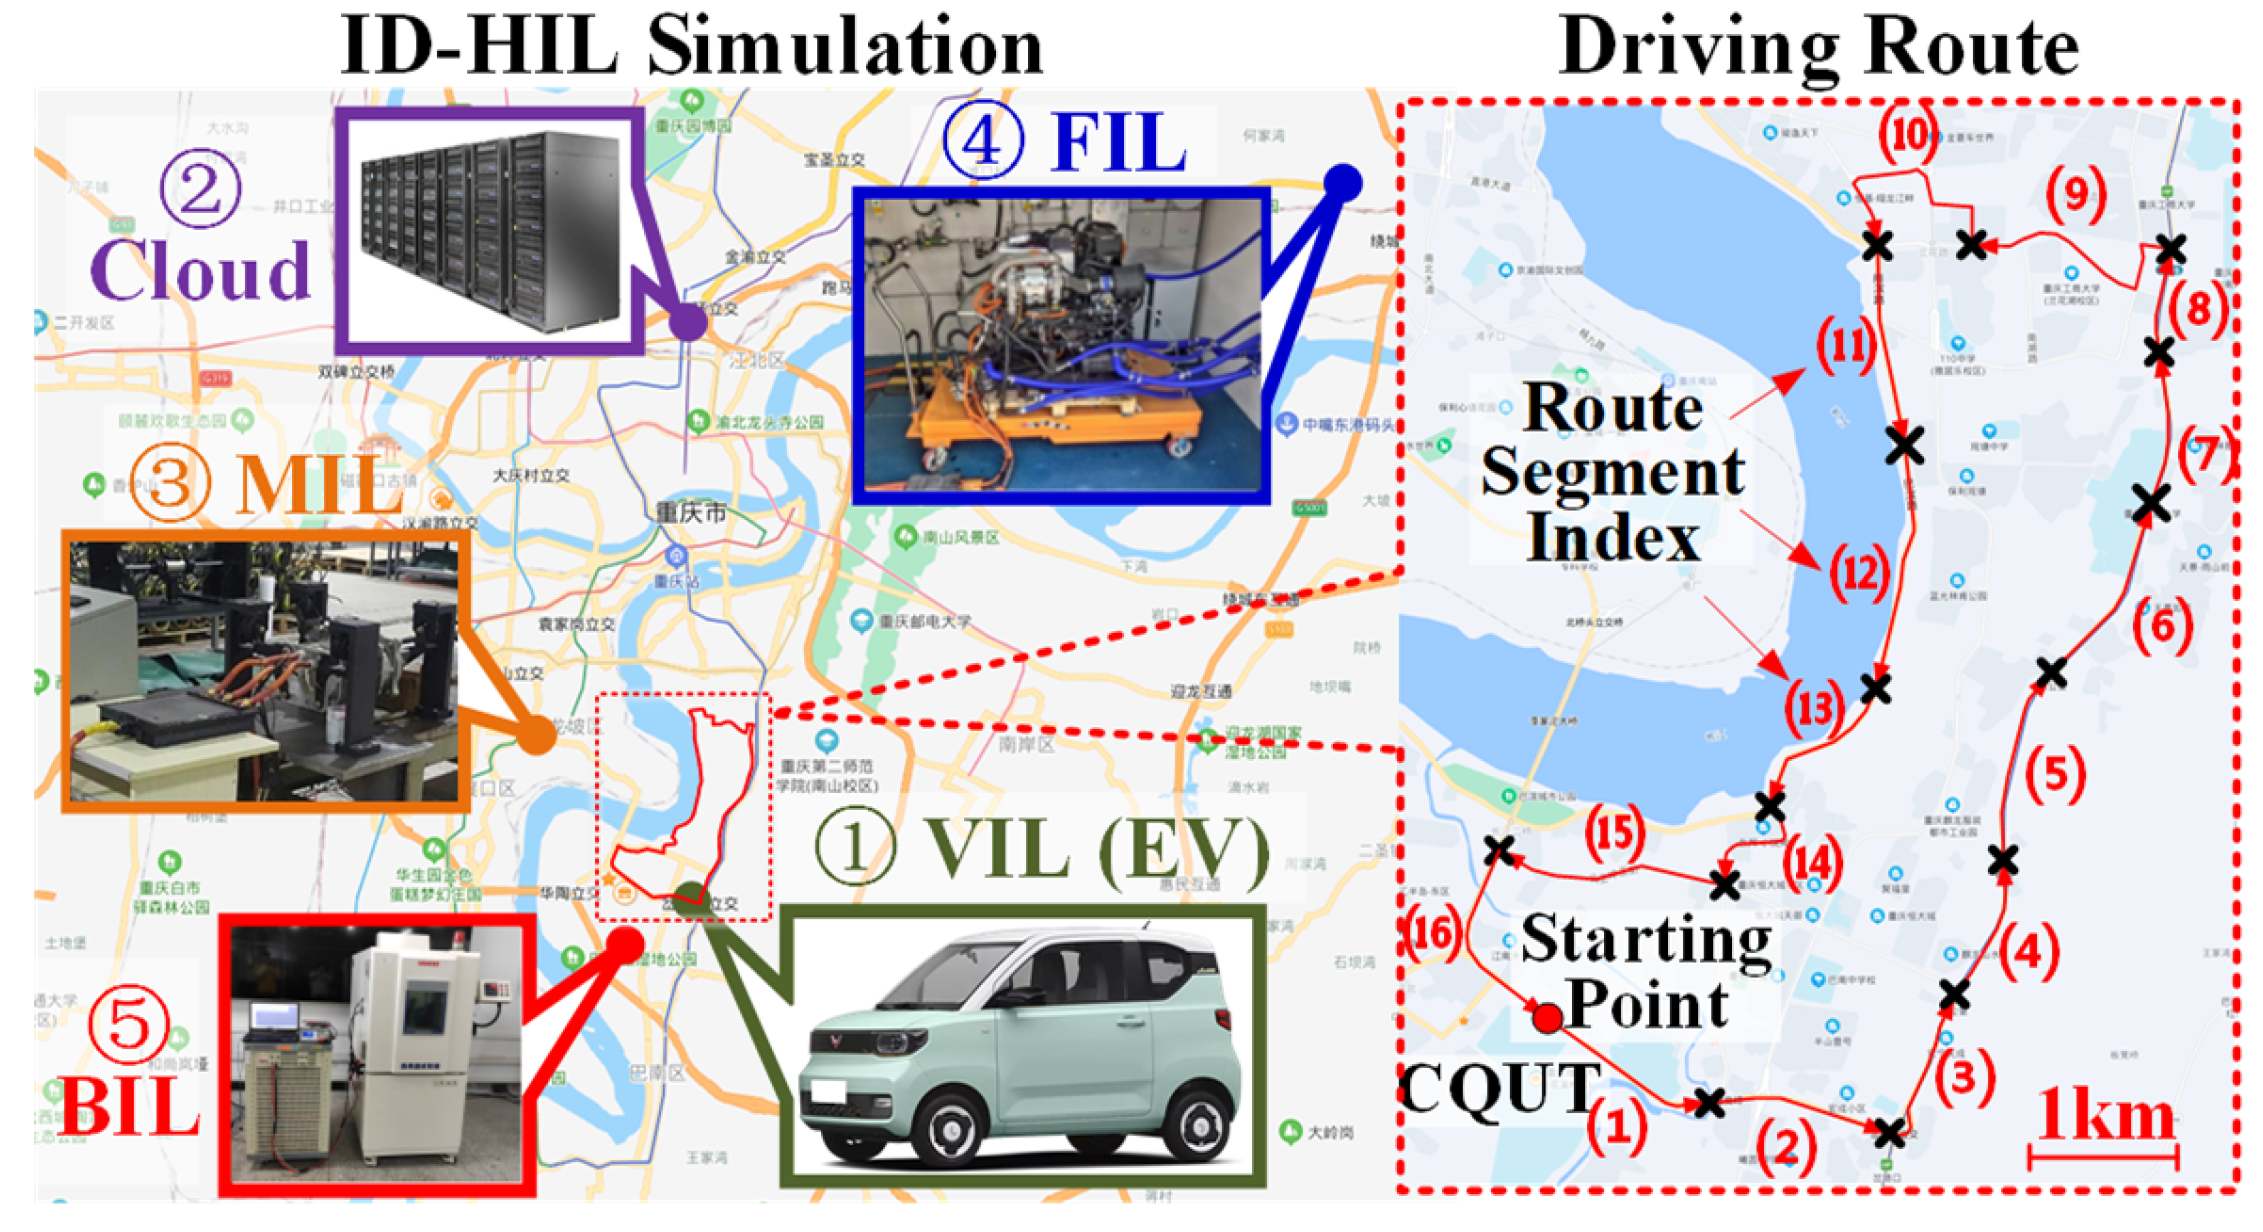
2. Configuration of the ID-HIL Platform

2.1. Overview and Geographical Distribution of ID-HIL

The left side of Figure 1 shows the simulation object of the proposed ID-HIL platform, namely, a PHEV whose topology structure and model method are in the author’s previous work [14]. The right side of Figure 1 shows the schematic diagram of the ID-HIL system, which contains five subsystems, including ① the vehicle-in-the-loop (VIL) subsystem, ② the Cloud, ③ the motor-in-the-loop (MIL) subsystem, ④ the fuel cell-in-the-loop (FIL) subsystem, and ⑤ the battery-in-the-loop (BIL) subsystem. Each subsystem refers to a part of or a function in the PHEV. The “data couple” method [15] is applied to couple them together with the help of the Internet connection.
Figure 2 shows the geographical distribution of the ID-HIL system. Specifically, the VIL is located on the road around the Huaxi campus of Chongqing University of Technology. The Cloud is rented from the IDC room of China Telecom. The MIL is situated in the lab of Chongqing Baizhuan Technology Co., Ltd. The FIL is inside the test center of Chongqing Changan Automobile Company. The BIL is at the Qibo Building of Chongqing University of Technology. More details of their configuration can be found in Table 1. Furthermore, the right side of Figure 2 illustrates the selected 21 km driving route, a typical urban driving situation in which it usually takes 50 min to finish one loop. The driving route is divided into 16 segments based on geographical characteristics, such as traffic lights and crossroads.

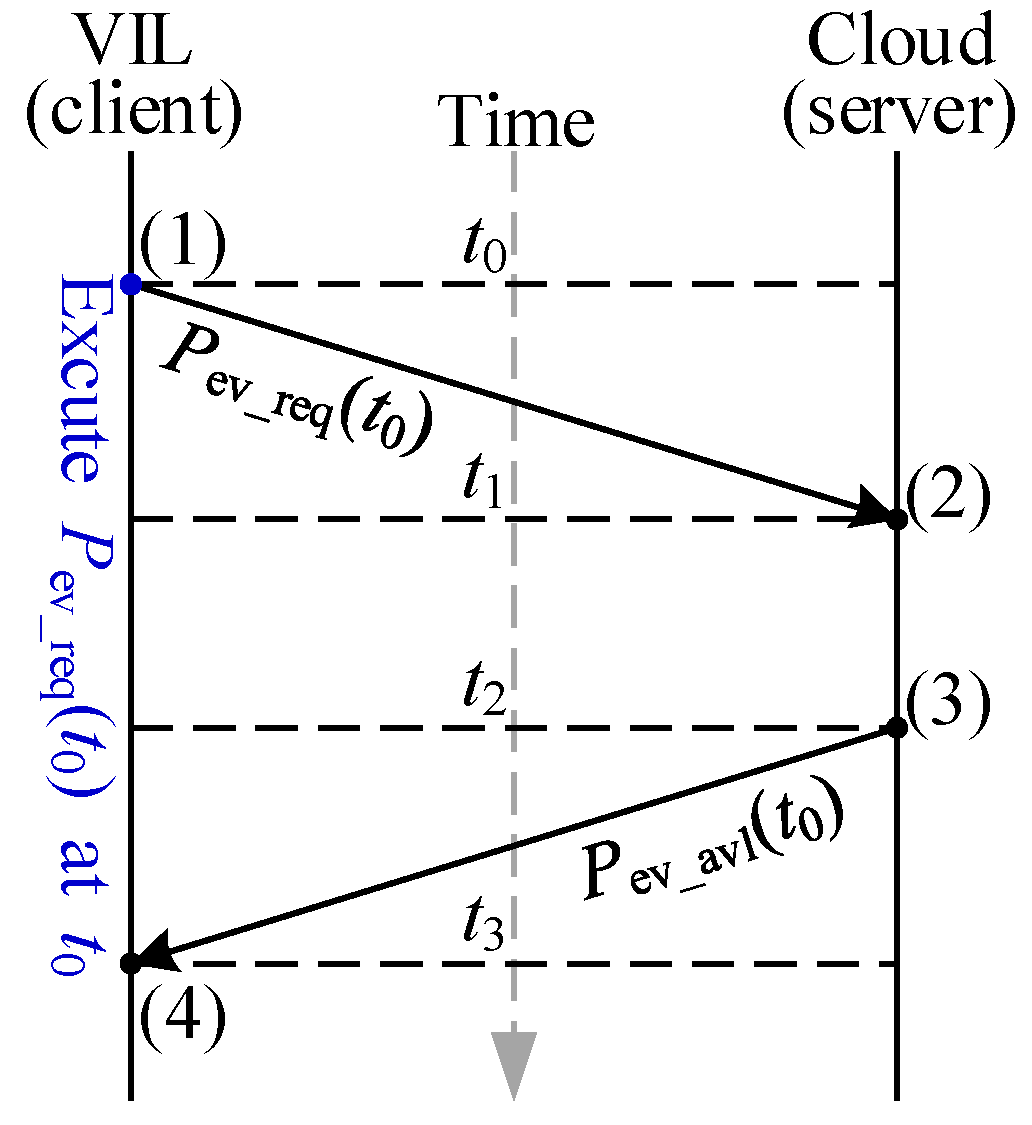
2.2. Network Configuration of ID-HIL

The ID-HIL system’s network configuration is shown in Figure 3, where the Cloud is the control center of this distributed multi-computer system and takes charge of the network control. Because of the requirement for on-road driving, the VIL is connected via the 5G wireless connection using a 5G cellphone, which will be illustrated in Section 3.1. Meanwhile, the rest of the in-loop subsystems are connected through the wired Internet connection for a reduced network delay, as shown in Table 2. Since package loss is rare, the User Datagram Protocol (UDP) [16] is selected for the simplification.
In addition, the Cloud is not the initial node of data flow transmission because the ID-HIL system aims to simulate a PHEV whose control activity is initiated by the driver’s inputs. Thus, as shown in Figure 4, the corresponding data flow route is as follows. (1) The VIL collects the driver’s inputs and calculates the required mechanical driving power for the vehicle (Pev_req), which is subsequently sent to the Cloud. (2) The energy management strategy (EMS) on the Cloud arranges the power distribution among different power sources, including MIL, FIL, and BIL. Thus, the required powers (Pem_req/Pfc_req/Pbat_req) for the corresponding power sources (MIL/FIL/BIL) are transmitted. (3) The power sources operate as the received requirement and send the detected actual outputs (Pem_avl/Pfc_avl/Pbat_avl) back to the Cloud. (4) The Cloud collects the feedback from the power sources and works out the available mechanical driving power for the vehicle (Pev_avl). The VIL will drive the vehicle according to Pev_avl from the Cloud.
The ID-HIL’s network configuration will add a significant delay to the response of the driver’s input because the related data have to travel through the following path before the onboard motor executes it: ①VIL → ②Cloud → ③MIL/④FIL/⑤BIL → ②Cloud → ①VIL. The added delay includes both the delay in network transmission and the execution delay of the HIL subsystems, which can damage the VIL’s maneuverability. Thus, the client-side prediction method [17] is introduced to minimize the delay.
The basic idea of the client-side prediction [17] shown in Figure 5 is that the client (VIL) locally reacts to the driver’s input (the required driving power Pev_req) before the server (Cloud) has acknowledged with an updated state (the available driving power Pev_avl). So, instead of only sending Pev_avl to the Cloud and waiting for Pev_avl in return, the VIL also, in parallel with this, predicts Pev_avl = Pev_req and gives dynamic feedback immediately. Since all messages transmitted in the ID-HIL system have a timestamp, the detailed procedures shown in Figure 5 are as follows:
(1) At the time t0, the VIL sends Pev_req(t0) to the Cloud and meanwhile sets the onboard motor’s driving power Pev(t0) = Pev_req(t0); (2) at the time t1, the Cloud receives Pev_req(t0) and commands each HIL subsystem according to the result of the EMS; (3) at the time t2, the Cloud collects the feedback from each HIL subsystem and sends Pev_avl(t0) back to VIL; and (4) at the time t3, the VIL receives Pev_avl(t0), and, based on its timestamp t0, the following action is executed:
set   P ev ( t 3 ) = P ev _ req ( t 3 ) , if   E r r o r ( t 0 ) = 0 set   P ev ( t 3 ) = P ev _ req ( t 3 ) E r r o r ( t 0 ) , if   E r r o r ( t 0 ) 0
where Error(t0) = Pev_req(t0) − Pev_avl(t0), Pev_req is the required driving power, Pev_avl is the available driving power, and t0, t1, t2, and t3 are the timestamps. Moreover, t1t0 and t3t2 contain only transmission delay (5~10 ms with 5G networks), while t2t1 includes both the transmission delay and the execution delay of the HIL (20~100 ms depending on the type of HIL).
And then, because the driver’s input (θacc and θbrk) is treated as “local data” in this design, there is neither a network delay nor disconnection, which may result in the loss of control of the vehicle. The drawback of this modification is that, if the available driving power does not meet the requirement (usually Pev_avl < Pev_req), the error to adjust the driving power will not be available until it finishes the whole data transmission loop, as shown in Figure 4 and Figure 5. This situation could be avoided by careful vehicle matching, namely, never letting the requirement outrun the power sources’ capability. In this research, the unsatisfactory situation rarely happened during the on-road experiment.
As shown in Figure 6, an on-road driving test is carried out to exhibit the influence of client-side prediction on the VIL’s dynamic performance. At 3 s, as can be seen in Figure 6, Pev_req steps up from 4 kW to 6 kW, while Pev follows it closely, which means the command is executed locally without delay based on the client-side prediction. And then, because an error in client-side prediction rarely happens, Pev_avl is deliberately set to 50% of Pev_req (constant at 6 kW) after 7 s, as seen in Figure 6, to incur an error. At the time, Pev_avl drops from 6 kW to 3 kW. After 0.3 s, the actual driving power of the VIL (Pev) follows to 3 kW, which is the time when Pev_avl(t0) returns to the VIL because the execution delay (t2t1) is set to 300 ms in the Cloud. And then, the VIL’s velocity begins to drop accordingly. In regular use, this incident could be avoided by carefully choosing Tmot_MAX and Pmot_MAX so that the requirement is within the HIL’s capability. Except for the error condition, Pev_req and Pev_avl behave like “local data”.

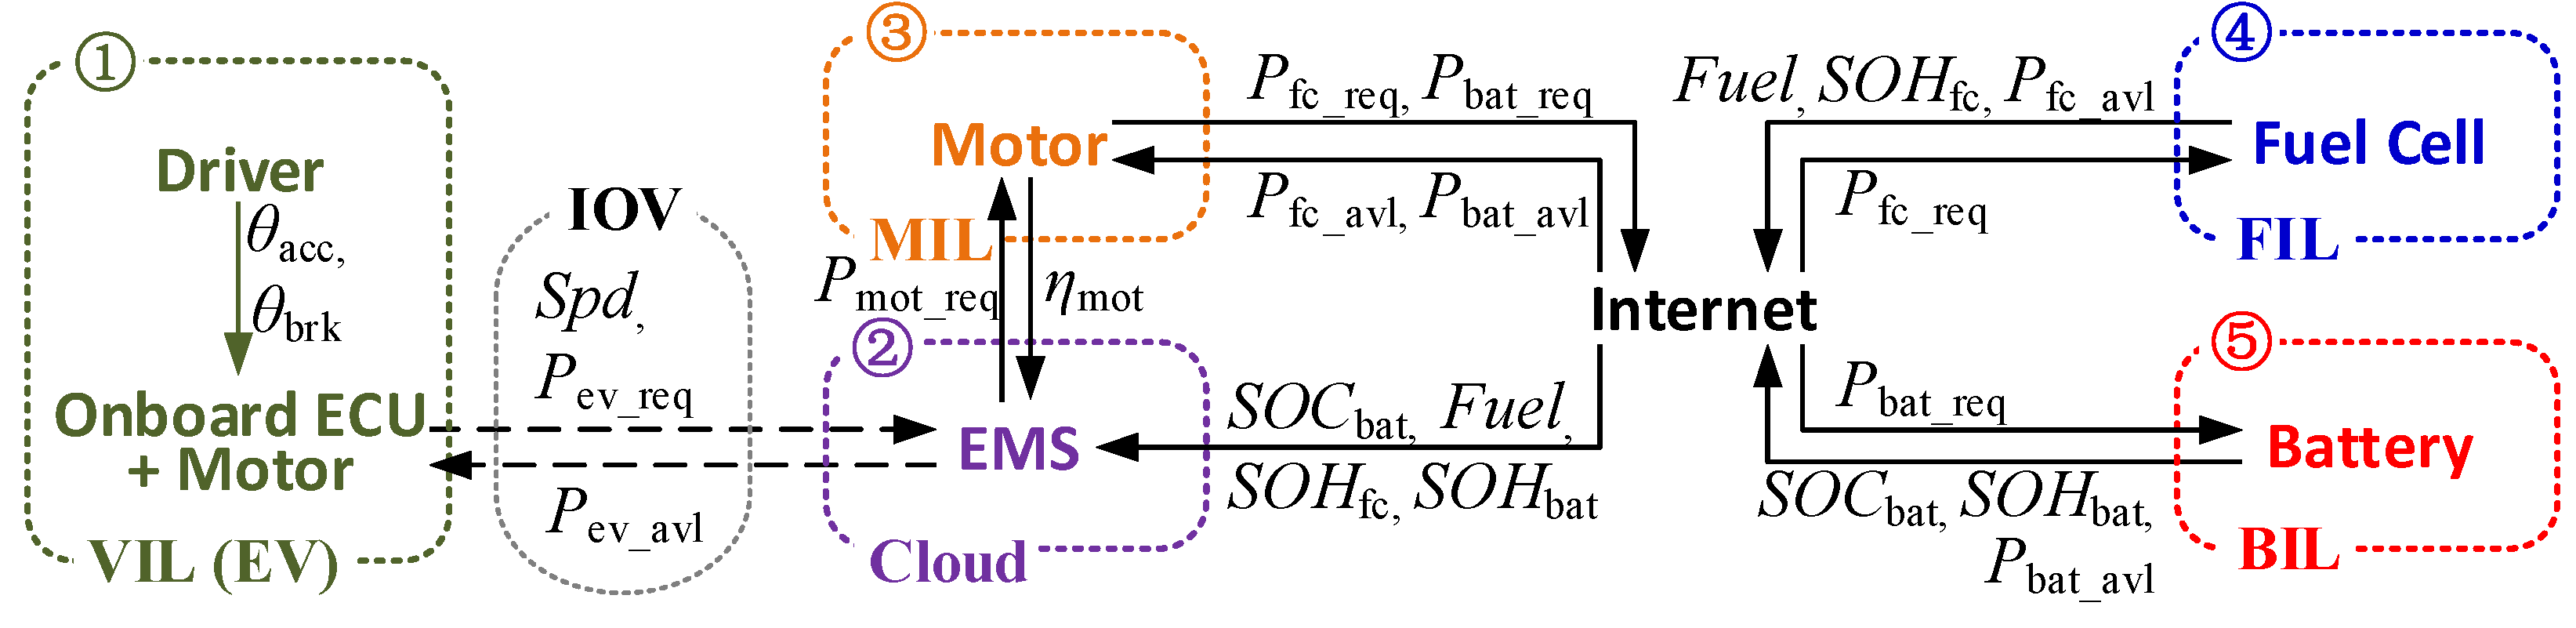
3. In-Loop Subsystems of the ID-HIL Platform

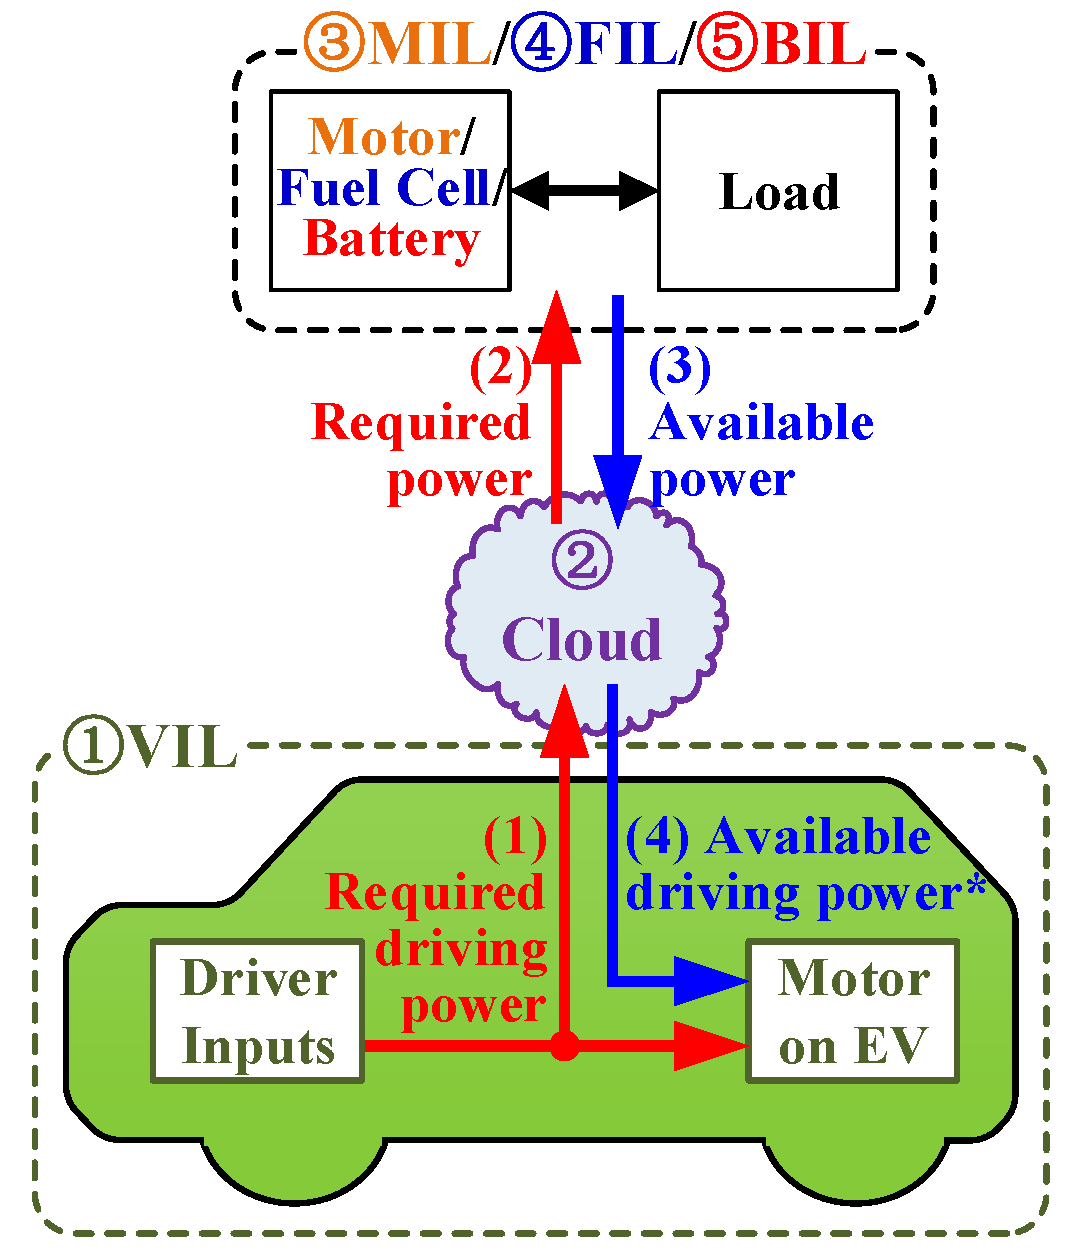
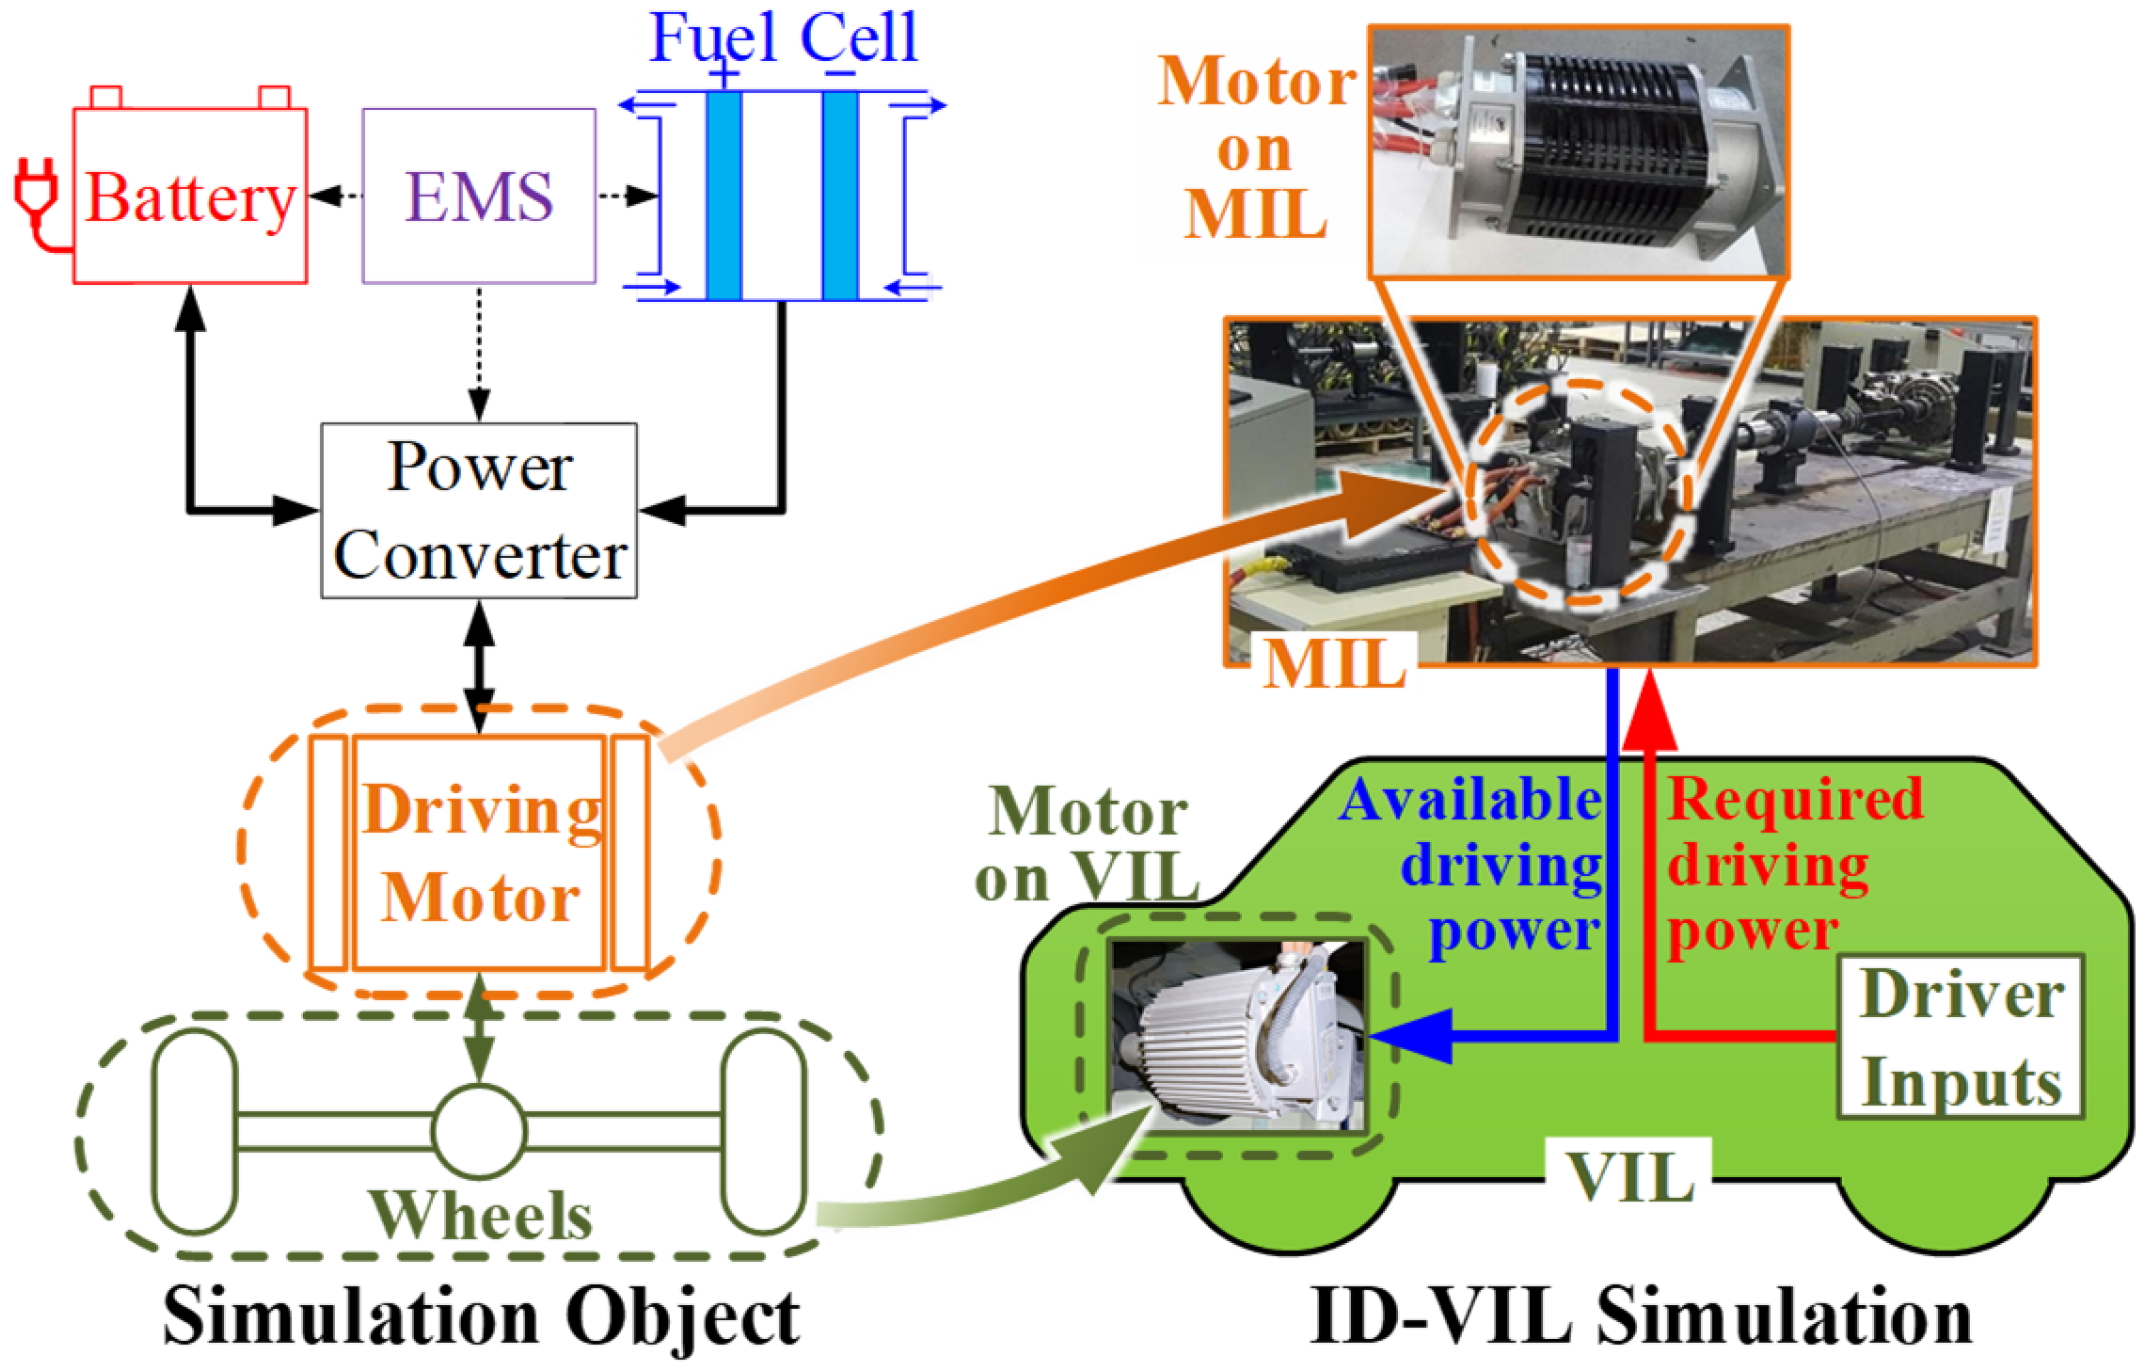
3.1. Vehicle-in-the-Loop Subsystem (VIL)

The main component of the VIL subsystem shown in Figure 7 is a pure electric vehicle (Hongguang MiniEV), whose parameters are listed in Table 3. The control center of the VIL is a laptop PC, which collects the driver’s inputs, including the acceleration and brake pedal positions (θacc and θbrk) via a CAN-USB module, to calculate the required mechanical driving power as follows:
P ev _ req = ω mot × min ( T mot _ MAX ,   P mot _ MAX / ω mot ) × θ acc
where Tmot_MAX (90 Nm) and Pmot_MAX (14 kW) are the parameters of the driving motor in the MIL. As mentioned in Section 2.2, the Pev_req will be executed by the VIL in parallel with the operations along the data flow route, as shown in Figure 4, so that the delay in the ID-HIL system’s effects on the vehicle’s dynamics is limited. Moreover, the 5G cellphone depicted in Figure 7 provides a 5G wireless connection to the Cloud, and the GPS module detects the VIL’s geographical position.

3.2. Cloud-in-the-Loop Subsystem (Cloud)

The components of the cloud server in China Telecom are as follows: CPU: Xeon, four cores; 2.13 GHz; Memory: 8 GB RAM; bandwidth: 5 Mb. There are two functions of the Cloud: communication control and energy management. The former has been discussed in Section 2.2. For the latter, the simple rule-based charge-depleting and charge-sustaining (CDCS) function is borrowed from the author’s previous study [18].

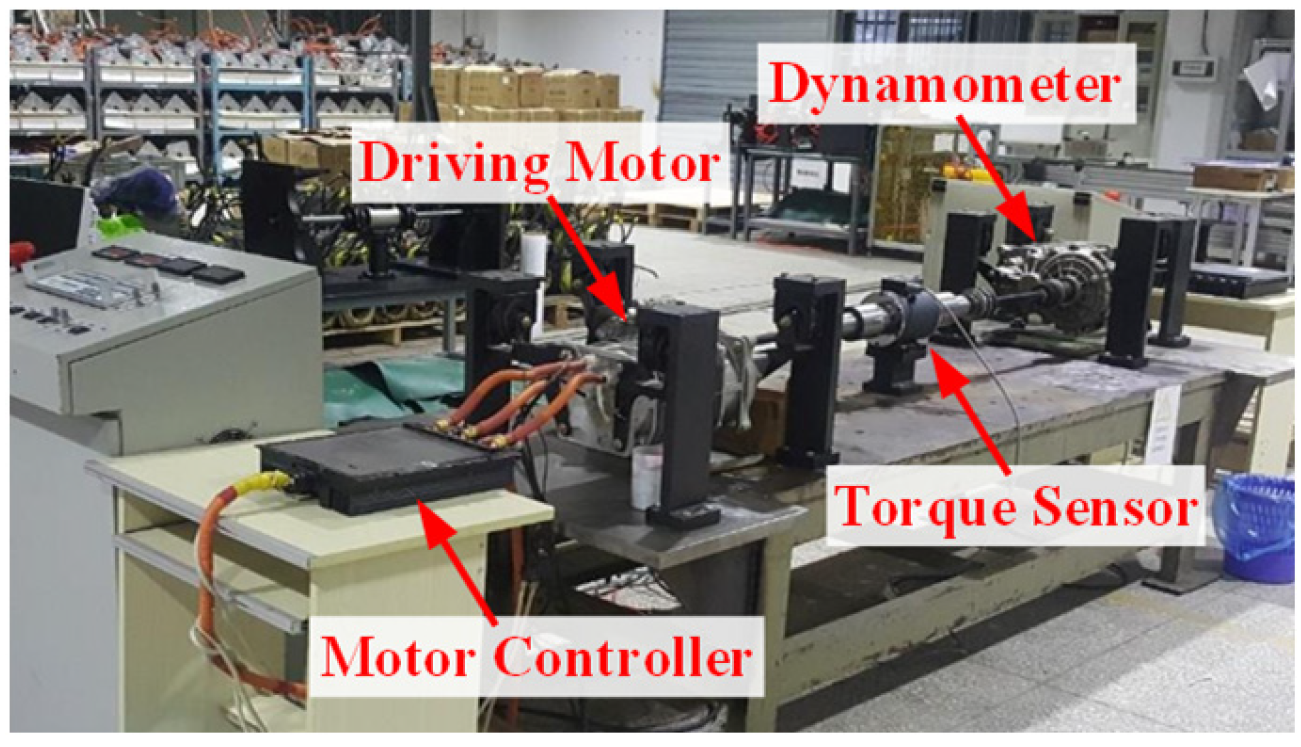
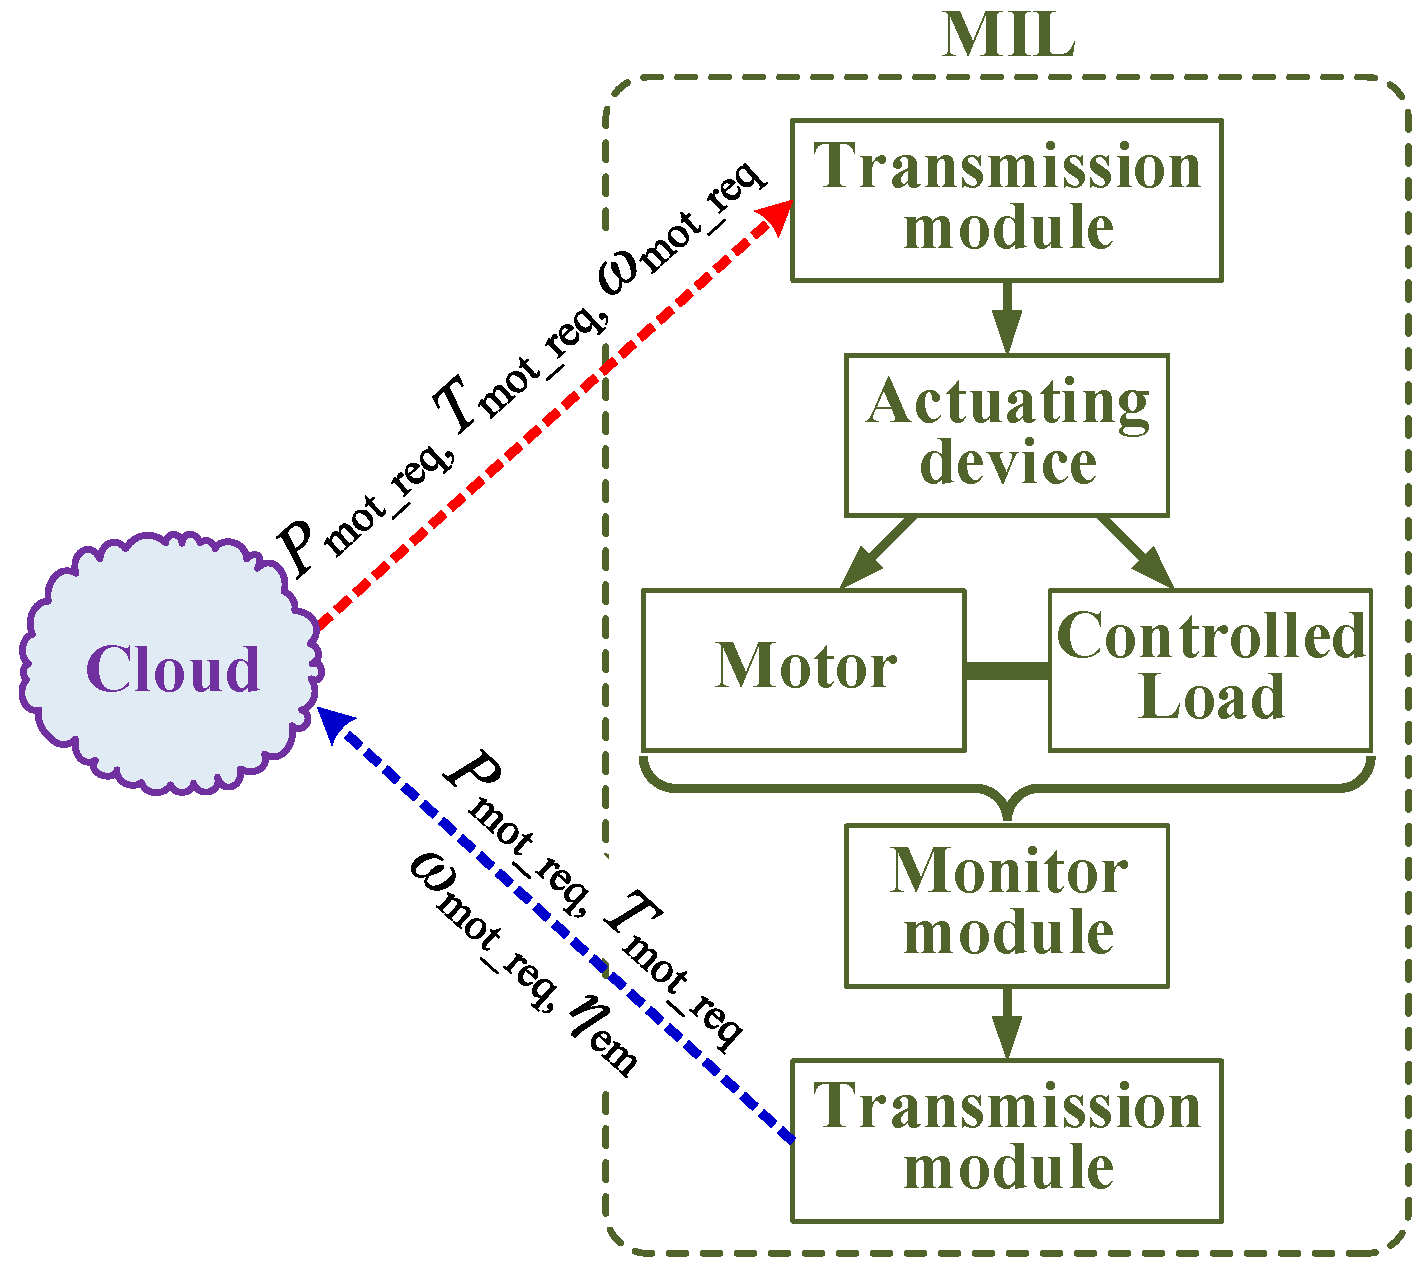
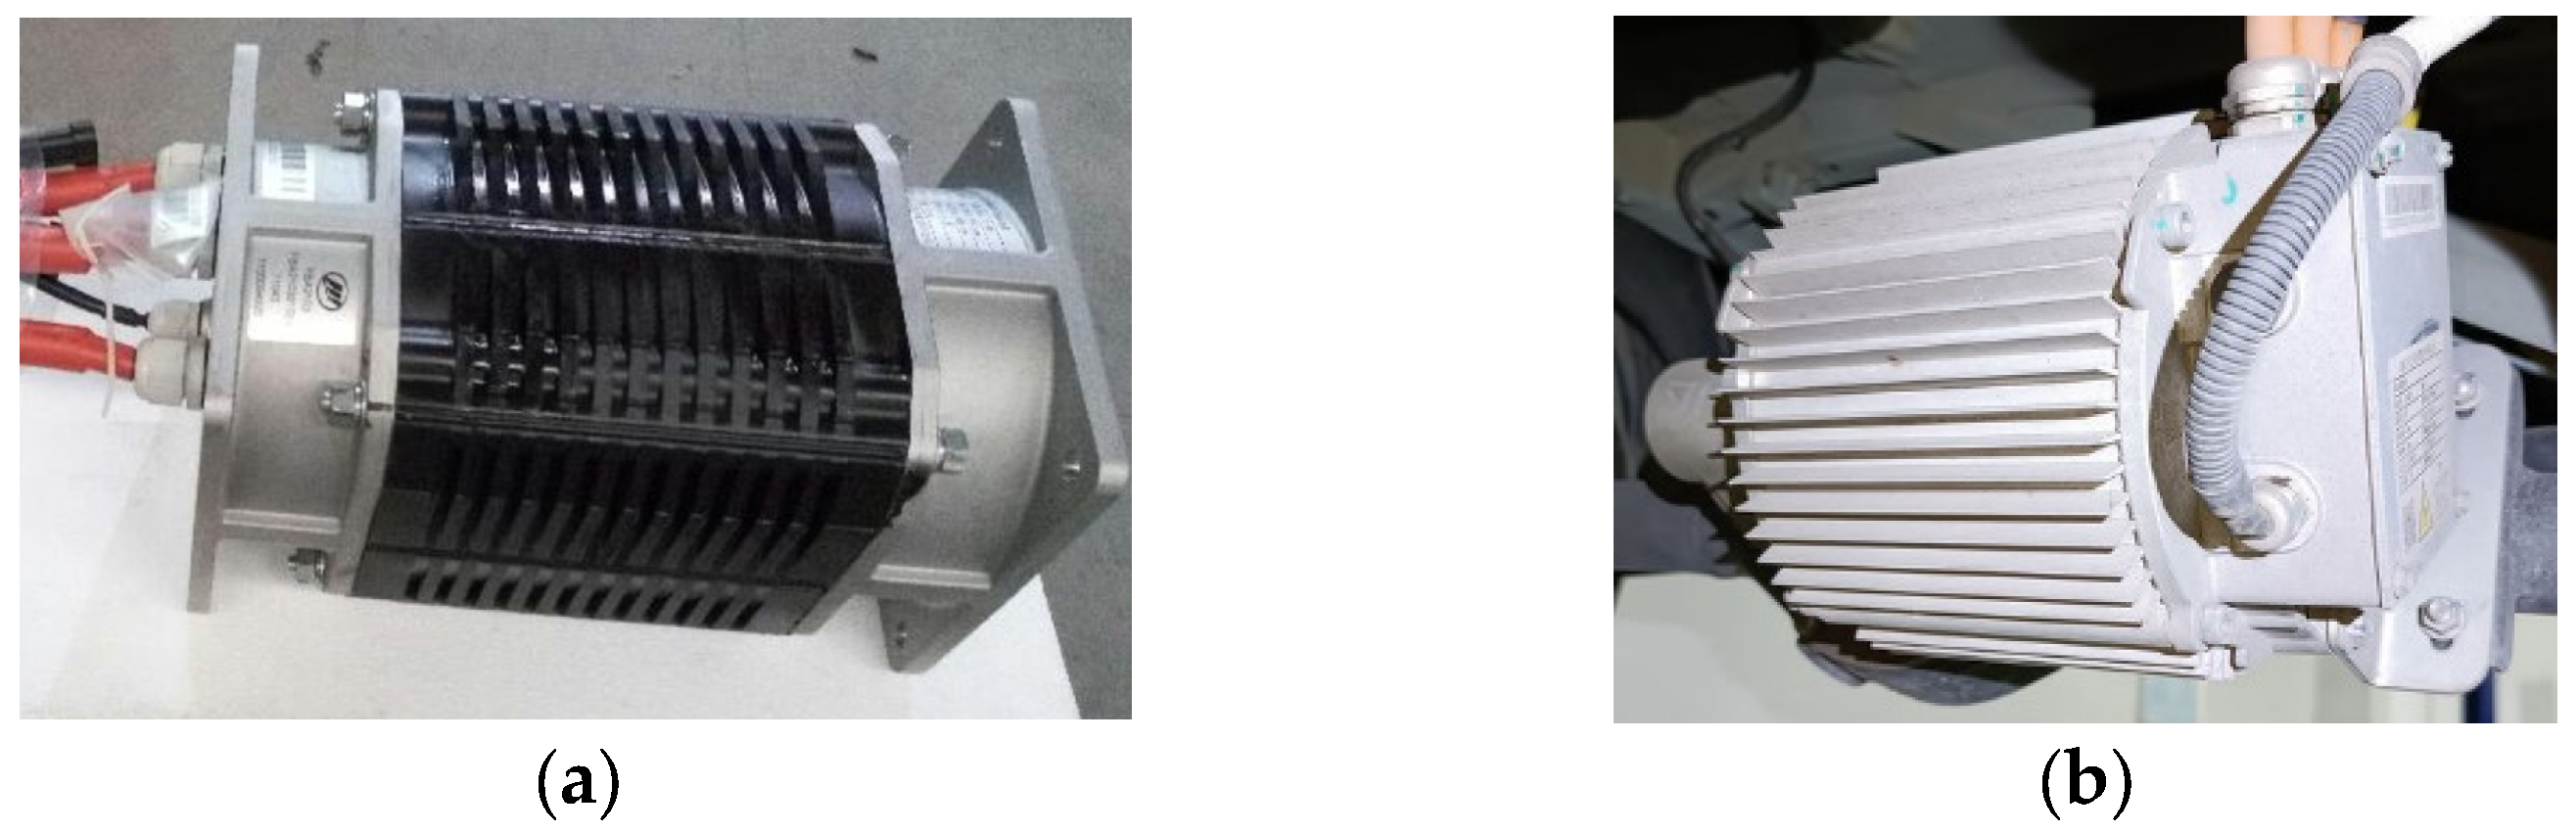
3.3. Motor-in-the-Loop Subsystems (MIL)

The MIL subsystem shown in Figure 8 contains a motor testing platform. It carries out requirements, including power and speed (Pem_req, ωem_req), from the Cloud and returns the instantaneous value of motor efficiency (ηem_avl) to the Cloud. Hem_avl will be used in the EMS to calculate the required charging power from the fuel cells (Pfc_req) and the required battery power (Pbat_req). The control logic of MIL is illustrated in Figure 9. Furthermore, the control logic of MIL, FIL, and BIL are almost the same, where the HIL tries to fulfill the Cloud’s requirement and feeds back the HIL’s real-time conditions.
As shown in Figure 10, the ID-HIL system contains two driving motors. One (on the left) is on the MIL, while the other (on the right) is mounted on the VIL. Specifically, the left-hand one is for the simulation object (PHEV), whose efficiency affects the EMS’s behaviors. The right-hand one is supposed to emulate the left-hand one’s kinetic characteristics, namely, output torque (or power). Thus, they could be different in the configuration shown in Table 4, where the left-hand one is an asynchronous motor while the right-hand one is a permanent magnet synchronous motor. But there is one rule for them to follow: the outputs (the available driving power depicted in Figure 4) of the left-hand motor should be strictly followed by those of the right-hand model.
In conclusion, as shown in Figure 11, the motor on the MIL refers to the driving motor on the simulation object (PHEV), which is responsible for calculating the energy efficiency for energy management. In contrast, the motor is mounted on the in-loop vehicle (VIL), which is used to fulfill the simulation object PHEV’s kinetic requirement.

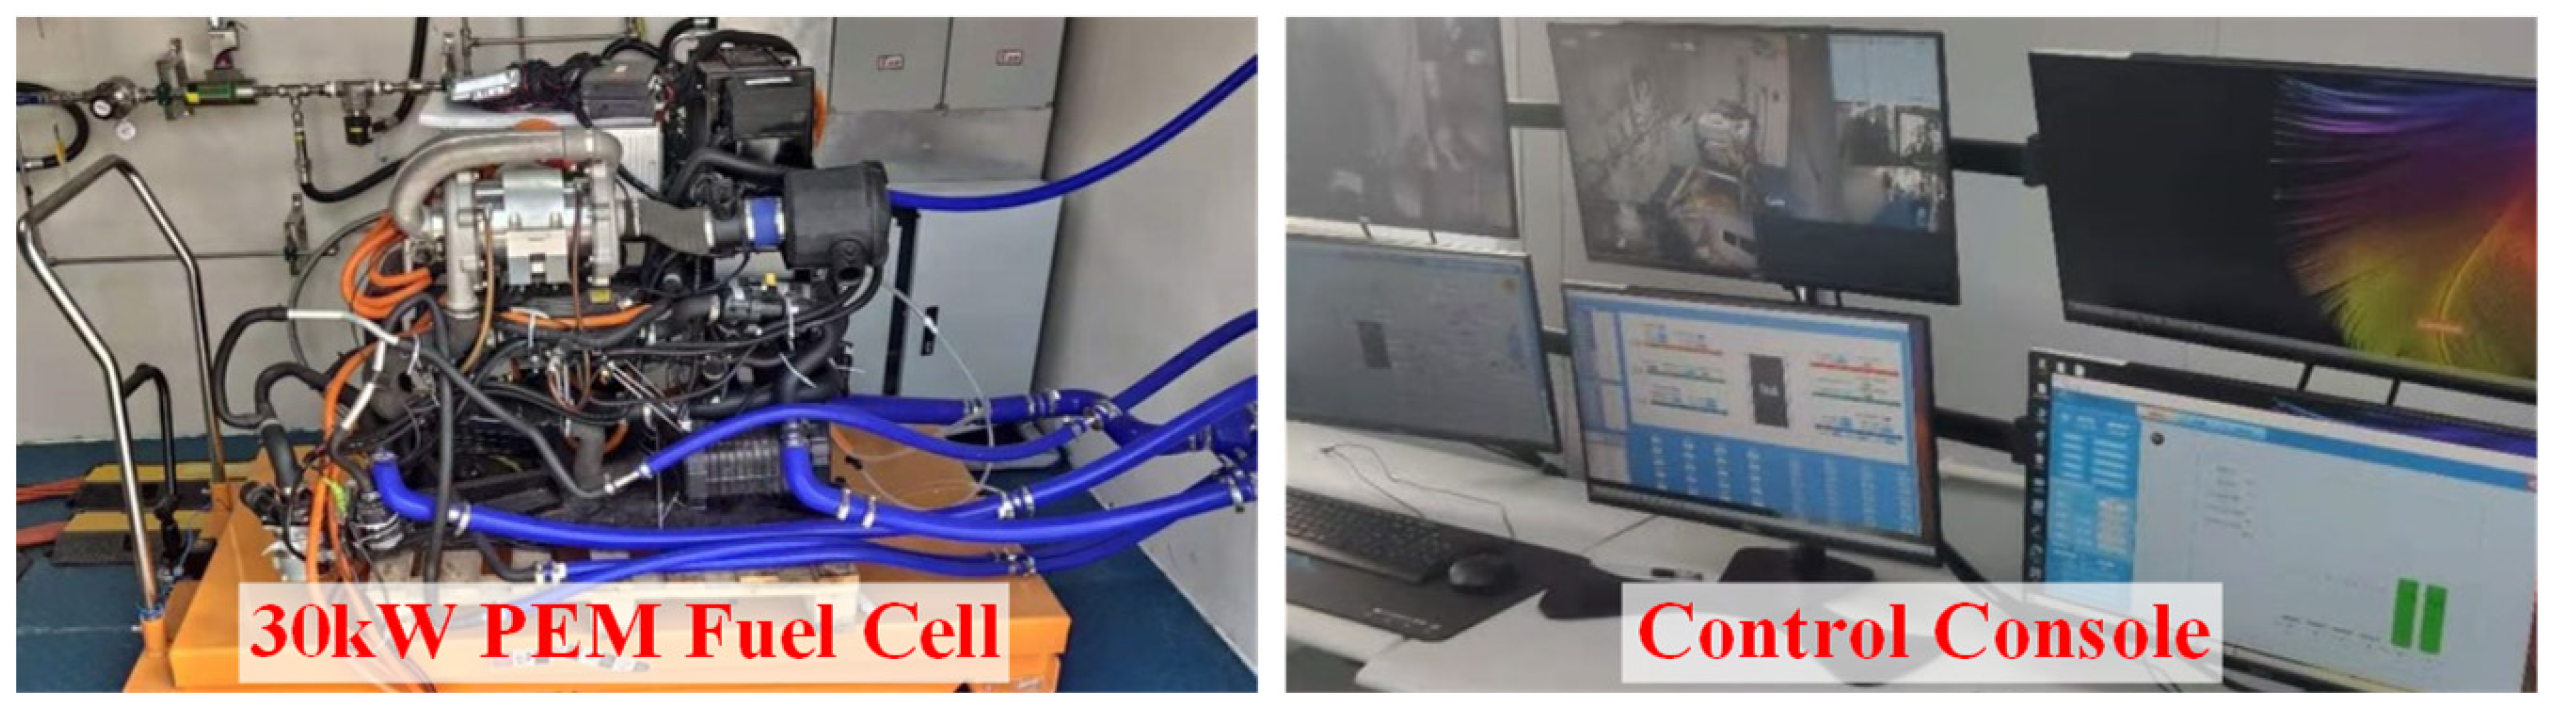
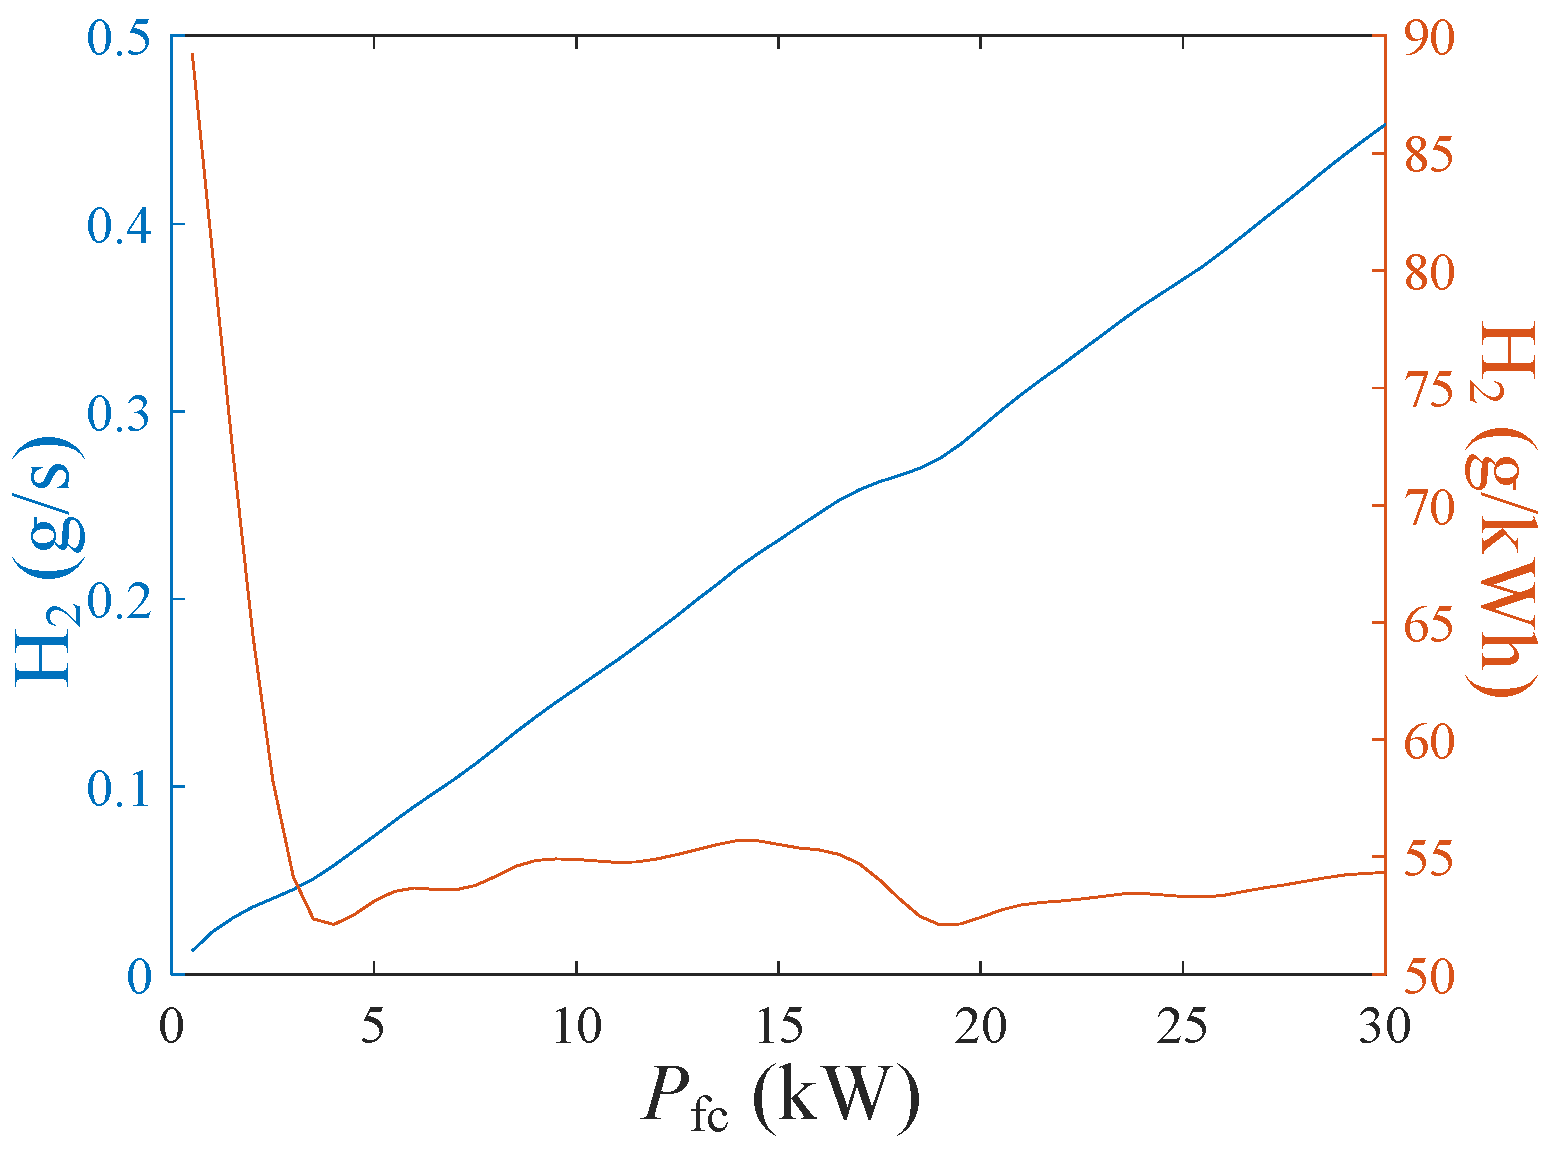
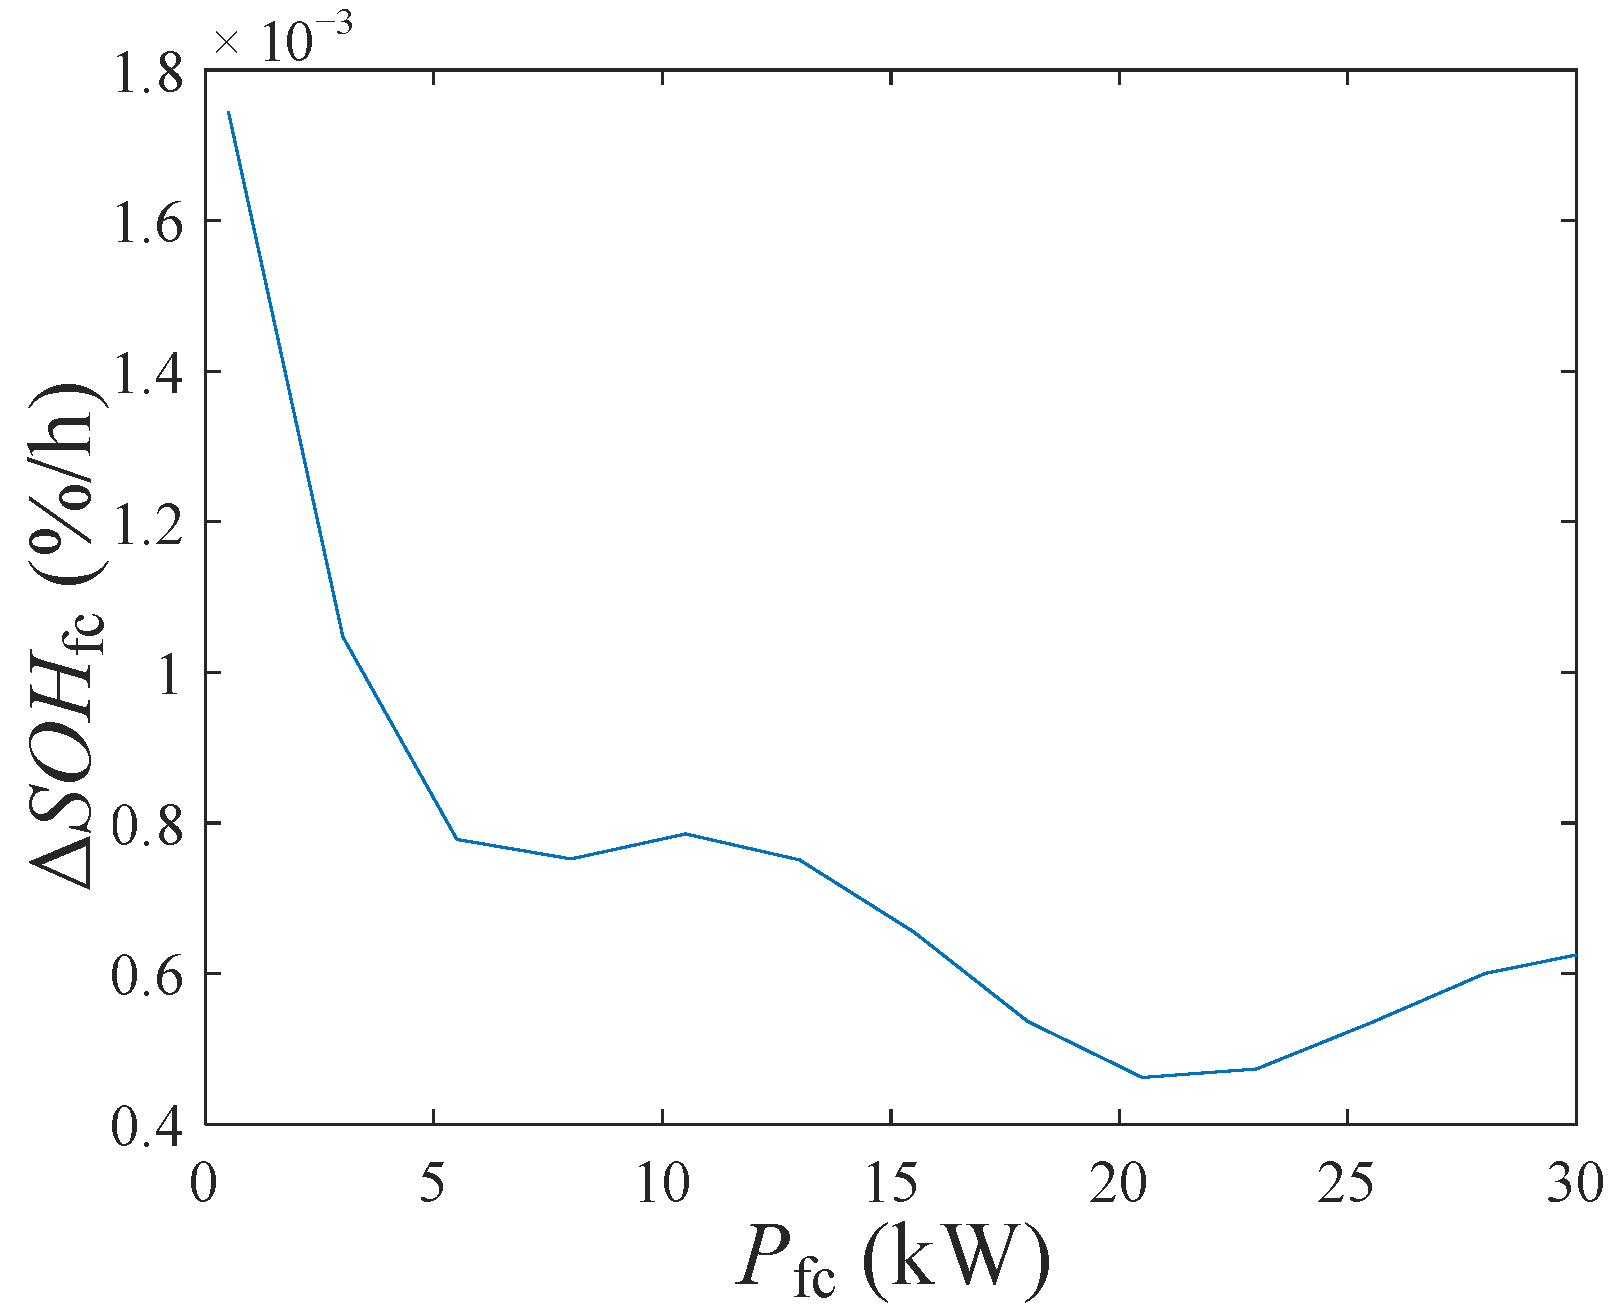
3.4. Fuel Cell-in-the-Loop Subsystems (FIL)

The FIL shown in Figure 12 consists of a 30 kW PEM (proton exchange membrane) fuel cell test bench. The FIL’s parameters are listed in Table 5. Specifically, there are 240 signal fuel cells in this stack. Each cell’s open-circuit voltage is 1.23 V. In the national standard GB/T 38914-2020 [19], the current when the terminal voltage of a signal fuel cell equals 0.70 V (stack: 0.7 × 240 = 168 V) with a constant load straight after the stack is at the beginning of life (BOL) is defined as the reference current (Iref). In the same way, the idle current corresponds to 0.85 V.
The stack’s fuel consumption rate is presented in Figure 13, which is evaluated under constant power conditions with an environment temperature of 20 °C. The stack’s highest efficiency operation point is around the reference working condition.
In the ID-HIL system, the Cloud sends the required power (Pfc_req) to the FIL and expects the available power (Pfc_avl), instantaneous fuel consumption (Fuel), and stack’s SOH (SOHfc) from the FIL. The FIL physically measures Pfc_avl and Fuel, but the variation of the stack’s SOH (ΔSOHfc) is too slight to be physically measured within a short-term driving test. Thus, an aging model of the fuel cell stack is needed.
According to [20], when fuel cells age, the stack’s terminal voltage under the constant current working condition at Iref, in other words, the reference voltage (Vref), will drop linearly. Furthermore, GB/T 38914-2020 [19] defines that when Vref drops 20% from its BOL level, the stack is at its end of life (EOL). Thus, the fuel cell SOH (SOHfc) is defined as follows:
S O H fc = 1 V BOL V ref 0.2 × V BOL × 100 %
where VBOL is the reference voltage when the stack is at BOL, and Vref is the fuel cell’s reference voltage at present.
The quantitative experiment method to evaluate the fuel cell degradation process is also defined in GB/T 38914-2020 [19] as follows. First, the effect of start–stop working conditions on SOHfc [21] should be evaluated. Second, the degradation rates under different constant power conditions are measured using repetitive experiments. Finally, a curve map of the fuel cell degradation rate ΔSOHfc under different output power is obtained, as shown in Figure 14. The details of the repeated experiments for ΔSOHfc can be found in Section S1 of the Supplementary Materials. The fuel cell degradation model depicted in Figure 14 could be used as an optimal object in energy management.

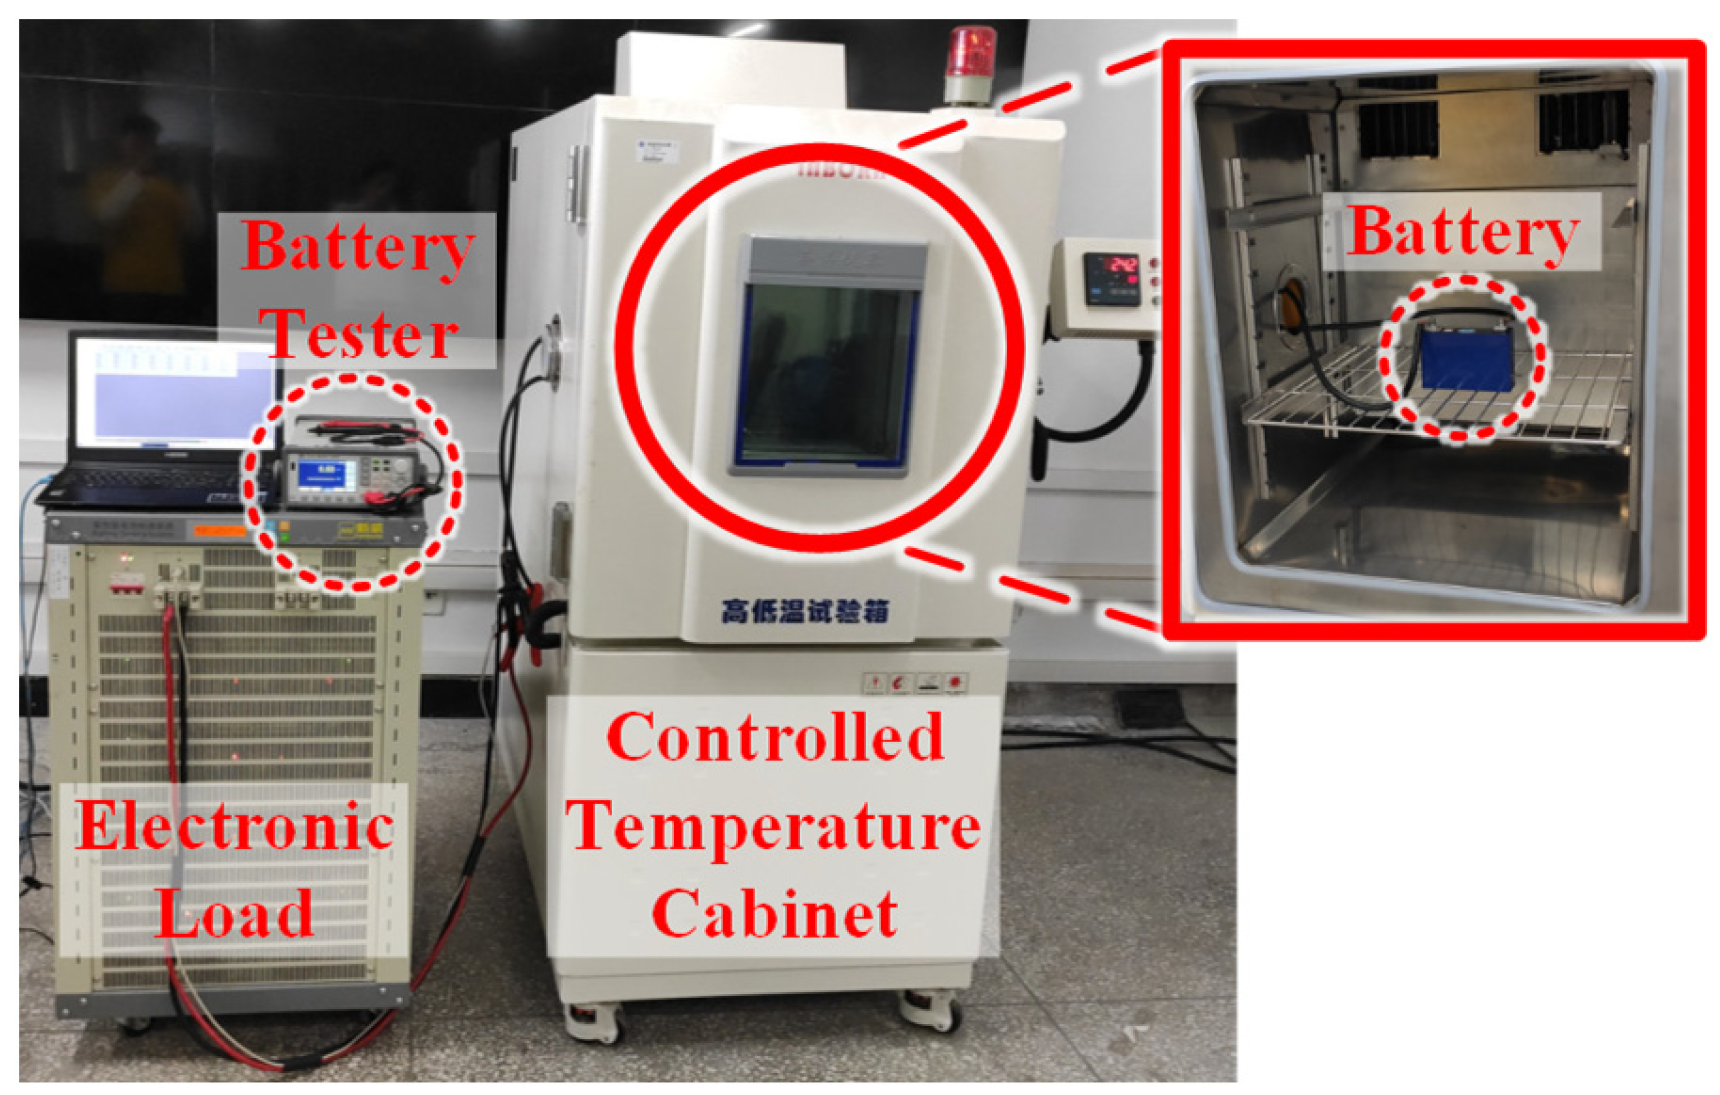
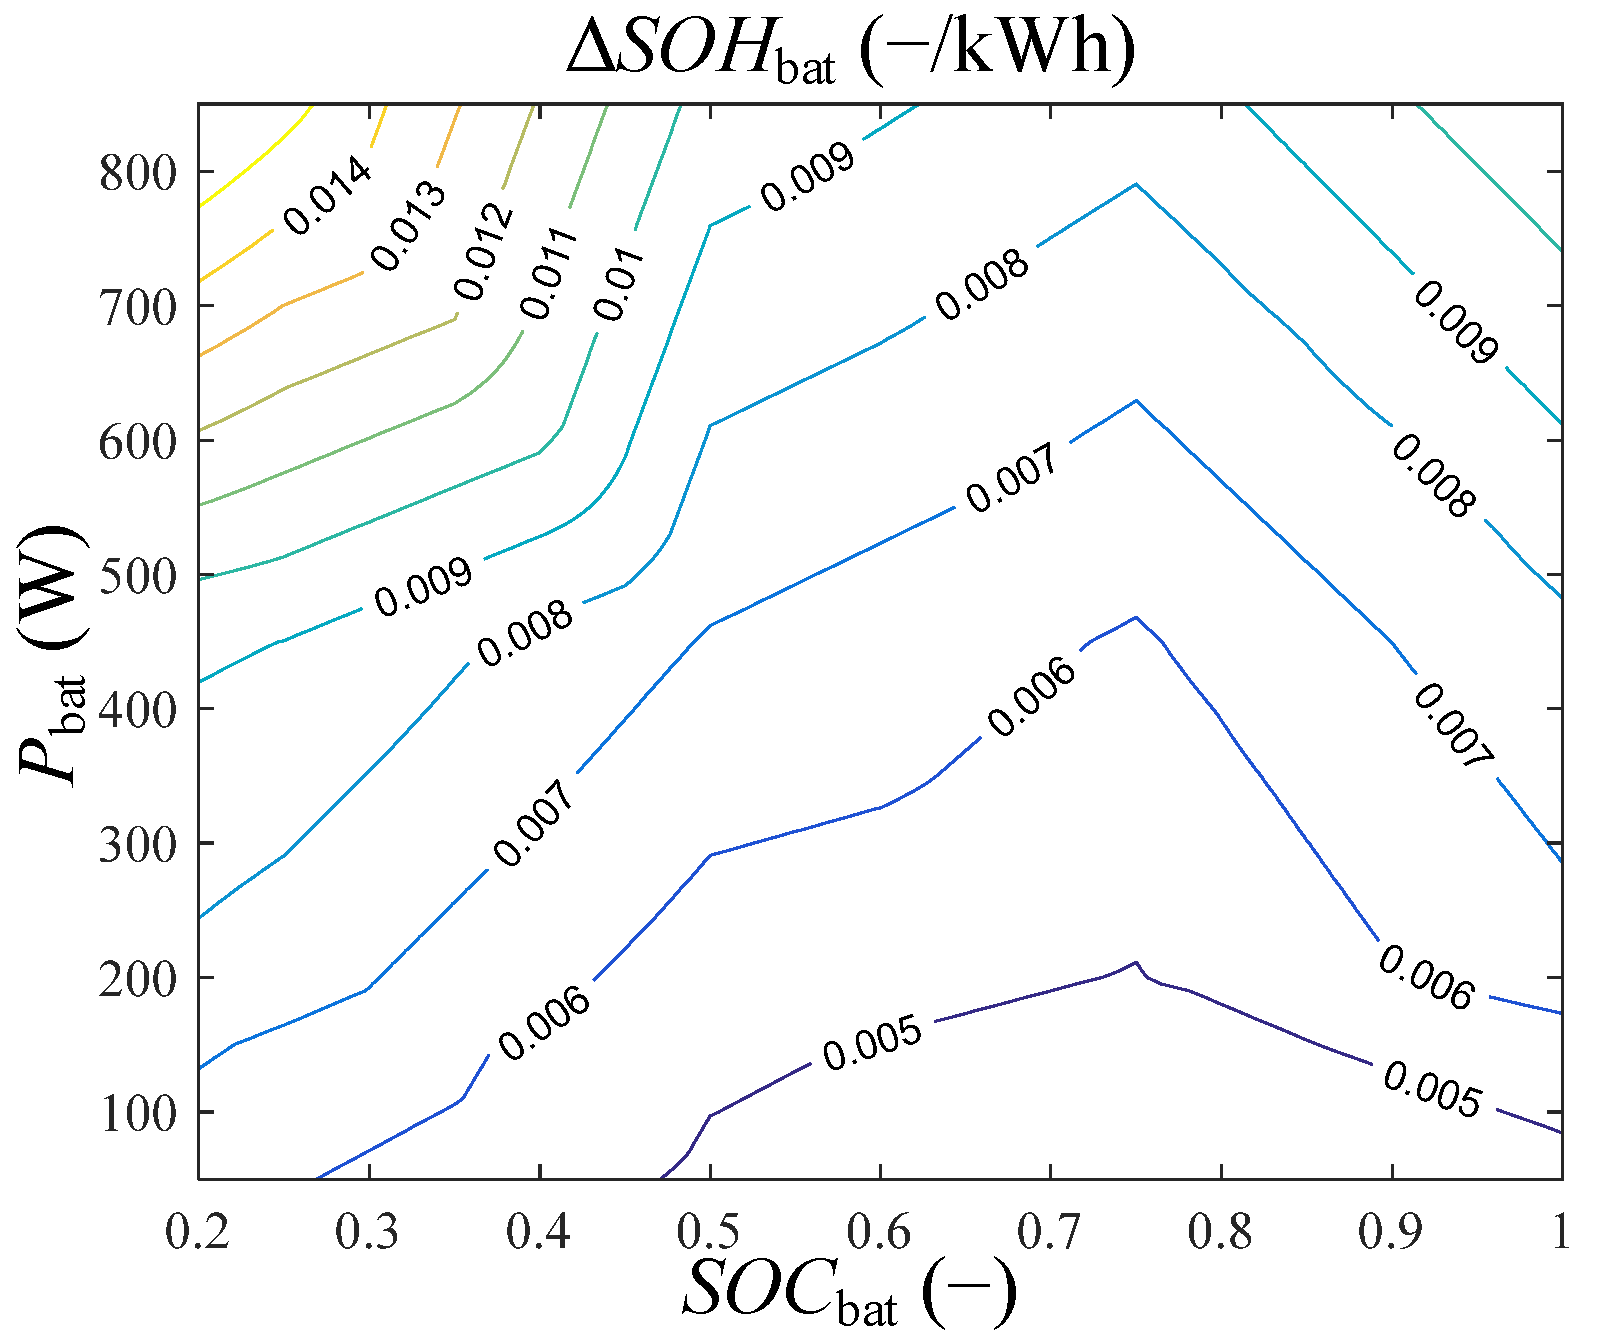
3.5. Battery-in-the-Loop Subsystems (BIL)

The BIL illustrated in Figure 15 has only one battery cell, whose parameters are listed in Table 6. In contrast, the battery pack in the ID-HIL system (Table 1) consists of 42 battery cells. Thus, the paper assumes that the battery cells in a battery pack are equalized in both SOC and SOH. Thus, the BIL’s output power is one-fifty-sixth of the whole pack’s output power [22].
In the ID-HIL system, the Cloud sends the required power (Pbat_req) to the BIL, which executes the command and returns relevant variables to the Cloud, including the available power (Pbat_avl), battery SOC (SOCbat), and SOH (SOHbat). Specifically, Pbat_avl and SOCbat are measured by physical sensors. Like the FIL, ΔSOHbat is too small to be physically detected within a short experiment. The battery’s degradation model should be developed.
According to [23], the decay process of the battery has a linear relation to the variation of the battery’s ohmic resistance. The battery’s end of life (EOL) is defined as occurring when the battery’s capacity decreases to 80% of the beginning-of-life (BOL) level. At the same time, the battery’s ohmic resistance will be doubled. Thus, SOHbat is defined as follows:
S O H bat = R EOL R ohm R BOL × 100 %
where the EOL criteria for the battery are defined as follows:
R EOL = 2 × R BOL C EOL = 0.8 × C BOL
where Rohm is the ohmic resistance of the battery at present, RBOL/REOL is the ohmic resistance at the beginning/end of life (1.21 mΩ/2.42 mΩ), and CBOL/CEOL is the capacity at the beginning/end of life (50 Ah/40 Ah).
The battery’s polarization resistance drops to nearly 0 after the battery is held still for a short period (≥10 min) without any charging or discharging activities, which means that the internal resistance (Rin) equals the ohmic resistance (Rohm) at this time. Since Rin can be directly measured by the battery tester shown in Figure 15, SOHbat in Equation (4) is also obtained.
Because both the output power (Pbat) and SOCbat of the battery can affect its ΔSOHbat [24], the model of battery SOH shown in Figure 16 is a 2-D contour map with Pbat on the y-axis and SOCbat on the x-axis. The repetitive degradation experiments for ΔSOHbat are similar to those for ΔSOHfc, where a series of different working conditions (Pbat and SOCbat) are conducted to obtain the corresponding ΔRin and calculate ΔSOHbat with Equation (4). By repeating the degradation experiment under different working conditions (Pbat and SOCbat), the model of ΔSOHbat is established, as shown in Figure 16. The details of the repeated degradation experiment for ΔSOHbat are presented in Section S2 of the Supplementary Materials.

4. Experiment and Analysis

4.1. Experiment Arrangement

A 21 km on-road driving experiment is set up to evaluate the proposed ID-HIL simulation platform. The test driving route is illustrated in Figure 2, whose parameters are listed in Table 7. Specifically, the experiment takes place in a typical evening rush hour, which includes both congestion and smooth driving conditions. The driving routes are divided into 16 segments, which will be indicated in the experiment result.
The rule-based CDCS energy management strategy [18] is selected to run the PHEV so that the charging activities and power source degradation can be observed. The pseudo-code of the rule-based CDCS strategy is shown in Table 8, where P fc = 20.25 kW is the predefined optimal charging power (the fuel cells’ most efficient working conditions, as shown in Figure 13), and Tmin is the predefined shortest charging duration.
Table 9 lists the on-road driving experiment results’ data sources and meanings, where the in-loop subsystems collect the responses of the corresponding power sources. Specifically, the vehicle speed Spd is collected by the CAN-USB module, as shown in Figure 7. The motor power Pmot, torque Tmot, and speed ωmot are measured by the torque sensor and dynamometer, as shown in Figure 8. The fuel cell and battery parameters are monitored by their electronic loads, as shown in Figure 12 and Figure 15, respectively, except for their SOH indicators. SOHfc and SOHbat are calculated by their degradation models, as shown in Figure 14 and Figure 16, respectively.

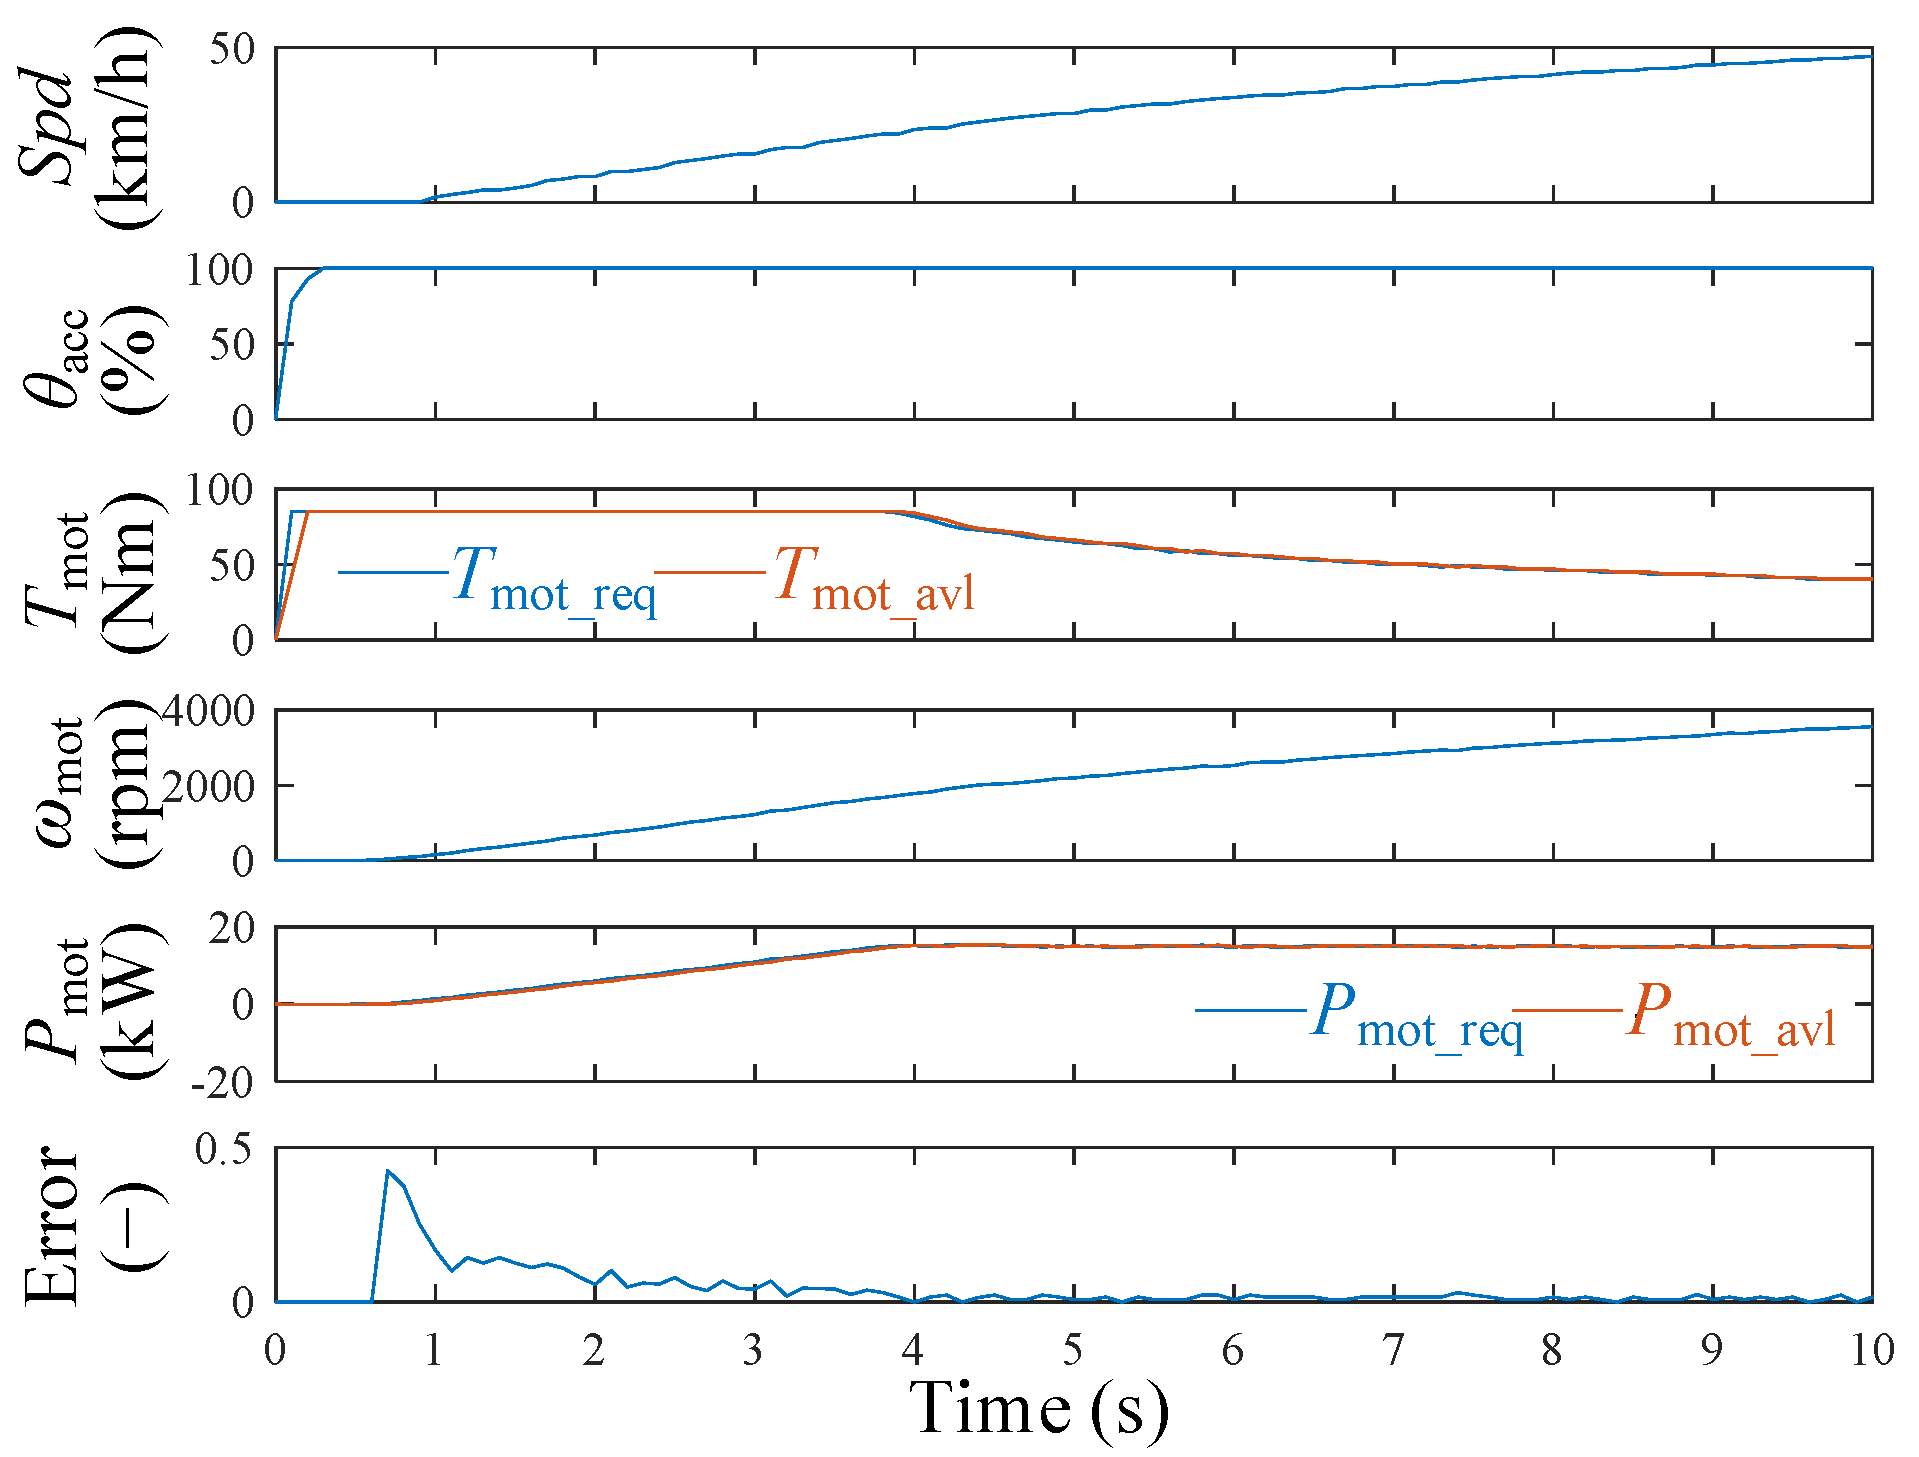
4.2. 10 s Acceleration Experiment

A 10 s acceleration experiment is carried out to demonstrate the accuracy of the ID-HIL’s dynamic simulation performance. Figure 17 shows that when the driver pushes the acceleration pedal to 100% after the beginning point, the available motor torque slightly lags behind the required one by less than 50 ms. This fast response performance of the ID-HIL system should be ascribed to the client-side prediction method in Section 2.2. As a result, the difference between the available motor power and the requirements is tiny. The corresponding error rate is also illustrated in the last line of Figure 17, where the average error rate between Pmot_req and Pmot_avl is 3.94%, which can indicate the ID-HIL simulation’s accuracy.

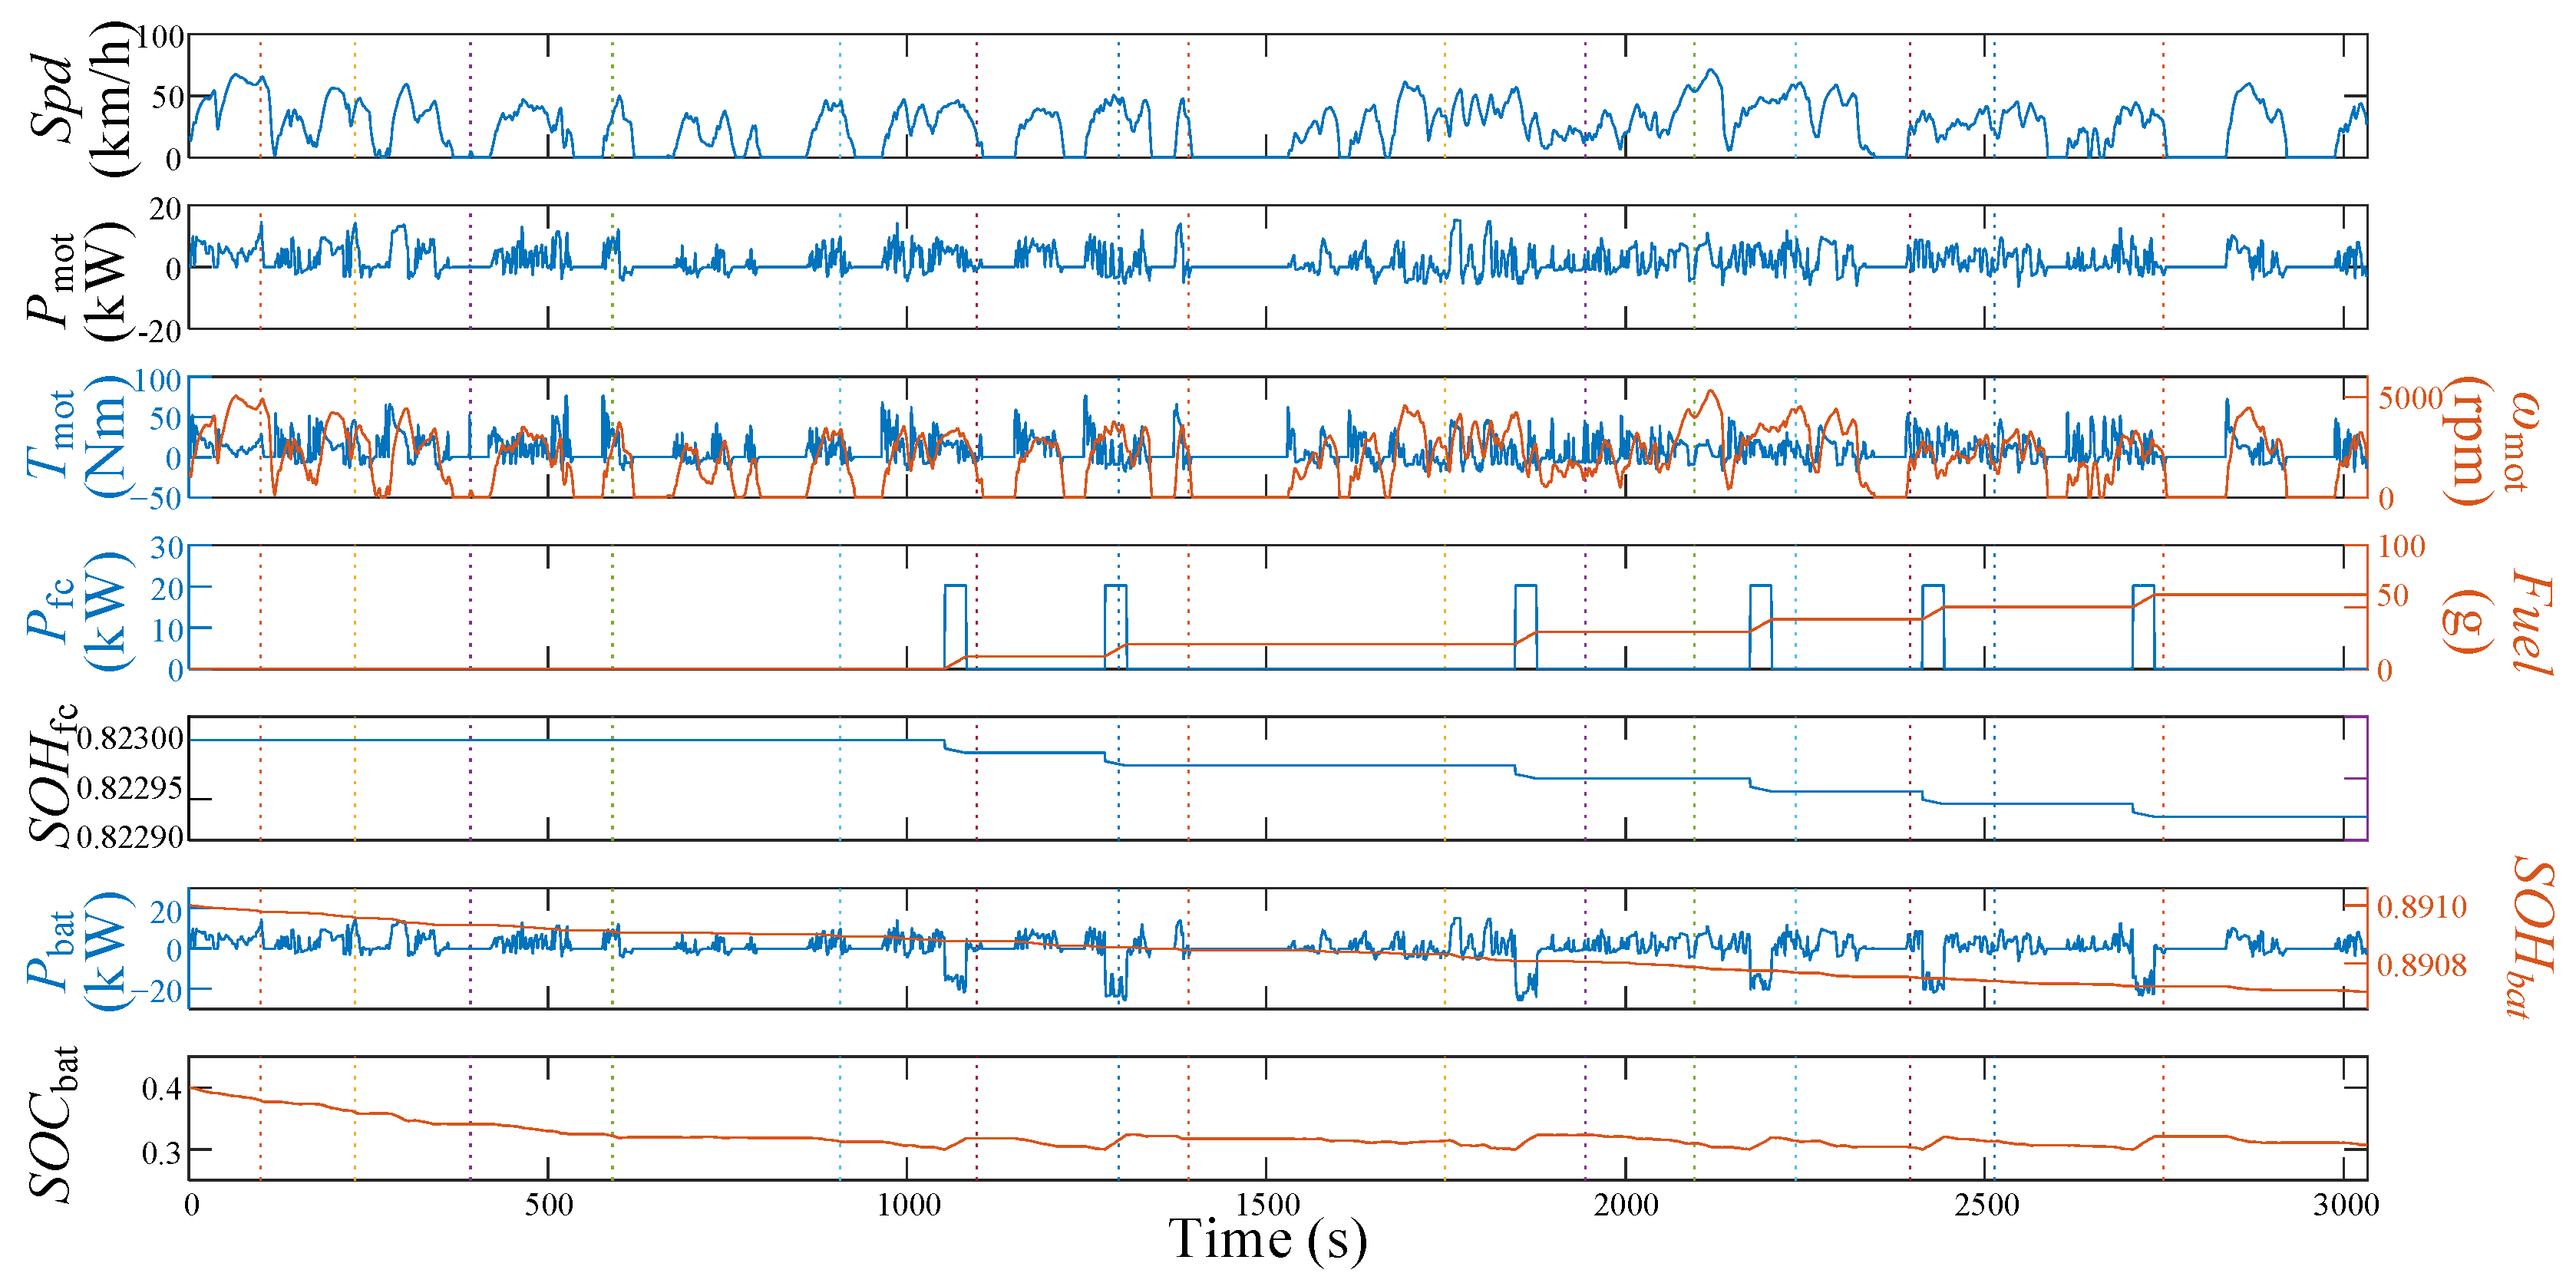
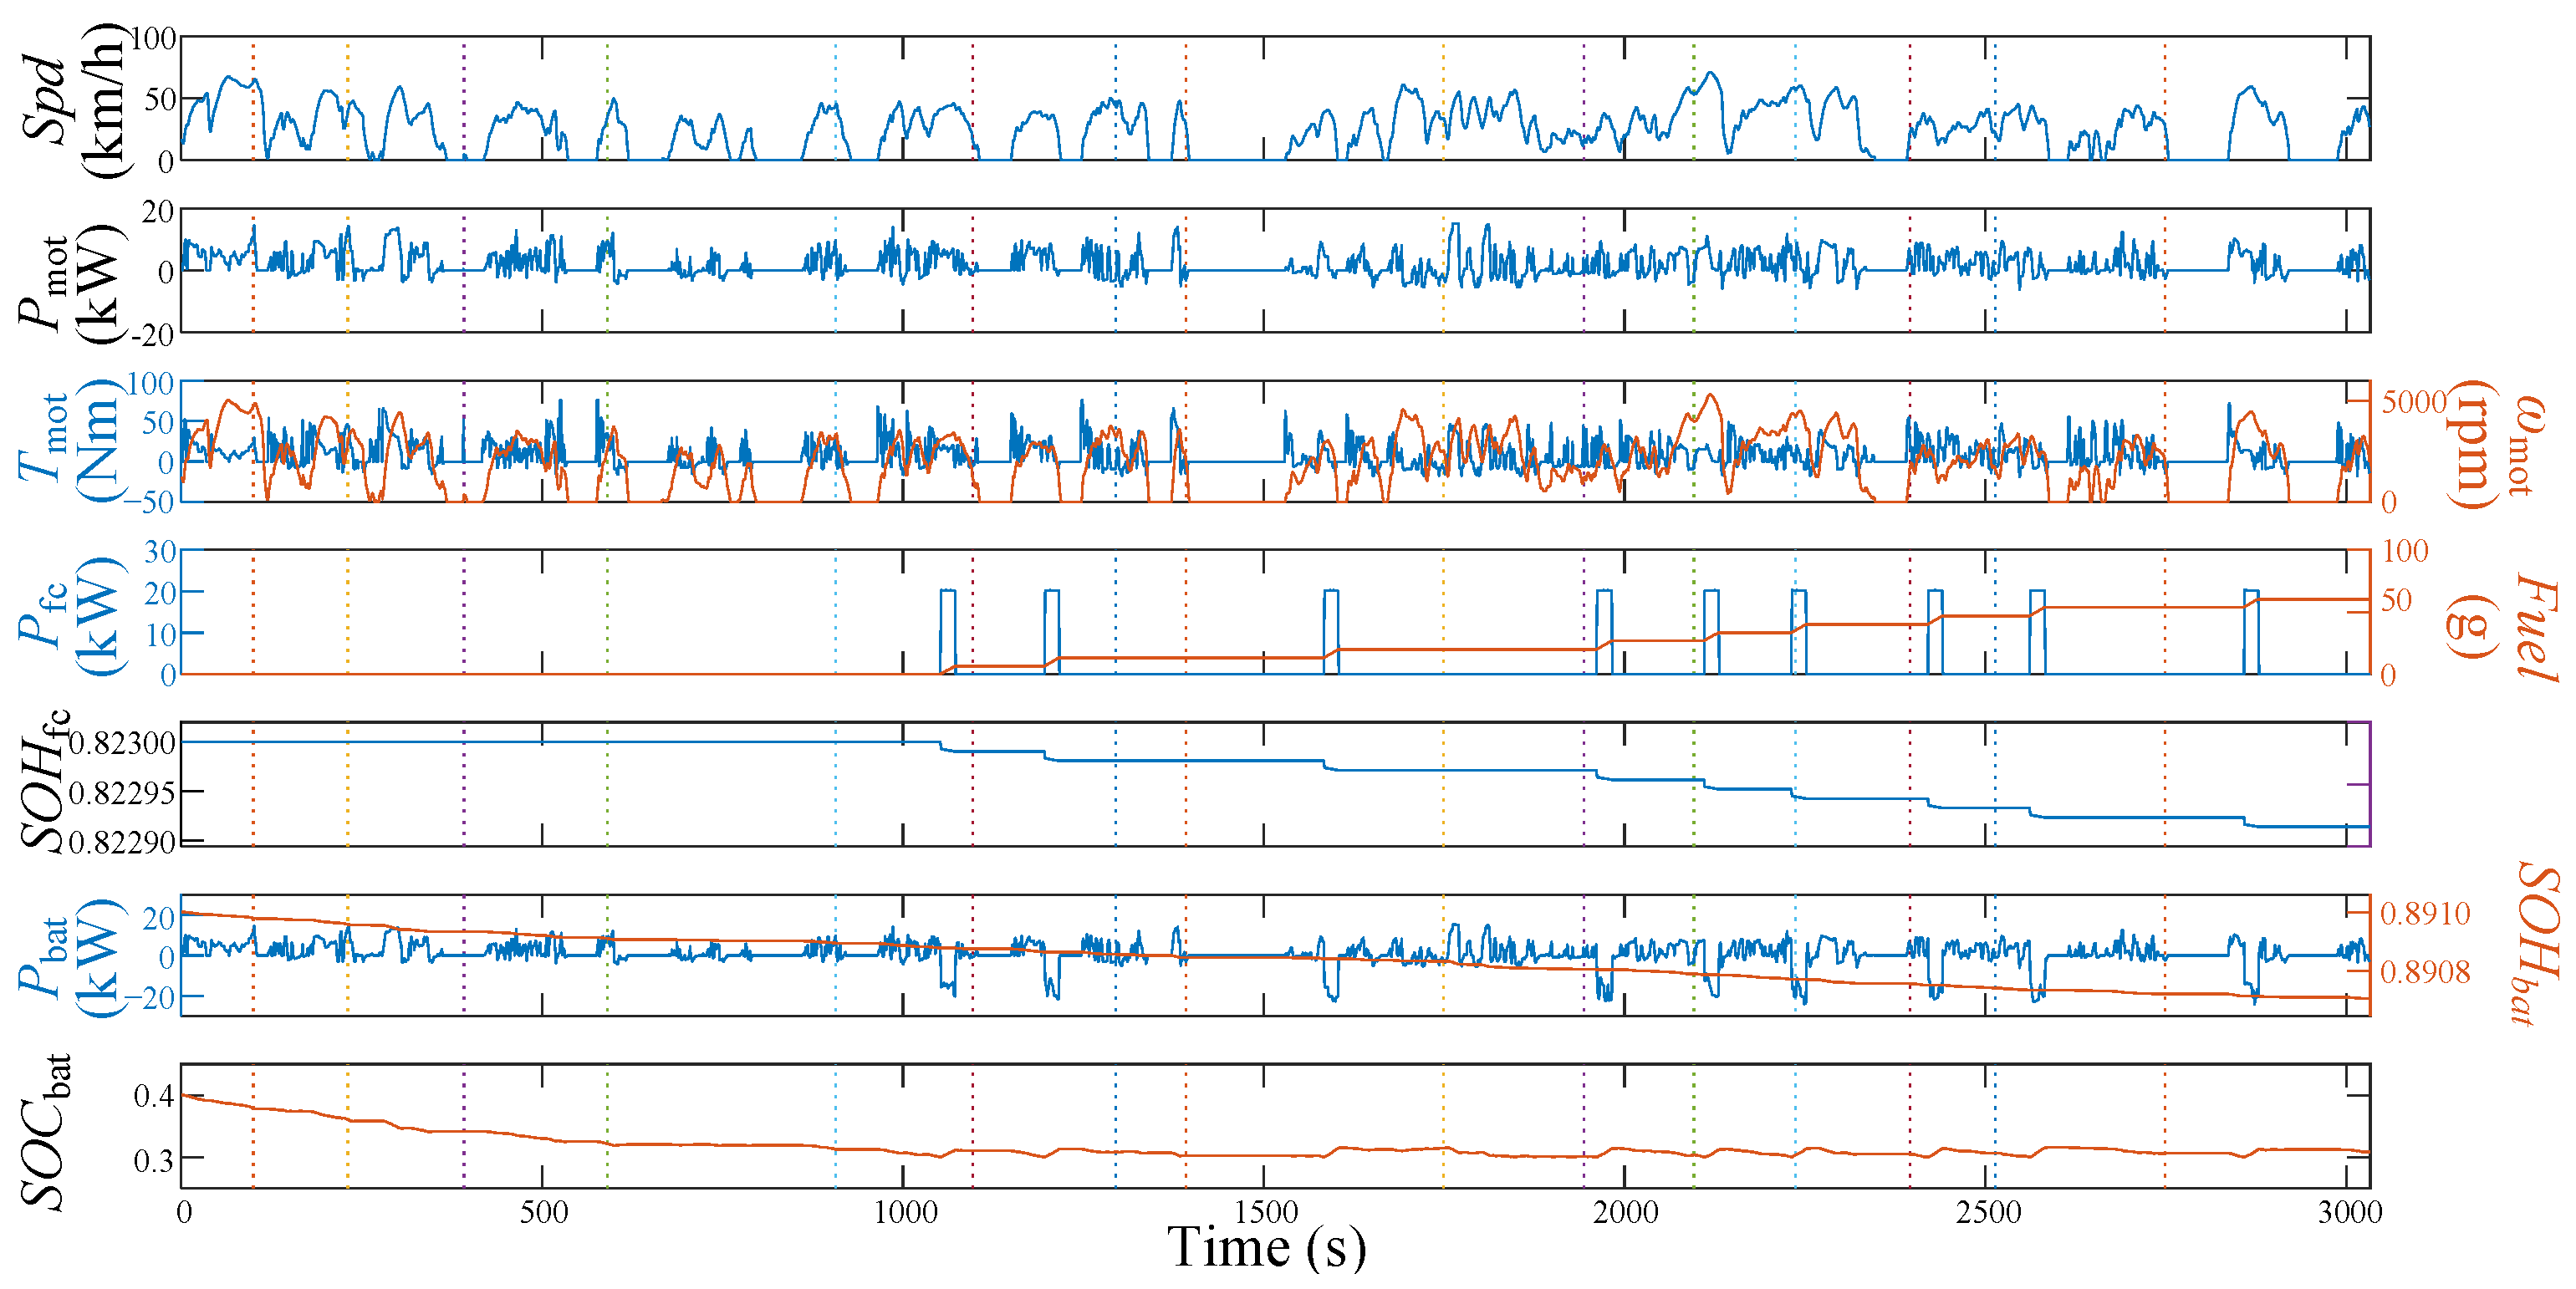
4.3. On-Road Experiment Result and Analysis

The experiment data collected by the in-loop subsystems are illustrated in Figure 18, where the minimal charging time Tmin is set to 20 s. On the one hand, the vehicle (VIL), which does not have a hybrid powertrain, can simulate the dynamic characteristics of a plug-in fuel cell hybrid vehicle. On the other hand, the subsystems, such as MIL, FIL, and BIL, which are not mounted on the vehicle, can operate as if they are on board. Thus, the data in Figure 18 are synchronized in the time domain, facilitating future study of the subsystem dynamic characteristics. For example, the fuel cell startup operation results in a sharp plunge of SOHfc because the fuel cell aging model has considered the startup’s effect on the fuel cell degradation process.
The ID-HIL system enables the researchers to evaluate the power source degradation speed under different arrangements, such as different energy management. A comparative test is set up to demonstrate this capability. Because the driving conditions can influence the result, the driving conditions and related information in Figure 18 are recorded and applied to the following experiments in Figure 19. Apart from this, the other arrangements are the same as in Section 4.1, except that the minimal charging time Tmin is set to 30 s. As shown in Figure 18, the longer charging time reduces the charging frequency, which cuts down the fuel cell degradation caused by the startup operation.
Table 10 shows the statistical results of the on-road driving experiment and comparative experiment. Comparing ΔSOHfc with ΔSOHfc_start, a significant part of the fuel cell degradation is caused by the startup operation. Moreover, because of the limited charging frequency in Figure 19, the corresponding ΔSOHfc_start is reduced, which also optimizes the overall cost of the PHEV. Thus, the future study of energy management can focus on how to limit the start–stop working conditions of the fuel cells. Apart from this point, the traffic flow’s influence on the PHEV’s driving activity can also be studied because the proposed ID-HIL with an in-loop vehicle can be tested on different driving conditions.

5. Conclusions

This paper proposes a novel Internet-distributed hardware-in-the-loop (ID-HIL) simulation platform, which couples different subsystems together to simulate a PHEV powertrain. Thus, the in-loop vehicle without a hybrid powertrain can imitate the PHEV’s dynamic outputs. Meanwhile, the geographically distributed other subsystems can work as if they are on board. Based on the proposed ID-HIL, the power source degradation process could be tested in real-world driving conditions, and the in-loop HIL subsystem could evaluate the energy management’s impact on the power source degradation.
A 21 km on-road driving experiment tested the proposed ID-HIL system, enabling the following conclusions to be drawn:
(1)
The ID-HIL system can simulate the PHEV’s dynamic characteristics with high fidelity;
(2)
The client-side prediction method can effectively reduce the ID-HIL system’s network delay, supporting enough maneuverability for on-road driving;
(3)
The EMS can seriously affect the degradation process of the onboard power sources. For example, the frequent start–stop operation of the fuel cells can essentially decrease their life cycle.
In future studies, the authors will combine the proposed ID-HIL system and the EMS so that the EMS can optimize energy consumption and minimize power source degradation at the same time.

Supplementary Materials

The following supporting information can be downloaded at: https://www.mdpi.com/article/10.3390/en16186755/s1, Figure S1: Load profile of durability experiment; Figure S2. Data sample of durability experiment; Figure S3. Open-circuit voltage and internal resistance.

Author Contributions

Methodology, Y.Z. and J.S.; Software, Y.Z.; Validation, Q.G.; Resources, Q.G. and J.S.; Writing—original draft, Y.Z.; Writing—review & editing, Q.G.; Funding acquisition, J.S. All authors have read and agreed to the published version of the manuscript.

Funding

This work is supported by the youth project of the science and technology research program of Chongqing Education Commission of China (No. KJQN202001105 and KJQN202001141).

Data Availability Statement

The data presented in this study are available on request from the corresponding author. The data are not publicly available due to the funder’s requirement.

Conflicts of Interest

The authors declare no conflict of interest.

Nomenclature

Acronyms
BOL/EOLBeginning/End of life
CDCSCharge-depleting and charge-sustaining
EMSEnergy management strategy
HEVHybrid electrical vehicle
HILHardware-in-the-loop
ID-HILInternet-distributed HIL
IOVInternet of vehicle
NEDCNew European Driving Cycle
PHEVPlug-in HEV
PMSMPermanent Magnet Synchronous Motor
UDDSUrban Dynamometer Driving Schedule
UDPUser Datagram Protocol
VIL/MIL/FIL/BILVehicle/Motor/Fuel cell/Battery-in-the-loop
Symbols
FuelFuel cell’s fuel (H2) consumption (g)
Pbat_req/Pbat_avlRequired/available power for the in-loop battery pack (kW)
Pev_req/Pev_avlRequired/available power for the in-loop vehicle (kW)
Pfc_req/Pfc_avlRequired/available power for the in-loop fuel cell stack (kW)
Pmot_req/Pmot_avlRequired/available power for the in-loop motor (kW)
SOCbatBattery’s state of charge (%)
SOHfc/SOHbatFuel cell/battery’s state of health (%)
SpdVehicle speed (km/h)
Tmot/ωmotMotor’s output torque/speed (Nm/rpm)
ηmotMotor’s energy efficiency (%)
θacc/θbrkPosition of acceleration/brake pedal (%)

References

  1. Tran, D.D.; Vafaeipour, M.; Baghdadi, M.E.; Barrero, R.; Mierlo, J.V.; Hegazy, O. Thorough state-of-the-art analysis of electric and hybrid vehicle powertrains: Topologies and integrated energy management strategies. Renew. Sustain. Energy Rev. 2020, 119, 109596. [Google Scholar] [CrossRef]
  2. Dong, H.; Fu, J.; Zhao, Z.; Liu, Q.; Li, Y.; Liu, J. A comparative study on the energy flow of a conventional gasoline-powered vehicle and a new dual clutch parallel-series plug-in hybrid electric vehicle under NEDC. Energy Convers. Manag. 2020, 218, 113019. [Google Scholar] [CrossRef]
  3. Vichard, L.; Petrone, R.; Harel, F.; Ravey, A.; Venet, P.; Hissel, D. Long term durability test of open-cathode fuel cell system under actual operating conditions. Energy Convers. Manag. 2020, 212, 112813. [Google Scholar] [CrossRef]
  4. Cao, T.F.; Lin, H.; Chen, L.; He, Y.L.; Tao, W.Q. Numerical investigation of the coupled water and thermal management in PEM fuel cell. Appl. Energy 2013, 112, 1115–1125. [Google Scholar] [CrossRef]
  5. Zhao, X.; Ma, X.; Chen, B.; Shang, Y.; Song, M. Challenges toward carbon neutrality in China: Strategies and countermeasures. Resour. Conserv. Recycl. 2022, 176, 105959. [Google Scholar] [CrossRef]
  6. Amir, M.; Deshmukh, R.G.; Khalid, H.M.; Said, Z.; Raza, A.; Muyeen, S.M.; Nizami, A.-S.; Elavarasan, R.M.; Saidur, R.; Sopian, K. Energy storage technologies: An integrated survey of developments, global economical/environmental effects, optimal scheduling model, and sustainable adaption policies. J. Energy Storage 2023, 72, 108694. [Google Scholar] [CrossRef]
  7. Chen, H.; Pei, P.; Song, M. Lifetime prediction and the economic lifetime of Proton Exchange Membrane fuel cells. Appl. Energy 2015, 142, 154–163. [Google Scholar] [CrossRef]
  8. Bellache, K.; Camara, M.B.; Dakyo, B.; Ramasamy, S. Aging characterization of Lithium Iron Phosphate batteries considering temperature and direct current undulations as degrading factors. IEEE Trans. Ind. Electron. 2021, 68, 9696–9706. [Google Scholar] [CrossRef]
  9. Zhang, H.; Zhang, Y.; Yin, C. Hardware-in-the-loop simulation of robust mode transition control for a series-parallel hybrid electric vehicle. IEEE Trans. Veh. Technol. 2016, 65, 1059–1069. [Google Scholar] [CrossRef]
  10. Tara, E.; Filizadeh, S.; Dirks, E. Battery-in-the-loop simulation of a planetary-gear-based hybrid electric vehicle. IEEE Trans. Veh. Technol. 2013, 62, 573–581. [Google Scholar] [CrossRef]
  11. Lee, H.; Sul, S. Fuzzy-logic-based torque control strategy for parallel-type hybrid electric vehicle. IEEE Trans. Ind. Electron. 1998, 45, 625–631. [Google Scholar]
  12. He, H.; Xiong, R.; Zhao, K.; Liu, Z. Energy management strategy research on a hybrid power system by hardware-in-loop experiments. Appl. Energy 2013, 112, 1311–1317. [Google Scholar] [CrossRef]
  13. Kermani, S.; Trigui, R.; Delprat, S.; Jeanneret, B.; Guerra, T.M. PHIL implementation of energy management optimization for a parallel HEV on a predefined route. IEEE Trans. Veh. Technol. 2011, 60, 782–792. [Google Scholar] [CrossRef]
  14. Zhang, Y.; Liu, H.; Guo, Q. Varying-domain optimal management strategy for parallel hybrid electric vehicles. IEEE Trans. Veh. Technol. 2014, 63, 603–616. [Google Scholar] [CrossRef]
  15. Kim, Y.; Salvi, A.; Siegel, J.B.; Filipi, Z.S.; Stefanopoulou, A.G.; Ersal, T. Hardware-in-the-loop validation of a power management strategy for hybrid powertrains. Control Eng. Pract. 2014, 29, 277–286. [Google Scholar] [CrossRef]
  16. Zimran, R.; Khalid, H.M.; Muyeen, S.M. Communication systems in distributed generation: A bibliographical review and frameworks. IEEE Access 2020, 8, 207226–207239. [Google Scholar]
  17. Bernier, Y. Latency Compensating Methods in Client/Server In-Game Protocol Design and Optimization. 2001. Available online: http://web.cs.wpi.edu/~claypool/courses/4513-B03/papers/games/bernier.pdf (accessed on 21 May 2023).
  18. Zhang, Y.; Liu, H. Fuzzy multi-objective control strategy for parallel HEV. IET Electr. Syst. Transp. 2012, 2, 39–50. [Google Scholar] [CrossRef]
  19. GB/T 38914-2020; Evaluation Method for Lifetime of Proton Exchange Membrane Fuel Cell Stack in Vehicle Application. State Administration for Market Regulation: Beijing, China. National Standardization Administration: Beijing, China, 2020.
  20. Pei, P.; Chang, Q.; Tang, T. A quick evaluating method for automotive fuel cell lifetime. Int. J. Hydrog. Energy 2008, 33, 3829–3836. [Google Scholar] [CrossRef]
  21. Qi, W.; Zhang, X.; Niu, J.; Zhang, Z.; Huang, J.; Ge, S.; Zhang, Y. Mechanism insight into the oxygen reduction reaction on dual FeN2 embedded graphene for proton exchange membrane fuel cells. Sustain. Energy Fuels 2022, 6, 4024–4033. [Google Scholar] [CrossRef]
  22. Khalid, H.M.; Flitti, F.; Muyeen, S.M.; Elmoursi, M.S.; Tha’er, O.S.; Yu, X. Parameter estimation of vehicle batteries in V2G systems: An exogenous function-based approach. IEEE Trans. Ind. Electron. 2021, 69, 9535–9546. [Google Scholar] [CrossRef]
  23. Andre, D.; Appel, C.; Guth, T.; Sauer, D. Advanced mathematical methods of SOC and SOH estimation for lithium-ion batteries. J. Power Sources 2013, 224, 20–27. [Google Scholar] [CrossRef]
  24. Zhang, S.; Hu, X.; Xie, S.; Song, Z.; Hu, L.; Hou, C. Adaptively coordinated optimization of battery aging and energy management in plug-in hybrid electric buses. Appl. Energy 2019, 256, 113891. [Google Scholar] [CrossRef]
Figure 1. Schematic diagram of ID-HIL simulation.
Energies 16 06755 g001
Figure 2. Geographical distribution of ID-HIL simulation and driving route.
Energies 16 06755 g002
Figure 3. Network configuration of ID-HIL system.
Energies 16 06755 g003
Figure 4. Data flow of ID-HIL simulation.
Energies 16 06755 g004
Figure 5. Example of the client-side prediction.
Energies 16 06755 g005
Figure 6. Driving test result of the client-side prediction.
Energies 16 06755 g006
Figure 7. Configuration of VIL (EV).
Energies 16 06755 g007
Figure 8. Configuration of MIL.
Energies 16 06755 g008
Figure 9. MIL’s control logic.
Energies 16 06755 g009
Figure 10. Driving motors in ID-HIL. (a) Driving motor on MIL; (b) Driving motor on VIL.
Energies 16 06755 g010
Figure 11. Relation between the motors on MIL and VIL.
Energies 16 06755 g011
Figure 12. 30 kW PEM fuel cell test bench for FIL.
Energies 16 06755 g012
Figure 13. Fuel consumption of fuel cells.
Energies 16 06755 g013
Figure 14. ΔSOHfc under different working conditions.
Energies 16 06755 g014
Figure 15. Battery test bench for BIL.
Energies 16 06755 g015
Figure 16. ΔSOHbat under different working conditions.
Energies 16 06755 g016
Figure 17. Result of 10 s acceleration experiment.
Energies 16 06755 g017
Figure 18. Experiment result of the on-road driving test for ID-HIL (Tmin = 20 s).
Energies 16 06755 g018
Figure 19. Experiment result of the comparative test for ID-HIL (Tmin = 30 sec).
Energies 16 06755 g019
Table 1. Configuration of subsystems in ID-HIL.
SubsystemConfigurationParametersLocation
VehicleVehicle-in-the-loop simulation (VIL)Hongguang MiniEV,
Vehicle mass: 0.7 t,
Frontal area: 2 m2
Hongguang Road around CQUT Huaxi Campus
EMSSoft simulation (Cloud)Internet-distributed EMSIDC room of China Telecom
MotorMotor-in-the-loop simulation (MIL)Asynchronous motor,
Rated power: 14 kW
Chongqing Baizhuan Technology Co., Ltd.
Fuel CellFuel cell-in-the-loop simulation (FIL)PEM, Rated power: 30 kW, Rated voltage: 168 VChongqing Changan Automobile Company
BatteryBattery-in-the-loop simulation (BIL)Rated voltage: 3.2 V × 42, Rated capacities: 50 AhCQUT Huaxi Campus
Table 2. Parameters of ID-HIL network.
Transmission protocolUDP
Packet size1024 Bytes
Wireless connection (5G)VIL
Wired connectionMIL, FIL, BIL
Network delay (Wireless)~12 ms (including processing delay)
Network delay (Wired)~10 ms (including processing delay)
Loss rate (Wireless)0%
Loss rate (Wired)0%
Table 3. Parameters of VIL (EV).
SubsystemParameter
Vehicle modelHongguang MiniEV
Frontal area2 m2
Vehicle mass700 kg
Cargo mass150 kg
Driving motorPMSM
Rated power15 kW
Peak power30 kW
Motor–wheel gear ratioFixed, 14.4
Wheel diameter0.508 m
Table 4. Parameters of driving motors in ID-HIL.
Parameter NameMotor on MILMotor on VIL
Motor typeInductionPermanent magnet synchronous
Phase Number33
Pole pairs24
Cooling methodAir coolingAir cooling
Rated power14 kW15 kW
Peak power28 kW30 kW
Rated torque25 Nm25 Nm
Peak torque85 Nm90 Nm
Table 5. Parameters of the PEM fuel cell stack.
NameParameter
Type of fuel cellProton exchange membrane
Number of fuel cells240
Reference current107 A
Reference voltage (BOL)168 V (0.7 × 240 V)
Open-circuit voltage295.2 V
Idle current10.2 A
Rated power30 kW
Table 6. Parameters of the battery cell.
NameParameter
Battery typeLiFePO4
Max discharge rate10 C
Number of battery cells42
Rated voltage3.2 V
Rated capacity50 Ah
Ohmic resistance (BOL)1.21 mΩ
Table 7. Parameters of experiment arrangement.
ParameterUnitValue
Departure time-17:30
Driving distancekm21
Predefined SOCinit-0.4
Route segment num-16
EMS mode-Rule-based CDCS
Fuel (H2) costRMB/kg40
Fuel cell stack costRMB/kW2000
Battery costRMB/kWh1000
Table 8. Pseudo-code of the rule-based CDCS energy management strategy.
(1)Repeat until VIL reaches the destination
(2)     If SOC ≤ 0.305 And Not in charging Then
(3)       Charging with P fc = 20.25 kW
(4)     End If
(5)     If in charging And current charging time > Tmin Then
(6)       If SOC > 0.31 Then
(7)          Stop charging
(8)       Else
(9)          Keep charging
(10)       End If
(11)     End If
(12)End Repeat
Table 9. Parameters of experiment result.
ParameterUnitMeaningData Source
Spdkm/hVehicle speedVIL
PmotkWMotor powerMIL
TmotNmMotor torqueMIL
ωmotrpmMotor speedMIL
PfckWFuel cell powerFIL
FuelgH2 consumptionFIL
SOHfc-Fuel cell SOHFIL
PbatkWBattery powerBIL
SOHbat-Battery SOHBIL
SOCbat-Battery SOCBIL
Table 10. Statistical results of the on-road driving experiment and comparative experiment.
Parameter NameResults for Figure 18Results for Figure 19
Min charging time Tmin (s)2030
Actual SOCinit0.40.4
Actual SOCend0.30840.3076
Fuel H2 (g)60.559.9
Fuel H2 cost (RMB)2.422.39
ΔSOHfc8.593 × 10−56.488 × 10⁻⁵
ΔSOHfc_start6.237 × 10−54.158 × 10⁻⁵
ΔSOHfc cost (RMB)2.581.95
ΔSOHbat2.950 × 10−42.978 × 10⁻⁴
ΔSOHbat cost (RMB)1.982.00
Overall cost (RMB)6.986.34
Disclaimer/Publisher’s Note: The statements, opinions and data contained in all publications are solely those of the individual author(s) and contributor(s) and not of MDPI and/or the editor(s). MDPI and/or the editor(s) disclaim responsibility for any injury to people or property resulting from any ideas, methods, instructions or products referred to in the content.

