Abstract
Ensuring the safety of nuclear energy necessitates proactive measures to prevent the escalation of severe operational conditions. This article presents an efficient and interpretable framework for the swift identification of abnormal events in nuclear power plants (NPPs), equipping operators with timely insights for effective decision-making. A novel neural network architecture, combining Long Short-Term Memory (LSTM) and attention mechanisms, is proposed to address the challenge of signal coupling. The derivative dynamic time warping (DDTW) method enhances interpretability by comparing time series operating parameters during abnormal and normal states. Experimental validation demonstrates high real-time accuracy, underscoring the broader applicability of the approach across NPPs.
1. Introduction
With the ongoing depletion of fossil energy reserves and the escalating severity of environmental issues, nuclear energy has emerged as a promising, clean, and economically beneficial alternative, attracting increasing global attention. To bolster the safety and reliability of nuclear energy, it becomes imperative to proactively prevent the escalation of operating conditions within nuclear power plants (NPPs) into severe accidents. Consequently, operators diligently assess the operational status of NPPs by analyzing data collected from field instruments, enabling the timely identification and response to any abnormal events in NPPs. However, the intricate nature of nuclear power plants poses a challenge for operators in promptly identifying events at an early stage. Therefore, it is essential to develop advanced abnormal event detection technologies to assist operators in identifying the transient as a plant transitions from a normal state to an abnormal state.
Transient identification approaches can be categorized into two main types: model-based and model-free methods [1,2]. Model-based methods utilize a mathematical model to represent the normal behavior of a nuclear power system [3]. However, due to discrepancies between theoretical models and real-world conditions, deviations may arise between analytically calculated values and actual measurements. These deviations are the basis for detecting transients in NPPs, as they manifest as statistically abnormal changes when abnormal events occur [4]. Some common model-based methods include parity equations [5], diagnostic observers [6], Kalman filters [7], parameter estimation [8], and subspace system identification [9]. While model-based methods can identify transients promptly, their practical applications are still limited by the challenge of obtaining an exact system model.
Model-free methods are gaining increasing popularity for transient identification in NPPs, as they operate without relying on explicit mathematical models. Some of these methods employ biologically inspired techniques, such as genetic algorithms (GA) [10], particle swarm optimization (PSO) [11], and quantum evolutionary algorithms (QEA) [12], to search for the optimal transient classification solution in the global space. Additionally, stochastic process-based methods are also employed for transient identification. One notable method is hidden Markov models (HMM), which utilize the maximum likelihood estimation (MLE) method for classification [13]. Additionally, support vector machines (SVM) find the optimal hyperplane that best separates data points belonging to different classes by maximizing the margin between the classes [14]. Although these methods have demonstrated good performance, they face challenges when dealing with large amounts of data.
Fortunately, significant advancements in deep learning (DL) technology [15] have propelled artificial neural networks (ANNs) to make remarkable strides in various big data applications, including abnormal detection in NPPs [16]. For instance, competitive neural networks, such as Self-Organizing Maps (SOMs), are employed for unsupervised learning to identify unlabeled transients [17]. Additionally, recurrent neural networks (RNNs), such as Long Short-Term Memory (LSTM), are utilized to handle time-dependent data [18,19]. Although ANNs are considered suitable for transient identification in NPPs due to their robust ability to map inputs and outputs in nonlinear systems, the challenge lies in designing network structures that effectively consider the coupling between nuclear power system signals. Moreover, as neural networks often operate as black boxes, providing explanations for the identification results of abnormal events to operators becomes crucial for ensuring the safe operation of nuclear power plants.
In this article, we aim to develop an efficient, accurate, and interpretable approach for rapidly identifying transients in nuclear power plants for anomaly detection. To this end, we propose a general learning framework and select a small nuclear reactor (SMRs), specifically the modular high-temperature gas-cooled reactor (MHTGR) [20], as the testbed for our approach. Specifically, we propose a novel neural network structure for transient identification, comprising the LSTM unit and attention mechanism. The LSTM unit is employed to extract time-dependent features, while the attention mechanism considers the coupling between different operating parameters. Furthermore, to ensure the recognition results possess a certain degree of interpretability, we employ the derivative dynamic time warping (DDTW) method. This involves comparing the shape difference of the time series operating parameters in the transient state of abnormal events and the normal state. That is, our proposed framework sequentially connects a neural network-based recognition module and a machine learning-based interpretation module to assist operators in abnormal event detection. Experimental results utilizing data from seven event classes generated by an MHTGR-based NPP simulator demonstrate the efficacy of the proposed approach.
Our main contributions are summarized as follows.
- (1)
- We propose a novel neural network-based approach that utilizes the attention technique for NPPs abnormal event detection. To the best of our knowledge, this is the first work to address the transient identification task in NPPs by designing a neural network that takes into account the coupling between different operating parameters.
- (2)
- We introduce a machine learning-based method to interpret the recognition results from the proposed neural network. This allows us to obtain and present abnormal parameters during transients by comparing them with those under normal conditions, providing valuable information to operators.
- (3)
- We propose a top-down structure that sequentially connects a recognition module and an interpretation module. By combining efficient identification with interpretable reasoning, our framework empowers operators to take appropriate actions promptly, ensuring the safe and reliable operation of nuclear power plants.
- (4)
- Experiments under an MHTGR-based NPP simulator show that our proposed method achieves high accuracy on the premise of satisfying real-time. We believe such a general learning-based approach can be applied to other NPPs.
The remainder of this article is outlined as follows. In Section 2, we present the basic information about the MHTGR and describe the problem formulation of the abnormal event detection. Section 3 introduces our proposed transient identification and interpretation method. In Section 4, we elaborate on the dataset collection and pre-processing, followed by the experimental results to evaluate our proposed method. Finally, Section 5 concludes the article and indicates future work.
2. Preliminaries
In this section, we first provide an overview of the MHTGR that serves as the testbed for this work. Following that, we formulate the abnormal event detection in NPPs as a problem of pattern recognition in a supervised learning manner.
2.1. Modular High Temperature Gas-Cooled Reactor
The modular high-temperature gas-cooled reactor (MHTGR), as a category of Small Modular Reactors (SMRs), has garnered widespread recognition for its inherent safety and highly efficient energy generation [21,22]. Figure 1 shows a MHTGR module, developed by the Institute of Nuclear and New Energy Technology at Tsinghua University [23,24,25], featuring a helical-coil once-through steam generator (OTSG) and a one-zone pebble-bed MHTGR arranged side by side with the OTSG. It utilizes helium as the primary coolant and graphite as both moderator and structural material.
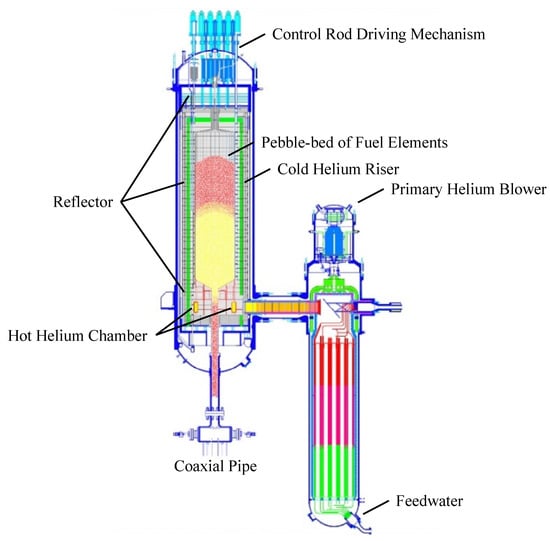
Figure 1.
Schematic diagram of a MHTGR module.
The cooling process involves pressurized cold helium passing through the blower located atop the OTSG. The helium then ascends through the channel inside the reflector, cooling it down as it moves from bottom to top. Subsequently, the helium falls vertically through the pebble bed, where fission releases substantial thermal energy, causing the helium to absorb the heat and raise its temperature to high levels. The hot helium then flows into the chamber at the bottom of the reflector and enters the primary side of the OTSG. Here, it transfers heat to the secondary steam stream, cools down in the process, and eventually returns as cold helium to the blower, completing the cycle.
2.2. Problem Formulation
Ensuring the efficient and safe operation of nuclear power plants (NPPs) requires the early detection of abnormal events, enabling prompt mitigation actions in accordance with emergency operating procedures. Unfortunately, the operation of NPPs is highly complex, as described above, with the OTSG and MHTGR being tightly coupled. Consequently, deviations from normal conditions can result in multiple operating parameters exhibiting outliers related to the abnormal event. This complexity necessitates the monitoring of several signals to evaluate the operating status of NPPs, posing a significant challenge for operators, who often have limited time for such assessments. Hence, the design of a system that automatically extracts key information from signals to promptly identify abnormal events becomes crucial in assisting operators in addressing them.
Emphasizing the enhancement of abnormal event detection accuracy while providing interpretable reasons for the identification assumes utmost importance. To this end, we propose a framework with a top-down structure that sequentially connects recognition and modules. As depicted in Figure 2, real-time signals are selected and fed to the recognition module, which evaluates whether the operating statute is normal or not. If the evaluation confirms normal operation, the operator is informed the nuclear power plant is running smoothly. However, if the evaluation indicates abnormal conditions, the interpretation module is triggered to provide further insights and explanations to the operator. This approach allows us to not only swiftly assess the operating status of nuclear power plants but also provide operators with valuable information on abnormal operating signals.
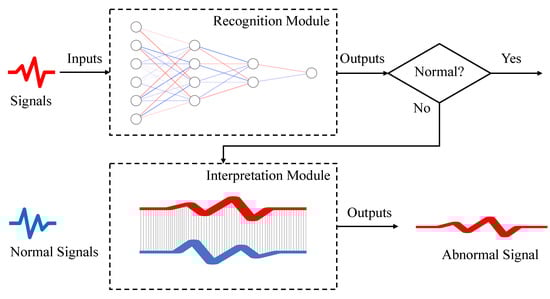
Figure 2.
Top-down structure of abnormal detection for NPPs.
Building upon this, we mathematically formulate the abnormal detection in NPPs as a problem of pattern recognition in a supervised learning manner. Specifically, we build the recognition module as a mapping
where represents the signals with m features, and denotes the evaluated solution according to . When approaches 1, it indicates that signals belong to the normal operational state, and conversely, when it approaches 0, it indicates abnormality. Therefore, the primary objective of recognition is to minimize the discrepancy between the evaluated value and the actual value by optimizing the parameters of the function. When the mapping is accurate enough, it can be used to evaluate the operating status of the real-time signals. Moreover, we build the interpretation module as
where the similarity between signal features is measured. That is, by comparing the similarity between the real-time signals and the normal signals , the index of the abnormal feature with low similarity is obtained.
3. Method
In this section, we introduce a novel approach aimed at assisting operators in swiftly identifying and addressing abnormal events in NPPs. Our approach combines a neural network-based recognition module, which evaluates the normality of the operating status, with a machine learning-based interpretation module that measures the similarity between normal and abnormal signals.
3.1. Recognition Module
To address the aforementioned pattern recognition problem using a supervised learning approach, deep learning through artificial neural networks emerges as a dependable solution [26]. As depicted in Figure 3A, the Fully Connected Neural Network (FCN), also known as Multi-Layer Perceptrons (MLPs), is a typical type of artificial neural network. In an FCN, each neuron is connected to every neuron in the adjacent layers, making it a suitable choice for processing 1-dimensional data. The Convolutional Neural Network (CNN), illustrated in Figure 3B, is specifically designed to handle grid-like data. By employing convolutional layers, CNNs can detect patterns and features hierarchically, proving highly effective in image recognition and computer vision tasks. Additionally, Figure 3C showcases the Recurrent Neural Network (RNN), which is specialized for sequential data, such as time series or natural language sequences. RNNs utilize recurrent connections, enabling the retention and transfer of information across different time steps, making them ideal for tasks involving temporal dependencies. These three architectures represent the most common and widely used types of neural networks, each optimized for specific types of data and tasks. By employing the backpropagation algorithm, these networks effectively update their parameters, minimizing the disparity between predicted and actual outputs during the training process.
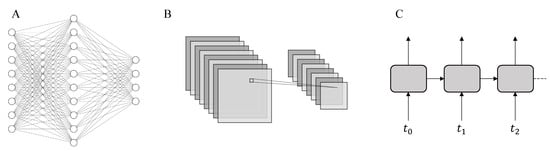
Figure 3.
The typical artificial neural networks: (A) Fully Connected Neural Network; (B) Convolutional Neural Network; (C) Recurrent Neural Network.
Given that the signals in NPPs are time series data, we employ RNNs to extract meaningful features. In particular, we make use of the Long Short-Term Memory architecture [27], which is designed with two gates to effectively control the content of the unit state. As the basic unit of LSTM depicted in Figure 4A, the first gate, known as the forget gate, determines the extent to which the unit state from the previous time step is retained and passed on to the current time step , i.e.,
this gate helps the LSTM decide what information to forget and what to preserve. The second gate, called the input gate, regulates how much of the current input is integrated into the unit state at the current time, i.e.,
it enables the LSTM to selectively update the unit state with new information. Based on the forget gate and the input gate, the cell state is updated, determining what information to forget and what new information to store in the cell state, i.e.,
additionally, the LSTM employs an output gate to control the amount of information from the unit state ,
which contributes to the current output value of the LSTM, i.e.,
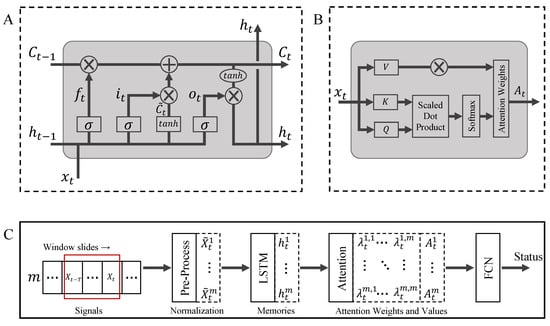
Figure 4.
The neural network-based approach to recognizing transients for abnormal event detection in NPPs. (A) The basic unit of LSTM; (B) The structure of the query-key attention mechanism; (C) The architecture of our proposed recognition module.
In the above equations, and denote the sigmoid and hyperbolic tangent activation functions that ensure the computed values fall within and , respectively. The parameters W and b denote weight matrices and bias vectors, respectively. The subscripts x, h, i, f, c, and o denote the corresponding weight and bias parameters for input, hidden state, input state, forget gate, cell state, and output gate, respectively. These parameters collectively define the behavior and connections of the Long Short-Term Memory (LSTM) unit in processing sequential data. By utilizing these gating mechanisms, the LSTM can effectively handle long-range dependencies and retain relevant information over extended sequences, making it well-suited for capturing temporal patterns in time series data such as those found in nuclear power plants.
Furthermore, to account for the coupling between different operating parameters, we employ an attention mechanism [28] to analyze the correlations between signals. Specifically, we employ the query-key attention mechanism, depicted in Figure 4B. This mechanism allows the model to dynamically focus on the most relevant elements in the input sequence, enabling it to extract essential information for the task at hand. Mathematically, consider an input sequence of length N with , where represents the i-th element of the input sequence. The coefficient matrix reflecting the importance between elements can be calculated as follows. First, we obtain the query Q, key K, and value V of the X sequence through the weight matrices , , and , respectively. Next, we compute the dot product between the query Q and the transpose of the key K to obtain the raw attention scores,
where is the scaling factor to prevent the dot product from becoming too large as the dimension of the key vector increases. Then, we apply the softmax function to the attention scores to obtain the attention weights ,
where denotes the importance weight for the i-th element in the input sequence. Finally, we compute the attention value vector A by taking the weighted sum of the value V using the attention ,
which contains the combined information from the input sequence X based on their attention weights, enhancing the capability of the neural network to capture important relationships among the various parameters in the nuclear power plant data.
By synergistically leveraging the capabilities of LSTM and attention technologies, we introduce a novel neural network-based recognition module meticulously crafted to identify transients in NPPs for abnormal event detection. The entirety of our innovative recognition module is thoughtfully depicted in Figure 4C, which seamlessly integrates an LSTM block, an attention block, and an FCN block. The key objective of our recognition module is to predict the operating status by taking into account the m signals at time t from the previous T-time instants, i.e., .
Before these signals enter the network, they undergo a normalization process facilitated by the pre-processing block. The details of this vital step will be elaborated upon in the subsequent Section 4.2. After normalization, the data for each signal i during time , denoted as , is meticulously fed into the LSTM block to extract the essential features present in the time dimension, denoted as . Then, the extracted features of different signals are fed into the attention block, which helps to identify the significant relationships and correlations among the various operating parameters, thus taking into account the coupling between the signals. This step provides a more comprehensive understanding of the data, which is essential for making accurate predictions and improving the overall performance of the recognition module in identifying transients for abnormal event detection in NPPs. Finally, the FCN block is employed to output the prediction of operating status by using the attention value of each signal.
In a word, the integration of LSTM enables us to effectively extract relevant time-dependent features from the input signals, capturing temporal dependencies in the data. On the other hand, the attention mechanism empowers the model to dynamically focus on the most critical elements and correlations among different operating parameters, enhancing its ability to highlight important information. The combination of LSTM and attention results in a powerful recognition module well-suited for accurately detecting abnormal events in NPPs. This advancement contributes significantly to enhancing the safety and reliable operation of nuclear power plants, ultimately ensuring the well-being of both the plants and the surrounding environment.
3.2. Interpretation Module
Once the recognition module evaluates the operating status as abnormal based on multiple signals, providing the abnormal signal to the operator becomes crucial. This information helps the operator not only confirm the abnormal status but also gain a deeper understanding of the nature and extent of the abnormality. Similarity analysis provides a solution to facilitate this process, which plays a key role in extracting specific signals that exhibit significant deviations from normal signals.
There are several methods to measure the similarity of time series data, often formulated as calculating the distance between the time series. The greater the distance, the smaller the similarity, and vice versa. Two commonly used techniques for measuring the distance between two-time series of equal length are Euclidean Distance and Manhattan Distance [29]. While these methods are relatively simple and easy to understand, they are sensitive to the alignment or translation of time series data along the time axis. That is, in scenarios where two time series exhibit similar overall trends but are slightly shifted in time, the calculated distance can be relatively large due to misalignment. This sensitivity to alignment can lead to inaccurate similarity measurements, especially when dealing with time series data featuring slight temporal shifts or phase differences, thereby impacting the effectiveness of these distance metrics.
The derivative dynamic time warping (DDTW) method [30] addresses the alignment issue by incorporating the first-order derivative information of the time series. Mathematically, consider two time series B and D of lengths M and N, respectively, denoted as and . To compute the DDTW distance , the first-order derivative of each time series is first calculated by:
where the value of the first and last data points is replaced by the value of the second and penultimate data points, respectively. Then, a cumulative distance matrix P of size is created, where represents the cumulative distance between and . The first row and first column of the matrix P are initialized to positive infinity, and is set to 0. Then, the matrix P is updated using the following recurrence relation,
where is the distance between and . Once the matrix P is filled, the DDTW distance between B and D is given by , which represents the optimal alignment distance between the two time series, considering not only their original time series data but also their first-order derivatives.
Given that the NPP signals are sampled using a sliding window approach in the recognition module, an alignment problem may arise when performing similarity analysis. To overcome this challenge, we propose an interpretation module that leverages the DDTW method. When the recognition module identifies the current operating status as abnormal, the interpretation module is activated to calculate the distance between the current signals and the normal signals in the database. This calculation helps to extract the component with low similarity, indicating the presence of abnormality. By employing the DDTW method, we can accurately identify and isolate the abnormal components from the time series data, enabling prompt detection and appropriate response to abnormal events in NPPs.
4. Experimental Results
In this section, we present a comprehensive overview of our approach, starting with the dataset collection. Next, we describe the data pre-processing method we employed. Finally, we present the experimental results to demonstrate the effectiveness and performance of our proposed method.
4.1. Dataset Collection
At present, there is no publicly available dataset specifically designed for abnormal event detection in NPPs. Thus, we developed a dataset using an HTR–PM simulator of the Shidao Bay Nuclear Power Station. This engineering simulator, developed by Tsinghua University, encompasses a comprehensive dynamic model capable of accurately simulating various scenarios, including startup, shutdown, normal operations, and even accident conditions of the HTR–PM. More details of this simulator can refer to [31,32].
The operational scenarios considered in this article include one normal condition and seven event classes as listed in Table 1. To ensure the reliability and robustness of the results, we conducted 30 experiments for each abnormal event, covering power levels from 50 to . Each experiment involved collecting 60 s of data, capturing the transitional process of the NPP’s operating state from normal to abnormal. This data, comprised of 20 specific readings and states (as detailed in Table 2), were sampled at a rate of 1 Hz. Additionally, we conducted 50 experiments under normal operational conditions at varying power levels, employing the same data collection methods as used for the abnormal events. Consequently, the dataset consists of a total of 260 segments, each containing 60 s of time-series data. This dataset was then randomly partitioned into three subsets—training, validation, and testing—with a distribution ratio of 3:1:1. Specifically, the training set includes 156 segments, while the validation and test sets each contain 52 segments of 60 s time-series data.

Table 1.
Operational scenarios for abnormal event detection in NPPs.
Table 2.
List of signals used in this article.
Drawing inspiration from the work of Wang et al. [19], we integrated a mechanism to improve the realism of the event data by introducing white noise. The magnitude of the noise in the signal is ascertained using a crucial parameter known as the signal-to-noise ratio (SNR), a fundamental concept in signal processing and communication engineering. The SNR quantifies the signal’s strength relative to the amount of noise present in the signal and can be defined as:
where Ps is the power of the signal and Pn is the power of the noise. The was set to 40 dB in this article.
4.2. Data Pre-Processing
As depicted in Table 2, the selected signals encompass a range of seven distinct types, each characterized by different units and ranges, encompassing power, pressure, temperature, flow rate, humidity, rate of change, and ratio. Considering that neural networks are sensitive to the scale of input features, as described in Section 3.1, it is essential that these signals undergo a normalization process before being fed into the recognition module of the network. Thus, we build a pre-processing block, which addresses the issue of inconsistent signal scales.
More precisely, the Z-score normalization method, commonly referred to as standardization, is utilized to reveal the inherent shape within time series data. This technique reorients the data by centering it around its mean and scaling it by its standard deviation. Mathematically, for a time series , the Z-score normalized time series is calculated as:
where is the mean of the time series, is the standard deviation of the time series. Evidently, Z-score normalization centers the data around zero by subtracting the mean and scales it according to the data’s dispersion achieved through division by the standard deviation. This approach notably streamlines the comparison and analysis of diverse time series shapes, effectively mitigating the impact of scale and starting point variations.
4.3. Experimental Results
In this article, our proposed recognition module is built on a cascading architecture that integrates LSTM, attention, and FCN blocks. In the LSTM block, we include two LSTM units, configuring the first with an input dimension of 20 and an output dimension of 128. The second LSTM unit receives an input dimension of 128 and delivers an output dimension of 20. Note that the time-step of two LSTM units is set to 10, corresponding to a time-shift window size of 10 s. The attention block employs weight matrices , , and , each with dimensions of . Lastly, the FCN block incorporates a single hidden layer of 40 neurons with an input dimension of 20.
The assessment of operational status, based on the FCN block’s output, employs the cross-entropy loss function. Denote the true status of an instance as normal, i.e., , and let represent the predicted probability that the instance belongs to normal. Therefore, the predicted probability for abnormal is . The entropy loss H for binary classification can be defined as:
at its minimum 0, the entropy loss H reflects alignment between the predicted probability and the true operating status y. As this alignment deviates, H increases, indicating a growing discrepancy. Therefore, the objective lies in minimizing the entropy loss throughout our training and validation dataset. The network models were trained using PyTorch 2.0.0 and the CUDA 11.8 Toolkit, conducted on a computational platform equipped with two Intel Xeon CPUs, two RTX 4090 GPUs, and 512 GB of RAM. A batch size of 64 was employed, while the optimization process utilized the Adam optimizer with a learning rate of 0.0001. To mitigate overfitting, early stopping was implemented to cease training as needed [33]. The training process was configured to run for a total of 1000 epochs, completing in approximately 30 min.
In our statistical process, an assigned threshold is employed to ascertain the operational status based on the predicted value . Specifically, if , the status is designated as normal. Conversely, if , the status is identified as abnormal. Otherwise, the status is categorized as uncertain. We deem the recognition accurate when the assessment outcome aligns with the actual operational status. The experimental results are shown in Table 3. It is evident that when is established at , the recognition accuracy achieves across the training, validation, and test datasets.
Table 3.
Recognition accuracy on training, validation, and test datasets with different evaluation threshold .
Furthermore, to showcase the efficacy of both the LSTM unit and the attention mechanism, we conduct ablation studies. The alternative network architectures are illustrated in Figure 5. Specifically, the feature extraction modules in Figure 5A,B omit the use of LSTM and instead employ FCN and CNN, respectively. Meanwhile, the network configurations in Figure 5C,D exclude the attention mechanism, employing CNN and FCN in their place. The training settings of these variant network models are the same as those of the original. The outcomes of these ablation experiments are presented in Table 4. The results manifest a notable decrease in recognition accuracy across all three datasets, particularly in the case of the untrained test dataset.
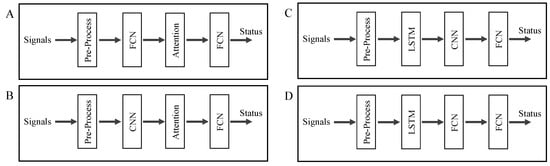
Figure 5.
The neural network structures of recognition ablation studies, including (A) FCN-Attention structure without LSTM unit, (B) CNN-Attention structure without LSTM unit, (C) LSTM-CNN structure without Attention Mechanism, and (D) LSTM-FCN structure without Attention Mechanism.
Table 4.
Recognition accuracy of ablation studies on training, validation, and test datasets with evaluation threshold .
Moreover, we conduct a thorough evaluation of our proposed interpretation module’s efficacy in precisely quantifying the similarity between normal and abnormal signals. The results are vividly depicted in Figure 6, with the abnormal component visually represented by the red line, aligning with the blue line denoting the normal state. Importantly, even when a signal’s trend exhibits a slight deviation from the normal signal’s pattern, the DDTW value shifts away from zero, effectively identifying the signal as an abnormal component. This unequivocally underscores the remarkable capability of our proposed interpretation module to expertly detect anomalous components, even in the presence of subtle deviations in the signals.
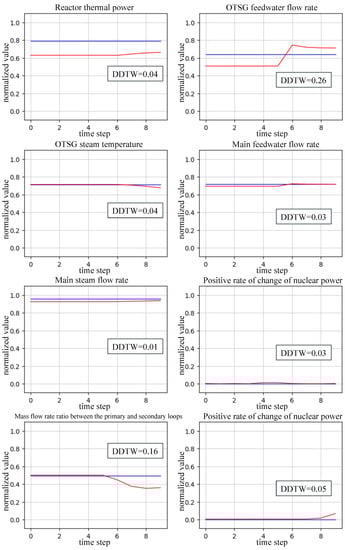
Figure 6.
Some abnormal signals analyzed by the interpretation module in an operational scenario where the feedwater control valve is stuck. The abnormal component is represented by the red line, corresponding to the blue line denoting the normal state.
In reality, when implementing artificial intelligence (AI) techniques in NPPs, the emphasis extends beyond merely achieving high prediction accuracy to also ensuring overarching safety and reliability. This is also our motivation for designing the interpretation module. By visually presenting these abnormal components to operators, our approach empowers them to precisely determine and comprehend the outcomes of abnormal event identification. Additionally, we can adjust the recognition module’s evaluation threshold , serving as the lower bound of the confidence interval, according to the similarity value between abnormal and normal signals as analyzed by the DDTW method within the interpretation module. Specifically, we will design a small value at the beginning so as not to miss abnormal signals. If under this threshold, the interpretation module does not detect abnormal signals; it represents that the recognition module is too “nervous”; thus, can be increased a little. On the contrary, if the interpretation module detects abnormal signals, the threshold should be lowered. In summary, by synergistically integrating the recognition and interpretation modules, our approach accomplishes high predictive accuracy and elevates overarching safety and reliability standards.
5. Conclusions
In this article, we have studied the abnormal event detection of the NPPs to improve operating safety. To realize this challenging pattern recognition problem, we formulate the task in a supervised learning manner and propose a novel framework, seamlessly integrating a neural network-based recognition module and a machine learning-based interpretation module. Critically, both modules are fine-tuned by a dynamically adjustable evaluation threshold, allowing for real-time adaptability in the sensitivity of abnormal event detection. This unique combination not only ensures efficient identification of abnormal events but also offers insightful explanations to operators, enabling them to make informed decisions swiftly. By conducting meticulous experiments on a modular high-temperature gas-cooled reactor (MHTGR) simulator, we have showcased the exceptional prowess of our methodology in accurately detecting anomalous components within real-time scenarios. The insights provided by our framework empower operators with a comprehensive understanding, engendering a secure and dependable operational environment for nuclear power plants. With nuclear energy maintaining its pivotal role on the global energy stage, our approach emerges as a potent tool in augmenting NPP safety and performance, thus contributing tangibly to a sustainable and resilient energy future.
Author Contributions
Conceptualization, X.H.; methodology, T.Z. and X.H.; software, Q.J. and C.G.; validation, T.Z., Q.J., C.G. and X.H.; formal analysis, X.H.; investigation, T.Z. and Q.J.; resources, X.H.; data curation, T.Z. and Q.J.; writing—original draft preparation, T.Z.; writing—review and editing, X.H.; visualization, T.Z.; supervision, C.G.; project administration, X.H.; funding acquisition, X.H. All authors have read and agreed to the published version of the manuscript.
Funding
This research was funded by China Postdoctoral Science Foundation (Grant No. 043241001) and China National Nuclear Corporation (Grant No. ZHJTJZYFGWD2020).
Data Availability Statement
The data presented in this study are available on request from the corresponding author. The data are not publicly available due to patent protection.
Acknowledgments
This work was additionally supported by Natural Science Foundation of China (NSFC) (Grants No. 62120106003, 71801141), and Nuclear Energy Development Research Project (Grant No. 20204601007).
Conflicts of Interest
The authors declare no conflict of interest.
Abbreviations
The following abbreviations are used in this manuscript:
| ANNs | Artificial neural networks |
| CNN | Convolutional Neural Network |
| DDTW | Derivative dynamic time warping |
| DL | Deep learning |
| FCN | Fully Connected Neural Network |
| GA | Genetic algorithms |
| HMM | Hidden Markov model |
| LSTM | Long Short-Term Memory |
| MHTGR | Modular high temperature gas-cooled reactor |
| MLE | Maximum likelihood estimation |
| MLPs | Multi-Layer Perceptrons |
| NPPs | Nuclear power plants |
| OTSG | Once-through steam generator |
| PSO | Particle swarm optimization |
| QEA | Quantum evolutionary algorithms |
| RNN | Recurrent Neural Network |
| SMRs | Small nuclear reactor |
| SOMs | Self-Organizing Maps |
| SVM | Support vector machines |
References
- Moshkbar-Bakhshayesh, K.; Ghofrani, M.B. Transient identification in nuclear power plants: A review. Prog. Nucl. Energy 2013, 67, 23–32. [Google Scholar] [CrossRef]
- Mendoza, M.; Tsvetkov, P.V. An intelligent fault detection and diagnosis monitoring system for reactor operational resilience: Power transient identification. Prog. Nucl. Energy 2023, 156, 104529. [Google Scholar] [CrossRef]
- Nguyen, T.N.; Ponciroli, R.; Bruck, P.; Esselman, T.C.; Rigatti, J.A.; Vilim, R.B. A digital twin approach to system-level fault detection and diagnosis for improved equipment health monitoring. Ann. Nucl. Energy 2022, 170, 109002. [Google Scholar] [CrossRef]
- Li, Y.; Sundaram, A.; Abdel-Khalik, H.S.; Talbot, P.W. Real-time monitoring for detection of adversarial subtle process variations. Nucl. Sci. Eng. 2022, 196, 544–567. [Google Scholar] [CrossRef]
- Sharifi, R.; Langari, R. Sensor fault diagnosis with a probabilistic decision process. Mech. Syst. Signal Process. 2013, 34, 146–155. [Google Scholar] [CrossRef]
- Zhang, K.; Jiang, B.; Cocquempot, V. Adaptive observer-based fast fault estimation. Int. J. Control. Autom. Syst. 2008, 6, 320–326. [Google Scholar]
- Gautam, S.; Tamboli, P.K.; Roy, K.; Patankar, V.H.; Duttagupta, S.P. Sensors incipient fault detection and isolation of nuclear power plant using extended Kalman filter and Kullback–Leibler divergence. ISA Trans. 2019, 92, 180–190. [Google Scholar] [CrossRef]
- Isermann, R. Process fault detection based on modeling and estimation methods—A survey. Automatica 1984, 20, 387–404. [Google Scholar] [CrossRef]
- Zhao, K.; Upadhyaya, B.R. Model based approach for fault detection and isolation of helical coil steam generator systems using principal component analysis. IEEE Trans. Nucl. Sci. 2006, 53, 2343–2352. [Google Scholar] [CrossRef]
- Tian, D.; Deng, J.; Vinod, G.; Santhosh, T.; Tawfik, H. A constraint-based genetic algorithm for optimizing neural network architectures for detection of loss of coolant accidents of nuclear power plants. Neurocomputing 2018, 322, 102–119. [Google Scholar] [CrossRef]
- Wang, H.; Peng, M.J.; Ayodeji, A.; Xia, H.; Wang, X.K.; Li, Z.K. Advanced fault diagnosis method for nuclear power plant based on convolutional gated recurrent network and enhanced particle swarm optimization. Ann. Nucl. Energy 2021, 151, 107934. [Google Scholar] [CrossRef]
- dos Santos Nicolau, A.; Schirru, R.; de Moura Meneses, A.A. Quantum evolutionary algorithm applied to transient identification of a nuclear power plant. Prog. Nucl. Energy 2011, 53, 86–91. [Google Scholar] [CrossRef]
- Kwon, K.C.; Kim, J.H. Accident identification in nuclear power plants using hidden Markov models. Eng. Appl. Artif. Intell. 1999, 12, 491–501. [Google Scholar] [CrossRef]
- Gottlieb, C.; Arzhanov, V.; Gudowski, W.; Garis, N. Feasibility study on transient identification in nuclear power plants using support vector machines. Nucl. Technol. 2006, 155, 67–77. [Google Scholar] [CrossRef]
- LeCun, Y.; Bengio, Y.; Hinton, G. Deep learning. Nature 2015, 521, 436–444. [Google Scholar] [CrossRef] [PubMed]
- Santosh, T.; Vinod, G.; Saraf, R.; Ghosh, A.; Kushwaha, H. Application of artificial neural networks to nuclear power plant transient diagnosis. Reliab. Eng. Syst. Saf. 2007, 92, 1468–1472. [Google Scholar] [CrossRef]
- Li, X.; Fu, X.M.; Xiong, F.R.; Bai, X.M. Deep learning-based unsupervised representation clustering methodology for automatic nuclear reactor operating transient identification. Knowl.-Based Syst. 2020, 204, 106178. [Google Scholar] [CrossRef]
- Kim, M.; Ou, E.; Loh, P.L.; Allen, T.; Agasie, R.; Liu, K. RNN-Based online anomaly detection in nuclear reactors for highly imbalanced datasets with uncertainty. Nucl. Eng. Des. 2020, 364, 110699. [Google Scholar] [CrossRef]
- Wang, M.D.; Lin, T.H.; Jhan, K.C.; Wu, S.C. Abnormal event detection, identification and isolation in nuclear power plants using LSTM networks. Prog. Nucl. Energy 2021, 140, 103928. [Google Scholar] [CrossRef]
- Zhang, Z.; Wu, Z.; Sun, Y.; Li, F. Design aspects of the Chinese modular high-temperature gas-cooled reactor HTR-PM. Nucl. Eng. Des. 2006, 236, 485–490. [Google Scholar] [CrossRef]
- Kępisty, G.; Oettingen, M.; Stanisz, P.; Cetnar, J. Statistical error propagation in HTR burnup model. Ann. Nucl. Energy 2017, 105, 355–360. [Google Scholar] [CrossRef]
- Oettingen, M.; Cetnar, J. Numerical modelling of modular high-temperature gas-cooled reactors with thorium fuel. Nukleonika 2021, 66, 133–138. [Google Scholar] [CrossRef]
- Wu, Z.; Lin, D.; Zhong, D. The design features of the HTR-10. Nucl. Eng. Des. 2002, 218, 25–32. [Google Scholar] [CrossRef]
- Dong, Z.; Zhang, Z.; Dong, Y.; Huang, X. Multi-layer perception based model predictive control for the thermal power of nuclear superheated-steam supply systems. Energy 2018, 151, 116–125. [Google Scholar] [CrossRef]
- Dong, Z. Physically-based power-level control for modular high temperature gas-cooled reactors. IEEE Trans. Nucl. Sci. 2012, 59, 2531–2549. [Google Scholar] [CrossRef]
- Schmidhuber, J. Deep learning in neural networks: An overview. Neural Netw. 2015, 61, 85–117. [Google Scholar] [CrossRef]
- Hochreiter, S.; Schmidhuber, J. Long short-term memory. Neural Comput. 1997, 9, 1735–1780. [Google Scholar] [CrossRef] [PubMed]
- Vaswani, A.; Shazeer, N.; Parmar, N.; Uszkoreit, J.; Jones, L.; Gomez, A.N.; Kaiser, Ł.; Polosukhin, I. Attention is all you need. In Proceedings of the 31st International Conference on Neural Information Processing Systems, Long Beach, CA, USA, 4–9 December 2017; pp. 6000–6010. [Google Scholar]
- Wang, X.; Mueen, A.; Ding, H.; Trajcevski, G.; Scheuermann, P.; Keogh, E. Experimental comparison of representation methods and distance measures for time series data. Data Min. Knowl. Discov. 2013, 26, 275–309. [Google Scholar] [CrossRef]
- Keogh, E.J.; Pazzani, M.J. Derivative Dynamic Time Warping. In Proceedings of the 2001 SIAM International Conference on Data Mining (SDM), Chicago, IL, USA, 5–7 April 2001; pp. 1–11. [Google Scholar]
- Dong, Z.; Huang, X. Real-time simulation platform for the design and verification of the operation strategy of the HTR-PM. In Proceedings of the International Conference on Nuclear Engineering. American Society of Mechanical Engineers, Chengdu, China, 29 July–2 August 2013; Volume 55829, p. V005T13A017. [Google Scholar]
- Sui, Z.; Sun, J.; Wei, C.; Ma, Y. The engineering simulation system for HTR-PM. Nucl. Eng. Des. 2014, 271, 479–486. [Google Scholar] [CrossRef]
- Shi, H.; Xu, M.; Li, R. Deep learning for household load forecasting—A novel pooling deep RNN. IEEE Trans. Smart Grid 2017, 9, 5271–5280. [Google Scholar] [CrossRef]
Disclaimer/Publisher’s Note: The statements, opinions and data contained in all publications are solely those of the individual author(s) and contributor(s) and not of MDPI and/or the editor(s). MDPI and/or the editor(s) disclaim responsibility for any injury to people or property resulting from any ideas, methods, instructions or products referred to in the content. |
© 2023 by the authors. Licensee MDPI, Basel, Switzerland. This article is an open access article distributed under the terms and conditions of the Creative Commons Attribution (CC BY) license (https://creativecommons.org/licenses/by/4.0/).