Article

Cooking Fuel Choice and Wellbeing: A Global Perspective

1
Gamos, Reading RG1 4LS, UK
2
School of Social Sciences, Loughborough University, Loughborough LE11 3TU, UK
*
Author to whom correspondence should be addressed.
Energies 2023, 16(18), 6739; https://doi.org/10.3390/en16186739
Submission received: 17 July 2023 / Revised: 15 September 2023 / Accepted: 18 September 2023 / Published: 21 September 2023

Abstract

:
This paper assesses the relationship between the proportion of the population with primary reliance on different types of fuels for cooking (national averages) and a number of key wellbeing indices. The study uses a data set created from a combination of the Gallup World Poll database and the World Health Organisation (WHO) Household Energy Database. The Gallup database comprises multinational survey data and contains wellbeing indices (Personal Health, Social Life, Civic Engagement, Life Evaluation, Negative Experience, etc.). The WHO database gives the proportion of a population with primary reliance on different types of cooking fuels. In order to understand the relative importance of the choice of cooking fuels in terms of wellbeing, regression modelling is used to control for the effects of demographic variables (income per capita, age, education level, employment, etc.), available in the Gallup database, on the wellbeing indices. The regression analysis results show that clean cooking fuels are strongly influential in health-related indices. By adding access to electricity as an additional predictor variable, the analysis highlights the potential for integrating eCooking into national electrification plans as part of sustainable energy transitions, given that health outcomes appear to be as closely linked to the choice of cooking fuels as to access to electricity.

1. Introduction

Clean cooking is associated with multiple benefits, most notably health benefits, convenience of cooking, liberated time for cooks, reduced expenditure, and reduced carbon emissions. A recognition of the importance of clean cooking fuels is evident in the adoption of clean cooking as a key metric within SDG7 (Indicator 7.1.2) along with other poverty metrics; the Multidimensional Poverty Index, for example, scores households according to their choice of cooking fuel [1]. Concepts of quality of life have been integrated into wellbeing methodologies. Two approaches dominate wellbeing research: objective measures of dimensions of life, and subjective self-assessment of wellbeing. The metrics mentioned above are examples of objective measures, derived from econometric modelling. Subjective approaches are less well developed, especially as applied to clean cooking; this paper explores links between clean cooking and self-assessment measures of wellbeing.
The paper presents a modelling approach integrating subjective measures of wellbeing with objective measures of cooking fuel choices. The Gallup World Poll database was made available through a Cookpad competition to study the role of home cooking in personal wellness. The Gallup World Poll surveys gather personal opinions and experience on a range of development-related topics that are used to create a range of indices. The adoption of clean cooking technologies and fuels is drawn from the WHO Household Energy Database. In order to understand the relative importance of the choice of cooking fuels in wellbeing, regression modelling is used to control for the effects of demographic variables available in the Gallup database.
By providing a complementary approach to establishing links between clean cooking and wellbeing, the research supports emerging clean cooking strategies. Furthermore, the research considers access to electricity alongside the choice of clean cooking fuels. This generates evidence of the value of integrating clean cooking into electrification programmes. Revenue from carbon credits generated from transitioning to clean cooking is well established as a source of finance for the sector. The voluntary carbon market is likely to pay premium prices for credits that offer benefits over and above climate impacts [2]. By demonstrating links between clean cooking and wellbeing, the findings from the research will strengthen trust in the quality and value of credits from clean cooking technologies and fuels. Development Impact Bonds, or Social Impact Bonds, are other examples of innovative financing mechanisms that are gaining traction; the World Bank issued Sustainable Development Bonds to the value of USD 41 billion in 2022 [3].

2. Background to Clean Cooking and Wellbeing

There are many different strands of research and theory around the subject of wellbeing. Income-related measures were traditional metrics for determining wellbeing, before advancements in the 1960s and 1970s introduced terms such as happiness, quality of life, and life satisfaction [4], which look beyond measures of economic and material progress. In the 1990s, development organisations such as the United Nations Development Program (UNDP) began actively considering quality of life with the Human Development Index, to look beyond measures such as GDP. Increasingly, improving wellbeing has become important in development research, policy-making, and determining progress on global objectives, such as the Sustainable Development Goals (SDG), most notably SDG3 (Health and Wellbeing), which contains a subjective wellbeing indicator [5].
Ideas of subjective and objective wellbeing, and measures designed to assess individuals’ happiness or quality of life, heavily borrow from disciplines such as psychology and philosophy: “ideas found in modern wellbeing research, e.g., the fundamental distinction between subjective and objective, originate from traditional philosophical theories” [6]. Subjective wellbeing indicates “wellbeing as described by self” compared to objective wellbeing, alluding to measures or dimensions of life, e.g., health status, level of education, or GDP [7]. These two broad conceptual approaches dominate the field of wellbeing research [8].
One of the key debates in subjective wellbeing literature concerns the relationship between increasing income and happiness. To a point, the relationship between these two shows a positive correlation, both nationally and internationally, though the limits to this are considered by the work of Easterlin, and the notion of the Easterlin paradox: “cross-sectionally (e.g., at a particular point in time), income and happiness are positively correlated. As countries become richer over time this relationship does not hold” [6]. Despite this consideration, the positive relationship between income growth and subjective wellbeing is well-established and wealth is important to control for and factor into analyses.
This paper considers the relationship between wellbeing and the choice of clean cooking fuels, which have been associated with a wide range of health and socio-economic benefits. Accordingly, first, we consider the literature linking cooking fuels and objective measures of wellbeing. It is apparent in the literature that there is a growing body of peer-reviewed work linking the effect of traditional polluting cooking fuels on negative health outcomes, particularly with regard to premature deaths due to household air pollution.
Data and analyses from several authors have built strong evidence of cardiorespiratory, paediatric, and maternal disease associated with using solid biomass for cooking [9,10,11,12,13,14,15], which has captured the attention of policy-makers at both national and international levels. There is also evidence that the negative effects are largely gendered, disproportionally impacting women and children, due to heightened exposure to cooking fumes, predominantly because of traditional gender roles [16,17] including home cooking responsibility [18]. Additionally, women are considered primarily responsible for solid fuel collection and bear associated time implications [19]. The prevalence of poor health outcomes due to polluting fuels is also observed to be highest in low- and middle-income countries, where the use of solid biomass fuel for cooking is more widespread [11,20]. Beyond studies demonstrating the negative impact of polluting cooking fuel use on health, other evolving studies have linked solid biomass cooking fuels to heightened economic costs for households, because of illness and higher medical expenses [21] and worse educational outcomes [22].
There is a less extensive body of work that links clean cooking fuel use with positive health outcomes [23,24,25]. Studies have shown that the adoption of clean cooking fuels has potential benefits not only for health but progress toward climate goals and other related SDGs [26]. There has also been nascent research into the potential for clean cooking fuels to positively impact mental health [27], as a counterpoint to the evolving evidence of the detrimental impact of outdoor air pollution [28], household air pollution, and cooking fuels on mental illness, such as depression [29].
The study of subjective wellbeing is a rapidly growing empirical science, especially over the past few decades and often works to complement objective measures [30]. Subjective wellbeing, despite being a broad construct, is defined by Diener et al. as a “person’s cognitive and affective evaluations of his or her life, as judged and reported by themselves” [31]. Key subjective wellbeing indices are a mix of experienced wellbeing measures (Positive Experience, Negative Experience, and Daily Experience), taking into account ranges of emotion at a specific moment in time, i.e., that day, and evaluative wellbeing measures (Life Evaluation), which requires respondents to give an evaluation of a longer period of time, i.e., their lifetime [32].
There have been few studies that have looked at cooking fuel use and subjective wellbeing; it is an emerging field of research. Ma et al. [33] used national data from the 2016 China Labor-force Dynamics Survey to explore household cooking fuel choices and individuals’ subjective wellbeing using two variables: happiness (an experienced measure), and life satisfaction (an evaluative measure). The paper concludes that a clean cooking fuel transition can significantly improve wellbeing within certain regions, which is supported by other national-level survey data, such as Ren et al. [34] and Wu et al. [35], who highlighted the particular advantages for rural areas and women.
A few other national-level studies, predominantly from China, have focussed on subjective wellbeing and specific segments of the population, such as the elderly [36,37], finding that the adoption of clean cooking fuels significantly enhances middle-aged and senior peoples’ subjective life satisfaction, or rural residents [38] whose life satisfaction is found to negatively correlate with solid fuel use. LPG is found to support dimensions of wellbeing; however, fuel transitions are complex, multi-dimensional, and dependent on context [19]. Alleviating a lack of access to clean fuels, as an aspect of energy poverty, finds that improved mental wellbeing may be a potential co-benefit of tackling energy poverty in peri-urban communities in countries in sub-Saharan Africa [39]. These studies focused on national-level data rather than multinational surveys, such as The Gallup World Poll, a data set used for this paper, which is a rich, global, and large evidence base for data on subjective wellbeing [40].
The association between access to clean cooking fuels and improved wellbeing is well established and growing. Much of the often epidemiological empirical evidence draws attention to the negative impact of the use of traditional polluting cooking fuels, and the resulting ill-health, rather than the direct benefits of clean cooking fuels, due to the challenges of empirically quantifying health [41]. Improving access to clean cooking fuels and reducing the reliance on cooking with solid biomass, and the linked risks to individuals’ health, are therefore intertwined in many development initiatives. This paper builds on research that makes links between clean cooking fuels and improved wellbeing, and in particular, contributes to the emerging field of study that explores subjective wellbeing measures and cooking fuel choice.

3. Methodology

3.1. Statistical Approach

The Gallup data set contains approximately 1000 individual records for each survey conducted in a given country in a particular year. However, the WHO data set contains only a single figure for the proportion of the population in a country that uses a given fuel as their primary cooking fuel in a particular year. Mean values of the indices of interest in the Gallup data set were calculated and matched with the corresponding country-level records in the WHO data set.
Pearson correlations were used to establish that some kind of link exists between wellbeing indices and the choice of clean cooking fuels at a national level.
It has been pointed out that, up to a point, wellbeing is linked to income, and so multiple regression modelling has been used to control for the effects of a number of demographic variables available in the Gallup data set that are themselves related to financial wellbeing. The proportion of the population using a clean cooking fuel as their primary cooking fuel is used as the predictor variable, and each wellbeing index in turn is used as the outcome variable. In order to control for income effects, the following demographic variables have been added as predictor variables. These have all been shown to correlate with income (see Section 5.1):
  • Age
  • Education level
  • Children under 15 in a household
  • Residents over 15 in a household
  • Access to internet
  • Employment
  • Rural/urban.
Finally, electrification rates for each country (in each year) were added to the model as a predictor variable in order to explore the relative impact of electrification and the choice of clean cooking fuels on the outcome variables.

3.2. Creating an Aggregated Data Set

The methodology is based on looking globally at countries with a spread of a mix of cooking fuels and looking for linkages with a number of wellbeing indices. The approach is based on combining two data sets:
  • Gallup World Poll data set (2018–2021)—measures attitudes and behaviours of people across the world;
  • WHO Household Energy Database—proportion of households using a range of fuels as their primary cooking fuel.
Each year, the Gallup World Poll surveys people in more than 150 countries worldwide, representing more than 98% of the world’s adult population [42]. The survey covers a comprehensive range of issues that are related to development indicators. Recent surveys have included a number of questions relating to cooking behaviours, which have been added at the request of Cookpad. The data set includes indices reflecting the six key elements of the methodology; law and order, food and shelter, institutions and infrastructure, good jobs, wellbeing, and brain gain. These elements are described as the currency of a life that matters. Twenty-one indices are calculated, each being constructed from a number of constituent questions; nine indices fall under the wellbeing category. The analysis has used a data set furnished by Cookpad, which covers a four-year period from 2018 to 2021.
The WHO Household Energy Database draws upon a range of nationally representative household survey data from WHO member states. It comprises data from over 170 countries, but these countries do not completely align with the countries covered by the Gallup data set; the WHO database includes a higher proportion of low- and middle-income countries. It provides data on the primary fuel used for cooking, so takes no account of fuel stacking; this means that the actual use of all fuels will be underrepresented. The analysis used data on the proportion of the population in each country using each different fuel. Data were available from 1960 to 2020; only data corresponding to the years covered by both the Gallup and WHO data set were used; i.e., three years from 2018 to 2020.
The two data sets were combined as follows:
  • Three-year data (2018 to 2020) were extracted from the Gallup data set, covering 148 countries;
  • Data on each of the wellbeing indices were aggregated to one value per year for each country by calculating the mean of individual indices in each country;
  • In the same way, mean values of demographic variables were calculated for each year for each country from the Gallup data set;
  • The aggregated Gallup data and WHO were then merged to generate the data set analysed in this paper. Each record represents a single country for a given year.
The number of countries for which data are available from both the Gallup and WHO data sets is presented in Table 1. This shows that, in terms of low-income countries, the data set is skewed towards African countries, and in terms of high-income countries, it is dominated by Europe. Note that the analysis explores relationships between the choice of clean cooking fuels and wellbeing indices at the country level, i.e., all countries are equally weighted, irrespective of population size. A list of countries within each region is given in Table A1.

3.3. Identifying Key Wellbeing Indices

The study is concerned with the nine composite indices relating to wellbeing described in Table 2. Each of these indices is, in turn, calculated from a small number of constituent variables (see Table A2).
The literature highlights a strong relationship between cooking and personal health, particularly as it relates to household air pollution. We would, therefore, expect to find a strong relationship between the choice of clean cooking fuels and the Personal Health Index. Potential links between the choice of clean cooking fuels and other indices are less intuitive. Other impacts associated with clean cooking include:
  • Time savings—not only time spent cooking, but also time spent collecting fuel and preparing fuel; e.g., chopping wood into stove-sized pieces. There is only emerging evidence that women use liberated time for additional household chores, leisure, and income-generating activities [43];
  • Reduced deforestation and environmental impact—this may not be apparent to urban residents, given that biomass fuels (notably charcoal) are harvested from rural areas and transported into urban markets;
  • Aspiration to modern living—especially in the connected world of the Internet and social media, people aspire to enjoy the benefits of economic and technological progress.
Reduced hazard-collecting wood fuel is physically demanding, back-breaking work, involving risk of injury, and often placing women in danger of sexual abuse; e.g., [44]. Collecting heavy bags of charcoal or LPG cylinders can also cause physical injury in the absence of a delivery service.
Bearing these factors in mind, an inspection of the constituent questions presented in Table A2 can help identify those indices likely to be most closely matched to the choice of clean cooking fuels.
  • Financial Life Index. Although there is emerging evidence that cooking with clean fuels can be cheaper than biomass fuels, this is largely a result of recent innovations in energy-efficient electric cooking devices coupled with increasing biomass fuel prices. In previous years, the use of clean cooking fuels has been associated with higher incomes. Therefore, we might expect the choice of clean cooking fuels to be only weakly linked to the economic status of the household.
  • Local Economic Confidence Index. Similarly, there will be many more pressing issues than clean cooking fuels affecting the local economy, with the possible exception of rural areas experiencing acute deforestation.
  • Personal Health Index. As mentioned above, polluting cooking fuels have been linked to a number of health conditions, including pain and chronic conditions, which are specifically covered by these questions. We would therefore, expect a strong link between the choice of clean cooking and personal health.
  • Social Life Index. Liberated cooking time can be used to meet people, but can also be used for income-generating activities, additional chores, leisure, etc., so we might only expect a weak link between the choice of clean cooking fuels and the social life index.
  • Civic Engagement Index. As above, liberated cooking time could offer more opportunities to volunteer time. However, these questions are designed to assess commitment to the local community, which might be expected to be independent of the household’s choice of cooking fuels.
  • Life Evaluation Index. This is an overall assessment of life satisfaction. Responses are based on a wide range of issues, but one of the central tenets of the study is that the use of clean cooking fuels will have an impact on overall wellbeing, so this is a key index to explore.
  • Positive Experience Index. Cooking with polluting fuels is often portrayed as drudgery [45], but there is also evidence that people take great pride in their cooking and can enjoy cooking for their families. It is not clear, therefore, that this index would be linked to the choice of clean cooking fuels.
  • Negative Experience Index. Physical pain is clearly linked to cooking with biomass fuels, not only to collecting and managing fuel, but also as a result of the design of traditional cooking devices; e.g., a three-stone fire. Any number of household responsibilities can be a source of worry and stress, and this includes preparing meals; a study on the impact of household fridges provided some interesting examples of links between food preparation and worry and stress [46].
  • Daily Experience Index. The ten constituent questions are those used in both the Positive and Negative Experience indices. Links to those two indices might, therefore, be expected to reveal more interesting insights into the links between the use of clean cooking and specific aspects of wellbeing.
A preliminary analysis of links between the choice of clean cooking fuels and the nine indices is summarised in Table 3. This confirms that neither of the economic-related indices are strongly linked to the choice of clean cooking fuels. The table also confirms that the Positive Experience index is not linked to the choice of clean cooking fuels, and the correlation with the Daily Experience index, although significant, is weaker than the correlation with the Negative Experience index.
On this basis, the detailed analysis explored links between the choice of clean cooking fuels and a reduced set of key indices:
  • Personal Health
  • Social Life
  • Civic Engagement
  • Life Evaluation
  • Negative Experience

3.4. Demographic Variables

It has been noted that factors other than the choice of cooking fuels will also influence wellbeing, most obviously income. The Gallup data set includes data on household income in the local currency, which was levelized by converting it into international dollars, which reflects local purchasing power. This was compared with per capita GDP figures from the World Bank (https://data.worldbank.org/indicator/NY.GDP.PCAP.PP.KD, accessed on 12 April 2023) to give us confidence in the figures. The results show that, overall, there is a strong correlation between the average household income at the country level (from the Gallup data set) and per capita GDP (World Bank data) (r = 0.826, p < 0.001). However, it is interesting to note that while correlations are strong in more developed regions (e.g., Europe and Eastern Mediterranean), they are weaker in lower-income regions, especially South-East Asia and Africa (Table 4). This probably reflects the concentrated nature of wealth generation in low-income countries, meaning that wealth is less evenly distributed among citizens. This suggests that the Gallup income data are not only reliable but, as a closer representation of household income, are also likely to be better suited to the purposes of the analysis.
The limitations of income as a measure of poverty are well recognised and there exists a wealth of literature on methodologies that take a more holistic view of poverty; perhaps one of the most widely accepted is the Multi-dimensional Poverty Index (MPI), adopted by UNDP in 2010 [1]. This proposes measures for quantifying three domains of poverty: health, education, and living standards (which includes the use of polluting cooking fuels). This level of data is not captured by the Gallup World Poll survey, but it is assumed that the household and respondent demographics presented in Table 5 are all linked in some way to socio-economic status and poverty. Multiple regression analysis has been used to control for these poverty-related characteristics.
When creating multiple regression models, we started with a maximum model including all of the demographic variables as predictor variables. We then simplified the model as much as possible by removing non-significant predictor variables and variables that had a zero slope, whilst retaining the choice of clean cooking energy as a predictor variable. Statistical analysis and regression modelling were carried out using SPSS.

4. Clean Cooking Fuels and Wellbeing Indices

The WHO database contains data on the use of biomass, charcoal, coal, electricity, gas, and kerosene as primary cooking fuels. For the purposes of this study, only electricity and gas were classified as clean cooking fuels. The distribution of the choice of cooking fuels across global regions is presented in Table 6 and shows that, overall, the choices of primary cooking fuels globally across all countries are predominantly clean cooking fuels (Table 6). Countries in Africa have the lowest proportion of their populations primarily using clean cooking fuels (18.8%), followed by South-East Asia (63.9%).
The correlation coefficients presented in Table 7 show that all of the key wellbeing indices are linked to the choice of clean cooking fuels. This shows that countries in which a higher proportion of the population uses clean cooking fuels tend to have better personal health, are more likely to be thriving (Life Evaluation index), and have stronger social networks; they are also less likely to experience negative feelings and less likely to engage in altruistic acts. With the exception of civic engagement, each of these relationships appears to support the hypothesis that clean cooking fuels are linked to more positive wellbeing.
The table goes on to break down the links between the choice of individual fuels and each of the key wellbeing indices. Correlations of the use of coal and kerosene with wellbeing indices are rarely significant because the use of these fuels is substantial in only a small number of countries; e.g., coal in China, and kerosene in Spain, Indonesia, and India. Among clean fuels, it is interesting to note that the choice of electricity for cooking appears to correlate more closely with wellbeing indices than the choice of gas. The choice of biomass and charcoal equally correlate with wellbeing indices, and are linked to more negative wellbeing.

5. Clean Cooking, Wellbeing, and Other Demographic Variables

5.1. Demographic Variables

In the previous section, it was shown that there are moderate to strong relationships between different wellbeing indices and the choice of clean cooking fuels. It has already been recognised that other factors will influence wellbeing, most notably financial or poverty status. To further understand the influence of the choice of clean fuels on different wellbeing indices, regression modelling was used, controlling for the demographic variables listed in Table 5. The correlation of demographic variables reveals how, at the level of country mean values, these variables relate to income (see Table 8):
  • Age—countries with a higher average age have higher incomes (r = 0.617, p < 0.001). Given that the mean age of the Gallup sample in a given country represents the overall age of the population, a higher mean age reflects countries with higher life expectancy, which is a characteristic of higher-status countries.
  • Education level—countries with higher levels of education have higher incomes (r = 0.665, p < 0.01).
  • Number of children in a household—countries where households have more children (under 15) tend to have lower incomes (r = −0.547, p < 0.001).
  • Number of adults in a household—countries with larger household sizes tend to have lower incomes (r = −0.350, p < 0.001).
  • Access to the Internet—countries with higher Internet penetration have higher incomes (r = 0.665, p < 0.001).
  • Employment—countries with lower unemployment rates have higher incomes (r = −0.259, p < 0.001).
  • Urban/rural—countries with a higher proportion of their population living in rural areas have lower incomes (r = 0.447, p < 0.001).

5.2. Regression Analysis

The regression models for predicting the key wellbeing indices are presented in Table 9, Table 10, Table 11, Table 12 and Table 13.
When controlling for the socio-economic status demographic variables, the regression analysis shows that access to clean fuels is a significant determinant of the personal health index. Moreover, it is the dominant factor included in the model, as shown in Table 9. Other variables contribute to the index as expected. The personal health index is higher in countries with:
  • a higher proportion of the population living in rural areas
  • higher levels of employment
  • higher levels of education
  • a younger population
  • higher incomes
Regression analysis shows that there is no evidence of statistical significance in the relationship between the life evaluation index and access to clean fuels when other variables are kept constant. As shown in Table 10, it appears that life satisfaction is higher in countries with:
  • a higher employment rate,
  • smaller household sizes, but with children (a higher number of young children in households but a lower number of adults)
  • higher access to the Internet (information and entertainment)
  • a higher urban population concentration
The regression analysis suggests that access to clean cooking fuels has a significant influence on population social life (see Table 11). Other variables contribute to the social life index as expected. It is higher in countries with:
  • higher levels of employment
  • populations with a higher mean age (older population)
The social life index is about social support structure and opportunities to make friends. Therefore, factors such as additional free time associated with modern cooking fuels, workplace social networks, and greater societal responsibility among older people would be expected to have a positive impact on social life.
Controlling for other variables, access to clean cooking significantly influences the negative experience index (see Table 12). Lower access to clean cooking fuels reflects the higher negative experience index, particularly experiencing pain. Other statistically significant relationships show that the negative experience index is higher in countries with:
  • lower levels of income
  • lower levels of education
  • a higher urban population concentration
  • a lower employment rate
Controlling for other variables, access to clean fuels has a significant influence on the civic engagement index (see Table 13). It seems that countries with lower access to clean fuels tend to have higher levels of civic engagement, which assesses volunteering time and assistance to others in the community. It appears that this index is weaker in countries with older populations and higher in countries with higher levels of education.
The following observations can be made from the results presented above:
  • Clean cooking fuels are influential in all of the key wellbeing indices with the exception of the high-level overall quality of life index (life evaluation index);
  • Personal health is the index that is most strongly influenced by the choice of clean cooking fuels; it is the only model in which clean fuels are the dominant factor in the model (Table 9);
  • Less choice of clean cooking fuels reflects a higher negative experience index, particularly experiencing pain;
  • The personal health and negative experience models are similar, sharing many of the same variables in the model.

6. Gender and the Burden of Cooking

The Gallup survey asked respondents how often they had cooked lunch and dinner in the previous week. Adding together the number of lunches and dinners cooked in a week gives an integer variable ranging from 0 to 14 meals/week. In order to explore the implications of the burden of cooking, a new categorical variable was created to assess if there is a difference between the wellbeing of people intensively cooking and that of those not cooking at all. Respondents who did not cook at all were defined as “non-cooks” (0 meals/week) and respondents who cooked at least 12 times in a week were defined as intensive “cooks”. Among the respondents in the Gallup data set, 24% intensively cooked and 24% did not cook at all.
The data show that cooking is a gendered activity worldwide. Figure 1 shows that, globally, on average, women cooked more than four times as much as men per week over the period 2018–2020. When comparing intensive cooks with non-cooks, women make up 79% of intensive cooks, but only 18% of non-cooks.
An expanded data set was created, comprising mean values of wellbeing indices at the country level for both intensive cooks and non-cooks, which were merged with the country-level variables pertaining to the choice of cooking fuels. The average wellbeing figures from across all countries show that, overall, personal health and social life are weaker among intensive cooks, and negative experience is more negative among intensive cooks (Table 14). This suggests that intensive cooking is associated with poorer wellbeing.
The question remains as to whether the choice of cooking fuels contributes to the poorer wellbeing of intensive cooks. Figure 2 shows how the personal health index varies with the choice of clean cooking fuels for both groups. The interesting feature of this chart is that among countries predominantly using polluting fuels, there is little difference in the wellbeing index. However, the positive effect of increasing the use of clean cooking fuels appears to be more acute among non-cooks. The same pattern can be seen for the negative experience index (Figure 3). This is somewhat counterintuitive, as one might expect it to be cooks who would benefit most from the positive effects of clean cooking on wellbeing. This is an area for further investigation.

7. Clean Cooking and Electricity Access

Impressive progress has been made in improving access to electricity, with the number of people without electricity dropping from 1.2 billion in 2010 to 730 million in 2020 [44]. This has been achieved with substantial investment, although this has recently been in decline from a peak of $25 billion in 2017 [47]. Achieving universal access to clean cooking by 2030 has been estimated to require still higher levels of investment ($150 billion/year), yet there remains a huge disparity in investment in the electricity sector versus investment in clean cooking [48].
Country-level data on rates of access to electricity have been added to regression models as an additional predictor variable by which to assess the relative effect on wellbeing of gaining access to electricity and to clean cooking fuels. The percentage of the population with access to electricity from the Our World in Data (OWID) data set was used (https://ourworldindata.org/energy-access, accessed on 3 July 2023).
The revised regression models are presented in Table 15, Table 16, Table 17, Table 18 and Table 19. It should be noted that at the country level, electrification rates closely correlate with the choice of clean cooking fuels (r = 0.812, p < 0.001). This is just about on the threshold of collinearity, which is regarded as being between 0.8 and 0.9 [49]. This makes it difficult for regression models to distinguish the relative importance of the two variables, and the model will tend to include one or the other of the two.
Having said that, the tables show three types of relationships:
  • The choice of clean cooking fuels appears to be more influential than access to electricity—negative experience and civic engagement indices;
  • The choice of clean cooking fuels is of similar importance as electricity access—the personal health index;
  • The choice of clean cooking has not been included in the model—life evaluation and social life indices;

8. Discussion

In the description of wellbeing indices in Section 3.2, it was asserted that both the personal health index and the negative experience index would be intuitively linked to the choice of cooking fuel. The regression analysis, controlling for demographic factors, confirms this to be the case. Furthermore, adding access to electricity as an additional predictor variable indicates that the choice of clean cooking fuels is at least as important as access to electricity in predicting these two indicators of wellbeing. When compared with non-cooks, who are not directly exposed to cooking fuels, intensive cooks have poorer personal health and negative experience metrics. Given that women do much more cooking than men, this highlights the gender implications of the burden of cooking.
The description of indices hypothesised that the social life index, which reflects personal relationships, would be only weakly linked to the choice of cooking fuels, so it is interesting to find that it is significantly linked to the choice of cooking fuels. This possibly reflects the time savings associated with clean cooking fuels, giving people increased opportunities for social activities. On the other hand, it is not surprising to find that this index appears to be more closely linked to access to electricity than to the choice of cooking fuels.
It is surprising to find that the civil engagement index, which was expected to be independent, appears to be linked to the choice of clean cooking fuels. The relationship is consistently negative, indicating that altruistic acts of volunteering are more common in countries with lower use of clean cooking fuels. We believe this reflects a difference in social norms between high- and low-income countries, rather than the effects of cooking fuel choices, but further research is needed to explore this.
Life evaluation was regarded as a key index because it is an important subjective measurement of overall wellbeing, covering a range of unspecified issues. However, the analysis indicates that it is not directly linked to the choice of cooking fuels. This corresponds with the findings of Ma et al. [33], who illustrated the complexity of cooking fuel transitions across national geographical locations, with only certain regions demonstrating increased subjective wellbeing due to a complete transition to clean cooking fuels. Overall, despite this being a novel field of study, the findings of this paper add to the existing literature linking subjective wellbeing and cooking fuel choice.
The close correlation of the choice of clean cooking fuels with electrification rates illustrates how countries with a developed electrical infrastructure will also have effective gas distribution logistics, given that, globally, gas is much more widely used than electricity for cooking. There is a growing body of work that has explored the gap between electricity access and access to clean cooking fuels [50,51]. This study’s findings highlight the value of conjointly considering the two.
The study can inform policymaking in a number of areas, highlighting the importance of considering clean cooking when developing electricity access policies, and vice versa, given this paper’s finding that they are both significantly linked to improved wellbeing. Clean fuels’ contribution to wider socio-economic benefits, such as improved wellbeing, serves to strengthen the appeal of clean cooking credits in carbon markets, an important tool in attracting private sector investment and advancing development goals around clean cooking. Finally, development surveys should consider including the choice of clean cooking fuels in questionnaires to obtain wider and more in-depth data, which will allow for further analysis in this emerging area of research.
The study has highlighted some areas for further research:
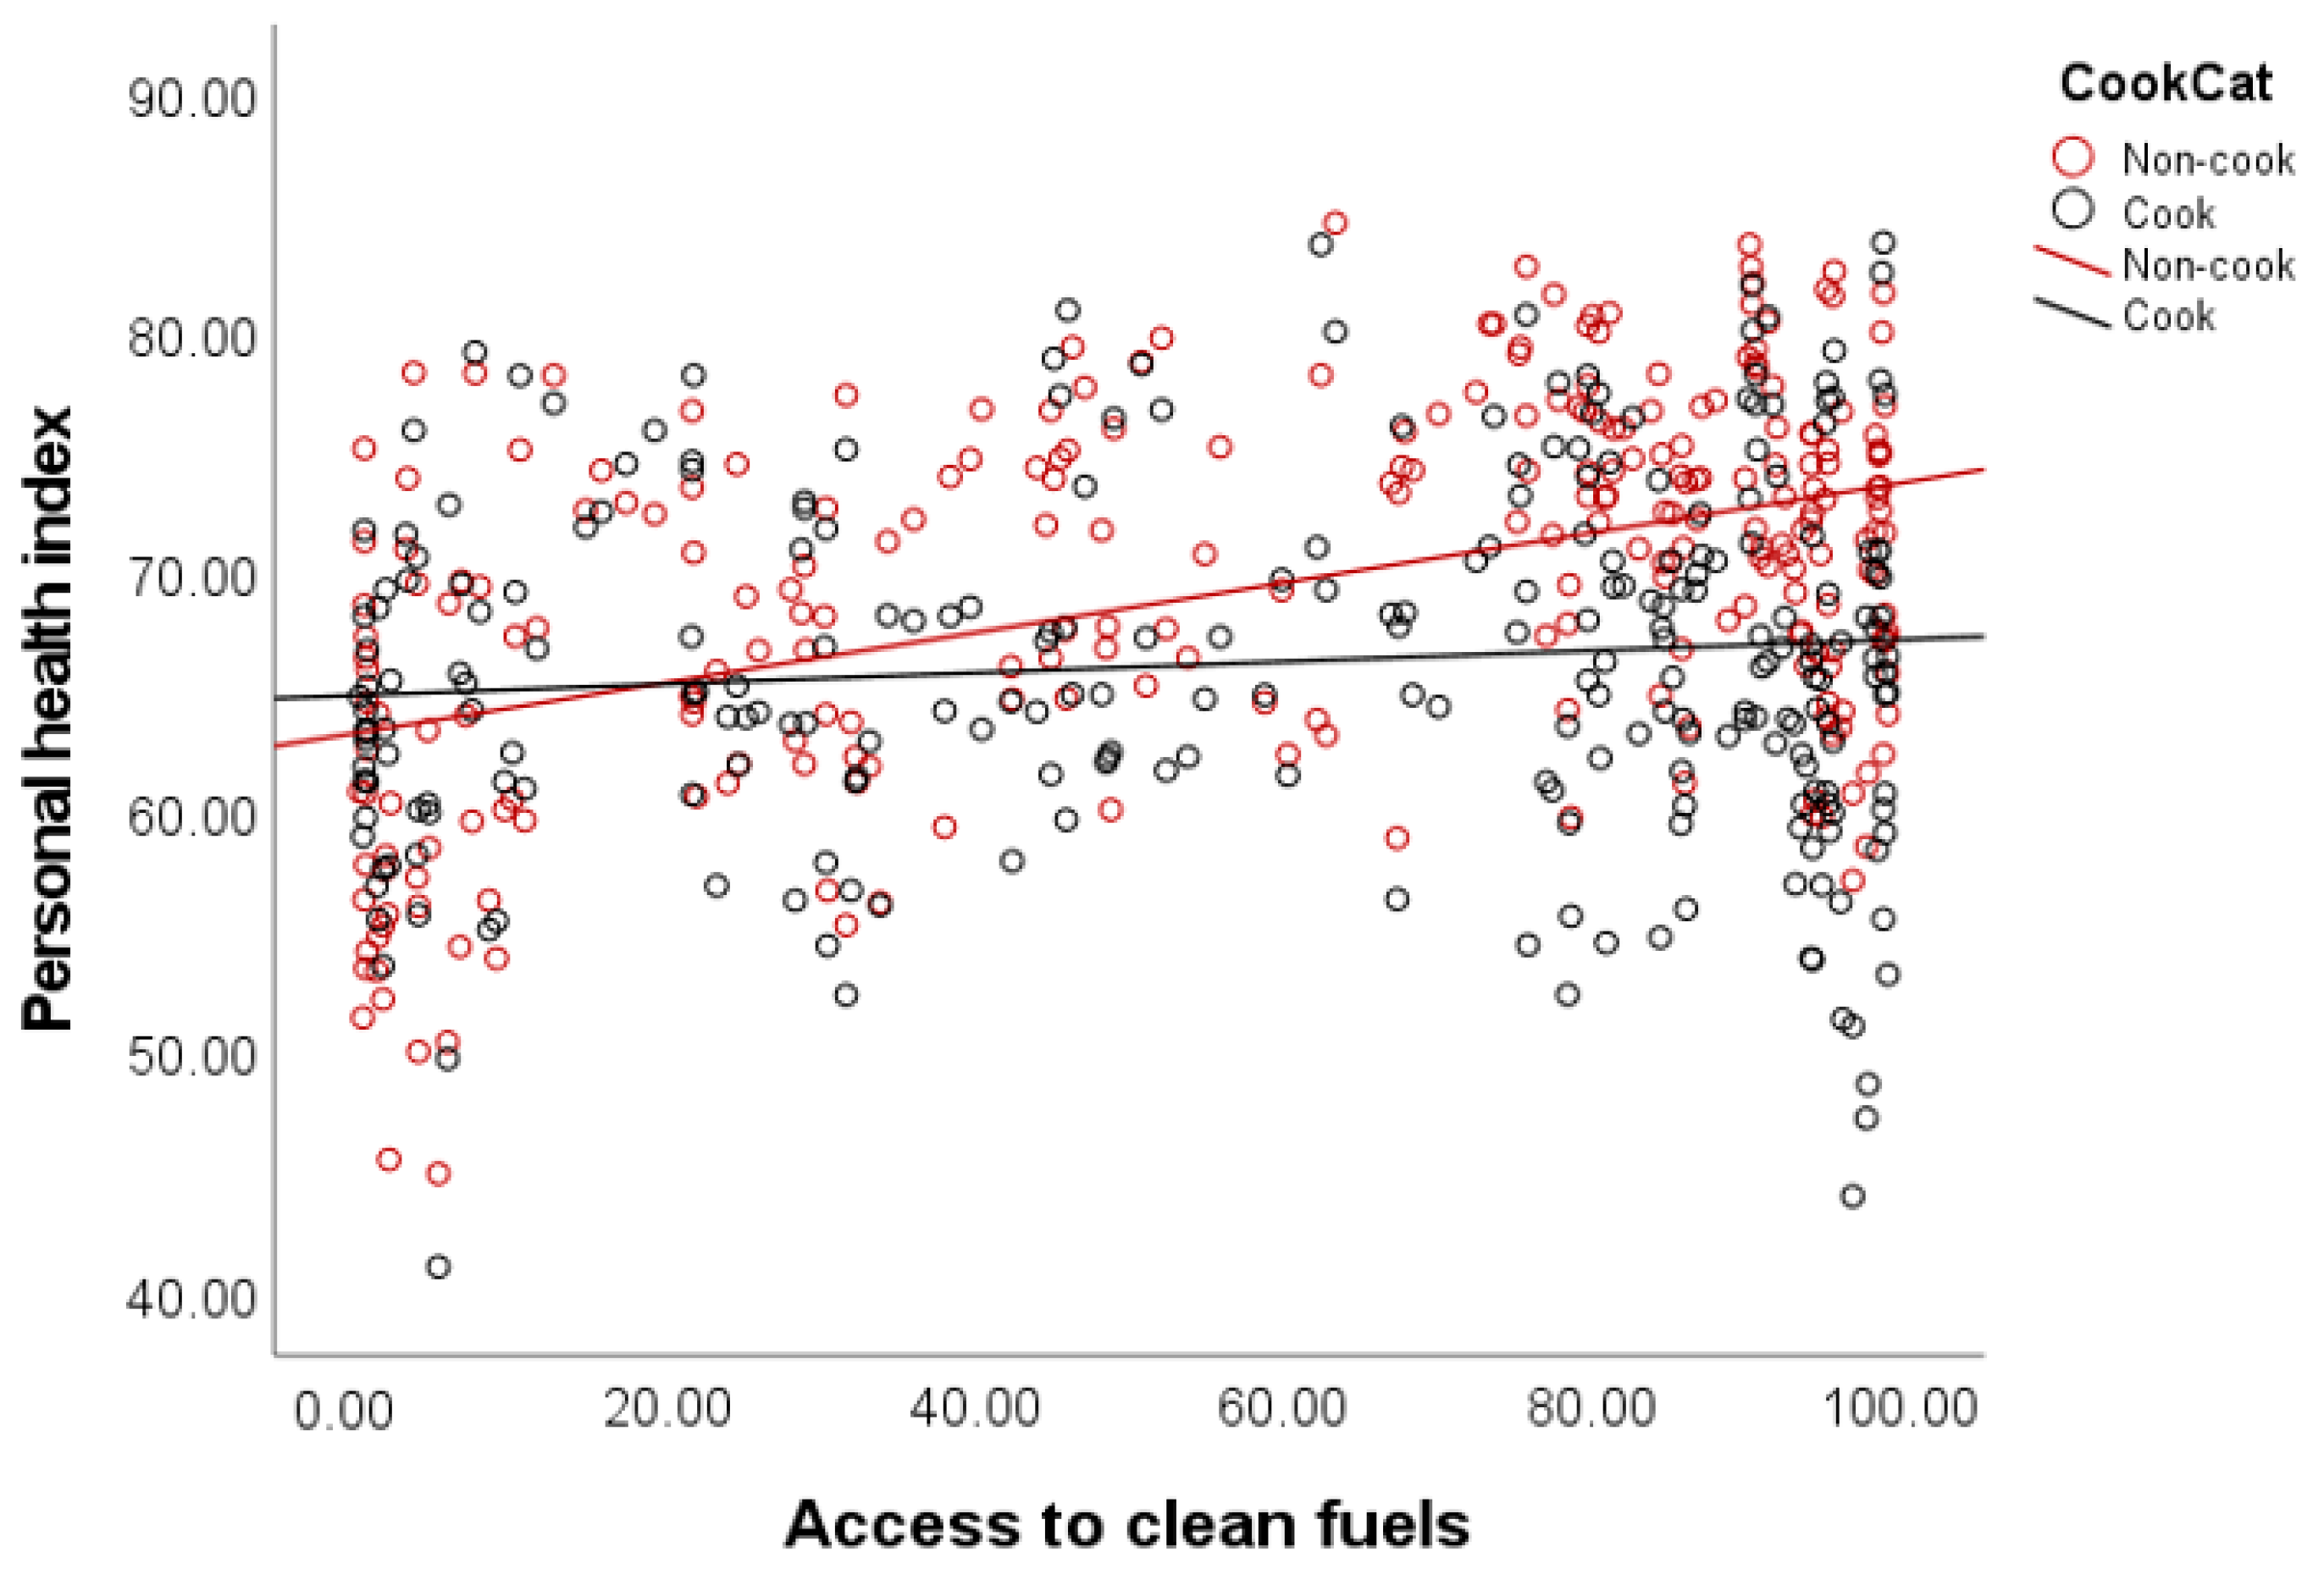
  • One might expect it to be cooks who would benefit most from the positive effects of clean cooking on wellbeing, but the increase in both the personal health and negative experience indices with increasing use of clean cooking fuels is greater among non-cooks, which is counterintuitive.
  • The civil engagement index, which was expected to be independent, appears to be linked to the choice of clean cooking fuels.
  • Correlations indicated that the choice of electricity as a cooking fuel is more closely linked to wellbeing than gas; links between specific fuels and wellbeing should be explored in more detail.

9. Conclusions

The study combined Gallup data with primary cooking fuel use at the country level and showed that wellbeing is clearly linked to the choice clean cooking fuels. Links were explored using two approaches:
  • regression modelling of the wellbeing indices as outcomes and using primary choice of cooking fuels (expressed as the proportion of populations using clean fuels) as a predictor variable, using country-level averages;
  • comparing intensive cooks, who are exposed to cooking fuels, with non-cooks (using Gallup data).
The results of both approaches confirm that both the personal health and negative experience indices are strongly linked to the choice of clean cooking fuels. These findings are consistent with the evidence found in the literature of links between clean cooking fuels and health and mental health, and between clean cooking fuels and wellbeing. The value of this study is in conferring external validity to the literature by taking a global, multi-country approach. The influence of cooking fuels does not appear to be strong enough to have an effect on overall wellbeing, as assessed by the life evaluation index.
The analysis highlights the potential for integrating eCooking into national electrification plans. The sustainability and developmental benefits of increased access to electricity can be enhanced by linking them to clean cooking, given that health outcomes (personal health and negative experience indices) appear to be as closely linked to the choice of cooking fuels as to access to electricity.
Having demonstrated the links between cooking fuels and wellbeing, there is a case to be made for incorporating questions on the choice of cooking fuels into the Gallup World Poll survey, which would complement the existing questions on the frequency of cooking.
The results from this paper were limited to global analysis with no extension to examples of country-level analysis due to the limitations of the data. First, only one data point for each country per year was available. Second, the WHO database only provides data on the primary cooking fuel, which does not take into account the common practice of fuel stacking. Lastly, modelling was only able to control for demographic variables included in the Gallup World Poll data set.

Author Contributions

Conceptualization, N.S. and J.L.; methodology, N.S. and J.N.; software, J.N. and N.S.; validation, N.S. and J.N.; writing—original draft preparation, N.S., J.N. and J.F.T.; writing—review and editing, N.S., J.N. and J.F.T.; visualization, J.N.; funding acquisition, N.S., J.L. and J.F.T. All authors have read and agreed to the published version of the manuscript.

Funding

This research was part funded by Cookpad and the Modern Energy Cooking Services (MECS) programme (GB-GOV-1-300123).

Institutional Review Board Statement

Not applicable.

Informed Consent Statement

Not applicable.

Data Availability Statement

The WHO Household Energy Database is publicly available at https://www.who.int/data/gho/data/themes/air-pollution/who-household-energy-db (accessed on 23 January 2023). The Gallup World Poll data set was made available to Gamos under a special Data Use Agreement facilitated by the competition partnership between Cookpad and Gallup; this is not publicly available. No new data were created under the study.

Acknowledgments

The authors thank Cookpad for their support and funding for the study; also Gallup for providing access to the World Poll data set. The authors also thank people who have contributed to the background research utilised.

Conflicts of Interest

The study was conducted independently of Cookpad; the authors had complete autonomy in the design, findings, and conclusions of the study. The authors declare no conflict of interest.

Appendix A

Table A1. List of countries by region common to Gallup and WHO data sets.
AfricaEuropeAmericasEastern
Mediterranean
Western PacificSouth-East Asia
AlgeriaAlbaniaArgentinaAfghanistanCambodiaBangladesh
BeninArmeniaBoliviaEgyptChinaIndia
BotswanaAustriaBrazilIranLaosIndonesia
Burkina FasoAzerbaijanChileIraqMalaysiaMyanmar
BurundiBelarusColombiaJordanMongoliaNepal
CameroonBosnia and HerzegovinaCosta RicaLibyaPhilippinesSri Lanka
ChadCzech RepublicDominican RepublicMoroccoSouth KoreaThailand
ComorosEstoniaEcuadorPakistanVietnam
Congo BrazzavilleGeorgiaEl SalvadorSaudi Arabia
EswatiniGreeceGuatemalaTunisia
EthiopiaKazakhstanHaitiUnited Arab Emirates
GabonKyrgyzstanHondurasYemen
GambiaLatviaMexico
GhanaMoldovaNicaragua
GuineaMontenegroPanama
Ivory CoastRomaniaParaguay
KenyaRussiaPeru
LesothoSerbiaUruguay
LiberiaSlovakiaVenezuela
MadagascarSlovenia
MalawiSpain
MaliTajikistan
MauritaniaTurkey
MauritiusTurkmenistan
MozambiqueUkraine
NamibiaUzbekistan
Niger
Nigeria
Rwanda
Senegal
Sierra Leone
South Africa
Tanzania
Togo
Uganda
Zambia
Zimbabwe
Table A2. Wellbeing indices constituent questions (Gallup data set).
IndexQuestions
Financial Life IndexWhich one of these phrases comes closest to your own feelings about your household’s income these days: living comfortably on present income, getting by on present income, finding it difficult on present income, or finding it very difficult on present income? (WP2319)
Are you satisfied or dissatisfied with your standard of living, all the things you can buy and do? (WP30)
Right now, do you feel your standard of living is getting better or getting worse? (WP31)
Right now, do you think that economic conditions in the city or area where you live, as a whole, are getting better or getting worse? (WP88)
Local Economic Confidence IndexRight now, do you think that economic conditions in the city or area where you live, as a whole, are getting better or getting worse? (WP88)
How would you rate your economic conditions in this city today—as excellent, good, only fair, or poor? (WP19472)
Personal Health IndexDo you have any health problems that prevent you from doing any of the things people your age normally can do? (WP23)
Now, please think about yesterday, from the morning until the end of the day. Think about where you were, what you were doing, who you were with, and how you felt. Did you feel well-rested yesterday? (WP60)
Did you experience the following feelings during a lot of the day yesterday? How about physical pain? (WP68)
Did you experience the following feelings during a lot of the day yesterday? How about worry? (WP69)
Did you experience the following feelings during a lot of the day yesterday? How about sadness? (WP70)
Social Life IndexIf you were in trouble, do you have relatives or friends you can count on to help you whenever you need them, or not? (WP27)
In the city or area where you live, are you satisfied or dissatisfied with the opportunities to meet people and make friends? (WP10248)
Civic Engagement IndexHave you done any of the following in the past month? How about donated money to a charity? (WP108)
Have you done any of the following in the past month? How about volunteered your time to an organization? (WP109)
Have you done any of the following in the past month? How about helped a stranger or someone you didn’t know who needed help? (WP110)
Life Evaluation IndexPlease imagine a ladder, with steps numbered from 0 at the bottom to 10 at the top. The top of the ladder represents the best possible life for you and the bottom of the ladder represents the worst possible life for you. On which step of the ladder would you say you personally feel you stand at this time? (WP16)
Please imagine a ladder, with steps numbered from 0 at the bottom to 10 at the top. The top of the ladder represents the best possible life for you and the bottom of the ladder represents the worst possible life for you. Just your best guess,
on which step do you think you will stand in the future, say about five years from now? (WP18)
Positive Experience IndexDid you feel well-rested yesterday? (WP60)
Were you treated with respect all day yesterday? (WP61)
Did you smile or laugh a lot yesterday? (WP63)
Did you learn or do something interesting yesterday? (WP65)
Did you experience the following feelings during a lot of the day yesterday? How about enjoyment? (WP67)
Negative Experience IndexDid you experience the following feelings during a lot of the day yesterday? How about physical pain? (WP68)
Did you experience the following feelings during a lot of the day yesterday? How about worry? (WP69)
Did you experience the following feelings during a lot of the day yesterday? How about sadness? (WP70)
Did you experience the following feelings during a lot of the day yesterday? How about stress? (WP71)
Did you experience the following feelings during a lot of the day yesterday? How about anger? (WP74)
Daily Experience IndexPositive Experience + Negative Experience

References

  1. Alkire, S.; Santos, M.E. Acute Multidimensional Poverty: A New Index for Developing Countries; University of Oxford: Oxford, UK, 2010. [Google Scholar]
  2. Galt, H.; Mikolajczyk, S.; Long, I.; Della Maggiore, M.; Bravo, F.; Tierney, M. The Role of Voluntary Carbon Markets in Clean Cooking. Climate Focus and the Modern Energy Cooking Services Programme. 2023. Available online: www.mecs.org.uk (accessed on 6 September 2023).
  3. World Bank. Sustainable Development Bonds & Green Bonds 2022. 2023. Available online: https://issuu.com/jlim5/docs/world_bank_ibrd_impact_report_2021_web_ready_r01?fr=sYTBhOTM4NTM3MTk (accessed on 6 September 2023).
  4. Allin, P.; Hand, D.J. New Statistics for Old?—Measuring the Wellbeing of the UK. 2017. Available online: https://www.jstor.org/stable/44682550 (accessed on 16 March 2023).
  5. De Neve, J.E.; Sachs, J.D. The SDGs and human well-being: A global analysis of synergies, trade-offs, and regional differences. Sci. Rep. 2020, 10, 15113. [Google Scholar] [CrossRef] [PubMed]
  6. Drydyk, J.; Keleher, L. Routledge Handbook of Development Ethics; Taylor & Francis: Abingdon, UK, 2019. [Google Scholar]
  7. Teghe, D.; Rendell, K. Social Wellbeing: A Literature Review; School of Social Work & Welfare Studies, CQU: Rockhampton, Australia, 2005. [Google Scholar] [CrossRef]
  8. Western, M.; Tomaszewski, W. Subjective wellbeing, objective wellbeing and inequality in Australia. PLoS ONE 2016, 11, e0163345. [Google Scholar] [CrossRef] [PubMed]
  9. Bruce, N.; Perez-Padilla, R.; Albalak, R. Indoor Air Pollution in Developing Countries: A Major Environmental and Public Health Challenge. 2000. Available online: https://apps.who.int/iris/handle/10665/268218 (accessed on 9 June 2023).
  10. Parikh, J. Hardships and health impacts on women due to traditional cooking fuels: A case study of Himachal Pradesh, India. Energy Policy 2011, 39, 7587–7594. [Google Scholar] [CrossRef]
  11. Lee, K.K.; Bing, R.; Kiang, J.; Bashir, S.; Spath, N.; Stelzle, D.; Mortimer, K.; Bularga, A.; Doudesis, D.; Joshi, S.S.; et al. Adverse health effects associated with household air pollution: A systematic review, meta-analysis, and burden estimation study. Lancet Glob. Health 2020, 8, e1427–e1434. Available online: https://www.ncbi.nlm.nih.gov/pmc/articles/PMC7564377/ (accessed on 6 September 2023). [CrossRef]
  12. Malla, S.; Timilsina, G.R. Household Cooking Fuel Choice and Adoption of Improved Cookstoves in Developing Countries: A Review; The World Bank: Washington, DC, USA, 2014. [Google Scholar] [CrossRef]
  13. Peabody, J.W.; Riddell, T.J.; Smith, K.R.; Liu, Y.; Zhao, Y.; Gong, J.; Milet, M.; Sinton, J.E. Indoor Air Pollution in Rural China: Cooking Fuels, Stoves, and Health Status. Arch. Environ. Occup. Health 2005, 60, 86–95. [Google Scholar] [CrossRef]
  14. Ki-Hyun, K.; Shamin, A.; Ehsanul, K. A review of diseases associated with household air pollution due to the use of biomass fuels. J. Hazard Mater. 2011, 192, 425–431. Available online: https://www.sciencedirect.com/science/article/abs/pii/S0304389411007424?via%3Dihub (accessed on 16 March 2023).
  15. Nie, P.; Sousa-Poza, A.; Xue, J. Fuel for life: Domestic cooking fuels and women’s health in rural China. Int. J. Environ. Res. Public Health 2016, 13, 810. [Google Scholar] [CrossRef]
  16. James, B.S.; Shetty, R.S.; Kamath, A.; Shetty, A. Household cooking fuel use and its health effects among rural women in southern India-A cross-sectional study. PLoS ONE 2020, 15, e0231757. [Google Scholar] [CrossRef]
  17. Silwal, A.R.; McKay, A. The Impact of Cooking with Firewood on Respiratory Health: Evidence from Indonesia. J. Dev. Stud. 2015, 51, 1619–1633. [Google Scholar] [CrossRef]
  18. Wolfson, J.A.; Ishikawa, Y.; Hosokawa, C.; Janisch, K.; Massa, J.; Eisenberg, D.M. Gender differences in global estimates of cooking frequency prior to COVID-19. Appetite 2021, 161, 105117. [Google Scholar] [CrossRef]
  19. Malakar, Y.; Day, R. Differences in firewood users’ and LPG users’ perceived relationships between cooking fuels and women’s multidimensional well-being in rural India. Nat. Energy 2020, 5, 1022–1031. [Google Scholar] [CrossRef]
  20. Floess, E.; Grieshop, A.; Puzzolo, E.; Pope, D.; Leach, N.; Smith, C.J.; Gill-Wiehl, A.; Landesman, K.; Bailis, R. Scaling up gas and electric cooking in low- and middle-income countries: Climate threat or mitigation strategy with co-benefits? Environ. Res. Lett. 2023, 18, 034010. [Google Scholar] [CrossRef]
  21. Lin, B.; Wei, K. Does Use of Solid Cooking Fuels Increase Family Medical Expenses in China? Int. J. Environ. Res. Public Health 2022, 19, 1649. [Google Scholar] [CrossRef] [PubMed]
  22. Biswas, S.; Das, U. Adding fuel to human capital: Exploring the educational effects of cooking fuel choice from rural India. Energy Econ. 2022, 105, 105744, Ahead of print. [Google Scholar] [CrossRef]
  23. Capuno, J.J.; Tan, C.A.R.; Javier, X. Cooking and coughing: Estimating the effects of clean fuel for cooking on the respiratory health of children in the Philippines. Glob. Public Health 2018, 13, 20–34. [Google Scholar] [CrossRef]
  24. Anenberg, S.C.; Henze, D.K.; Lacey, F.; Irfan, A.; Kinney, P.; Kleiman, G.; Pillarisetti, A. Air pollution-related health and climate benefits of clean cookstove programs in Mozambique. Environ. Res. Lett. 2017, 12, 025006. [Google Scholar] [CrossRef]
  25. Lamichhane, P.; Sharma, A.; Mahal, A. Impact of cleaner fuel use and improved stoves on acute respiratory infections: Evidence from India. Int. Health 2017, 9, 349–366. [Google Scholar] [CrossRef]
  26. Rosenthal, J.; Quinn, A.; Grieshop, A.P.; Pillarisetti, A.; Glass, R.I. Clean cooking and the SDGs: Integrated analytical approaches to guide energy interventions for health and environment goals. Energy Sustain. Dev. 2018, 42, 152–159. [Google Scholar] [CrossRef]
  27. Liu, P.; Han, C.; Teng, M. Does clean cooking energy improve mental health? Evidence from China. Energy Policy 2022, 166, 113011. [Google Scholar] [CrossRef]
  28. King, J.D.; Zhang, S.; Cohen, A. Air pollution and mental health: Associations, mechanisms and methods. Curr. Opin. Psychiatry 2022, 35, 192–199. [Google Scholar] [CrossRef]
  29. Li, X.; Guo, Y.; Xiao, J.; Liu, T.; Zeng, W.; Hu, J.; He, G.; Rong, Z.; Zhu, Z.; Wu, F.; et al. The effect of polluting cooking fuels on depression among older adults in six low- and middle-income countries. Sci. Total Environ. 2022, 838, 155690. [Google Scholar] [PubMed]
  30. Diener, E.; Lucas, R.E.; Oishi, S. Advances and open questions in the science of subjective well-being. Collabra Psychol. 2018, 4, 15. [Google Scholar] [CrossRef] [PubMed]
  31. Diener, E.; Lucas, R.; Oishi, S. Subjective Well-being: The Science of Happiness and Life Satisfaction. In Handbook of Positive Psychology; Snyder, C., Lopez, S., Eds.; Oxford University Press: Oxford, UK, 2009. [Google Scholar]
  32. Kahneman, D.; Diener, E.; Schwarz, N. Foundations of Hedonic Psychology. Russell Sage Foundation. 1999. Available online: https://www.jstor.org/stable/10.7758/9781610443258 (accessed on 6 September 2023).
  33. Ma, W.; Vatsa, P.; Zheng, H. Cooking fuel choices and subjective well-being in rural China: Implications for a complete energy transition. Energy Policy 2022, 165, 112992. [Google Scholar] [CrossRef]
  34. Wu, S. The health impact of household cooking fuel choice on women: Evidence from China. Sustainability 2021, 13, 12080. [Google Scholar] [CrossRef]
  35. Ren, P.; Liu, X.; Li, F.; Zang, D. Clean Household Energy Consumption and Residents’ Well-Being: Empirical Analysis and Mechanism Test. Int. J. Environ. Res. Public Health 2022, 19, 14057. [Google Scholar] [CrossRef] [PubMed]
  36. Wang, X.; Bian, Y.; Zhang, Q. The effect of cooking fuel choice on the elderly’s well-being: Evidence from two non-parametric methods. Energy Econ. 2023, 125, 106826. [Google Scholar] [CrossRef]
  37. Liu, Z.; Li, J.; Rommel, J.; Feng, S. Health impacts of cooking fuel choice in rural China. Energy Econ. 2020, 89, 104811. [Google Scholar] [CrossRef]
  38. Zhang, L.; Xiao, Y.; Wu, Q.; Li, J. Will the use of solid fuels reduce the life satisfaction of rural residents—Evidence from China. Energy Sustain. Dev. 2022, 68, 94–102. [Google Scholar] [CrossRef]
  39. Shupler, M.; Baame, M.; Nix, E.; Tawiah, T.; Lorenzetti, F.; Saah, J.; Anderson de Cuevas, R.; Sang, E.; Puzzolo, E.; Mangeni, J.; et al. Multiple aspects of energy poverty are associated with lower mental health-related quality of life: A modelling study in three peri-urban African communities. SSM—Ment. Health 2022, 2, 100103. [Google Scholar] [CrossRef]
  40. Kapteyn, A.; Lee, J.; Tassot, C.; Vonkova, H.; Zamarro, G. Dimensions of Subjective Well-Being. Soc. Indic. Res. 2015, 123, 625–660. [Google Scholar] [CrossRef]
  41. Aktas, A.; Poblete-Cazenave, M.; Pachauri, S. Quantifying the impacts of clean cooking transitions on future health-age trajectories in South Africa. Environ. Res. Lett. 2022, 17, 055001. [Google Scholar] [CrossRef]
  42. Gallup. Worldwide Research Methodology and Codebook; Gallup: Washington, DC, USA, 2018. [Google Scholar]
  43. Leary, J.; Scott, N.; Leach, M.; Sigvaldsen, M.; Onjala, B.; Ochieng, S.; Sarin, S.; Batchelor, S.; Masibo, C.; Scott, P.; et al. Understanding the Impact of Electric Pressure Cookers (EPCs) in East Africa: A Synthesis of Data from Burn Manufacturing’s Early Piloting; Shell Foundation: London, UK, 2023. [Google Scholar]
  44. Njenga, M.; Gitau, J.K.; Mendum, R. Women’s work is never done: Lifting the gendered burden of firewood collection and household energy use in Kenya. Energy Res. Soc. Sci. 2021, 77, 102071. [Google Scholar] [CrossRef]
  45. WHO Burning Opportunity: Clean Household Energy for Health, Sustainable Development, and Wellbeing of Women and Children. 2016. Available online: https://www.afro.who.int/sites/default/files/2017-06/9789241565233_eng.pdf (accessed on 6 September 2023).
  46. Sanni, M.; Neureiter, K.; Raksit, A. How Innovation in Off-Grid Refrigeration Impacts Lives in Kenya; British International Investment: London, UK, 2019. [Google Scholar]
  47. IEA; IRENA; UNSD; The World Bank; WHO. Tracking SDG7: The Energy Progress Report; The World Bank: Washington, DC, USA, 2022. [Google Scholar]
  48. ESMAP. The State of Access to Modern Energy Cooking Services; World Bank: Washington, DC, USA, 2020; Available online: https://documents.worldbank.org/en/publication/documents-reports/documentdetail/937141600195758792/the-state-of-access-to-modern-energy-cooking-services (accessed on 15 March 2023).
  49. Field, A. Discovering Statistics Using SPSS; SAGE Publications: Thousand Oaks, CA, USA, 2009. [Google Scholar]
  50. Batchelor, S.; Brown, E.; Scott, N.; Leary, J. Two birds, one stone—Reframing cooking energy policies in Africa and Asia. Energies 2019, 12, 1591. [Google Scholar] [CrossRef]
  51. Pachauri, S.; Poblete-Cazenave, M.; Aktas, A.; Gidden, M.J. Access to clean cooking services in energy and emission scenarios after COVID-19. Nat. Energy 2021, 6, 1067–1076. [Google Scholar] [CrossRef]
Figure 1. Mean cooking frequency by gender at the global level (Gallup data set).
Energies 16 06739 g001
Figure 2. Relationship between the personal health index and the choice of clean cooking fuels-intensive cooks vs. non-cooks.
Energies 16 06739 g002
Figure 3. Relationship between the negative experience index and the choice of clean cooking fuels-intensive cooks vs. non-cooks.
Energies 16 06739 g003
Table 1. Regional distribution of countries in aggregated data set (number of countries in each region).
201820192020Total
Global10710074282
Africa36361890
Americas19151449
Eastern Mediterranean1111931
Europe26242171
South-East Asia76619
Western Pacific88622
Table 2. Description of wellbeing indices.
IndexMeasureDescription
Life Evaluation Index1–3A measure of respondents’ perceptions of where they stand now and in the future
Social Life Index0–100An assessment of respondent’s social support structure and opportunities to make friends
Financial Life Index0–100A measure of respondents’ personal economic situations and the economics of the community where they live
Local Economic Confidence Index−100 to +100An assessment of the economic conditions in respondents’ city today, and whether they think economic conditions in their city as a whole are getting better or worse
Personal Health Index0–100A measure of perceptions of one’s own health
Positive Experience Index0–100A measure of respondents’ experienced wellbeing on the day before the survey
Negative Experience Index0–100A measure of respondents’ experienced wellbeing on the day before the survey
Daily Experience Index0–100A measure of respondents’ experienced wellbeing on the day before the survey
Civic Engagement Index0–100An assessment of respondents’ inclination to volunteer their time and assistance to others. It is also a measure of respondent’s commitment to the community where he or she lives
Table 3. Correlation of indices with proportion of population using Clean Cooking Fuels (global).
IndexPearson’s r
Financial Life0.182 **
Local Economic Confidencen/s
Personal Health0.361 ***
Social Life0.376 ***
Civic Engagement−0.299 ***
Life Evaluation0.347 ***
Positive Experiencen/s
Negative Experience−0.313 ***
Daily Experience0.248 ***
** p < 0.01; *** p < 0.001; n/s—Not statistically significant.
Table 4. Relationship between income per capita and GDP per capita, PPP.
Region Pearson’s r
World0.826 ***
Africa0.611 ***
Americas0.514 ***
Europe0.884 ***
South-East Asia0.463 *
Western Pacific0.880 ***
Eastern Mediterranean0.938 ***
* p < 0.05; *** p < 0.001.
Table 5. Household demographic variables in the Gallup data set.
VariableCoding
Income per capitaContinuous (PPP USD)
AgeInteger
Education level1 = completed elementary education or less (up to 8 years of basic education); 2 = secondary education-three-year secondary education and some years beyond secondary education (9 to 15 years of education); 3 = completed 4 years of education beyond high school and/or received a 4-year college degree
Children under 15Integer
Residents over 15Integer
Access to internet1 = yes; 2 = no
Employment1 = unemployed; 2 = part-time employed (self-employed or working for an employer); 3 = Full-time employed ((self-employed or working for an employer)
Rural/urban1 = rural; 2 = urban
Table 6. Proportion of population with primary reliance on fuels for cooking, by fuel type.
AfricaAmericasEastern
Mediterranean
EuropeSouth-East AsiaWestern PacificTotal
Biomass60.8%9.6%22.1%7.5%33.1%20.4%29.1%
Charcoal14.7%1.4%2.3%0.0%0.4%0.8%3.2%
Coal0.4%0.0%0.1%0.6%0.9%1.6%0.8%
Electricity6.4%2.5%1.0%15.9%1.2%28.9%10.4%
Gas12.4%84.4%70.3%65.7%62.7%45.3%52.9%
Kerosene3.0%0.1%0.5%3.4%0.5%0.1%1.0%
Clean fuels18.8%87.0%71.3%81.6%63.9%74.2%63.4%
Table 7. Wellbeing Indices—Relationships with the proportion of population using different cooking fuels.
Pearson’s r
Cooking FuelPersonal HealthLife
Evaluation
Social LifeNegative
Experience
Civic
Engagement
Biomass−0.373 ***−0.371 ***−0.360 ***0.292 ***0.227 ***
Charcoal−0.350 ***−0.195 ***−0.384 ***0.323 ***0.290 ***
Coal0.197 ***n/sn/s−0.189 **n/s
Electricity0.331 ***0.211 ***0.273 ***−0.373 ***n/s
Gas0.173 **0.197 ***0.221 ***n/s−0.236 ***
Kerosenen/sn/sn/sn/s0.122 *
Clean Fuels0.367 ***0.323 ***0.380 ***−0.315 ***−0.299 ***
* p < 0.05; ** p < 0.01; *** p < 0.001; n/s—Not statistically significant.
Table 8. Income per Capita—Relationships with other demographic variables (country means).
Demographic VariablesPearson’s r
Age0.617 ***
Education level0.665 ***
Children under 15−0.547 ***
Residents over 15−0.350 ***
Access to the Internet0.665 ***
Employment0.259 ***
Rural/urban0.447 ***
*** p < 0.001.
Table 9. Regression—Personal health index and choice of clean cooking fuels.
ModelUnstandardized
Coefficients
Standardized CoefficientstSig.
BStd. ErrorBeta
1(Constant)54.5186.551 8.322<0.001
Income per capita0.0000.0000.2282.7850.006
Age−0.3310.106−0.274−3.1340.002
Education level7.2572.0840.2733.482<0.001
Rural/urban−12.3613.140−0.362−3.937<0.001
Employment10.9112.1200.3165.146<0.001
Choice of clean fuels0.1330.0220.6485.968<0.001
Dependent Variable: Personal health index. R2 = 0.408; F(6, 177) = 20.309, p < 0.001.
Table 10. Regression—Life evaluation index and choice of clean cooking fuels.
ModelUnstandardized
Coefficients
Standardized CoefficientstSig.
BStd. ErrorBeta
1(Constant)1.1750.199 5.900<0.001
Children under 150.0570.0230.3332.4900.014
Residents over 15−0.0900.026−0.343−3.500<0.001
Access to internet0.3290.1060.3223.1020.002
Rural/urban0.1350.0620.1522.1990.029
Employment0.2020.0870.2352.3290.021
Choice of clean fuels0.0000.0010.0690.5280.598
Dependent Variable: Life evaluation index. R2 = 0.302; F(5, 211) = 18.260, p < 0.001.
Table 11. Regression analysis—Social life index and choice of clean cooking fuels.
ModelUnstandardized
Coefficients
Standardized CoefficientstSig.
BStd. ErrorBeta
1(Constant)39.3904.749 8.294<0.001
Age0.2810.0840.2113.352<0.001
Employment11.9041.8750.3336.349<0.001
Choice of clean fuels0.0710.0150.3044.789<0.001
Dependent Variable: Social life index. R2 = 0.281; F(3, 260) = 34.690; p < 0.001.
Table 12. Regression—Negative experience index and choice of clean cooking fuels.
ModelUnstandardized
Coefficients
Standardized CoefficientstSig.
BStd. ErrorBeta
1(Constant)51.7665.841 8.863<0.001
Income per capita0.0000.000−0.183−2.5460.012
Education level−14.8252.133−0.511−6.951<0.001
Rural/urban19.9433.2110.5366.211<0.001
Employment−8.2432.169−0.219−3.800<0.001
Choice of clean fuels−0.0970.021−0.436−4.639<0.001
Dependent Variable: Negative experience index. R2 = 0.476; F(5, 178) = 32.320, p < 0.001.
Table 13. Regression—Civic engagement index and choice of clean cooking fuels.
ModelUnstandardized
Coefficients
Standardized CoefficientstSig.
BStd. ErrorBeta
1(Constant)41.2434.292 9.610<0.001
Age−0.5010.089−0.358−5.604<0.001
Education level8.3371.7060.3024.888<0.001
Choice of clean fuels−0.0640.018−0.256−3.512<0.001
Dependent Variable: Civic engagement index. R2 = 0.260; F(3, 269) = 31.488, p < 0.001.
Table 14. Wellbeing indices for intensive cooks and non-cooks (medians).
Personal HealthLife
Evaluation
Social LifeNegative
Experience
Civic
Engagement
Intensive cooks67.32.1880.232.032.4
Non-cooks71.92.2082.128.131.4
Difference (non-cooks—intensive cooks)4.60.021.9−3.9−1.0
Table 15. Regression—Personal health index as an outcome variable.
ModelUnstandardized
Coefficients
Standardized CoefficientstSig.
BStd. ErrorBeta
1(Constant)55.0246.331 8.692<0.001
Income per capita0.0010.0000.2483.1380.002
Age−0.4190.105−0.347−3.986<0.001
Education level6.8372.0180.2573.388<0.001
Employment10.3802.0540.3005.053<0.001
Rural/urban−12.8493.011−0.376−4.267<0.001
Choice of clean fuels0.0840.0260.4073.2620.001
Access to electricity0.0990.0280.3643.583<0.001
Dependent Variable: Personal health index. R2 = 0.449; F(7, 177) = 20.596; p < 0.001.
Table 16. Regression—Life evaluation index as an outcome variable.
ModelUnstandardized
Coefficients
Standardized CoefficientstSig.
BStd. ErrorBeta
1(Constant)1.1600.197 5.897<0.001
Children under 150.0820.0260.4803.1290.002
Residents over 15−0.1180.029−0.446−4.006<0.001
Access to the Internet0.2930.1070.2872.7440.007
Employment0.1340.0610.1512.2040.029
Rural/urban0.2020.0850.2352.3610.019
Choice of clean fuels0.0000.001−0.032−0.2300.818
Access to electricity0.0020.0010.2421.8780.062
Dependent Variable: Life evaluation index. R2 = 0. 338; F(7, 181) = 13.228; p < 0.001.
Table 17. Regression—Social life index as an outcome variable.
ModelUnstandardized
Coefficients
Standardized CoefficientstSig.
BStd. ErrorBeta
1(Constant)38.2114.608 8.293<0.001
Age0.2160.0830.1632.6120.010
Employment10.5661.8380.2965.748<0.001
Choice of clean fuels0.0080.0210.0350.3890.698
Access to electricity0.1200.0300.3644.057<0.001
Dependent Variable: Social life index. R2 = 0. 325; F(4, 268) = 32.275; p < 0.001.
Table 18. Regression—Negative experience index as an outcome variable.
ModelUnstandardized
Coefficients
Standardized CoefficientstSig.
BStd. ErrorBeta
1(Constant)53.1115.821 9.123<0.001
Income per capita0.0000.000−0.180−2.5260.012
Education level−14.6032.119−0.503−6.890<0.001
Employment−7.9862.158−0.212−3.701<0.001
Rural/urban19.9513.1630.5366.309<0.001
Choice of clean fuels−0.0690.026−0.308−2.6010.010
Access to electricity−0.0480.028−0.162−1.7050.090
Dependent Variable: Negative experience index. R2 = 0.485; F(6, 178) = 27.901; p < 0.001.
Table 19. Regression—Civic engagement index as an outcome variable.
ModelUnstandardized
Coefficients
Standardized CoefficientstSig.
BStd. ErrorBeta
1(Constant)40.5724.261 9.521<0.001
Age−0.5230.092−0.376−5.709<0.001
Education level7.8011.7490.2834.461<0.001
Choice of clean fuels−0.0830.023−0.333−3.542<0.001
Access to electricity0.0430.0330.1231.3010.195
Dependent Variable: Civic engagement index. R2= 0.262; F(4, 271) = 23.992; p < 0.001.
Disclaimer/Publisher’s Note: The statements, opinions and data contained in all publications are solely those of the individual author(s) and contributor(s) and not of MDPI and/or the editor(s). MDPI and/or the editor(s) disclaim responsibility for any injury to people or property resulting from any ideas, methods, instructions or products referred to in the content.

