Energy and Stochastic Economic Assessments of Photovoltaic Systems in the East Midlands
Abstract
:1. Introduction
2. PV System Designs
2.1. Building Description
2.2. Weather Conditions
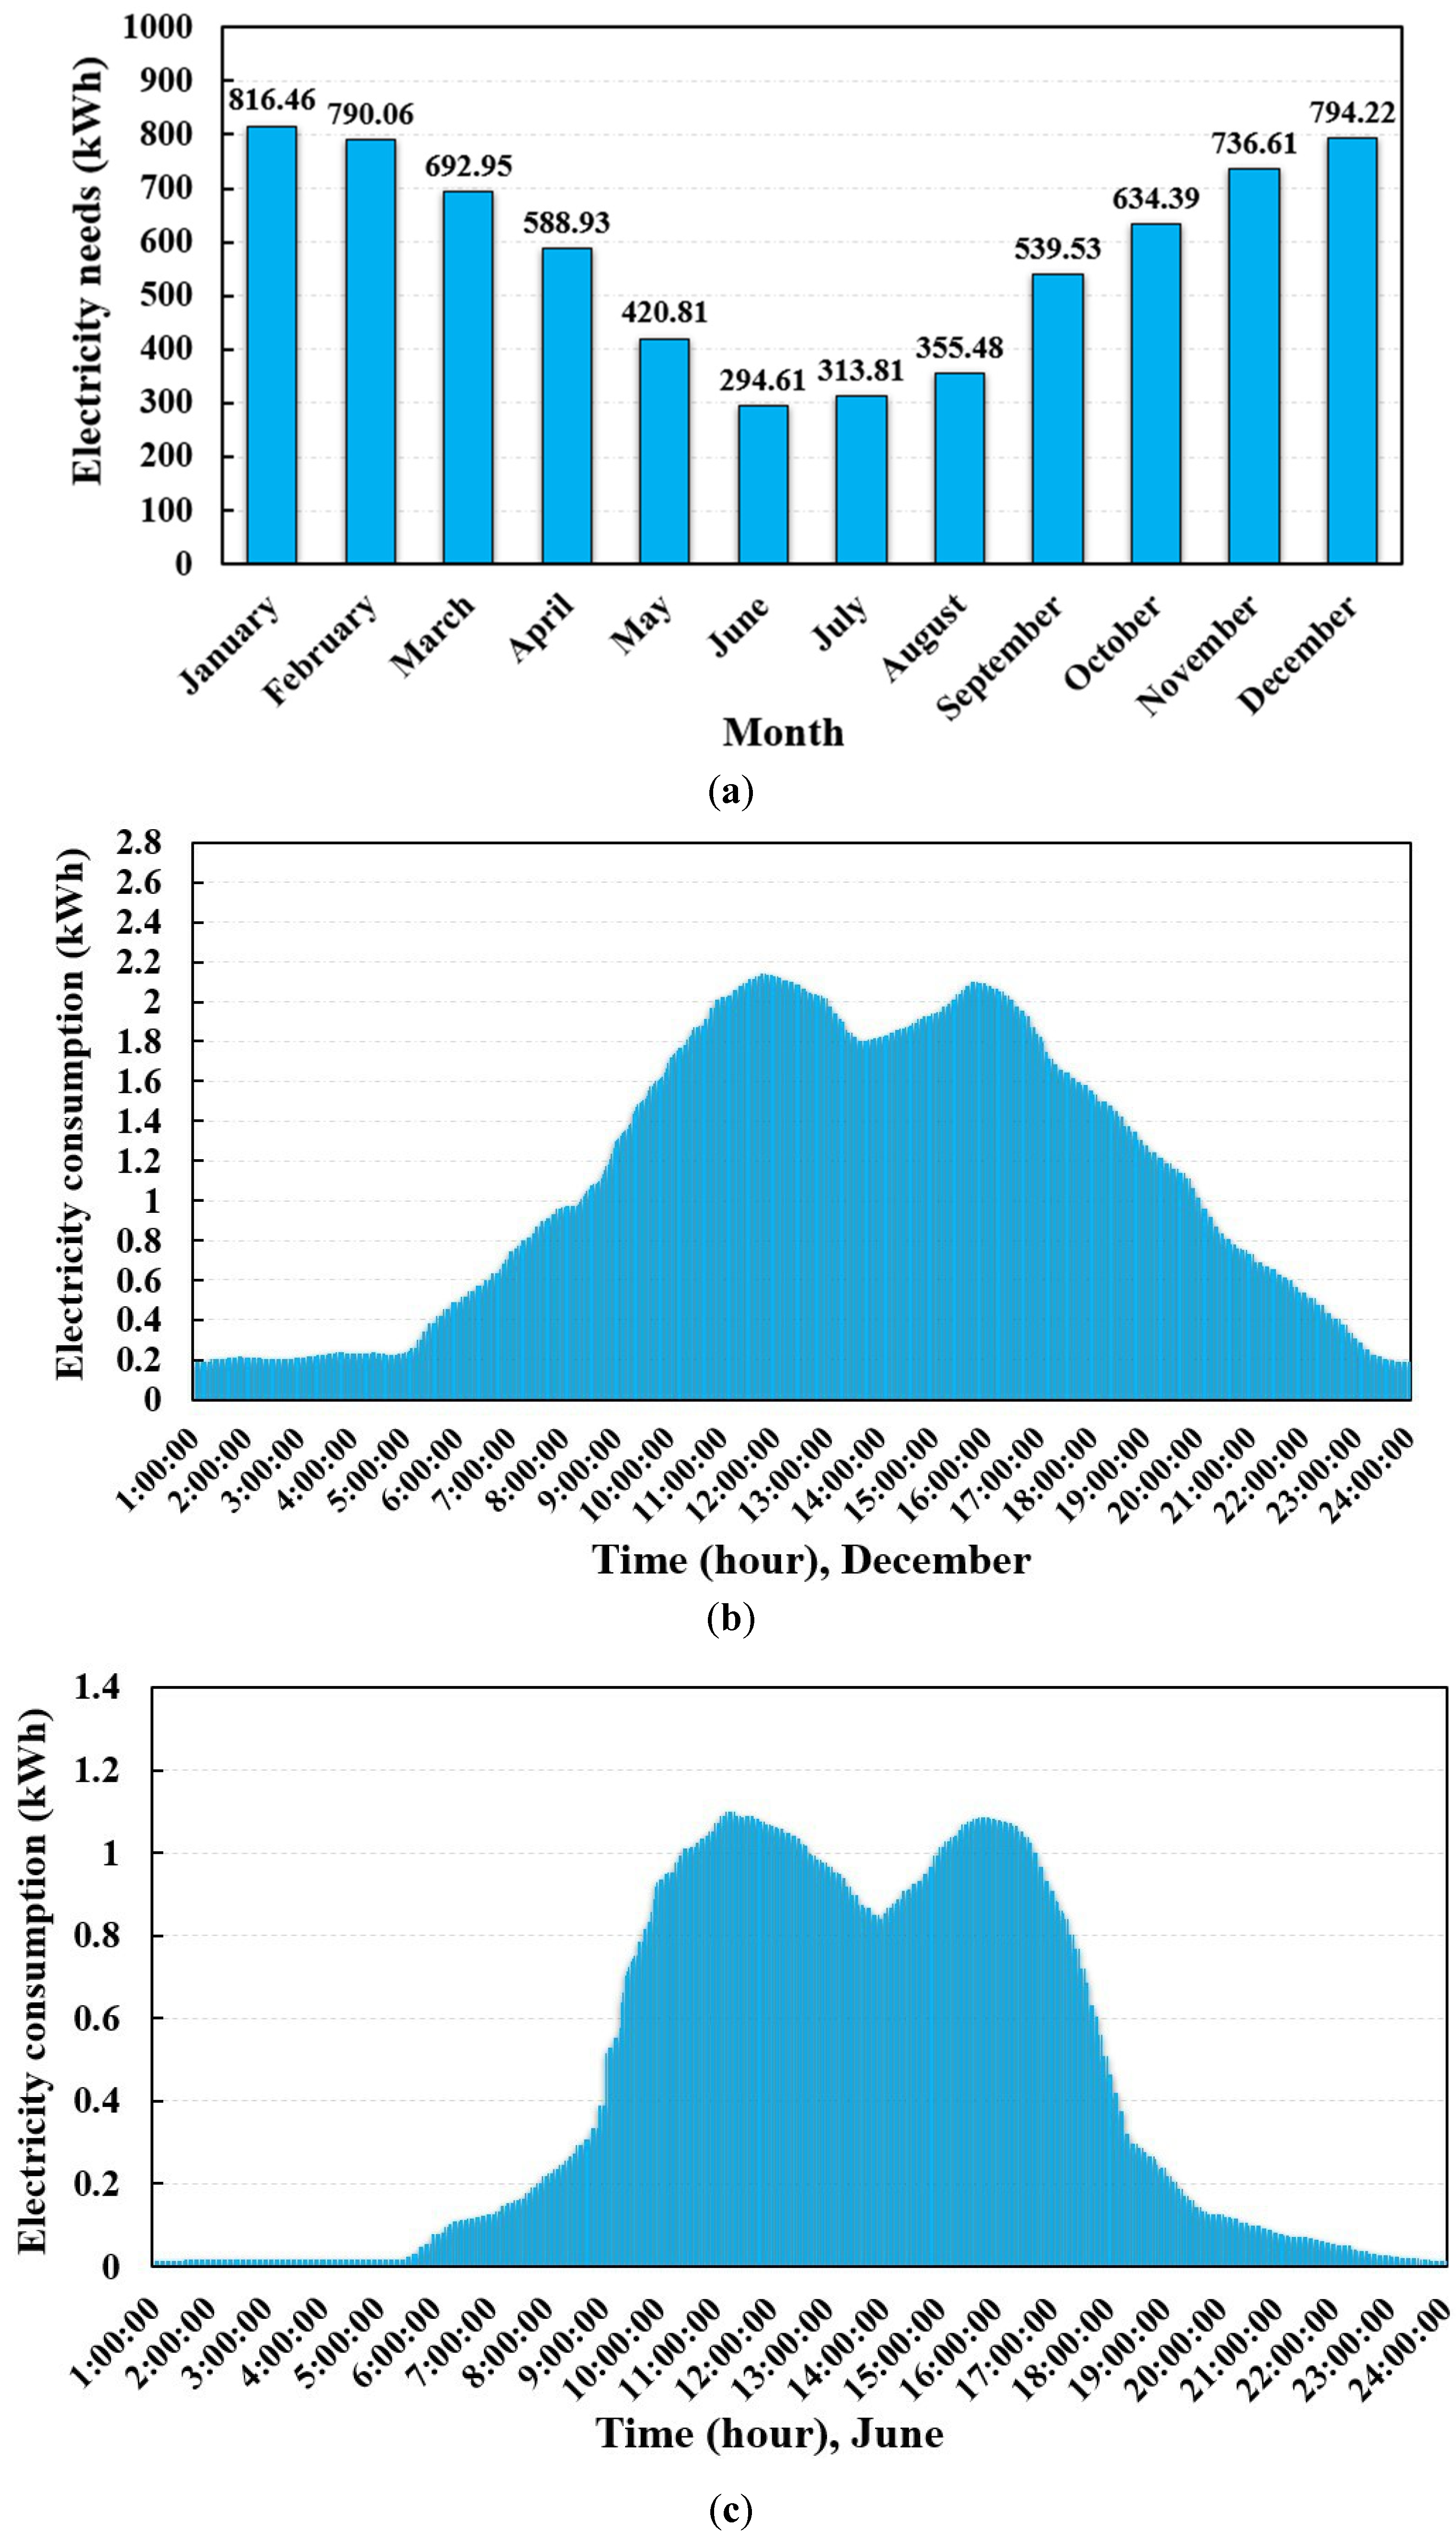
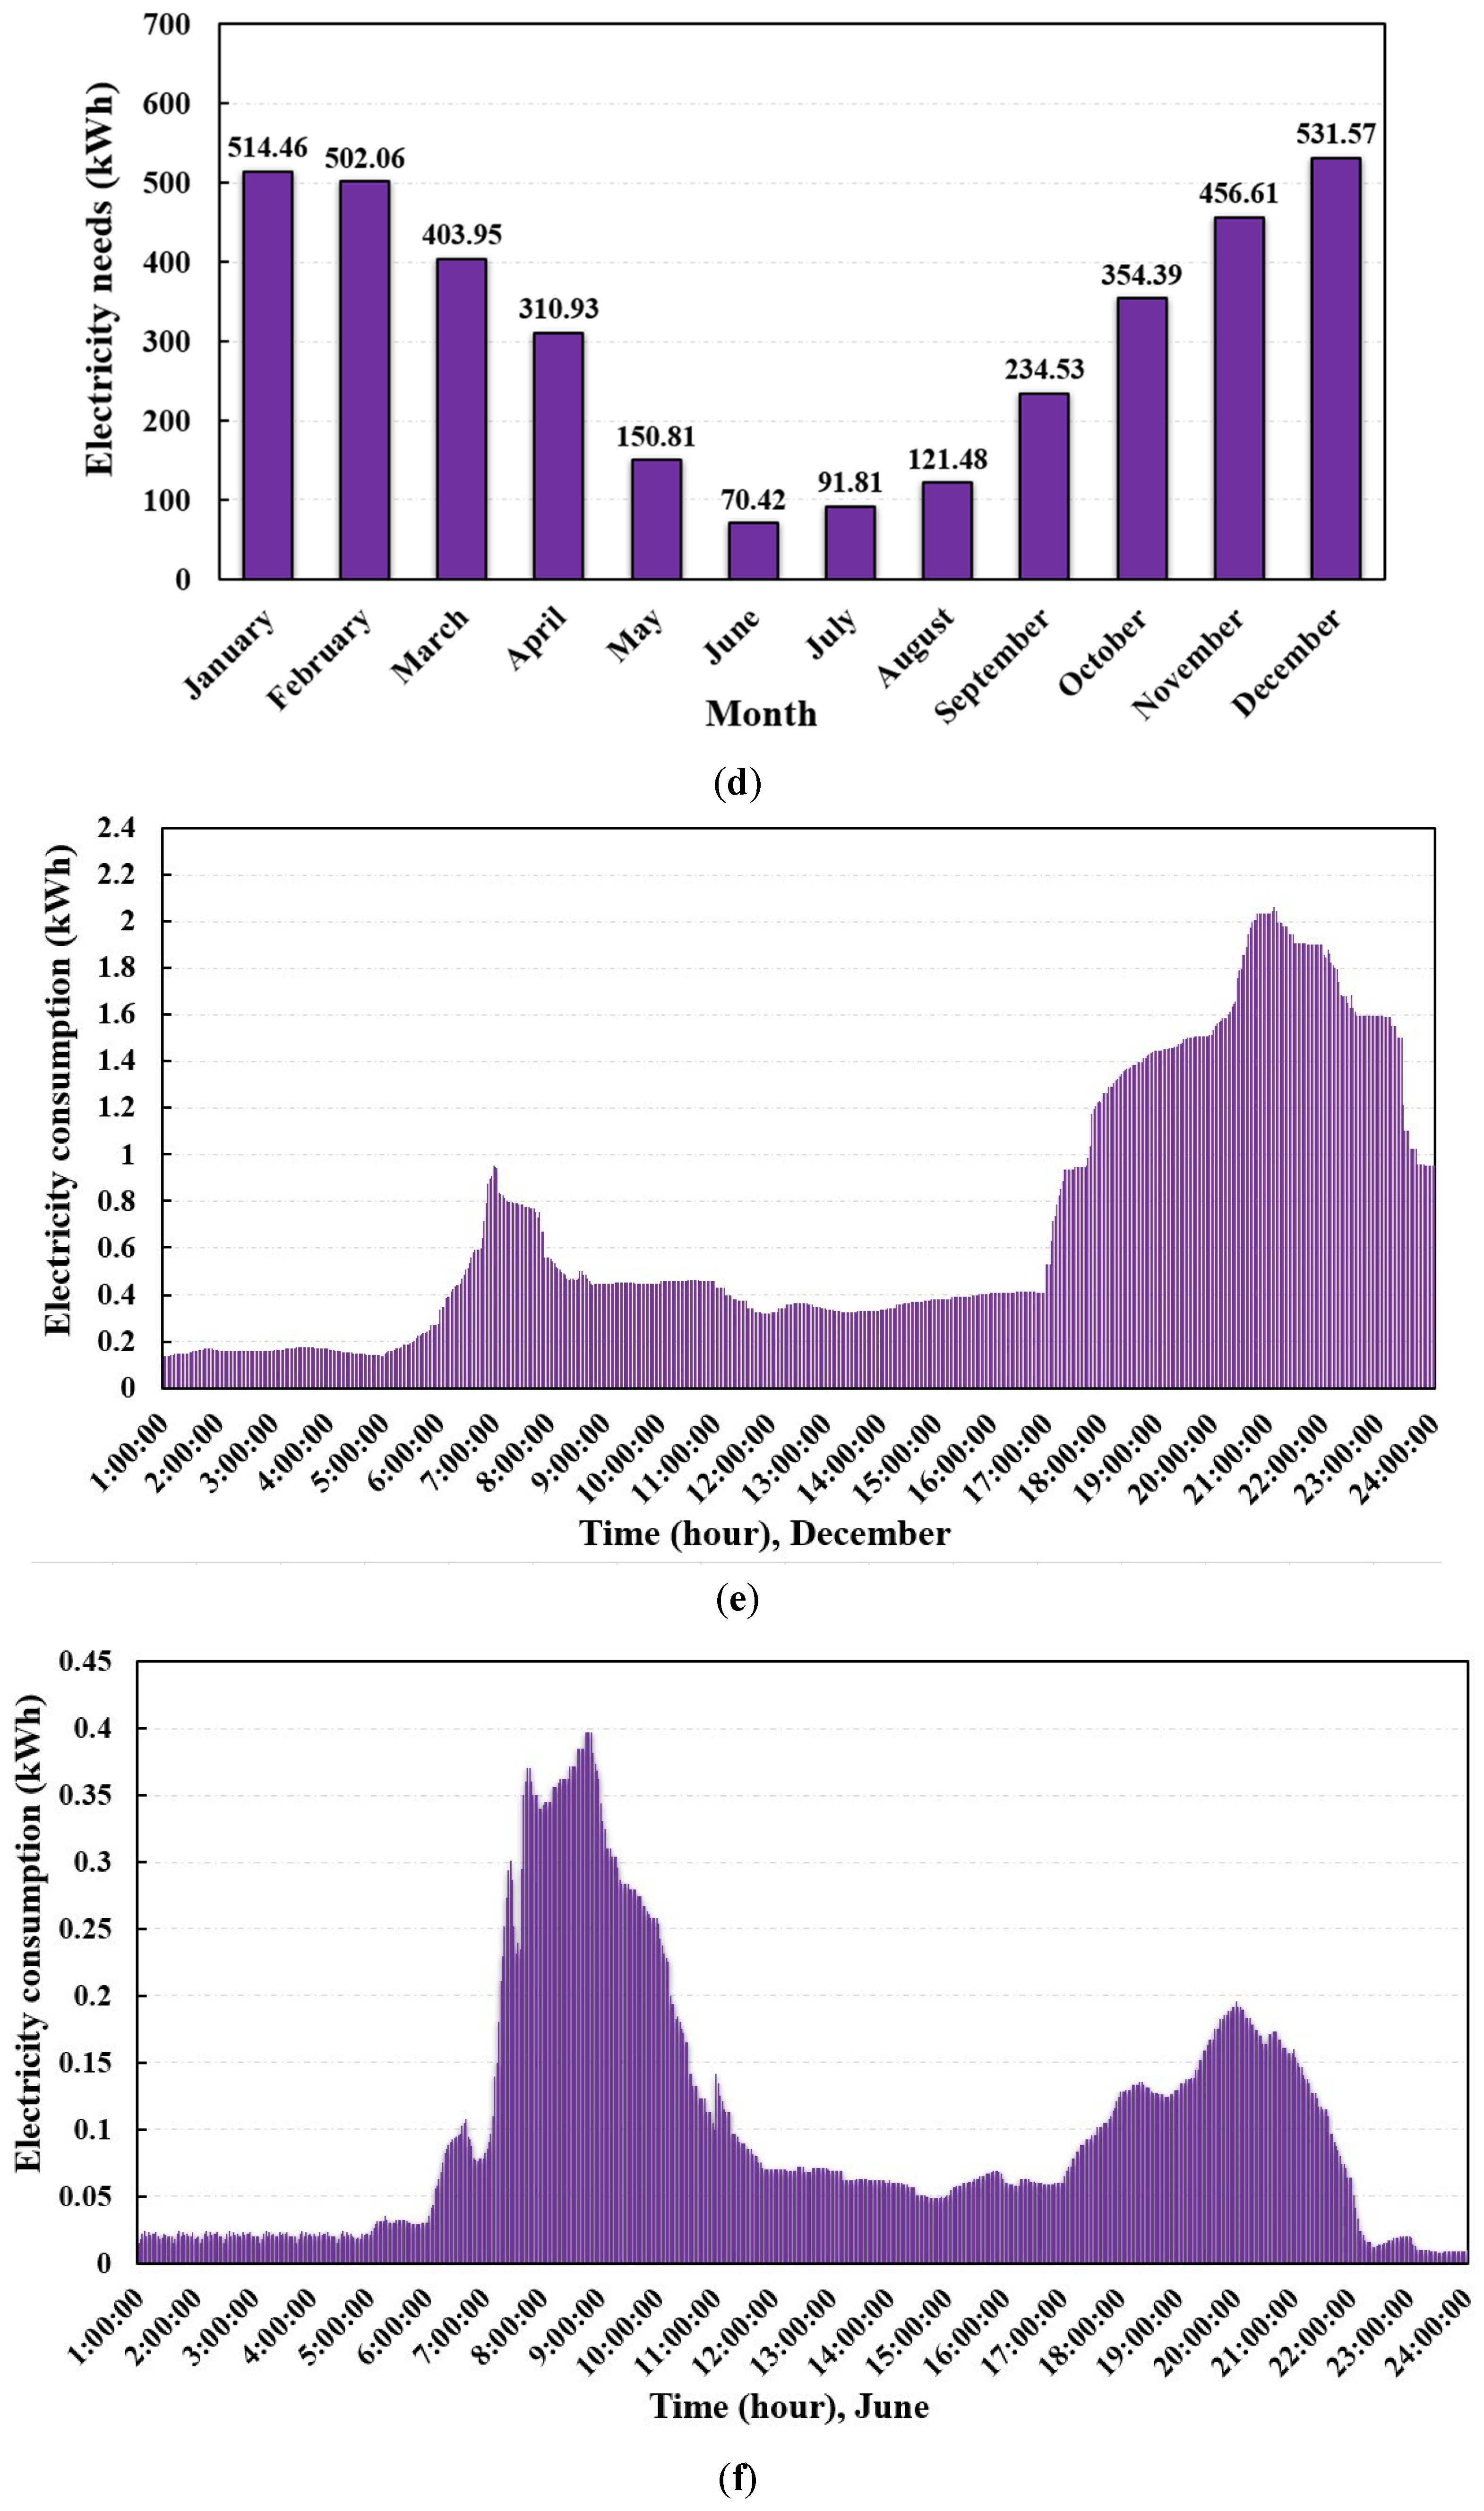
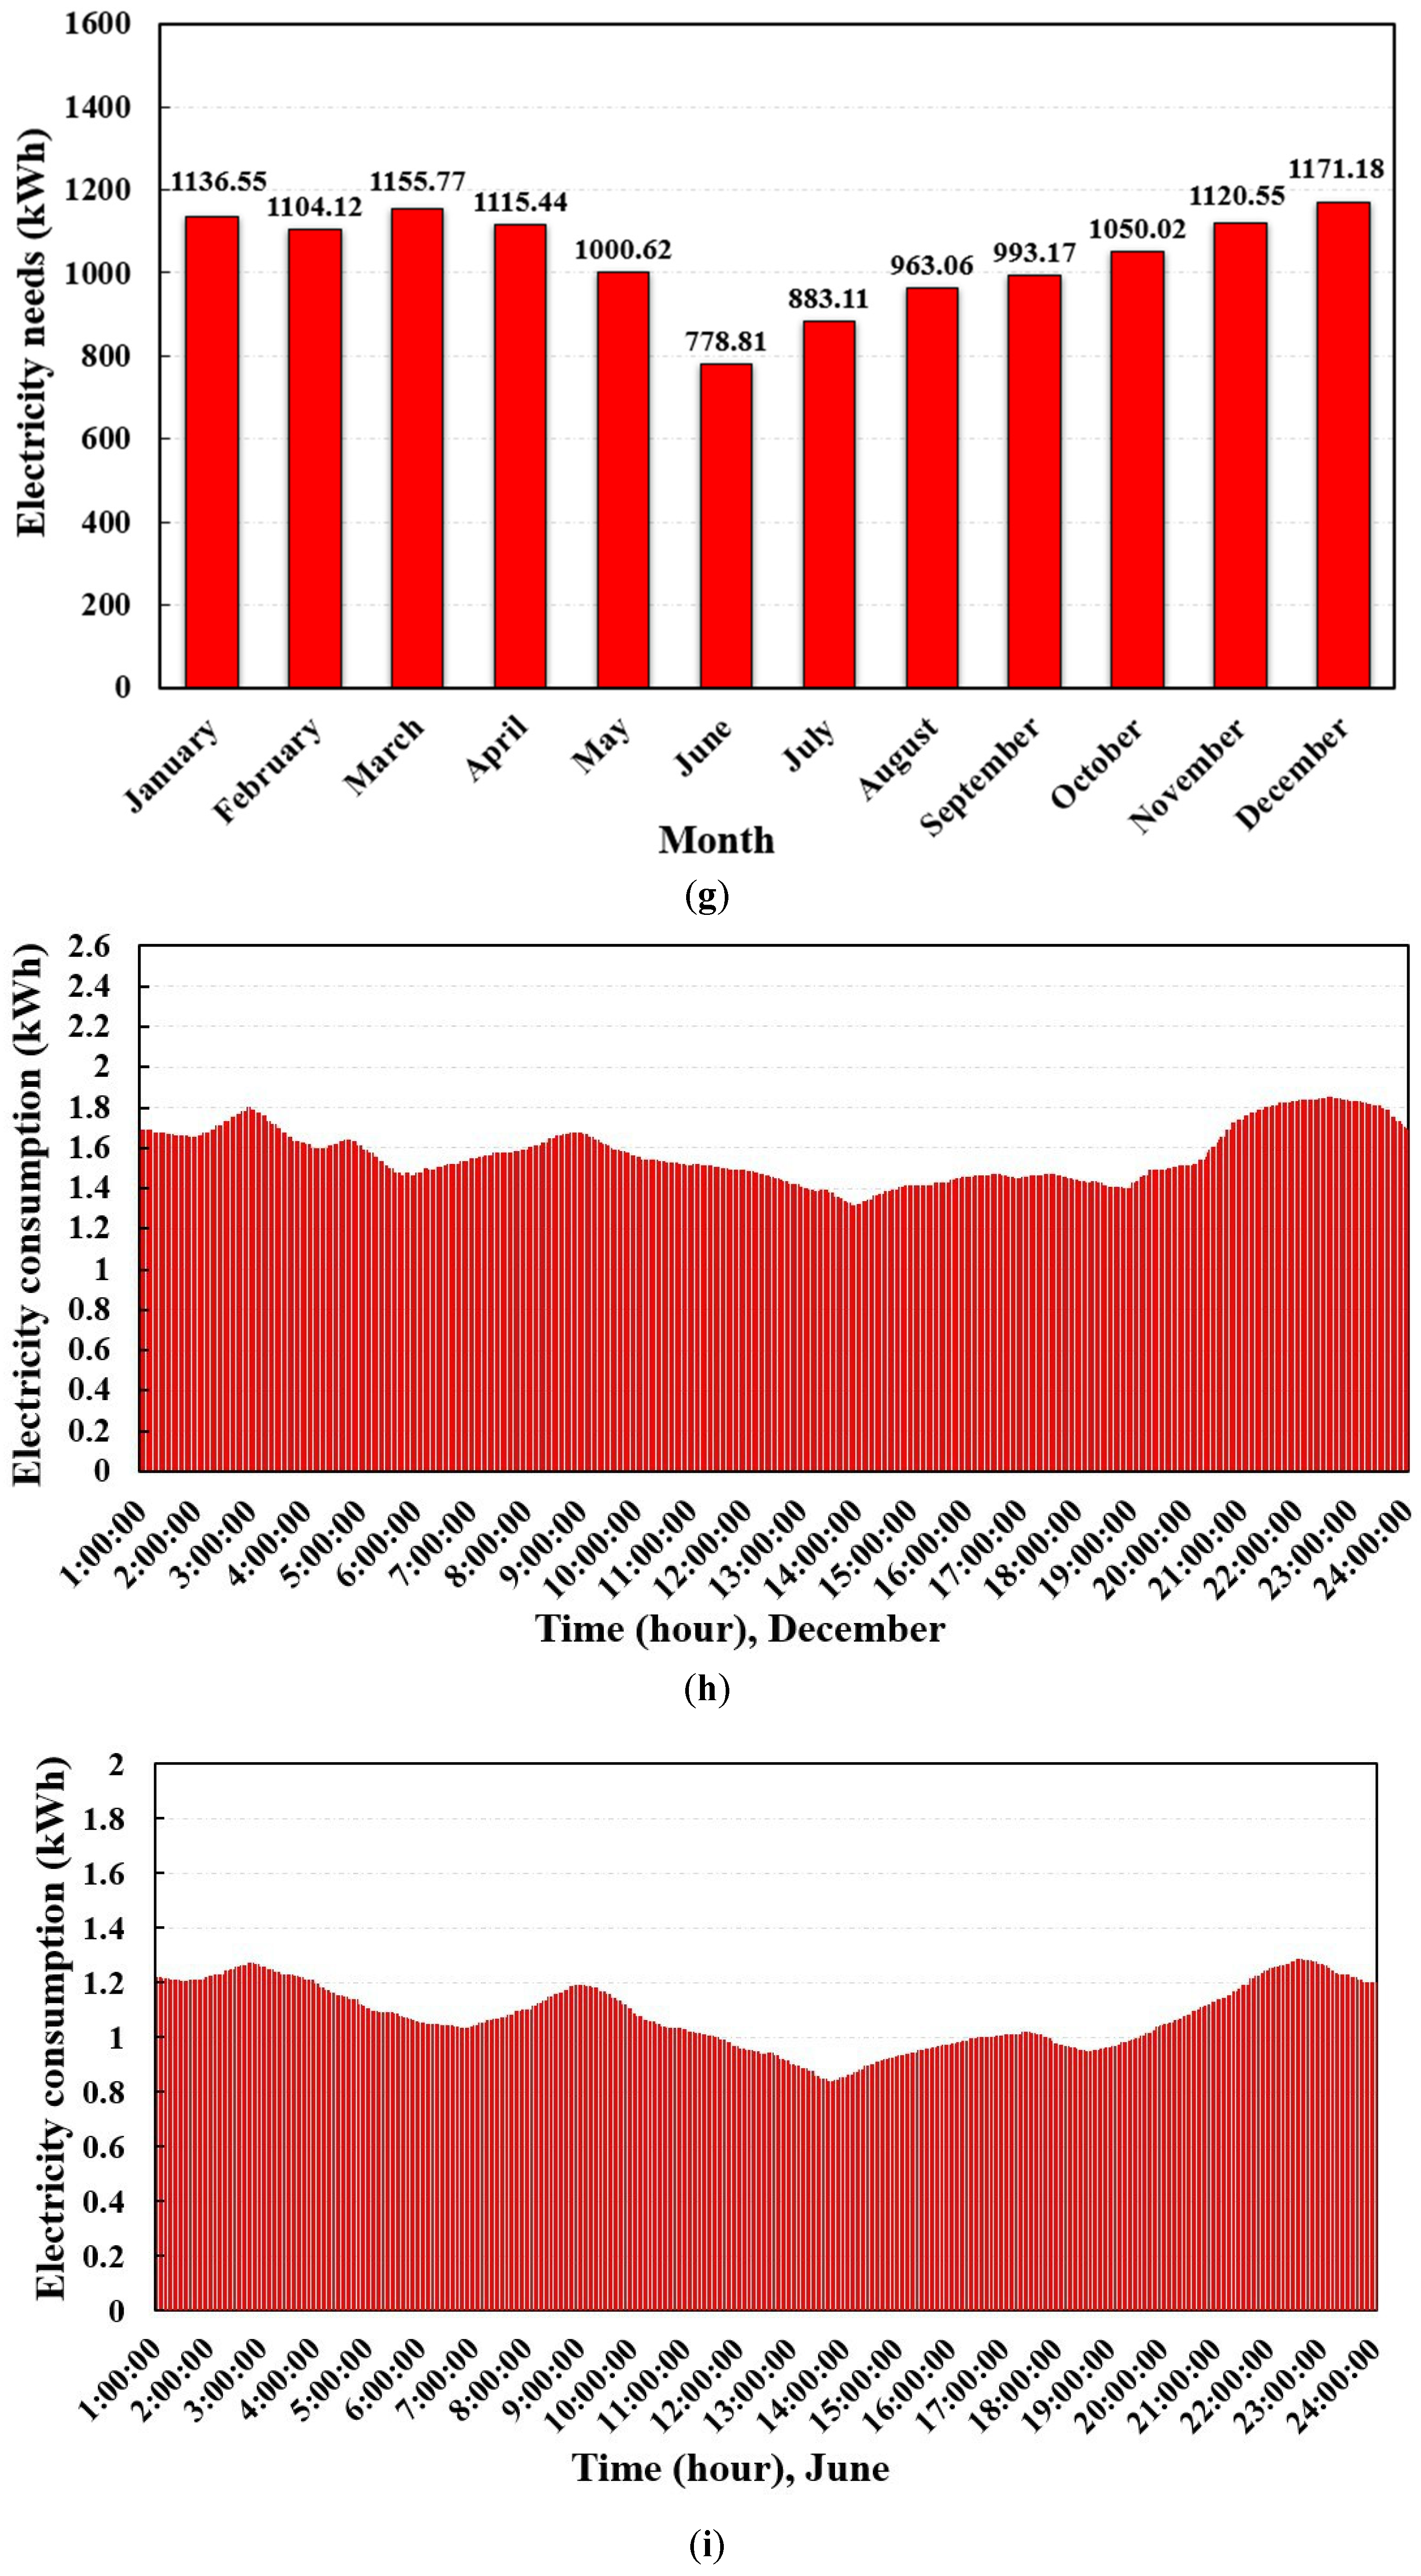
2.3. Electricity Consumption
2.4. System Specifications
2.5. Initial Investment and UK Government Subsidies
3. Energy Models
3.1. Radiation on a Tilted Plane
3.2. Shading Losses
3.3. PV Module Model
3.4. Inverter, Cable, and Other Losses
4. Economic Models
4.1. Net Present Value and Payback Period
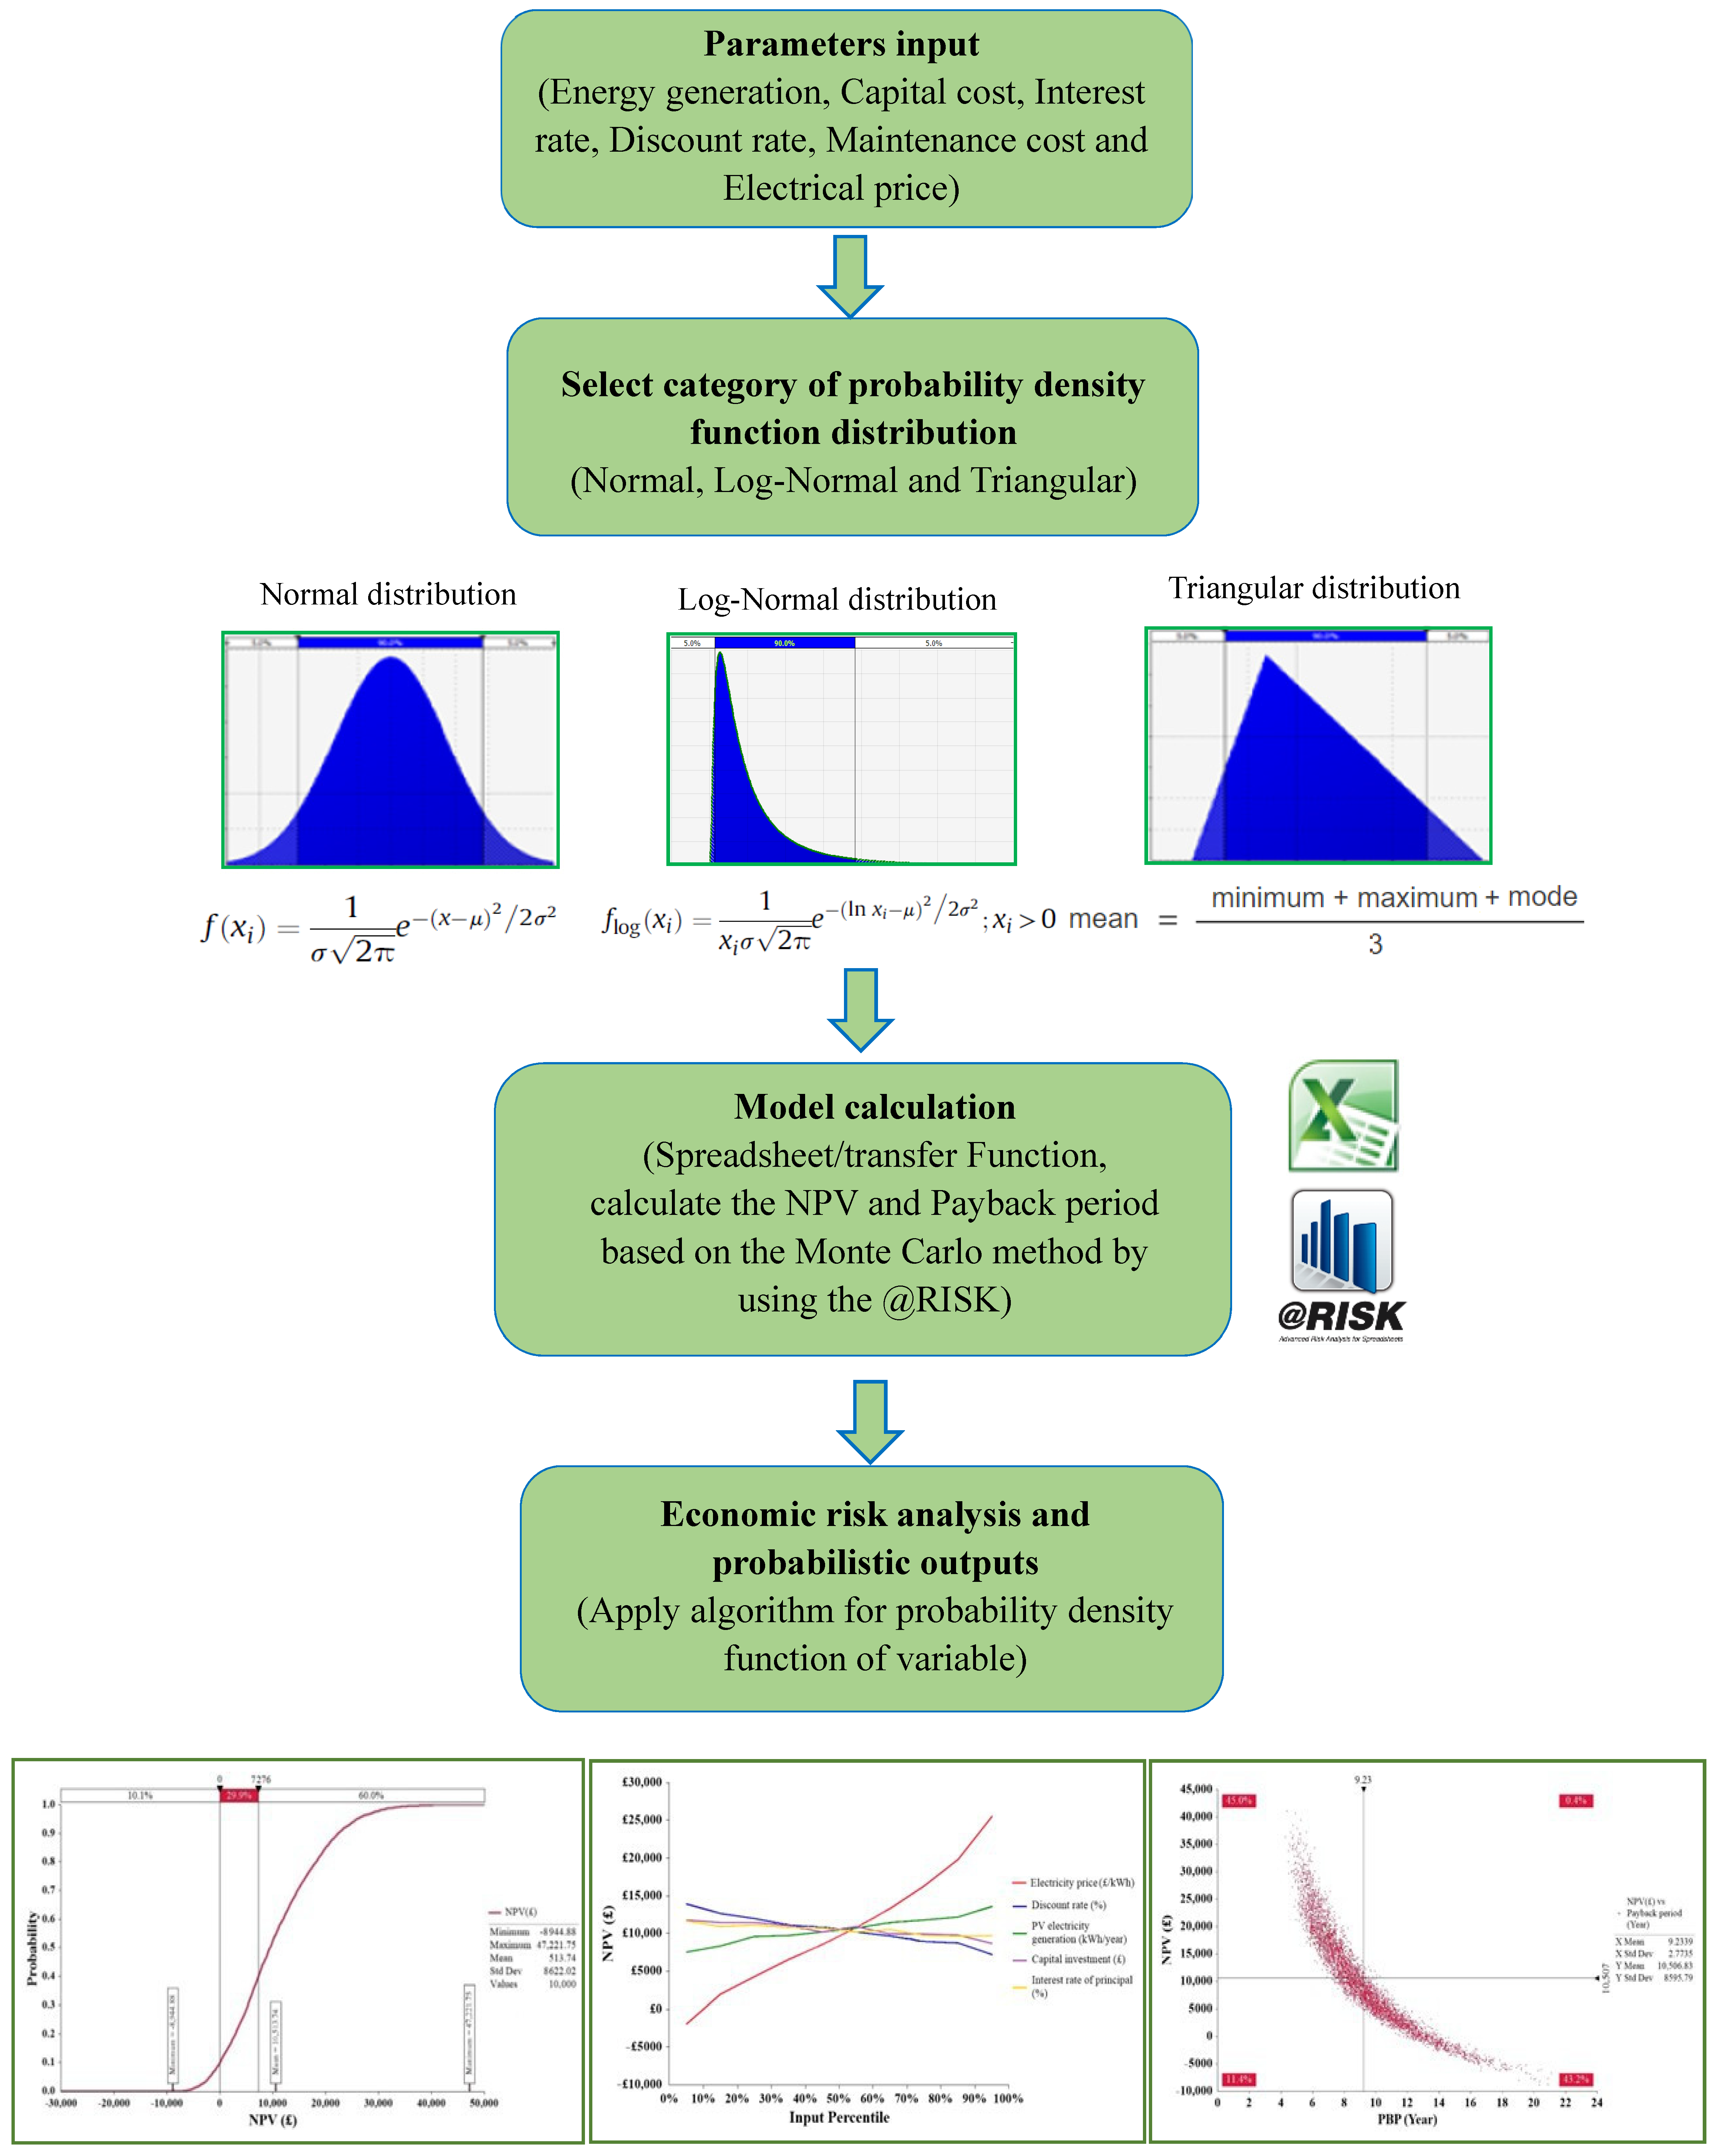
4.2. Monte Carlo Method
5. Results and Discussion
5.1. Energy Performance
5.1.1. Office Building
5.1.2. Domestic Building
5.1.3. Poultry Shed
5.1.4. PV Temperature and Efficiency
5.2. Economic Performance
5.2.1. Results for the 25-Year Operating Period
5.2.2. Sensitivity Analyses of NPV and PBP
5.3. Profitable Analyses of FiT and SEG Schemes
6. Conclusions
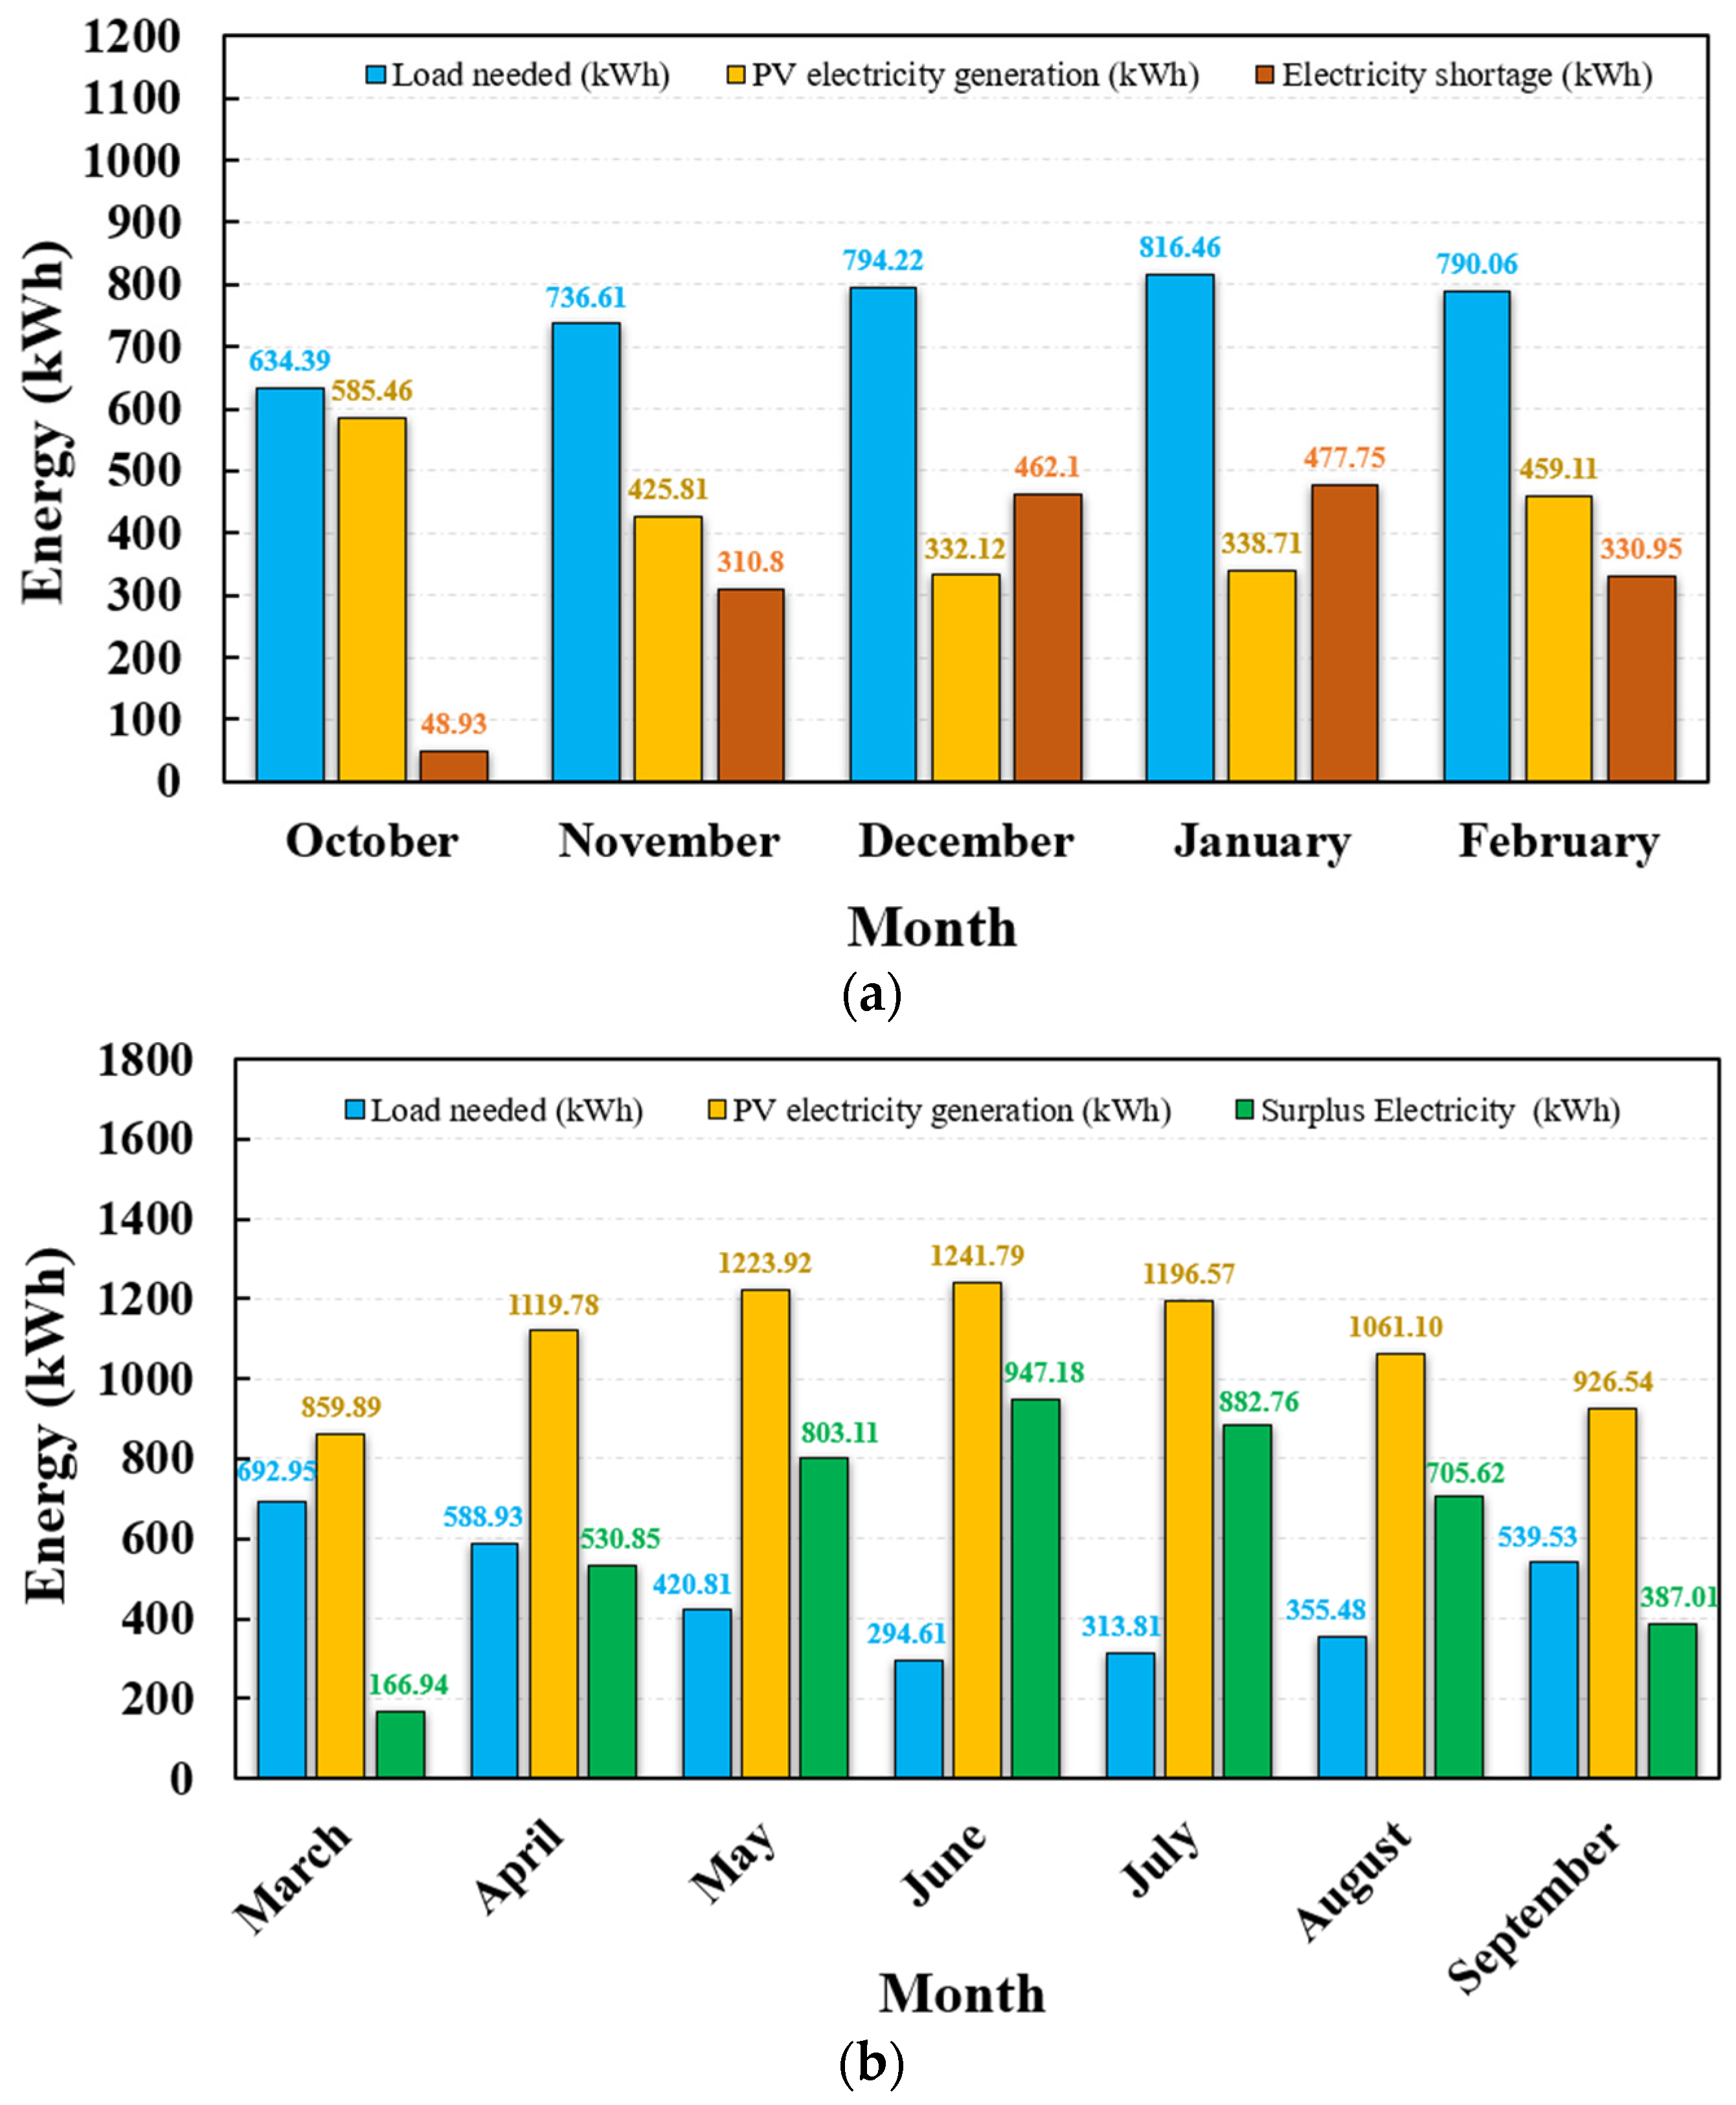
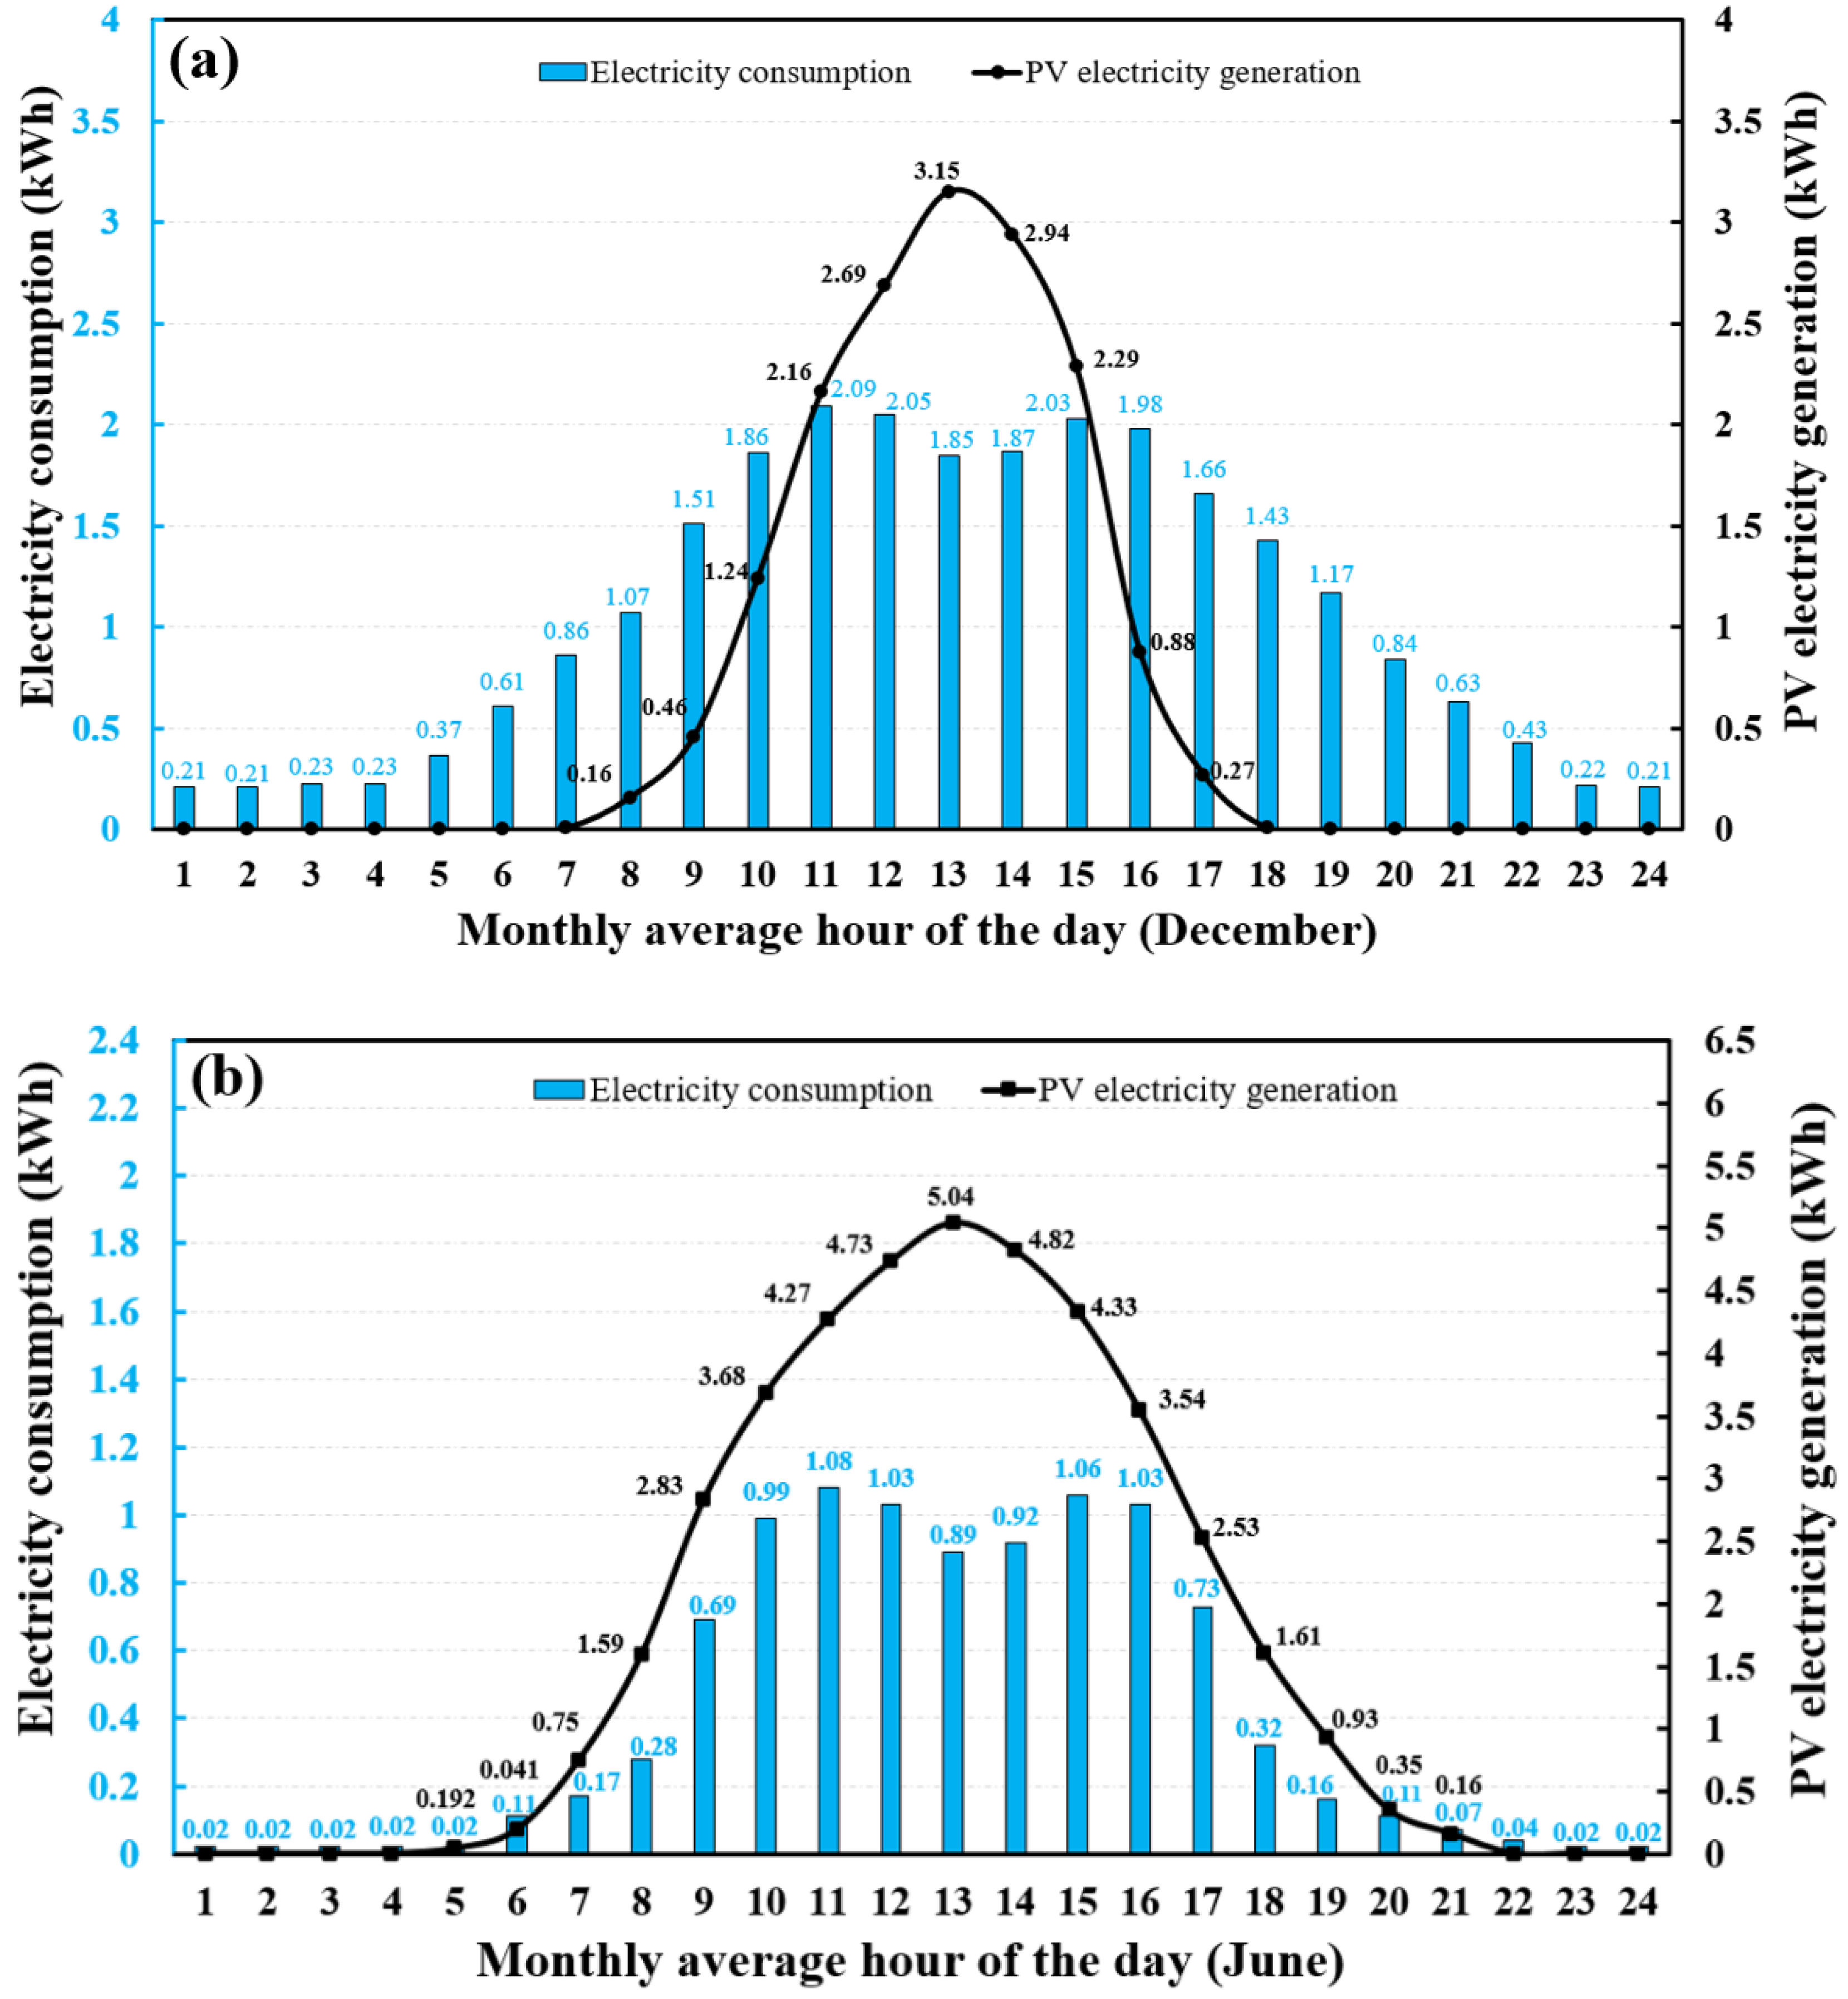
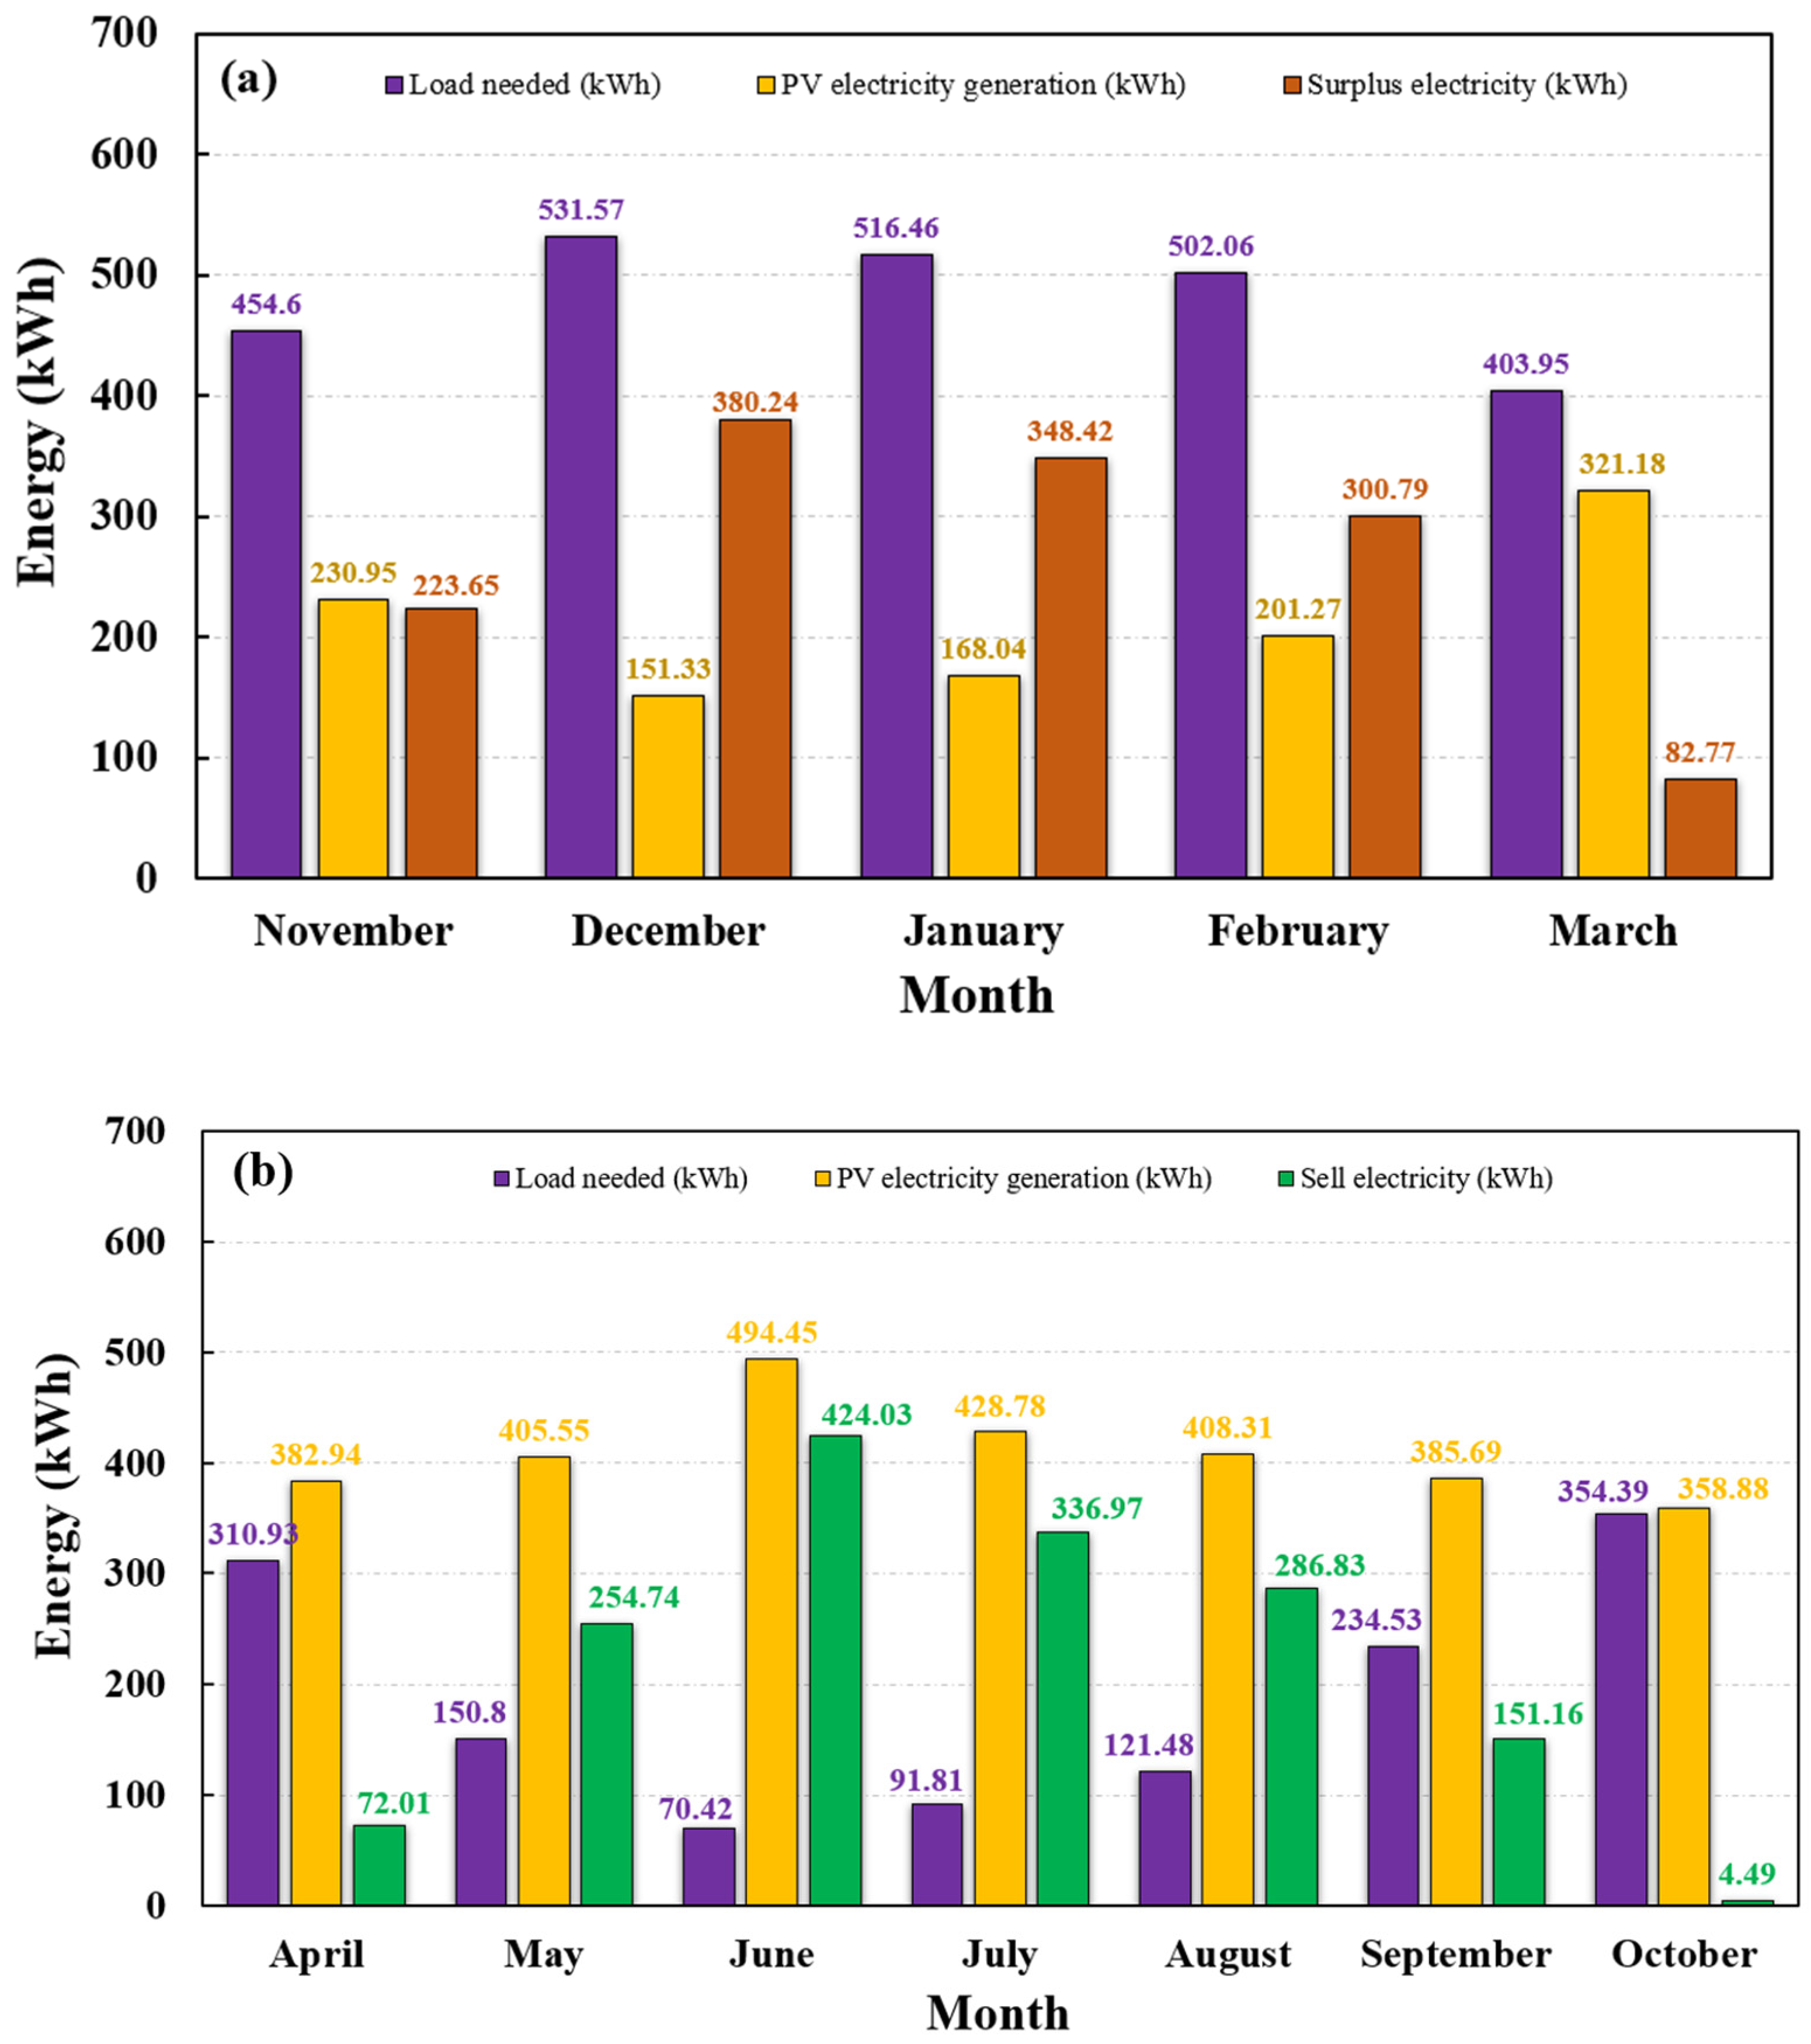
- The highest and lowest electricity production periods of PV systems occur in June and December, reaching 1241.79 kWh and 332.12 kWh for the office building, 494.45 kWh and 151.33 kWh for the domestic building, as well as 1890.32 kWh and 484.94 kWh for the poultry shed, respectively.
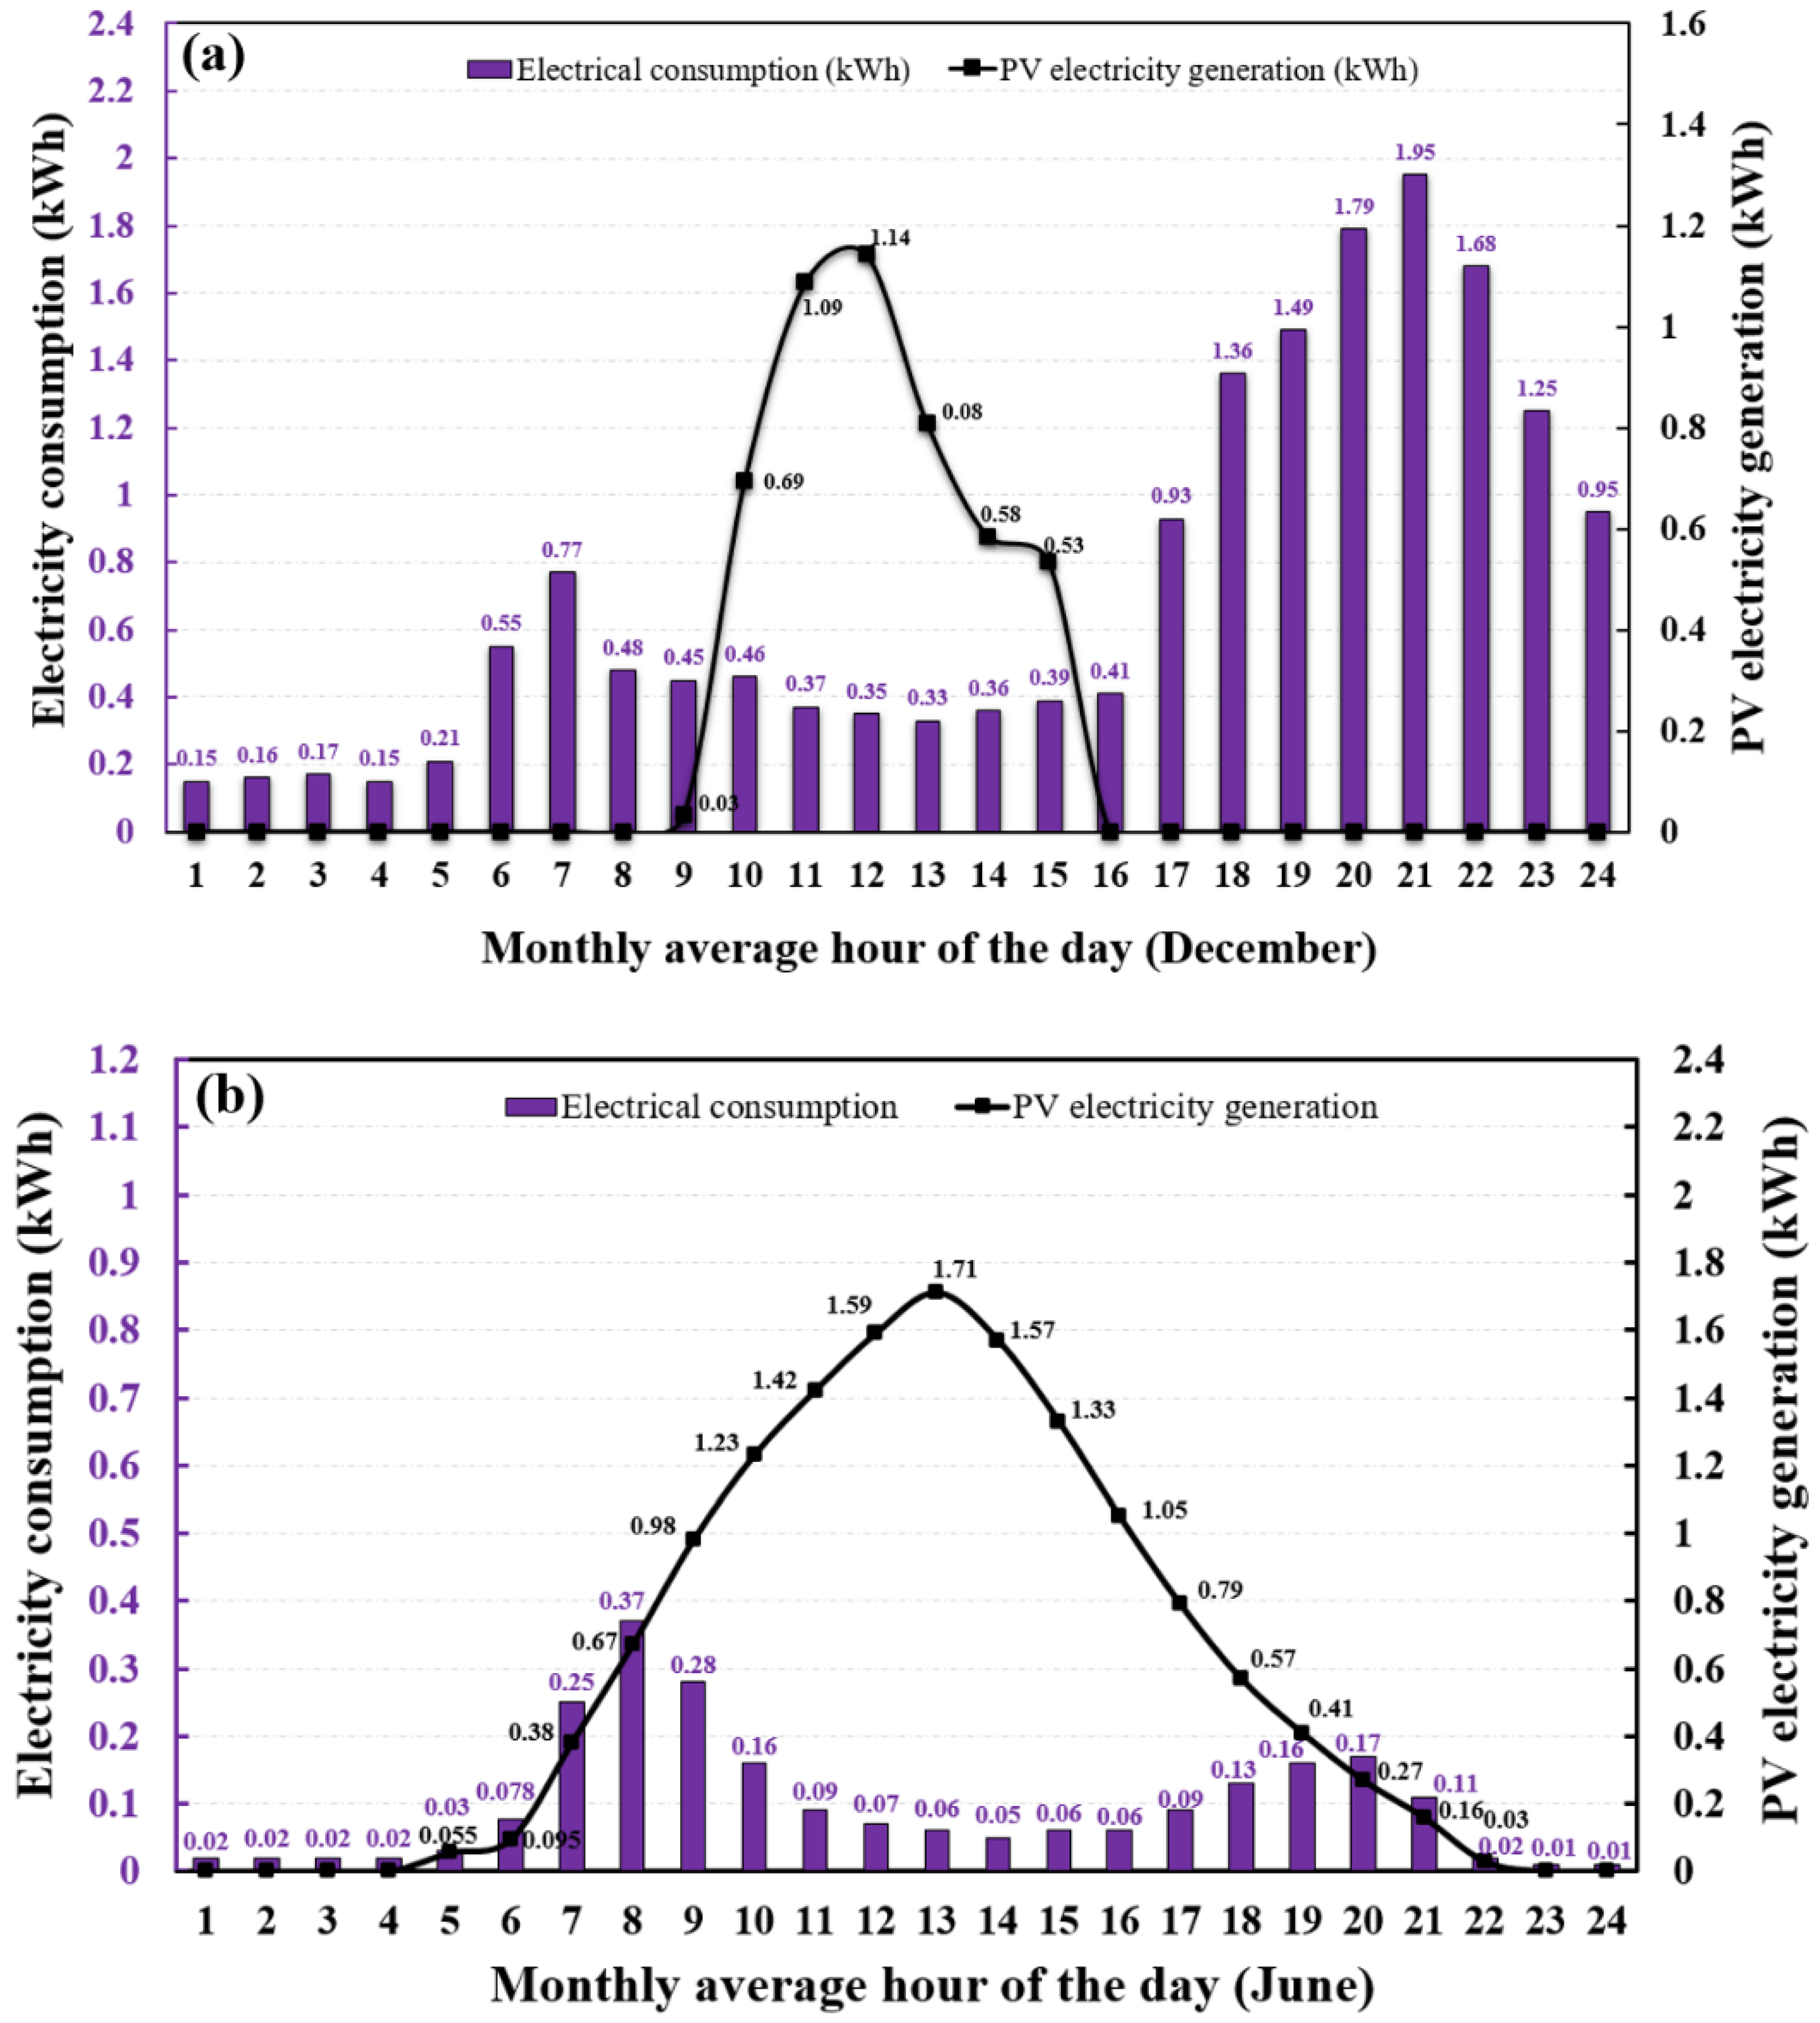
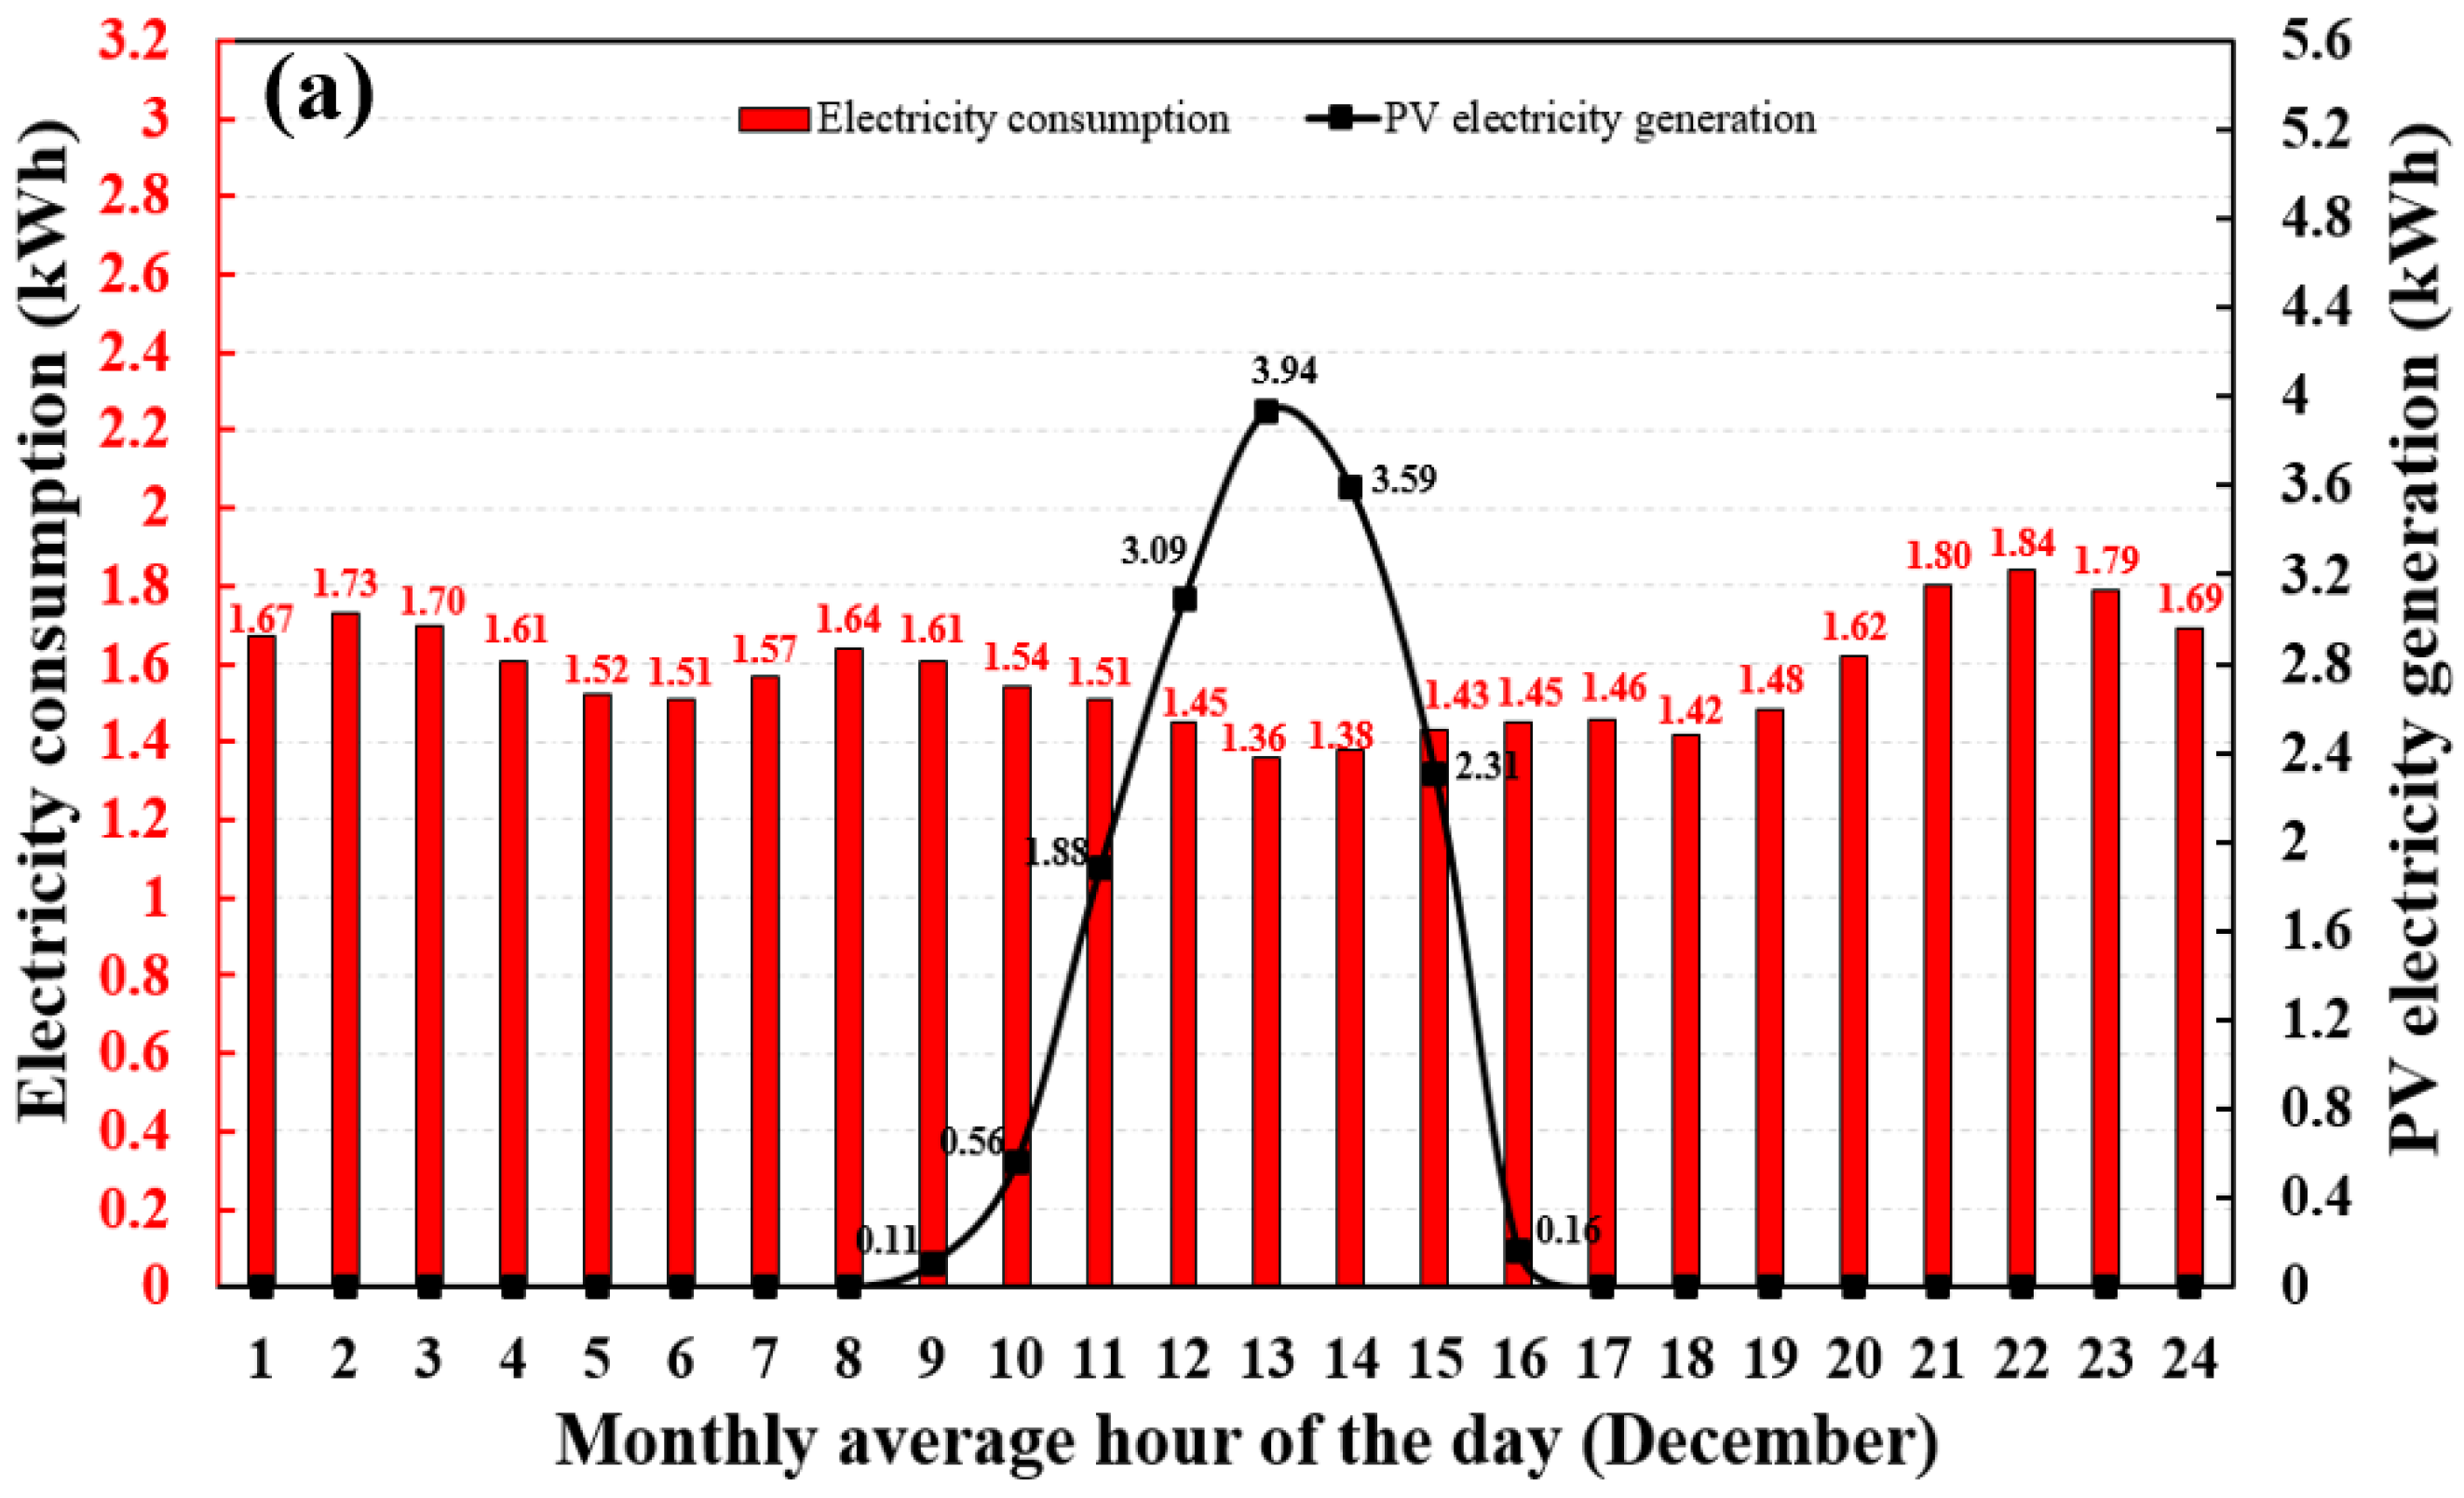
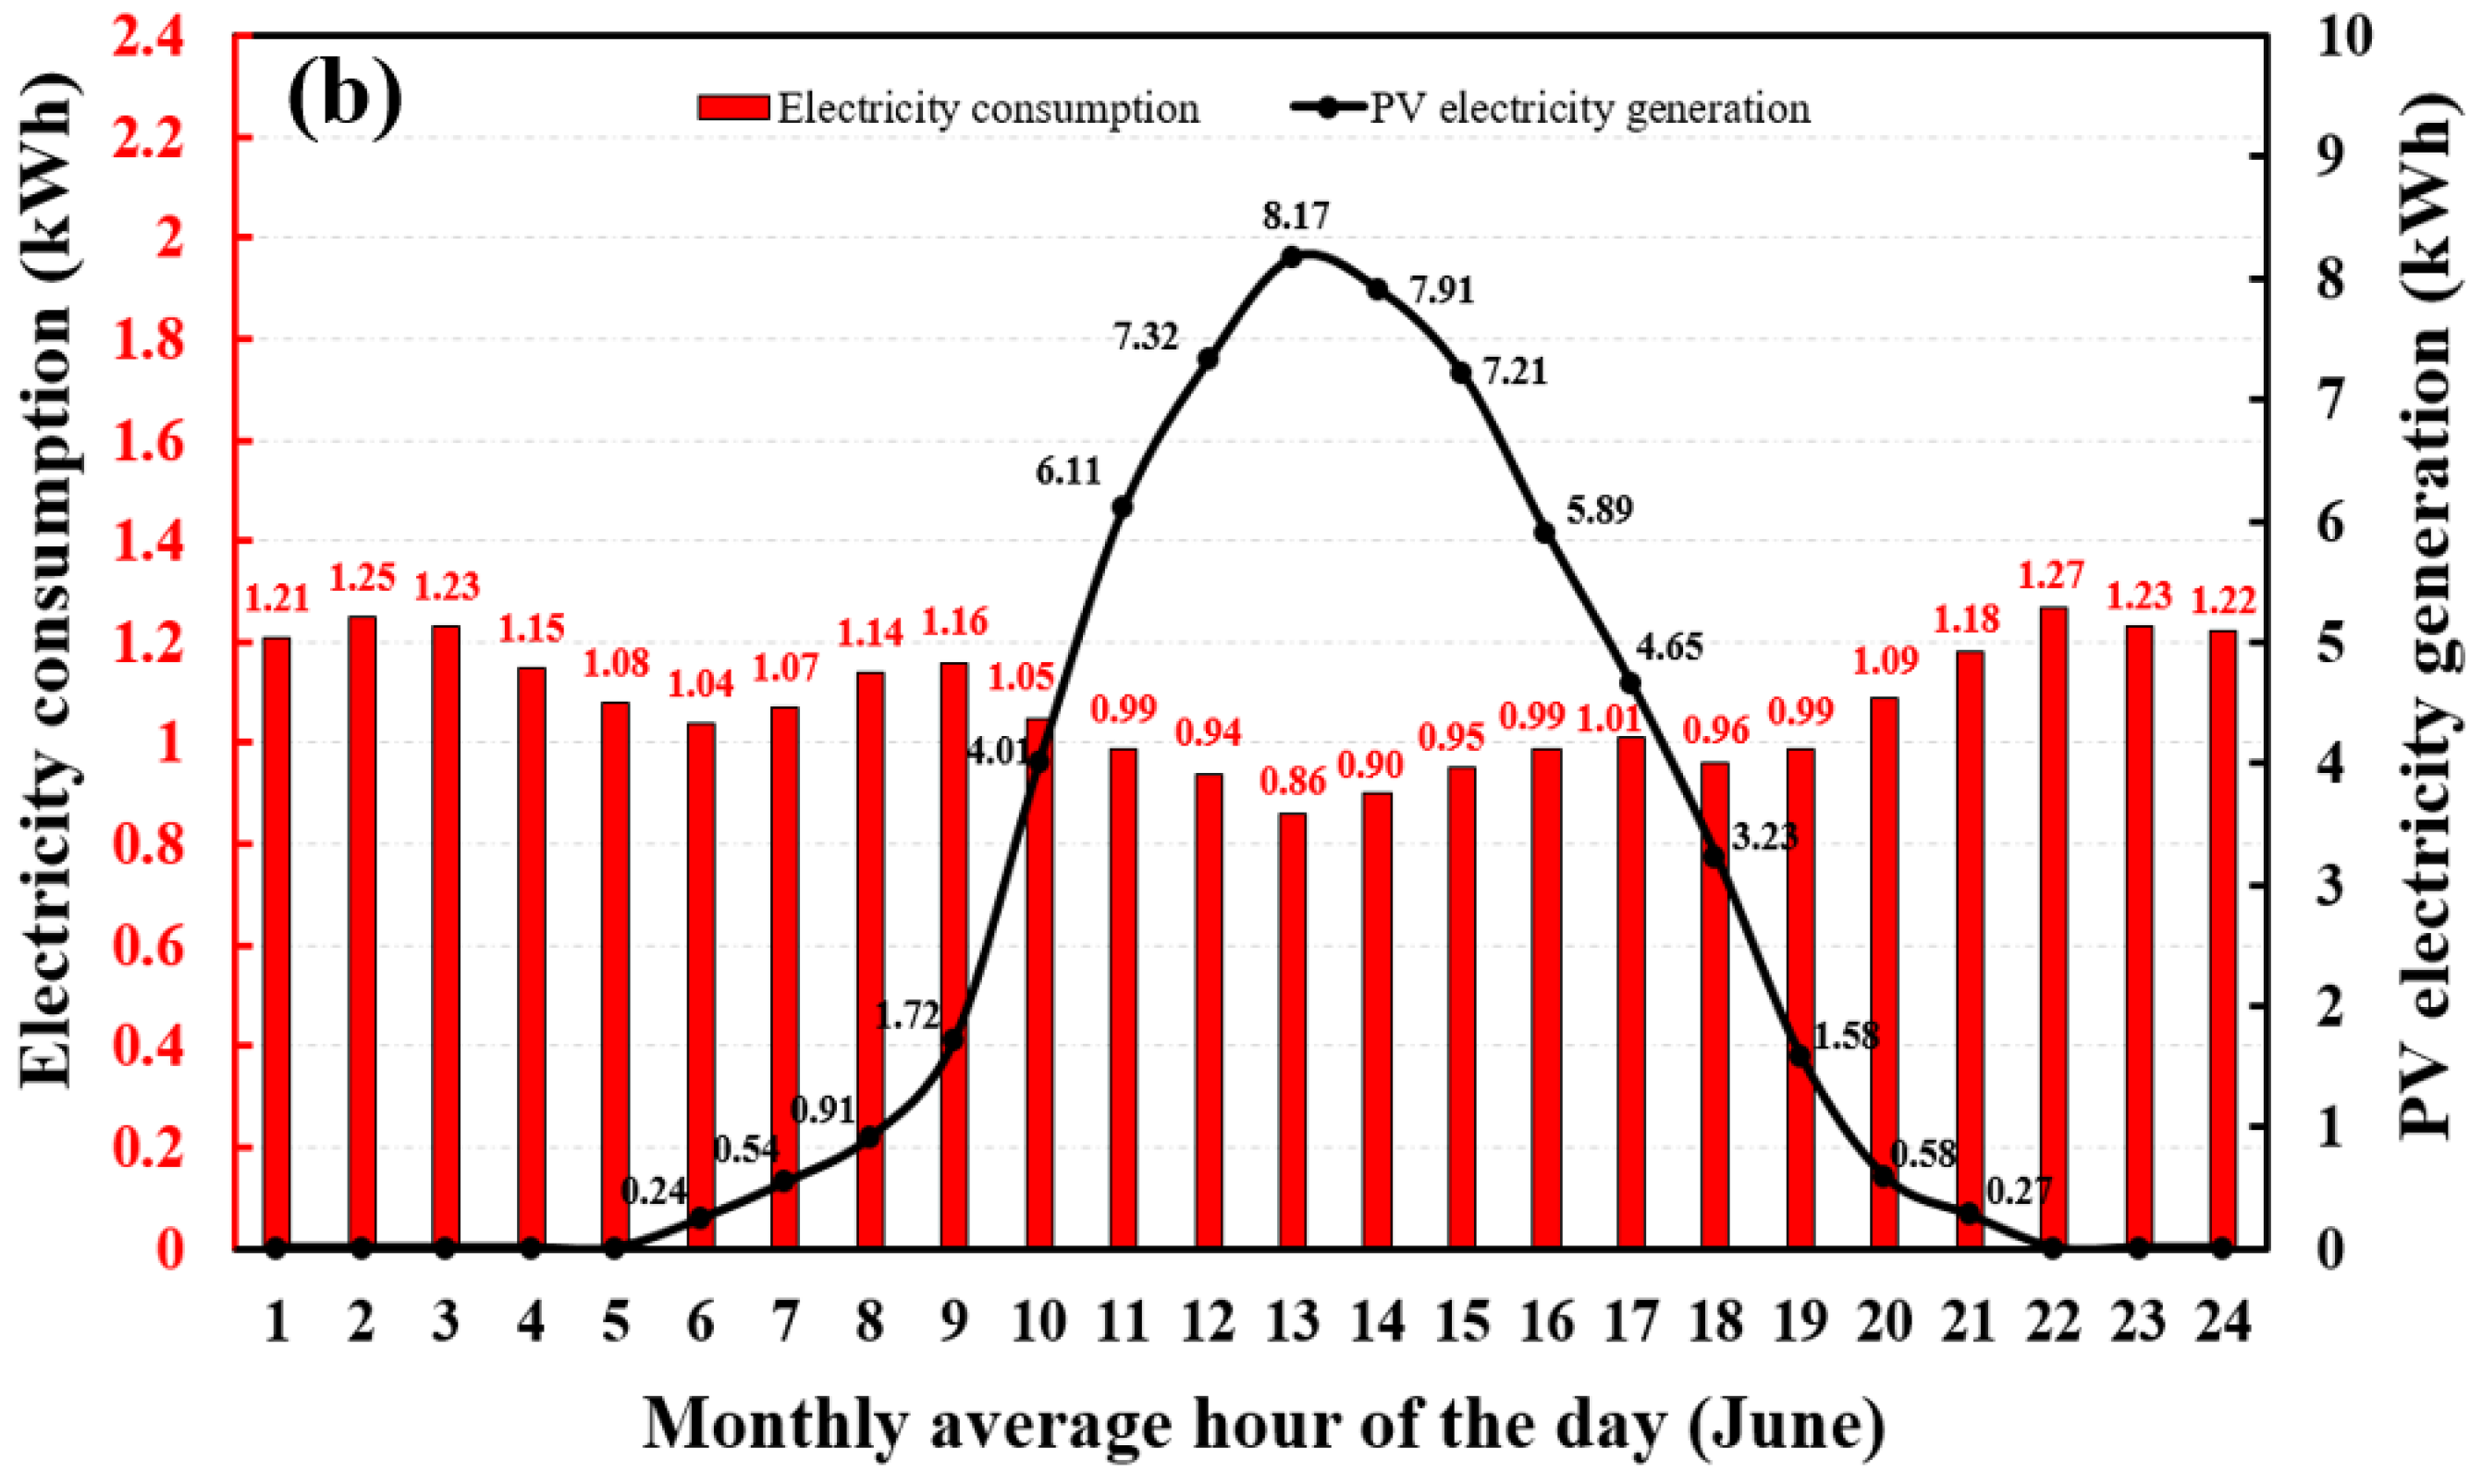
- The annual electricity generation is less than the annual electricity consumption for the three cases. However, in summer, the PV systems could produce sufficient electricity from 10:00 to 16:00 to meet the building demands.
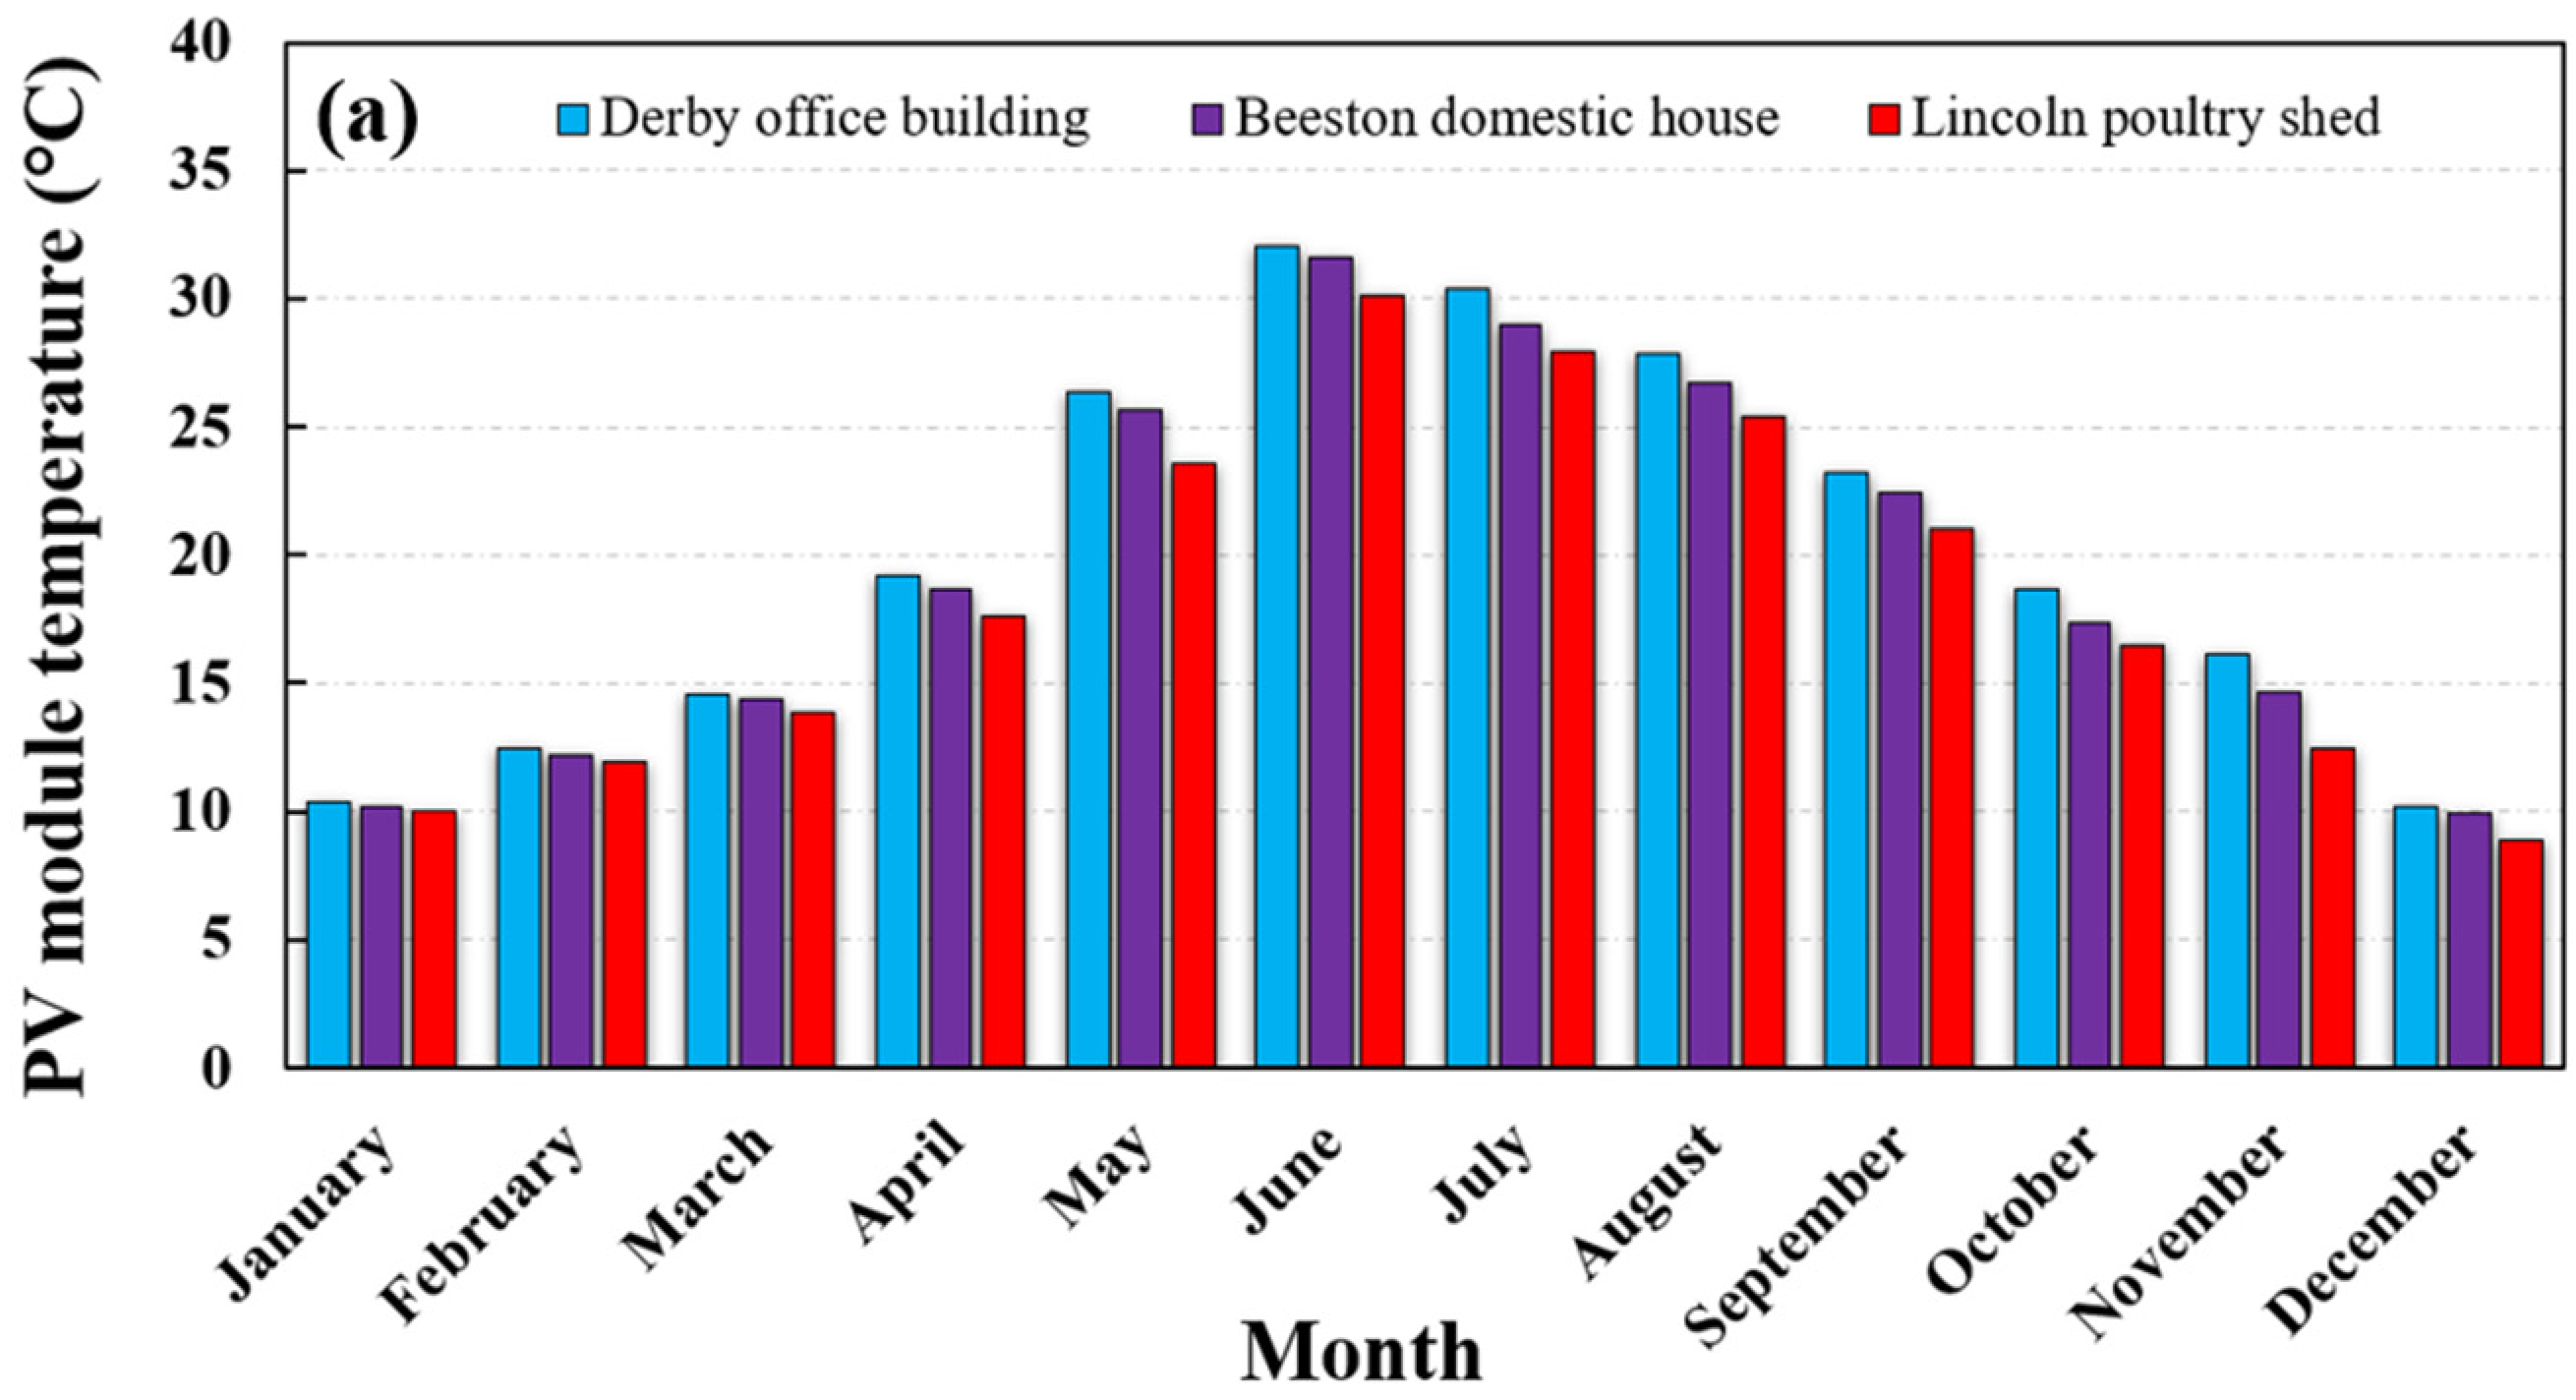
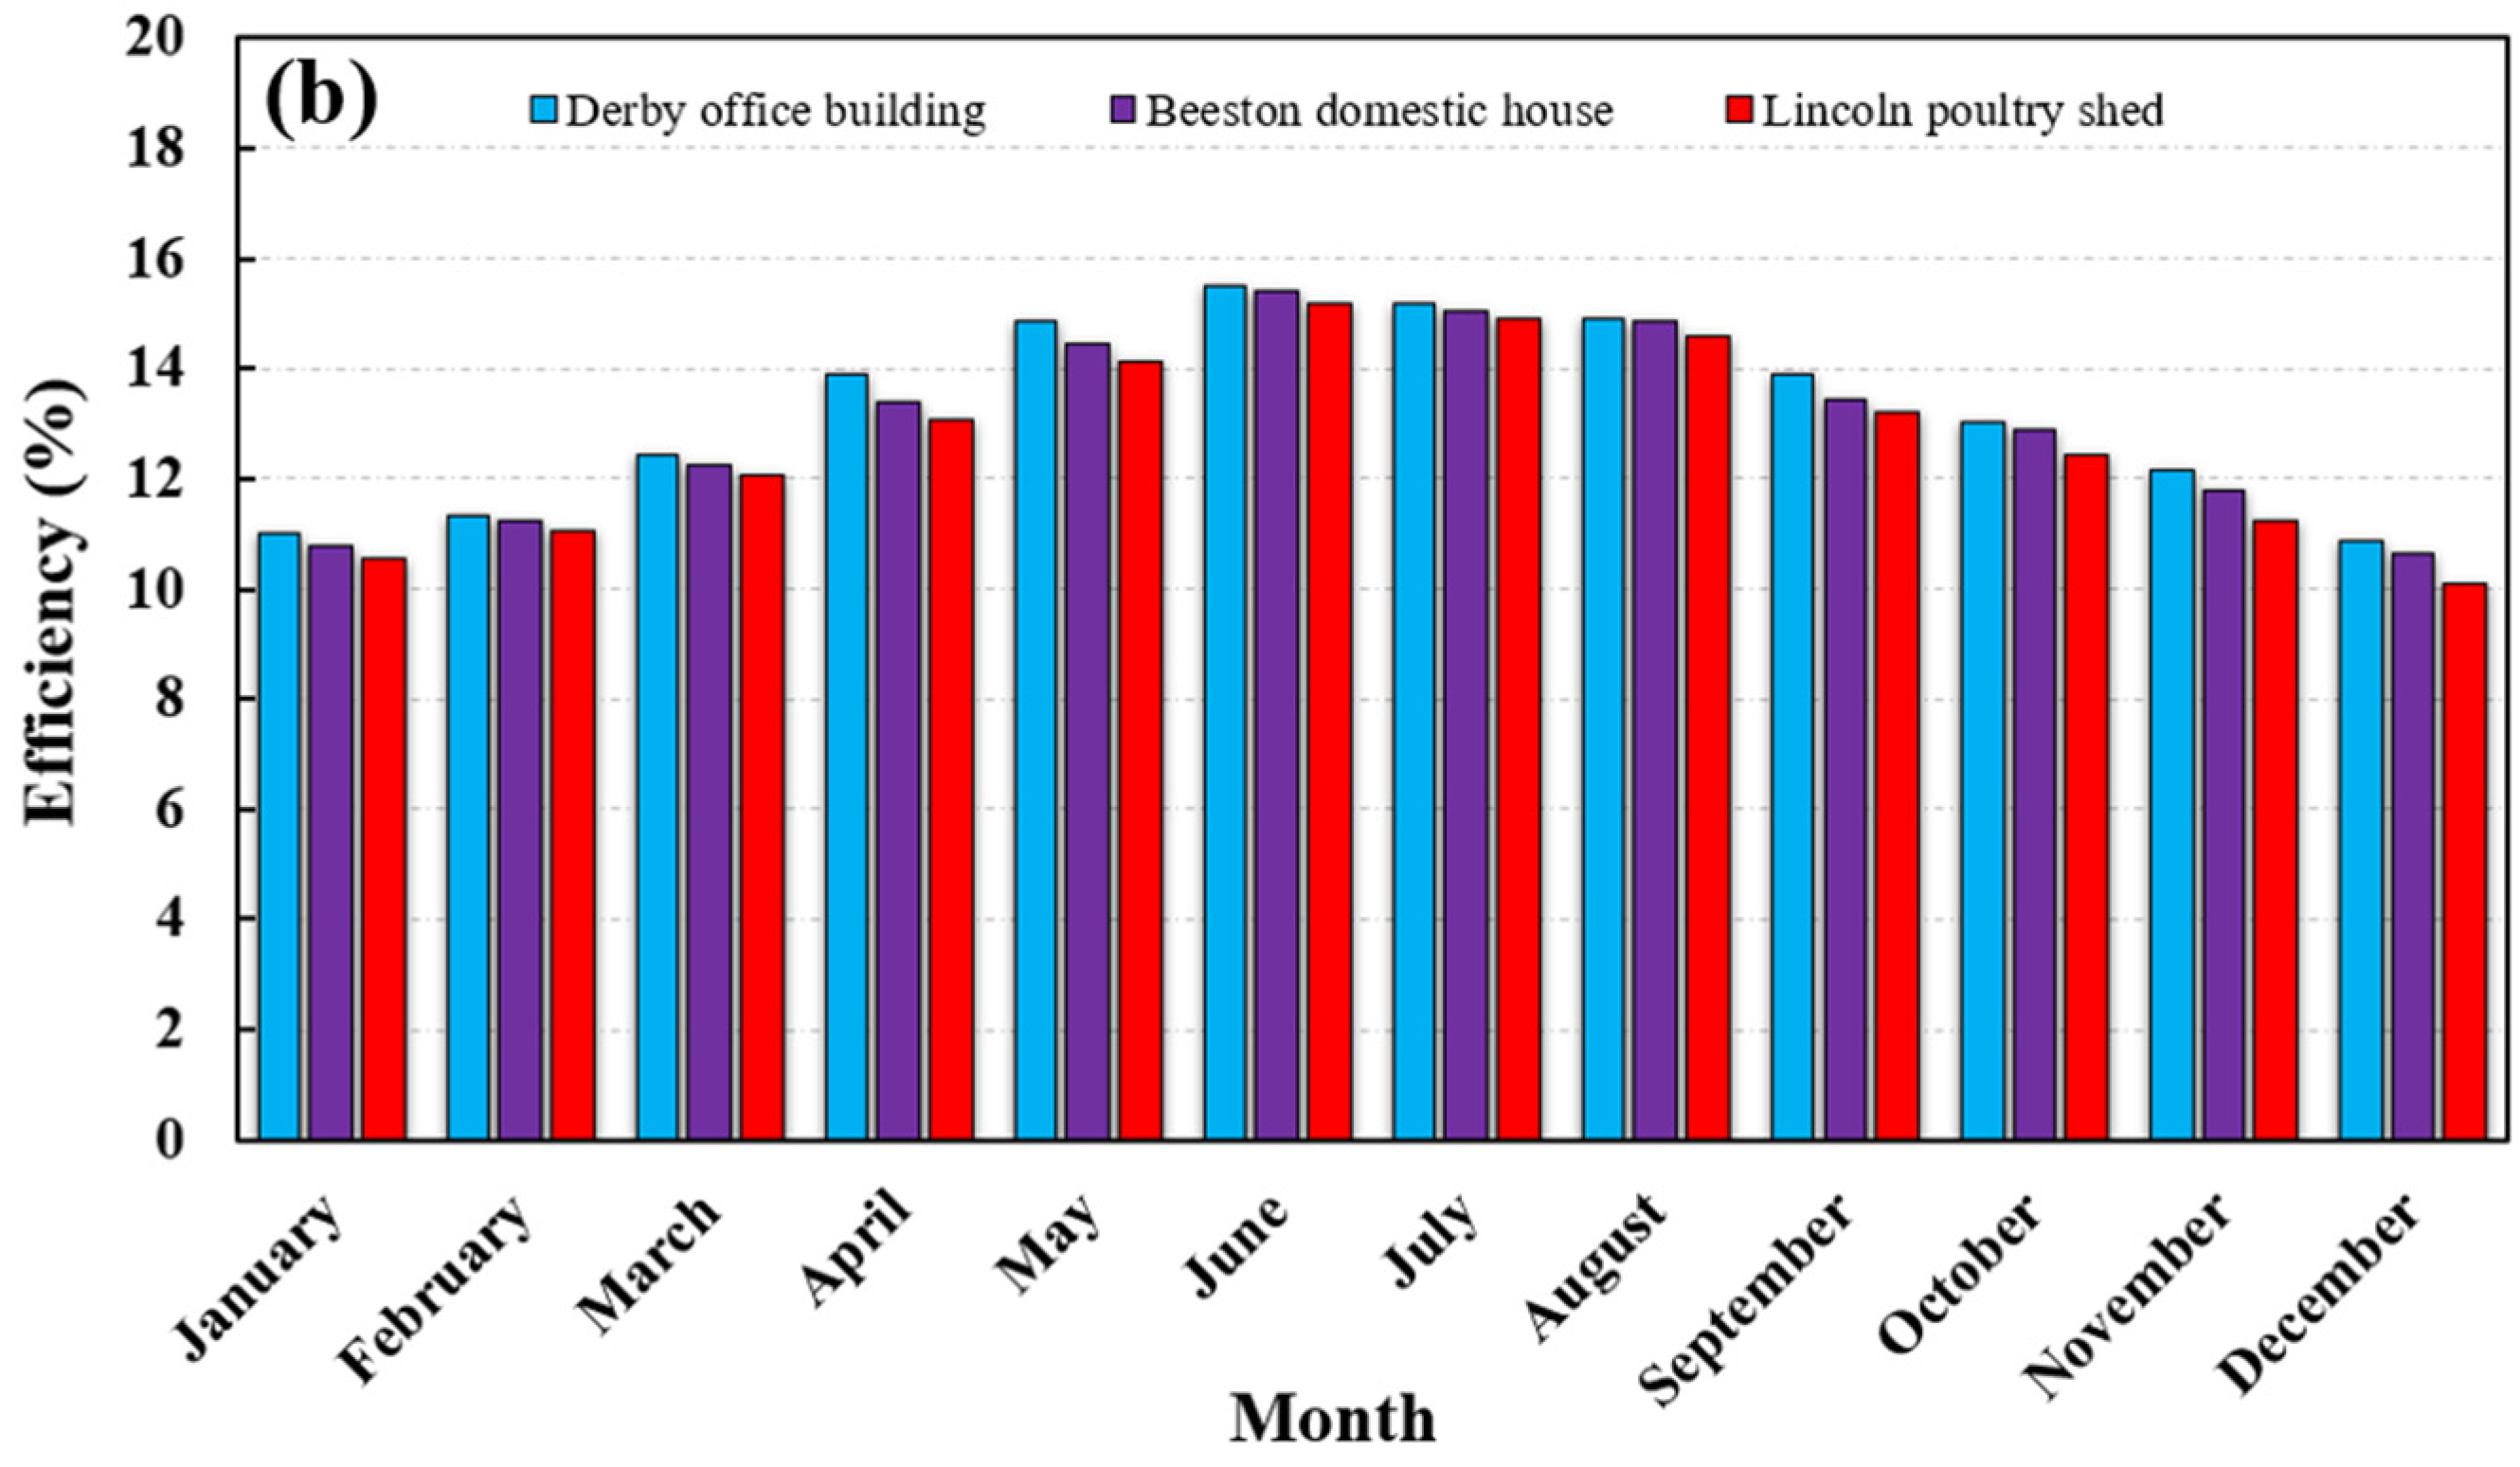
- The maximum average surface temperatures of the PV systems are in the range of 30.1 °C to 32.01 °C in June, and the corresponding electric efficiencies are in the range of 15.17% to 15.48%. By comparison, the minimum average surface temperatures are in the range of 8.87 °C to 10.18 °C in December, associated with electric efficiencies varying from 10.11% to 10.89%.
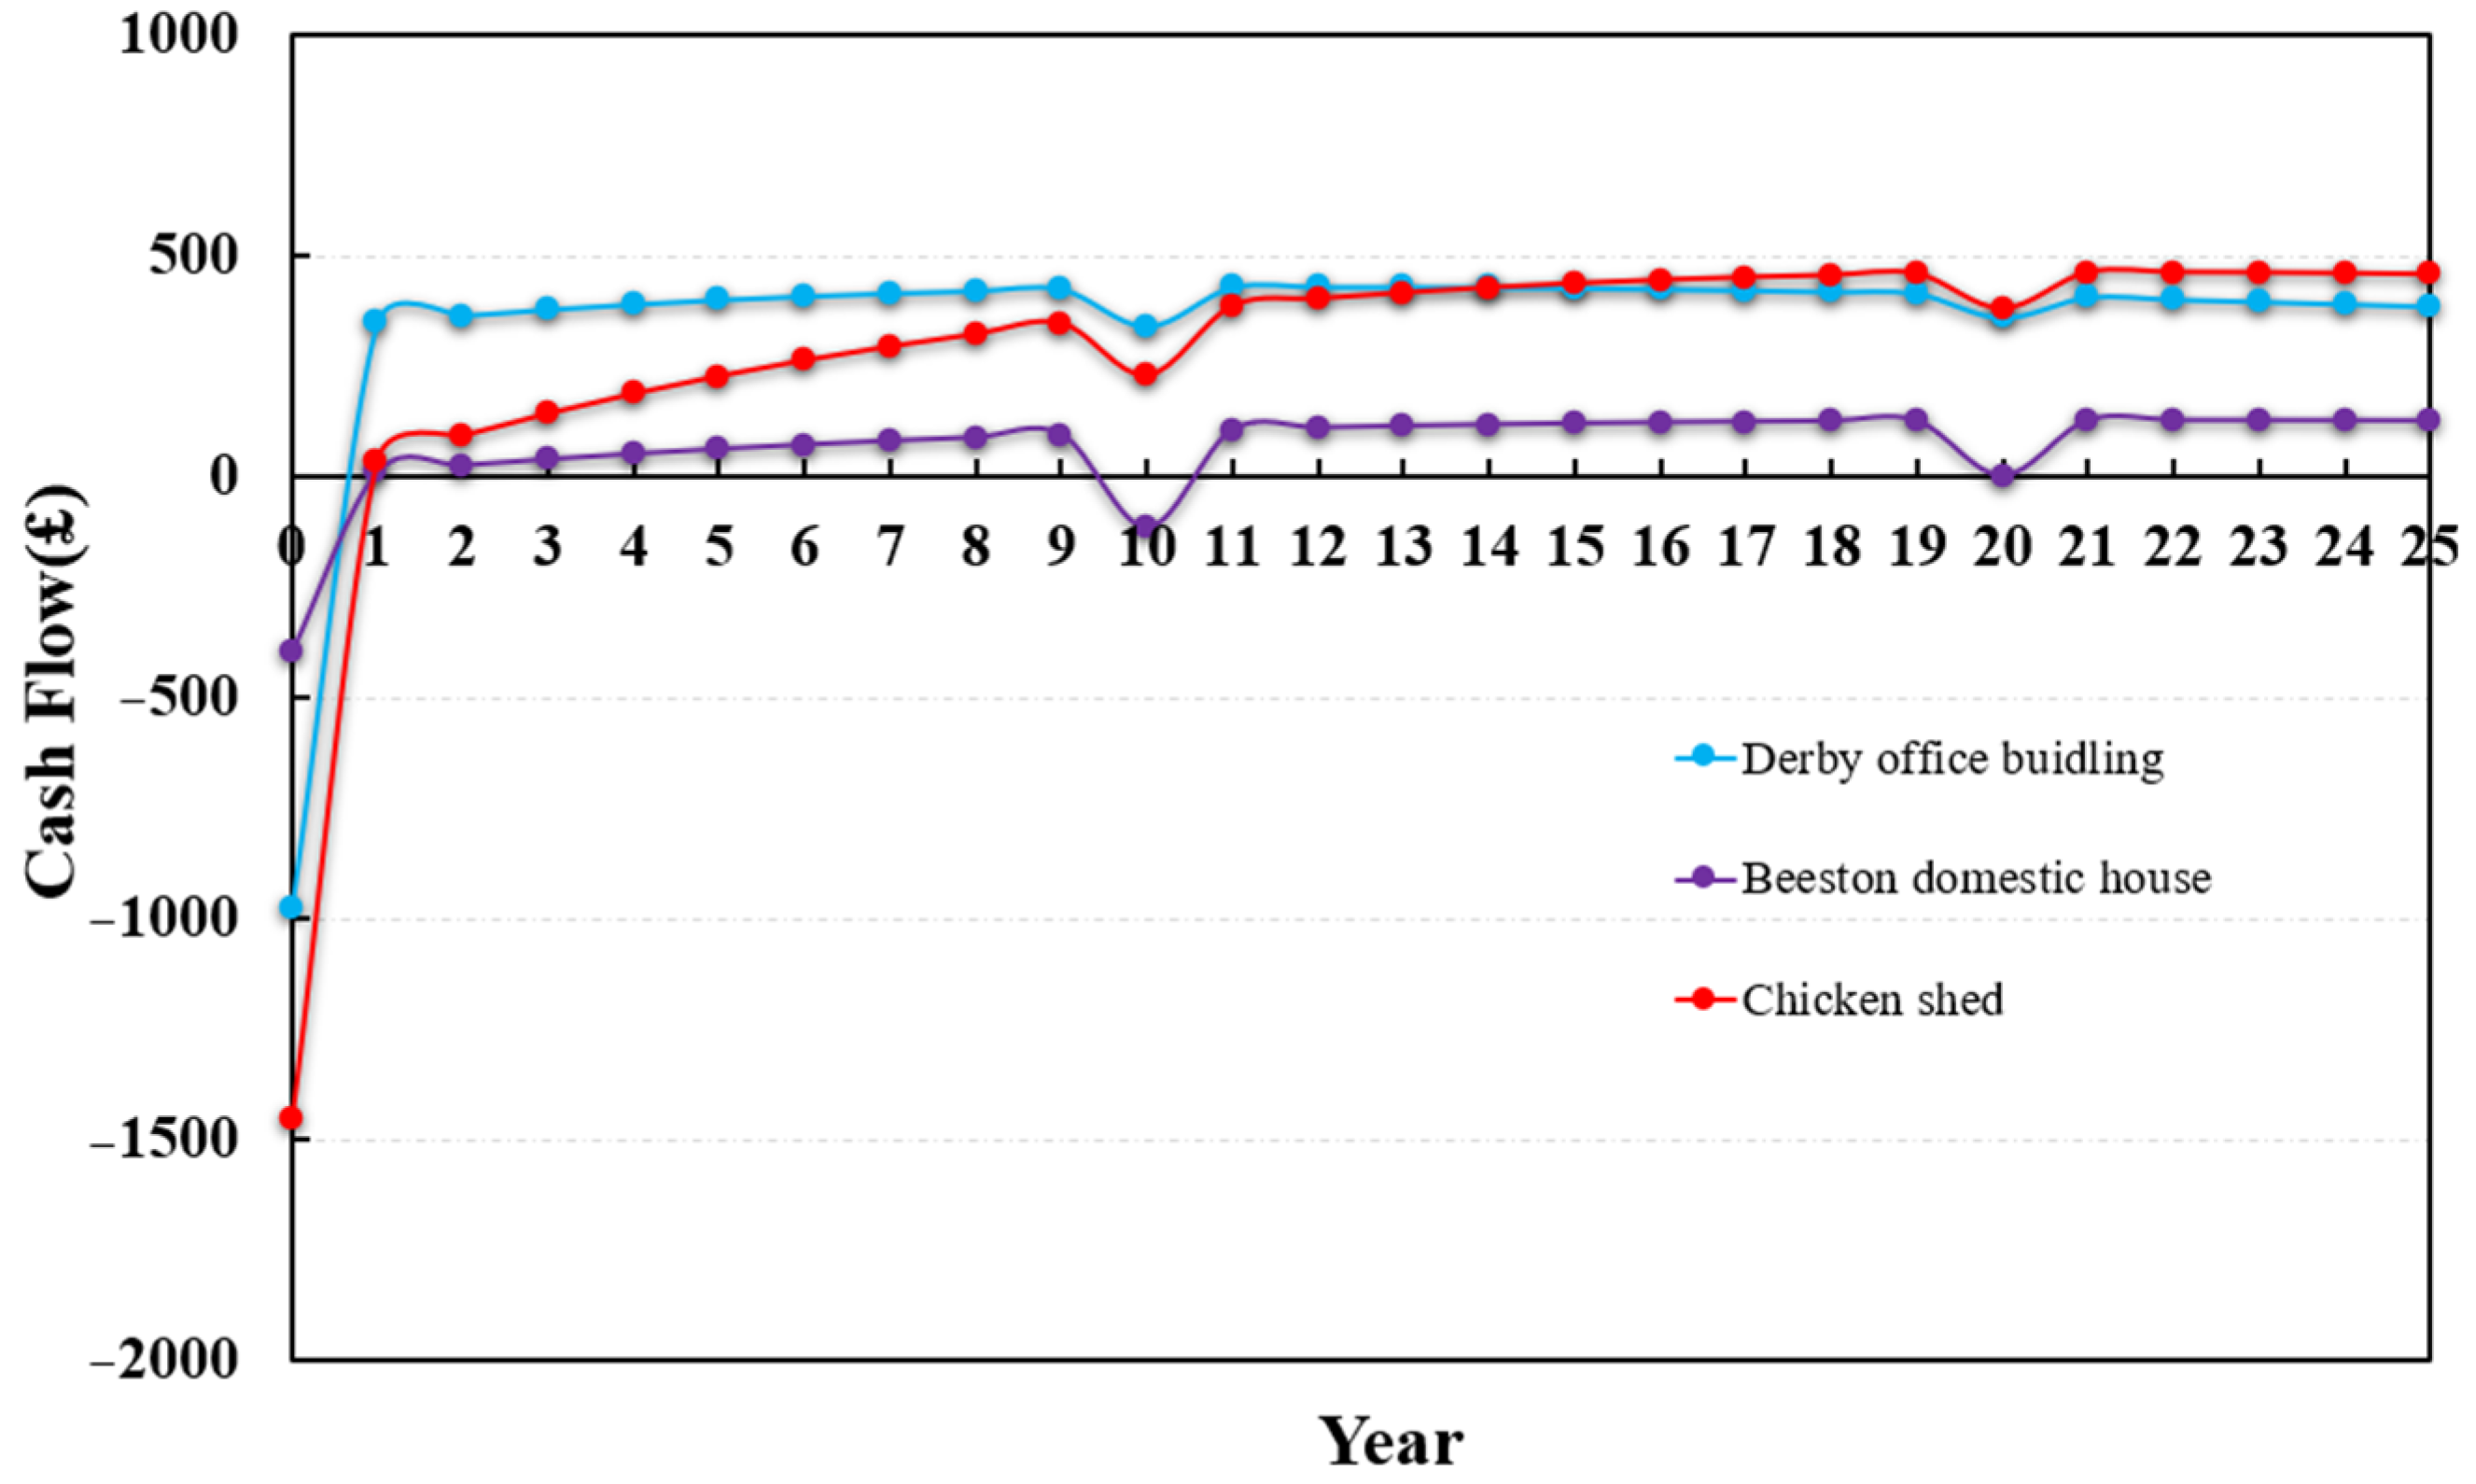
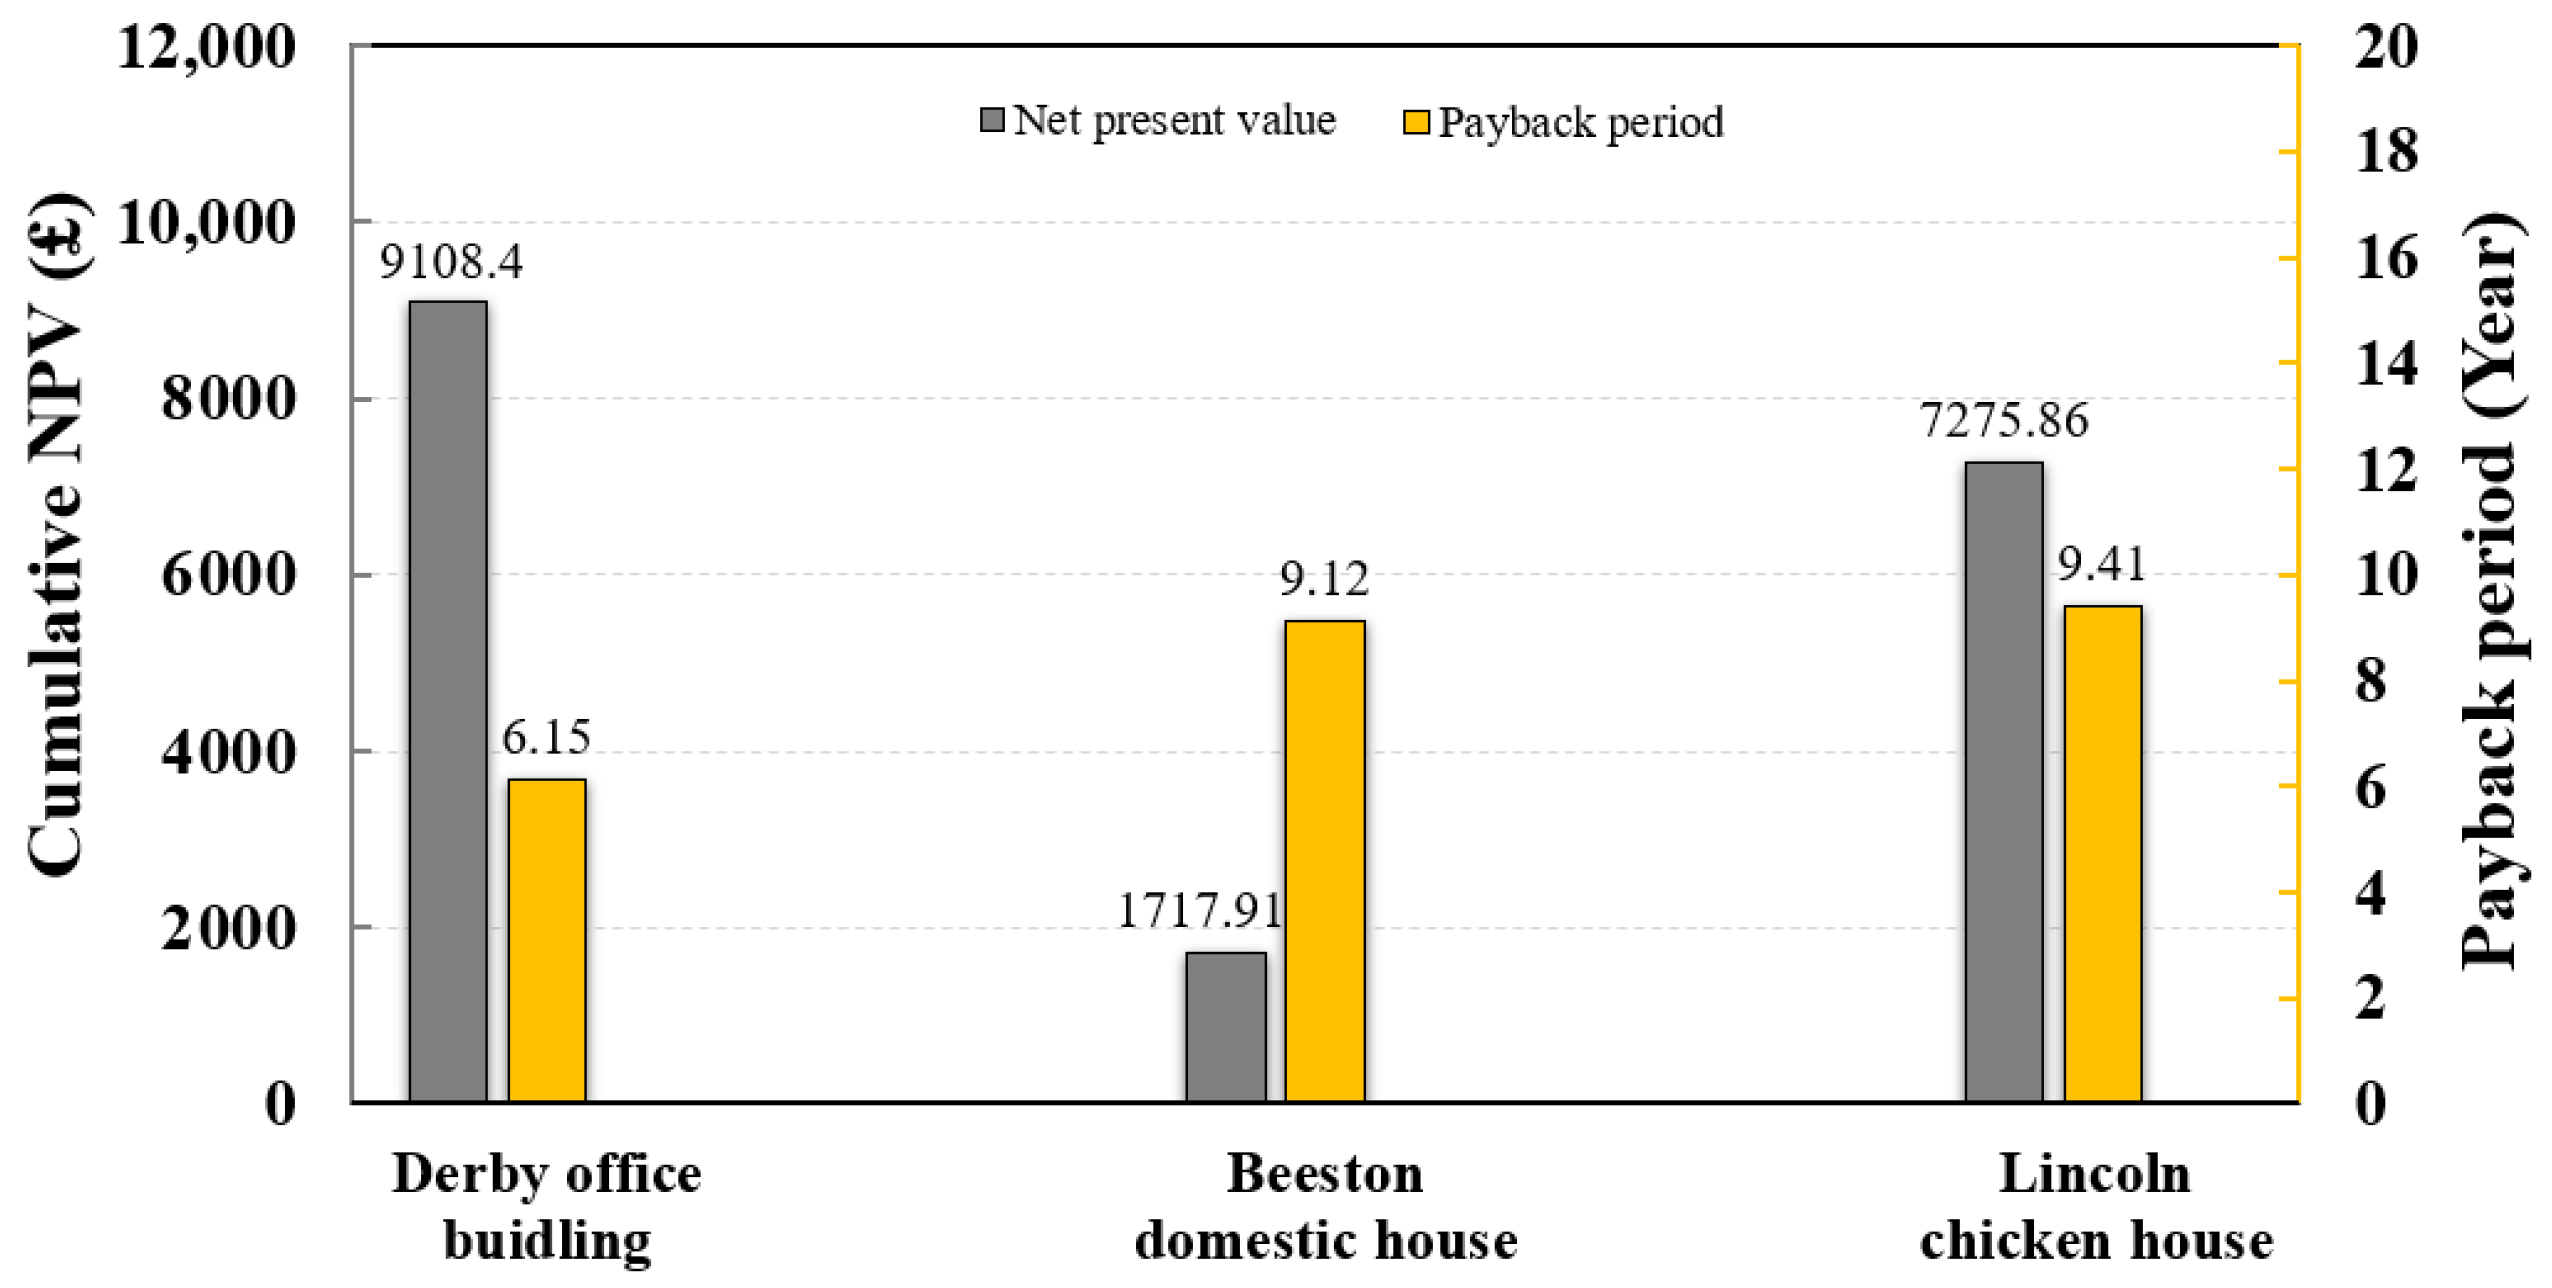
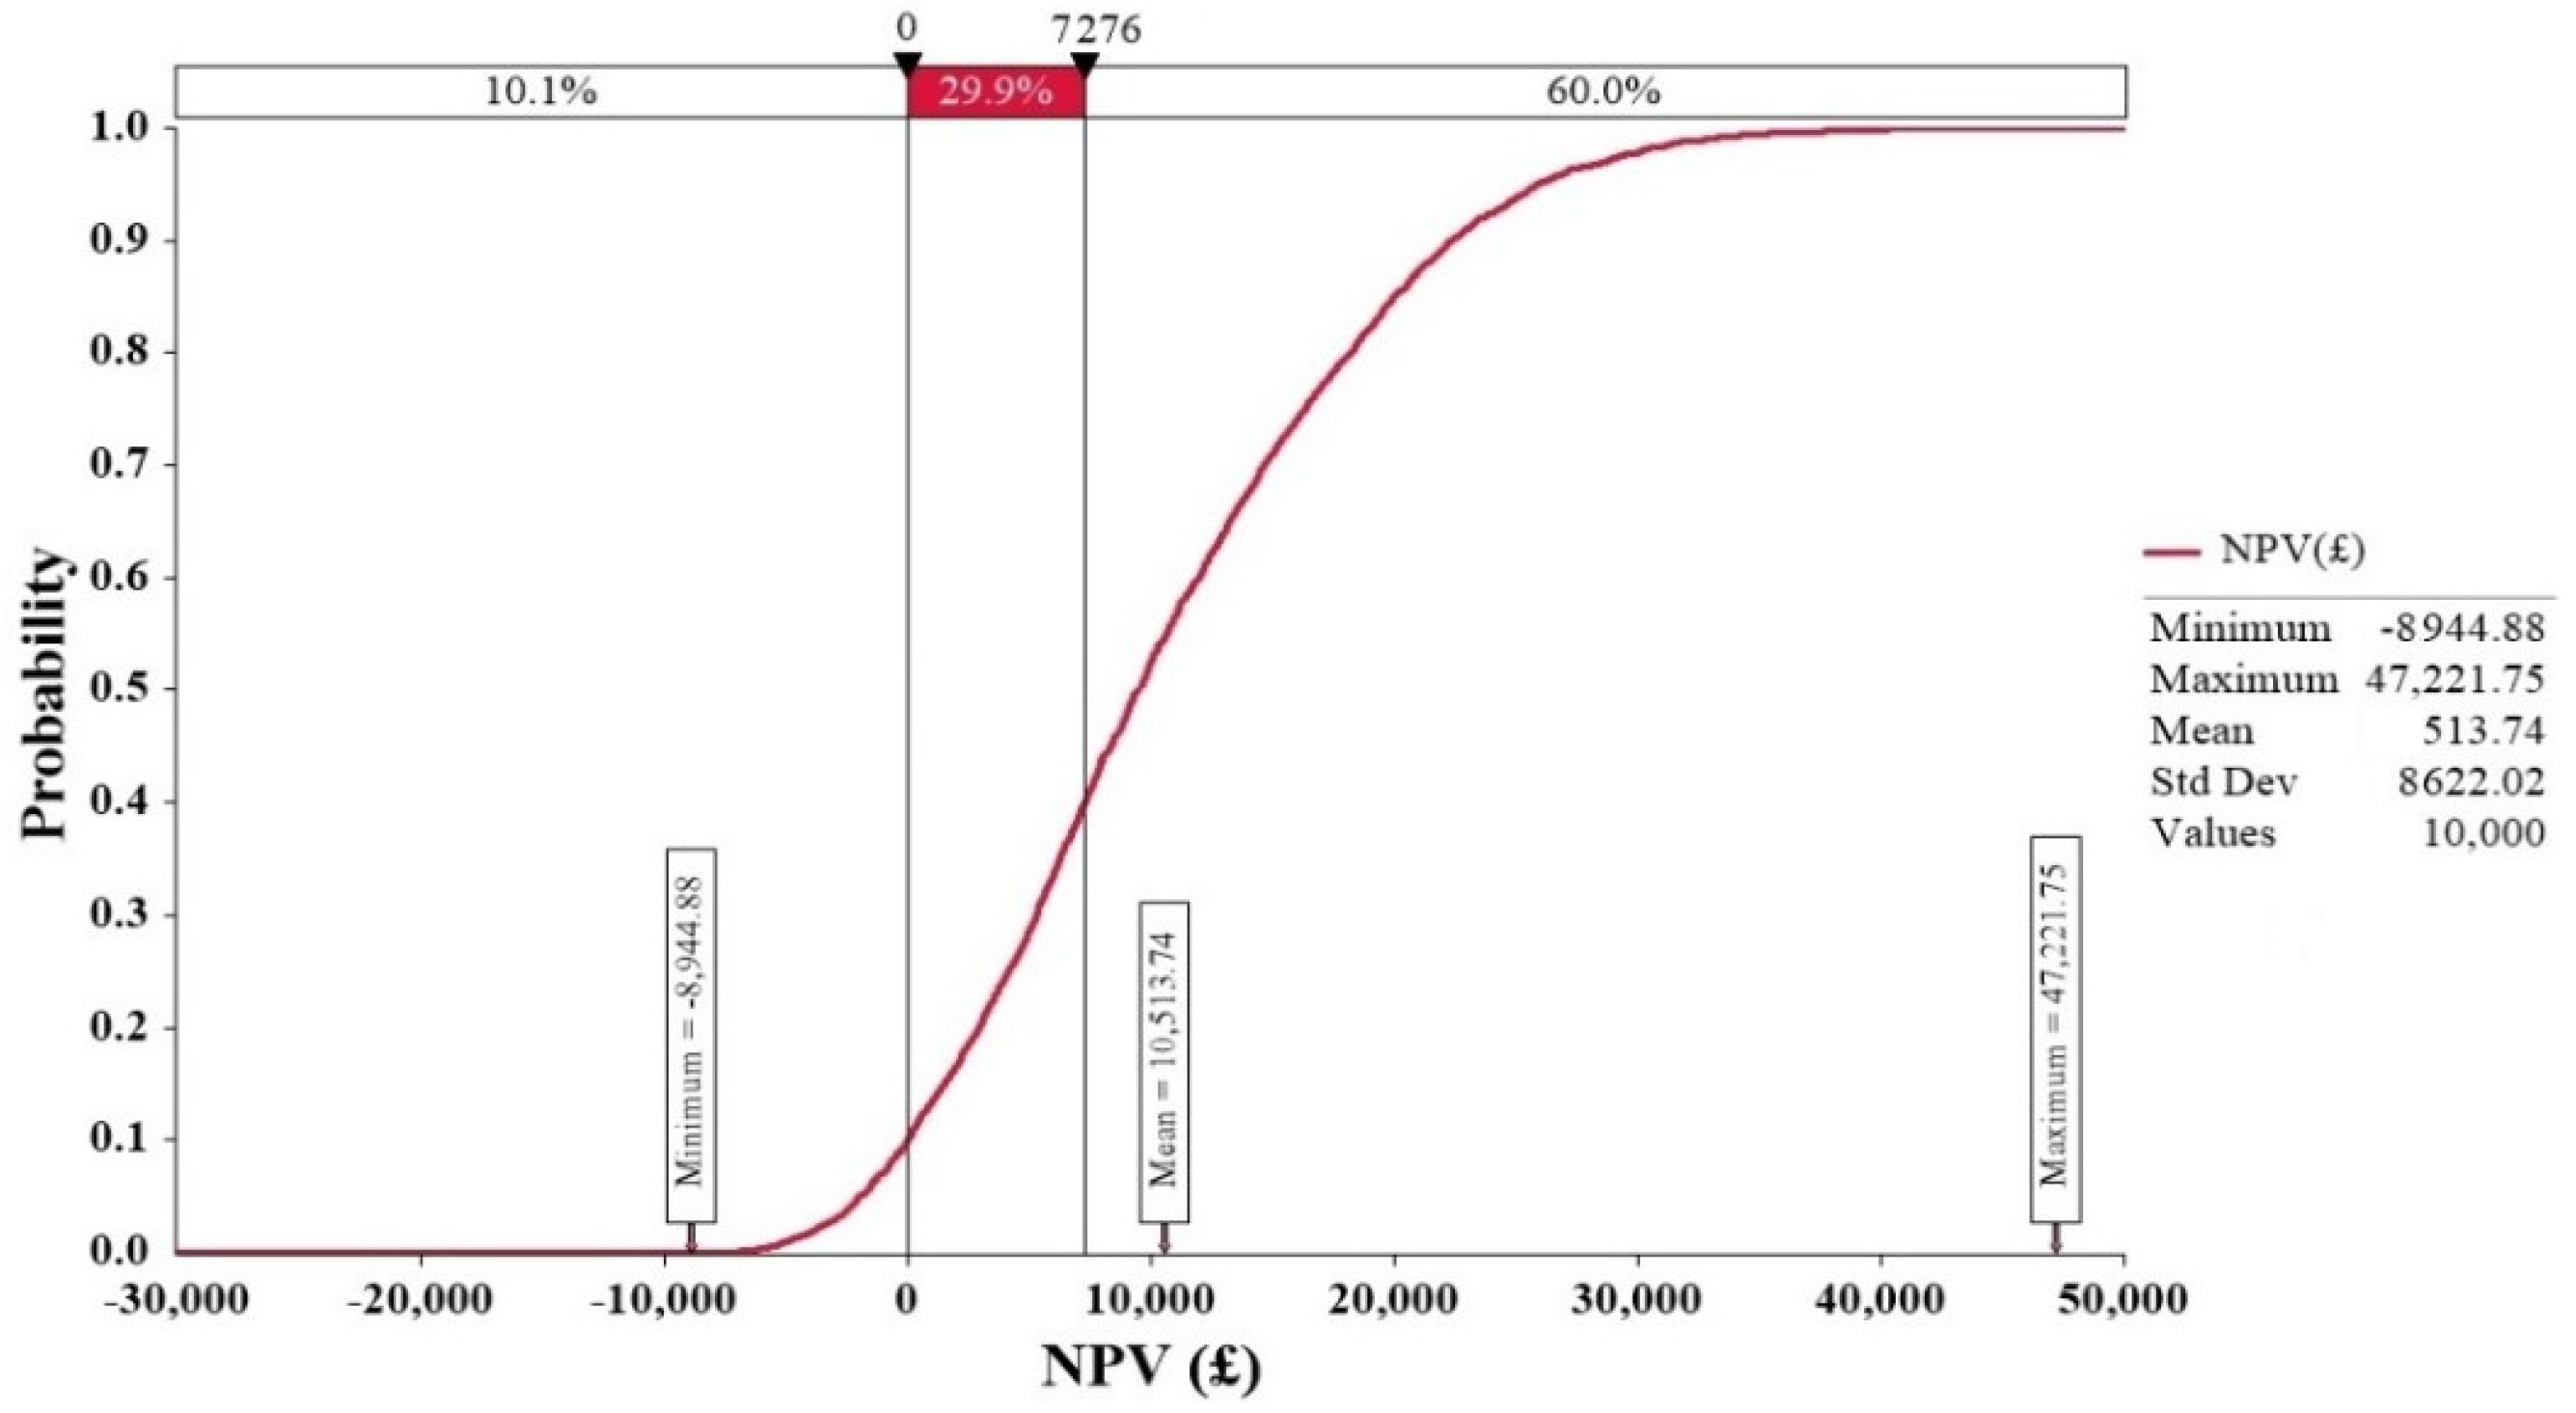
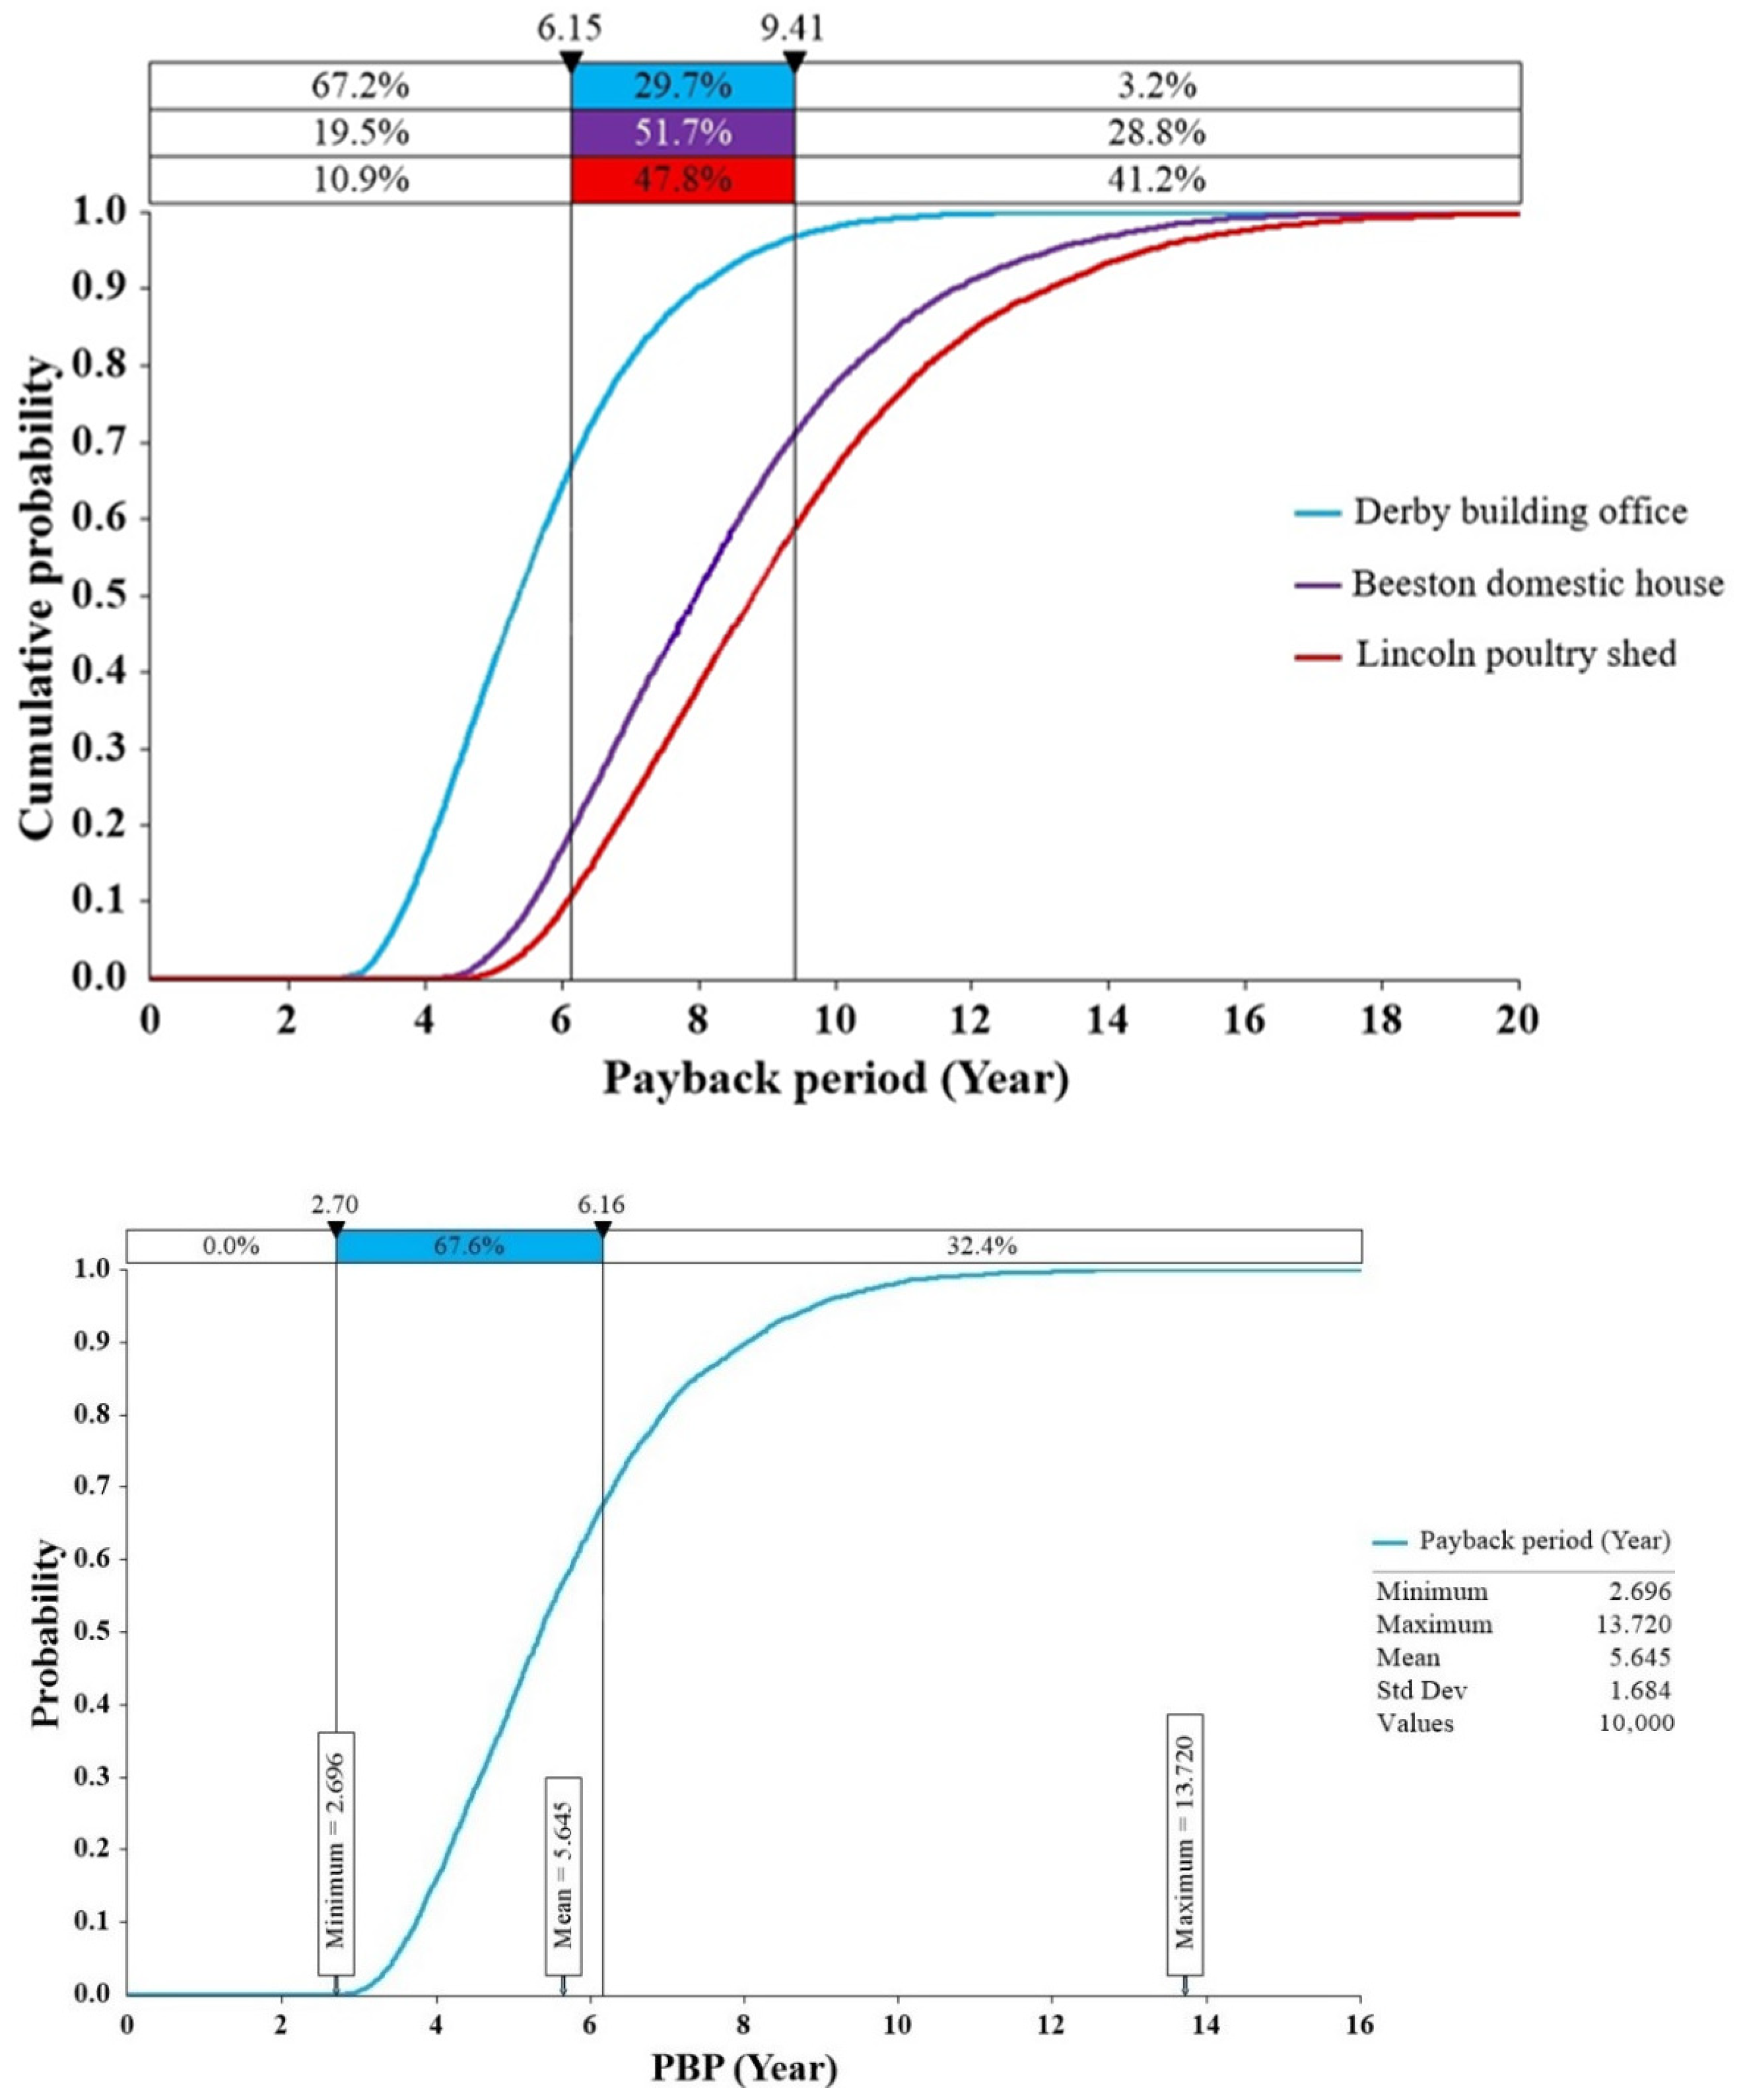
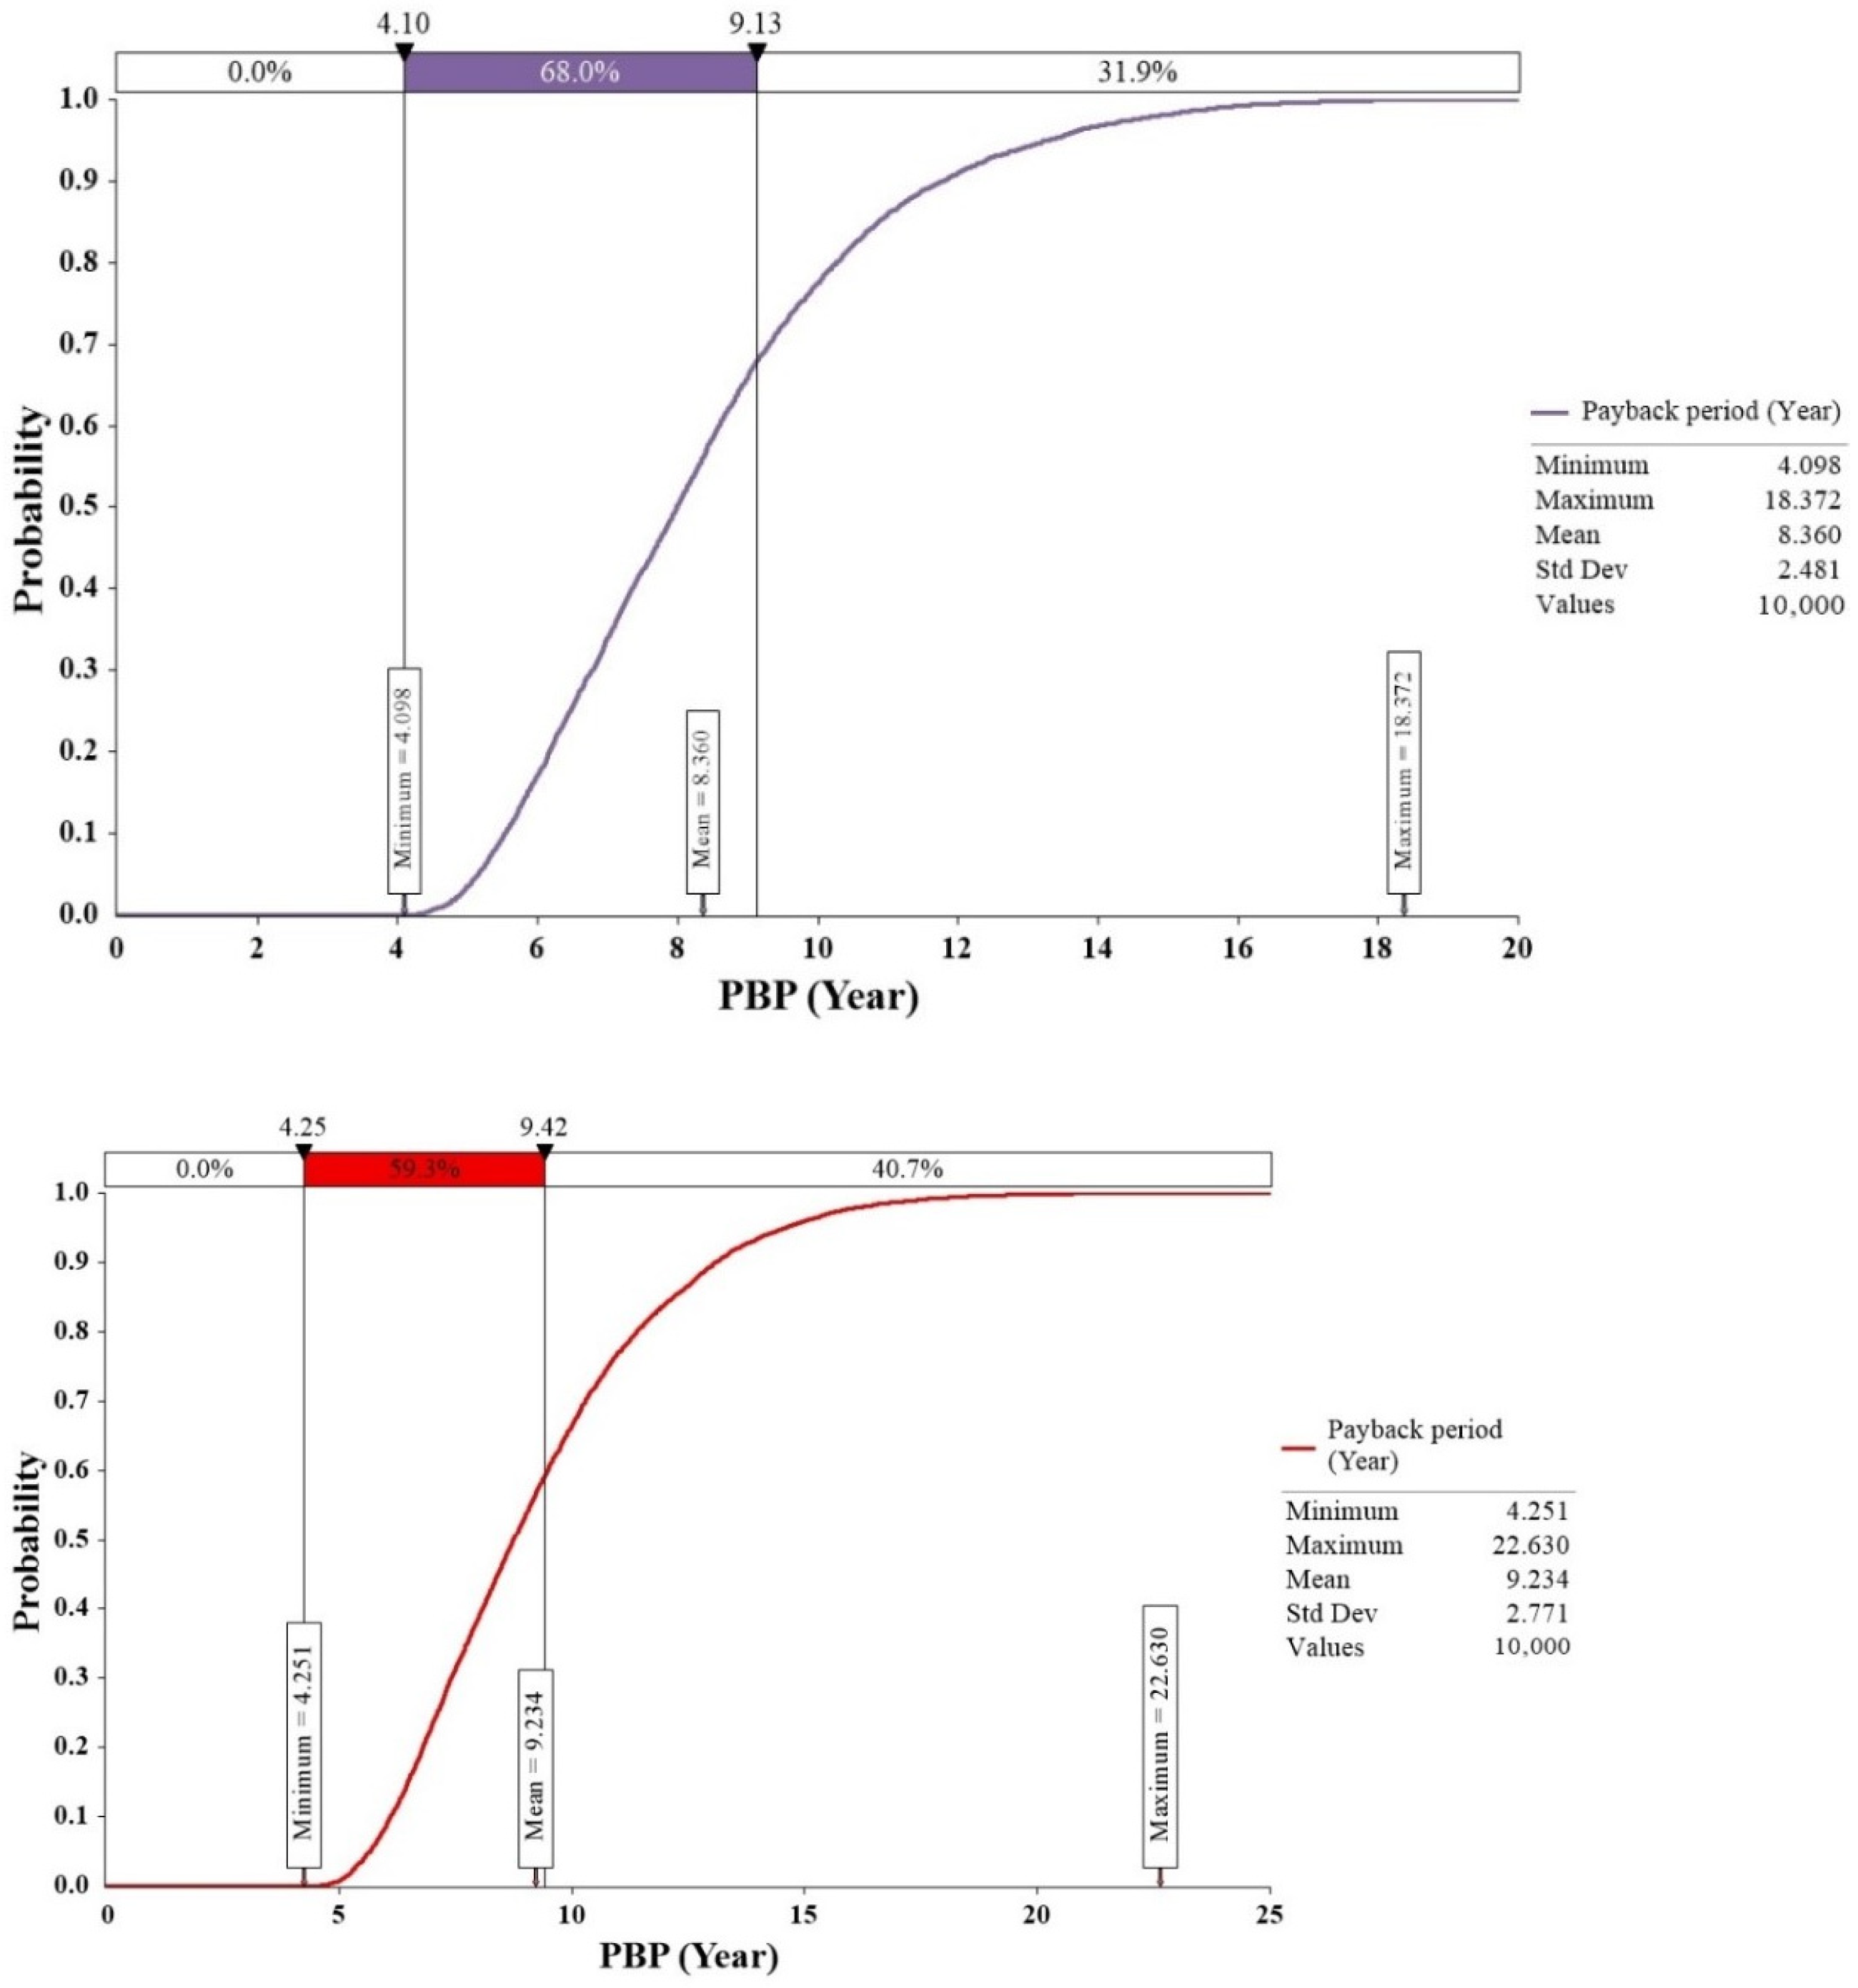
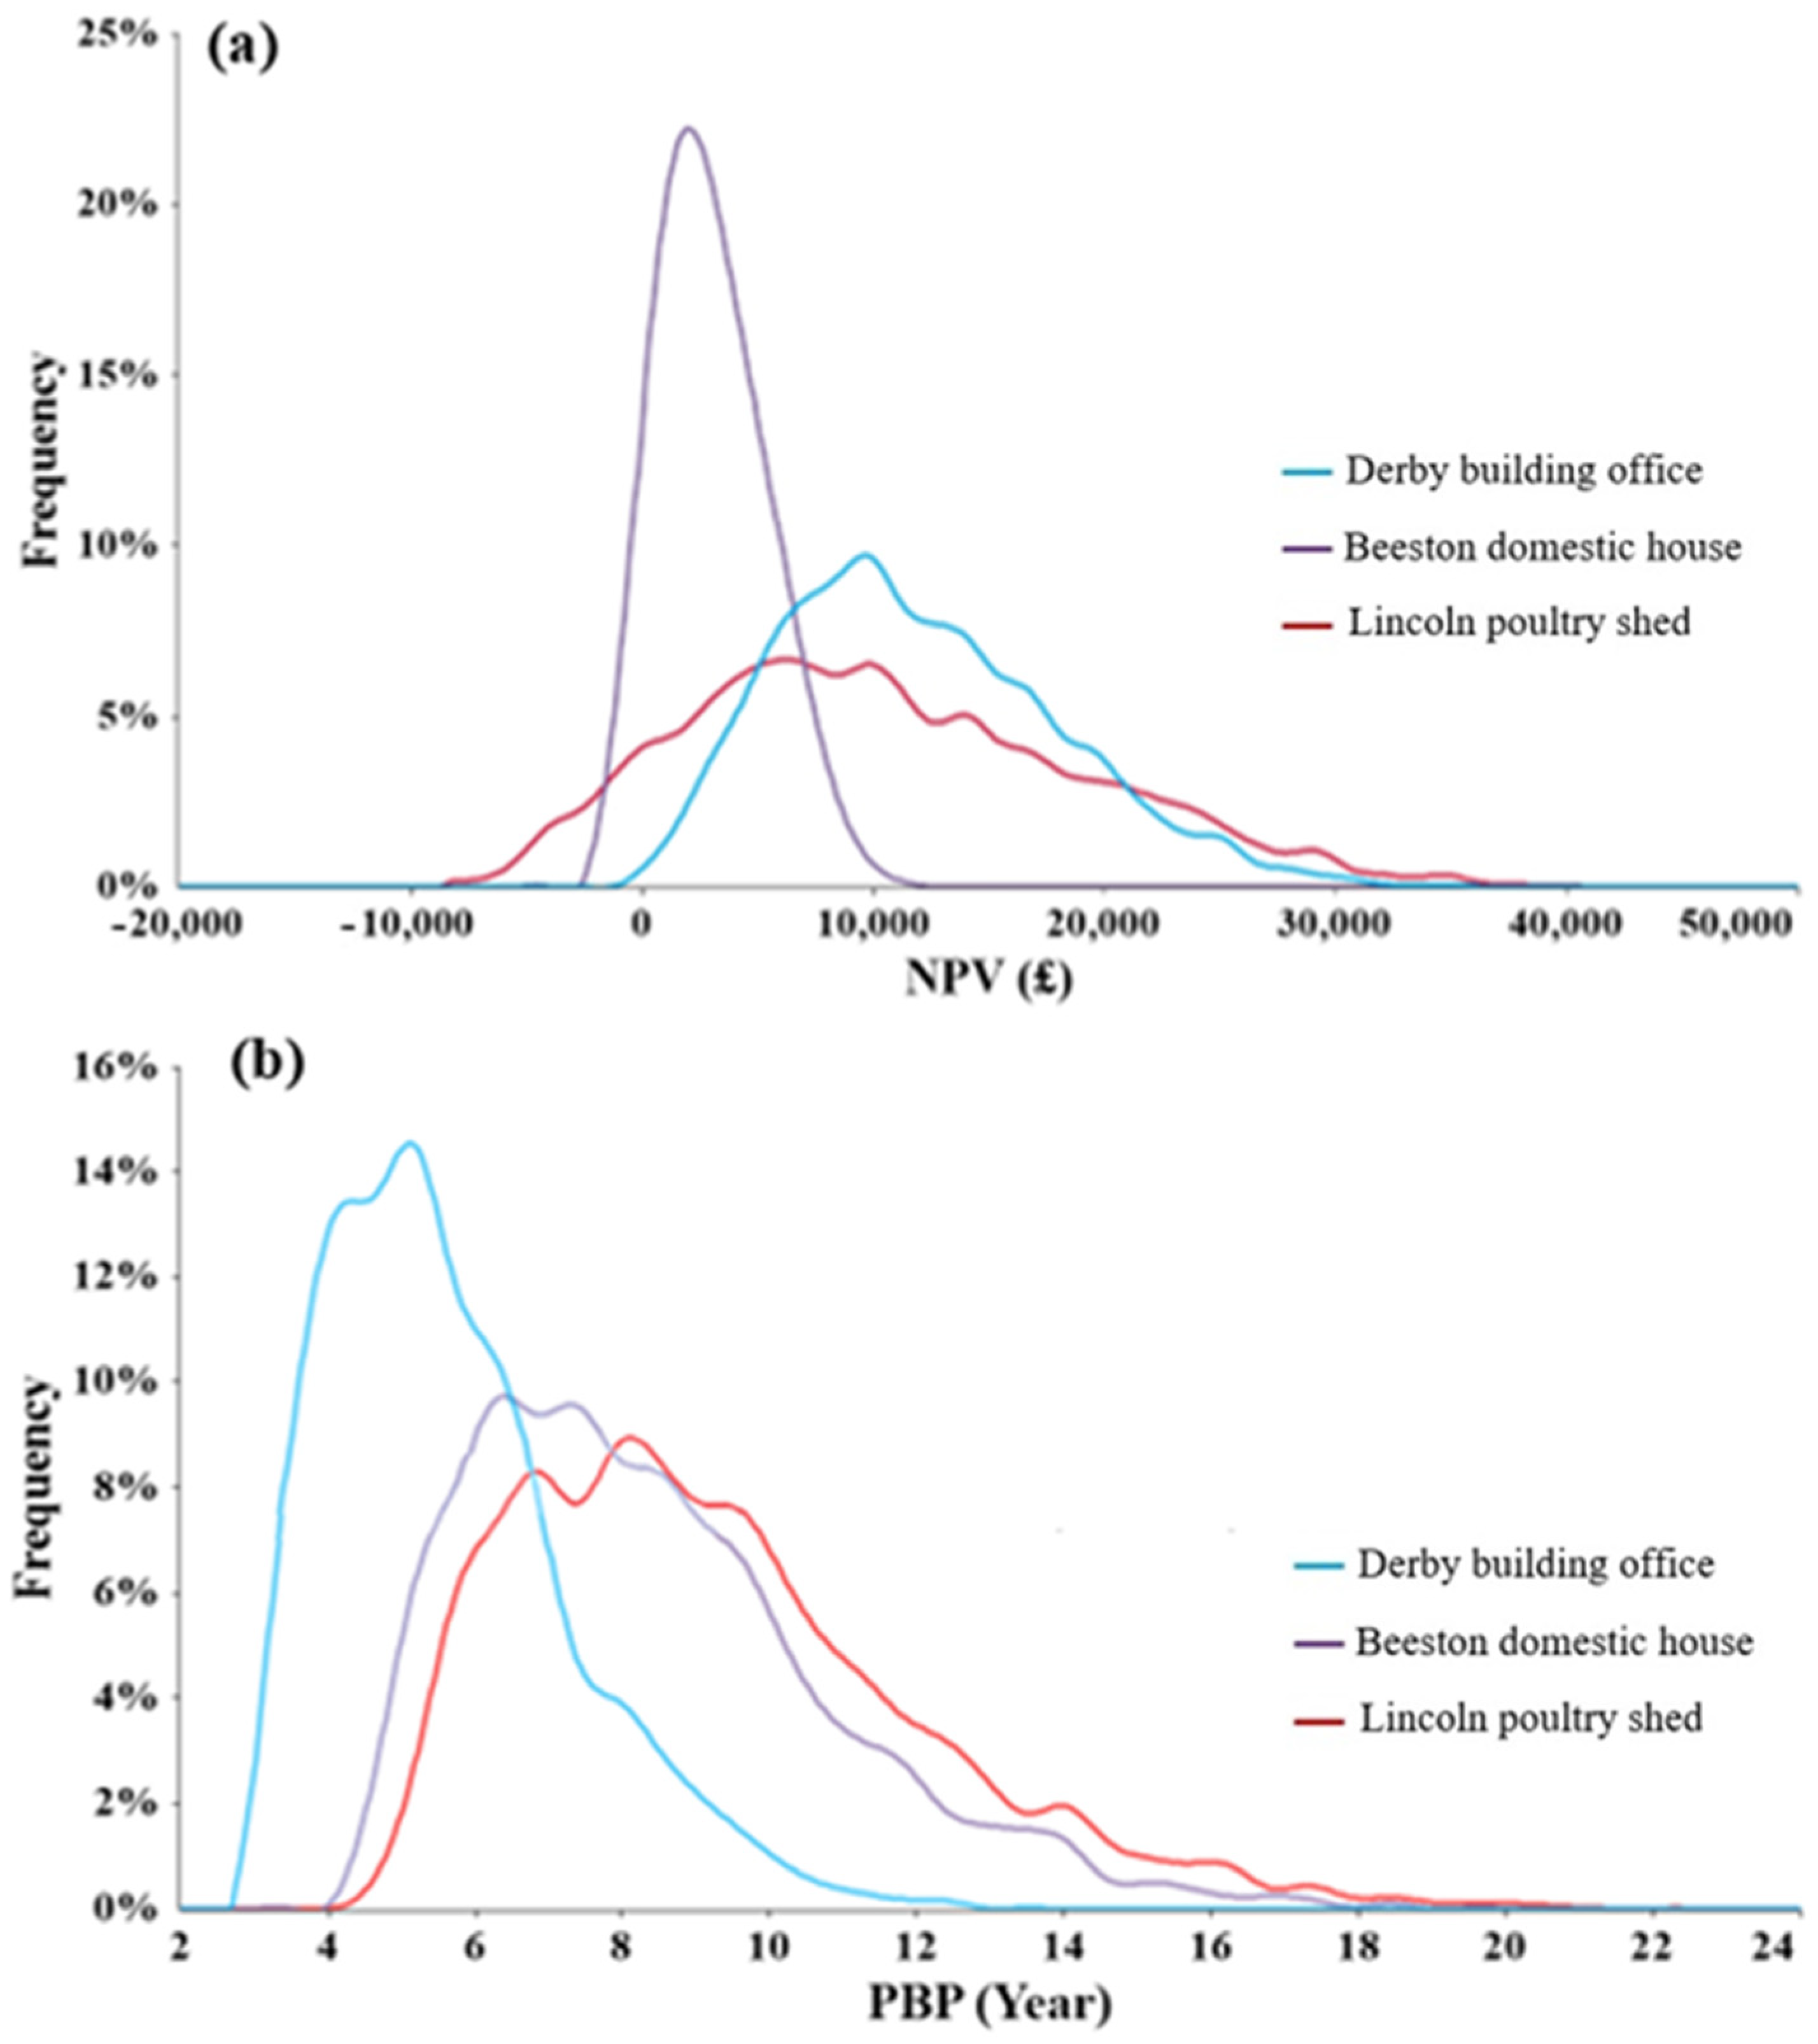
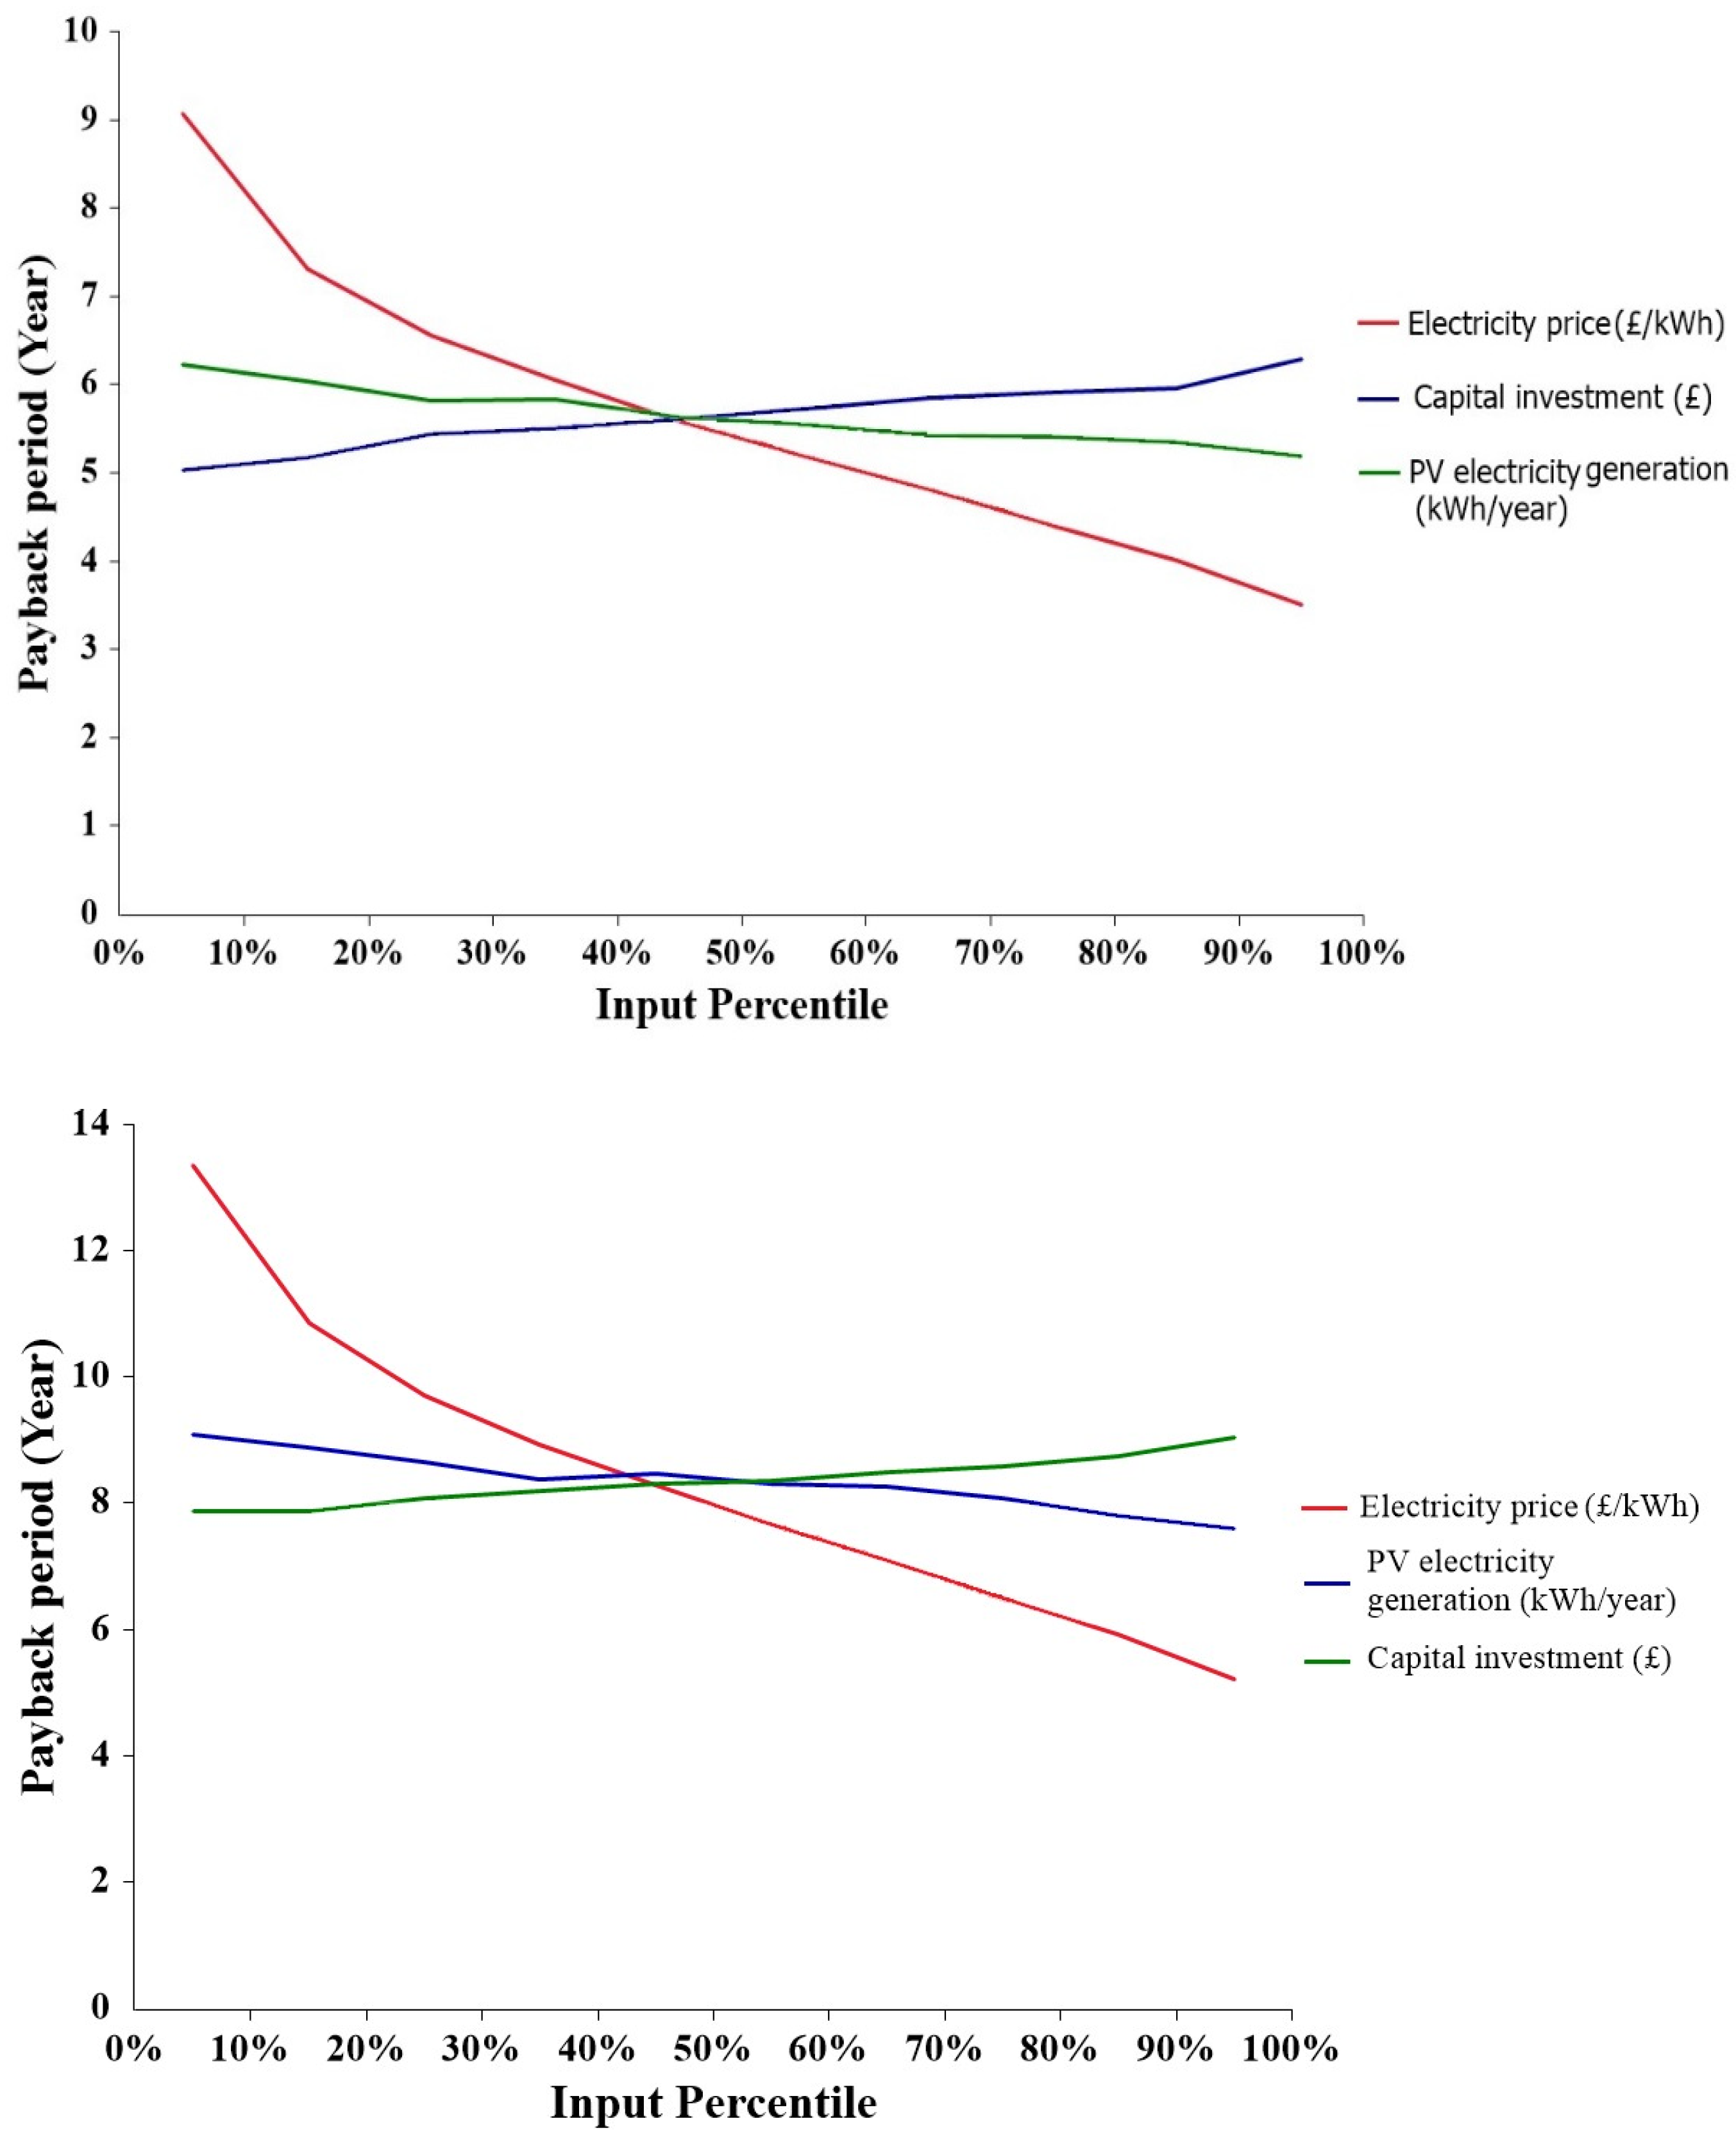
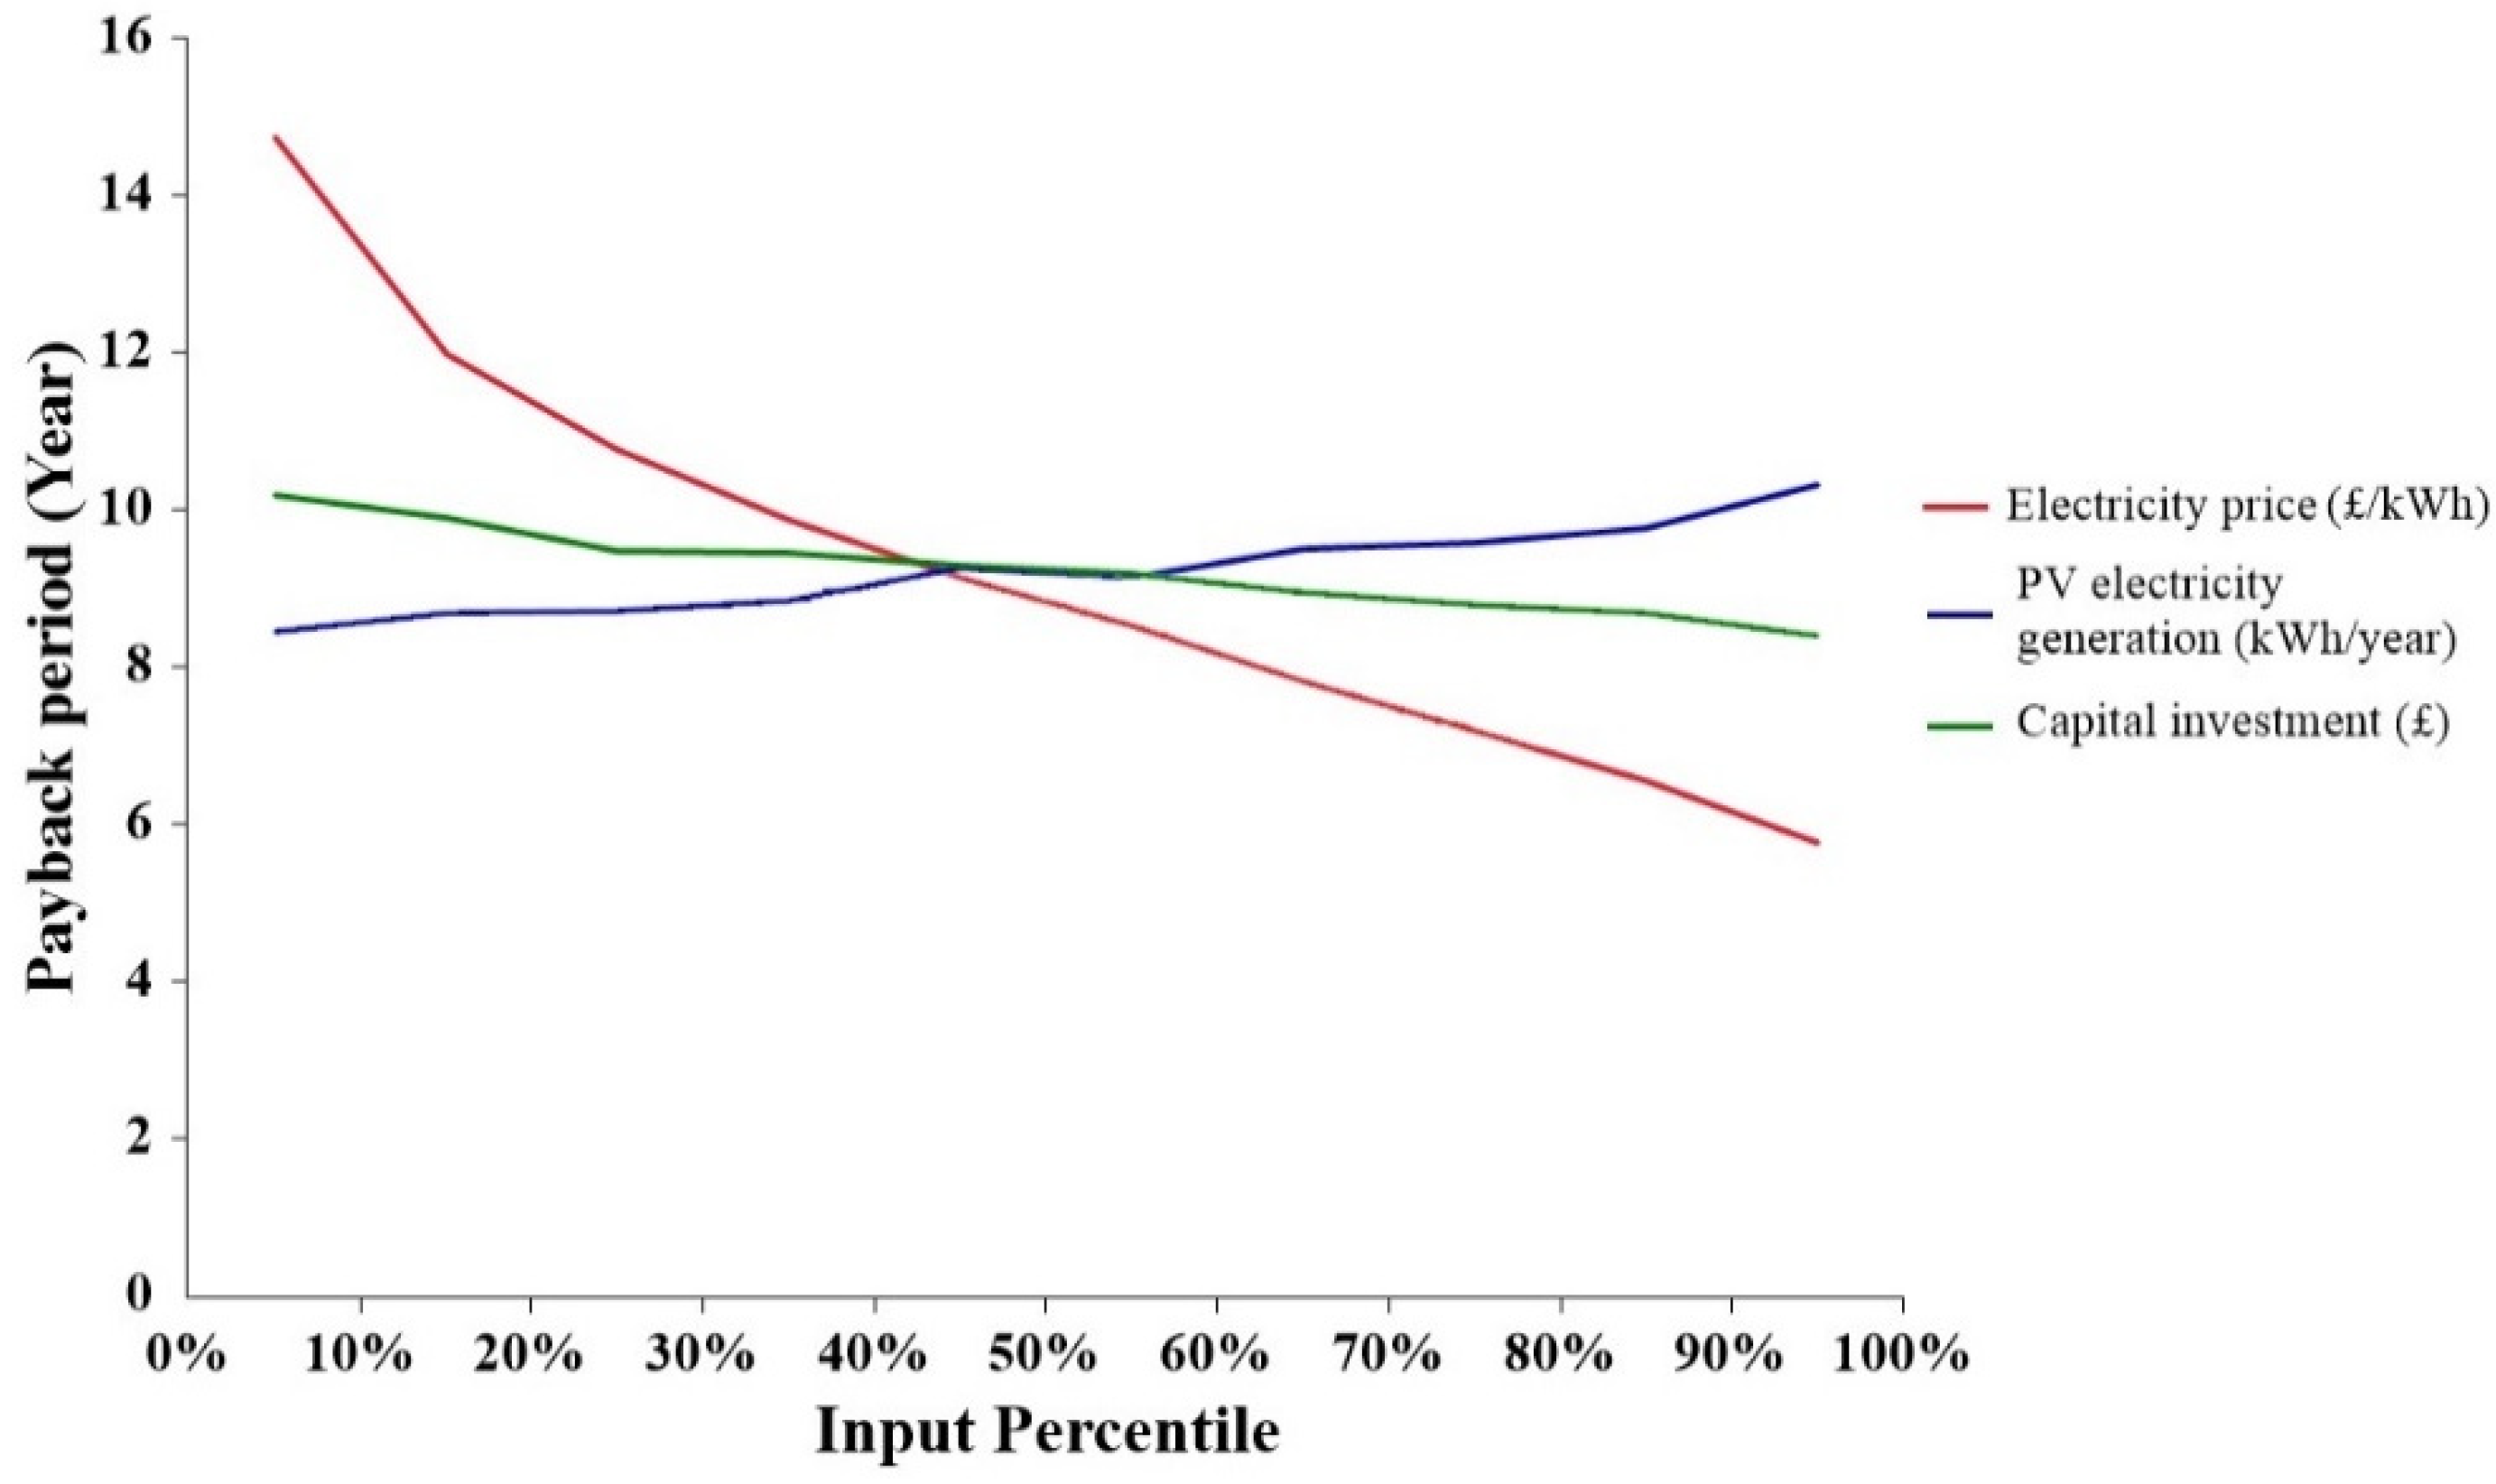
- Based on the 25-year lifetime, the NPVs of the office building, domestic building, and poultry shed are £9108.4, £1717.91, and £7275.86, with the corresponding PBPs of 6.15 years, 9.12 years, and 9.41 years, respectively.
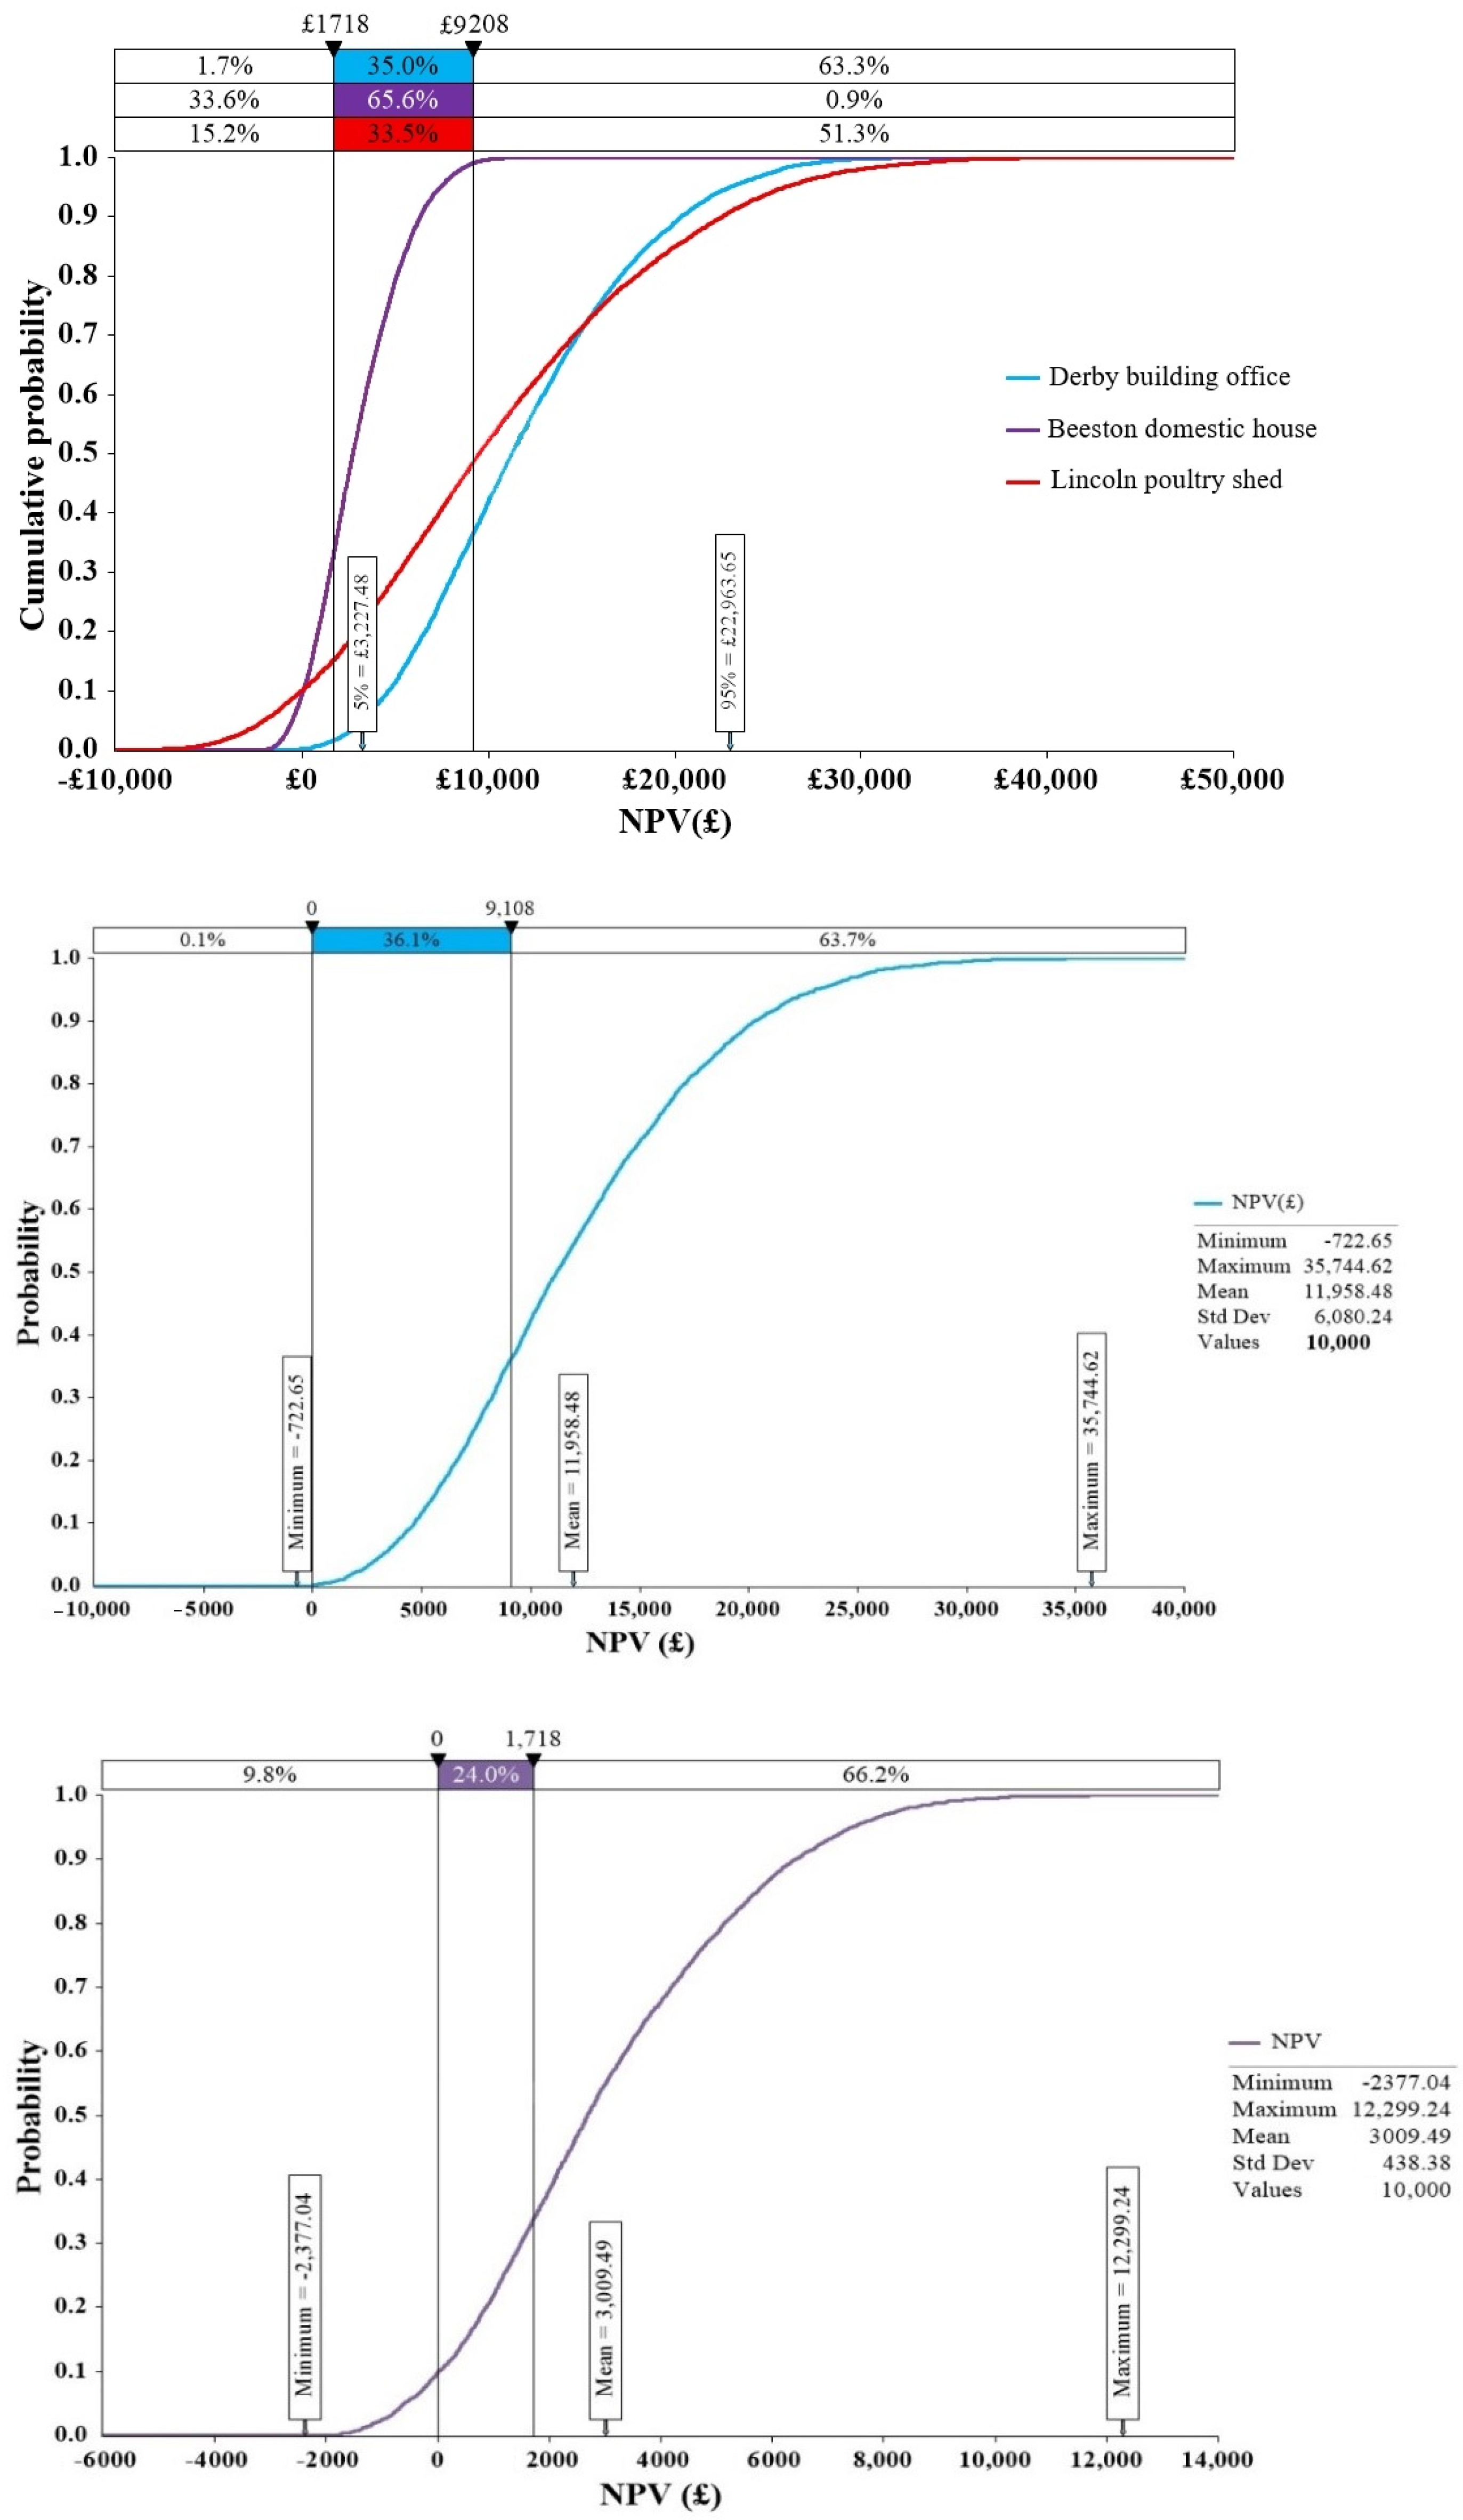
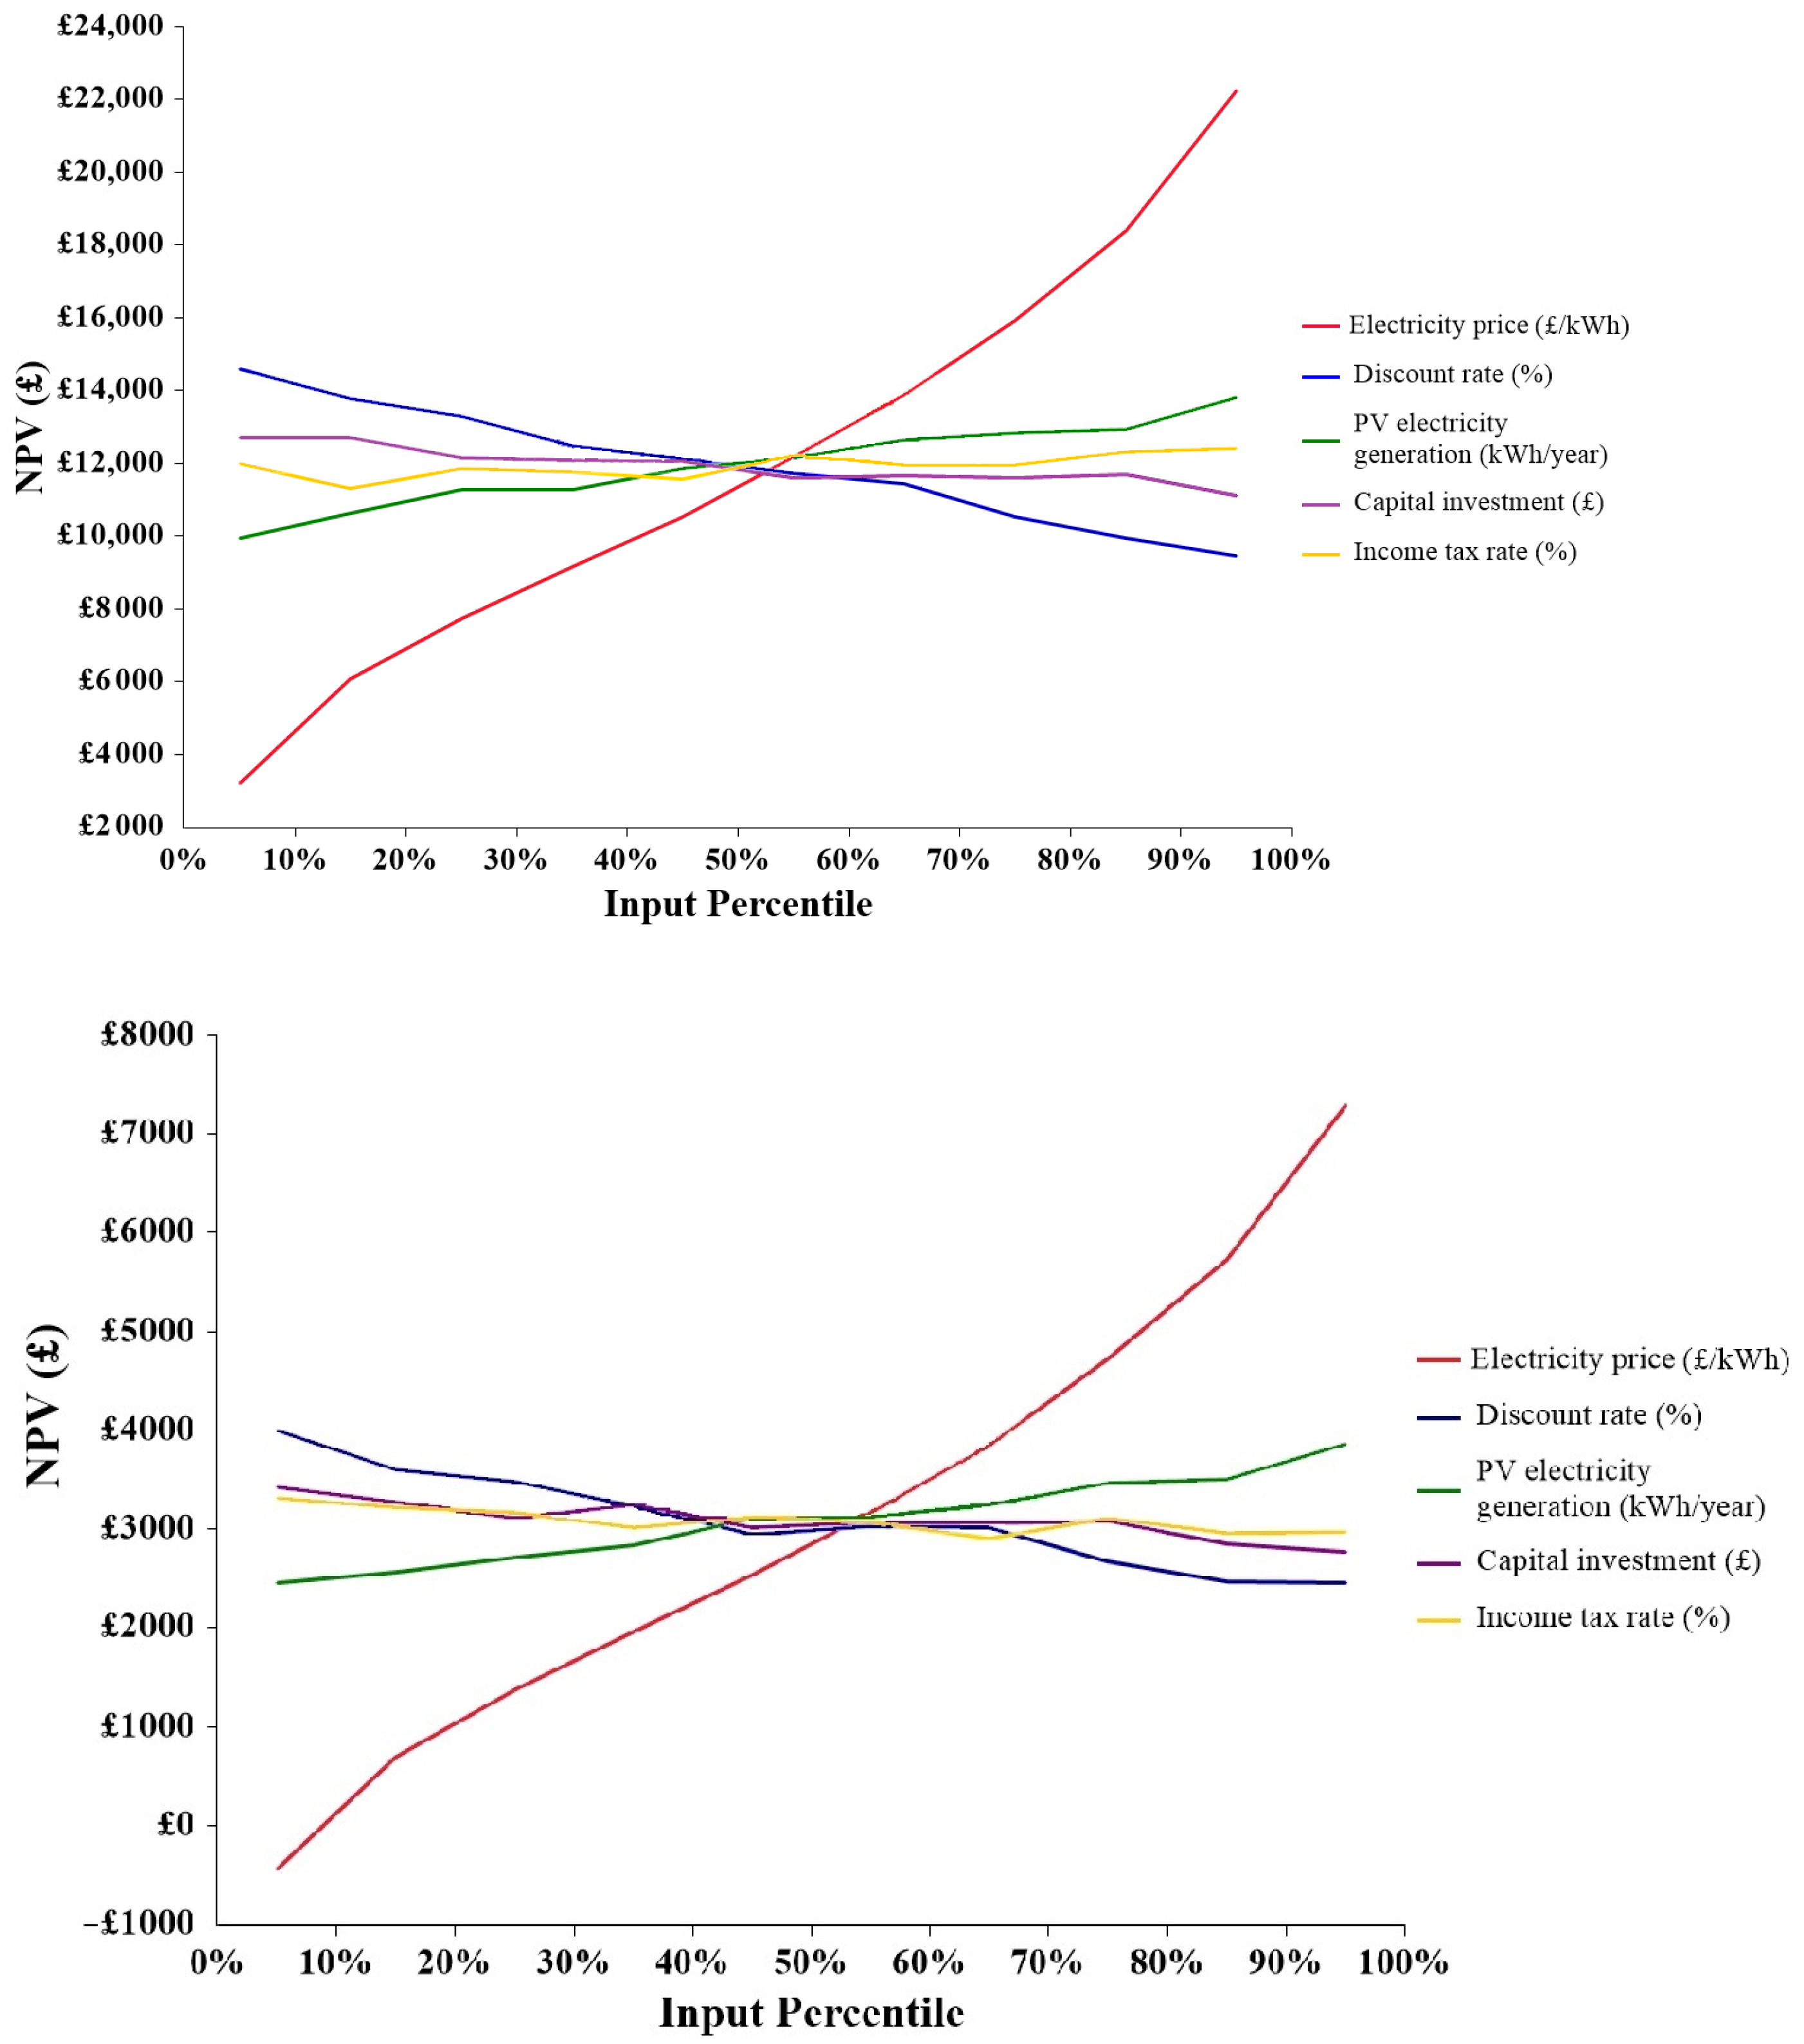
- The economic sensitive evaluation indicates that the capital investment and discount rate have significant effects on the NPV and PBP; however, the income tax rate has less influence on the NPV and PBP.
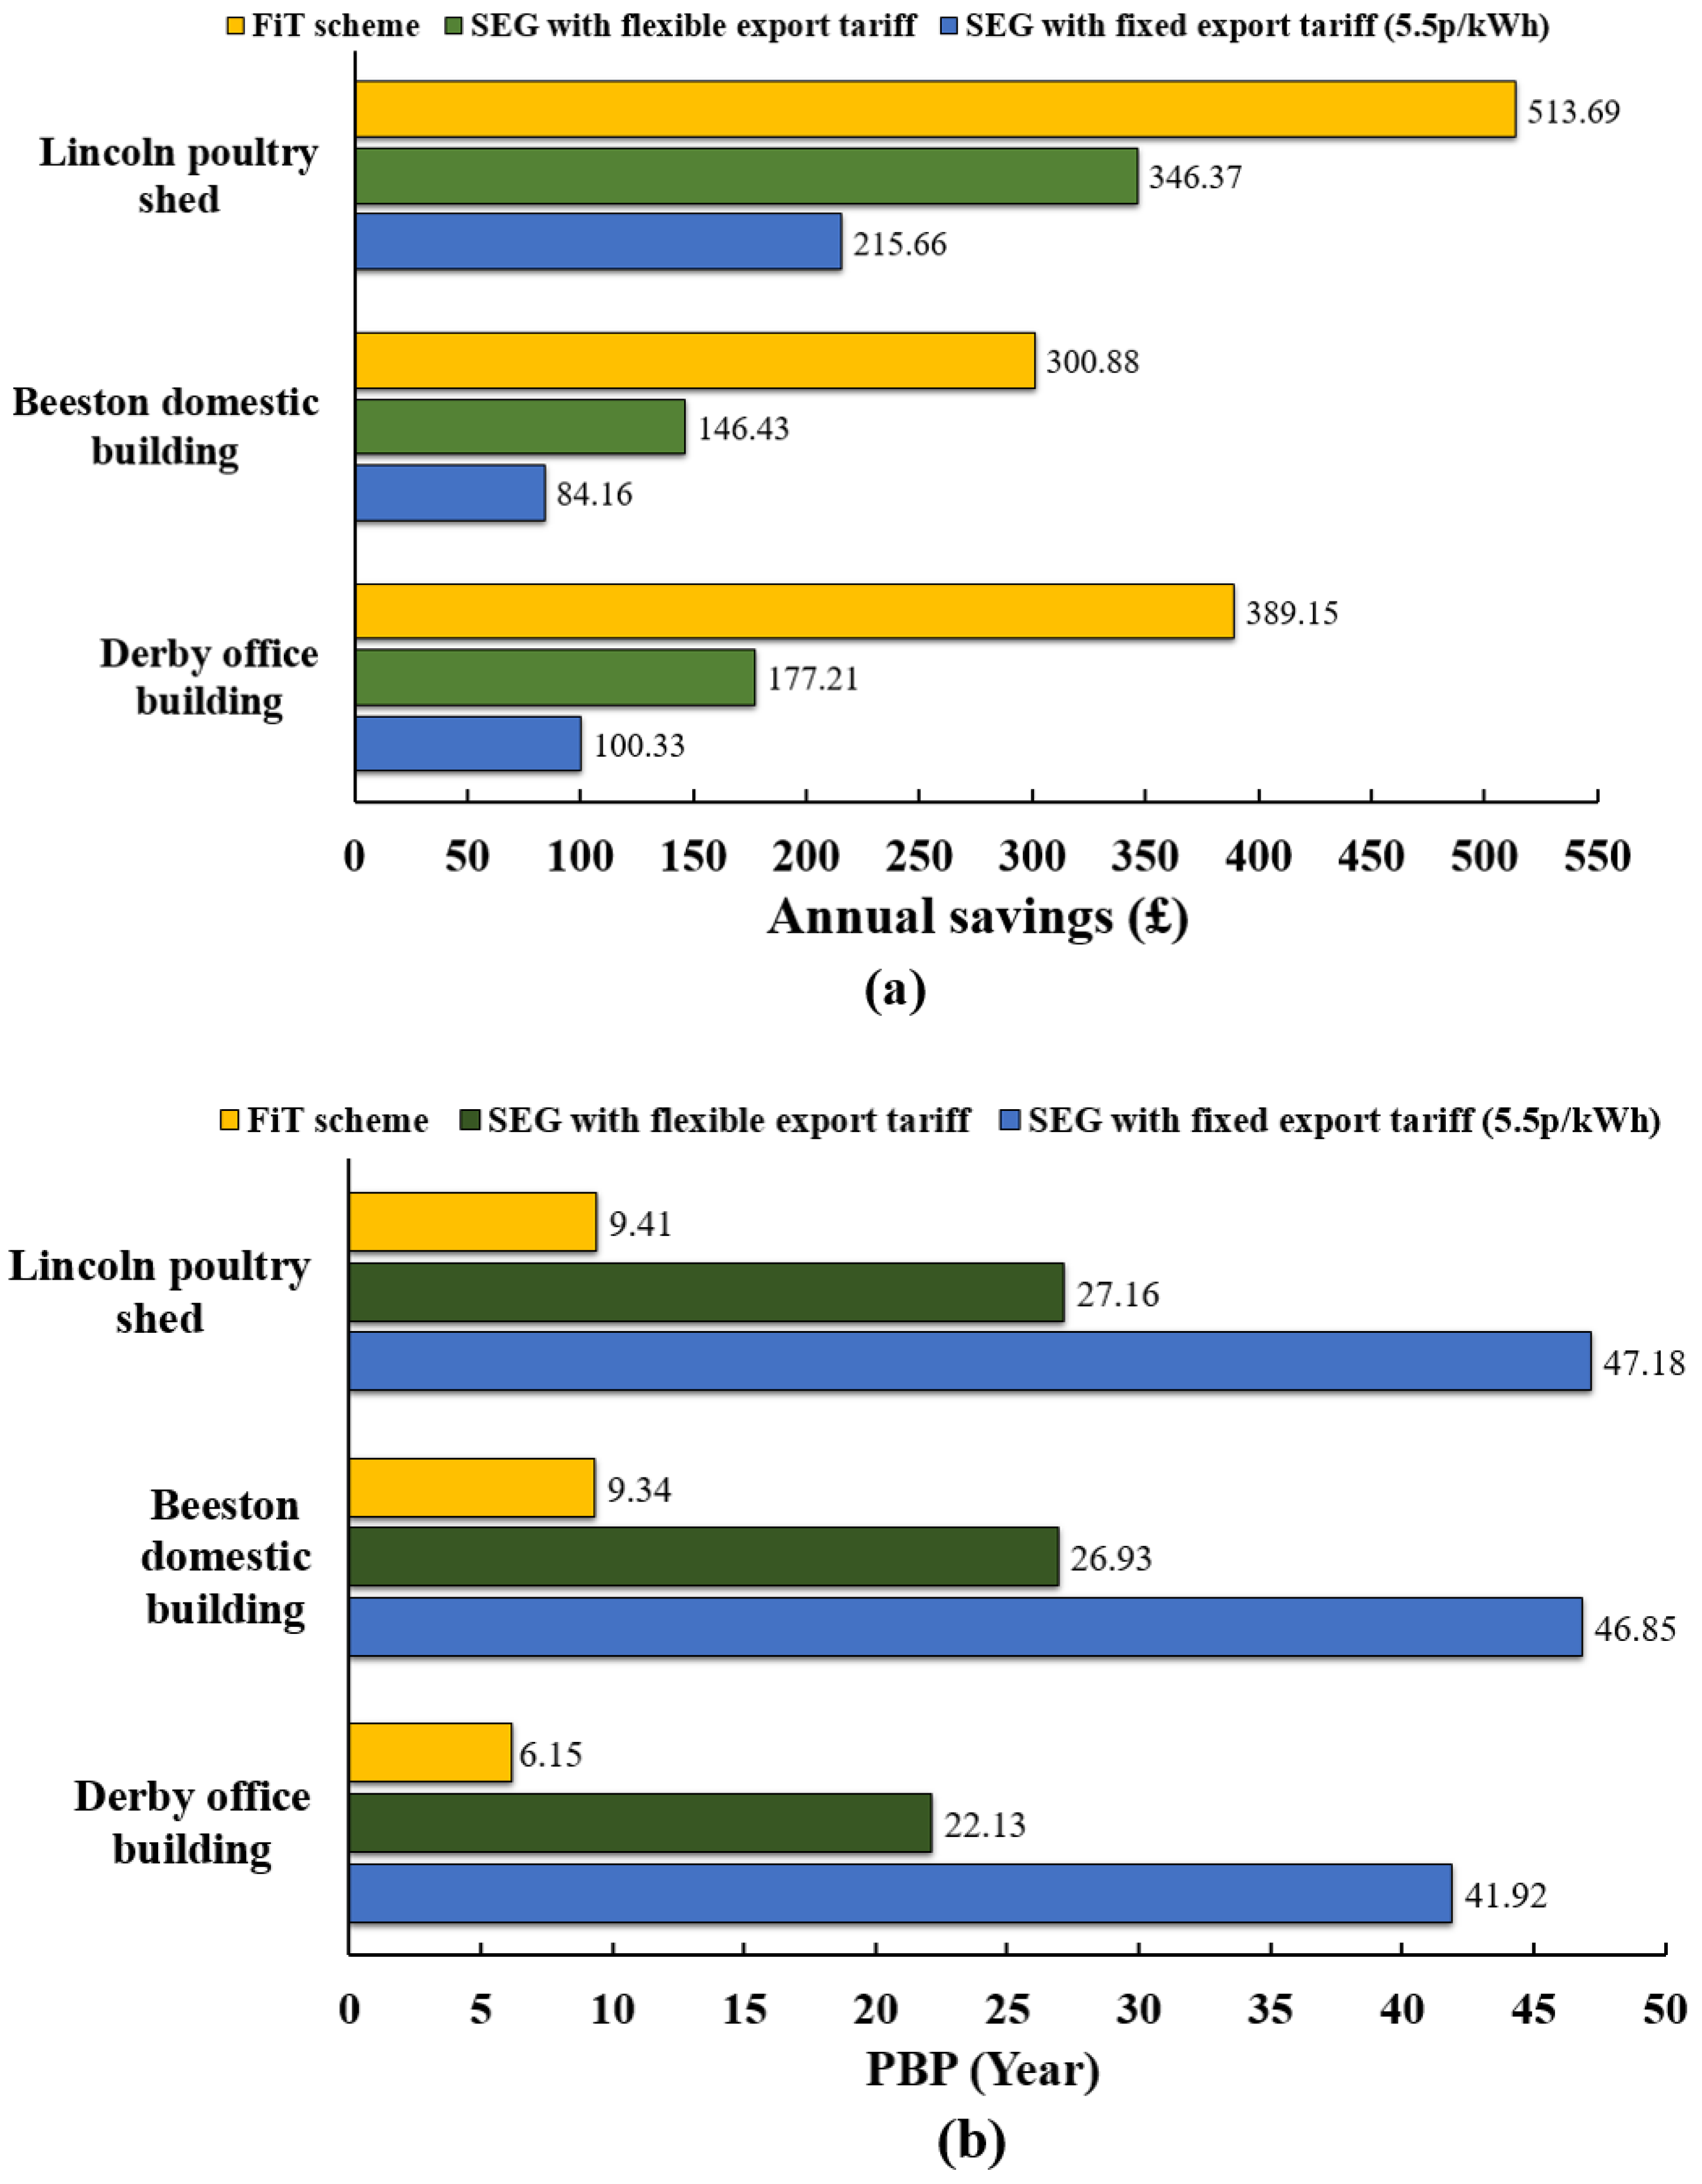
- Yearly savings on the basis of the FiT and SEG schemes with flexible and fixed export tariffs are £513.69, £346.37, and £215.66 for the poultry shed, £300.88, £146.43, and £84.16 for the domestic building, as well as £389.15, £177.21, and £100.33 for the office building, respectively.
- The PBPs on the basis of the FiT scheme are 9.41 years for the poultry shed, 9.34 years for the domestic building, and 6.15 years for the office building, which are far less than those under the SEG scheme with a fixed export tariff for 27.16 years, 26.93 years, and 22.13 years as well as the SEG scheme with flexible export tariff for 47.18 years, 46.85 years, and 41.92 years, respectively. The FiT scheme has the shortest payback period compared with the SEG scheme.
Author Contributions
Funding
Informed Consent Statement
Data Availability Statement
Conflicts of Interest
Abbreviations
| Nomenclature | |
| Bt | Beam direct irradiance on a tilted surface (W/m2) |
| b0 | Incidence angle modifier coefficient |
| Dt | Diffuse irradiance on a tilted surface diffuse horizontal irradiance (W/m2) |
| ID | Diode reverse saturation current |
| Ip | Photocurrent |
| N | Number of PV module |
| PAC | Electrical energy output of the inverter |
| Vth | Thermal equivalent voltage (V) |
| Rt | Reflected on a tilted surface (W/m2) |
| Rsh | Shunt resistance (Ω) |
| Rs | Series resistance (Ω) |
| UPV | Heat transfer coefficient |
| Ta | Air temperature (°C) |
| c | Thermal capacity (J/kg·K) |
| k | Boltzmann’s constant (1.381 × 10⁻²³ J/K) |
| q | Electron charge (1.602 × 10⁻¹⁹ coulomb) |
| T | Temperature (°C) |
| Greek Letters | |
| β | Slope/tilt/inclination angle of the PV module |
| Θz | Solar zenith angle |
| Θ | Incidence angle of the radiation |
| αc | Absorptance coefficient |
| ηSTC | Efficiency (%) |
| μP,mp | Temperature coefficient of the module’s maximum power |
| τ | Transmittance of the glass cover (%). |
| Abbreviations | |
| AMR | Automatic meter reading |
| ET | Export tariff |
| FiT | Feed-in tariff |
| IAM | Incidence angle modifier |
| LCC | Life-cycle cost |
| LCOE | Levelized cost of electricity |
| NPV | Net present value |
| OWC | Oscillating water column |
| PBP | Payback period |
| PV | Photovoltaic |
| ROR | Rate of return |
| SEG | Smart Export Guarantee |
| STC | Standard test condition |
| WGBC | World Green Building Council |
References
- Costa, E.; Teixeira, A.C.R.; Costa, S.C.S.; Consoni, F.L. Influence of public policies on the diffusion of wind and solar PV sources in Brazil and the possible effects of COVID-19. Renew. Sustain. Energy Rev. 2022, 162, 112449. [Google Scholar] [CrossRef]
- Zhang, S.; Ocłoń, P.; Klemeš, J.J.; Michorczyk, P.; Pielichowska, K.; Pielichowski, K. Renewable energy systems for building heating, cooling and electricity production with thermal energy storage. Renew. Sustain. Energy Rev. 2022, 165, 112560. [Google Scholar] [CrossRef]
- Destek, M.A.; Manga, M.; Cengiz, O.; Destek, G. Investigating the potential of renewable energy in establishing global peace: Fresh evidence from top energy consumer countries. Renew. Energy 2022, 197, 170–177. [Google Scholar] [CrossRef]
- Qin, J.; Jiang, H.; Lu, N.; Yao, L.; Zhou, C. Enhancing solar PV output forecast by integrating ground and satellite observations with deep learning. Renew. Sustain. Energy Rev. 2022, 167, 112680. [Google Scholar] [CrossRef]
- Castrejon-Campos, O.; Aye, L.; Hui, F.K.P. Effects of learning curve models on onshore wind and solar PV cost developments in the USA. Renew. Sustain. Energy Rev. 2022, 160, 112278. [Google Scholar] [CrossRef]
- IRENA. Renewable Energy Statistics 2021. Available online: https://irena.org/publications/2021/Aug/Renewable-energy-statistics-2021 (accessed on 5 August 2021).
- 2021 Global Status Report for Buildings and Construction. Available online: https://www.unep.org/ndc/resources/report/2021-global-status-report-buildings-and-construction#:~:text=2021%20Global%20Status%20Report%20for%20Buildings%20and%20Construction,energy%20use%2C%20emissions%2C%20technologies%2C%20policies%2C%20and%20investments%20globally (accessed on 11 May 2022).
- Climate Change. Becoming Carbon Neutral by 2030. Available online: https://new.brighton-hove.gov.uk/climate-change/becoming-carbon-neutral-2030 (accessed on 9 February 2020).
- Luz, C.M.A.; Tofoli, F.L.; Vicente, P.D.S.; Vicente, E.M. Assessment of the ideality factor on the performance of photovoltaic modules. Energy Convers. Manag. 2018, 167, 63–69. [Google Scholar] [CrossRef]
- Shukla, A.K.; Sudhakar, S.; Baredar, P. A comprehensive review on design of building integrated photovoltaic system. Energy Build. 2016, 128, 99–110. [Google Scholar] [CrossRef]
- Allouhi, A.; Saadani, R.; Kousksou, T.; Saidur, R.; Jamil, A.; Rahmoune, M. Grid-connected PV systems installed on institutional buildings: Technology comparison, energy analysis and economic performance. Energy Build. 2016, 130, 188–201. [Google Scholar] [CrossRef]
- Hassan, A.S.; Cipcigan, L.; Jenkins, N. Optimal battery storage operation for PV systems with tariff incentives. Appl. Energy 2017, 203, 422–441. [Google Scholar] [CrossRef]
- Parra, D.; Patel, M.K. Effect of tariffs on the performance and economic benefits of PV-coupled battery systems. Appl. Energy 2016, 164, 175–187. [Google Scholar] [CrossRef]
- Simola, A.; Kosonen, A.; Ahonen, T.; Ahola, J.; Korhonen, M.; Hannula, T. Optimal dimensioning of a solar PV plant with measured electrical load curves in Finland. Sol. Energy 2018, 170, 113–123. [Google Scholar] [CrossRef]
- Mateus, R.; Silva, S.M.; Almeida, M.G. Environmental and cost life cycle analysis of the impact of using solar systems in energy renovation of Southern European single-family buildings. Renew. Energy 2019, 137, 82–92. [Google Scholar] [CrossRef]
- Nacer, T.; Hamidat, A.; Nadjemi, O.; Bey, M. Feasibility study of grid connected photovoltaic system in family farms for electricity generation in rural areas. Renew. Energy 2016, 96 Pt A, 305–318. [Google Scholar] [CrossRef]
- Osma-Pinto, G.; Ordóñez-Plata, G. Measuring factors influencing performance of rooftop PV panels in warm tropical climates. Sol. Energy 2019, 185, 112–123. [Google Scholar] [CrossRef]
- Saheli, M.A.; Lari, K.; Salehi, G.; Azad, M.T. Techno-economic assessment of a hybrid on grid PV-wave system: A case study in Caspian Sea. Renew. Energy 2022, 186, 596–608. [Google Scholar] [CrossRef]
- Zimmerman, R.; Panda, A.; Bulović, V. Techno-economic assessment and deployment strategies for vertically-mounted photovoltaic panels. Appl. Energy 2020, 276, 115149. [Google Scholar] [CrossRef]
- Ozcan, H.G.; Gunerhan, H.; Yildirim, N.; Hepbasli, A. A comprehensive evaluation of PV electricity production methods and life cycle energy-cost assessment of a particular system. J. Clean. Prod. 2019, 238, 11788. [Google Scholar] [CrossRef]
- Ahmed, N.; Khan, A.N.; Ahmed, N.; Aslam, A.; Imran, K.; Sajid, M.B.; Waqas, A. Techno-economic potential assessment of mega scale grid-connected PV power plant in five climate zones of Pakistan. Energy Convers. Manag. 2021, 237, 114097. [Google Scholar] [CrossRef]
- McKenna, E.; Pless, J.; Darby, S.J. Solar photovoltaic self-consumption in the UK residential sector: New estimates from a smart grid demonstration project. Energy Policy 2018, 118, 482–491. [Google Scholar] [CrossRef]
- Koppelaar, R.H.E.M. Solar-PV energy payback and net energy: Meta-assessment of study quality, reproducibility, and results harmonization. Renew. Sustain. Energy Rev. 2017, 72, 1241–1255. [Google Scholar] [CrossRef]
- Mirzania, P.; Balta-Ozkan, N.; Ford, A. An innovative viable model for community-owned solar PV projects without FIT: Comprehensive techno-economic assessment. Energy Policy 2020, 146, 111727. [Google Scholar] [CrossRef]
- PVSYST 6.0.1: Software for Photovoltaic System. Available online: http://www.pvsyst.com/en/ (accessed on 5 March 2016).
- Cui, Y.; Zhu, J.; Meng, F.; Zoras, S.; McKechnie, J.; Chu, J. Energy assessment and economic sensitivity analysis of a grid-connected photovoltaic system. Renew. Energy 2020, 150, 101–115. [Google Scholar] [CrossRef]
- Sharp ND-R250A5 (250W) Solar Panel. Available online: http://www.solardesigntool.com/components/module-panel-solar/Sharp/1493/ND-R250A5/specification-data-sheet.html (accessed on 3 March 2014).
- Afore HNS Inverter. Available online: http://upload.evocdn.co.uk/ecolution/uploads/product_download/2_0_afore-user-manual.pdf (accessed on 12 May 2018).
- Sangwongwanich, A.; Yang, Y.; Sera, D.; Blaabjerg, F. Lifetime evaluation of grid-connected PV inverters considering panel degradation rates and installation sites. IEEE Trans. Power Electron. 2018, 33, 1225–1236. [Google Scholar] [CrossRef]
- Energy Price Statistics. 2013. Available online: https://www.gov.uk/government/collections/energy-price-statistics (accessed on 15 October 2013).
- Cherrington, R.; Goodship, V.; Longfield, A.; Kirwan, K. The feed-in tariff in the UK: A case study focus on domestic photovoltaic systems. Renew. Energy 2013, 50, 421–426. [Google Scholar] [CrossRef]
- Ofgem. Domestic Renewable Heat Incentive. Available online: https://www.ofgem.gov.uk/environmental-programmes/domestic-rhi (accessed on 15 April 2016).
- McCormick, P.G.; Suehrcke, H. The effect of intermittent solar radiation on the performance of PV systems. Sol. Energy 2018, 171, 667–674. [Google Scholar] [CrossRef]
- Romero-Fiances, I.; Livera, A.; Theristis, M.; Makrides, G.; Stein, J.S.; Nofuentes, G.; Casa, J.; Georghiou, G.E. Impact of duration and missing data on the long-term photovoltaic degradation rate estimation. Renew. Energy 2022, 181, 738–748. [Google Scholar] [CrossRef]
- Theristis, M.; Livera, A.; Micheli, L.; Ascencio-Vasquez, J.; Makrides, G.; Georghiou, H.; Stein, J. Comparative analysis of change-point techniques for nonlinear photovoltaic performance degradation rate estimations. IEEE J. Photovolt. 2021, 11, 1511–1518. [Google Scholar] [CrossRef]
- Mayer, M.J.; Gróf, G. Techno-economic optimization of grid-connected, ground-mounted photovoltaic power plants by genetic algorithm based on a comprehensive mathematical model. Sol. Energy 2020, 202, 210–226. [Google Scholar] [CrossRef]
- Aronescu, A.; Appelbaum, J. Design optimization of photovoltaic solar fields-insight and methodology. Renew. Sustain. Energy Rev. 2017, 76, 882–893. [Google Scholar] [CrossRef]
- Gallardo-Saavedra, S.; Karlsson, B. Simulation, validation and analysis of shading effects on a PV system. Sol. Energy 2018, 170, 828–839. [Google Scholar] [CrossRef]
- Dolara, A.; Leva, S.; Manzolini, G. Comparison of different physical models for PV power output prediction. Sol. Energy 2015, 119, 83–99. [Google Scholar] [CrossRef]
- Duffie, J.A.; Beckman, W.A. Solar Engineering of Thermal Processes, 4th ed.; John Wiley & Sons: New York, NY, USA, 2013. [Google Scholar]
- Smart Export Guarantee. Available online: https://www.greenmatch.co.uk/green-energy/grants/smart-export-guarantee#faq (accessed on 1 August 2019).
- The Smart Export Guarantee. 2022. Available online: https://www.theecoexperts.co.uk/solar-panels/smart-export-guarantee (accessed on 20 July 2022).
- Octopus Energy. Available online: https://octopus.energy/blog/agile-pricing-explained/ (accessed on 9 April 2019).
- Smart Export Guarantee Tariffs: Which Is the Best Rate? Available online: https://blog.spiritenergy.co.uk/homeowner/smart-export-guarantee-tariffs (accessed on 1 January 2020).
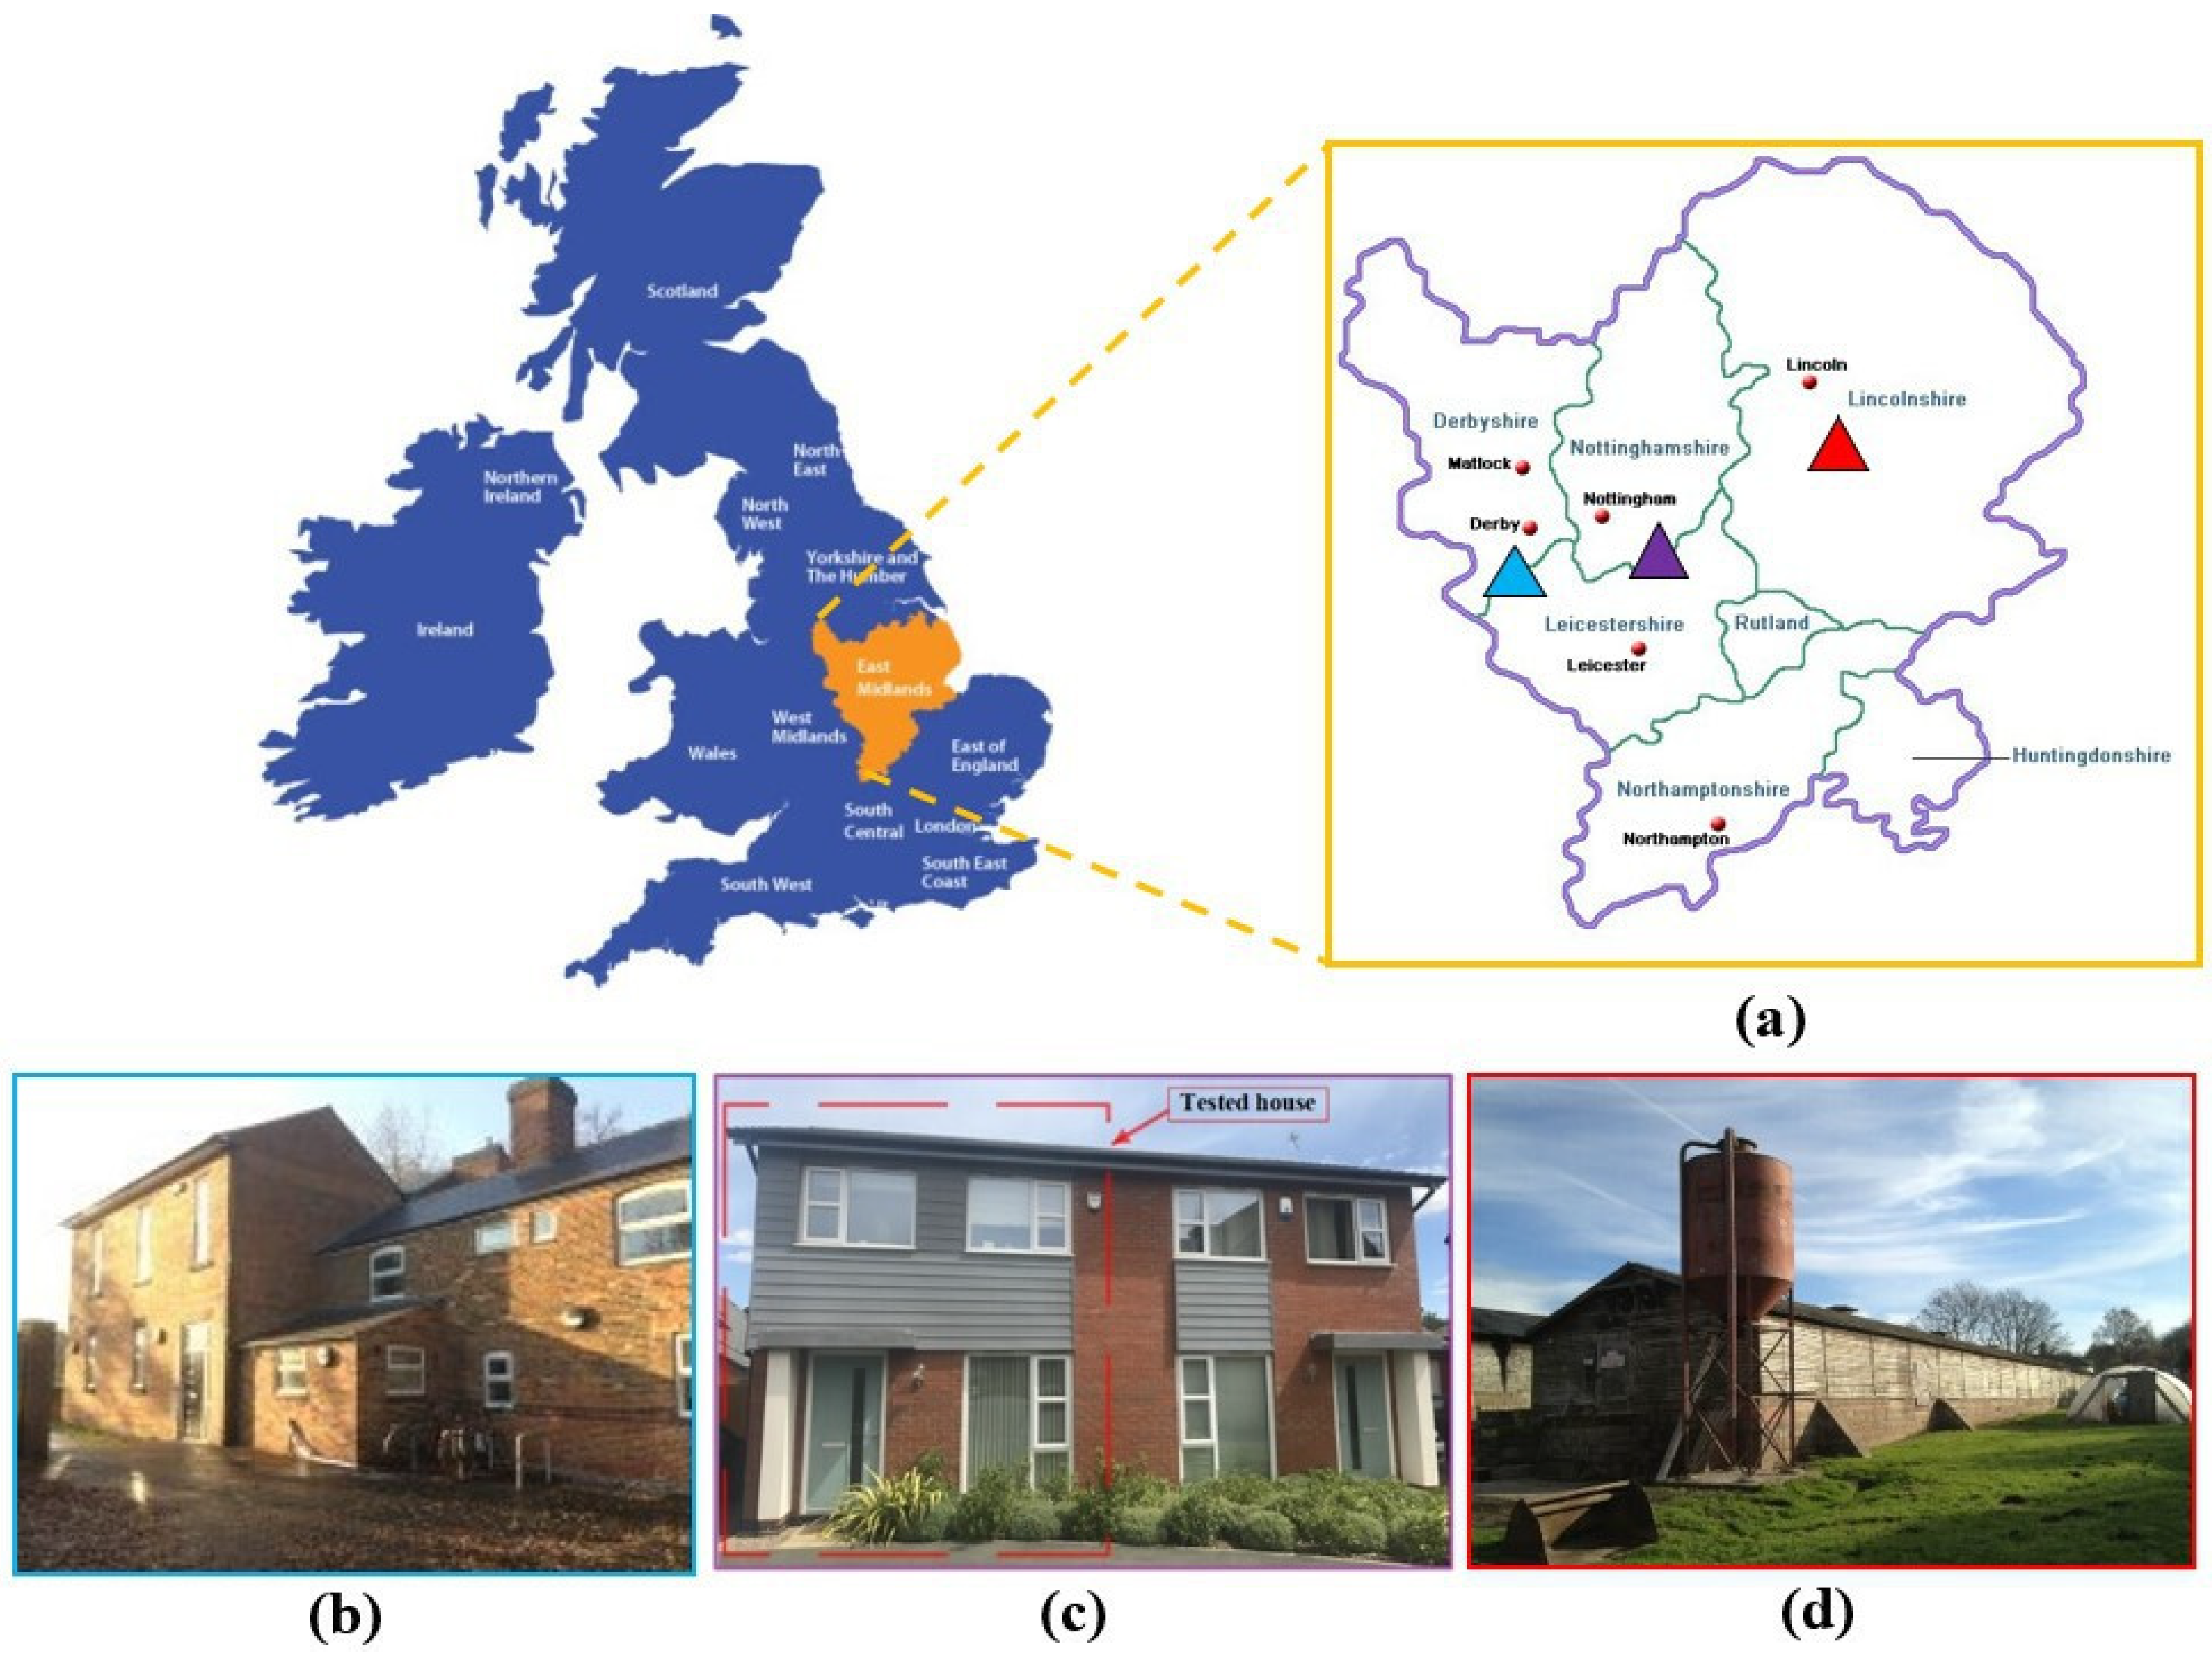





| Derby | ||||||||||||
| January | February | March | April | May | June | July | August | September | October | November | December | |
| Solar radiation (kWh/m2/month) | 20.80 | 34.10 | 74.40 | 114.60 | 143.10 | 148.60 | 144.40 | 118.5 | 89.01 | 49.34 | 27.05 | 17.93 |
| Ambient air temperature (°C) | 4.90 | 4.90 | 6.40 | 8.60 | 12.10 | 15.01 | 16.62 | 16.80 | 14.11 | 10.9 | 7.20 | 4.73 |
| Wind speed (m/s) | 5.20 | 4.80 | 4.79 | 4.20 | 4.19 | 3.80 | 3.79 | 3.59 | 3.80 | 4.29 | 4.69 | 4.49 |
| Beeston | ||||||||||||
| January | February | March | April | May | June | July | August | September | October | November | December | |
| Solar radiation (kWh/m2/month) | 18.96 | 33.03 | 69.19 | 100.06 | 133.69 | 144.57 | 139.78 | 120.42 | 85.63 | 51.29 | 25.22 | 14.82 |
| Ambient air temperature (°C) | 5.66 | 5.79 | 7.72 | 9.58 | 12.98 | 16.29 | 17.85 | 18.39 | 15.50 | 11.69 | 7.91 | 5.32 |
| Wind speed (m/s) | 4.27 | 4.51 | 3.89 | 3.81 | 3.92 | 3.68 | 3.51 | 3.11 | 3.41 | 3.91 | 3.49 | 3.92 |
| Newark-on-Trent | ||||||||||||
| January | February | March | April | May | June | July | August | September | October | November | December | |
| Solar radiation (kWh/m2/month) | 21.30 | 32.23 | 73.22 | 117.84 | 142.43 | 148.61 | 145.17 | 114.10 | 88.60 | 49.62 | 26.40 | 17.72 |
| Ambient air temperature (°C) | 4.50 | 4.60 | 6.30 | 8.70 | 12.20 | 15.01 | 16.70 | 16.81 | 14.10 | 11.02 | 7.01 | 4.52 |
| Wind speed (m/s) | 5.50 | 4.99 | 5.00 | 4.49 | 4.39 | 3.90 | 3.89 | 3.79 | 4.00 | 4.59 | 4.89 | 4.69 |
| Item | |
| PV Module | |
| Module size (single) | 1.652 m × 0.994 m × 0.046 m |
| No. of PV module | 22/12/50 |
| Cell type | Poly-crystalline |
| Efficiency | 15.5% |
| Maximum voltage/current | 30.90 V/8.10 A |
| Packing factor | 0.94 |
| Exposed roof area and title angle | |
| Active entire region | 59 m2/30 m2/85 m2 |
| Title angle | 30°/25°/20° |
| Inverter | Afore HNS4500TL/Afore HNS3000TL/Afore HNS6000TL |
| Item | Office Building | Domestic Building | Poultry Shed |
|---|---|---|---|
| PV array | £4167.24 | £2273 | £9949.84 |
| Inverter | £370 | £370 | £740 |
| Pipeline | £660 | £300 | £1360 |
| Isolation switch and power meter | £200 | £200 | £200 |
| Labour budget | £1200 | £800 | £2375 |
| Total capital investment | £6597.24 | £3943 | £14,524.84 |
| Estimated maintenance Budget | £150 | £80 | £240 |
| Item | Value |
|---|---|
| Electrical price | Feed-in-tariff (building usage): £0.1097/kWh |
| Export tariff (to the grid): £0.052/kWh | |
| Deposit | 10% |
| Interest rate of payment of principal | 8.2% |
| Inflation rate of inverter price | 3% |
| Inflation rate of M&I | 4.5% |
| Council tax for property tax | 2% |
| Inflation rate of electricity price | 6% |
| UK discount rate | 8.75% |
| Income tax rate | 20% |
| Inflation rate of extra property tax | 4% |
| Input Variable | Probability Distribution Type | Parameter | Office Building | Domestic Building | Poultry Shed |
|---|---|---|---|---|---|
| Capital investment |  | Range | 5831–7200 | 3500–4300 | 13,500–18,000 |
| A | 6597 | 3943 | 14525 | ||
| B | 2.8 | 1.1 | 7.4 | ||
| C | 1.9 | 0.18 | 4.3 | ||
| PV electrical generation |  | Range | 8500–11,000 | 3500–4500 | 12,000–16,000 |
| A | 8500 | 3500 | 12,000 | ||
| B | 9770 | 3938 | 14,060 | ||
| C | 11,000 | 4500 | 16,000 | ||
| Electrical price |  | Range | 0.055–0.22 | 0.055–0.22 | 0.055–0.22 |
| A | 0.055 | 0.055 | 0.055 | ||
| B | 0.1097 | 0.1097 | 0.1097 | ||
| C | 0.22 | 0.22 | 0.22 | ||
| Maintenance cost |  | Range | 120–185 | 72–88 | 210–280 |
| A | 150 | 80 | 240 | ||
| B | 0.070 | 0.31 | 0.61 | ||
| C | N/A | N/A | N/A | ||
| Deposit cost |  | Range | 488–1466 | 200–588.6 | 730–2174 |
| A | 488 | 200 | 730 | ||
| B | 977 | 394.3 | 1452.5 | ||
| C | 1466 | 588.6 | 2174 | ||
| Discount rate |  | Range | 0.065–0.11 | 0.065–0.11 | 0.065–0.11 |
| A | 0.065 | 0.065 | 0.065 | ||
| B | 0.875 | 0.875 | 0.875 | ||
| C | 0.11 | 0.11 | 0.11 | ||
| Inflation rate |  | Range | 0.055–0.065 | 0.055–0.065 | 0.055–0.065 |
| A | 0.055 | 0.055 | 0.055 | ||
| B | 0.06 | 0.06 | 0.06 | ||
| C | 0.065 | 0.065 | 0.065 | ||
| Inverter replacement cost |  | Range | 350–400 | 350–400 | 700–800 |
| A | 370 | 370 | 740 | ||
| B | 0.22 | 0.22 | 0.48 | ||
| C | N/A | N/A | N/A |
Disclaimer/Publisher’s Note: The statements, opinions and data contained in all publications are solely those of the individual author(s) and contributor(s) and not of MDPI and/or the editor(s). MDPI and/or the editor(s) disclaim responsibility for any injury to people or property resulting from any ideas, methods, instructions or products referred to in the content. |
© 2023 by the authors. Licensee MDPI, Basel, Switzerland. This article is an open access article distributed under the terms and conditions of the Creative Commons Attribution (CC BY) license (https://creativecommons.org/licenses/by/4.0/).
Share and Cite
Cui, Y.; Tian, S.; Zhu, J.; Zoras, S.; Shao, Y. Energy and Stochastic Economic Assessments of Photovoltaic Systems in the East Midlands. Energies 2023, 16, 6723. https://doi.org/10.3390/en16186723
Cui Y, Tian S, Zhu J, Zoras S, Shao Y. Energy and Stochastic Economic Assessments of Photovoltaic Systems in the East Midlands. Energies. 2023; 16(18):6723. https://doi.org/10.3390/en16186723
Chicago/Turabian StyleCui, Yuanlong, Shuangqing Tian, Jie Zhu, Stamatis Zoras, and Yiming Shao. 2023. "Energy and Stochastic Economic Assessments of Photovoltaic Systems in the East Midlands" Energies 16, no. 18: 6723. https://doi.org/10.3390/en16186723
APA StyleCui, Y., Tian, S., Zhu, J., Zoras, S., & Shao, Y. (2023). Energy and Stochastic Economic Assessments of Photovoltaic Systems in the East Midlands. Energies, 16(18), 6723. https://doi.org/10.3390/en16186723


