Article

Power Output Enhancement of Straight-Bladed Vertical-Axis Wind Turbines with Surrounding Structures

1
Research Institute for Applied Mechanics, Kyushu University, Fukuoka 816-8580, Japan
2
Department of Aeronautics and Astronautics, Kyushu University, Fukuoka 819-0395, Japan
3
Department of Mechanical Engineering, Faculty of Engineering, University of Malaya, Kuala Lumpur 50603, Malaysia
*
Author to whom correspondence should be addressed.
Energies 2023, 16(18), 6719; https://doi.org/10.3390/en16186719
Submission received: 24 July 2023 / Revised: 11 September 2023 / Accepted: 12 September 2023 / Published: 20 September 2023
(This article belongs to the Section A3: Wind, Wave and Tidal Energy)

Abstract

:
Wind tunnel experiments were conducted by installing wind-acceleration structures on both sides of a straight-bladed vertical-axis wind turbine (VAWT) to improve the output performance of the turbine. In the case of Venturi-shape structures, a curved shape with a large outlet opening produced a higher power output than straight or brimmed Venturi shapes. More importantly, two simple flat plates installed upstream of the wind turbine achieved the highest power enhancement of 2.4 times the power of the bare wind turbine. From the analysis of the flow visualization results, the power enhancement was attributed to the increase in lift force on the blades in the upstream region due to the acceleration of the gap flow between the flat plates, and the decrease in drag force on the blades toward the upstream region due to stagnation of the flow behind the plates.

1. Introduction

The power output of a wind turbine is proportional to the cube of the wind speed. Therefore, if the wind speed of a wind turbine can be increased by even a small amount, it can result in a large power increase. Ohya et al. took advantage of this property and dramatically increased the power output of a horizontal-axis wind turbine by installing a brimmed Venturi-shaped peripheral add-on (shroud wind accelerator) that collects and accelerates the wind around the turbine [1,2]. Although many studies have been carried out on concentrating wind energy in wind turbines [1,2,3,4], Ohya et al. showed that the generation of a low-pressure region behind the wind turbine is important, and they proposed the installation of a brim at the diffuser outlet. It has been shown by wind tunnel experiments that a brimmed Venturi-shaped peripheral structure can increase the power output of a vertical-axis wind turbine by the same principle [5]. For this paper, power performance experiments and flow visualization experiments were carried out with various shapes of peripheral additions to find the shape of peripheral additions that can most effectively increase the power output of a wind turbine.
There were several previous attempts to install peripheral structures on vertical-axis wind turbines. Shahizare et al. [6] and Li et al. [7] considered structures that did not affect the characteristics of vertical-axis wind turbines, which were non-directional to the wind direction. On the other hand, due to the asymmetry of the rotor, there were attempts to reduce negative torque by installing a deflector upstream of a drag-type vertical-axis wind turbine [8,9]. Recently, applications of a deflector to a lift-type wind turbine were examined [10,11]. In those cases, the deflector was also intended to control the angle of attack into the blades. Deflectors were applied to a pair of wind turbines as well [12,13,14]. In these approaches, a single deflector was intended to have a positive impact on two wind turbines.
Since the power output of a wind turbine is proportional to the cube of the wind speed, our first priority in this study was to accelerate the approaching wind speed for a vertical-axis wind turbine.

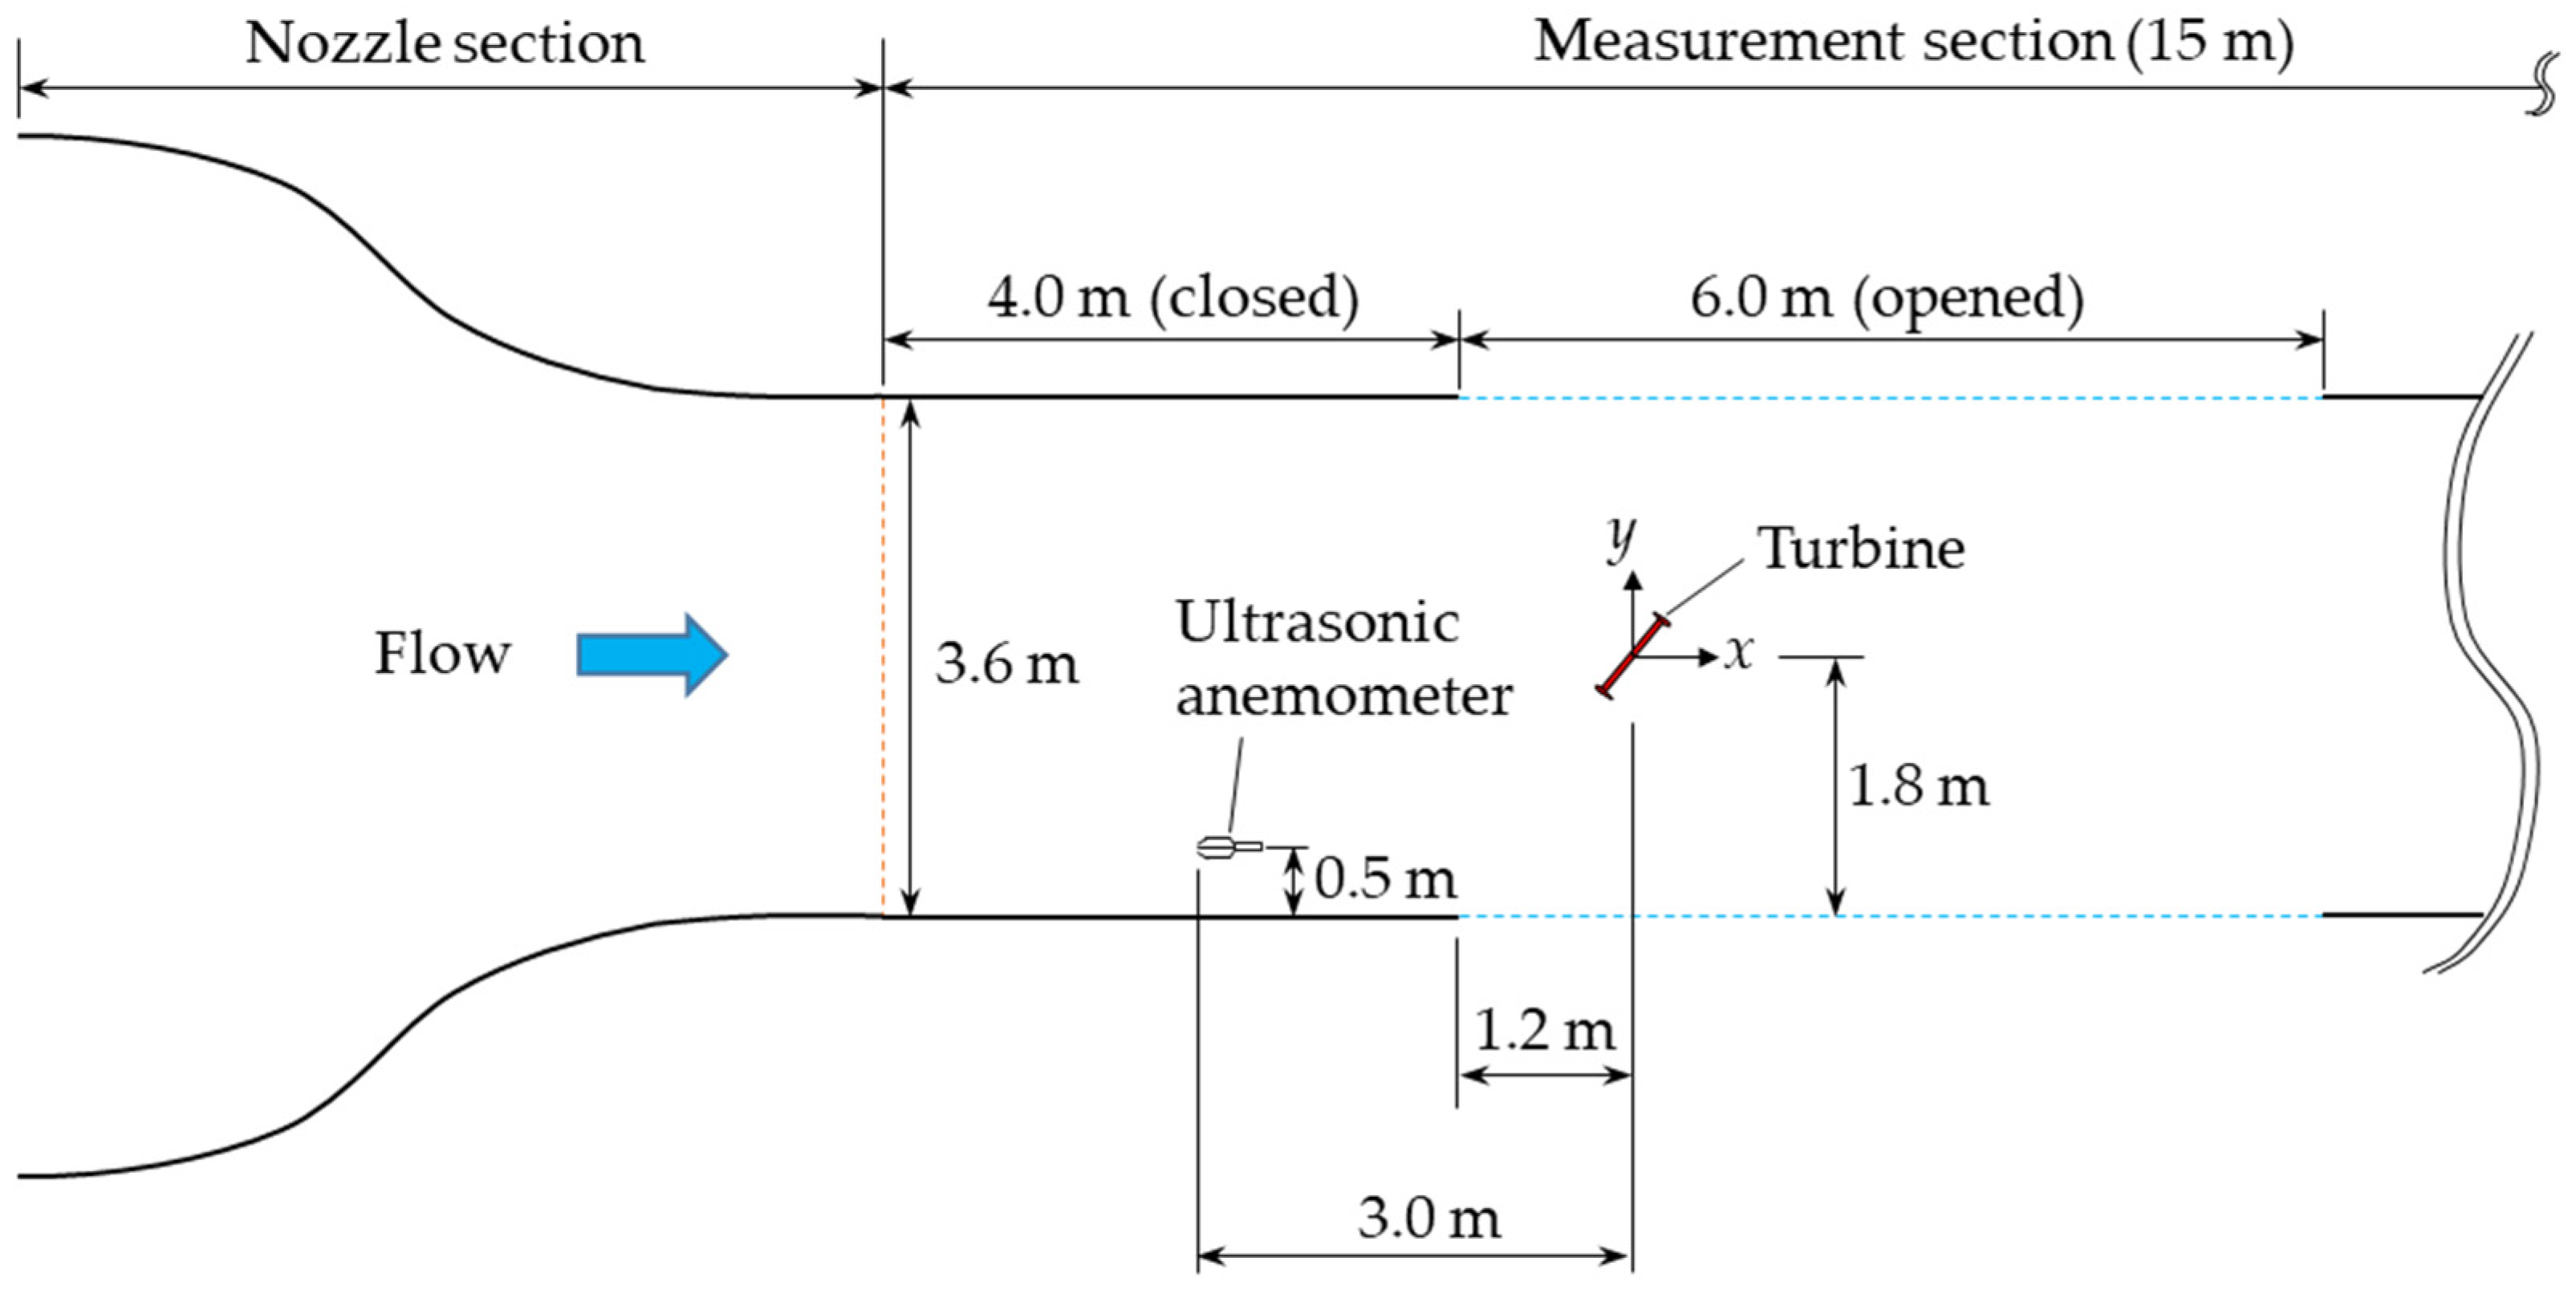
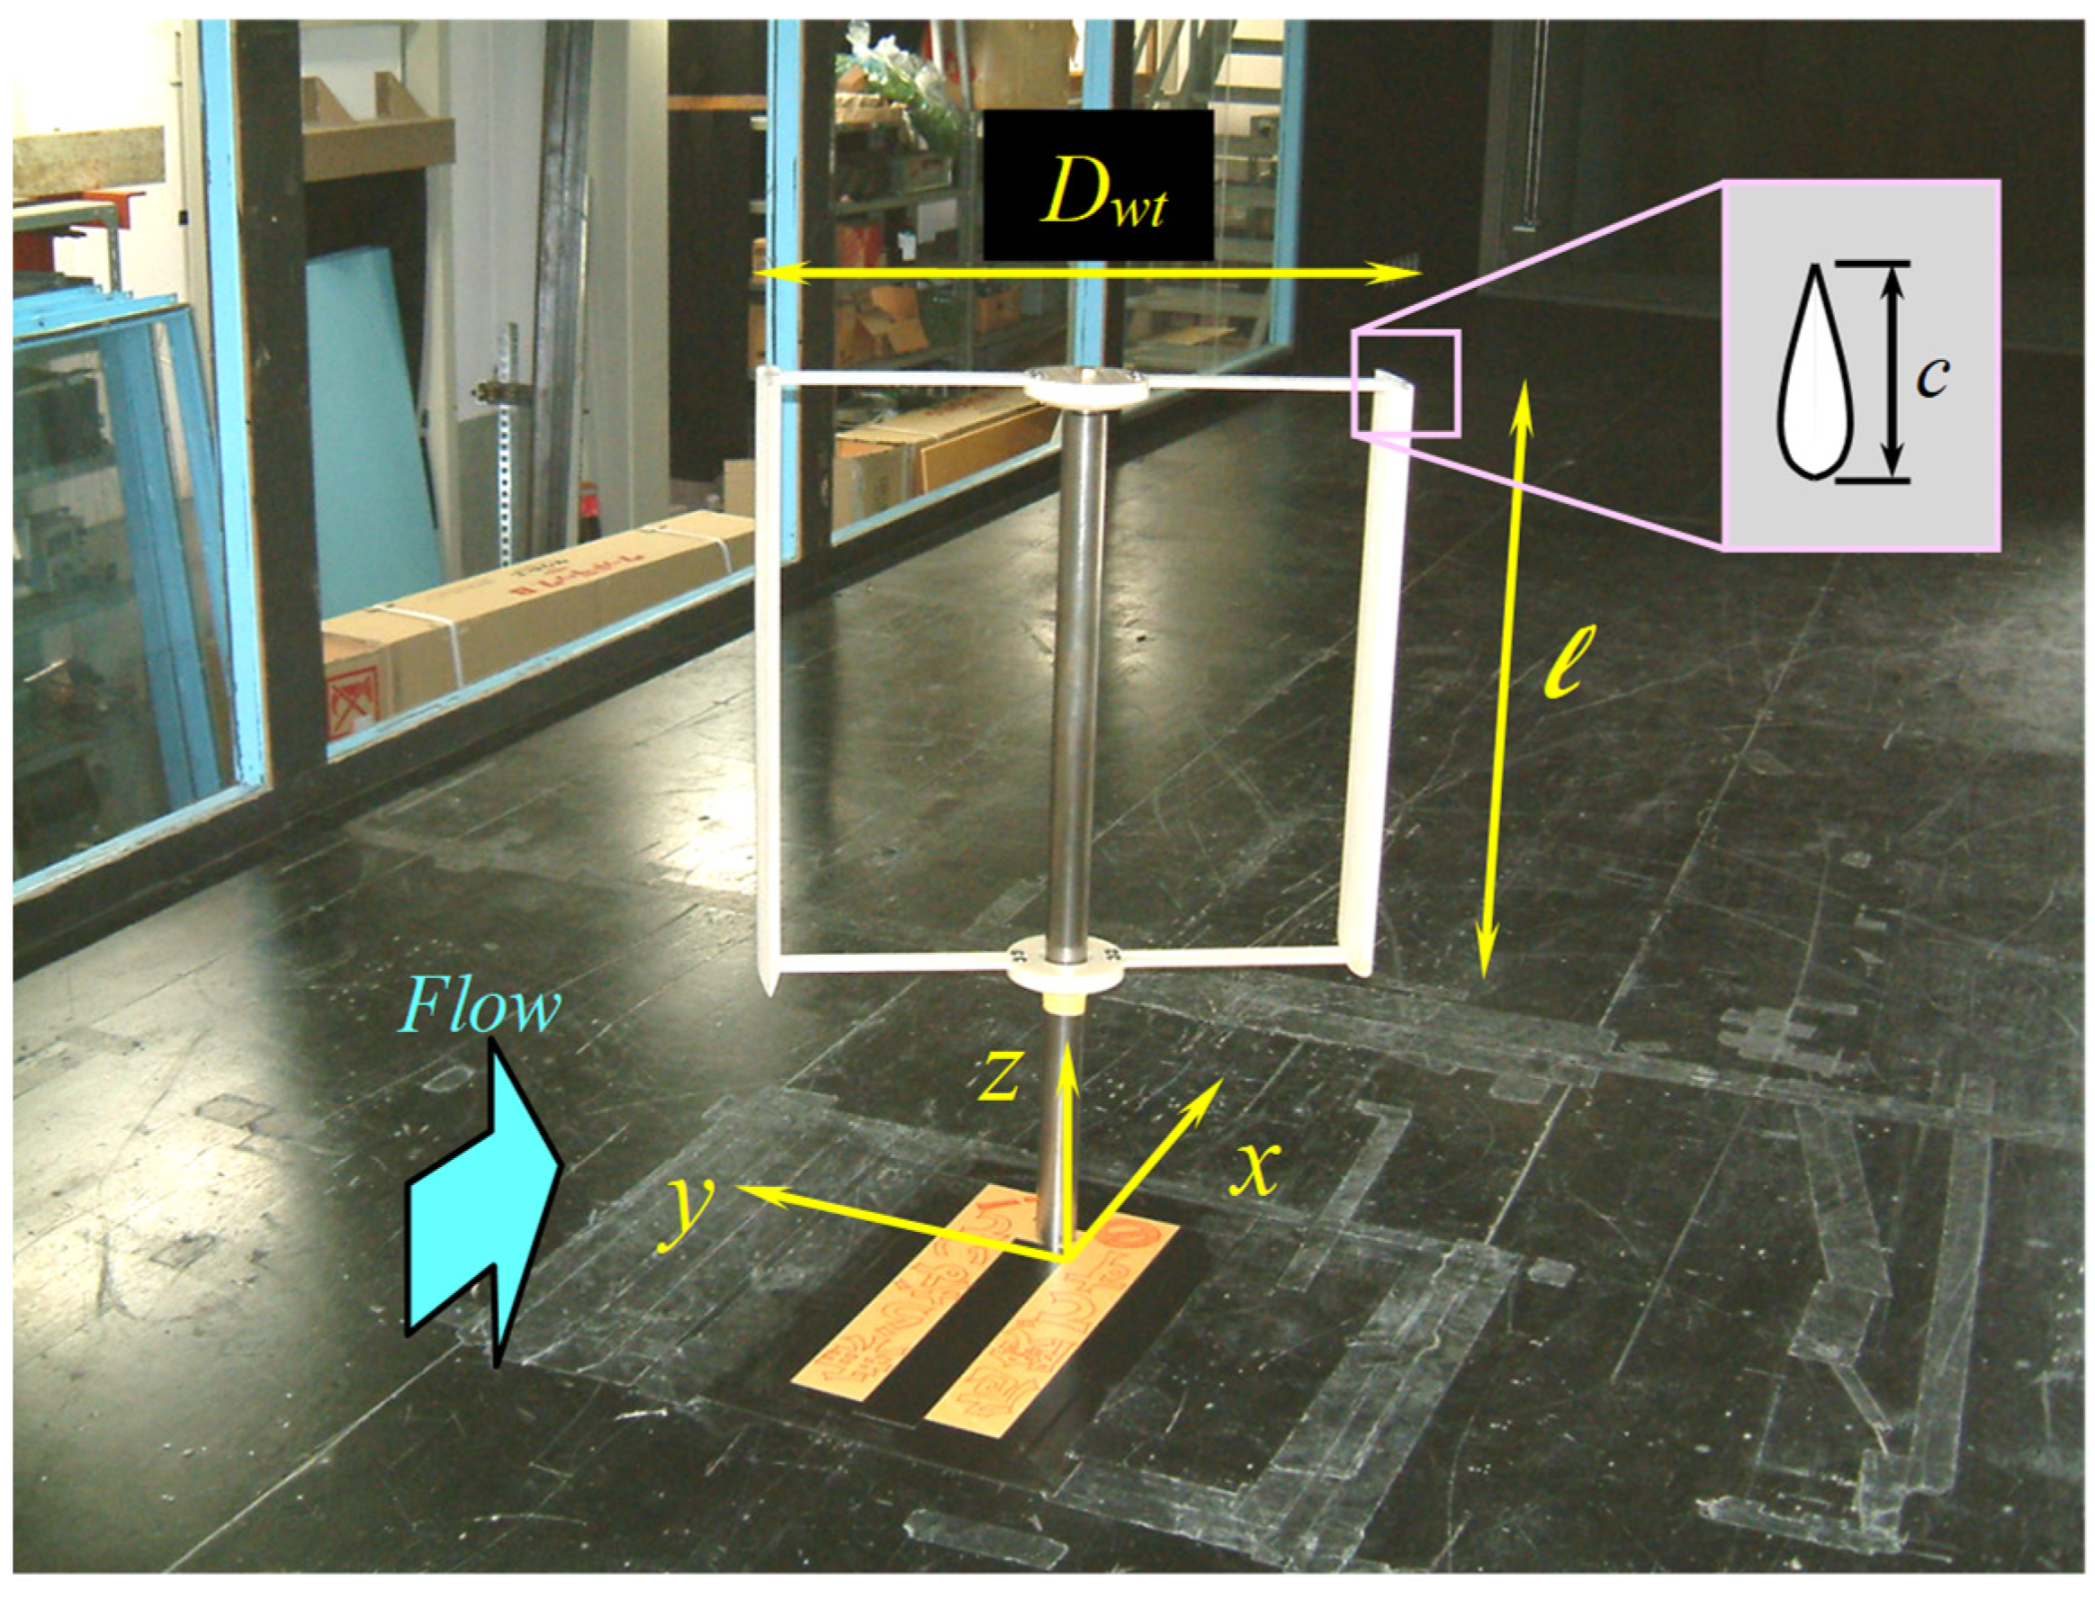
2. Wind Tunnel Test Method

The wind tunnel used for the experiments was a large boundary layer wind tunnel at the Research Institute for Applied Mechanics of Kyushu University with a measurement section that was 3.6 m wide × 2 m high × 15 m long and a maximum wind speed of 30 m/s. The experimental wind speed U0 was set to U0 = 9 m/s for the power performance experiment and U0 = 1 m/s for the flow visualization experiment. During the experiments, the ceiling and both side walls were opened for a length of 6 m in the main flow direction to prevent the wind turbine and surrounding additions from blocking the flow. An ultrasonic anemometer was installed 3 m upstream of the semi-open measurement section to detect the approaching wind velocity (see Figure 1). The position of the ultrasonic anemometer in the width direction was set at 0.5 m from the wall in order to avoid the influence of the boundary layer of the wind tunnel wall and to avoid the influence of the wake on the wind turbine installed in the center of the wind tunnel measurement section. The distance between the ultrasonic anemometer and the wind tunnel floor was 0.75 m. The wind speed detected by the ultrasonic anemometer was measured simultaneously with the wind turbine output and averaged over 30 s. The wind turbine used in the experiment was made of wood (both the blade and the support arm), and the blade length l and the rotating diameter Dwt were both 0.7 m (see Figure 2). The Reynolds number for the output performance test was 4.2 × 10⁵ when the diameter of the wind turbine was taken as the representative length. As shown in the photo, the wind turbine was a two-bladed straight blade type, and the symmetric blade type NACA0024 was used. The solidity of the wind turbine was σ = 0.14. The chord length of the blade was set to c = 0.15 m. Dwt/Tw = 0.19, where Tw is the width of the wind tunnel measurement area. The wind turbine was installed so that the lower edge of the blade was at a height of z = 0.35 m above the floor when the coordinate system was defined as shown in Figure 2. In the output performance experiment, a non-contact torque meter (rated at 0.5 N·m) was connected to the wind turbine, and the torque Q (N·m) and rotational speed n (1/s) of the wind turbine were measured when the load was gradually applied from no load, and the output P (W) = n was calculated to obtain the output performance curve. The accuracy of the torque meter was ± 0.2 %F. S, which was equivalent to about ±1% of the torque to be measured. The specifications of the equipment are shown in Table 1. The smoke wire method was used to visualize the flow. The visualization cross-section was positioned at the center of the wind turbine blade span (z = 0.7 m), and the rotational speed of the wind turbine was adjusted to the tip speed ratio, where the power output was maximized.

3. Output Performance Experiments Using Wind-Acceleration Structures

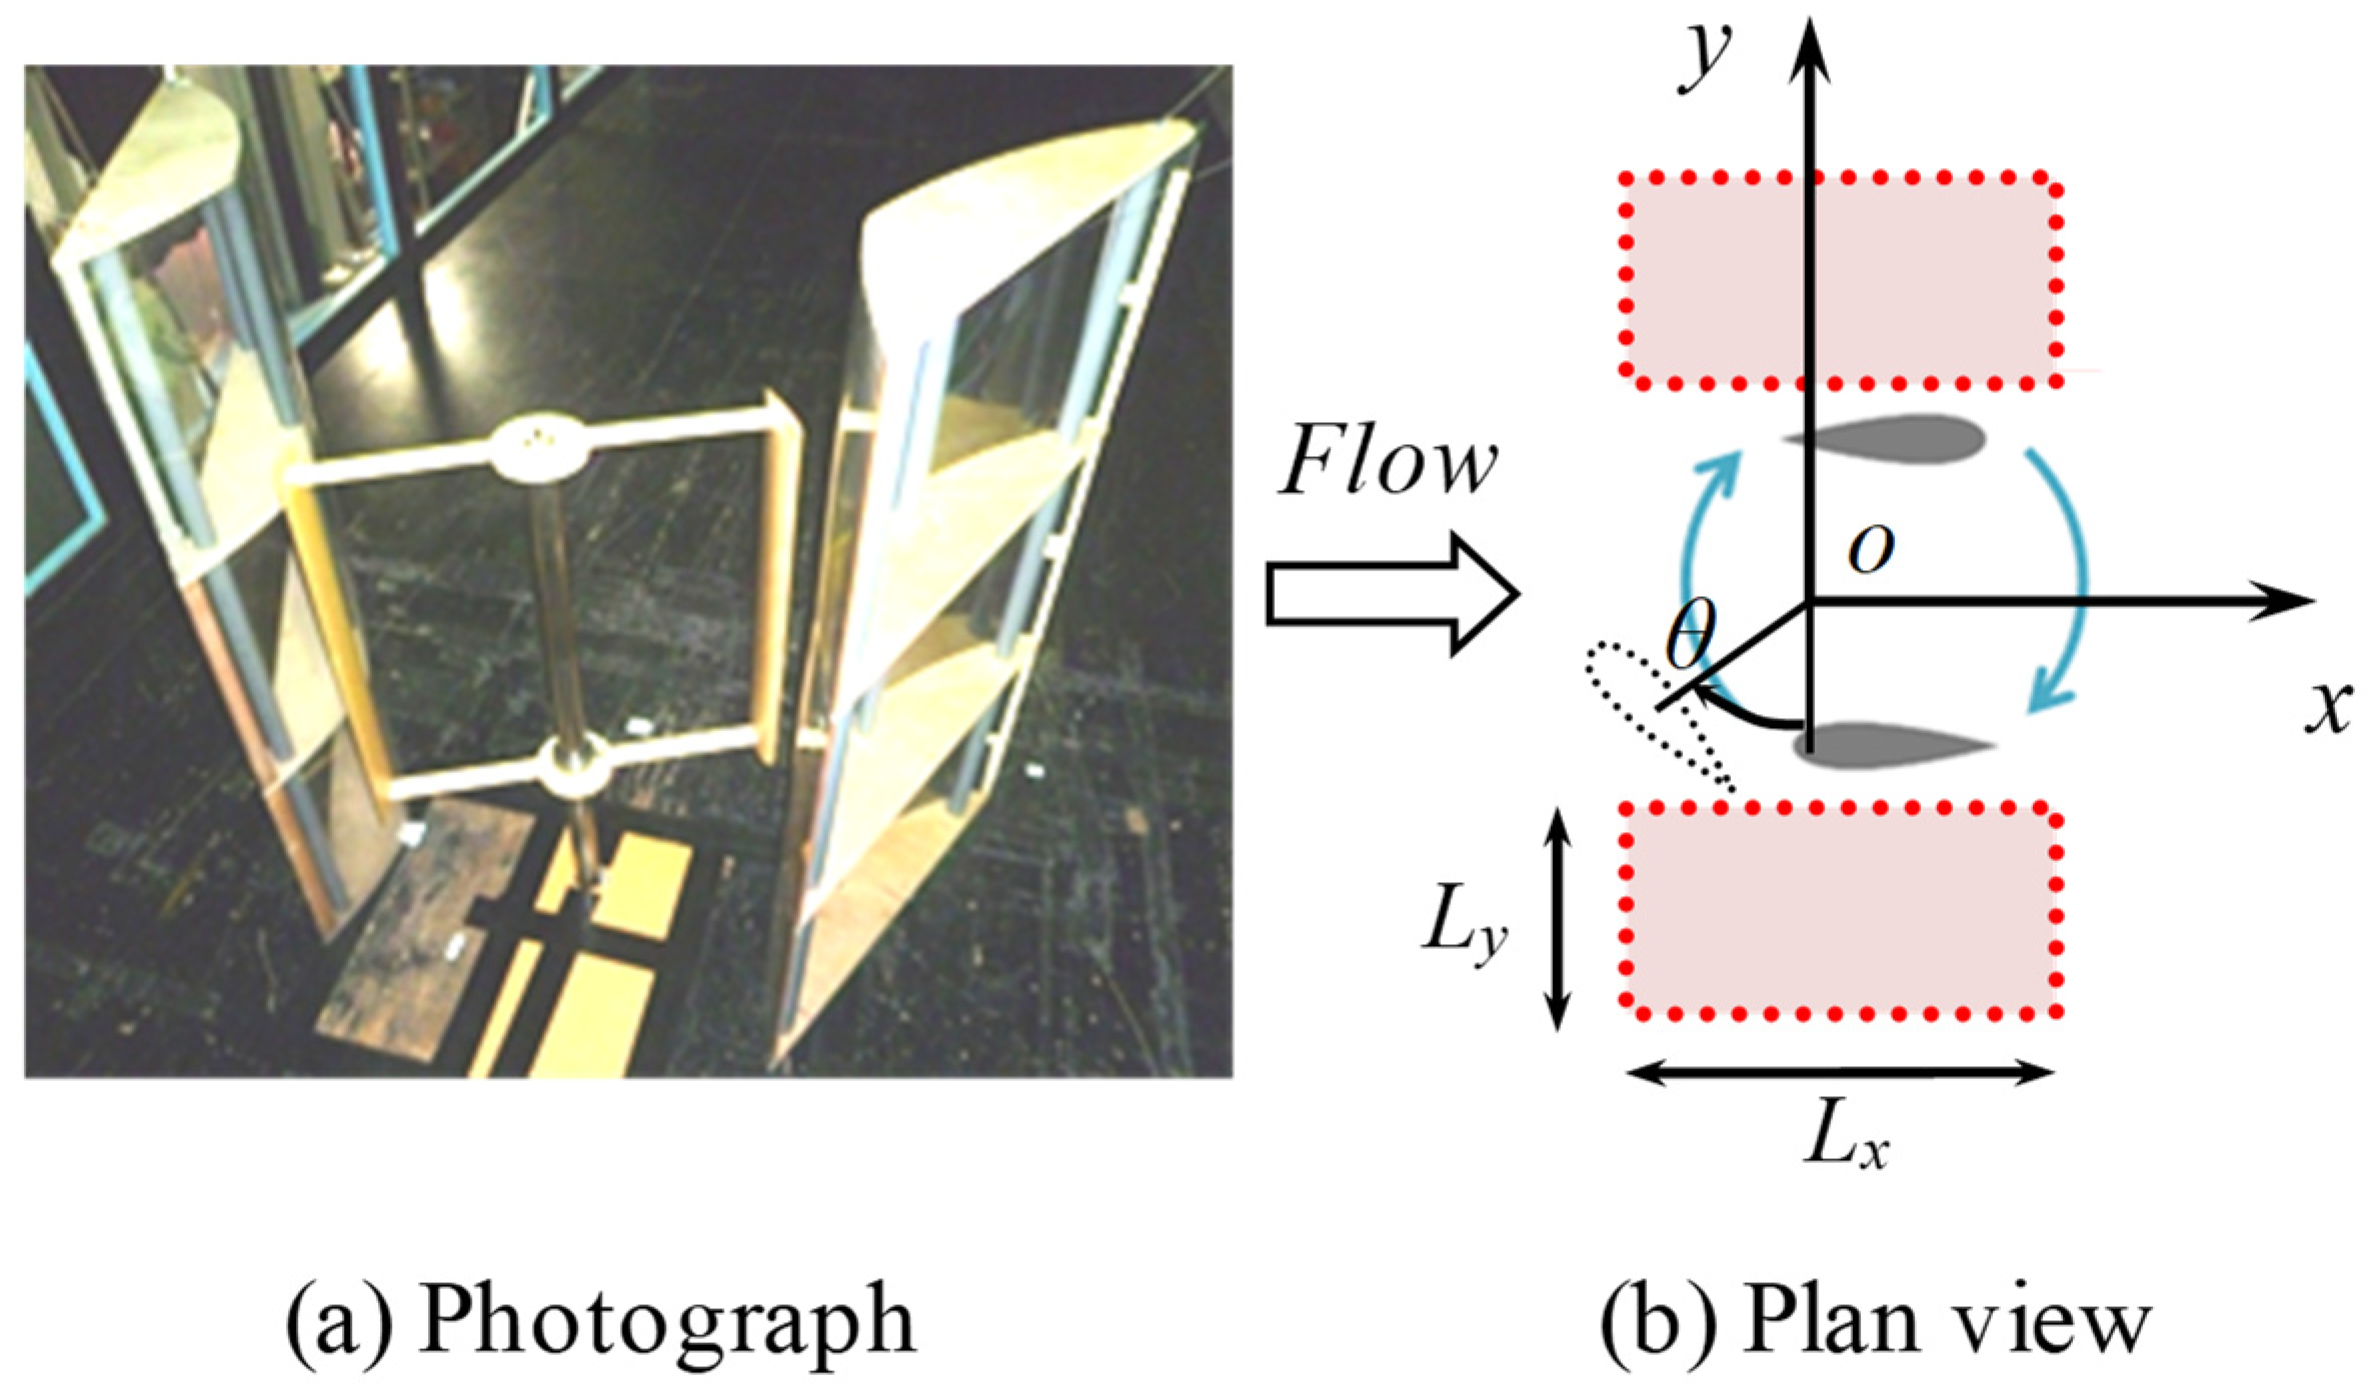
3.1. Geometry of the Wind-Acceleration Structures Used in the Experiment

Wind-acceleration structures with the same cross-section in the vertical direction were installed around the wind turbine as shown in Figure 3a. In this experiment, the area where the structures were placed was predetermined to be inside Lx and Ly, shown in Figure 3b, and by comparing the power output against the wind energy using the limited area, we searched for a shape that could increase the power output more effectively. Specifically, we installed structures with curved (or flat) shapes as shown in Figure 4. The range of Lx and Ly in Figure 3b was set as shown in Equations (1) and (2). This range was set according to the diffuser structure designed and fabricated by Takahashi [5]. Figure 4 shows the abbreviations and shapes of the structures. The shape of the structures will henceforth be denoted as “(abbreviation for a surface placed in a region where y is positive)-(abbreviation for a surface placed in a region where y is negative)”. CY(b) is a brimmed cycloid shape [2], which has been applied to horizontal-axis wind turbines to obtain a high power increase. CY is a cycloid shape without a brim to investigate the effect of the brim. CR is an elliptically shaped curved surface so that the diffuser opening is larger than that of CY. S is the shape where the inlet, throat, and outlet of the CR are connected by a plane in order to investigate the effect of a curved shape. b(U), b(C), and b(D) are flat-plate shapes with only a brim, in contrast to CY. For the Venturi-shaped structures, the throat position was set at x = 0 since past studies have shown that aligning the throat with the center of the wind turbine is effective [5]. The most effective installation position of the flat plate was also investigated by changing the installation position in the x-direction: upstream, center, and downstream of the wind turbine. For detailed shape data of each surface shape, please refer to reference [15]. The throat width in the y-direction was set to keep the structures and the wind turbine as close as possible, with only a small gap to avoid contact. For the Venturi-shaped structure, the minimum gap between the wind turbine and the structure at the throat was 0.03 m.
L x : { 0.295   m x 0.428   m ( 0.42 D w t x 0.61 D w t )
L y : { 0.756   m y 0.400   m 0.400   m y 0.756   m ( 1.08 D w t y 0.57 D w t , 0.57 D w t y 1.08 D w t )

3.2. Characteristics of Power Increase Caused by a Venturi-Shaped Structure with a Horizontal Cross-Section Symmetrical about the x-Axis and in the y-Direction

Figure 5 shows the output curve of a wind turbine with a Venturi-shaped structure with a horizontal cross-section, with the x-axis and a linear symmetry in the y-direction. The horizontal axis of the graph shows the tip speed ratio λ, the vertical axis shows the power output coefficient Cp = P/(0.5ρ·U03·A), and A is the rotational area of the wind turbine rotor A = l·Dwt. In all cases, a significant increase in power output was obtained when compared to a bare wind turbine. Comparing the power output of each of the four types of structures, the power output of the flat type “S-S” was lower. For the planar type, where the shape changes discontinuously at the throat, past studies have found flow separation inside the diffuser [16]. When the curved surface type was applied, a higher power increase than that of the planar type was obtained, even when the structure “CY-CY” with a 14.6% narrower Venturi exit width than that of the planar type “S-S” was used, indicating that the curved surface type can increase the output power more efficiently than the planar type. In the case of the curved shape, the “CR-CR” shape with a wider Venturi outlet was found to have a higher output than the “CY(b)-CY(b)” shape with a brim if the projected area in the mainstream direction was the same. This trend was consistent with the results of previous studies [5].

3.3. Characteristics of the Power Increase Caused by a Flat-Plate Structure with Horizontal Cross-Sectional Symmetry in the y-Direction about the x-Axis

Figure 6 shows the power output curves for the case where a flat-plate-shaped additive with a horizontal cross-section symmetric in the y-direction was installed with the x-axis as its axis. Even though the shape of the additive was the same, there was a large difference in the power increase when the position of the additive in the mainstream direction was changed. In the case of “b(D)-b(D)”, where the additive was installed downstream of the wind turbine (x = 0.428), the power output was lower than that of the wind turbine alone, whereas in the case of “b(U)-b(U)”, with the additive installed upstream of the wind turbine (x = −0.295), and “b(C)-b(C)”, with the additive installed at the center of the wind turbine (x = 0), the power output increased. Especially in the case of “b(U)-b(U)”, which was installed in the upstream region, the output power increased by 2.4 times compared with the wind turbine alone. This value was higher than that of the curved Venturi shape shown in Section 3.1. In other words, although the shape is simple, the addition of a flat-plate shape has a high power increase effect, and the most effective installation position is upstream of the wind turbine.

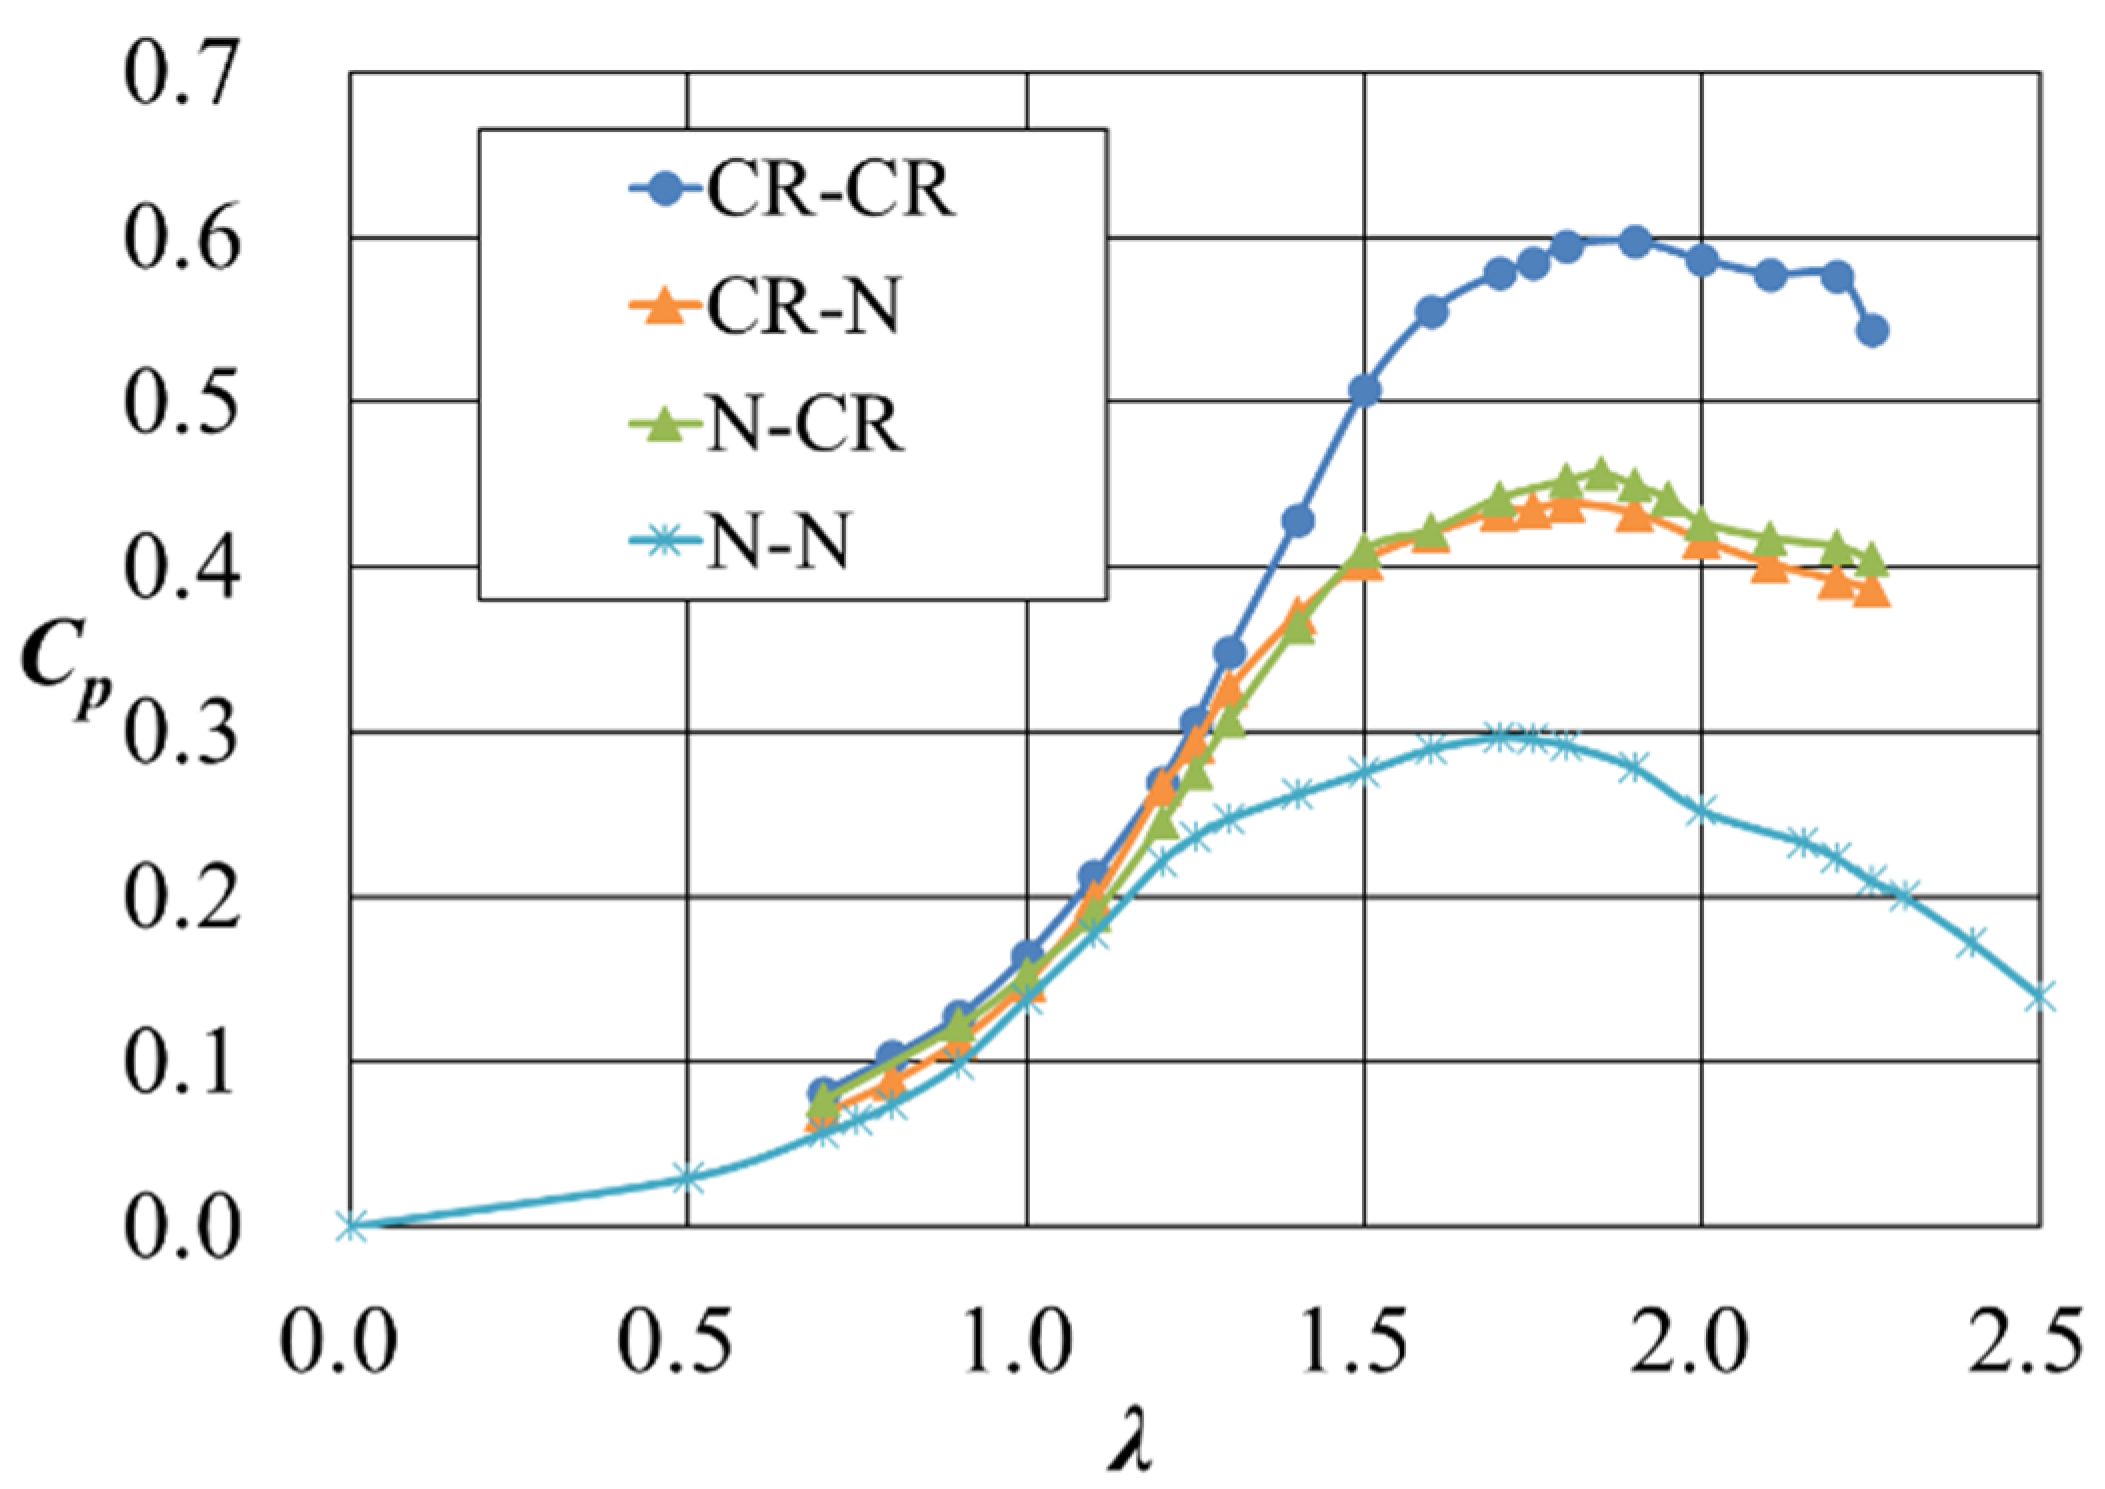
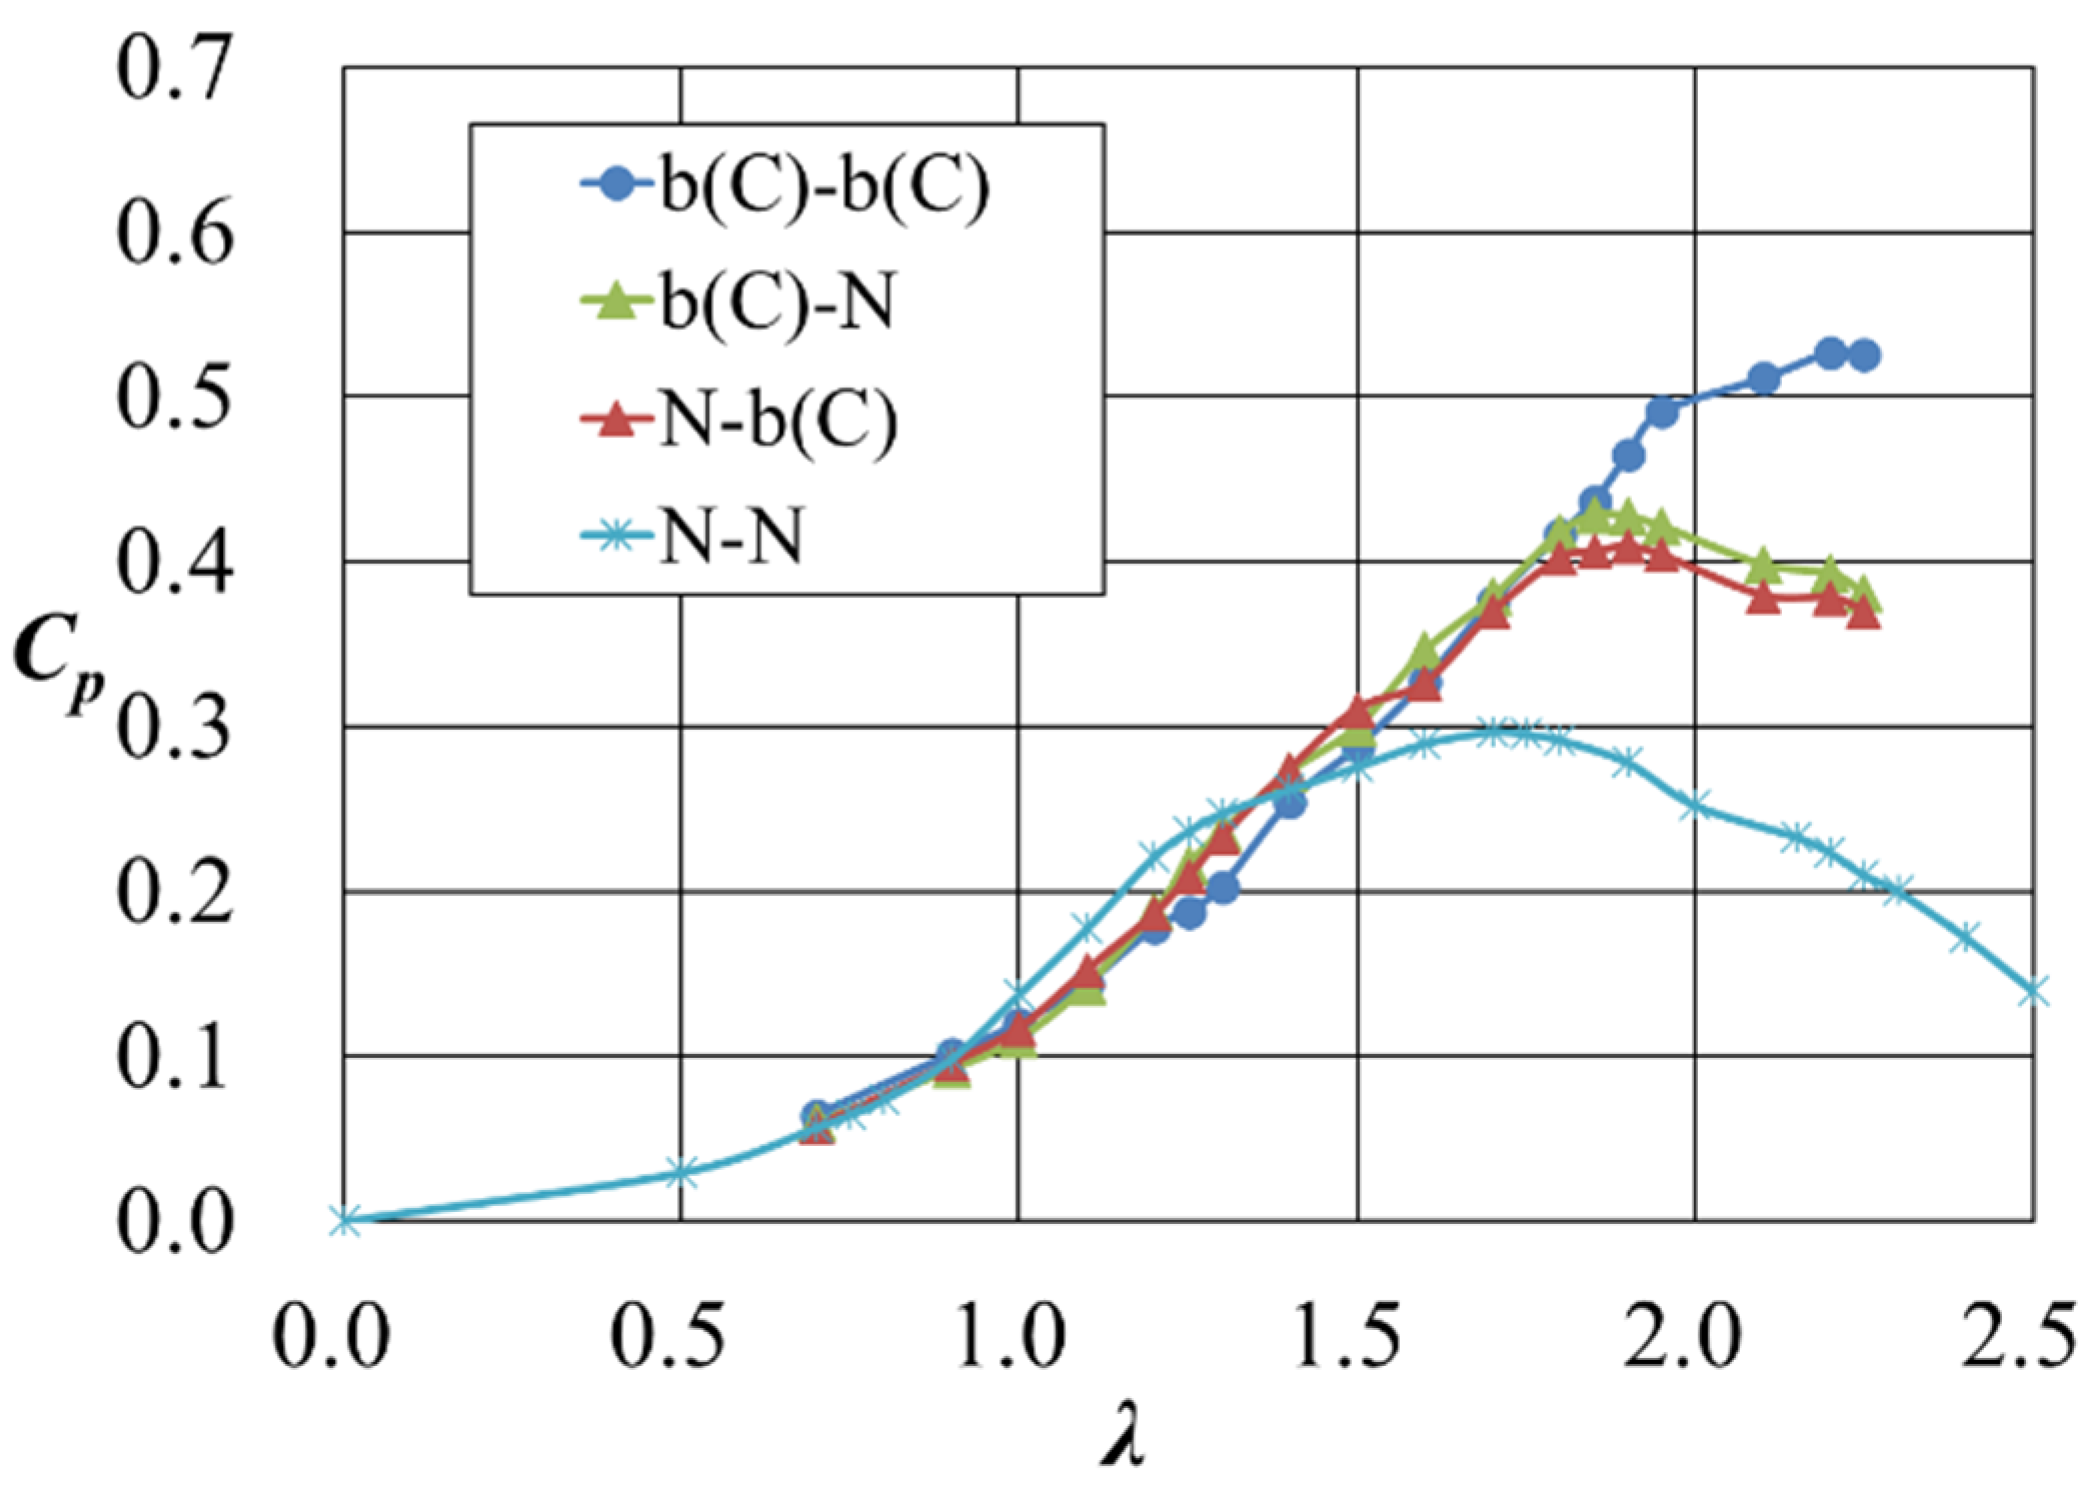
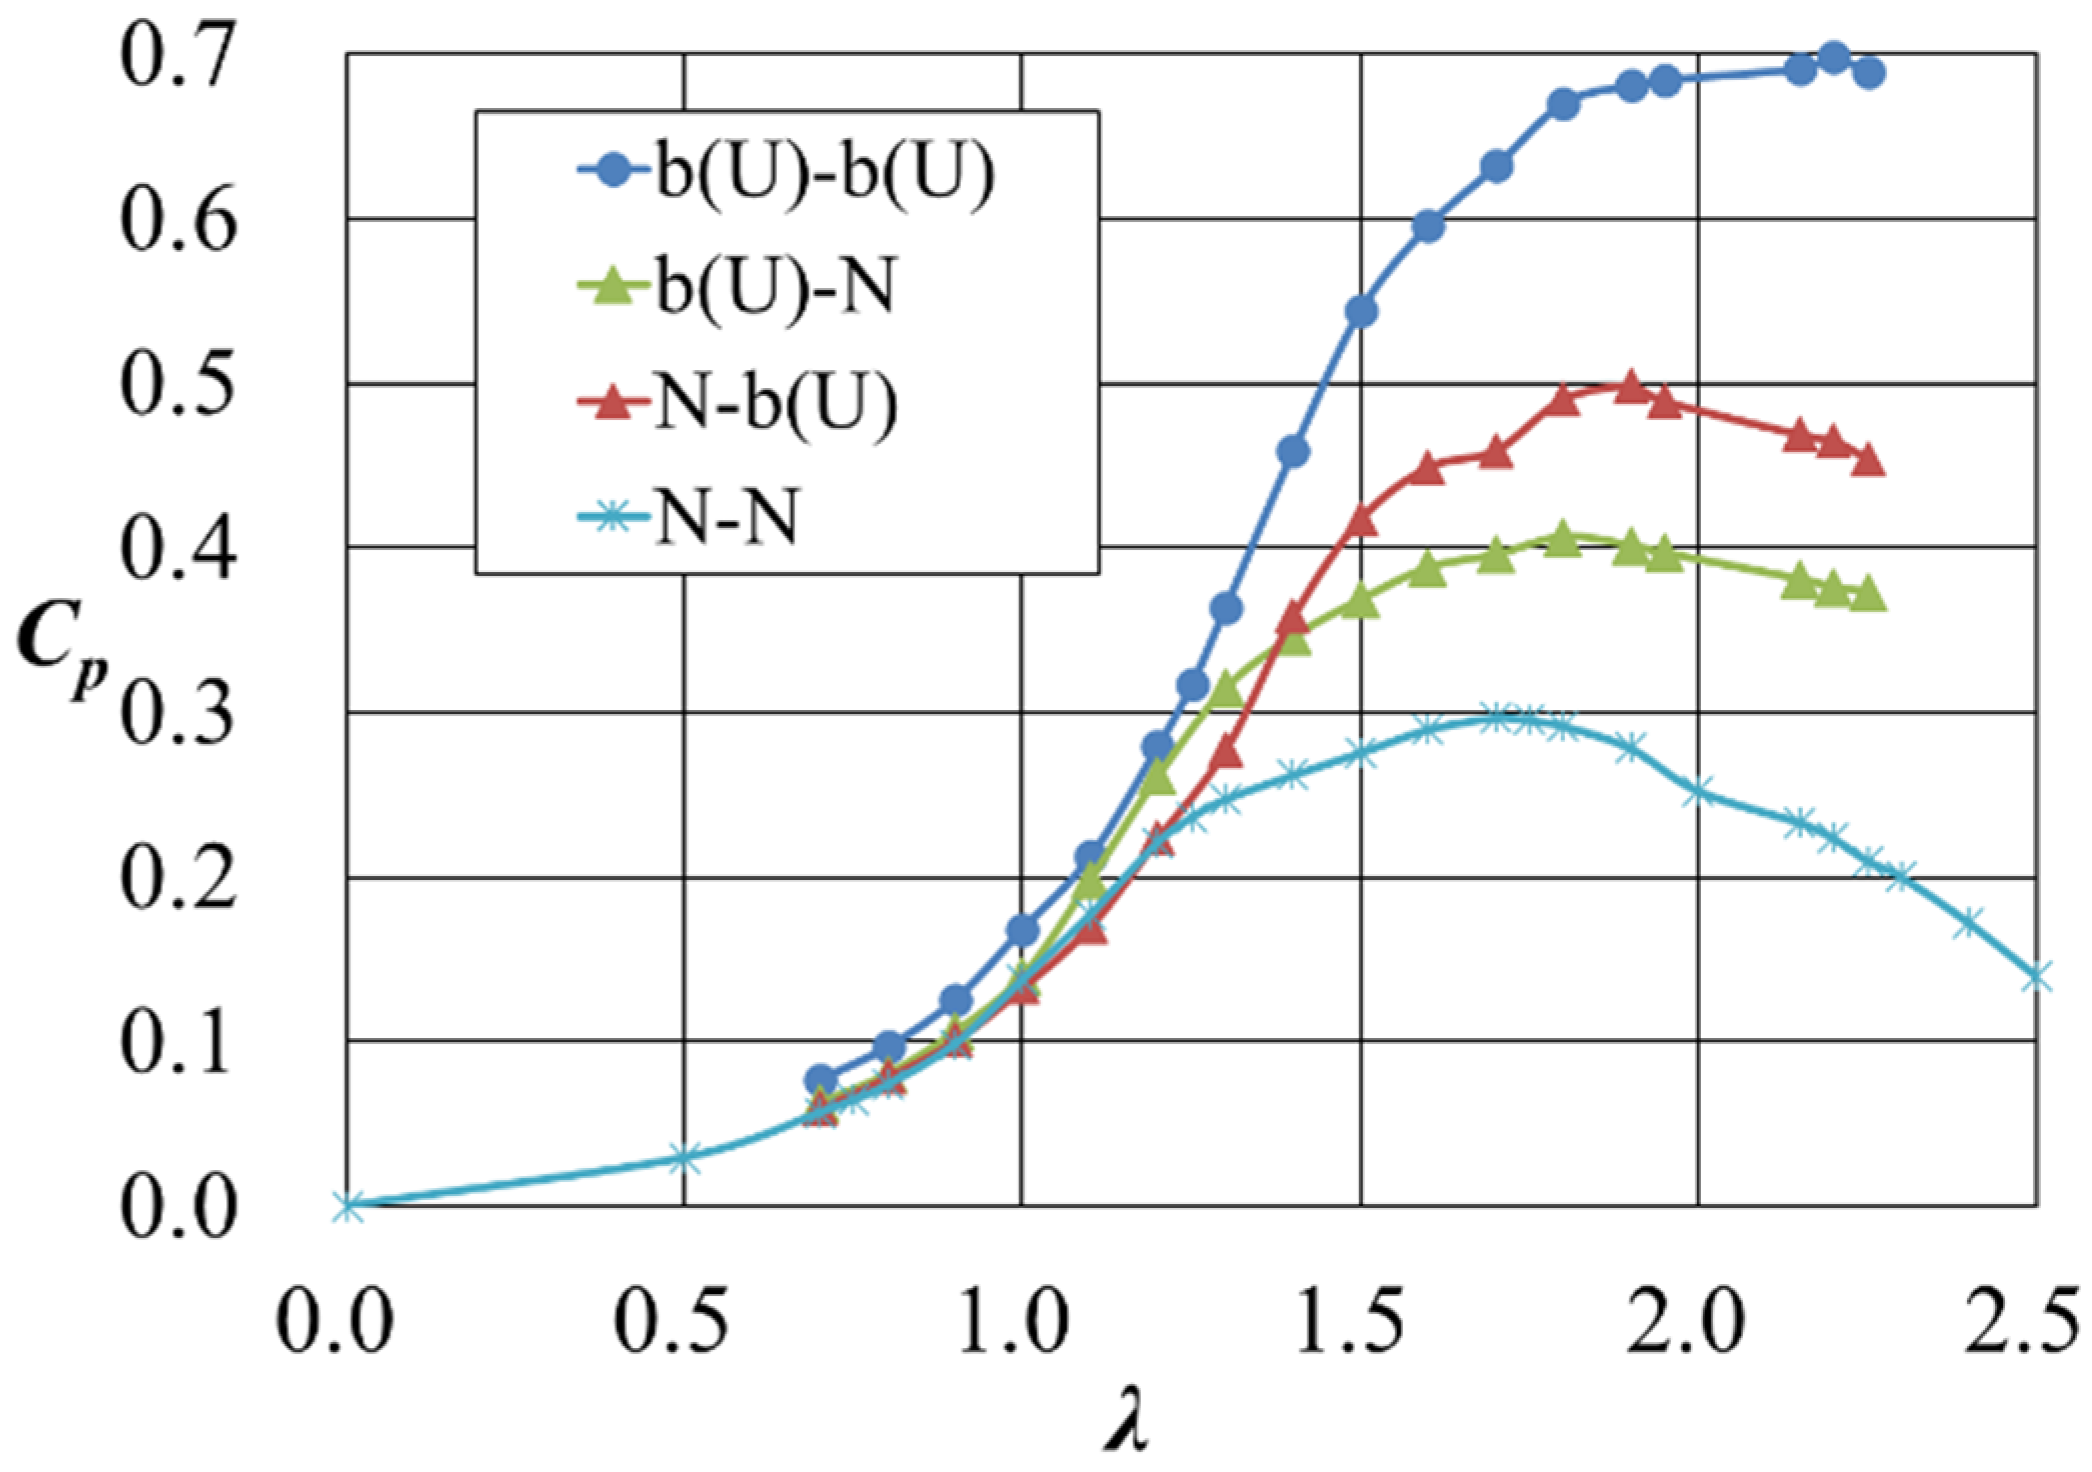
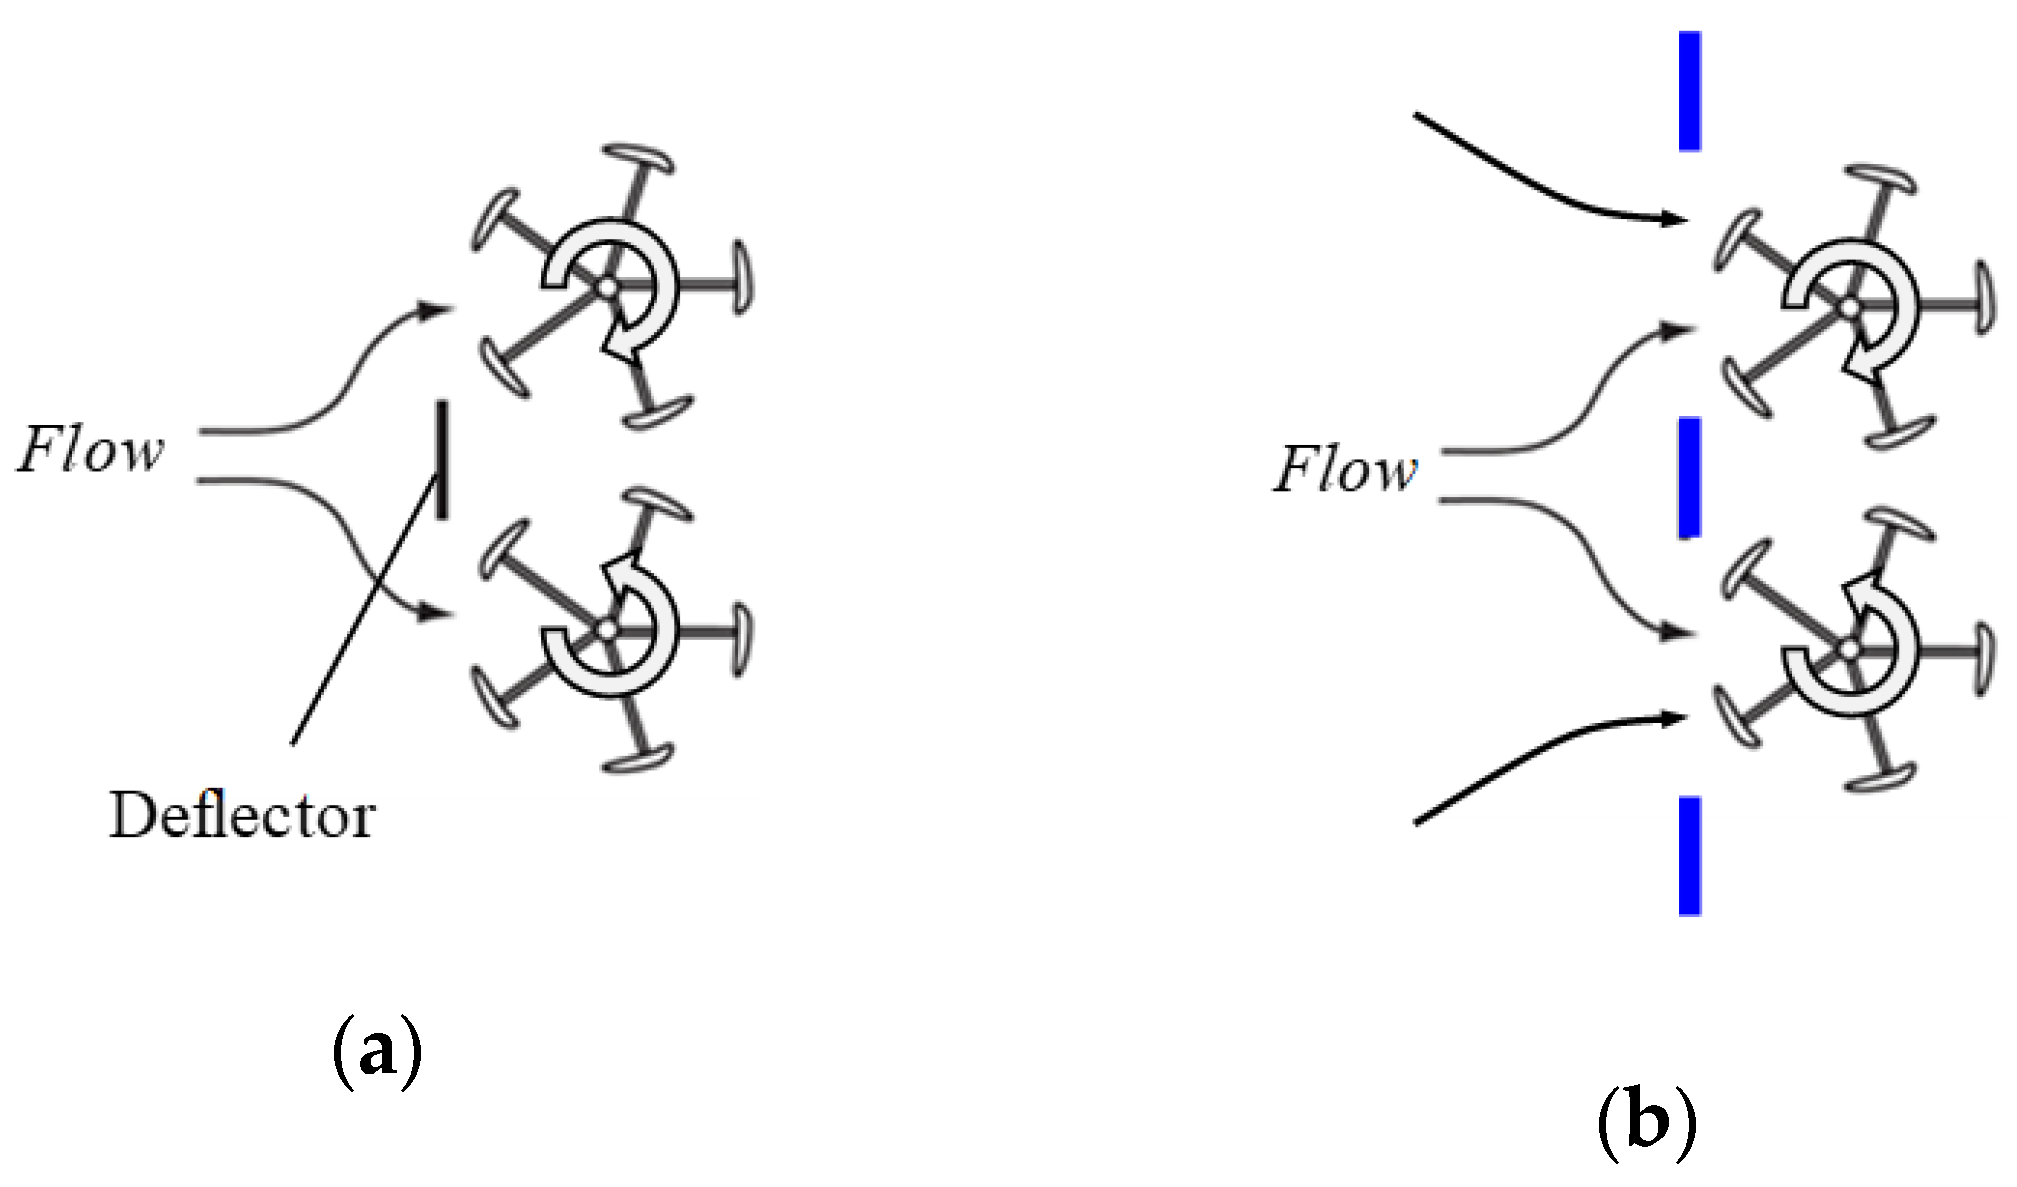
3.4. Characteristics of Power Increase Caused by a Structure with an Asymmetric Horizontal Cross-Section in the y-Direction about the x-Axis

In the previous section, the results of the power increase obtained using structures with horizontal cross-sections that were linearly symmetrical in the y-direction with the x-axis as its axis were given, but the shape of a vertical-axis wind turbine itself is asymmetrical in the y-direction because the blades rotate around the z-axis, and the flow field around a rotating wind turbine has been reported to be asymmetrical [16,17]. Therefore, it was considered possible that a structure with an asymmetric shape in the y-direction would increase power more effectively. In order to investigate the effect of left and right structures on the power increase, asymmetrical structures were installed around the wind turbine, and the power increase effect was demonstrated.
Figure 7a shows the power output curves for the case where the shape of the structure in the positive y region was fixed to CR and the shape of the additive in the negative y region varied. The results showed that the power increase tended to be higher when combined with a surface shape with high power in the simple symmetry experiment, and the power increase did not exceed the maximum power of “CR-CR” with the symmetrical shape. Figure 7b shows the power output curves for the case where the shape of the structure in the negative y region was fixed to CR and the shape of the additive in the positive y region varied. In some of the cases where the surrounding-structure geometries were reversed, slight output changes were observed. Nevertheless, in all of those cases, the power output increase did not exceed the maximum power output of “CR-CR” with the symmetrical shape.
Next, one side of the symmetrical structure was removed, and the effect of the power increase on each side was investigated. Figure 8, Figure 9 and Figure 10 show the power curves for the case where the structure was installed only on one side, together with the power curves for the case where the structure was installed on both sides. In the case of the Venturi-shaped CR (Figure 8), the same power increase effect was obtained regardless of whether the additive was installed on the positive or negative side of y (“CR-N” and “N-CR”), and there was no significant difference in the power curves. The increase in power when the additive was installed only on one side was about half of that when it was installed on both sides, and the total increase on one side was almost equal to that on both sides. In the case of b(C) (Figure 9), where the flat plate was aligned with the center of the wind turbine, the same results were obtained, but in the region where λ ≤ 1.8, the power increase on only one side was equal to that on both sides. On the other hand, in the case of the b(U) geometry, where the flat plate was placed upstream of the wind turbine (Figure 10), depending on whether the additive was placed in the positive or negative region of y (“b(U)-N” or “N-b(U)”), there was a large difference in the power curves, with a larger increase in power when the additive was placed in the negative y region. In addition, it was found that the increase in power output when the additive was placed on both sides was larger than the sum of the increases when the additive was placed on one side.

4. Discussion

Observing the flow field obtained in the visualization experiment, the results obtained in Section 3 are discussed. The visualization results in Figure 11, Figure 12, Figure 13, Figure 14 and Figure 15 were obtained by checking the photographs of various azimuth angles and selecting the photographs in which the space of interest was not an instantaneous singular flow field, and in which the visualization results were easy to confirm. Refer to Appendix A for photographs of the various azimuth angles. The approaching wind speed was set to U0 = 1 m/s in order to clearly visualize the flow field in which the turbine blades were moving. Although the wind speed was not sufficient for the wind turbine to achieve its output performance, the Re number was 2.4 × 10⁴, with Ly = 0.356 m as the representative length of the added structure, which was sufficient to determine the large structure of the flow field passing through the additive. We therefore focused our discussion not on the details of the flow field near the wind turbine blades, but on how the large structure of the flow through the wind turbine changed with the installation of the additional structures.

4.1. Acceleration Effect of Wind Collection by Surrounding Structures

Figure 11 shows the visualization results of the flow field for a bare wind turbine and for the CR-CR wind turbine with a greatly increased power output. The direction of the main flow is from left to right in the figure. An approaching flow is generally slowed down in the upstream region of a wind turbine by the reaction of the thrust force acting on the wind turbine. As a result, the static pressure increases, and the approaching flow is deflected by the wind turbine. In the case of our vertical-axis wind turbine without surrounding structures, deflection was observed (Figure 11a), and it was greater on the negative side of y, where the blade returns to the upstream side. This suggested that the thrust of the vertical-axis wind turbine was greater on the return side of the blades. On the other hand, when a Venturi-shaped structure was installed, stream convergence was observed upstream of the inlet. This meant that the wind approaching the wind turbine was collected and suctioned into the structure with increased wind speed. A previous study confirmed that a brimmed Venturi-shaped surrounding structure suctions the flow in and accelerates the wind speed by creating a low-pressure region behind the brim [18,19]. In the present case of vertical-axis wind turbines, it was estimated that the power increase was caused by the wind-acceleration effect of the surrounding structure.
Figure 11. Flow visualization (N-N type and CR-CR type).
Energies 16 06719 g011
Figure 12. Flow visualization (b(U)-b(U) type).
Energies 16 06719 g012
Figure 12 shows the visualization results of the flow field when a flat-plate structure “b(U)-b(U)” was installed. The formation of large wakes behind the structures was observed. Generally, static pressure is decreased in the wake of a bluff body. The gap flow of the two objects is accelerated toward the low-pressure wake. In the visualization results shown in Figure 12, convergence of streamlines suggesting an acceleration of flow velocity was also observed in the gap of the two plates. Accordingly, it is estimated that the power increase was caused by the wind-acceleration effect of the surrounding structure.

4.2. Difference in the Flow Field around a Venturi-Type Structure and a Flat-Plate-Type Additive

In order to further examine the characteristics of the flow created by the Venturi-type and flat-plate-type structures, the flow field was visualized by installing the structure on one side only. Figure 13 shows the results for CR, which is a Venturi shape, and Figure 14 shows the results for b(C), which is a flat-plate shape. Until it passes through the center of the wind turbine, the flow is drawn closer to the x-axis for both shapes. However, after passing through the center of the wind turbine, the Venturi shape pulls the flow back to the structure side, while the flat-plate shape does not. Therefore, in the case of the Venturi type, the wind flows through the center of the wind turbine and then expands along the shape of the structure, as shown in Figure 11b. This expanded flow creates a pressure gradient in the direction of the main flow, which is considered to lead to a pressure decrease and acceleration of the wind flow inside the wind turbine on the upstream side. As for the flat-plate type, the flow generates a large low-pressure wake area behind the plates, as shown in Figure 12. As a result, the flow that passed through the side of the plate toward its low-pressure wake region was considered to be accelerated. Another point was that when the add-on was placed upstream of the wind turbine, as in b(U), the wake was generated at the position where the wind turbine blades pass. The effect of this wake on the power output is discussed in the next section.

4.3. Low-Speed Effects Produced by Flat-Plate-Type Structures

As shown in Figure 10, there was a significant difference in the output performance when the flat plates were installed one on each side of the upstream region. This result was different from the b(c)-type result shown in Figure 9. It is reasonable to consider that the difference in output is due to the fact that the structure has moved upstream relative to the wind turbine for the b(U) type, causing the wind turbine to be more significantly affected by the wake of the structure. Moreover, the results in Figure 10 show that a larger increase in output is obtained when the object is on the negative side of y. We examined the reason using the visualization results.
Figure 13. Flow visualization (asymmetric CR-type).
Energies 16 06719 g013
Figure 14. Flow visualization (asymmetric b(C)-type).
Energies 16 06719 g014
Figure 15. Flow visualization (asymmetric b(U)-type).
Energies 16 06719 g015
Figure 15 shows the visualization results for the case where a flat-plate-type structure was installed on one side upstream of the wind turbine. As shown in Figure 15a, when a flat-plate add-on was placed upstream of the wind turbine and in the positive y region, the flow was deflected to the side without the add-on, and the return blade moved against the flow. In the positive region of y, the blade traveled in the low-speed wake region toward the downstream side. When the structure was placed in the negative region of y, the returning blade traveled in the low-speed wake region behind the structure. According to several previous studies [20,21], the blades of straight-bladed vertical-axis wind turbines generate a negative torque at azimuth angles θ = 0–30° when moving against the flow. Therefore, it was estimated that the installation of a flat-plate add-on upstream of the wind turbine in the negative region of y moderates the negative torque acting on the blades effectively by slowing down the velocity in the mainstream direction in the region where the negative torque is generated, thus mitigating the power reduction. As shown in Figure 12, it can be presumed that this also occurred when the flat plate was installed on both sides, and the reduction in blade drag due to the creation of this low-speed region is considered to be another reason for the high power increase when the flat-plate additive is installed upstream.

4.4. Proposal of a Wind Collector Using a Flat-Plate-Type Additive

The effect of placing a flat plate upstream of the side where the blades of a vertical-axis wind turbine are subjected to dragging forces has also been shown by Kim et al. [12]. They showed that the power output of a five-bladed wind turbine can be increased by a factor of three by placing two vertical-axis wind turbines rotating in opposite directions in a row, as shown in Figure 16a, and installing a deflector upstream of the side where the blades encounter drag. However, in our experiment, it was found that the power increase effect was higher when the additions were installed on both sides of the wind turbine. So we propose installing the additions on both sides, as shown in Figure 16b. It is known from previous studies [5] that the power increase caused by the wind-acceleration structure can be obtained in the same way even if the number of blades of the wind turbine is changed. Therefore, the installation of flat plates on both sides of the wind turbine should increase the wind collection and acceleration effect more than the installation on a single side, and together with the blade drag reduction effect caused by the flat plate installed upstream, an even higher power increase can be obtained.
The Cp of the case with the b(U)-b(U) structure, which obtained the highest power in this experiment, was re-evaluated in terms of the area A*(=l × 2.16Dwt) using the width of the surrounding structure of 2.16Dwt (the Cp at this time is Cp*) and compared with the case where the diameter of the wind turbine itself (N-N) was increased to the same size as the width of the surrounding structure. The maximum value of Cp* for the case with the b(U)-b(U) additive was Cp*max = 0.32. On the other hand, it was Cp*max = 0.30 for a bare wind turbine, and an 8.8% performance improvement was able to be obtained using the additive. In other words, the performance of the wind turbine could be improved by installing an add-on rather than by expanding the wind turbine itself, and the Cp* could be further improved if multiple wind turbines share the add-on, as shown in Figure 16b. Therefore, the application of peripheral additions is beneficial to improving performance. In addition, the width and gap of the flat-plate add-on were not studied in this experiment. In future studies, parametric studies could be conducted to find more effective shapes.
Although the wind turbine with the flat-plate add-on was directional to the wind, it can be applied to areas where the direction of the flow can be specified to some extent, such as tidal power generation and power generation using the flow around rivers and buildings, or it can be yaw-controlled by adding a tail fin in areas where non-directional characteristics are required. In other words, the system is expected to be widely effective.

5. Conclusions

Power performance and flow field visualization experiments were conducted on a vertical-axis wind turbine with peripheral additions to determine the shape of the additions that can achieve the highest power increase. The following points were clarified:
  • When a Venturi-shaped structure is installed, it is more effective to make the cross-sectional shape of the Venturi curved rather than flat to increase the power output. In addition, if the projected area in the mainstream direction is the same, a higher output can be obtained by widening the outlet width of the Venturi, rather than by installing a brim, because the wind collection effect of the diffuser section is increased.
  • When the flat-plate additive is installed upstream of the wind turbine, it has a high power increase effect. The power increase is 2.4 times that of a single wind turbine over a Venturi shape.
  • A flat-plate additive needs to be installed upstream of the turbine because it generates an acceleration zone downstream of the plate.
  • When installing asymmetrical additions, it is recommended to select additions with a cross-sectional shape that has a higher wind collection and acceleration effect and install them on both sides of the wind turbine to obtain a higher power increase. However, for the return-side blade, it is effective to install a flat plate in the upstream region. This is thought to be because the negative torque generated in the blade is mitigated by the creation of a low-speed region behind the flat plate.
  • Based on these results, we proposed an addition of flat plates on both sides of the upstream region of a wind turbine. The application of peripheral additions is beneficial for performance improvement because a wind turbine with flat plates on both sides of the upstream region has an 8.8% higher performance than a wind turbine alone that is similarly enlarged to the same size as the additions.

Author Contributions

Conceptualization, K.W., M.M., T.N., Y.O., T.K. and T.U.; data curation, K.W., M.M. and T.N.; investigation, K.W., M.M., T.N., Y.O., T.K. and T.U.; methodology, K.W., M.M., T.N., Y.O., T.K. and T.U.; writing—original draft, K.W.; writing—review and editing, T.U. All authors have read and agreed to the published version of the manuscript.

Funding

This work was supported by JST Moonshot R&D Program Grant Number JPMJMS2283.

Data Availability Statement

The data presented in this study are available from the corresponding author on request.

Acknowledgments

The authors are grateful to laboratory engineers Kimihiko Watanabe and Keiji Matsushima.

Conflicts of Interest

The authors declare no conflict of interest.

Appendix A

We provide some pictures in this section to complement the figures discussed in Section 4.
Figure A1. Flow visualization: N-N type.
Energies 16 06719 g0a1
Figure A2. Flow visualization: CR-CR type.
Energies 16 06719 g0a2
Figure A3. Flow visualization: b(U)-b(U) type.
Energies 16 06719 g0a3
Figure A4. Flow visualization: CR-N type.
Energies 16 06719 g0a4
Figure A5. Flow visualization: N-CR type.
Energies 16 06719 g0a5
Figure A6. Flow visualization: b(C)-N type.
Energies 16 06719 g0a6
Figure A7. Flow visualization: N-b(C) type.
Energies 16 06719 g0a7
Figure A8. Flow visualization: b(U)-N type.
Energies 16 06719 g0a8
Figure A9. Flow visualization: N-b(U) type.
Energies 16 06719 g0a9

References

  1. Ohya, Y.; Karasudani, T.; Sakurai, A.; Abe, K.; Inoue, M. Development of a shrouded wind turbine with a flanged diffuser. J. Wind Eng. Ind. Aerodyn. 2008, 96, 524–539. [Google Scholar] [CrossRef]
  2. Ohya, Y.; Karasudani, T. A shrouded wind turbine generating high output power with wind-lens technology. Energies 2010, 3, 634–649. [Google Scholar] [CrossRef]
  3. Gilbert, B.L.; Foreman, K.M. Experiments with a diffuser-augmented model wind turbine. J. Energy Resour. Technol. 1983, 105, 46–53. [Google Scholar] [CrossRef]
  4. Jamieson, P. Beating Betz.Energy Extraction Limits in a Constrained Flow Field. J. Sol. Energy Eng. 2009, 131, 031008. [Google Scholar] [CrossRef]
  5. Watanabe, K.; Takahashi, S.; Ohya, Y. Application of a Diffuser Structure to Vertical-Axis Wind Turbines. Energies 2016, 9, 406. [Google Scholar] [CrossRef]
  6. Shahizare, B.; Nik-Ghazali, N.; Chong, W.T.; Tabatabaeikia, S.; Izadyar, N.; Esmaeilzadeh, A. Novel Investigation of the Different Omni-direction-guide-vane Angles Effects on the Urban Vertical Axis Wind Turbine Output Power via Three-dimensional Numerical Simulation. Energy Convers. Manag. 2016, 117, 206–217. [Google Scholar] [CrossRef]
  7. Li, Y.; Zhao, S.; Qu, C.; Tong, G.; Feng, F.; Zhao, B.; Kotaro, T. Aerodynamic Characteristics of Straight-Bladed Vertical Axis Wind Turbine with a Curved-Outline Wind Gathering Device. Energy Convers. Manag. 2020, 203, 112249. [Google Scholar] [CrossRef]
  8. Altan, B.D.; Atılgan, M.; Özdamar, A. An Experimental Study on Improvement of a Savonius Rotor Performance with Curtaining. Exp. Therm. Fluid Sci. 2008, 32, 1673–1678. [Google Scholar] [CrossRef]
  9. Mohamed, M.H.; Janiga, G.; Pap, E.; Thévenin, D. Optimization of Savonius Turbines Using an Obstacle Shielding the Returning Blade. Renew. Energy 2010, 35, 2618–2626. [Google Scholar] [CrossRef]
  10. Takao, M.; Kuma, H.; Maeda, T.; Kamada, Y.; Oki, M.; Minoda, A. A Straight-Bladed Vertical Axis Wind Turbine with A Directed Guide Vane Row—Effect of Guide Vane Geometry on the Performance—. J. Therm. Sci. 2009, 18, 54–57. [Google Scholar] [CrossRef]
  11. Syawitri, T.P.; Yao, Y.; Chandra, B. Optimisation of straight plate upstream deflector for the performance enhancement of vertical axis wind turbine at low, medium and high regimes of tip speed ratios. Wind Eng. 2022, 46, 1487–1510. [Google Scholar] [CrossRef]
  12. Kim, D.; Gharib, M. Efficiency improvement of straight-bladed vertical-axis wind turbines with an upstream deflector. J. Wind Eng. Ind. Aerodyn. 2013, 115, 48–52. [Google Scholar] [CrossRef]
  13. Jin, X.; Wang, Y.; Ju, W.; He, J.; Xie, S. Investigation into Parameter Influence of Upstream Deflector on Vertical Axis Wind Turbines Output Power via Three-Dimensional CFD Simulation. Renew. Energy 2018, 115, 41–53. [Google Scholar] [CrossRef]
  14. Jiang, Y.; Zhao, P.; Zou, L.; Zong, Z.; Wang, K. Two-Dimensional Computational Fluid Dynamics Study on the Performance of Twin Vertical Axis Wind Turbine with Deflector. J. Energy Resour. Technol. 2020, 142, 081303. [Google Scholar] [CrossRef]
  15. Matsumoto, M. Investigation of the Shape and Arrangement of the Wind Collector Suitable for a Straight-Blade Vertical-Shaft Wind Turbine. Master’s Thesis, Kyushu University, Fukuoka, Japan, 2013. [Google Scholar]
  16. Watanabe, K.; Ohya, Y.; Karasudani, T. Development of a high-performance vertical axis wind turbine by a drive abstract principled method and an application of wind-energy collecting structure. In Proceedings of the 21th National Symposium on Wind Engineering, Tokyo, Japan, 1–3 December 2010; pp. 239–244. [Google Scholar]
  17. Battisti, L.; Zanne, L.; Dell’Anna, S.; Dossena, V.; Persico, G.; Paradiso, B. Aerodynamic Measurements on a Vertical Axis Wind Turbine in a Large Scale Wind Tunnel. J. Energy Resour. Technol. 2011, 133, 031201. [Google Scholar] [CrossRef]
  18. Ohya, Y.; Uchida, T.; Karasudani, T.; Hasegawa, M.; Kume, H. Numerical Studies of Flow around a Wind Turbine Equipped with a Flanged-Diffuser Shroud Using an Actuator-Disk Model. Wind Eng. 2012, 36, 455–472. [Google Scholar] [CrossRef]
  19. Watanabe, K.; Ohya, Y. A Simple Theory and Performance Prediction for a Shrouded Wind Turbine with a Brimmed Diffuser. Energies 2021, 14, 3661. [Google Scholar] [CrossRef]
  20. Horiuchi, K.; Sagara, K.; Seki, K. A Flow Analysis on Straight Wing Vertical Axis Wind Turbine using Numerical Simulation Model. In Proceedings of the JSES/JWEA Joint Conference, Fukuoka, Japan, 4–5 November 2004; pp. 313–316. [Google Scholar]
  21. Fujii, T.; Takuno, H.; Mizuno, A. Computational Fluid Dynamics of Straight Wing Vertical Axis Wind Turbine for Practical Design. In Proceedings of the Wind Energy Symposium, Tokyo, Japan, 27–28 November 2014; pp. 417–419. [Google Scholar]
Figure 1. Wind tunnel setup (looking down).
Energies 16 06719 g001
Figure 2. Vertical-axis wind turbine used in the wind tunnel experiments.
Energies 16 06719 g002
Figure 3. Configurations and locations of the surrounding structures: (a) in situ photograph; (b) plan view.
Energies 16 06719 g003
Figure 4. Configurations and ellipses of the surrounding structures.
Energies 16 06719 g004
Figure 5. Power coefficient Cp of wind turbines vs. tip speed ratio λ (symmetric Venturi).
Energies 16 06719 g005
Figure 6. Power coefficient Cp of wind turbines vs. tip speed ratio λ (symmetric flat panels).
Energies 16 06719 g006
Figure 7. Power coefficient Cp of wind turbines vs. tip speed ratio λ (CR type used with other shapes). (a) The shape of the structure in the positive y region was fixed to CR. (b) The shape of the structure in the negative y region was fixed to CR.
Energies 16 06719 g007
Figure 8. Power coefficient Cp of wind turbines vs. tip speed ratio λ (CR-type structures).
Energies 16 06719 g008
Figure 9. Power coefficient Cp of wind turbines vs. tip speed ratio λ (b(C)-type flat panels).
Energies 16 06719 g009
Figure 10. Power coefficient Cp of wind turbines vs. tip speed ratio λ (b(U)-type flat panels).
Energies 16 06719 g010
Figure 16. Recommended shape of the surrounding structures. (a) Deflector which is proposed by “Kim (2013)”. (b) Recommended shape.
Energies 16 06719 g016
Table 1. Torque transducer and AC servo-control system.
DeviceManufacturerModelMeasurement Accuracy
Torque
Detector
ONO SOKKI
Co. Ltd.
(Kanagawa, Japan)
SS-100±0.2% F.S
Torque
Converter
TS-2600
AC Servo-
Control System
SANYO DENKI
Co. Ltd.
(Tokyo, Japan)
PY0A
150A
-
Disclaimer/Publisher’s Note: The statements, opinions and data contained in all publications are solely those of the individual author(s) and contributor(s) and not of MDPI and/or the editor(s). MDPI and/or the editor(s) disclaim responsibility for any injury to people or property resulting from any ideas, methods, instructions or products referred to in the content.

