Article

Effects of Operating Conditions on the Oxygen Removal Performance of the Deoxo Chamber in the Water Electrolysis System

1
School of Mechanical Engineering, Pusan National University, Geumjeong-gu, Busan 46241, Republic of Korea
2
School of Electronical Engineering, Pusan National University, Geumjeong-gu, Busan 46241, Republic of Korea
3
Sunbo Unitech R&D Center, 97, Centum jungang-ro, Haeundae-gu, Busan 48058, Republic of Korea
*
Authors to whom correspondence should be addressed.
Energies 2023, 16(18), 6685; https://doi.org/10.3390/en16186685
Submission received: 21 August 2023 / Revised: 12 September 2023 / Accepted: 15 September 2023 / Published: 18 September 2023

Abstract

:
Although the production of high-quality hydrogen from electrolysis systems is essential, research in this area is limited. In this study, we investigate the effect of operating conditions on the change in oxygen concentration through computational analysis for optimizing the deoxo chamber of a water electrolysis system. The test results of the water electrolysis system are simulated, and the oxygen concentration of the deoxo chamber is calculated through computational fluid dynamics analysis according to various conditions, such as the pressure, temperature, and flow rate. The O2 removal performance is significantly affected by the operating pressure and temperature, with an increase in both leading to a decrease in the O2 concentration in the water electrolysis system. Furthermore, we confirm that the change in the flow rate into the chamber has a minor effect on the change in the oxygen removal performance when the inlet flow rate was 1–1.5 kg/h and the length diameter ratio of the chamber is 38.4.

1. Introduction

Recently, the use of carbon fuels has led to an increase in the amount of CO2 emissions due to industrialization and increased economic activities [1,2,3]. Global warming, caused by an increase in the amount of CO2 emissions, has created several climate change issues, including floods, droughts, and cold waves [4,5,6,7]. The seriousness of this climate change problem has been continuously raised; however, the efforts to solve this issue are still insufficient [8,9]. Between 2030 and 2052, the global average temperature will reach the threshold of 1.5 °C if we continue with present activities without implementing any efforts to reduce greenhouse gas emissions. To maintain global warming within the required threshold, greenhouse gas emissions must be reduced to net zero by 2050 [10]. To prevent further deterioration of the present conditions, it is essential to use hydrogen as an energy source to replace carbon. Research on the production and storage of green hydrogen in association with renewable energy is highly important for the use of hydrogen as an energy source. Currently, the production cost of green hydrogen is higher than that of blue hydrogen, but it is necessary to increase the production of green hydrogen through the expansion of water electrolysis facilities as well as increasing the capacity of water electrolytic systems, which can reduce the production cost of green hydrogen. Among water electrolysis methods, the most commercialized technology is alkaline water electrolysis, which uses a non-precious metal catalyst and has the advantage of having the lowest hydrogen production cost. However, there is a risk of mixing hydrogen and oxygen, and there are disadvantages of using low-purity hydrogen, low energy density, and corrosive electrolytes. Water electrolysis using polymer electrolyte membrane (PEM) has the advantage of being able to operate at relatively high pressure, to produce high-purity hydrogen, to have high energy density and efficiency, and to be applicable to systems of various capacities. However, despite their enormous potential, water electrolysis systems relying on these sources suffer from various reliability and high cost issues. Especially when increasing the capacity of the water electrolysis system, it takes too long to reach the target hydrogen purity, and the hydrogen concentration is not stable. Among the various H2 purification technologies used to increase hydrogen purity, catalyst purification technology is commonly used to remove O2; O2 and H2 recombination reactions are performed to remove only O2 from the H2 stream. Furthermore, O2 removal technology is essential for ensuring the safety of H2 production systems because an explosion can occur when the O2 concentration reaches the lower explosive limit of 4% [11]. In order to safely operate a large-capacity water electrolysis system connected to renewable energy sources, technology is required to prevent the possibility of oxygen concentration increasing in various load fluctuation situations and to maintain stable hydrogen quality. Several methods exist for separating oxygen, including the solid polymer electrode method, metal hydride, palladium membrane separation method, and cryogenic separation method. However, catalytic purification, which selectively removes only oxygen through the recombination reaction of hydrogen and oxygen, is capable of reducing its content close to zero. Catalytic purification technology utilizing the recombination reaction of hydrogen and oxygen can effectively clear the path for the commercialization of an extremely safe hydrogen production process, making it an essential technology for achieving this goal.
Several studies have been conducted on the removal of O2 from H2 streams in water electrolysis systems. Schug [12] performed a pilot test using a high-pressure 100 kW electrolyzer, and an oxygen electrolyte separator was used to remove oxygen. The experimental confirmation was limited to changes in oxygen concentration based on the input current density of the oxygen separator. Ligen et al. [13] demonstrated the use of a 50-kW alkaline water electrolysis system equipped with an O2 removal catalyst. The catalyst purification unit was operated at ambient temperature and pressure, and the O2 concentration in the H2 stream, produced by the O2 removal catalyst unit, was maintained at 4 ppm. They confirmed the concentration of O2 under a single temperature and pressure condition when producing 850 g of hydrogen per hour, and did not investigate the effect of changing conditions. Pyle et al. [14] reported a solar water electrolysis system equipped with an O2 removal catalyst. Kim et al. [15] and Lalik et al. [16] evaluated the O2 removal performance according to changes in the physical and chemical properties of the catalysts to improve the efficiency of Pd and Pt catalysts. In addition, Lalik et al. investigated the poisoning effect due to moisture depending on the type of catalyst such as Pd, Pt, and Pd-Pt. When Pd was used as a catalyst, activity was easily recovered just by increasing the temperature of the deoxo chamber to 50 °C, thereby promoting desorption of water on the catalyst surface. Pt catalyst remains deactivated by the produced water even at a higher temperature than Pd. Haug et al. [17] investigated the influence of operating conditions on the product gas purity using an O2 gas separator in lab-scale alkaline water electrolysis. The operating conditions included the temperature, electrolyte concentration, flow rate, and electrolyte management. They showed that an increase in the temperature and a decrease in the flow rate reduced the amount of gas impurities. Yasnev et al. [18] investigated the performance of H2 and O2 recombination reaction using cellular ceramics as a catalyst support to ensure hydrogen safety in nuclear power plants. Maximum conversion can be reached in a short time and local overheating can be prevented by optimizing temperature distribution along the catalyst column, when using cellular ceramics. Despite previous studies, much research has focused on the catalyst materials and characteristics, but the catalyst process system using it and the technology for its integration into the system are still in the early stages of development. Furthermore, since an expensive catalyst is utilized, there is a need for optimization research on the O2 removal chamber. This research aims not only to improve O2 removal efficiency but also to reduce the cost of hydrogen production in the water electrolysis system.
Catalysts for improving the O2 removal performance have been studied extensively; however, there is a lack of optimal research for their usage in water electrolysis systems. To increase the capacity of the water electrolysis system, it is necessary to study the changes in oxygen concentration in the hydrogen stream in the deoxo chamber under various conditions, such as pressure, temperature, flow rate, and catalyst type. Therefore, in this study, we investigated the effects of various conditions on the change in oxygen concentration using computational analysis. The test results of the water electrolysis system were simulated through the process analysis (Asepen Plus V11), and the oxygen concentration of the deoxo chamber was calculated through computational fluid dynamics (CFD) analysis (Fluent 19.0) using the operating conditions of the chamber derived from the process analysis; this was carried out in this manner because it is not possible to conduct experiments under various conditions in the water electrolysis system.

2. Numerical Condition and Methods

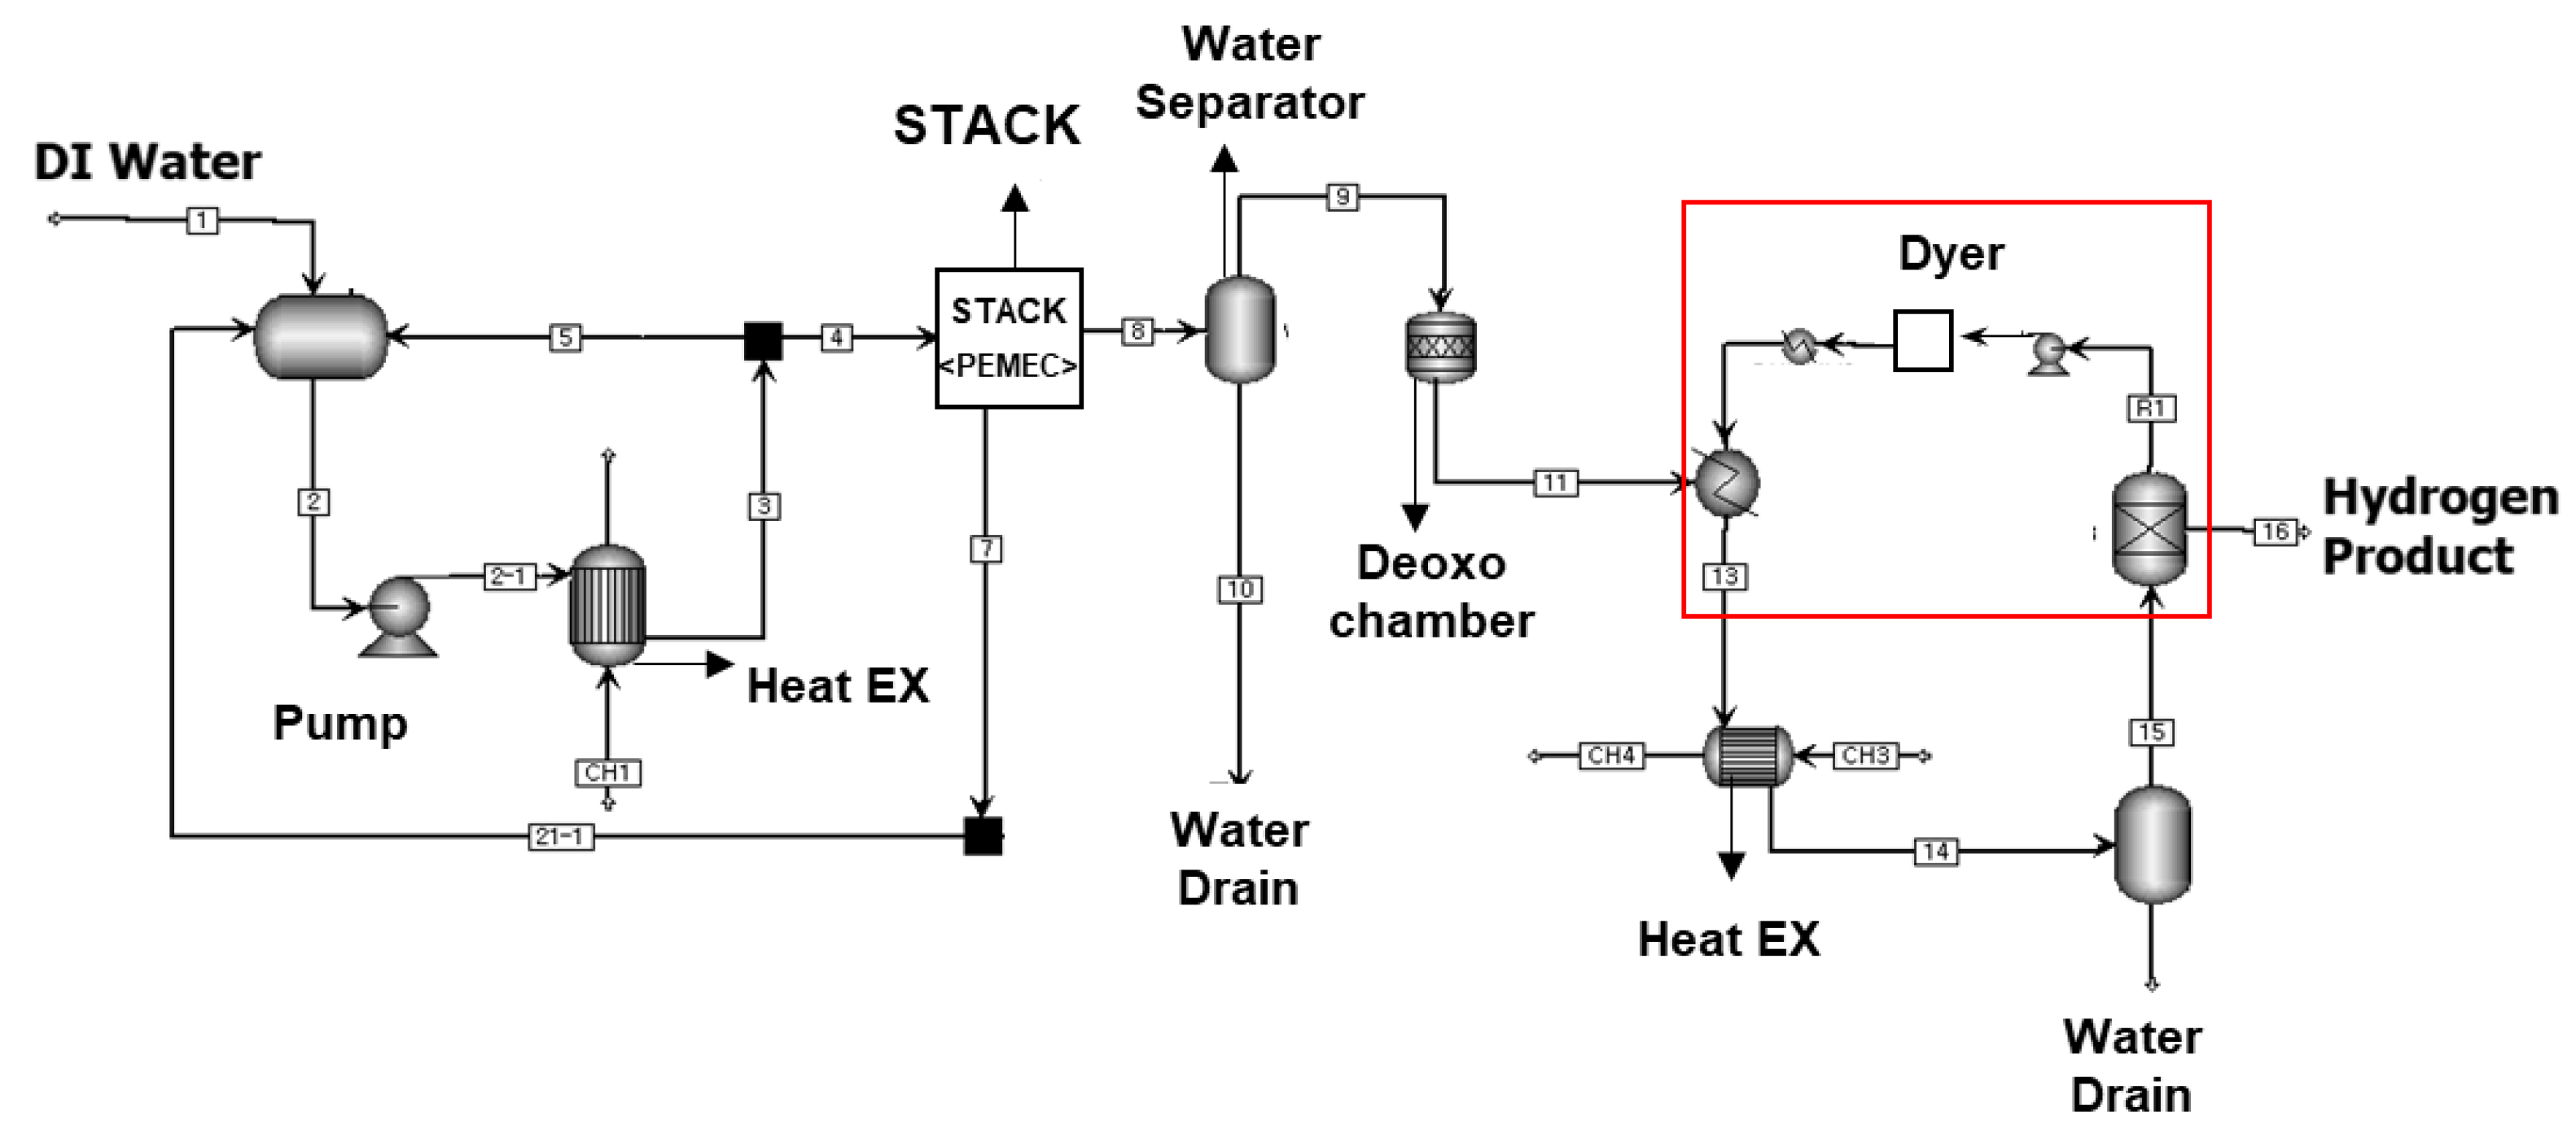
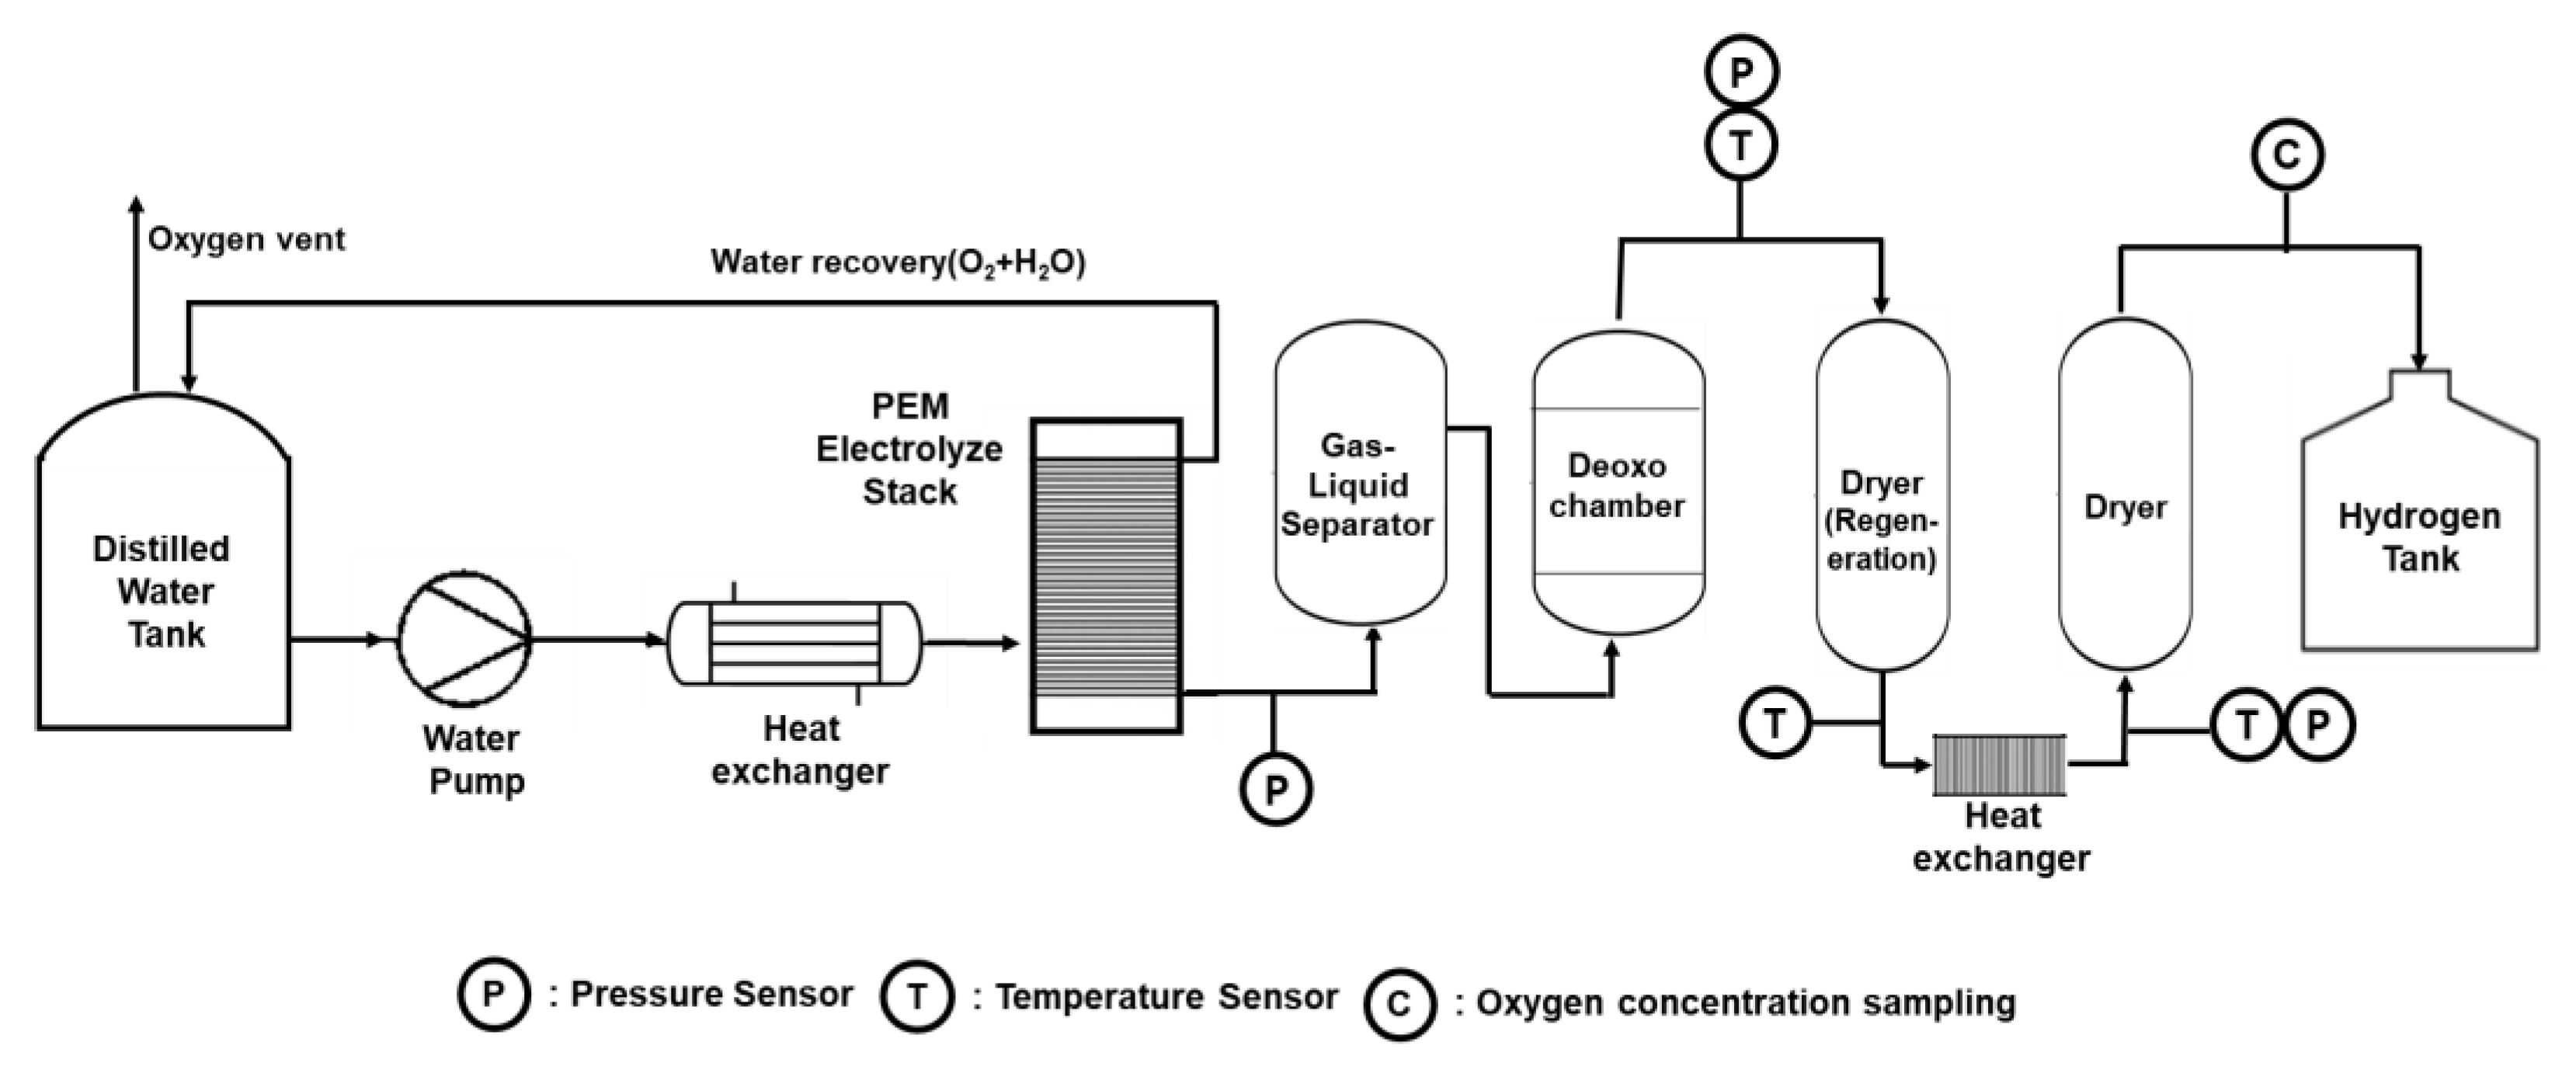
2.1. Process Analysis of the Electrolysis System

The process flow diagram of the PEM water electrolysis system is illustrated in Figure 1. As shown in Figure 1, the PEM water electrolysis system consists of a PEM stack and surrounding balance of plants (BOPs) for producing hydrogen and a system for removing impurities from the produced hydrogen.
Process analysis was performed under the same conditions as the test: the initial deionization water temperature was 23 °C and the PEM stack pressure and temperature were 8 bar and 60 °C, respectively. The PEM stack decomposes H2O supplied through the pump to produce H2 and O2; after increasing the purity of hydrogen through several steps to remove impurities (H2O and O2), produced hydrogen is stored in a hydrogen tank. Impurities in hydrogen were removed through a gas–liquid separator, deoxo chamber, and dryer. The hydrogen produced in the stack was first dehydrated in the gas–liquid separator before oxygen was removed by feeding the liquid into the deoxo chamber. Each BOP was subjected to process analysis by applying the actual operating conditions of the water electrolysis system (load, temperature, pressure, etc.) and was then compared with the measured results, such as the pressure, temperature, and concentration.

2.2. Physical Models and Numerical Methods

2.2.1. Governing Equation

For an incompressible, unsteady, two-phase turbulent flow, the three-dimensional RANS governing equations for the mass, momentum, species, and energy were solved using the equations given below. In this study, the governing equation of the flow analysis was calculated using the incompressible Navier–Stokes equation [19]. The mass conservation equation, also known as the continuity equation, can be expressed as follows:
ρ t + x i ( ρ μ i ) = 0
The law of conservation of momentum can be expressed as follows:
· ( ρ v v ) = p + · ( τ = ) + ρ g + F
In this study, the kε model, which is a turbulent flow model, was used to confirm the flow characteristics in the deoxo chamber. The governing equation applied to the simulation is given as follows:
The turbulent kinetic energy (k) is given as,
x i ( ρ k ) + x i ( ρ k u i ) = x j [ ( μ + μ i σ k ) k x j ] + G k ρ ε
The turbulence dissipation rate (ε) is given as,
x ( ρ ε ) + x i ( ρ ε u i ) = x j [ ( μ + μ i σ k ) ε x j ] + C 1 ε C 2 ε ρ ε 2 k
The generation of turbulent kinetic energy (Gk) of the mean velocity gradient is given as follows:
G k = ρ u i u j ¯ u j x i
The turbulent viscosity (μi) used in the standard kε turbulent model is given as,
μ i = C μ ρ k 2 ε
In the above equations, the coefficients are given as follows:
C1ε = 1.44, C2ε = 1.92, Cμ = 0.09, σk = 1.0, σε = 1.3
The standard kε model assumes that the flow is perfectly turbulent, and that the molecular viscosity is negligible.
To simulate the O2 conversion reaction on the catalyst’s surface, a species transport equation was applied to generate H2O from H2 and O2. The mass fraction of a chemical species Y can be predicted through the analysis of convection and diffusion for the ith species.
The conservation equation is expressed as follows:
t ( ρ Y i ) + · ( ρ μ Y i ) = · J i + S i
where Ji is the production rate of a product by the chemical reaction and Si is the production rate plus the user defined function (UDF) or the dispersed phase.

2.2.2. Catalyst Reaction

Chapman et al. [20] reported the recombination reaction of H2 and O2 when using a Pd catalyst, and almost a century has passed since this publication and the first reports of the water electrolysis technique. The recombination reaction of H2 and O2 is opposite to that of water electrolysis and is a strongly exothermic and catalytic reaction, as expressed in Equation (9).
0.5O2 + H2 → H2O ΔH = −242 kJ/mol
Depending on the choice of the catalyst, it is possible to theoretically maintain a 0% concentration of O2 in the H2 stream at room temperature without the use of an external power supply. For O2 removal from the H2 stream, Pd and Pt metals with high H2–O coupling reaction activities are used as the main catalyst materials [15]. In this study, Pd was used as a catalyst. It is possible to adsorb a large amount of H2 even at room temperature and atmospheric pressure because Pd has almost no activation energy barrier for the dissociative adsorption of H2 molecules [21]. In addition, because of its strong affinity for O2, Pd is adsorbed onto the surface of O2 molecules and dissociates, and ionization occurs even at low temperatures. The process by which ions chemically get adsorbed onto the Pd surface are sequentially combined to form water, as shown in equations given below [22].
Oads + Hads = OHads
OHads + Hads = H2Oads (H2Ogas)
In this study, the reaction rates experimentally presented in previous studies [23] were applied to predict the O2 concentration, as shown in Equations (10) and (11). Each reaction rate was modeled following a simple Arrhenius kinetic equation:
k i = A i exp ( E i R T )    
where ki is the rate of reaction i, Ai is the pre-exponential factor, Ei is the activation energy, R is the gas constant, and T is the temperature.

2.2.3. Reaction Model for Oxygen Removal

The deoxo reaction kinetics obtained in previous studies were used for CFD simulation using UDFs composed of C language macros. The basic variable values (temperature, pressure, and mass flow rate) calculated in Fluent were transferred to the UDF, and the variable values were used for the adsorption kinetics in the UDF routine. It also calculates the mass change of the gas phase and sends this data to Fluent 19.0.

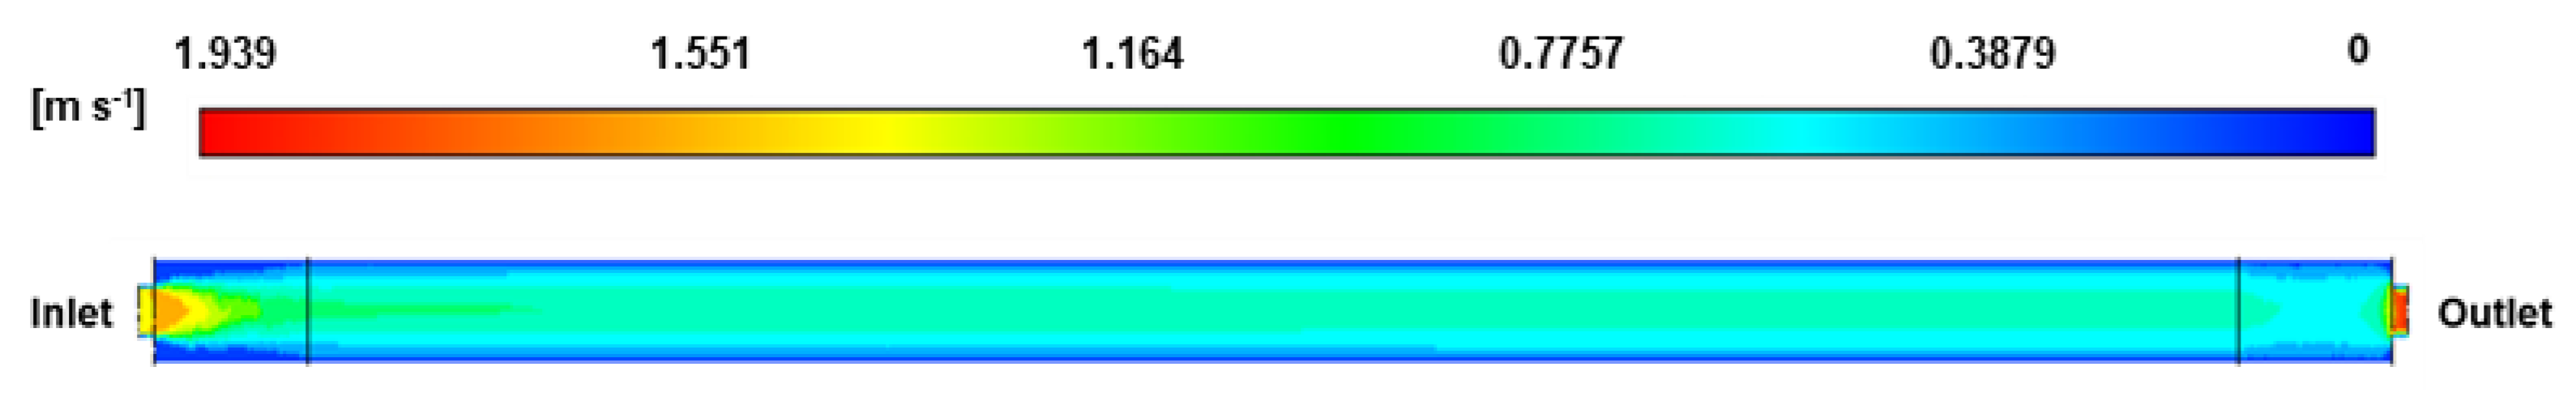
2.2.4. Geometric of the Deoxo Chamber and Boundary Condition

As shown in Figure 2a, the length diameter ratio (L/D ratio) of the deoxo chamber was designed to be 38.4 and the length of catalyst bed was 33.2D. The internal catalyst bed where the reaction occurs was assumed to be a porous zone, as shown in Figure 2b. The O2 removal reactor was made of a hexahedral lattice, which was interpreted to be approximately 1.25 million lattices based on the velocity distribution results. At the beginning of the reaction, the number of moles of gas inside the catalyst bed was set to zero. In addition, the inlet flow rate and volume ratio of each component were maintained constant, and the detailed values are listed in Table 1.

3. Results and Discussion

3.1. Process Analysis Temperature of the Water Electrolysis System

The Process analysis results of the process analysis are presented in Table 2. The analysis showed that the H2 mole flow generated in the water electrolysis stack at 100% load was 0.493 kmol/h, and the O2 concentration was approximately 200 ppm in the H2 stream that exited the electrolysis stack. The O2 concentration increases to 960 ppm after H2O separation in the water separator and is supplied to the deoxo chamber. The O2 removal rate of the catalytic recombination was 99.5%, which is similar to the recovery rate of 99.2–99.4% reported in previous research [13].
To verify the validity of the process analysis results in Table 2, an experiment was conducted using the water electrolysis system shown in Figure 3. The experiment was performed under conditions of a stack pressure of 8 bar and a temperature of 60 °C, and a deoxo chamber pressure of 6.5 bar and a temperature of 60 °C. The catalyst used in the deoxo chamber of the water electrolysis system contained 0.3 wt.% of Pd and reacted with H2 to remove O2. The temperature at the deoxo chamber’s outlet was compared with the temperature values measured before and after the use of the heat exchanger at the rear end of the dryer chamber during the regeneration process. The measured data are used for model verification that performs process analysis.

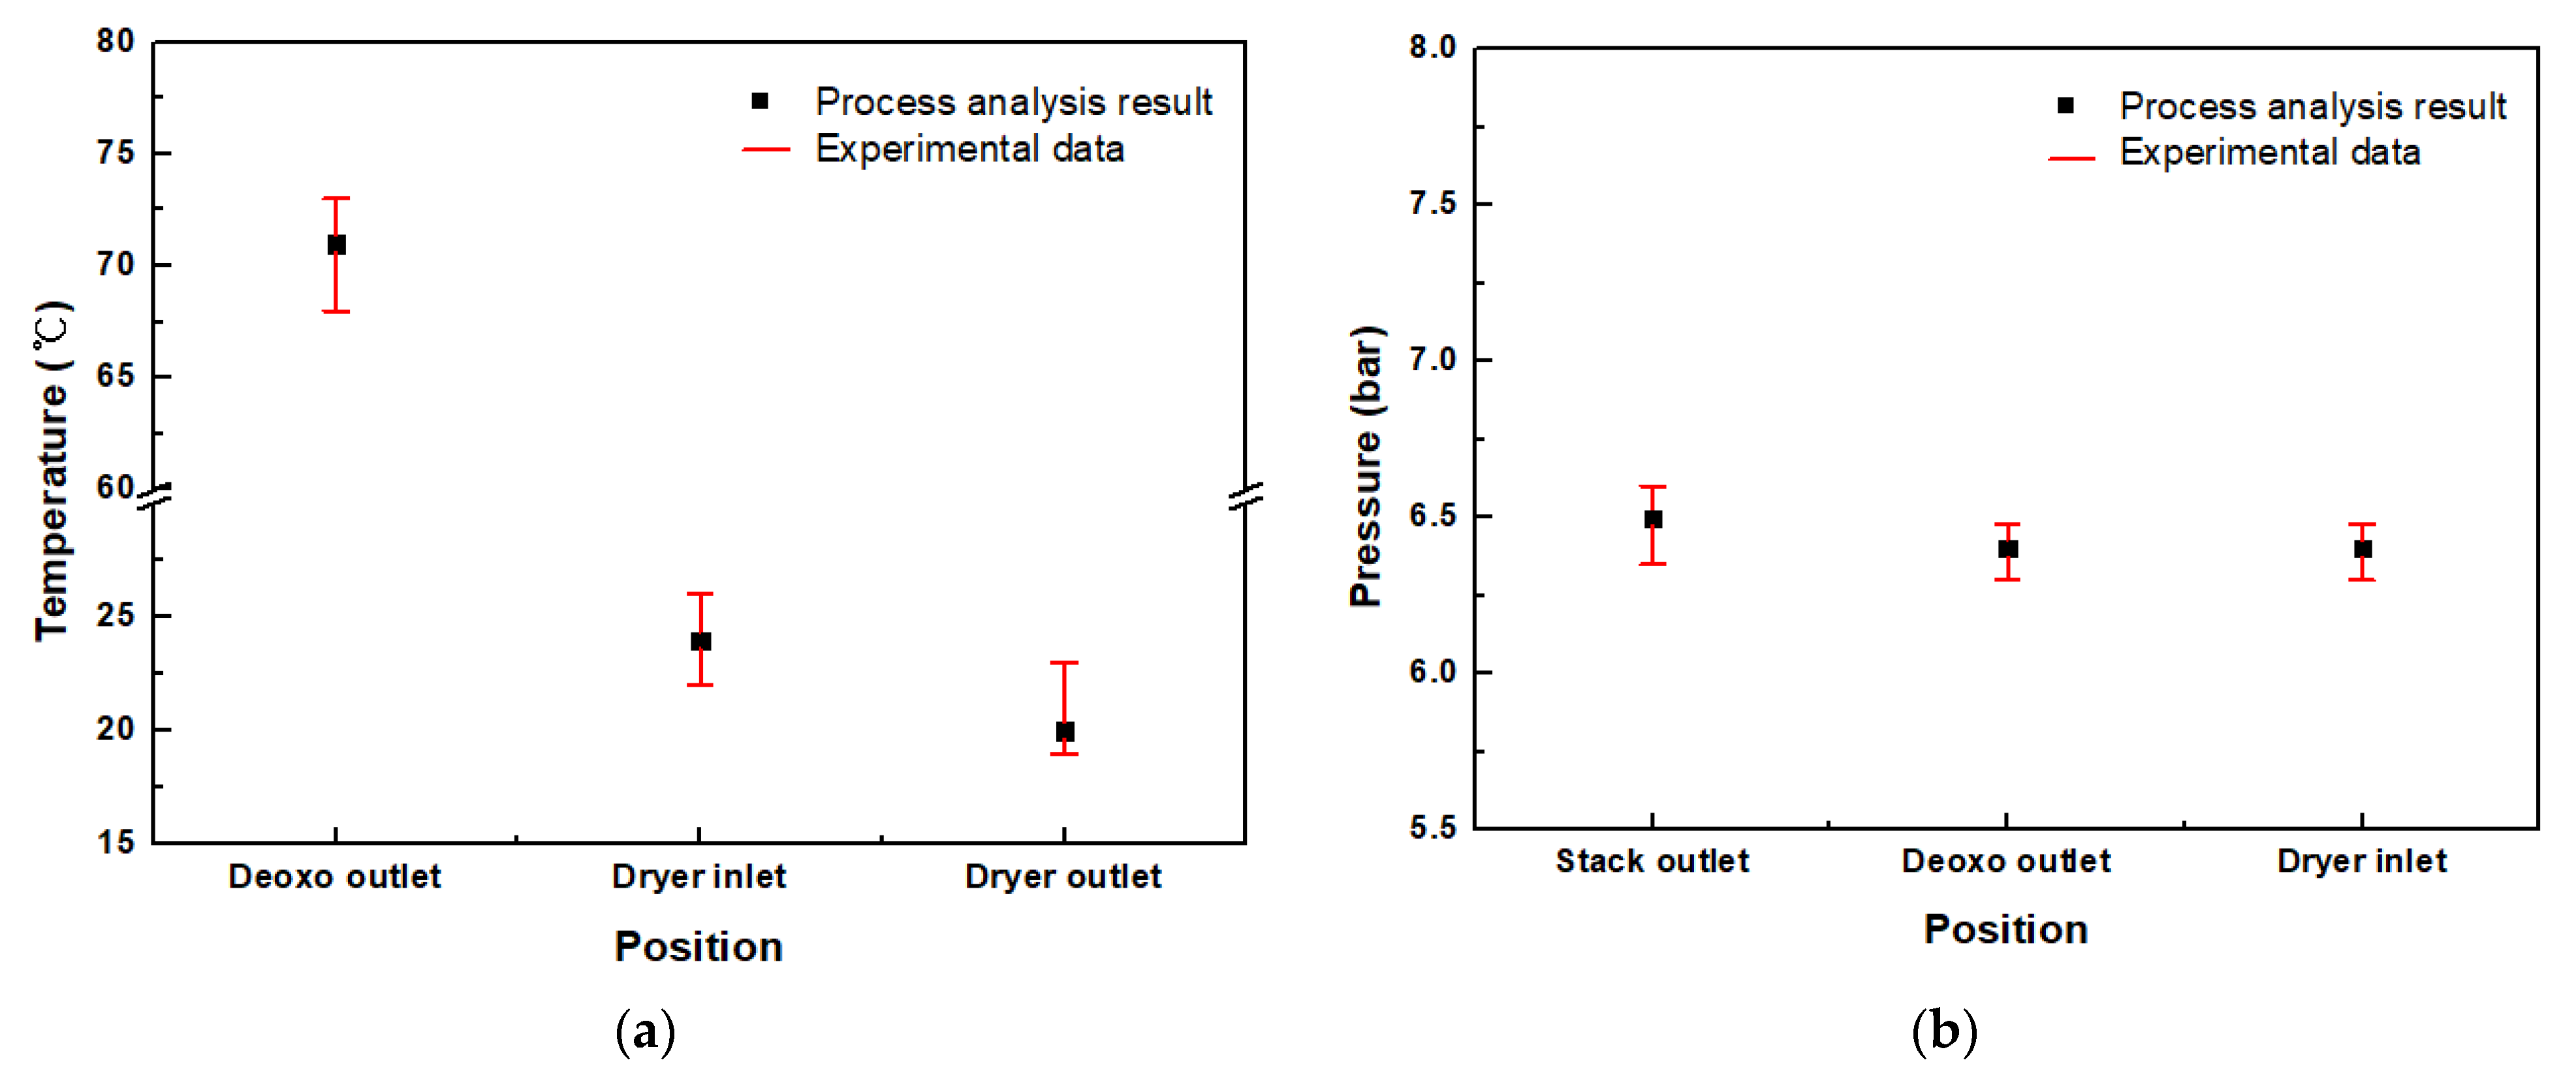
3.1.1. Temperature Comparison of the Test Results and Process Analysis

Figure 4a shows the results of the comparison of the temperature values determined using the test and process analysis. In the case of applying a 100% load to the stack during the function of the water electrolysis system, a mixed gas at 60 °C was supplied to the deoxo chamber and was discharged at a temperature of 68–73 °C after the oxygen removal reaction. The temperature of the heat exchanger, which was at the rear end of the regeneration dryer chamber ranged from 22–26 °C at the inlet and 19–23 °C at the outlet. The process analysis results at each point were within the range of those measured in the electrolysis test: 71 °C at the deoxo chamber outlet, 24 °C at the dryer inlet (the heat exchanger outlet), and 20 °C at the dryer outlet.

3.1.2. Pressure Comparison of the Test Results and Process Analysis

Figure 4b shows the results of the comparison of the pressure values determined using the test and process analysis. The pressure values measured at the outlet of the water electrolysis stack, at the rear end of the deoxo chamber, and at the inlet of the dryer chamber were compared with those of the process analysis results. When a 100% load was applied to the stack, the mixed gas compressed to 6.3–6.6 bar that had completed the reaction in the stack was discharged, and the pressure at the rear end of the deoxo chamber and the inlet of the dryer chamber ranged between 6.3 and 6.5 bar. The process analysis results at each point were in the range of those measured during the test, with a pressure of 6.5 bar at the outlet of the water electrolysis stack, 6.4 bar at the rear end of the deoxo chamber, and 6.4 bar at the inlet of the dryer chamber.

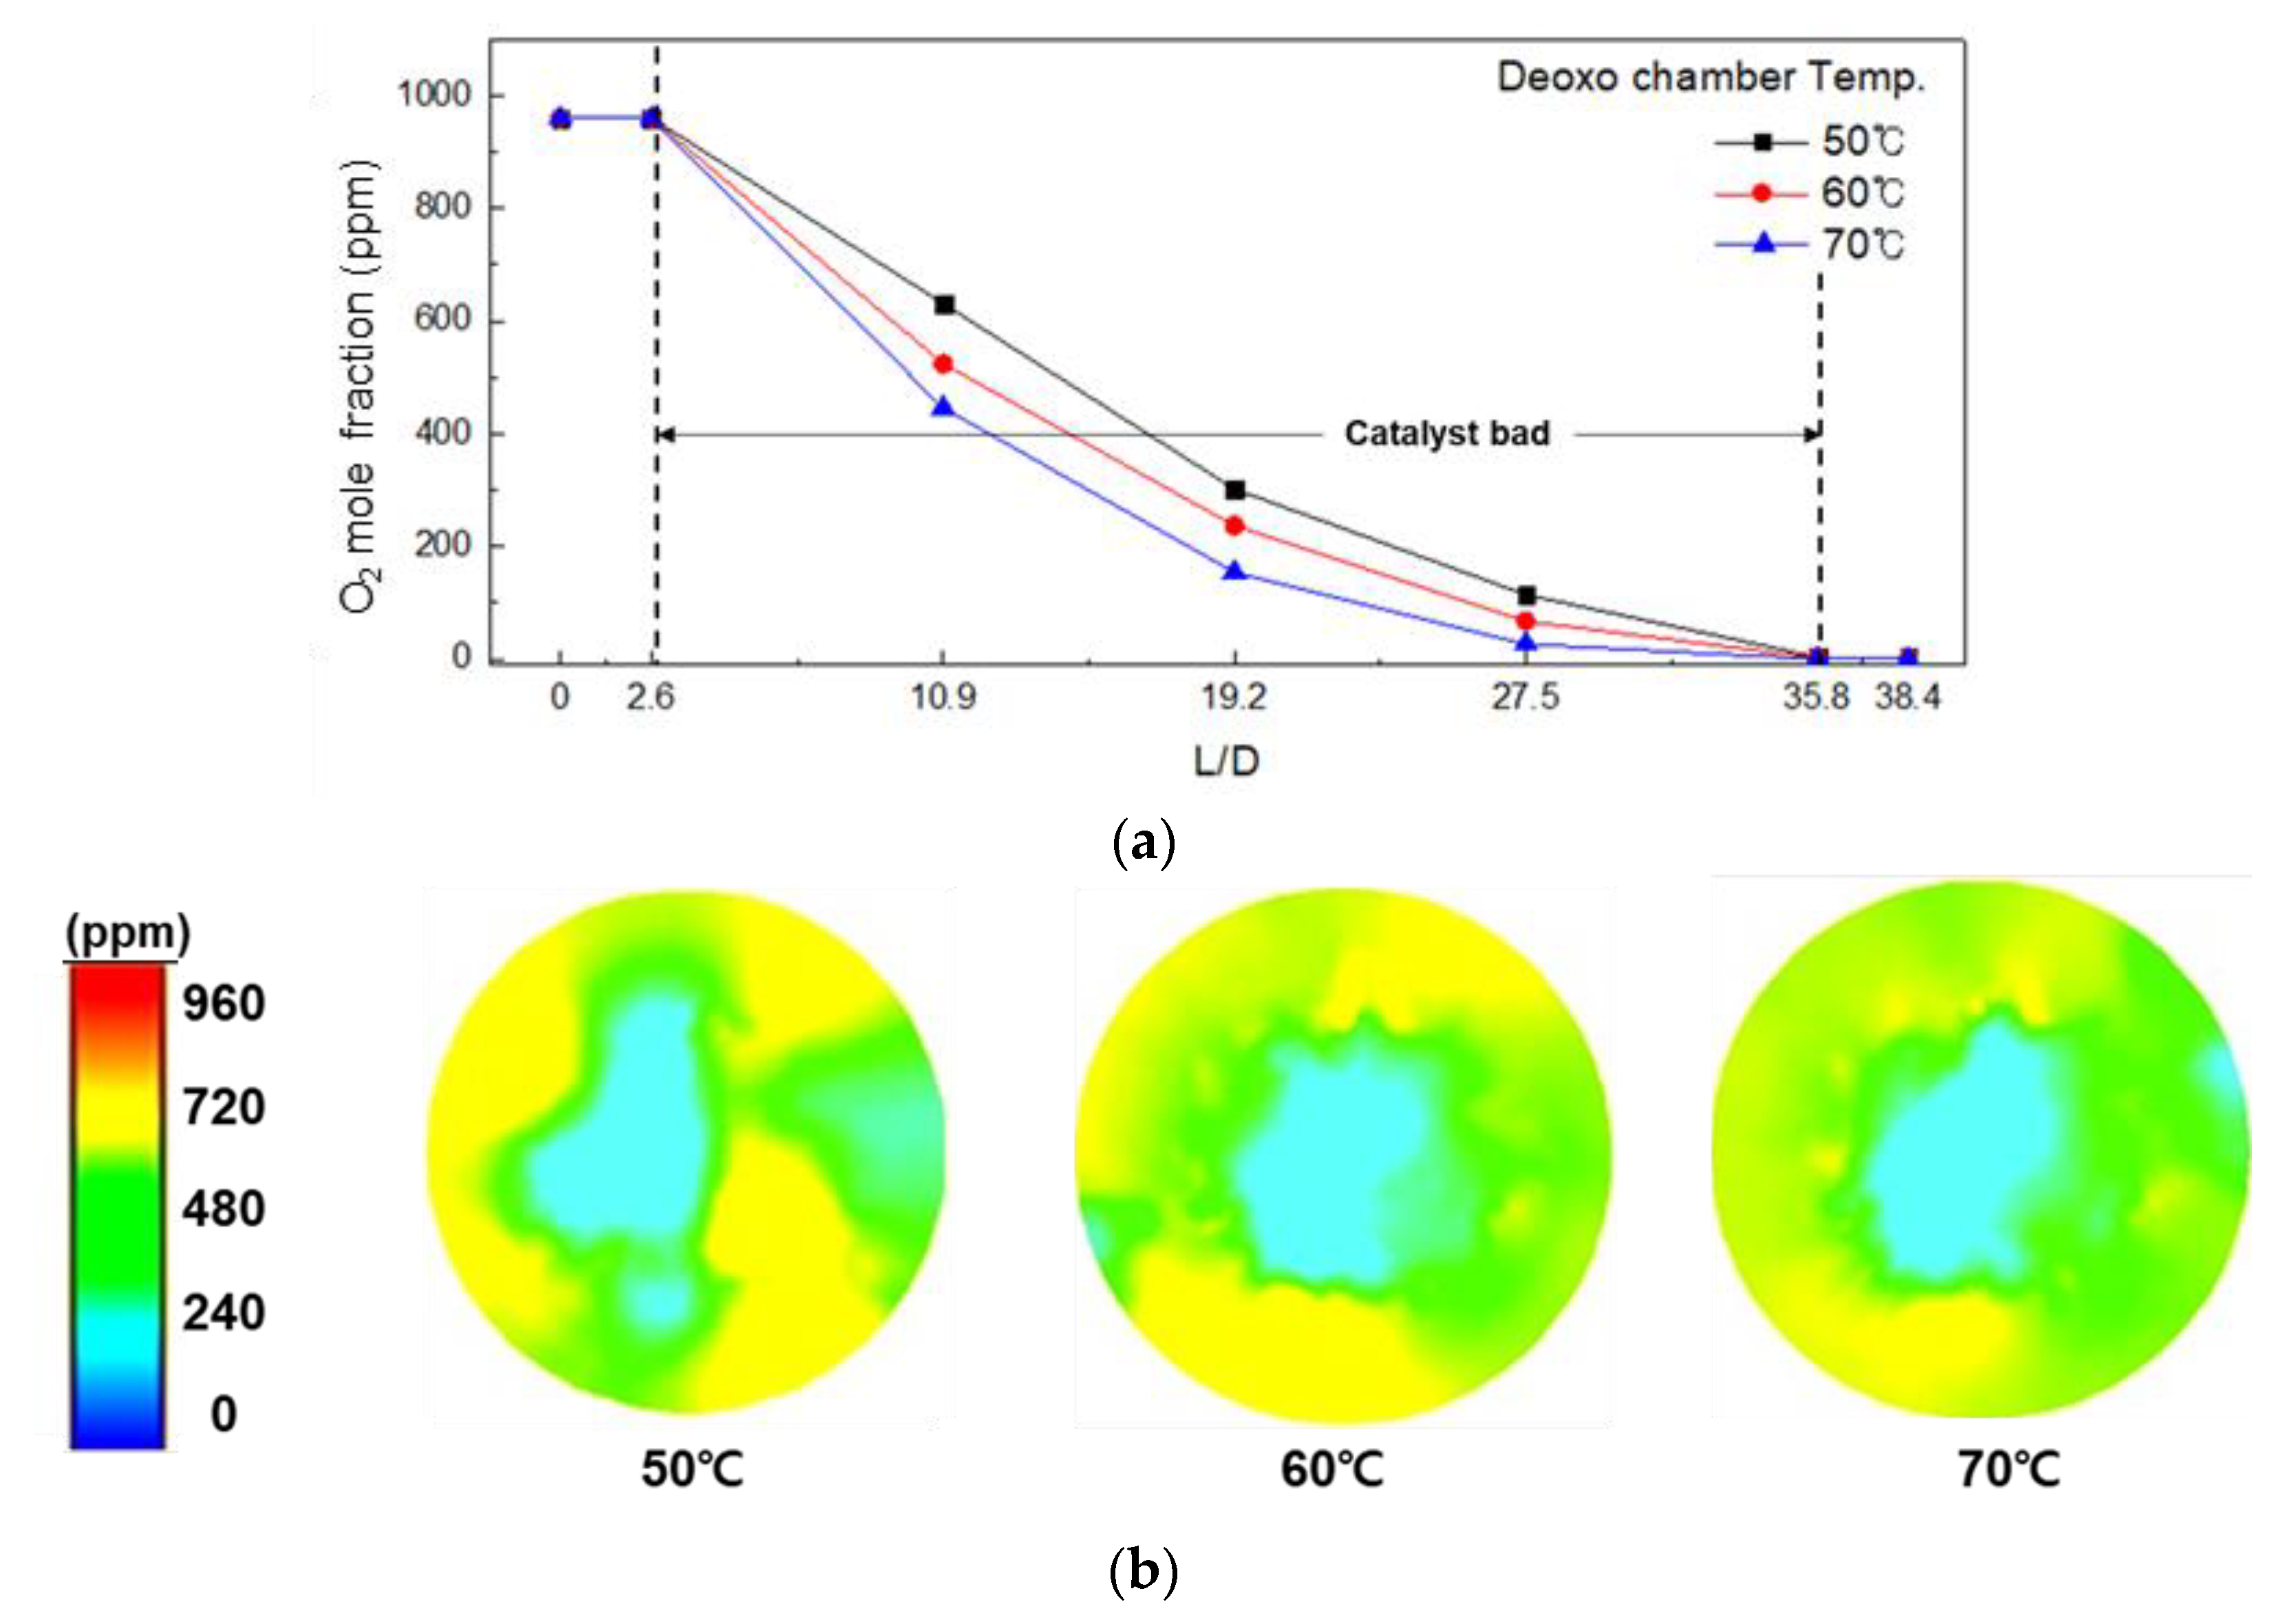
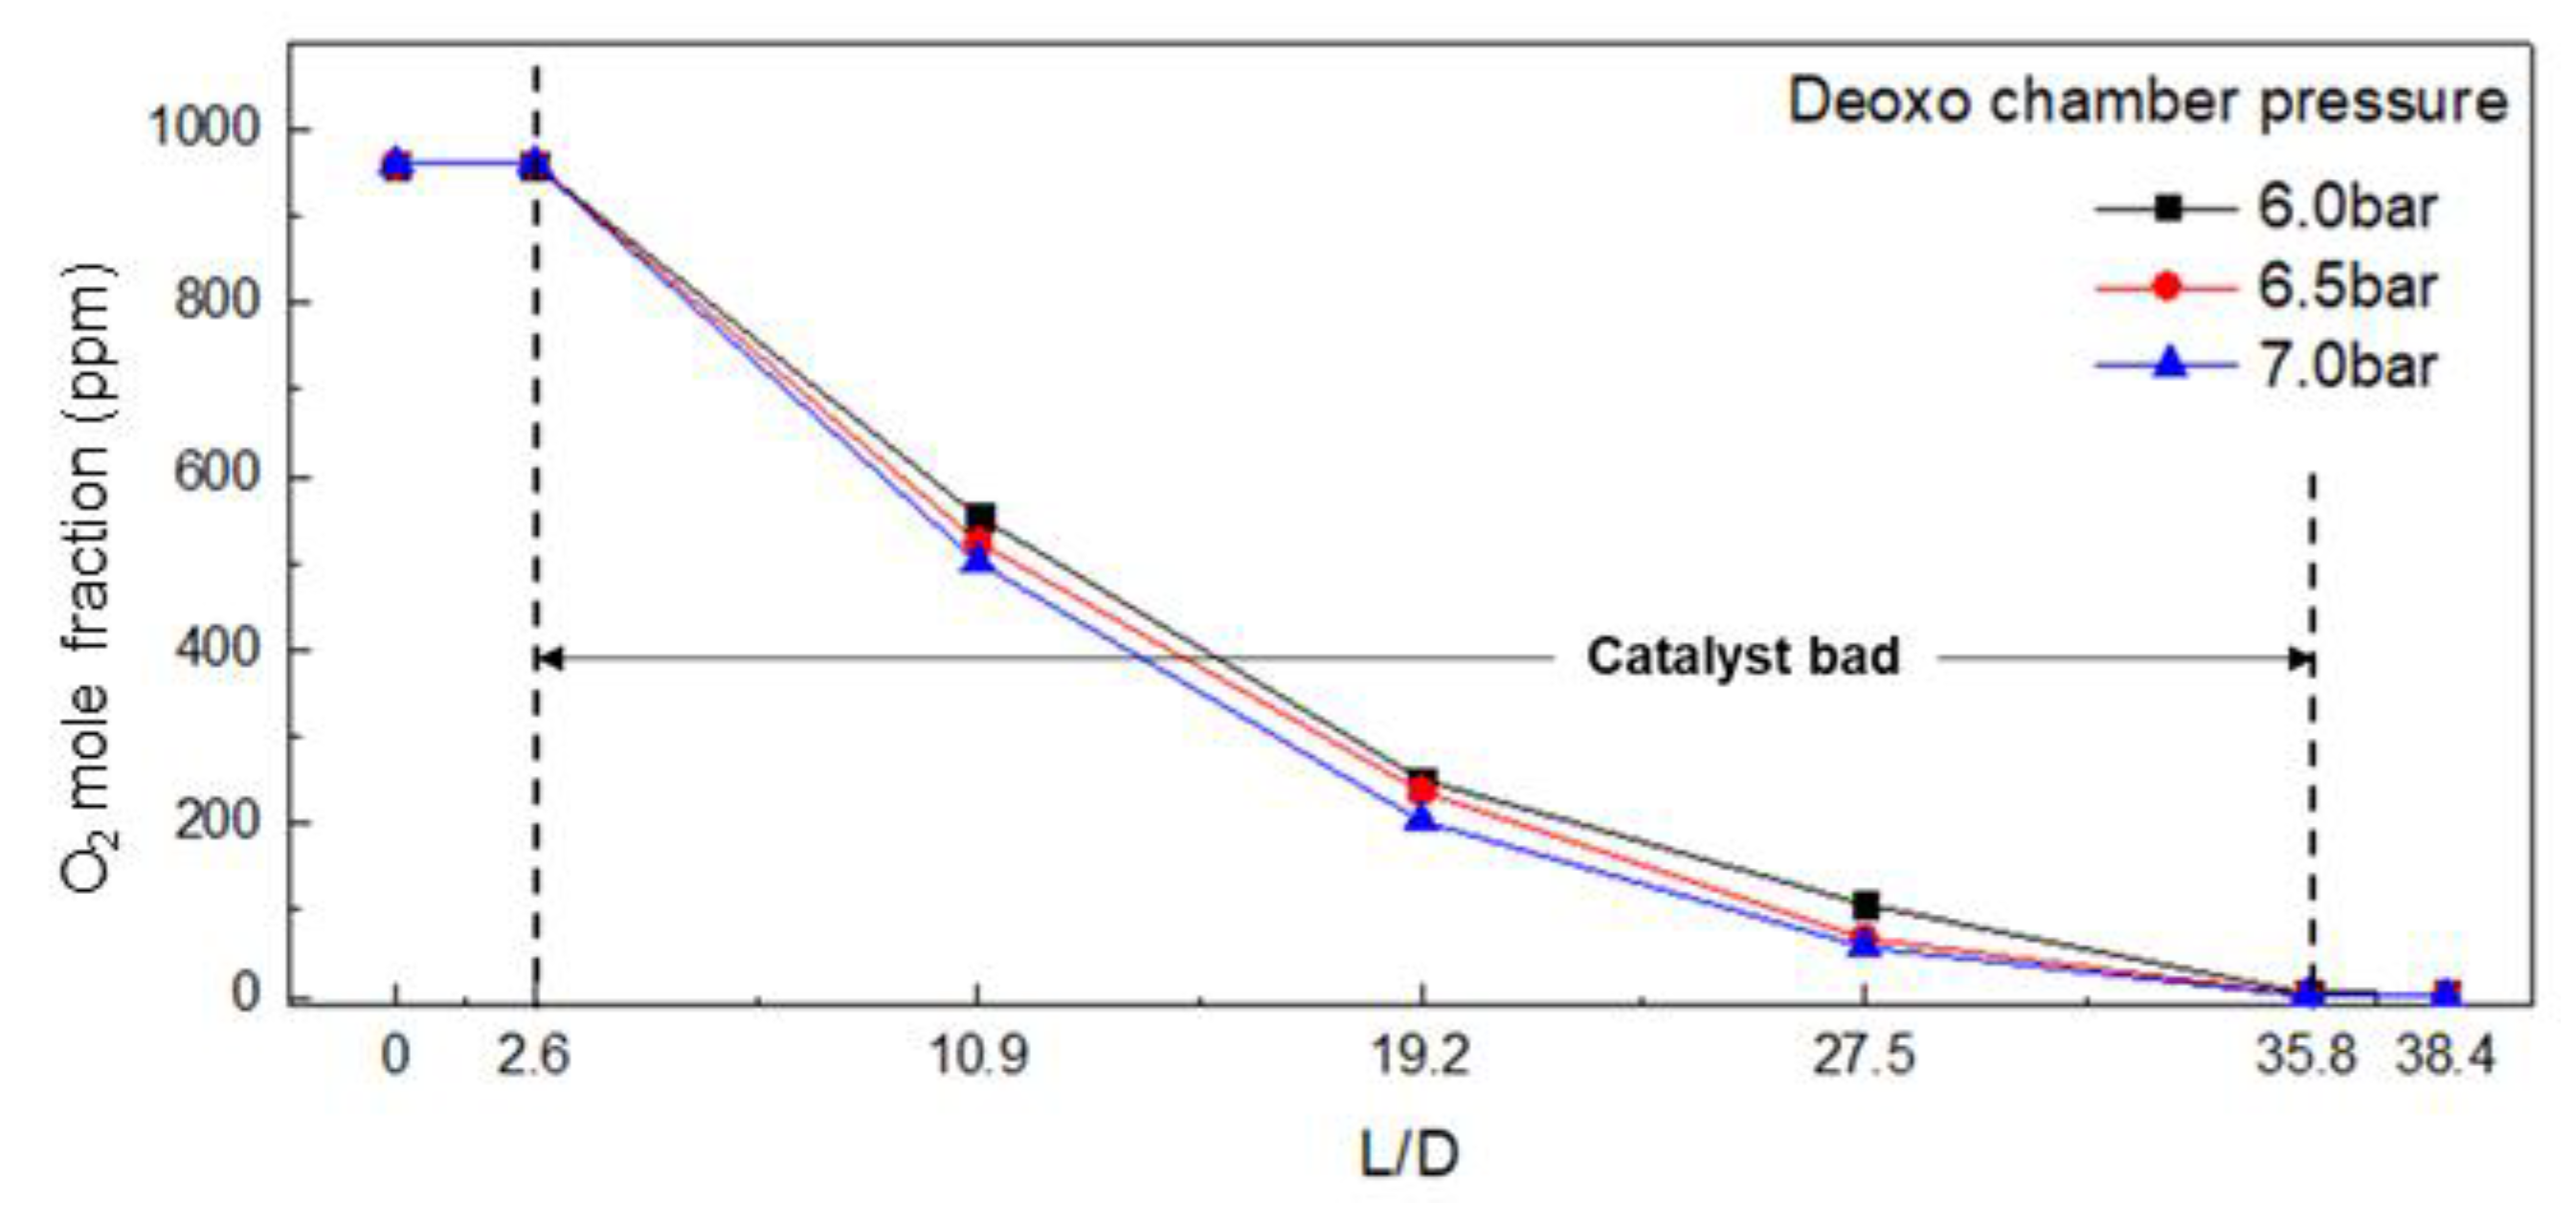
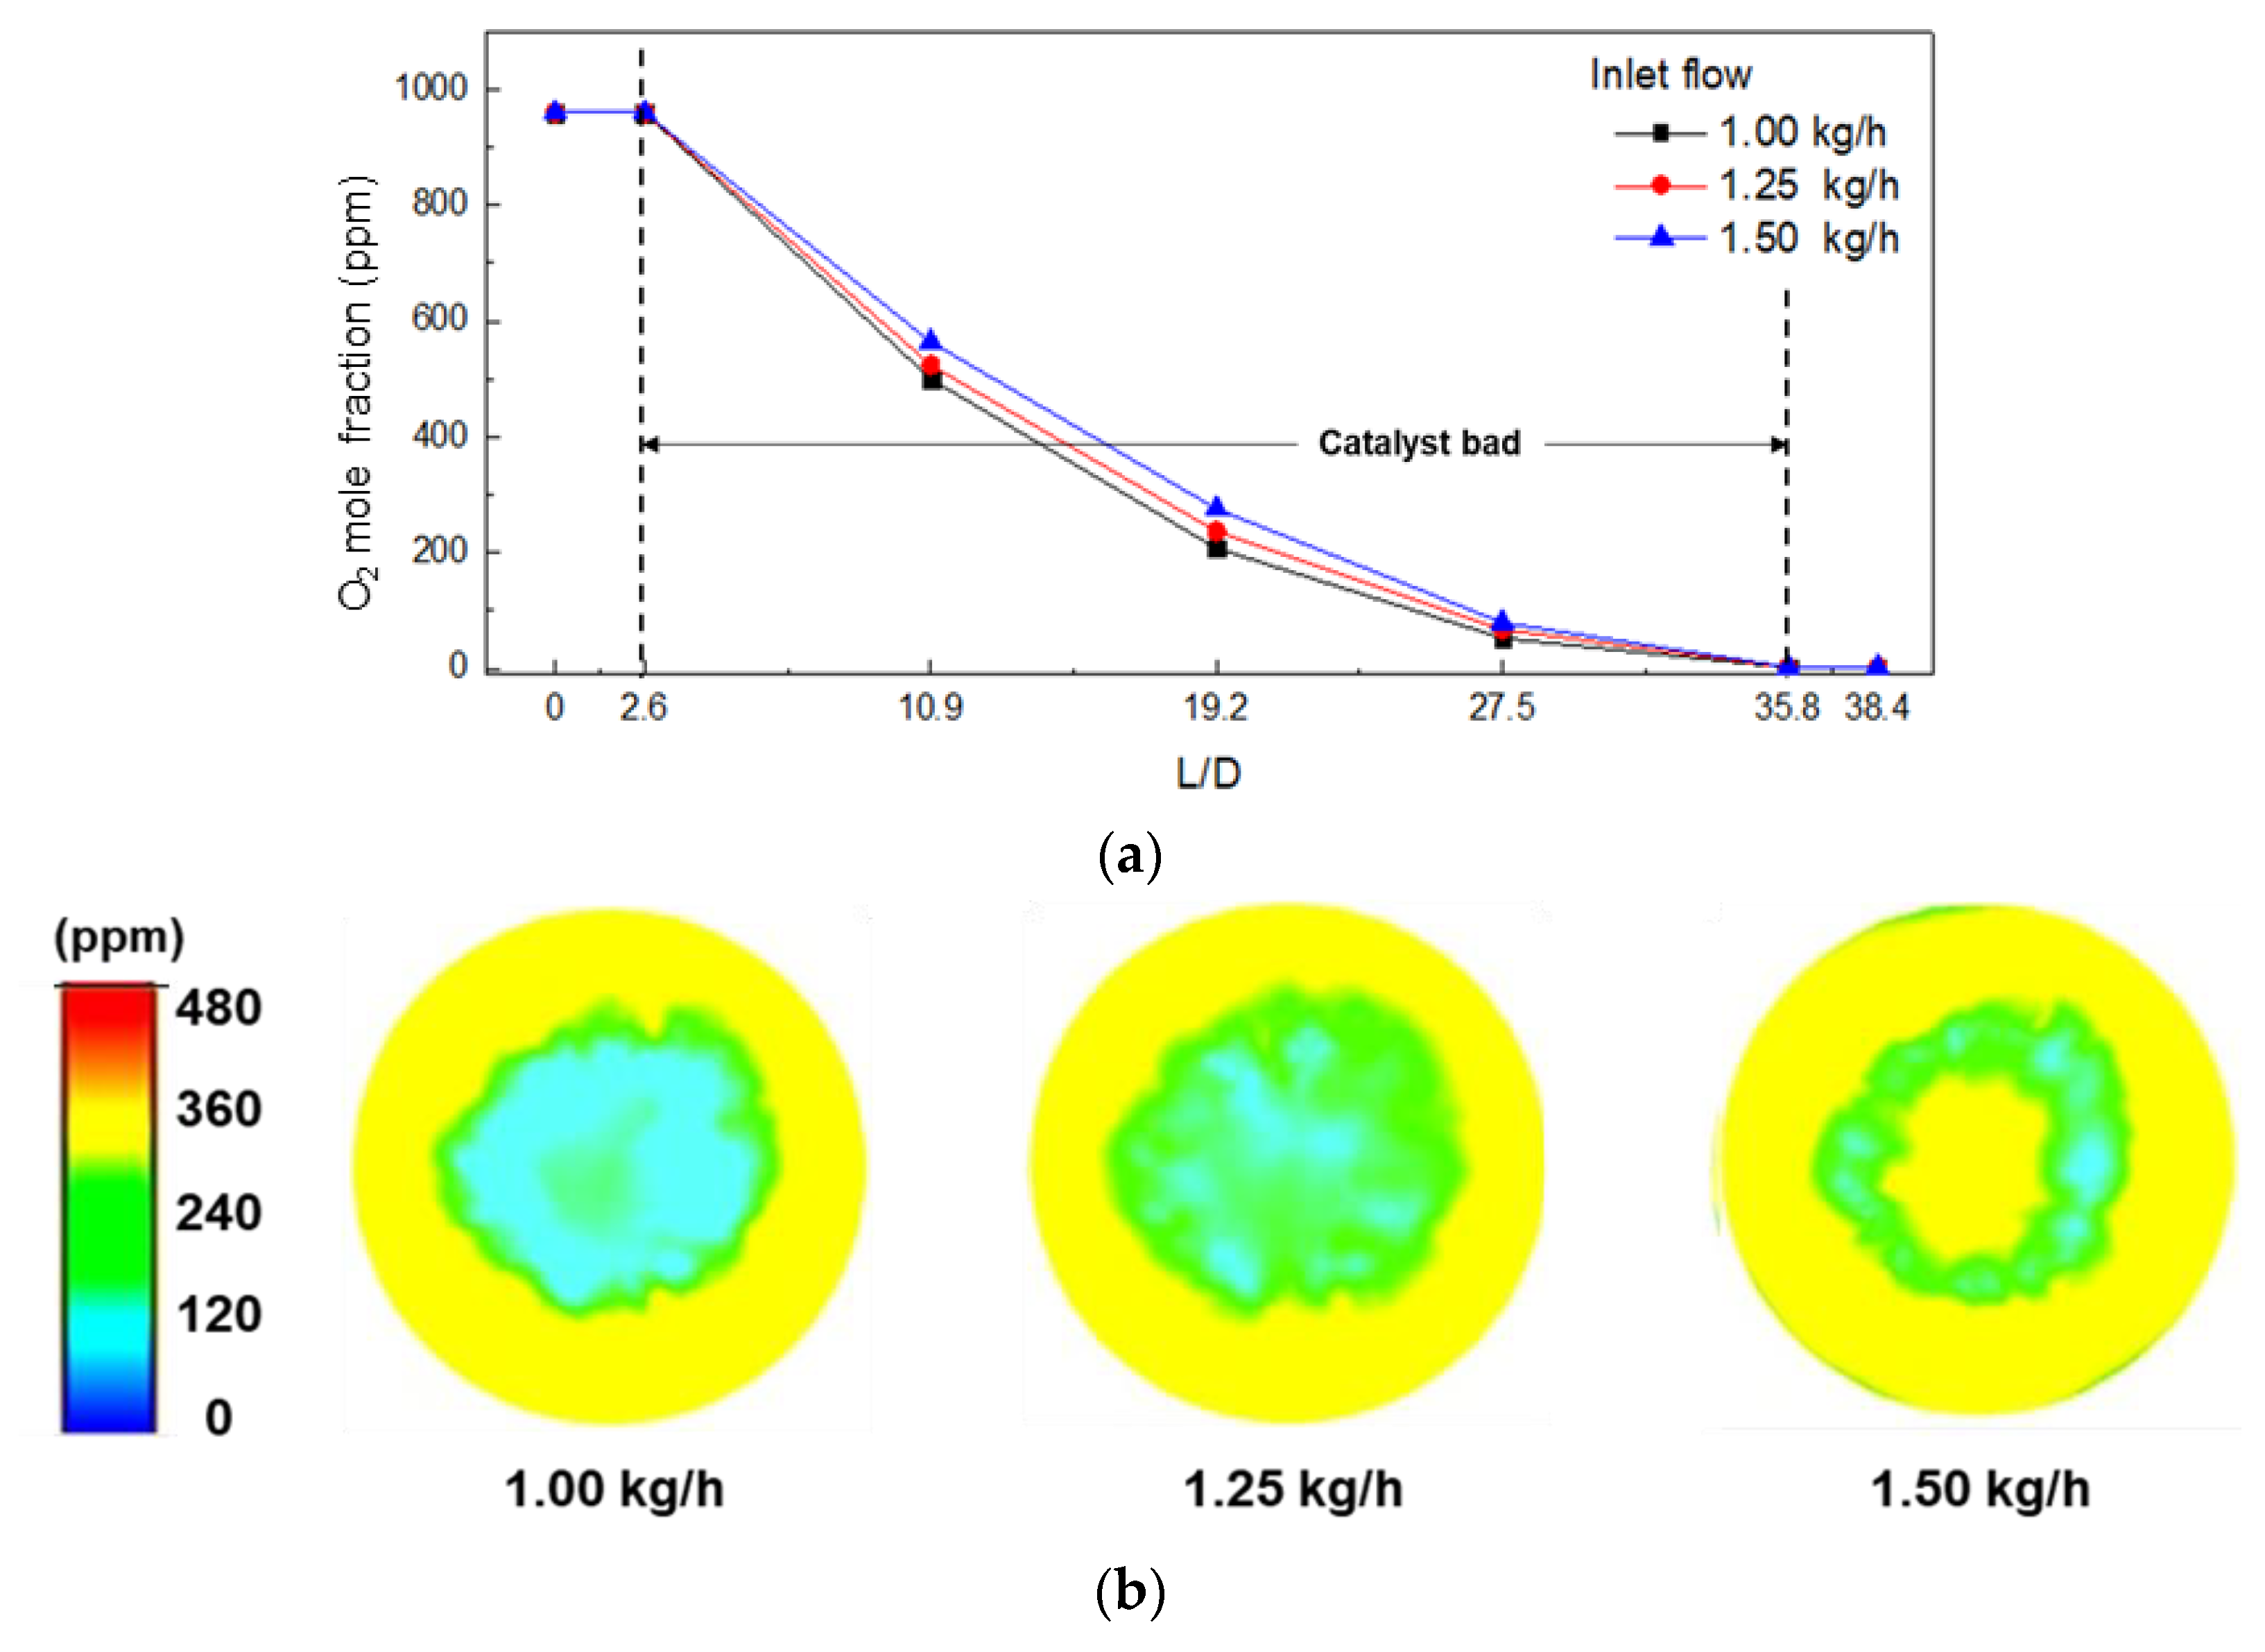
3.2. Effect of Operating Conditions on the O2 Mole Fraction

Figure 5 shows the contours of the stream velocity under the experimental conditions. The figure describes the distribution of the streamwise velocity. The high-velocity distributions appear in the inlet and outlet parts of the chamber, and uniform velocities in the z-axis direction are observed in the catalyst layer. The velocity decreases from the center of the chamber to the wall, and the residence time in the chamber is expected to increase for gases close to the wall. The pressure drop at the inlet and outlet of the deoxo chamber was 1420 pa under the experimental conditions (6.5 bar, 60 °C, 1.25 kg/h and porosity 0.476), and the change in the pressure drop and distribution of the streamwise velocity according to the operating pressure and temperature change was not large.
Figure 6a,b shows the O2 mole fraction in the longitudinal direction (z-axis) of the chamber and the O2 distribution in the cross section according to the change in porosity. The porosity was calculated by selecting the largest value of 0.476 and the smallest value of 0.397 considering the average diameter of the catalyst of 3 mm. Figure 6a shows that the lower the porosity of the catalyst layer, the higher the O2 removal rate. This is due to the increase in the surface area of the catalyst exposed to O2 and the increase in the utilization efficiency of the catalyst due to the uniform distribution of O2, as shown in Figure 6b. In addition, when the porosity decreased from 0.476 to 0.397, the pressure drops in the chamber increased from 1420 pa to 2483 pa. This indicates that the concentration of O2 was low at low porosity because the residence time of the reaction gas increased. Comparing the O2 concentration test results and analysis results at the rear end of the water electrolysis system, the O2 concentration test results (1.8 ppm) are similar when the porosity of the catalyst layer is 0.476 (2.2 ppm) rather than 0.397 (0.8 ppm). Therefore, calculation was performed by applying porosity 0.476 when performing CFD analysis according to changes in other operating conditions.
Figure 7 shows the result of the O2 mole fraction at the outlet according to the operating temperature of the deoxo chamber under an inlet flow rate of 1.86 m3/h and a pressure of 6.5 bar. The trend of the O2 mole fraction decreased as the temperature of the deoxo chamber increased. This indicates that the rate of O2 removal using the Pd catalyst can be changed by increasing the temperature. This is because the increased temperature provides more thermal energy to overcome the activation energy barrier and activate the reaction. In addition, in Figure 7a, the difference in O2 mole fraction according to the temperature gradually decreases as it goes to the rear end of the chamber. This is because the concentration of O2 at the rear end decreases under high temperature conditions. Therefore, even if the temperature of the deoxo chamber increases, the catalyst layer over a certain length has a similar O2 concentration, so the length of the catalyst layer in the deoxo chamber must be designed according to the operating temperature range.
Figure 7b shows the O2 concentration distribution in the chamber section at position 10.9D for each temperature condition. The O2 removal reaction mainly occurs in the center of the chamber under the condition of 50 °C, and the O2 concentration distribution is not uniform. When the chamber temperature increases to 60 °C and 70 °C, the O2 concentration is still low in the center of the chamber, but the O2 concentration distribution becomes more uniform as the temperature increases. As such, the non-uniformity at a low degree of temperature may reduce the performance of the deoxo chamber due to the formation of a water film covering the catalyst surface due to the low catalyst utilization rate and excessive water molecule generation after the O2 removal reaction because the O2 removal reaction is concentrated on some catalysts.
Figure 8 shows the O2 mole fraction analysis results at the outlet according to the operating pressure inside the deoxo chamber at a temperature of 60 °C and an inlet flow rate of 1.86 m3/h. From these results, we confirmed that the higher the pressure, the lower the O2 mole fraction at the outlet. As the pressure increased, the reaction rate increased because of the increased concentration of reactant molecules, which increased the number of collisions between O2 and active sites on the catalyst’s surface. Therefore, the O2 mole fraction decreases with increasing chamber pressure. The average O2 concentration at the outlet of the deoxo chamber was 4.2 ppm at 6.0 bar, 2.4 ppm at 6.5 bar, and 0.8 ppm at 7.0 bar. Since the mole fraction of O2 in H2 exceeds 4 ppm at a pressure of 6.0 bar, it is necessary to operate at a pressure of 6.0 bar or higher for system stability, or to increase the temperature of the chamber or change the shape of the deoxo chamber to operate at a pressure of 6.0 bar or lower.
The O2 mole fraction analysis results at the outlet, according to the mass flow rate at the inlet of the deoxo chamber at a temperature of 60 °C and a pressure of 6.5 bar, are shown in Figure 9a. The results revealed that there was no significant change in the O2 mole fraction along the chamber length, even if the inlet flow rate increased or decreased under the current configuration conditions. These results suggest that the inlet mass flow rate between 1.00 kg/h and 1.25 kg/h has a minor effect on the O2 mole fraction when using the current deoxo chamber geometry. Contrary to the outlet O2 mole fraction result, the distribution of O2 mole fraction in the cross section of the chamber in Figure 9b is different depending on the mass flow rate. In the conditions of 1.00 kg/h and 1.25 kg/h, high O2 removal reaction occurs in the center of the chamber, but in the condition of 1.50 kg/h, the O2 concentration in the center of the chamber is higher than the surroundings. This is because as the mass flow rate increases, the flow rate in the center portion relatively increases, and thus the time for O2 to react on the catalyst surface decreases.

4. Conclusions

This was a basic study conducted to optimize the deoxo chamber according to the capacity of the water electrolysis system. In this study, the effects of various conditions, such as pressure, temperature, mass flow rate, and porosity, on the change in oxygen concentration were investigated through process and computational analyses. As the operating pressure of the chamber for O2 removal increased, the O2 mole fraction decreased because the amount of O2 in contact per unit specific surface area of the catalyst’s particle surface increased. When the inlet flow rate was 1–1.5 kg/h, the effect of the inlet flow rate on the O2 mole fraction was insignificant for the chamber shape with an L/D ratio of 38.4. As the operating temperature of the chamber increased, the O2 mole fraction decreased because the reaction rate of the O2 to H2O conversion reaction increased. The change in O2 concentration according to these operating conditions can be used as a basis for the optimization of the deoxo chamber according to the capacity of the water electrolysis system.

Author Contributions

Conceptualization, S.K., S.E. and G.C.; methodology, S.E.; software, S.E.; validation, S.K. and S.E.; formal analysis, S.E. and G.C.; investigation, S.K., S.E. and G.C.; resources, S.K., S.E. and G.C.; data curation, S.K., S.E. and G.C.; writing—original draft preparation, S.K. and S.E.; visualization, S.E.; supervision, G.C.; project administration, S.K. and G.C.; funding acquisition, S.K. and G.C. All authors have read and agreed to the published version of the manuscript.

Funding

This research received no external funding.

Data Availability Statement

The data presented in this study are available in insert article.

Acknowledgments

This research was supported by 2023 Regional Industry-linked University Open-Lab Development Support Program through the Commercializations Promotion Agency for R&D Outcomes (COMPA) funded by Ministry of Science and ICT (2023openlab(RnD)_02).

Conflicts of Interest

The authors declare no conflict of interest.

References

  1. Leung, D.Y.; Caramanna, G.; Maroto-Valer, M.M. An overview of current status of carbon dioxide capture and storage technologies. Renew. Sustain. Energy Rev. 2014, 39, 426–443. [Google Scholar] [CrossRef]
  2. Chen, H.; Wang, Z.; Chen, X.; Wang, L. Increasing permeability of coal seams using the phase energy of liquid carbon dioxide. J. CO2 Util. 2017, 19, 112–119. [Google Scholar] [CrossRef]
  3. Zhang, X.P.; Cheng, X.M. Energy consumption, carbon emissions, and economic growth in China. Ecol. Econ. 2009, 68, 2706–2712. [Google Scholar] [CrossRef]
  4. Schlenker, W.; Roberts, M.J. Nonlinear temperature effects indicate severe damages to U.S. crop yields under climate change. Proc. Natl. Acad. Sci. USA 2009, 106, 15594–15598. [Google Scholar] [CrossRef] [PubMed]
  5. Lee, H.S.; Trihamdani, A.R.; Kubota, T.; Iizuka, S.; Phuong, T.T.T. Impacts of land use changes from the Hanoi Master Plan 2030 on urban heat islands: Part 2. Influence of global warming. Sustain. Cities Soc. 2017, 31, 95–108. [Google Scholar] [CrossRef]
  6. Bale, J.S.; Masters, G.J.; Hodkinson, I.D.; Awmack, C.; Bezemer, T.M.; Brown, V.K. Herbivory in global climate change research: Direct effects of rising temperature on insect herbivores. Glob. Change Biol. 2002, 8, 1–16. [Google Scholar] [CrossRef]
  7. McCarthy, M.P.; Best, M.J.; Betts, R.A. Climate change in cities due to global warming and urban effects. Geophys. Res. Lett. 2010, 37, 1–5. [Google Scholar] [CrossRef]
  8. Chiu, Y.B. Carbon dioxide, income and energy: Evidence from a non-linear model. Energy Econ. 2017, 61, 279–288. [Google Scholar] [CrossRef]
  9. Edelenbosch, O.Y.; Kermeli, K.; Crijns-Graus, W.; Worrell, E.; Bibas, R.; Fais, B. Comparing projections of industrial energy demand and greenhouse gas emissions in long-term energy models. Energy 2017, 122, 701–710. [Google Scholar] [CrossRef]
  10. Ogunbode, C.A.; Doran, R.; Böhm, G. Exposure to the IPCC special report on 1.5 °C global warming is linked to perceived threat and increased concern about climate change. Clim. Change 2020, 158, 361–375. [Google Scholar] [CrossRef]
  11. Schröder, V.; Emonts, B.; Janßen, H.; Schulze, H.P. Explosion Limits of Hydrogen/Oxygen Mixtures at Initial Pressures up to 200 bar. Chem. Eng. Technol. 2004, 27, 847–851. [Google Scholar] [CrossRef]
  12. Schug, C.A. Operational characteristics of high-pressure, high-efficiency water-hydrogen-electrolysis. Int. J. Hydrogen Energy 1998, 23, 1113–1120. [Google Scholar] [CrossRef]
  13. Ligen, Y.; Vrubel, H.; Girault, H. Energy efficient hydrogen drying and purification for fuel cell vehicles. Int. J. Hydrogen Energy 2020, 45, 10639–10647. [Google Scholar] [CrossRef]
  14. Pyle, W. Hydrogen Purification; Home Power: Ashland, OR, USA, 1998. [Google Scholar]
  15. Kim, G.J.; Shin, J.H.; Chang, H.S. Study on the role of Pt and Pd in Pt-Pd/TiO2 bimetallic catalyst for H2 oxidation at room temperature. Int. J. Hydrogen Energy 2020, 45, 17276–17286. [Google Scholar] [CrossRef]
  16. Lalik, E.; Kosydar, R.; Tokarz-Sobieraj, R.; Witko, M.; Szumełda, T.; Kołodziej, M. Humidity induced deactivation of Al2O3 and SiO2 supported Pd, Pt, Pd-Pt catalysts in H2+O2 recombination reaction: The catalytic, microcalorimetric and DFT studies. Appl. Catal. A-Gen. 2015, 501, 27–40. [Google Scholar] [CrossRef]
  17. Haug, P.; Koj, M.; Turek, T. Influence of process conditions on gas purity in alkaline water electrolysis. Int. J. Hydrogen Energy 2017, 42, 9406–9418. [Google Scholar] [CrossRef]
  18. Yasnev, I.M.; Mel’nichenko, A.N.; Gurskii, V.S. A cellular ceramic as a catalyst support for radiolytic gas recombination devices. Russ. J. Appl. Chem. 2020, 93, 927–932. [Google Scholar] [CrossRef]
  19. Sung, Y.; Choi, M.; Park, T.; Choi, C.; Park, Y.; Choi, G. Synergistic effect of mixer and mixing chamber on flow mixing and NOx reduction in a marine urea-SCR system. Chem. Eng. Process. Process Intensif. 2020, 150, 107888. [Google Scholar] [CrossRef]
  20. Chapman, D.L.; Gregory, G. The catalysis by palladium of the union of hydrogen and oxygen. Proc. R Soc. Lond A. 1934, 147, 68–75. [Google Scholar]
  21. Adams, B.D.; Chen, A. The role of palladium in a hydrogen economy. Mater. Today 2011, 14, 282–289. [Google Scholar] [CrossRef]
  22. Völkening, S.; Bedürftig, K.; Jacobi, K.; Wintterlin, J.; Ertl, G. Dual-Path mechanism for catalytic oxidation of hydrogen on platinum surfaces. Phy.s Rev. Lett. 1999, 83, 2672–2675. [Google Scholar] [CrossRef]
  23. Kramer, J.F.; Reihani, S.S.; Jackson, G.S. Low-temperature combustion of hydrogen on supported Pd catalysts. Proc. Combust. Inst. 2002, 29, 989–996. [Google Scholar] [CrossRef]
  24. Kwon, S.; Eom, S.; Yang, J.S.; Choi, G. Development of an In-House Code for Dry Tower of Heat Transfer Analysis in Hydrogen Purification System. Energies 2023, 16, 5090. [Google Scholar] [CrossRef]
Figure 1. Process flow diagram of the PEM water electrolysis system (Aspen Plus).
Energies 16 06685 g001
Figure 2. (a) Numerical domain of the deoxo chamber for y-z plane and (b) 3D geometry with grid system.
Energies 16 06685 g002
Figure 3. Schematic diagram of water electrolysis system adapted with permission from Ref. [24]. published by Kwon et al., 2023.
Energies 16 06685 g003
Figure 4. Comparison of the O2 mole fraction between the process analysis results and test results in terms of (a) temperature and (b) pressure.
Energies 16 06685 g004
Figure 5. Contour of the stream velocity at experimental conditions during the O2 removal reaction.
Energies 16 06685 g005
Figure 6. (a) O2 mole fraction along the chamber length and (b) contour of the cross-sectional area of the deoxo chamber at 19.2D with porosity.
Energies 16 06685 g006
Figure 7. (a) O2 mole fraction along the chamber length and (b) contour of the cross-sectional area of the deoxo chamber at 10.9D with different temperature of the deoxo chamber.
Energies 16 06685 g007
Figure 8. O2 mole fraction along the chamber length with different pressure of the deoxo chamber.
Energies 16 06685 g008
Figure 9. (a) O2 mole fraction along the chamber length and (b) contour of the cross-sectional area of the deoxo chamber at 19.2D with inlet mass flow rate.
Energies 16 06685 g009
Table 1. CFD conditions for analyzing the O2 removal performance according to the operating conditions of the deoxo chamber.
Deoxo Chamber
Diameter of inlet and outlet 0.5D
Chamber inner diameter D
Length38.4D
CatalystMean diameter [mm]3
Porosity0.397–0.476
Length33.2D
Inlet flow [kg/h]1.00, 1.25, 1.50
Inlet temperature [°C]50, 60, 70
Pressure [bar]6.0, 6.5, 7.0
Mole FractionsH20.97250
O20.00096
H2O0.02654
Table 2. Process analysis results of the water electrolysis system (8 bar; 60 °C).
Stack InletStack OutletDeoxo InletDeoxo OutletDyer InletDyer Outlet
Temperature°C50.060.060.071.024.020.0
Pressurebar2.06.56.56.46.46.4
Mass Flowskg/h2337.13535.0901.2471.2471.2470.988
Volume Flowm3/h2.4111.8961.8611.7451.7451.611
Mole Flowskmol/h129.7292.3840.5050.5040.5040.490
H2Okmol/h129.7281.8920.0130.0140.0140.000
H2kmol/h0.0000.4910.4910.4900.4900.490
O2kmol/h0.0020.0000.0000.0000.0000.000
Mole Fractions
H2O0.999990.793760.026540.0284840.0284840.00000
H20.000000.206040.972500.9715140.9715140.999998
O20.000010.000200.000960.0000020.0000020.000002
Disclaimer/Publisher’s Note: The statements, opinions and data contained in all publications are solely those of the individual author(s) and contributor(s) and not of MDPI and/or the editor(s). MDPI and/or the editor(s) disclaim responsibility for any injury to people or property resulting from any ideas, methods, instructions or products referred to in the content.

