Article

Transient Simulation and Parameter Sensitivity Analysis of Godiva Experiment Based on MOOSE Platform

Northwest Institute of Nuclear Technology, Xi’an 710024, China
*
Author to whom correspondence should be addressed.
Energies 2023, 16(18), 6575; https://doi.org/10.3390/en16186575
Submission received: 20 June 2023 / Revised: 20 August 2023 / Accepted: 22 August 2023 / Published: 12 September 2023
(This article belongs to the Special Issue Mathematics and Computational Methods in Nuclear Energy Technology)

Abstract

:
The fast-neutron burst reactor is a chain reactor that can operate in a prompt critical state. In order to ensure the operational safety of the fast-neutron-pulse reactor and prevent the supercritical pulse from causing physical damage to the material, it is necessary to simulate and analyze the pulse operating conditions of the fast-neutron-pulse reactor. Godiva-I is a spherical assembly of highly enriched uranium metal made during the 1950s. A prompt-critical transient in such a nuclear system impels a quick power excursion, which will cause a temperature rise and a subsequent reactivity reduction because of the metal sphere’s expansion. The overall transient lasts for a few fractions of a millisecond. Based on the point kinetics and Monte Carlo method, the temporal and spatial characteristics of transient input power were calculated, the difference of the average reactivity temperature coefficient between uniform density and non-uniform density was compared, and the transient power distribution condition was loaded into the thermal–mechanics calculation of the MOOSE platform; thus, the pulse process of Godiva-I with different initial reactivity periods was simulated. The JFNK (Jacobian–Free–Newton–Krylov) direct method and multi-app indirect method were used to analyze the transient response of the pulse dynamic process using the heat conduction module and tenor mechanics module, respectively. After considering the influence of the inertia effect and wall-reflected neutrons, the simulation results were much closer to the experimental values. Based on the stochastic tools module, the uncertainty propagation and sensitivity analysis of the Godiva-I model were carried out, the uncertainty of external surface displacement of Godiva under input disturbance of material properties and heat source amplitude factor was obtained, and the sensitivity of different input parameters to output parameters was quantified. The research results can lay a technical foundation for the thermal–mechanics coupling analysis and uncertainty quantification of the metal fast reactor.

1. Introduction

Godiva-I is a metal sphere of highly enriched uranium built in the 1950s at the Los Alamos National Laboratory in the U.S. [1,2]. In this system, transient criticality causes a rapid power excursion (up to 10 GW), which leads to a temperature rise and subsequent reduction in reactivity by expansion of the metal sphere, with an entire transient time of only a few milliseconds [3,4]. It is capable of operating at a super transient criticality state and generates controlled neutron and γ pulses that can be applied to research in nuclear radiation dosimetry, radiation biology, weapon physics, etc. It is an important device for nuclear testing and neutron physics research in nuclear science and technology [5].
When Godiva-I bursts into pulse, supercritical reactivity is induced, and the core reaches a supercritical state with a pulse process lasting tens to hundreds of microseconds [6,7]. In such a short period of time, conventional reactor control rods do not have time to control reactivity [8]. When the fast-pulsed reactor with metallic nuclear fuel bursts into pulse due to an exponential increase in the fission rate, the heat released from the fission causes the core to expand rapidly. This rapid expansion, in turn, leads to a decrease in core density and an increase in neutron leakage rate. Consequently, the fast-neutron-pulse reactor exhibits a negative reactivity temperature coefficient. At the beginning of the reactivity’s decrease, the fission rate increases exponentially, and the neutrons’ growth rate gradually slows down to the maximum fission rate; as reactivity continues to decrease, the fission rate starts to decrease, and finally, as the safety block exits the core at the pulse ends, it causes the negative feedback effect in the fast-pulsed reactor with metallic nuclear fuel. The study of the Godiva-I neutron dynamic calculation and the thermal–mechanical process is helpful for predicting the transient pulse condition of the pulsed reactor and the safe operation of the pulsed reactor [9,10].
The rapid increase in the core material temperature occurs when the Godiva-I fast-pulsed reactor experiences a burst into a pulse with a large initial reactivity. As a result, the core fission releases heat. However, due to the mechanical inertia of the core material, the core thermal expansion rate is lower than the temperature rise rate. Consequently, the core thermal expansion leads to negative feedback in the fast-pulsed reactor. It is important to note that the negative feedback lags behind the temperature rise as the thermal expansion lags behind. This phenomenon is known as the inertia effect of the pulsed reactor [11]. The inertia effect significantly increases the fission yield of the Godiva-I fast-pulsed reactor and increases the displacement, stress, and other parameters of fast-pulsed reactor properties, which need to be studied specifically to explain the deviation of simulation results and experimental data [12,13].
The Godiva-I fast-pulsed reactor is a spherical bare reactor without a reflector [2], which is arranged in the reactor hall and uses highly enriched uranium as nuclear fuel. Due to the absence of a reflector, the reactor is very sensitive to reflected neutrons from walls and floors. There is a high probability that reflected neutrons will be reflected back to the core, even in a large reactor hall [14]. Experiments have demonstrated the wall-reflected neutron effect, showing that it significantly affects the pulse trailing edge, pulse waveform, and parameters such as maximum temperature rise, displacement, and stress in the core [5]. The impact of a higher number of reflected neutrons returning to the core can potentially jeopardize core safety. Hence, understanding the effect of wall-reflected neutrons on the fission rate, temperature rise, displacement, and stress of the Godiva-I fast-pulsed reactor is crucial.
In addition, since the transient characteristics of the Godiva-I fast-pulsed reactor are closely related to the properties of fuel material, sensitivity analysis is needed for different fuel properties in order to analyze the detailed effects of different material properties on the transient characteristics of the Godiva-I fast-neutron-pulsed reactor. The purpose of the sensitivity analysis is to obtain the sensitivity coefficients of each parameter to the transient characteristics of Godiva-I. This analysis involves analyzing the input parameters with different material properties and ranking the coefficients. The focus is on the parameters with larger first-order sensitivity coefficients. The aim is to improve the in-depth understanding of the transient physical processes and provide technical reference for the design of a new generation of fast-pulsed reactors with enhanced performance.
In recent years, increasing efforts have been made to study Godiva-I’s negative feedback effect and thermal–mechanical process, such as the Serpent-OpenFOAM model [15] and MAMMOTH [16]. Fewer studies have involved the inertia effect, reflected neutrons effect, and sensitivity analysis. The main purpose of this work was to comprehensively and systematically analyze Godiva’s performance. The structure of this paper is as follows: the first part presents the computational models and methods used for the fast-pulsed reactor, with a focus on transient calculations incorporating the Godiva-I reactivity feedback effect, inertial effect, wall-reflection neutron effect, as well as sensitivity and uncertainty analysis. The second part presents the computational results and discusses the effects of the Godiva-I reactivity feedback, inertial effect, wall reflection neutron effect, as well as the outcomes of the sensitivity and uncertainty analysis. Finally, the third part concludes the paper and provides an outlook for future research.

2. Simulation Model and Methods

Godiva-I is a fast pulsed reactor with spherical high-enriched uranium; in this paper, the external supporting structure is neglected, and the three parts of the Godiva-I reactor, namely the upper, middle, and lower parts, are considered as a complete sphere. It is designed with two independent emergency shutdown mechanisms, with the upper and lower parts being tele-scoped through the cylinder and the middle part fixed on the steel pipe support. The fuel used in the reactor is highly enriched cast uranium metal, with a density of 18.7398 g/cm3 and 235U enrichment of 93.8%. The core has a radius of 8.7407 cm and a mass of 52.42 kg [17,18]. The specific physical properties of the fuel and its units are provided in Table 1, while the laboratory schematic and the meshing model are illustrated in Figure 1.

2.1. Reactivity Feedback Effect

2.1.1. Point Reactor Kinetic Method

Godiva-I fast pulsed reactor can be described using the point reactor kinetic method for the fission rate as the spatial distribution of the neutron flux remains essentially constant during the burst pulse.
The relationship between fission rate and neutron density in the reactor is:
F ˙ ( t ) = n ( t ) Λ υ ¯ f
The point reactor kinetic method based on the fission rate is as follows:
d F ˙ ( t ) d t = ρ t β Λ F ˙ ( t ) + i = 1 6 λ i C i t Λ υ - f + q Λ υ ¯ f
d C i t d t = β i υ ¯ f F ˙ ( t ) λ i C i t
where:
F ˙ t is the fission rate, n(t) is the neutron density,
Λ is the neutron generation time,
ν f ¯ is the average number of neutrons generated per fission,
ρ(t) is the reactivity,
β is the effective delayed neutron fraction,
t is the time,
λ is the decay constant,
C is the precursor density,
q is the reactivity,
The subscript i is the group number of the precursors.
The reactivity feedback mainly includes the Doppler effect and thermal expansion effect. Since the neutron energy of Godiva-I is generally above 1 MeV and the neutron energy spectrum is very hard, it is reasonable not to consider the effect of the Doppler effect on reactivity. In this paper, only the change in reactivity due to thermal expansion of temperature is considered. The reactivity at the tn+1 moment during the burst pulse of the pulsed reactor can be expressed as:
ρ ( t n + 1 ) = ρ ( t n ) + α t Δ T
where:
α is the reactivity temperature coefficient,
Δ T is the system temperature rise variation.

2.1.2. Neutron Flux Calculation

The energy released from total nuclear fission determines the temperature rise of the fast pulsed reactor. However, the point reactor kinetic can only calculate the temporal distribution of the fission rate. Therefore, this paper utilizes the Monte Carlo method to calculate the spatial distribution of the fission rate. To achieve this, the FMESH card is used to tally the neutron flux density and fit it with a suitable distribution curve. After fitting, the normalized radial neutron flux density function is combined with the fission rate results to obtain the spatial and temporal distribution functions of the fission rate.

2.1.3. Heat Source Loading

Discrete the temperature rise function into a spatial component(T(r)), and a temporal component(T(t)):
T ( r , t ) = T ( r ) T ( t )
The relationship between the fission rate of the pulsed reactor and the average temperature rise of the core is:
T t = 0 t F ˙ ( t ) E f C p m
where:
F ˙ t is the fission rate,
Ef is the average fission release energy,
Cp is the specific heat capacity,
and
m is the core quality.
Because the spatial distribution of core temperature rise is proportional to the core neutron flux density distribution. Therefore, a 1 °C increase in core temperature results in an average stack-wide temperature rise of:
T = v ϕ ( r ) d v V
where:
V is the system volume,
ϕ r is the normalized radial neutron flux density,
Thus, the power density function is:
q ( r , t ) = C p ρ d ( T ( r , t ) ) d t

2.1.4. Quench Coefficient and Reactivity Temperature Coefficient

The quench coefficient is defined as the absolute value of the reactivity change per fission. It is important for the theoretical evaluation of pulse characteristics of fast pulsed reactors and for ensuring the safe operation of pulsed reactors. Its formula is
b f = d ρ d F
where:
ρ is the reactivity,
F is the fission neutron number.
The reactivity temperature coefficient is defined as the absolute value of the reactivity with temperature changing 1 °C; it can be expressed as:
α T = d ρ d T
The quench coefficient is a function of the reactivity temperature coefficient:
b f = ε f C m α T
where:
ε f is the average fission release energy,
α T is the reactivity temperature coefficient,
C is the specific heat capacity,
m is the mass.
Then, Equation (4) will become:
ρ t = ρ 0 + b f 0 t F ˙ t d t
ρ 0 = Λ T 0
where:
ρ 0 is the initial reactivity induced in the pulse,
T 0 is the initial reactivity period,
Λ is neutron generation time.
To determine the quench coefficient and reactivity temperature coefficient, the displacement and density distribution along the radius at different initial temperatures are first obtained; for the detailed density distribution, the 100-layer sphere model is created, and each grid element is set to the corresponding density so that the density achieves a non-uniform distribution, the reactivity at different temperature is calculated using MCNP. Using the linear fitting method, the αT0 at the center can be calculated, and the average reactivity temperature coefficient αT is achieved according to Equation (7), then the quench coefficient is obtained using Equation (11).

2.1.5. Thermal-Mechanical Calculation

The burst pulse process simulation of the Godiva-I at different initial reactivity periods is performed using the transient power density distributions as a known time-dependent heat source, which are loaded into the thermal-mechanical calculations of the MOOSE platform (Gaston D, Newman C, Hansen G, et al., 2009) [19]. The core’s heat transfer calculation is based on the Heat Conduction module in MOOSE, while the mechanical calculation is based on the Tensor Mechanics module. The coupling of different physical processes is realized using the JFNK or MultiApp method in MOOSE, and each process is shown in Figure 2. JFNK, which is a direct method, uses the unified matrix to solve thermal-mechanical coupling formulas. On the other hand, MultiApp is an indirect method that only executes one thermal calculation and one mechanical calculation without any coupling between these two fields. In the JFNK approach, the temperature field and stress field are obtained directly, whereas, in the MultiApp approach, the heat transfer calculation is used as a MasterApp, and the mechanic calculation is used as a subApp. The temperature transfer from Heat Conduction to Tensor Mechanics is achieved via Transfer. Consequently, the temperature field is obtained first, followed by the stress field. The calculations are performed with an initial time of 0.00 s, a step size of 5.0 × 10⁻⁶ s, and an end time of 1.0 × 10⁻³ s, which is divided into 200-time steps.

2.2. Inertia Effect

There have been many experiments demonstrating the fact that the inertial effect increases the pulse yield. Shabalin (1979) estimated the increment of Godiva II, Godiva IV, and SPR-II fast pulsed reactor inertia effects on the pulse yield [20]. Stratton (1958) simplified the model and analyzed the results of pulse waveform and yield calculations when inertial effects are taken into account [21]; the inertial effects increase the fission rate of the pulse by a factor of (1+ α 0 2 τ 2 ), α 0 is the inverse of the initial reactivity period of the fast pulsed reactor, and τ is the inverse of the intrinsic oscillation angle frequency of the core. The effect of inertial effects on the point reactor kinetic must be considered when the transient reactivity is larger, as discussed by Li Bing (2001) and Zhong Lihan (2017) [12,13]. As the inertia effect increases the pulse yield, it can cause the reactor to withstand a temperature greater than the rated value, which may lead to damage and jeopardize the safety of the pulsed reactor. The calculated results of analyzing the inertial effect of the fast pulsed reactor with metallic nuclear fuel agreed well with the experimental values. Inertial effects can make the fission yield larger, resulting in a non-linear relationship between the fission yield and the transient reactivity.
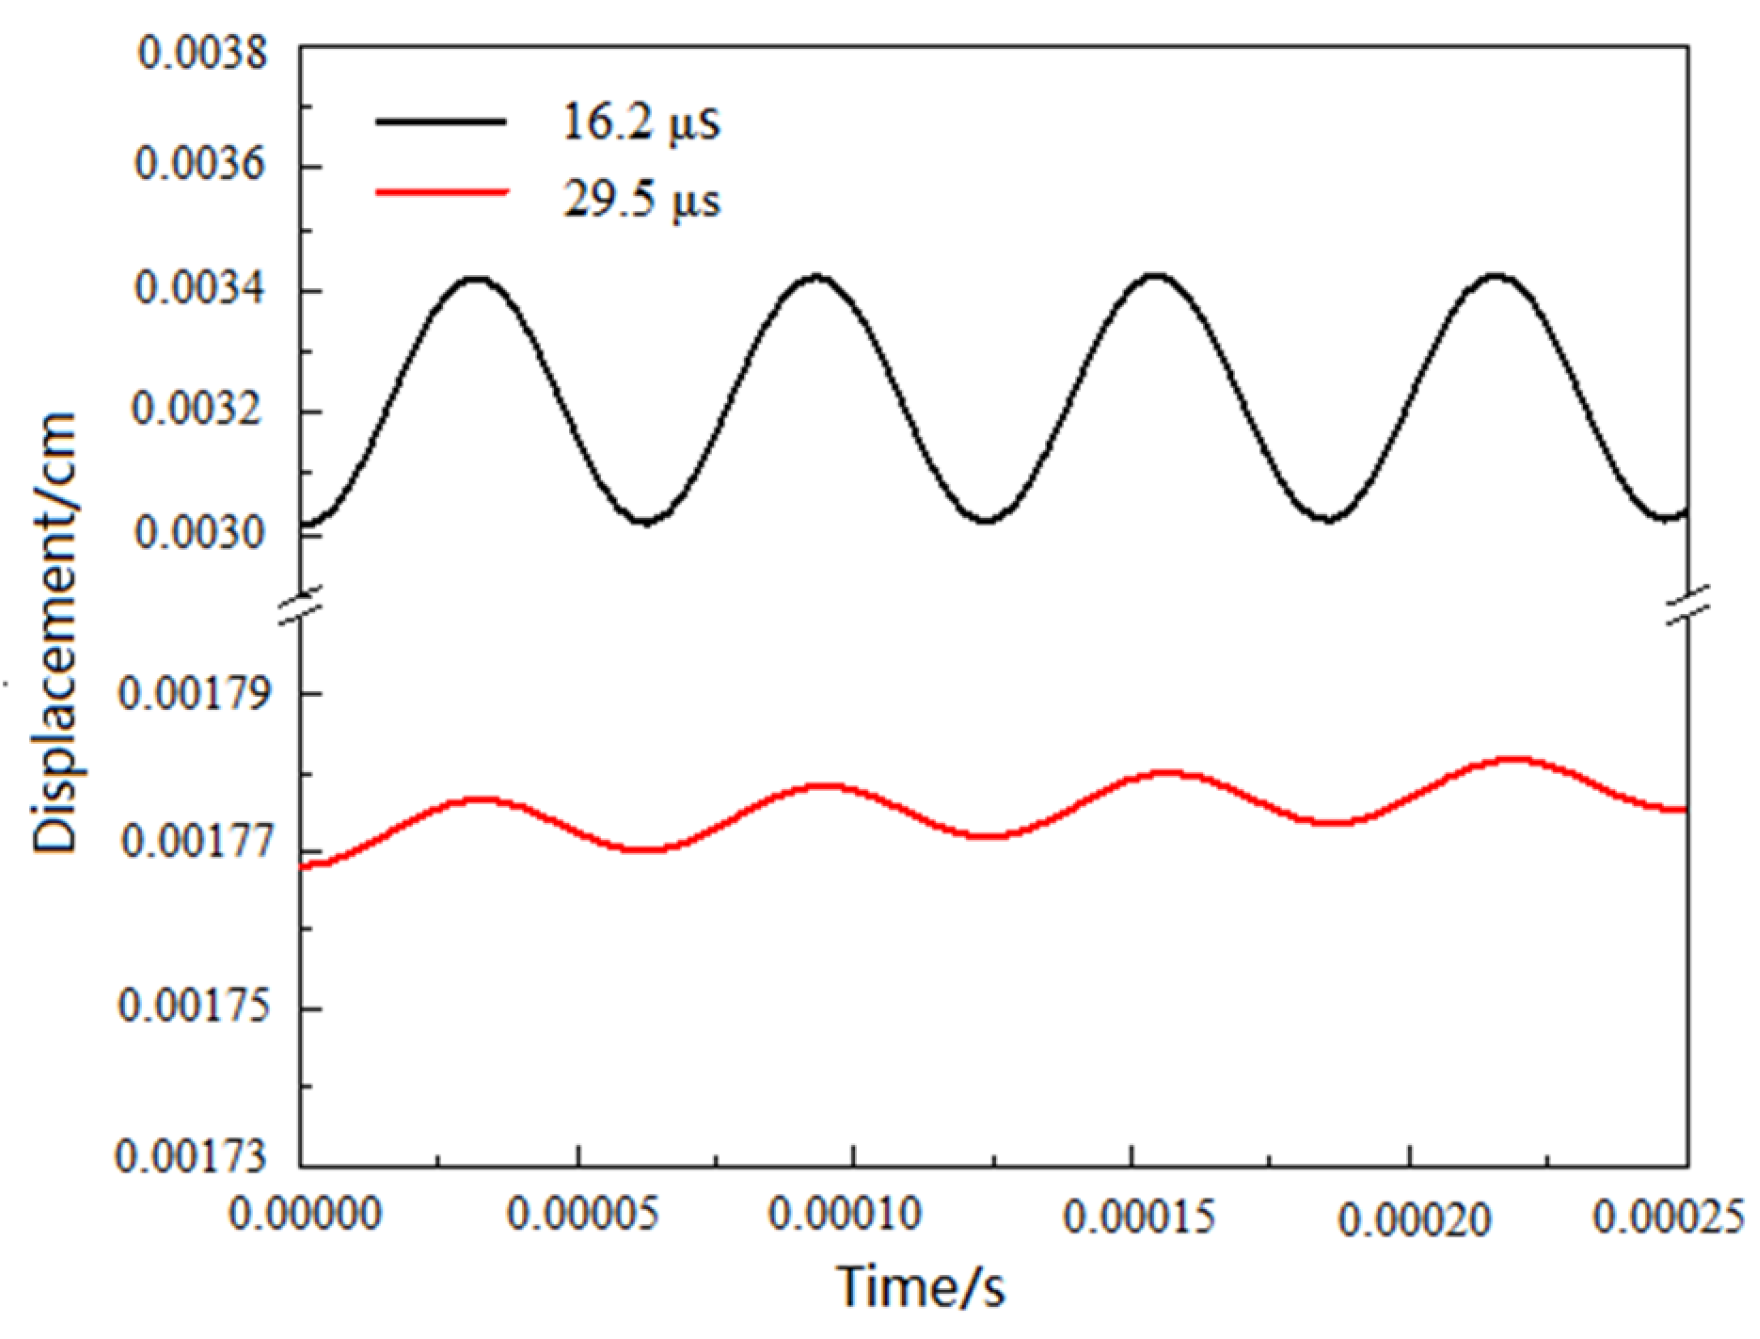
Since the quench coefficient varies with time and is no longer a constant, the point reactor kinetic equations need to be solved again. The reactivity expression of the fast pulsed reactor is given using Equation (12). In consideration of the elastic oscillation of the surface displacement, we also consider the quench coefficient as a function of the oscillation with time. To obtain the thermal expansion characteristics of the fast pulsed reactor, a displacement oscillation curve is used. The curve of the quench coefficient with time is derived by selecting the region where the displacement oscillation is stable.
Figure 3 presents the stabilization regions for the initial reactivity period of 16.2 μs and 29.5 μs displacement oscillation. The findings indicate that despite the variations in both the initial reactivity period of the pulse and the amplitude of the outer surface displacement oscillation, the oscillation period remains constant at approximately 63 μs for both cases. The fitting equation for the normalized displacement oscillation fitting curve is presented in Figure 4.
y t = 0.50137 + 0.50176   sin ( π x 1.64202 10 5 / 3.06364 10 5 )
Since the quench coefficient varies with displacement, the oscillation period of the quench coefficient is the same as the displacement oscillation period, so the function of the quench coefficient is:
b f t = b f × y t
Thus, in the pulse burst process, the reactivity changes as:
ρ ( t ) = ρ 0 + 0 t b f t t F ˙ t d t
Replace Equation (12) with Equation (16) for the reactivity change considering inertial effects to re-solve the point reactor kinetic equation, and then the pulse waveform after taking inertia effects into account can be obtained.

2.3. Wall-Reflected Neutrons Effect

When the fast pulsed reactor with metallic nuclear fuel is placed indoors, the core is very sensitive to neutrons reflected back from the walls. Neutrons reflected from the moderator, walls, ceiling, and floor will most likely return to the core. The effect of reflected neutrons on fast pulsed reactors is relatively large, even if the walls are far from the core. This wall reflection neutron effect has been demonstrated in some experiments. From the experimental data, it is evident that the reflected neutrons from the walls can increase the trailing edge of the pulse waveform and increase the pulse fission yield. Having more reflected neutrons back to the core may have an impact on the operational safety of the pulsed reactor. The magnitude of the time of flight of these reflected neutrons can be compared to the initial reactivity period of the reactor.
In 1956, Wimett [18] introduced the concept of reflected neutrons as two sets of delayed neutrons and incorporated them into the point reactor kinetic equation. By simulating the reflected neutrons from the room walls, the calculated results were found to align with the indoor test results. Similarly, Zhang Xianda [22] employed two sets of delayed neutrons to model the reflected neutrons. By conducting a numerical analysis of the neutron dynamics within the CFBR-II core, satisfactory results were obtained. The behavior of wall-reflected neutrons differs significantly from that of delayed neutrons; therefore, the above method, which relies on delayed neutrons to simulate reflected neutrons, cannot accurately predict the effect of wall-reflected neutrons on the wave-form of the pulsed pile. To address the reflecting layer problem posed by wall-reflected neutrons, the two-point kinetics model has been widely used. Proposed by Cohn (1962) [23], this model divides the pulsed reactor into a core fission region and a non-fission reflector region, treating the core fission region and the reflector layer as a single point to establish the point reactor kinetic equations. While the two-point kinetics model is effective in explaining steady-state situations, it is not suitable for analyzing the transient burst of a pulsed reactor.
Following the definitions of the quench coefficient and reactivity temperature coefficient, the reactivity at each moment during the Godiva fast pulsed reactor pulse burst can be expressed as Equation (12). Therefore, the equation for the point reactor kinetics based on the fission rate and the quench coefficient is:
d F ˙ t d t = ρ 0 + b f 0 t F ( t ) d t β e f f Λ F ˙ t + i = 1 6 λ i C i t Λ υ ¯ f + q Λ υ ¯ f
d C i t d t = β eff , i υ ¯ f F ˙ t λ i C i t
Referring to the method in the literature [14,24], the reflected neutrons from the walls are equated to the external source Q(t). For the calculation method of the external source Q(t), the equivalent source of a leaking neutron is calculated and integrated with time to obtain the overall leaking neutron source.
The MCNP code was employed to calculate the core leakage rate and the neutron leakage spectrum, with the neutron energy divided into 19 groups ranging from 0 MeV to 20 MeV. The statistical error of the calculated results for each energy group was found to be less than 3%. As depicted in Table 2, the leakage neutron spectrum calculation exhibits a dominant concentration in the energy range of 0.2 to 3 MeV, accounting for approximately 77.24% of the total neutron spectrum. Furthermore, the core leakage rate was determined to be 57.28%.
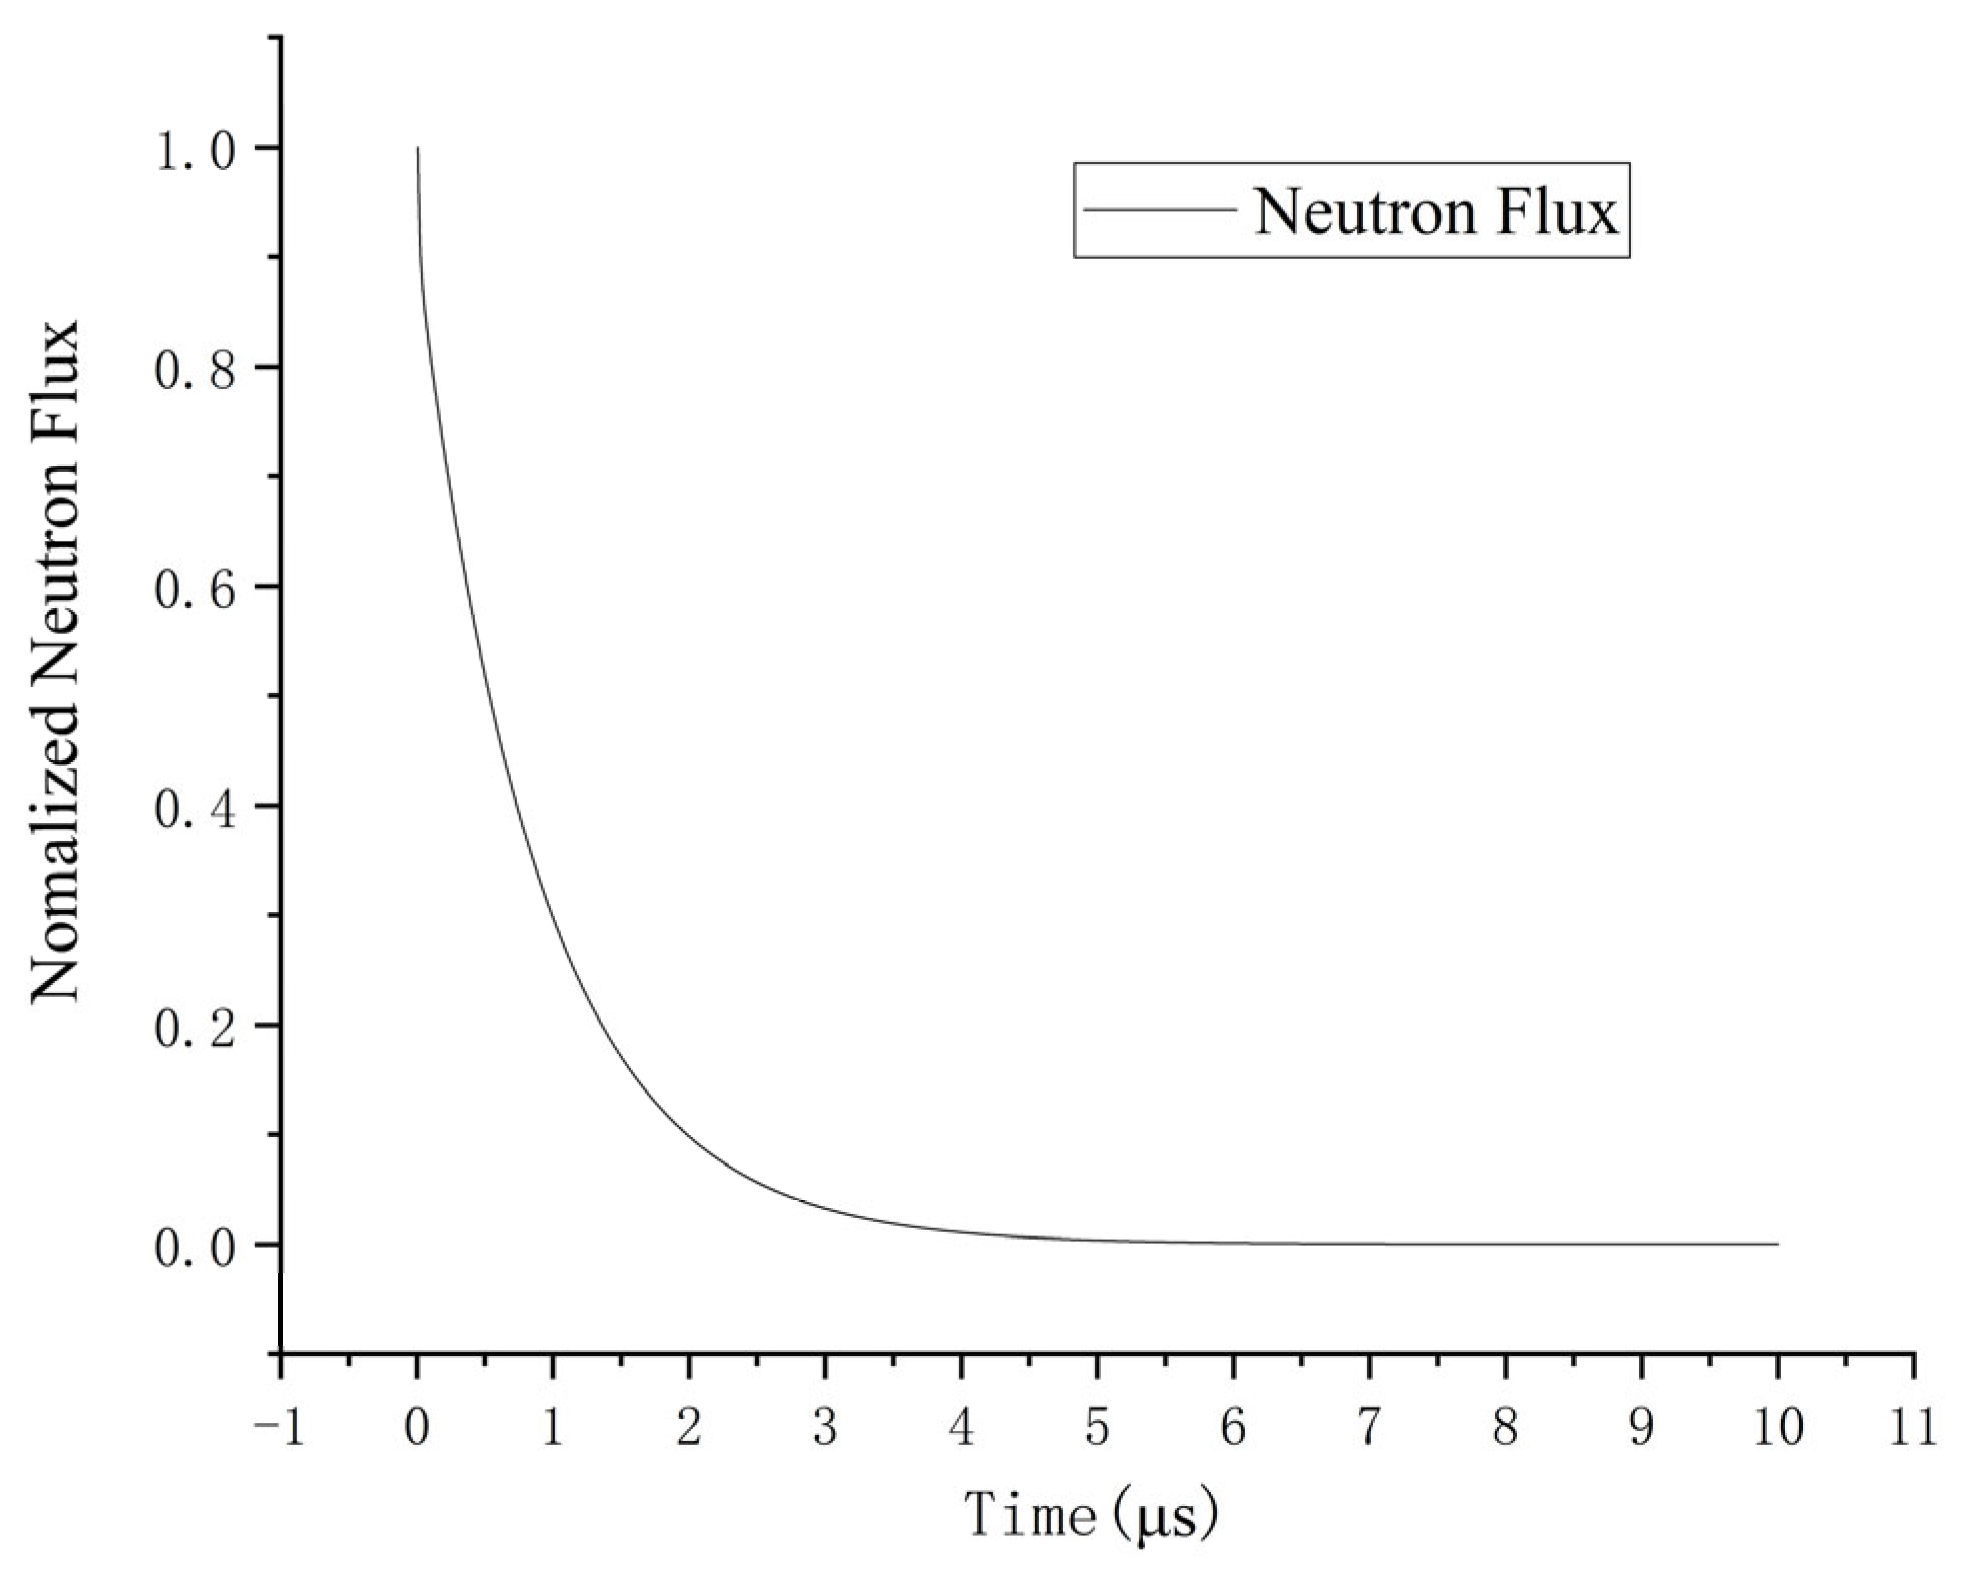
The prompt neutron density decay method [25] was used to calculate the prompt neutron decay constant for the Godiva-I fast pulsed reactor. The neutron flux density decay curve of the core is shown in Figure 5. Fitting the curve in the figure, the instantaneous, prompt neutron decay constant α is −1.112 × 10⁶(/μs); it is in good agreement with the experimental value of −1.11 × 10⁶(/μs).
After obtaining the results related to the leakage rate and leakage neutron spectrum, the change in the neutron number of the core caused by a neutron passing through the reflection was calculated using MCNP. The wall, floor, and ceiling materials are concrete, and the distances of the core from the four walls are 6.1 m, 7.9 m, 6 m, 6 m, 6 m, 6.4 m, and 3.2 m from the ceiling and floor, respectively.
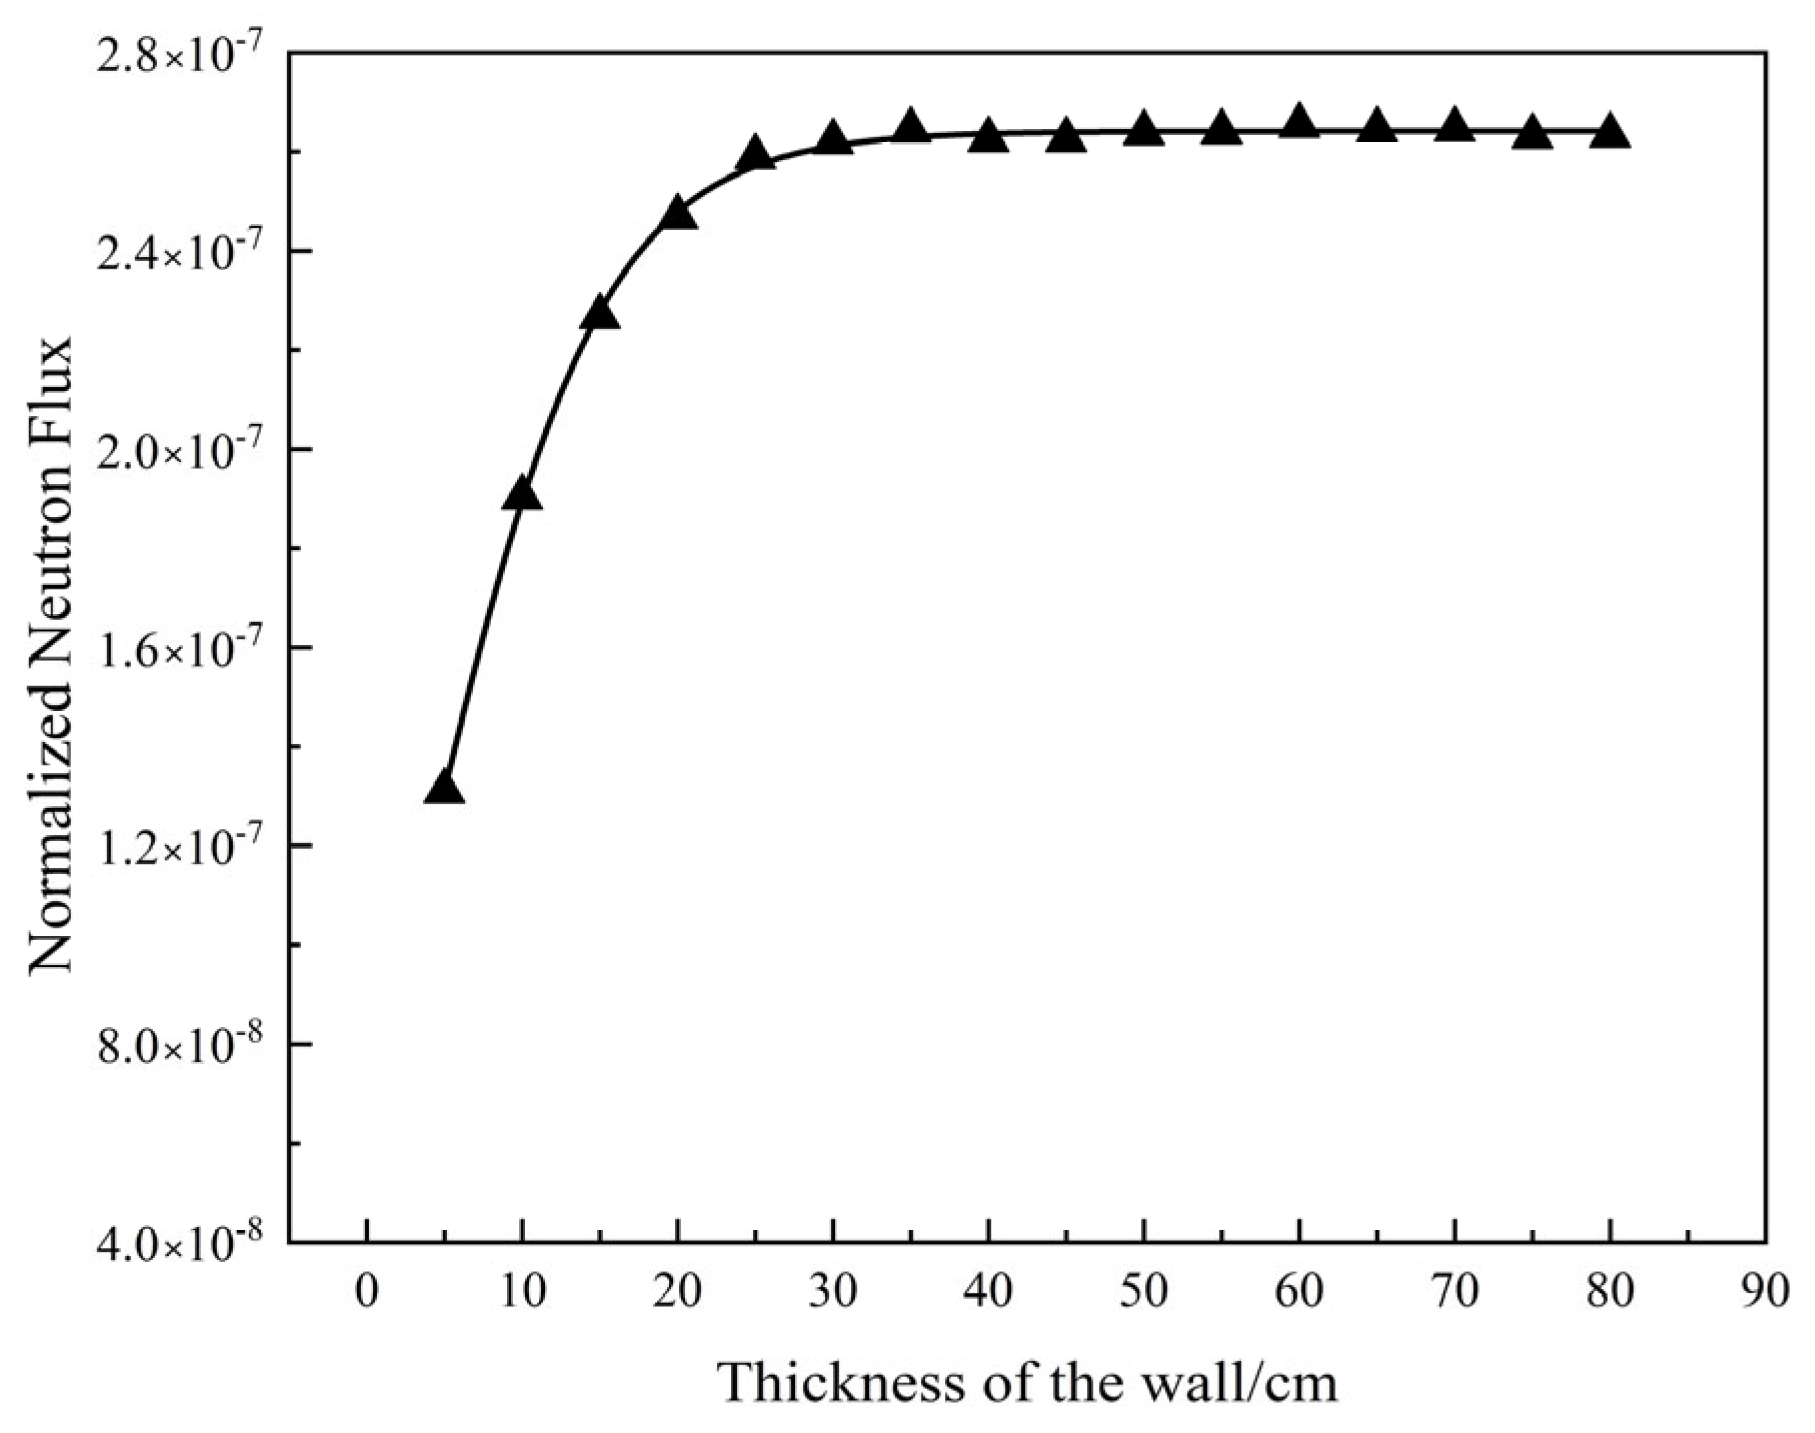
To address the issue of long calculation time associated with the use of actual wall thickness in the Monte Carlo method, an alternative approach utilizing the "saturated wall thickness" is employed. This involves calculating the scattered neutron saturation wall thickness using the F4 card and CF4 card of MCNP, with the wall positioned 6 m from the core. The scattered neutron intensity calculation is then performed at a distance of 10 cm from the wall, with the wall thickness ranging from 5 cm to 75 cm. The neutron flux is tallied every 5 cm, and the results are depicted in Figure 6. It can be observed that the intensity of scattered neutrons initially increases gradually with the wall thickness but eventually stabilizes and remains essentially constant as the thickness continues to increase. In light of these findings, the surrounding walls, ceiling, and floor are all set to a uniform thickness of 70 cm instead of their actual dimensions. This adjustment significantly enhances the calculation speed without compromising accuracy. Consequently, this standardized thickness is referred to as the “saturated scattered neutron wall thickness” of 70 cm.
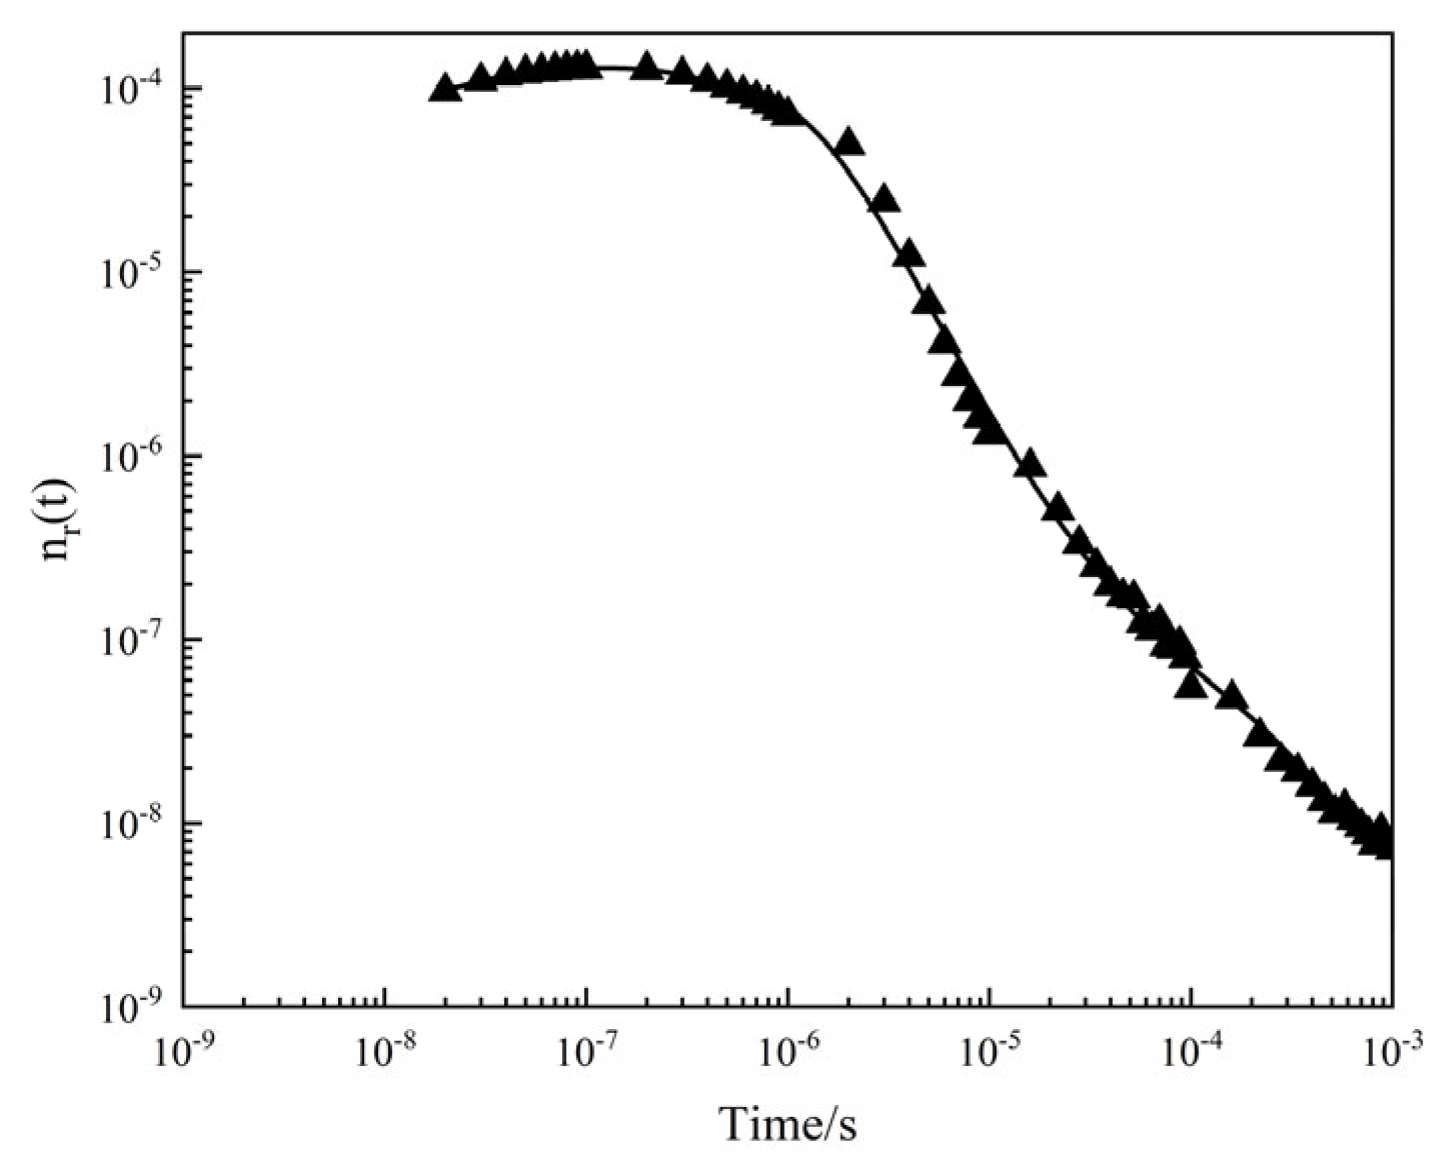
The core and hall were modeled using MCNP after obtaining the core leakage rate, leakage neutron spectrum, and saturated scattered neutron wall thickness, as shown in Figure 7. A surface source is established on the surface of the core using the leakage neutron spectrum, and the variation of the core neutron number with time is recorded using the FT card. The calculation results, shown in Figure 8, demonstrate that the core neutron number increases and then decreases, reaching a peak moment of about 10−7 s. This indicates the average value of the change in core neutron number caused by one or more reflections of a leaking neutrons through the wall, ceiling, and floor.
As we know from the point reactor kinetic method:
d n r ( t ) d t = α n r ( t ) + q e ( t )
Since α and n r ( t ) have already been calculated, a leakage neutron equivalent source can be found using the above equation. The results of the leakage neutron equivalent source calculation are shown in Figure 9. The reflected neutrons peak at about 0.2 μs, and most of the reflected neutrons return to the core within 1 μs; the subsequently reflected neutrons take a longer time to return to the core. In order to calculate the burst transient process containing the reflected neutron pulse from the wall, it is necessary to obtain the equivalent source of all leaking neutrons. Set N ( t ) as the number of neutrons in the core at time t , then the number of leakage neutrons at time t is N ( t ) P Λ . Therefore, the total equivalent source Q ( t ) at time t is:
Q ( t ) = 0 t N t P Λ q e t t d t
where:
P is the leakage rate,
Λ is the neutron generation time.
So, the total equivalent source of leakage neutrons is related not only to the number of neutrons in the core at the current moment but also to the history of neutrons in the entire core.
Bringing the equivalent source Q(t) into Equations (17) and (18), the point reactor kinetic equation containing the reflection neutron effect is as follows:
d F ˙ t d t = ρ 0 + b f 0 t F ( t ) d t β e f f Λ F ˙ t + i = 1 6 λ i C i t Λ υ ¯ f + 0 t N t P Λ q e t t d t Λ υ ¯ f
d C i t d t = β i υ ¯ f F ˙ t λ i C i t
Then, the spatial and temporal distribution of the core fission rate can be obtained using combining the radial neutron flux density distribution calculated using the Monte Carlo method. The core temperature, displacement, stress, and other related results can be calculated using the thermalmechanical module under the MOOSE platform.

2.4. Sensitivity Analysis

In this paper, the Sobol method is utilized to perform sensitivity analysis on material properties based on the transient output parameters of the Godiva fast-pulsed reactor. The analysis is conducted using the Stochastic Tools module [26] under the MOOSE platform. The chosen technique for the analysis is the second-order Sobol sensitivity analysis tool, which employs the Sobol sampling scheme. This method allows for the calculation of first-order, second-order, and full-order sensitivity coefficients. The first-order sensitivity coefficient represents the change in the response quantity caused by variations in the uncertain parameters themselves. On the other hand, the second-order sensitivity coefficient represents the change in the response quantity due to the interaction between two uncertain parameters. Finally, the full-order sensitivity coefficient indicates the change in the total response resulting from alterations in a single uncertain parameter and its interaction with all other parameters. The Sobol method used in this study necessitates the evaluation of N (2K + 2) models, where K denotes the number of uncertain parameters, and N represents the size of the sample matrix. For this particular research, a sample matrix size of 500 and 6 input parameters (K) results in a total of 7000 evaluated models being sampled to calculate the Sobol sensitivity coefficients. The second-order Sobol sensitivity analysis tool automatically computes the values of the first-order, second-order, and total sensitivity coefficients, which are then exported as an EXCEL sheet. Table 3 provides an overview of the range of values and distribution types of the input parameters, all of which are Gaussian.

3. Results and Discussion

3.1. Reactivity Feedback Effect

3.1.1. Steady-State Reactivity Temperature Coefficient

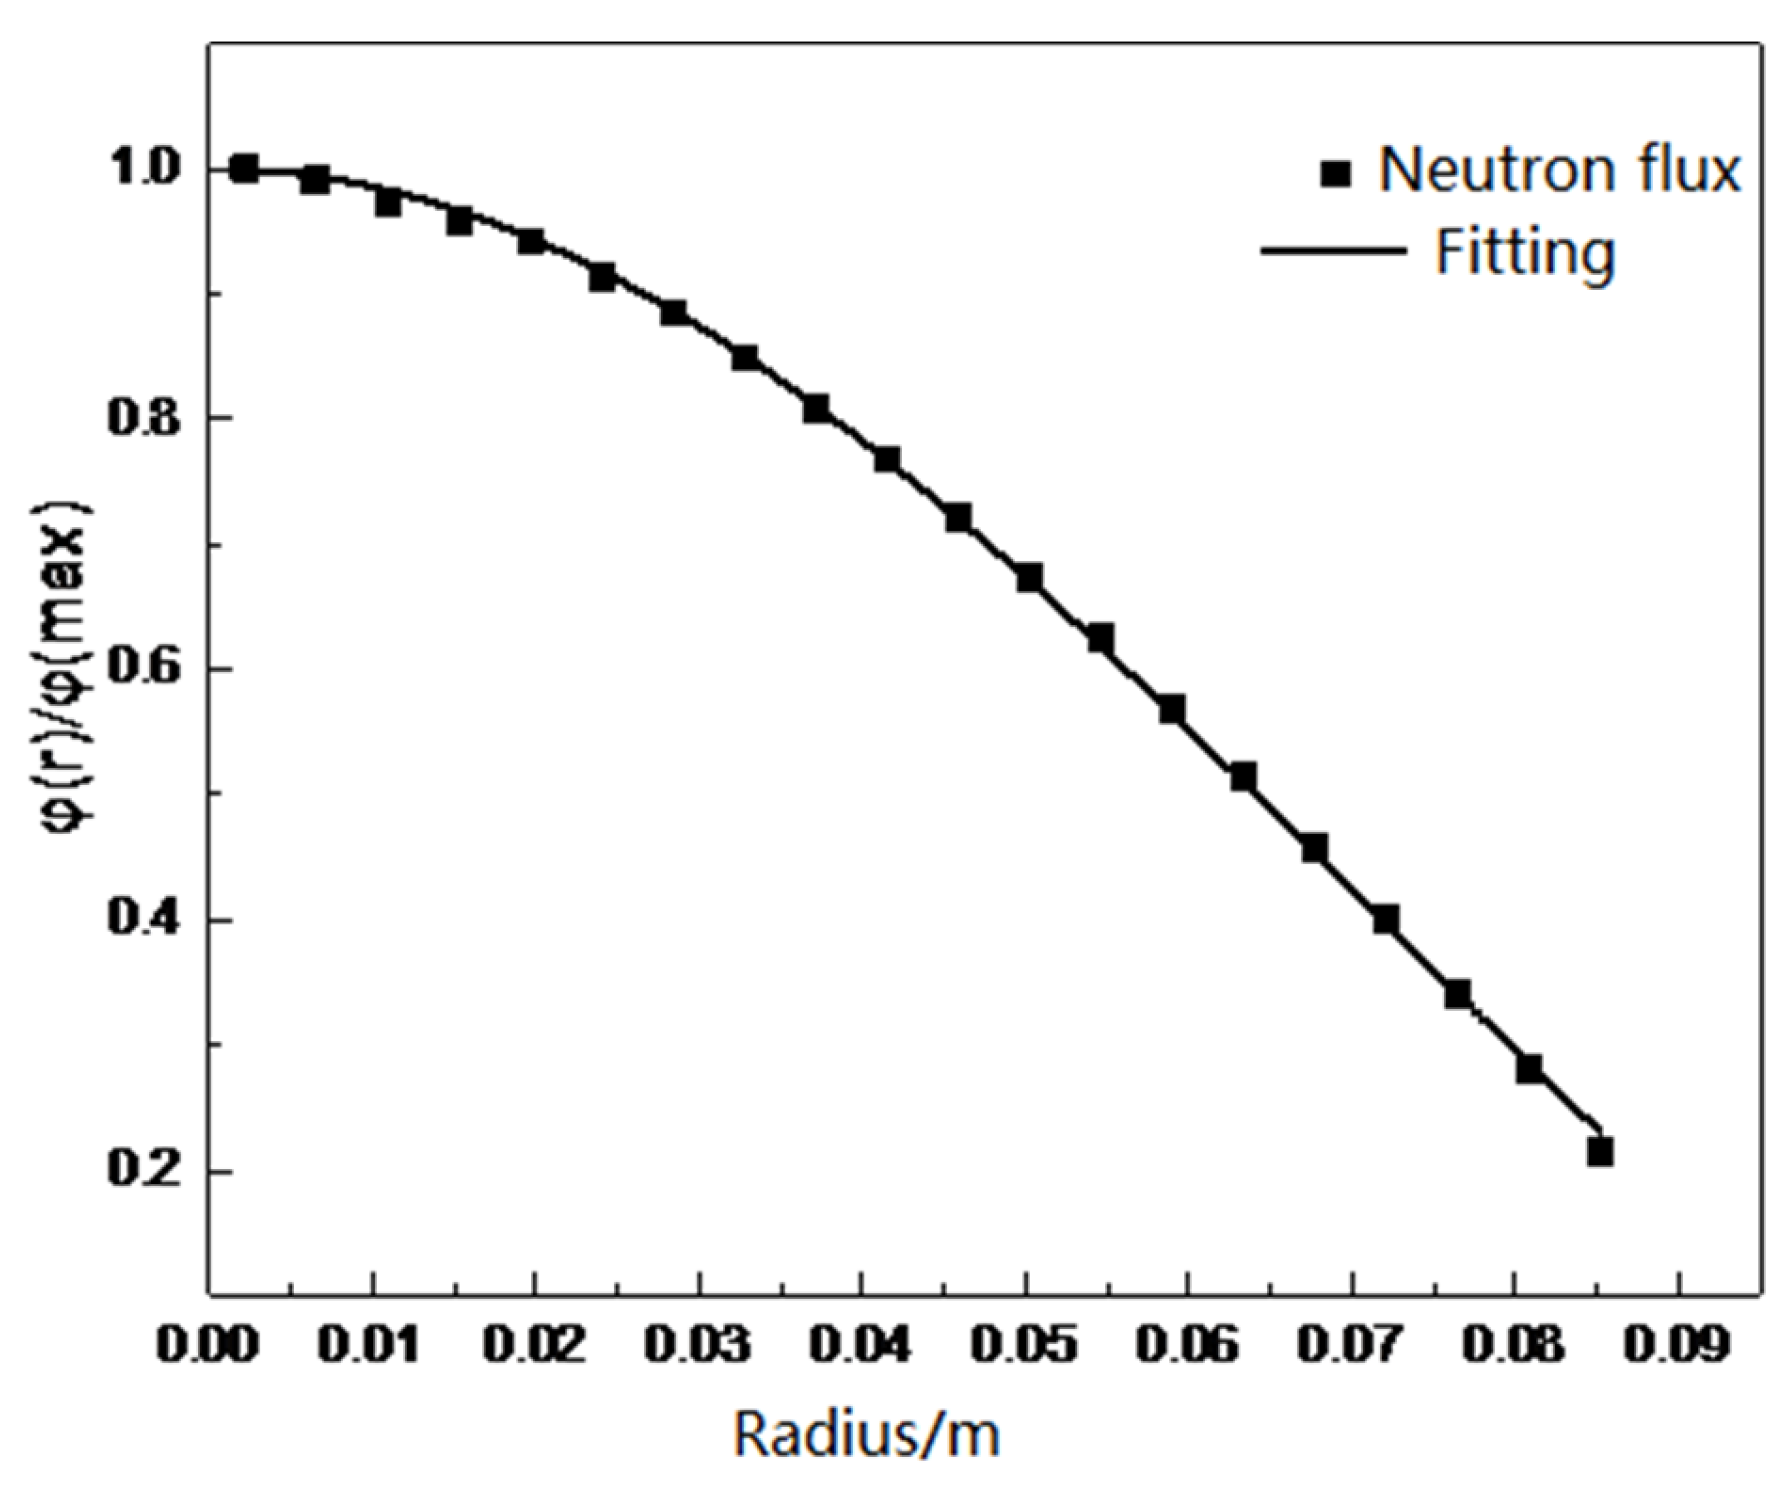
Firstly, the critical calculation is carried out. The keff of Godiva is 1.00018. The radial neutron flux distribution of the core is calculated, and the fitted curve of the radial neutron flux is shown in Figure 10, which shows that at the core r = 0, the neutron flux is the largest, and the surface neutron flux is the lowest. The surface neutron flux is about 21.5% of the center. Calculations based on Equation (7) show a temperature rise of 1 °C in the center of the system and an average temperature rise of 0.473 °C for the whole stack. The equation of the radial flux fitting curve is:
y = sin ( 29.58489 r ) / ( 29.58489 r )
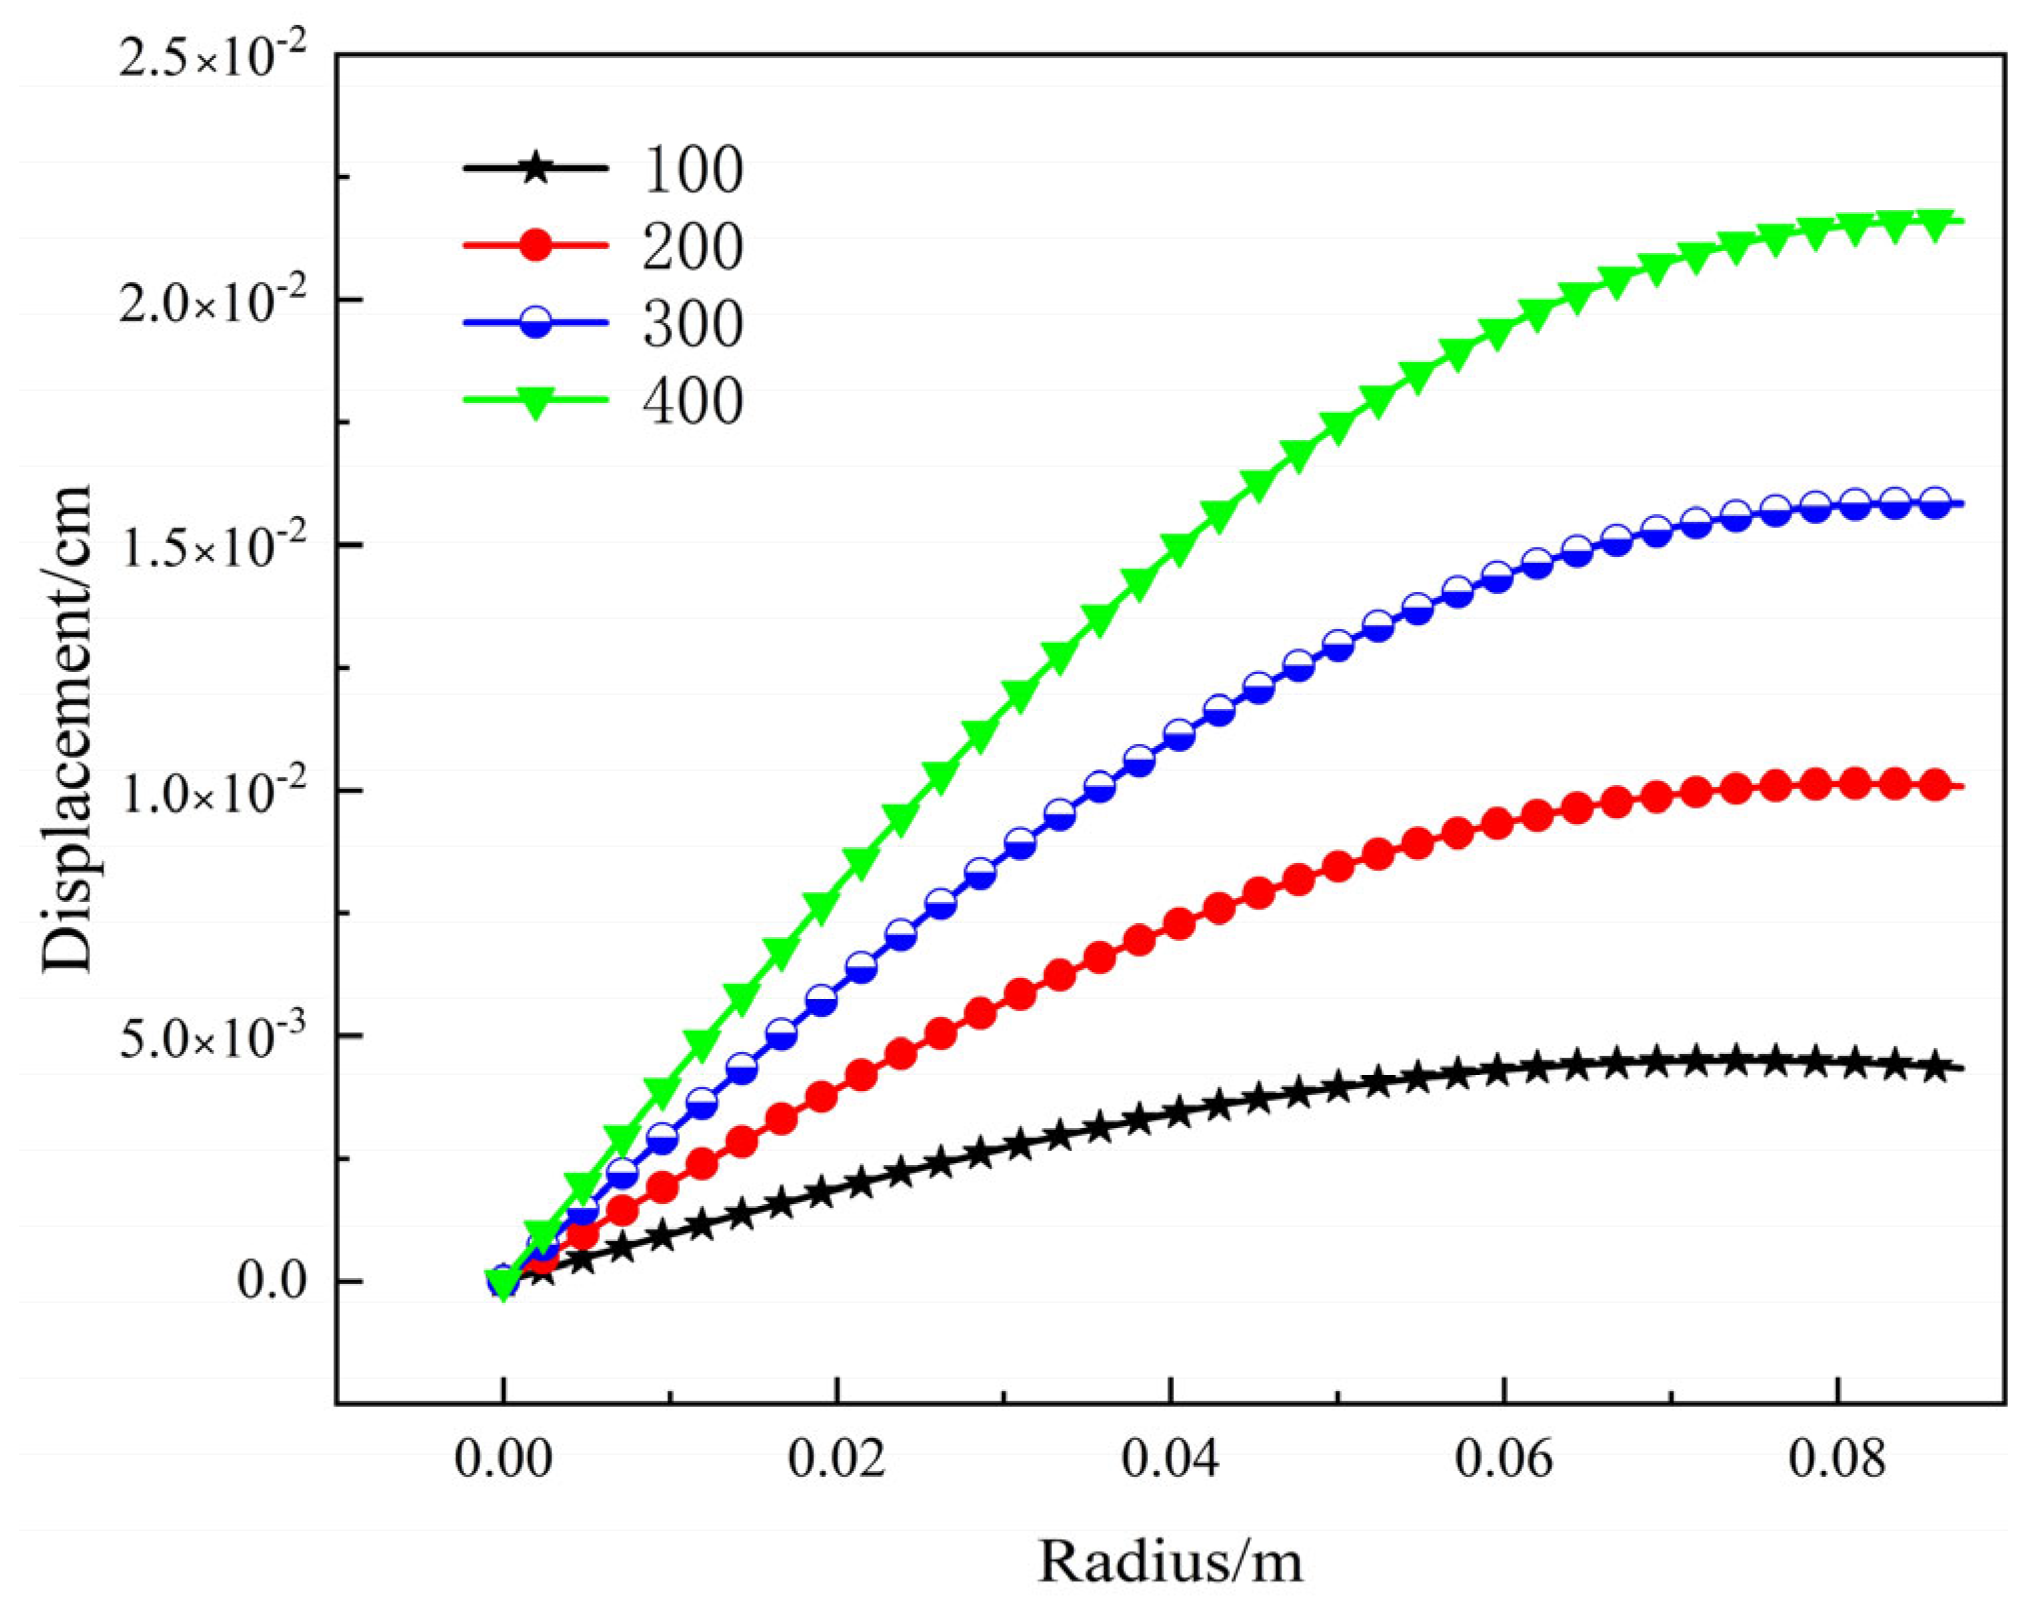
The Heat Conduction module and the Tensor Mechanics module under the MOOSE platform were used to calculate the displacement variation under different initial temperature conditions. The meshing size was selected as 3.7% of the diameter, the number of mesh was 90,287, and the number of nodes was 126,885. The displacement expansion along the radius for central temperature T0 of 100 °C, 200 °C, 300 °C and 400 °C was calculated, and the results are shown in Figure 11.
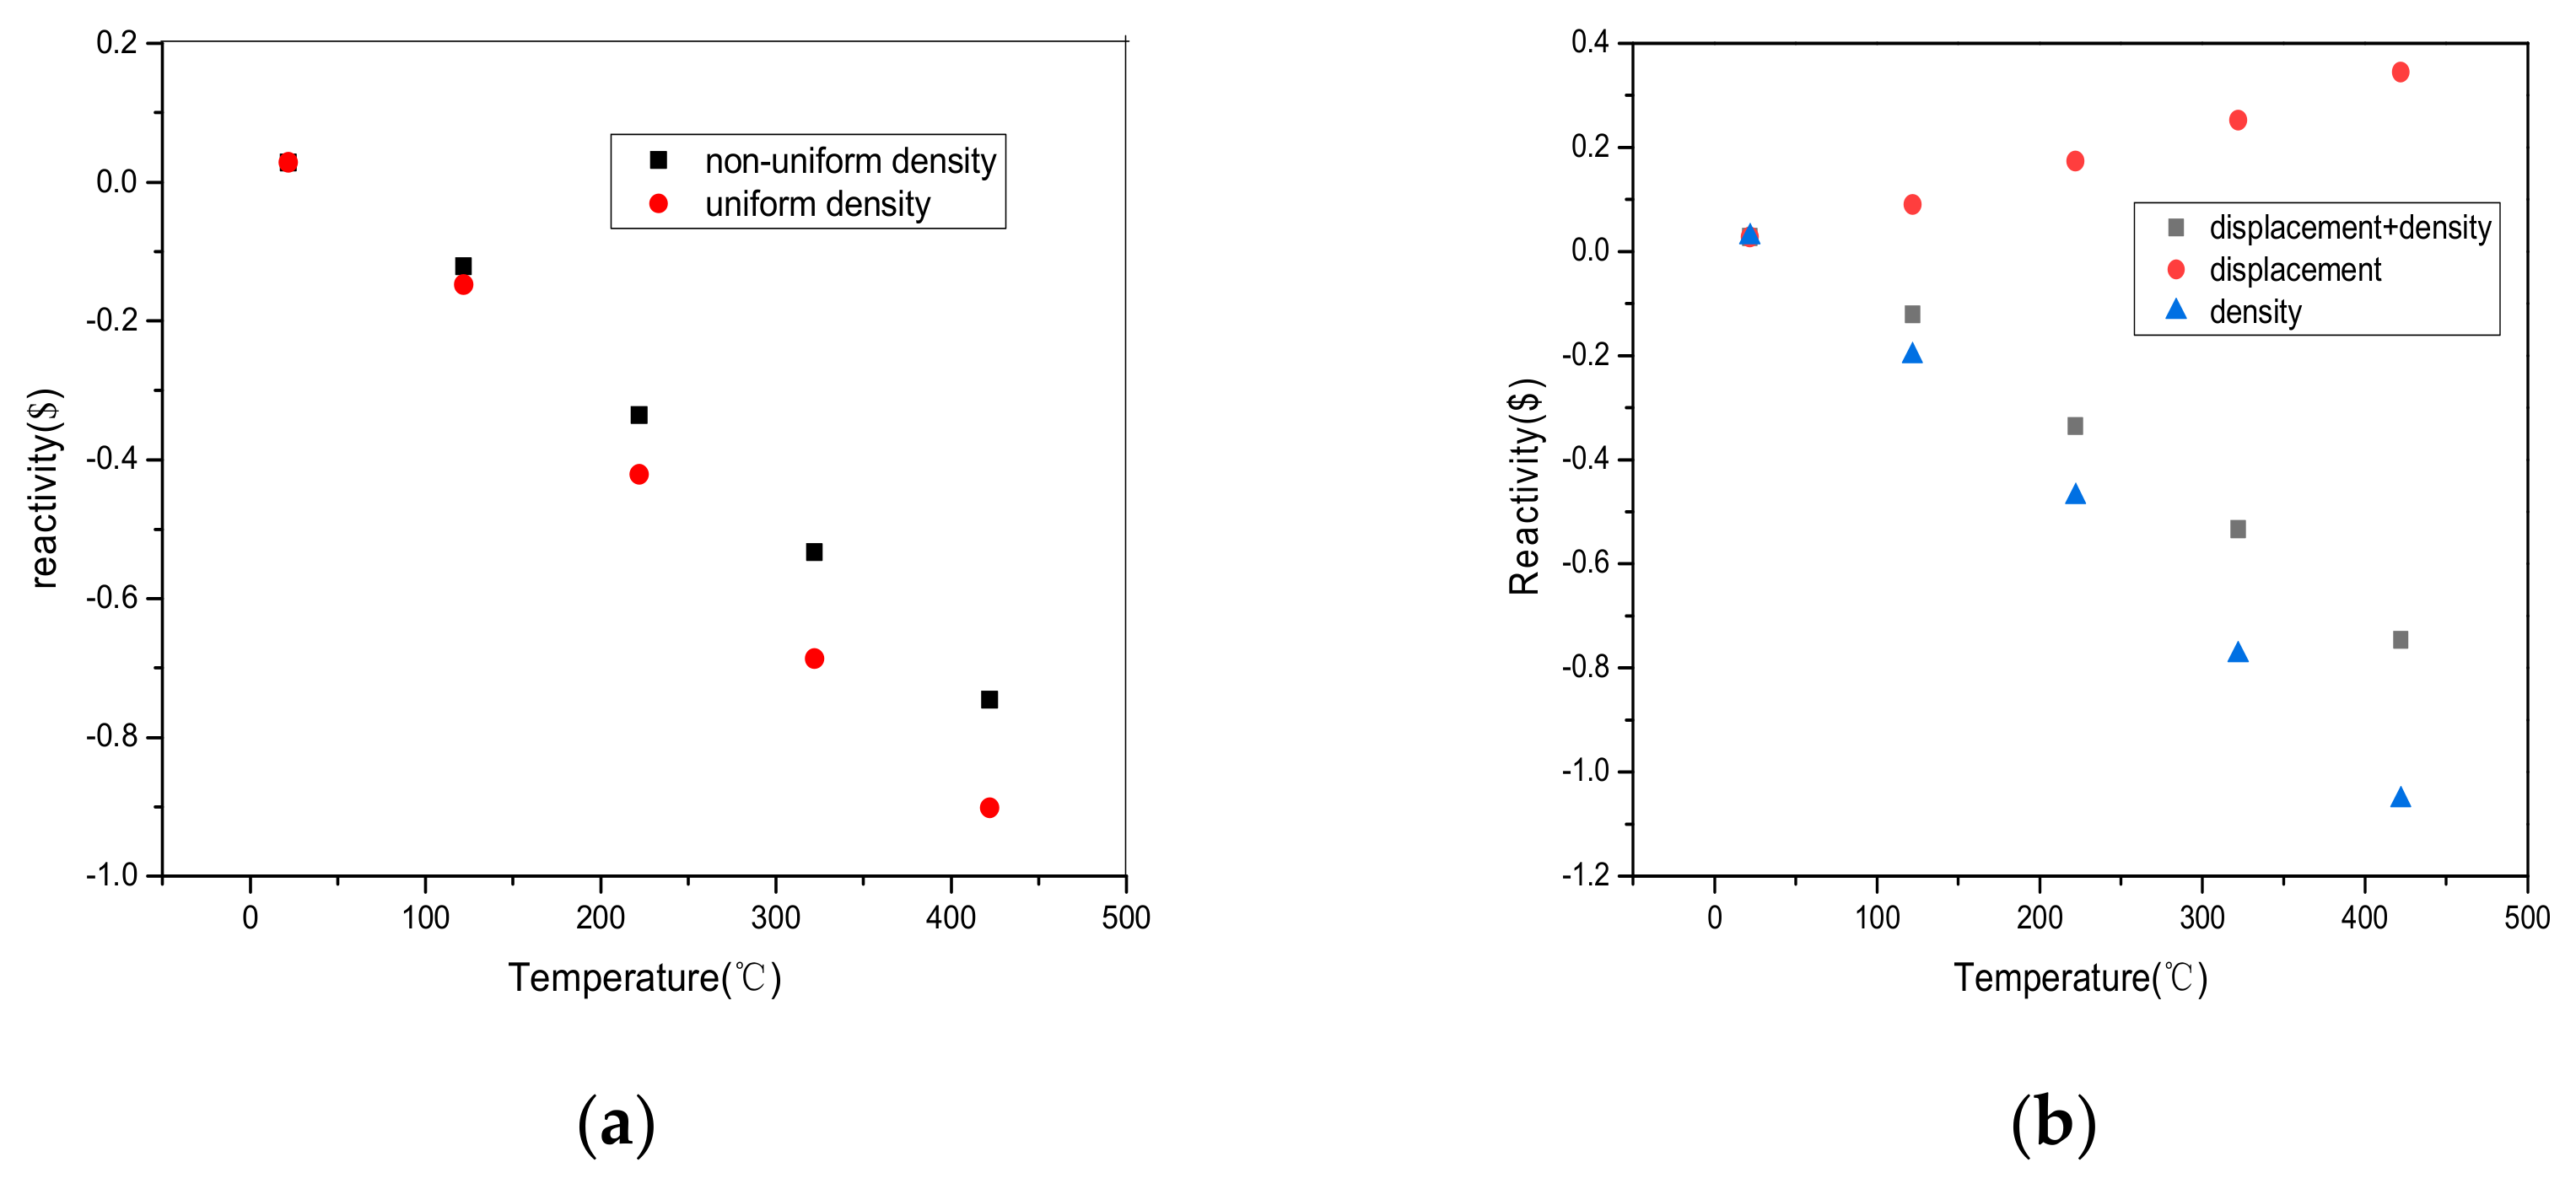
The spherical shell elements were built based on the radial displacement variation in different layers, and the corresponding elements’ densities were calculated. Subsequently, the reactivity was calculated considering various displacements at different temperatures, and the reactivity difference was compared between uniform and non-uniform density variations (Figure 12a). Moreover, the calculated results of reactivity with temperature were compared between cases of only displacement or density variation and cases involving both variations (Figure 12b). It is observed that the reactivity changes approximately linearly with temperature. By fitting the non-uniform density variation data, the reactivity temperature coefficient at the center position (αT0) was determined to be −0.00196 ($/°C). Combining this with the relationship between the center temperature and average temperature, the average reactivity temperature coefficient was calculated as −0.00415 ($/°C). This value has only a 1.27% relative deviation from the experimental measurement [18]. In contrast, under the uniform density variation, the fitted reactivity temperature coefficient at the center position was found to be −0.0024 ($/°C), leading to an average reactivity temperature coefficient of −0.00507 ($/°C). Interestingly, this value deviates from the experimental measurement by up to 20.9%.

3.1.2. Transient Reactivity

The initial reactivity periods of Godiva-I were calculated using the point reactor kinetic theory after obtaining the reactivity temperature coefficients. The calculated values were compared with experiment data [18] in Figure 13, where tm represents the peak fission rate moment. The relative deviations of the peak fission rate were found to be −4.83% and 3.86%, indicating that our point reactor kinetic code can better simulate the peak fission rate. In the power-rise region, the calculated values and experimental values show a good match. However, in the power-decrease region, the calculated values are generally smaller than the experimental values. This discrepancy can be attributed to the involvement of neutrons reflected from the wall in the nuclear reaction, which are not captured by the initial code.
The diagram in Figure 14 illustrates the change in system reactivity. It can be observed that the initial reactivity periods of 16.2 μs and 29.5 μs, with inserted reactivity values of $1.056 and $1.031, respectively, are comparable. However, due to the presence of the reactivity feedback effect, the reactivity consistently decreases. Once the reactivity reaches 1$, the system instantly enters a supercritical state, where criticality can be achieved without delayed neutrons and power output is maximized. Consequently, as the reactivity feedback intensifies, the reactivity further diminishes, and delayed neutrons start to emerge. This causes a gradual decrease in system power and leads to the punching stage illustrated in Figure 13, primarily attributed to the presence of delayed neutrons.

3.1.3. Transient Thermal-Mechanical Calculation

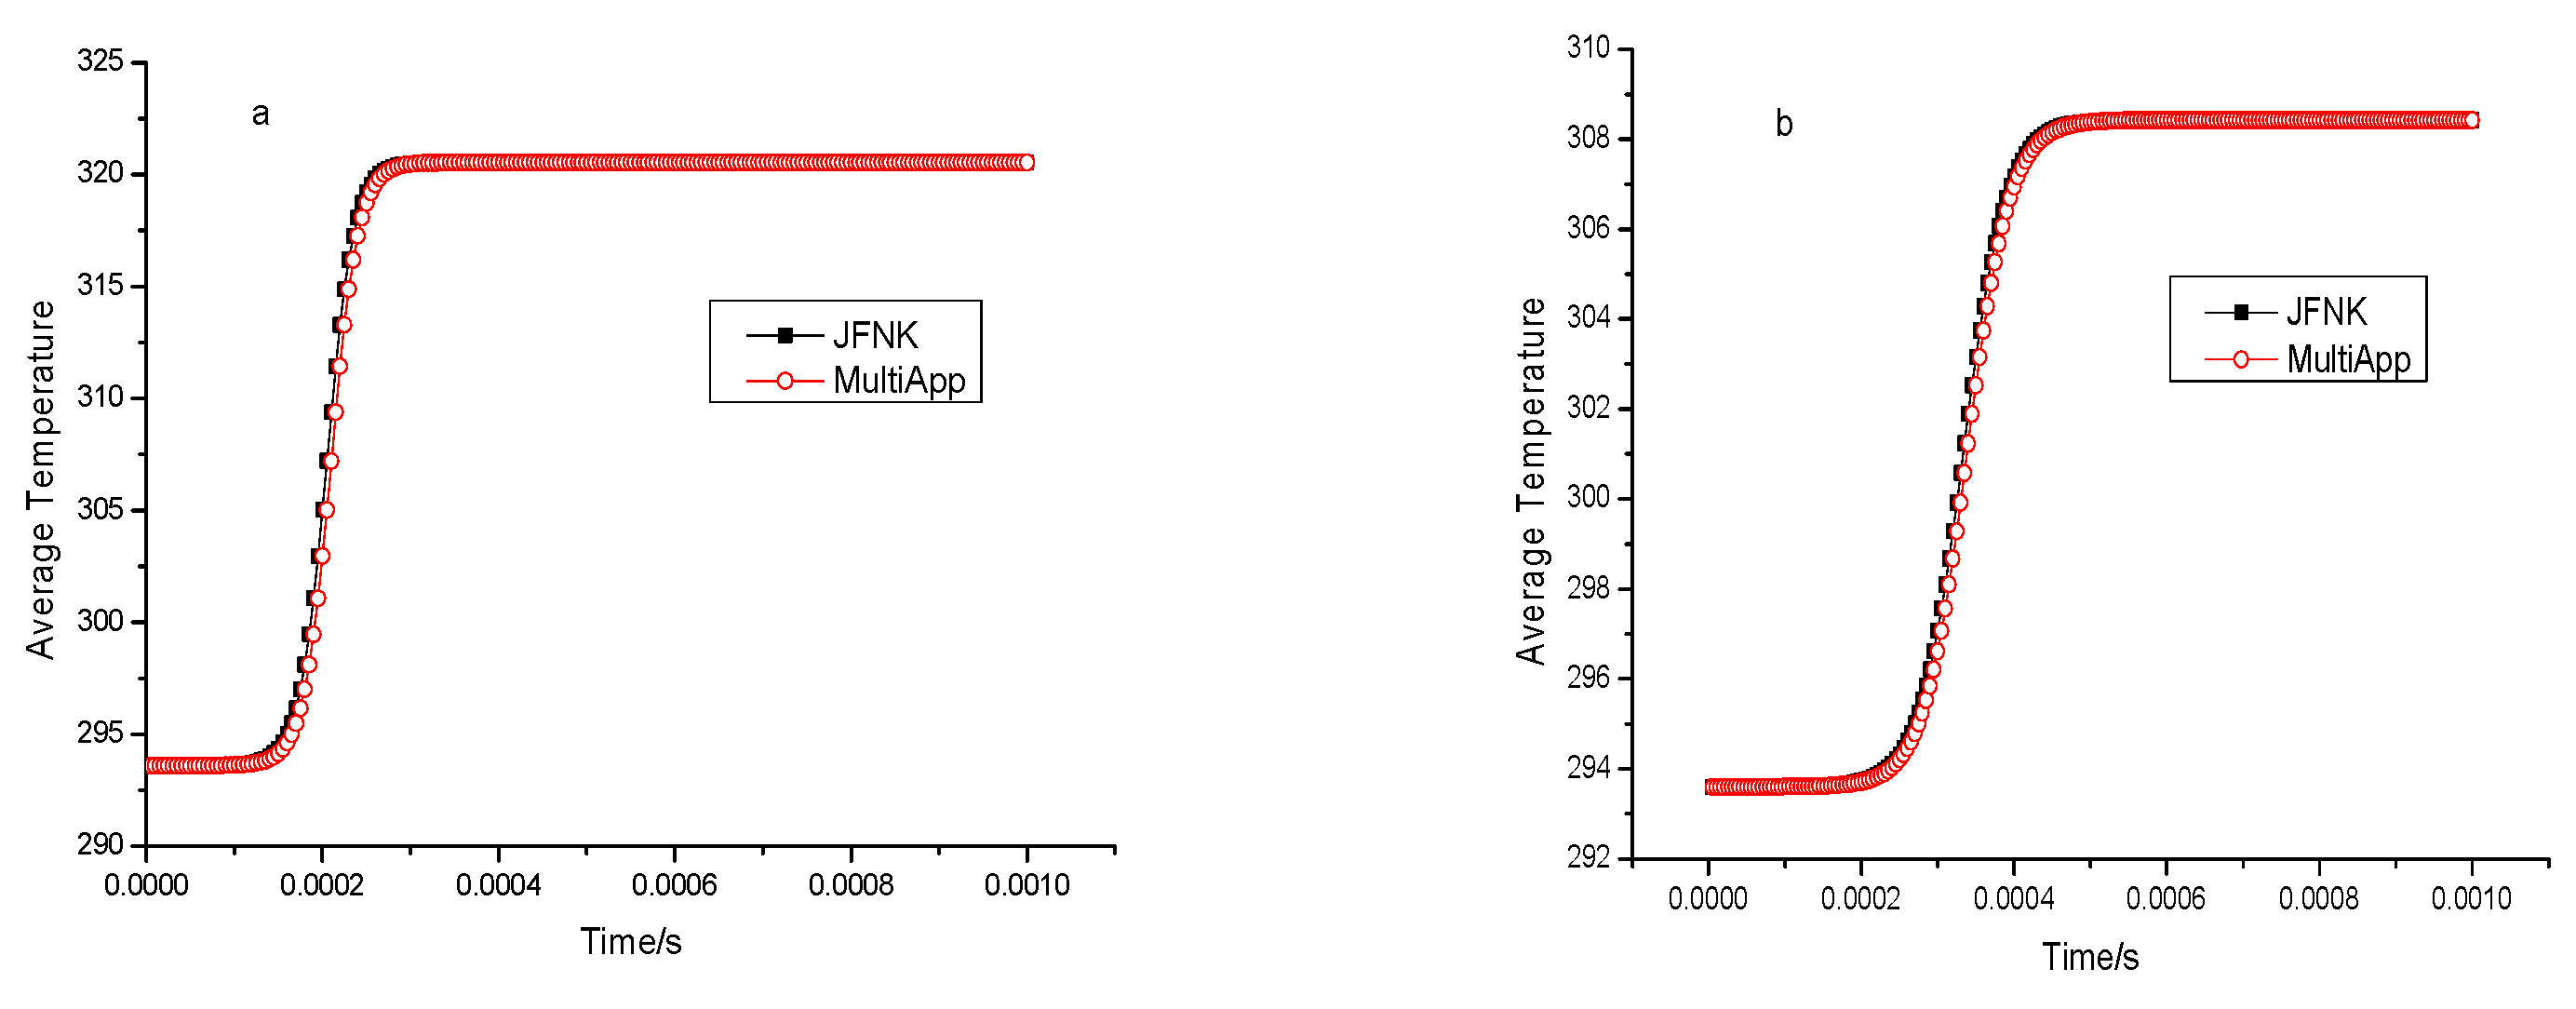
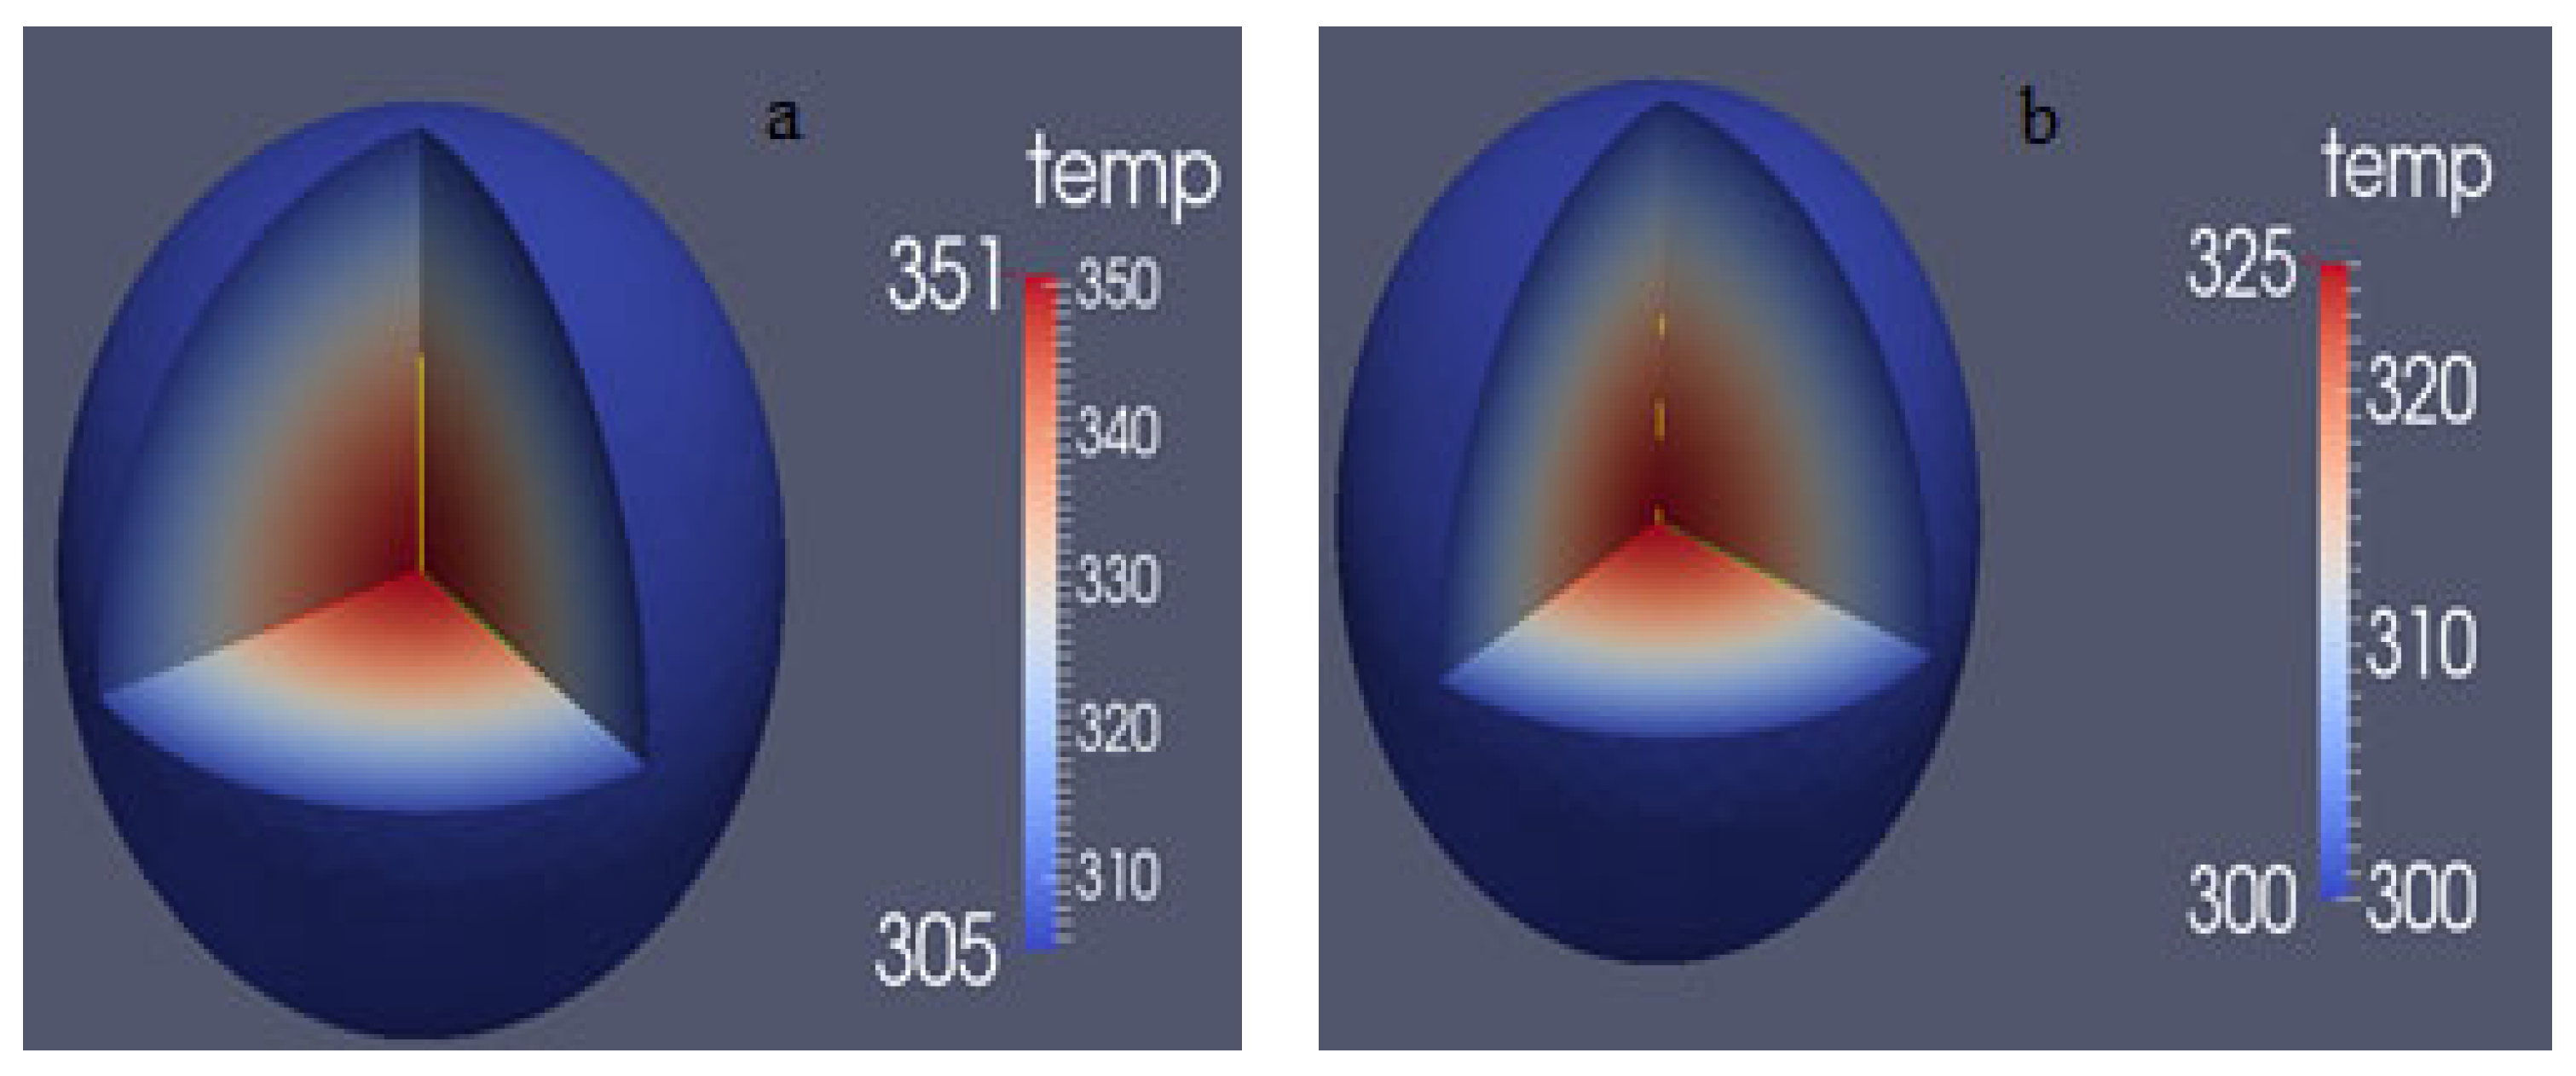
Figure 15 shows the system average temperature results for an initial reactivity period of 16.2 μs and 29.5 μs. Initially, the system’s average temperature rise changes slowly due to the slow increase in system power. Subsequently, the system power rises sharply, resulting in a rapid growth in temperature. As the reactivity feedback deepens, the system temperature change gradually slows down until it reaches a constant level. There is little difference in average temperature between the JFNK and MultiApp methods. Both direct JFNK and indirect MultiApp exhibit similar temperature distributions. Figure 16 displays the temperature distribution at the end time for the initial reactivity periods of 16.2 μs and 29.5 μs, where the temperature difference inside the Godiva sphere is greater for the smaller initial reactivity period than for the larger one.
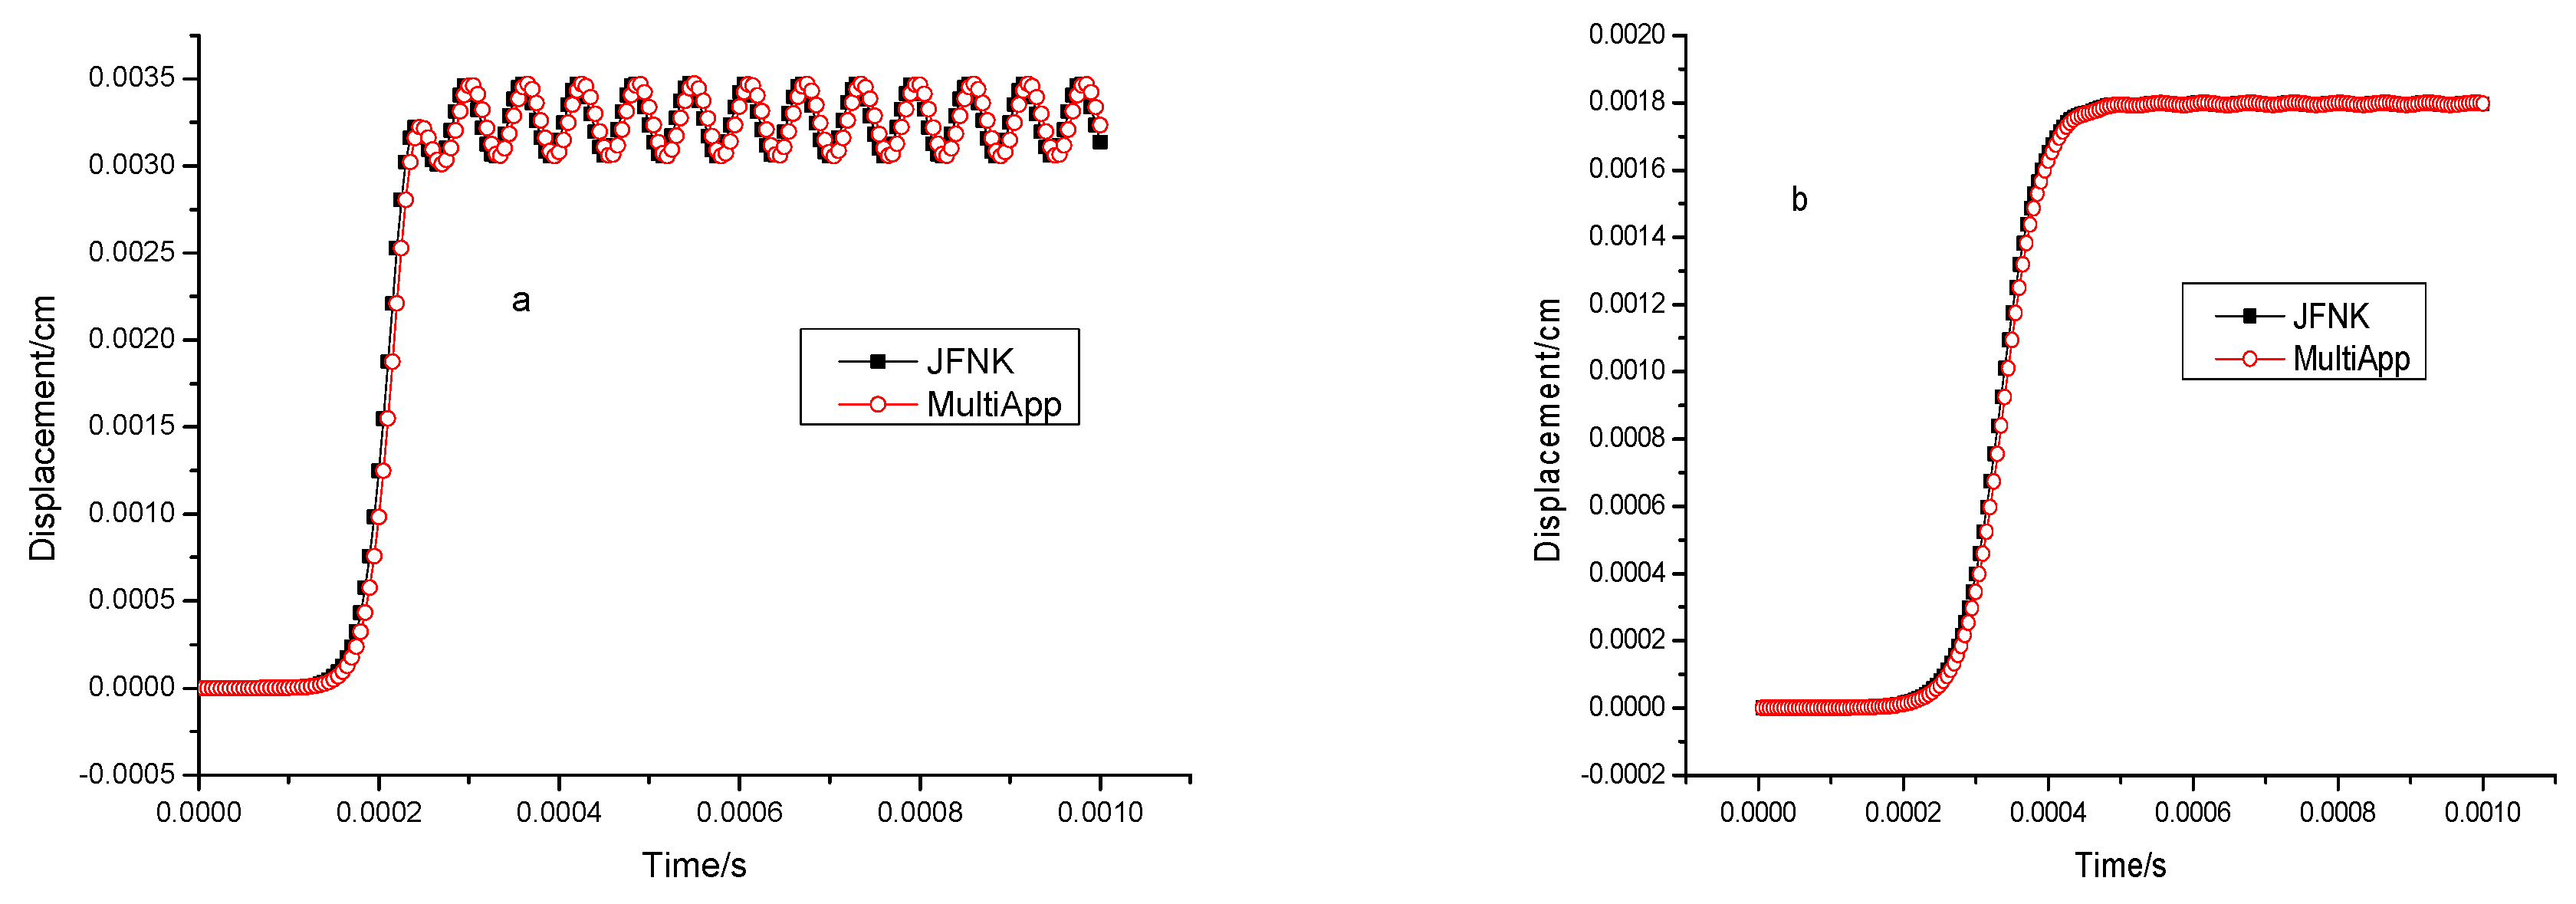
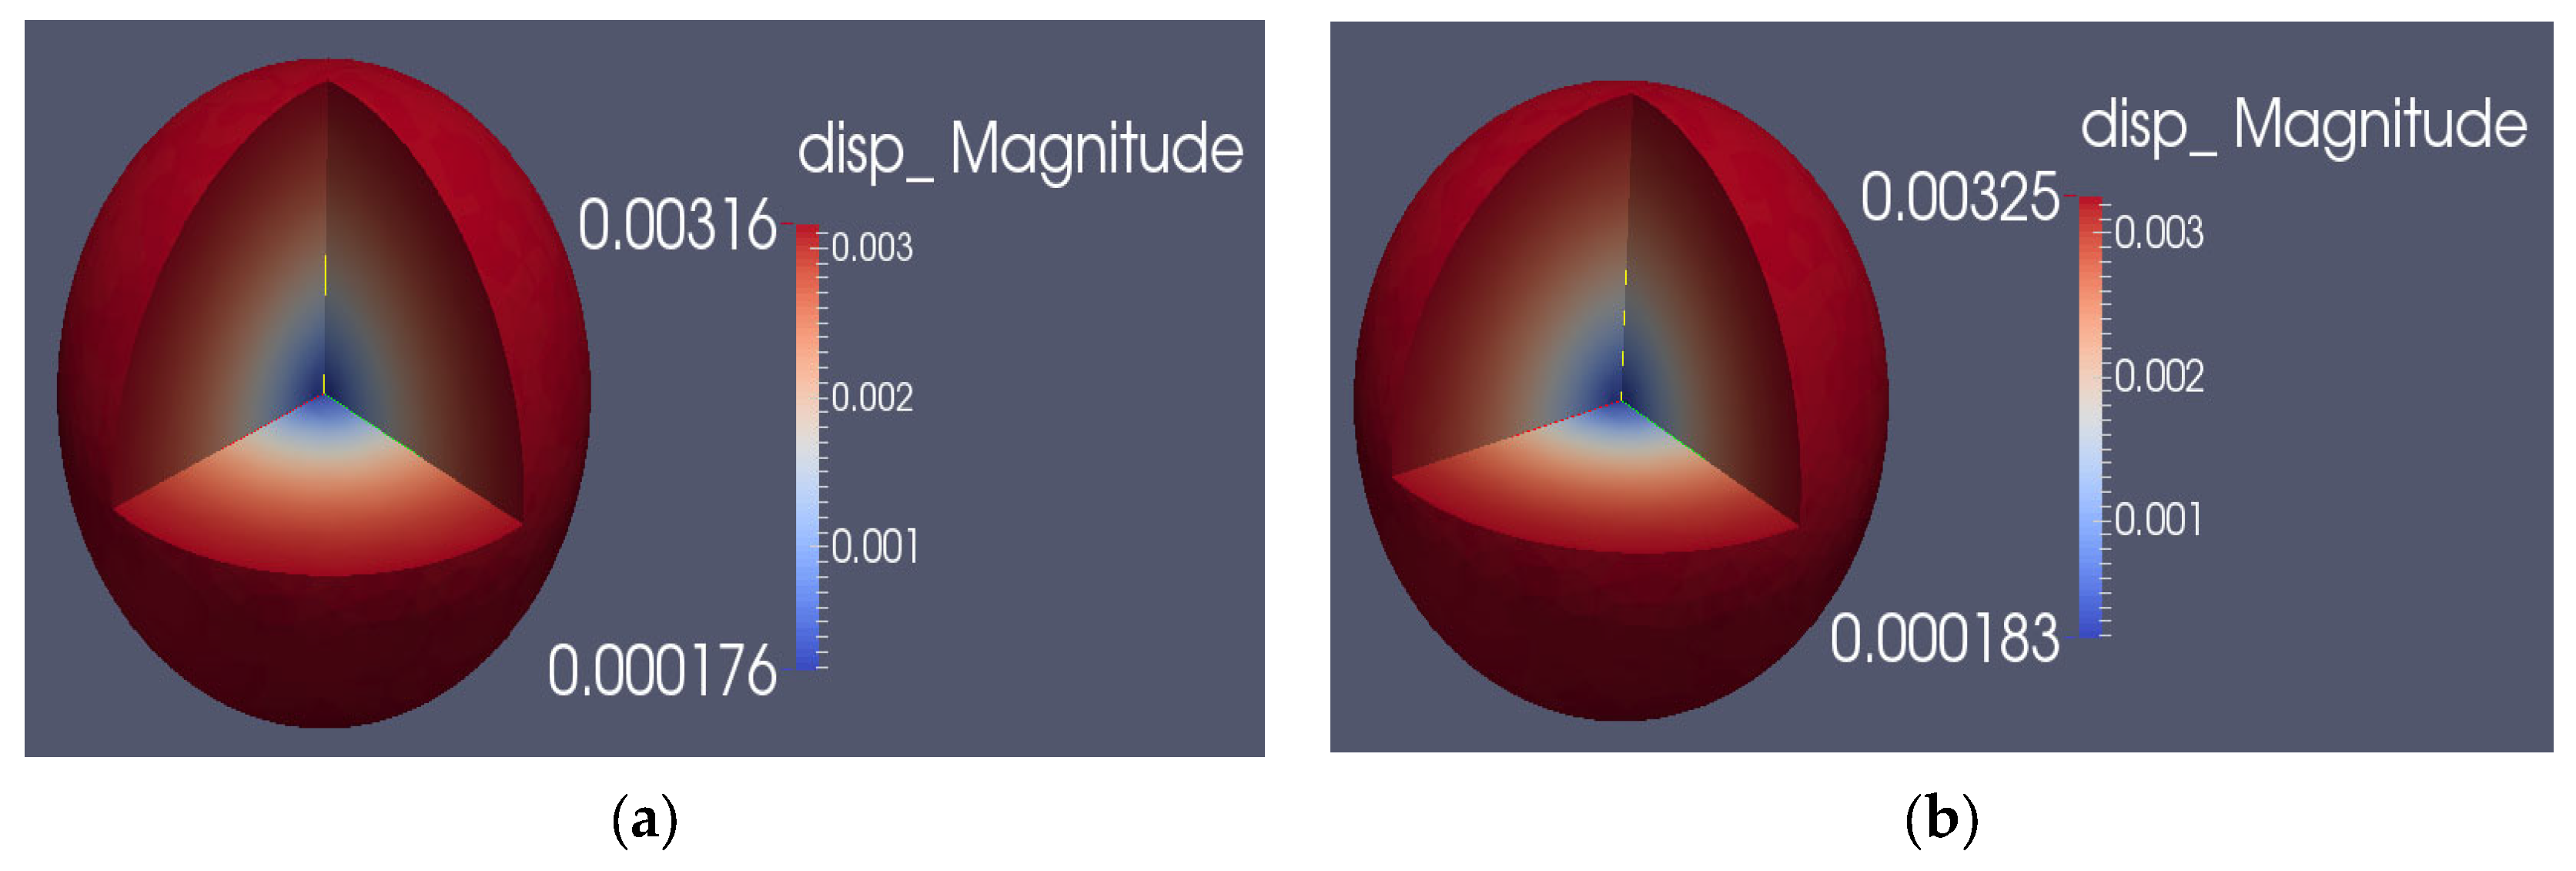
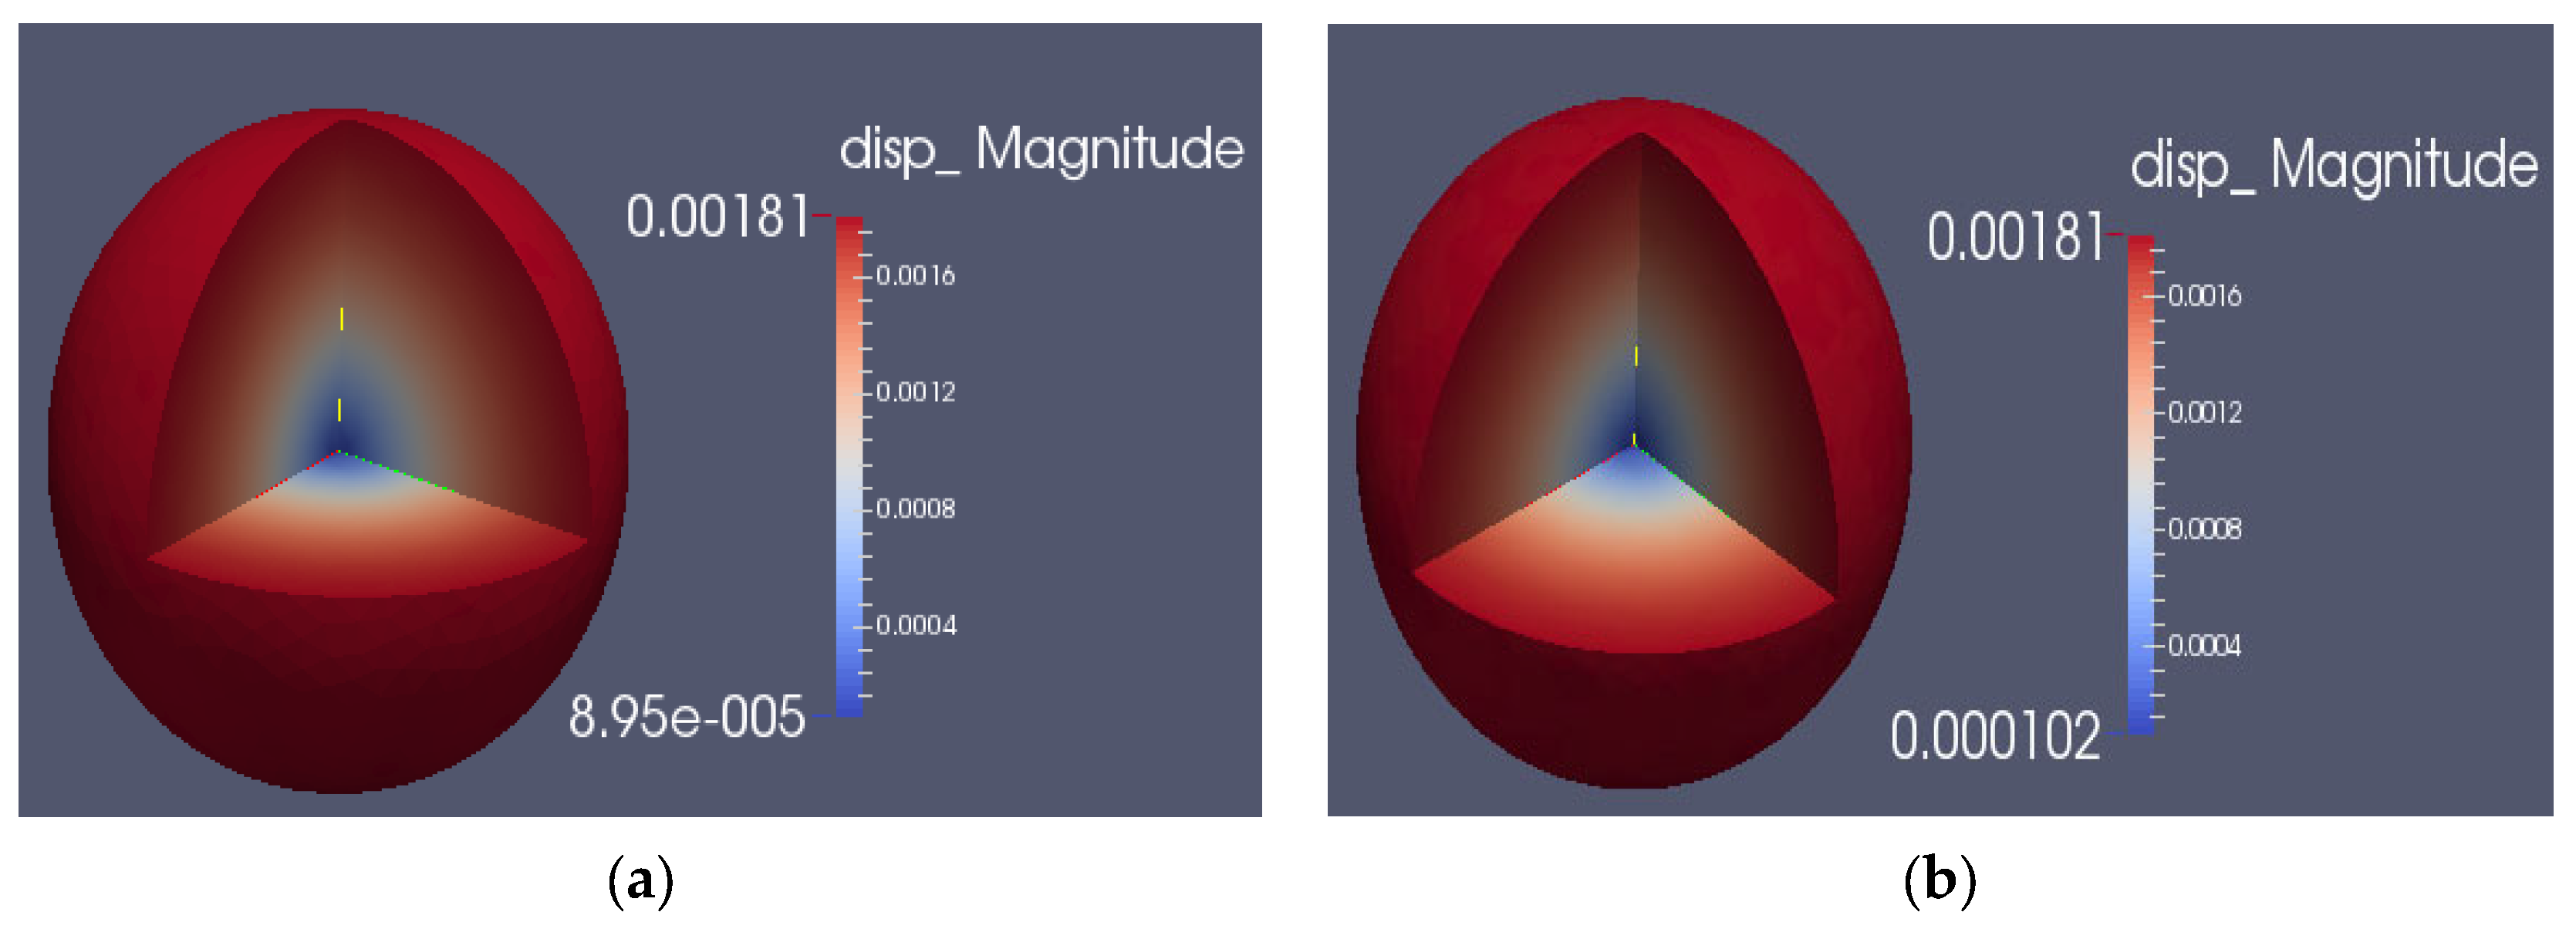
During the pulsing process of the fast pulsed reactor, the external surface displacement with time for both the JFNK and MultiApp methods is shown in Figure 17. The core experiences compression and tension alternately under the pulse condition, resulting in the oscillation of surface displacement due to the rapid change of temperature rise. The period of surface stress oscillation matches that of surface displacement. However, when the initial reactivity period is 29.5 μs, the oscillation effect becomes insignificant. Figure 18 and Figure 19 illustrate the displacement distribution at 16.2 μs and 29.5 μs initial reactivity period using the JFNK and MultiApp methods, respectively. Comparatively, Table 4 presents the runtime and memory consumption comparison between JFNK and MultiApp. The results show that MultiApp lags behind JFNK by one time step. Additionally, the JFNK convergence runtime differs depending on the initial reactivity period, with 29.5 μs requiring more time than 16.2 μs. However, their memory consumption remains the same. In contrast, MultiApp does not achieve convergence as it only conducts one Heat Conduction and one Tensor Mechanics step. Its runtime and memory consumption for different initial reactivity periods are almost identical but larger than that of JFNK. In practical applications where thermal-mechanical inner-coupling is required, this paper recommends using the JFNK method, deeming MultiApp inappropriate for this problem.

3.2. Inertia Effect

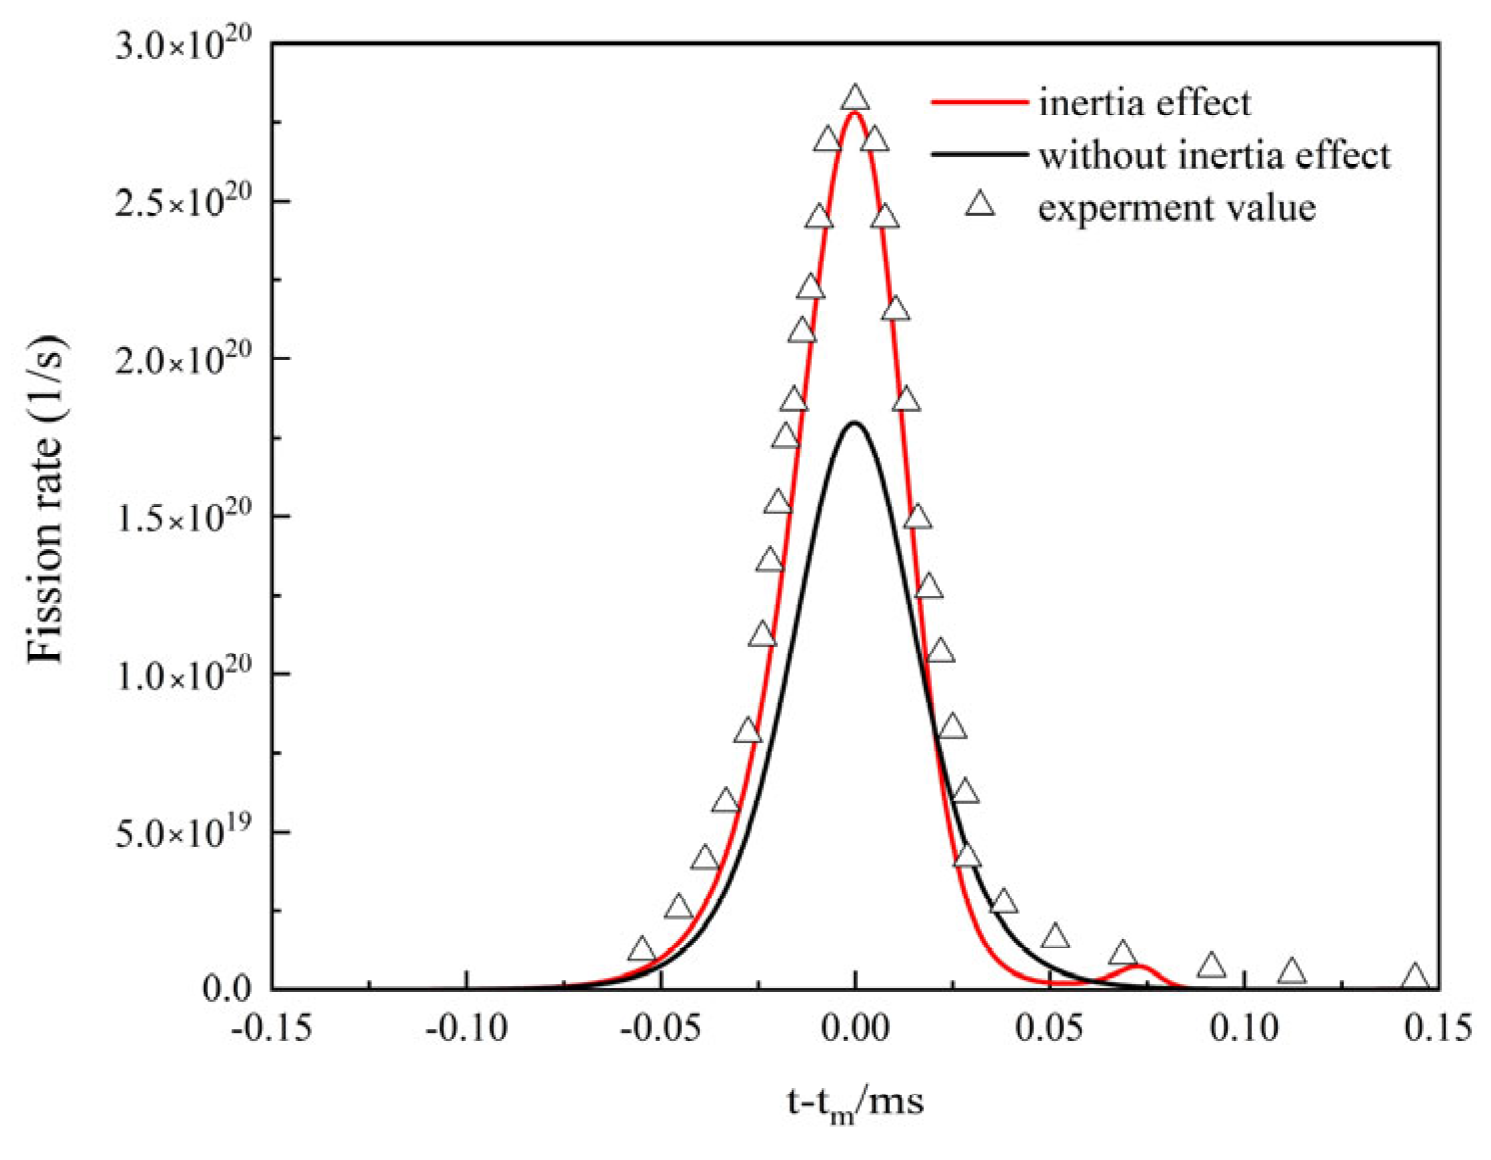
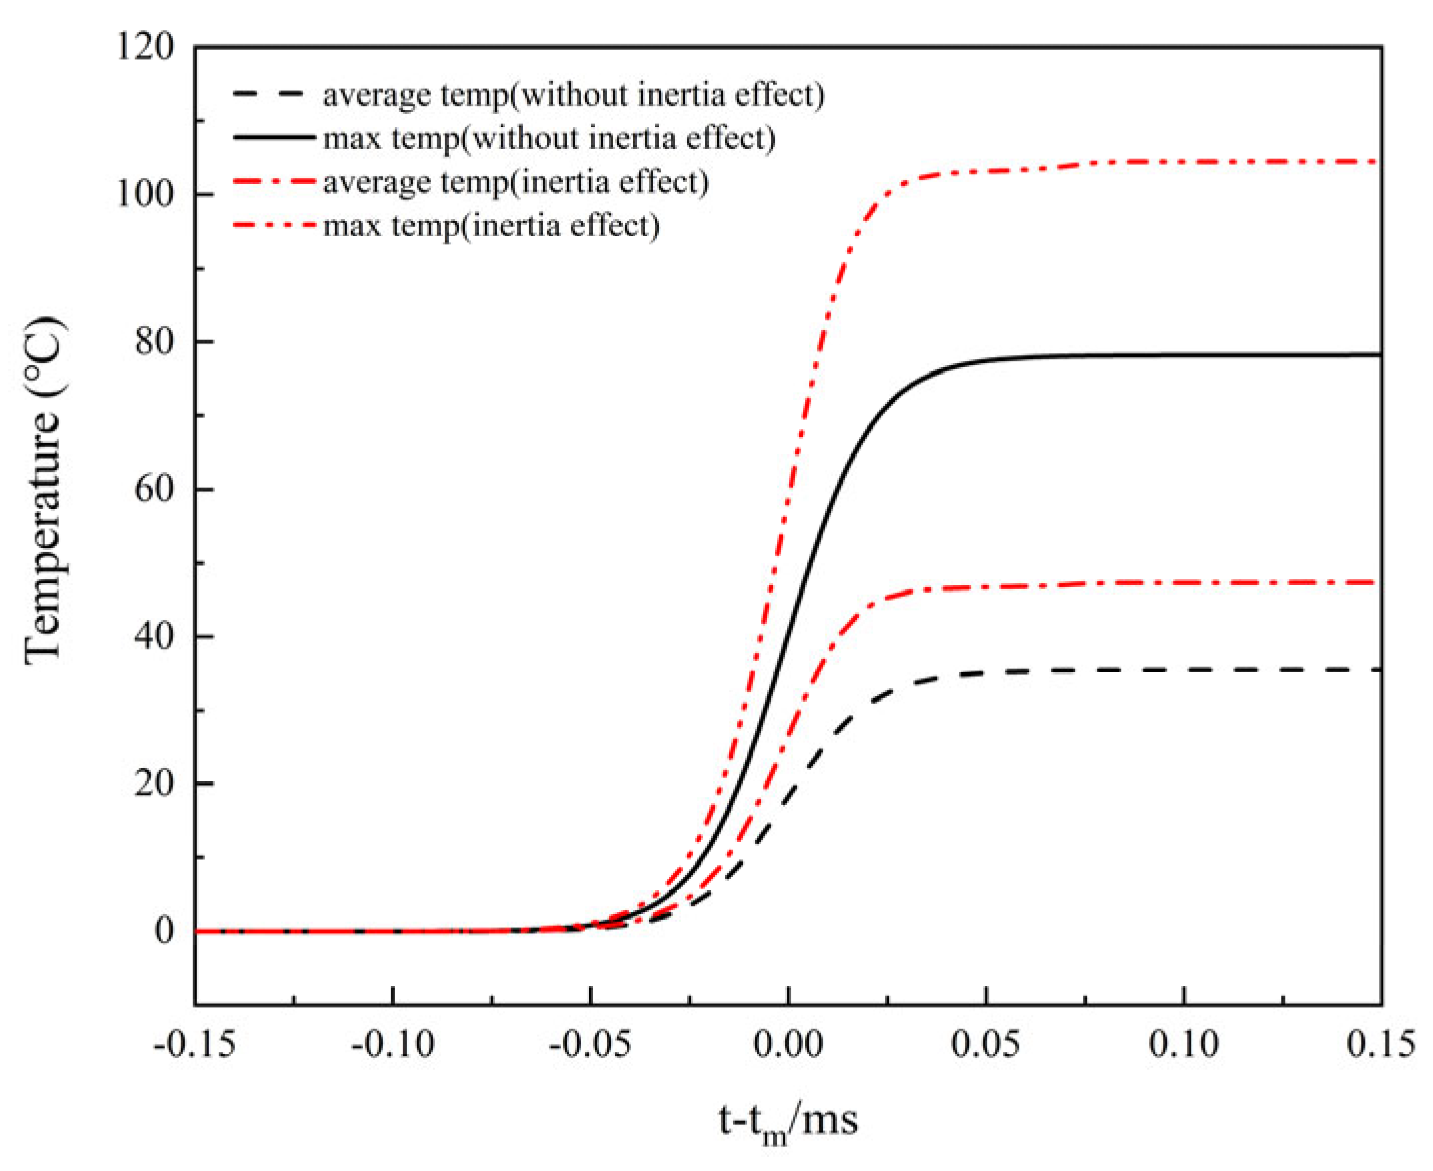
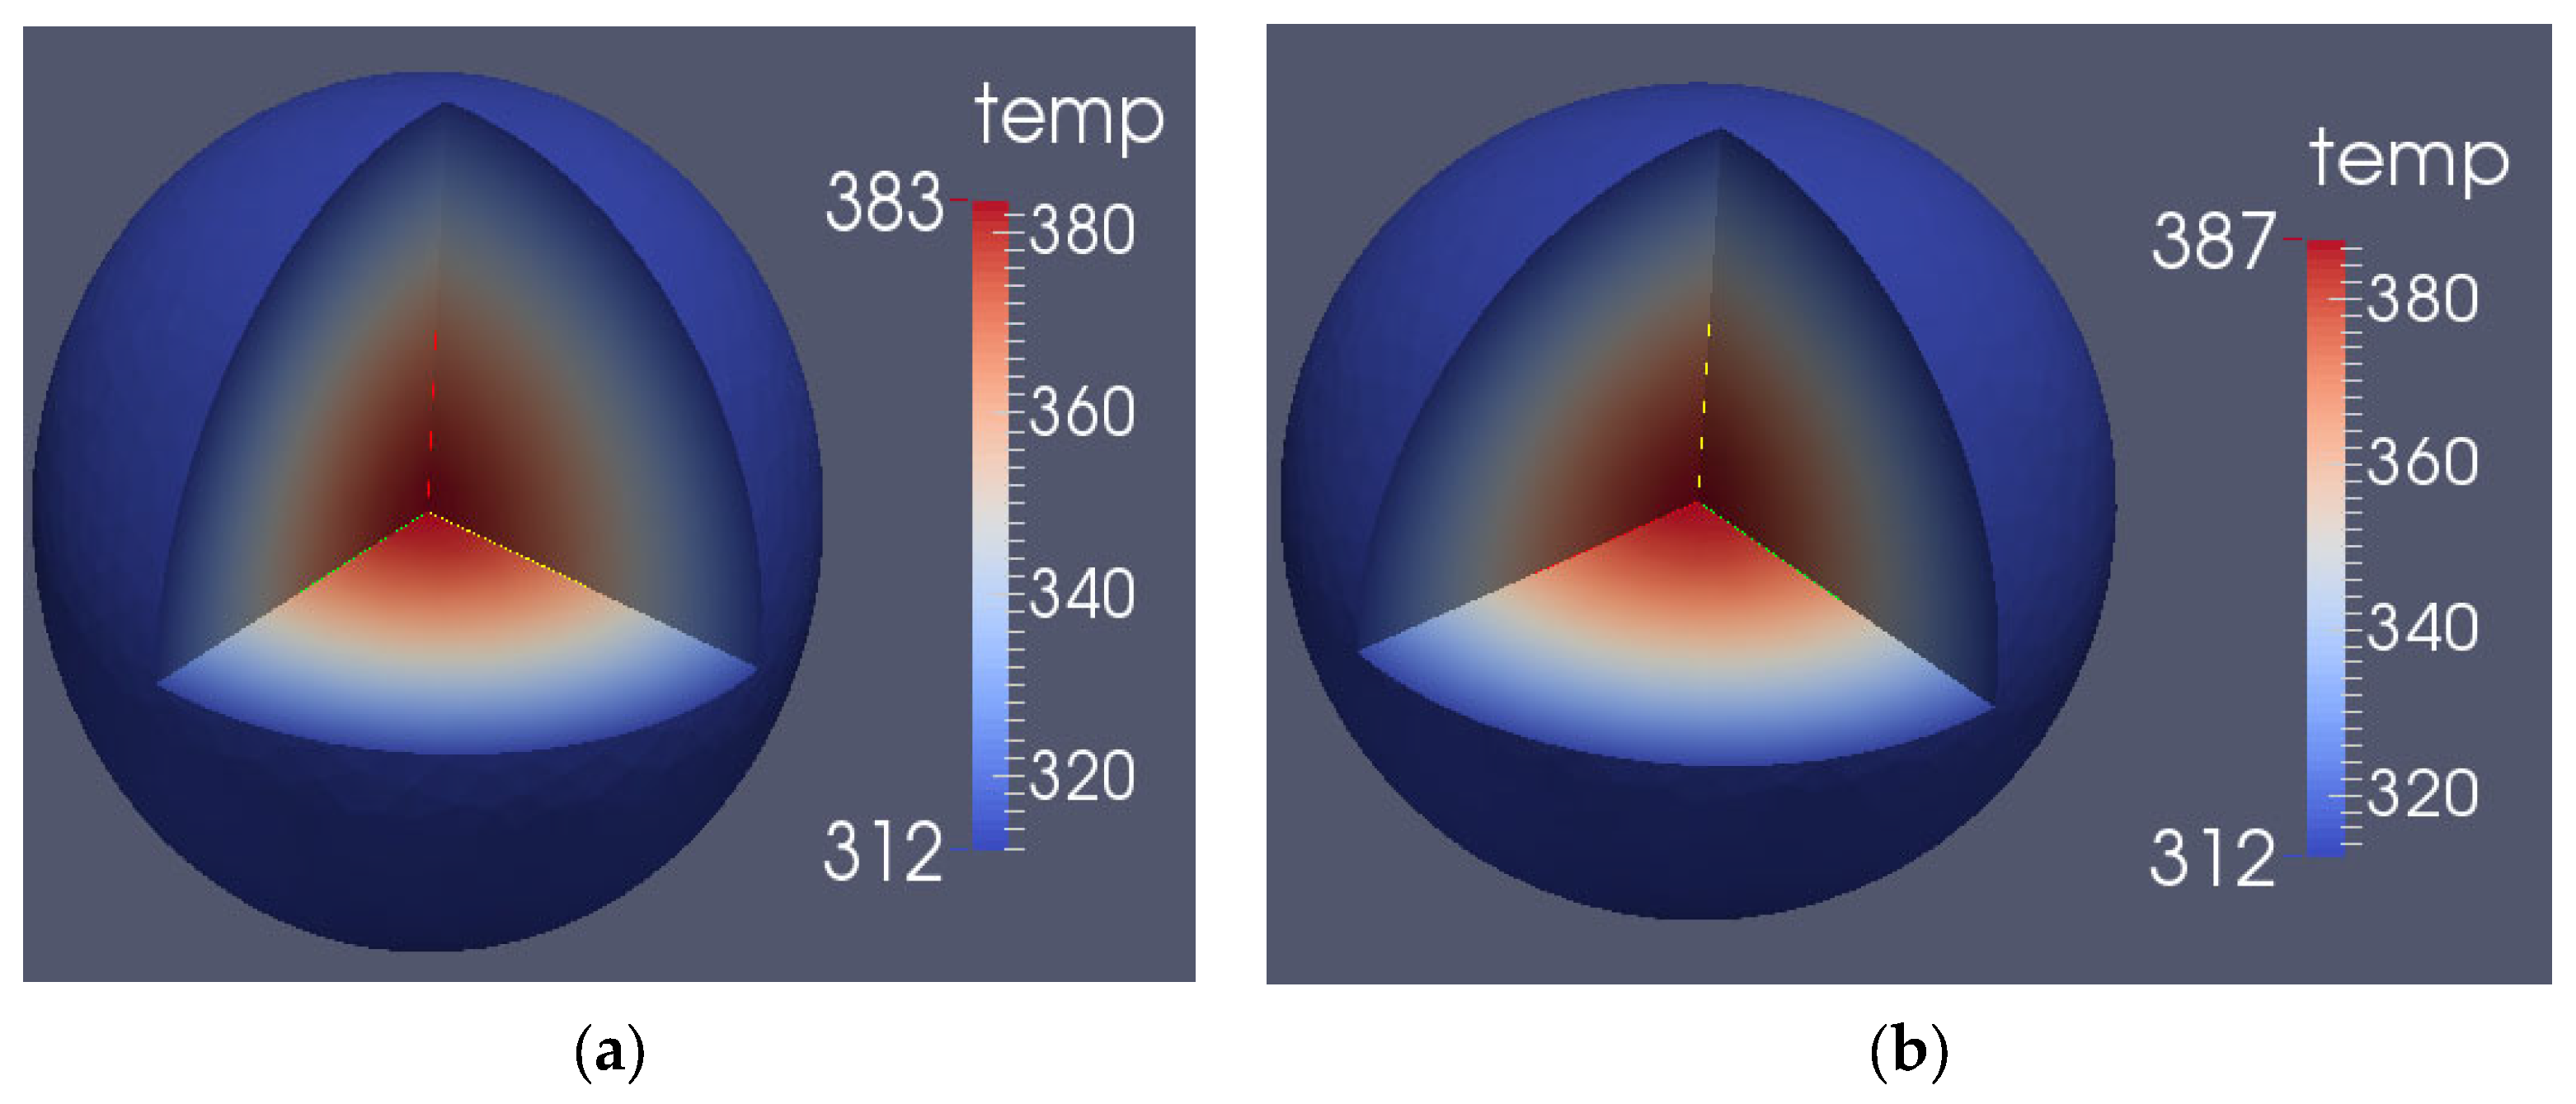
In order to investigate the inertia effect of Godiva-I, an initial reactivity period of 11.6 μs was induced since the inertia effects of the initial periods 16.2 μs and 29.5 μs were not evident according to Figure 13. Figure 20 illustrates a comparison between the calculated fission rates, considering and not considering the inertia effect, with the experimental value [18]. Without considering the inertia effect, the calculated peak fission rate was 1.8 × 10²⁰(s − 1), resulting in a relative deviation of −36.28% from the experimental value. Conversely, after considering the inertia effect, the calculated peak fission rate was 2.78 × 10²⁰(s − 1), leading to a relative deviation of −1.35%, which is in closer agreement with the experimental value. Figure 21 presents a comparison of the system temperature rise with and without considering the inertia effect. The average and maximum temperature rise of the core without inertia effect were 35.43 °C and 78.24 °C, respectively. However, when the inertia effect was taken into account, the average and maximum temperature rise of the core increased to 47.34 °C and 104.53 °C. The core temperature rise significantly increases after considering the inertia effect, with an approximately 1.3 times increase. Furthermore, Figure 22 displays the temperature distribution when considering and not considering the inertia effect. It can be observed that the core temperature gradually decreases from the center to the surface. However, with the inertia effect, the maximum temperature is slightly higher compared to not considering the inertia effect.
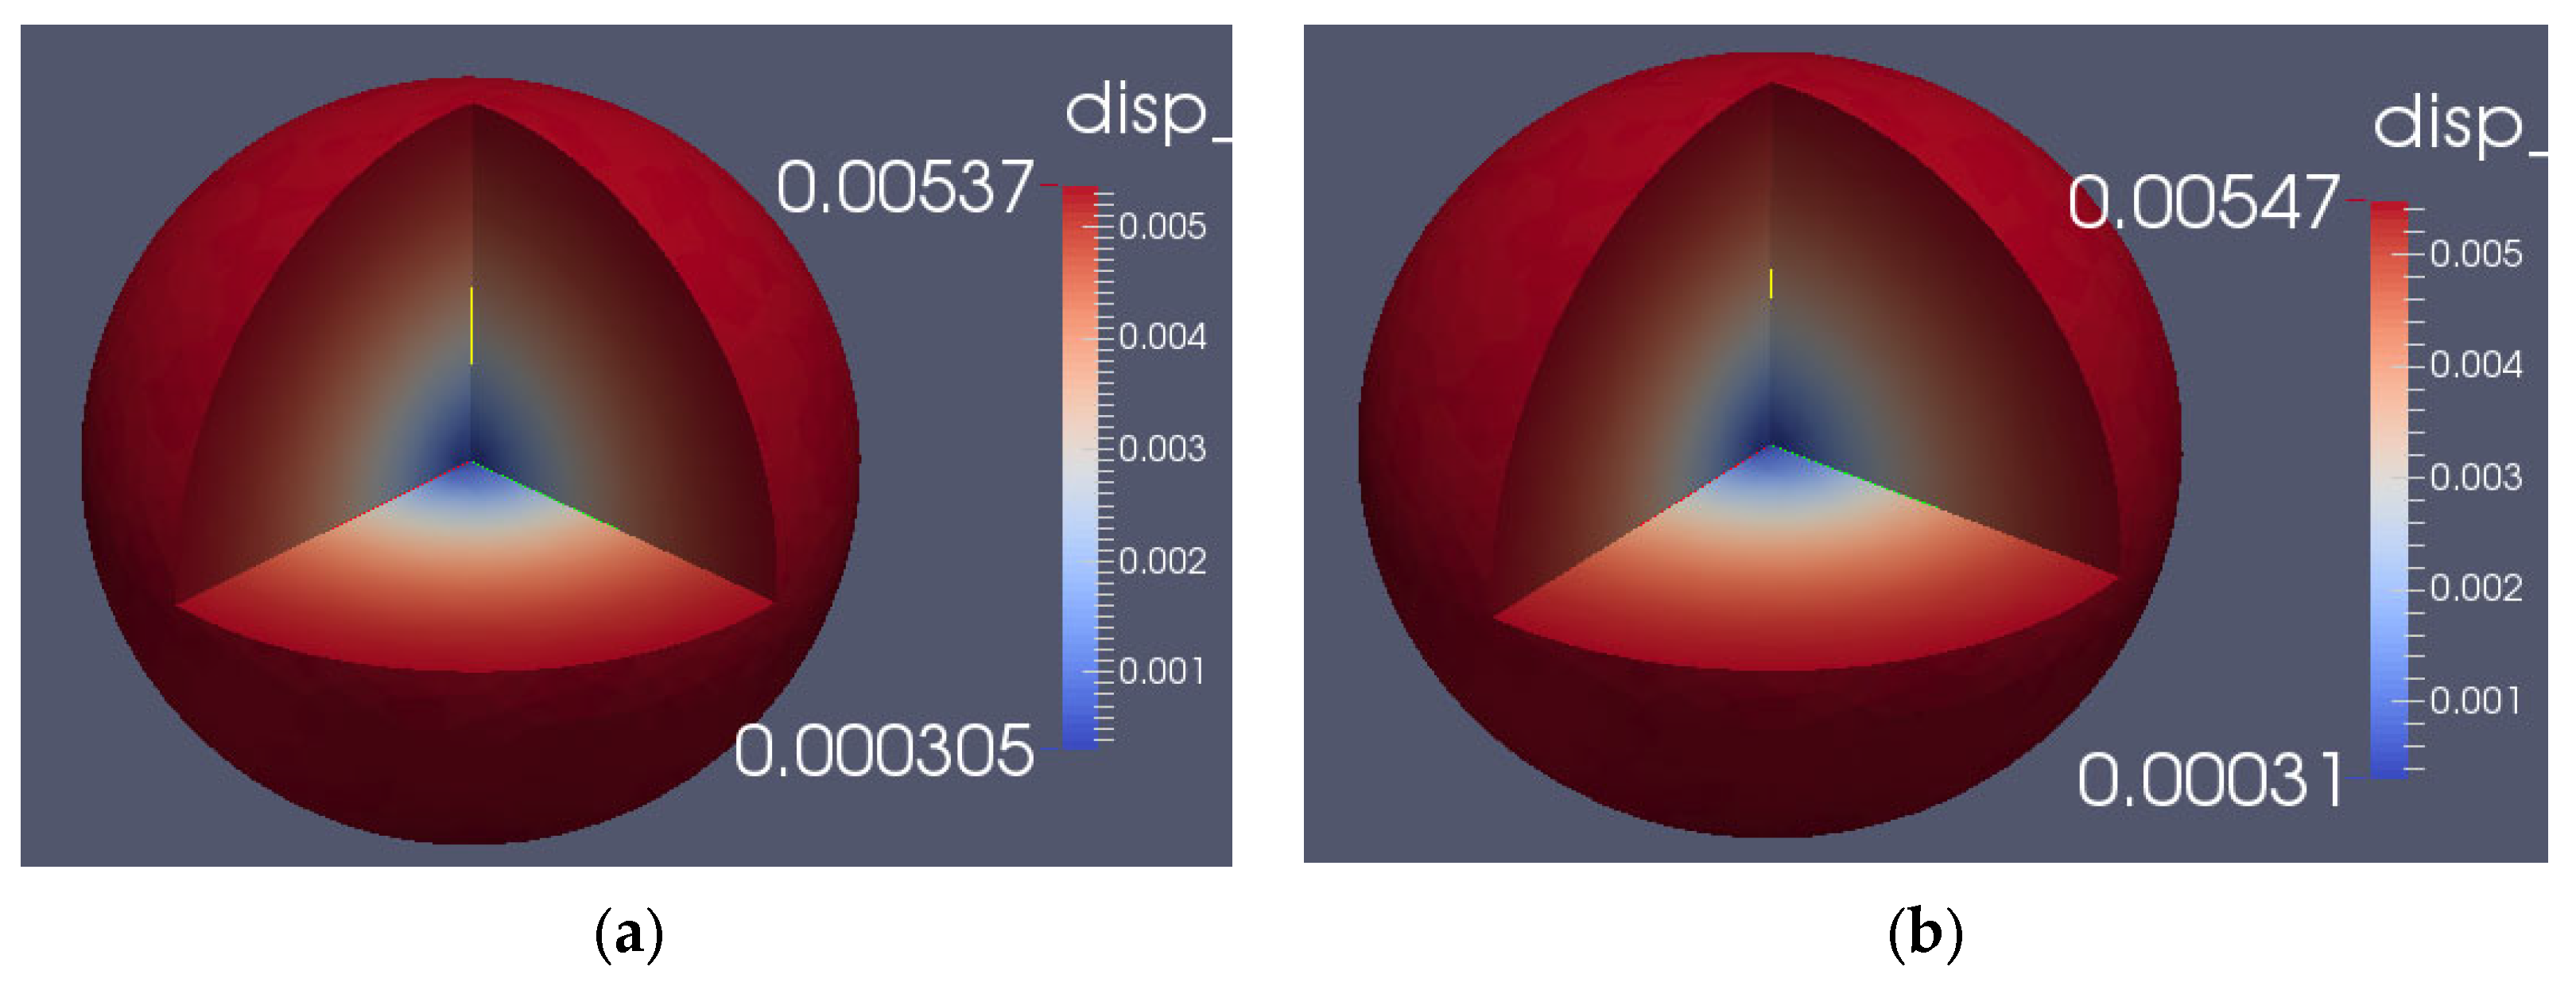
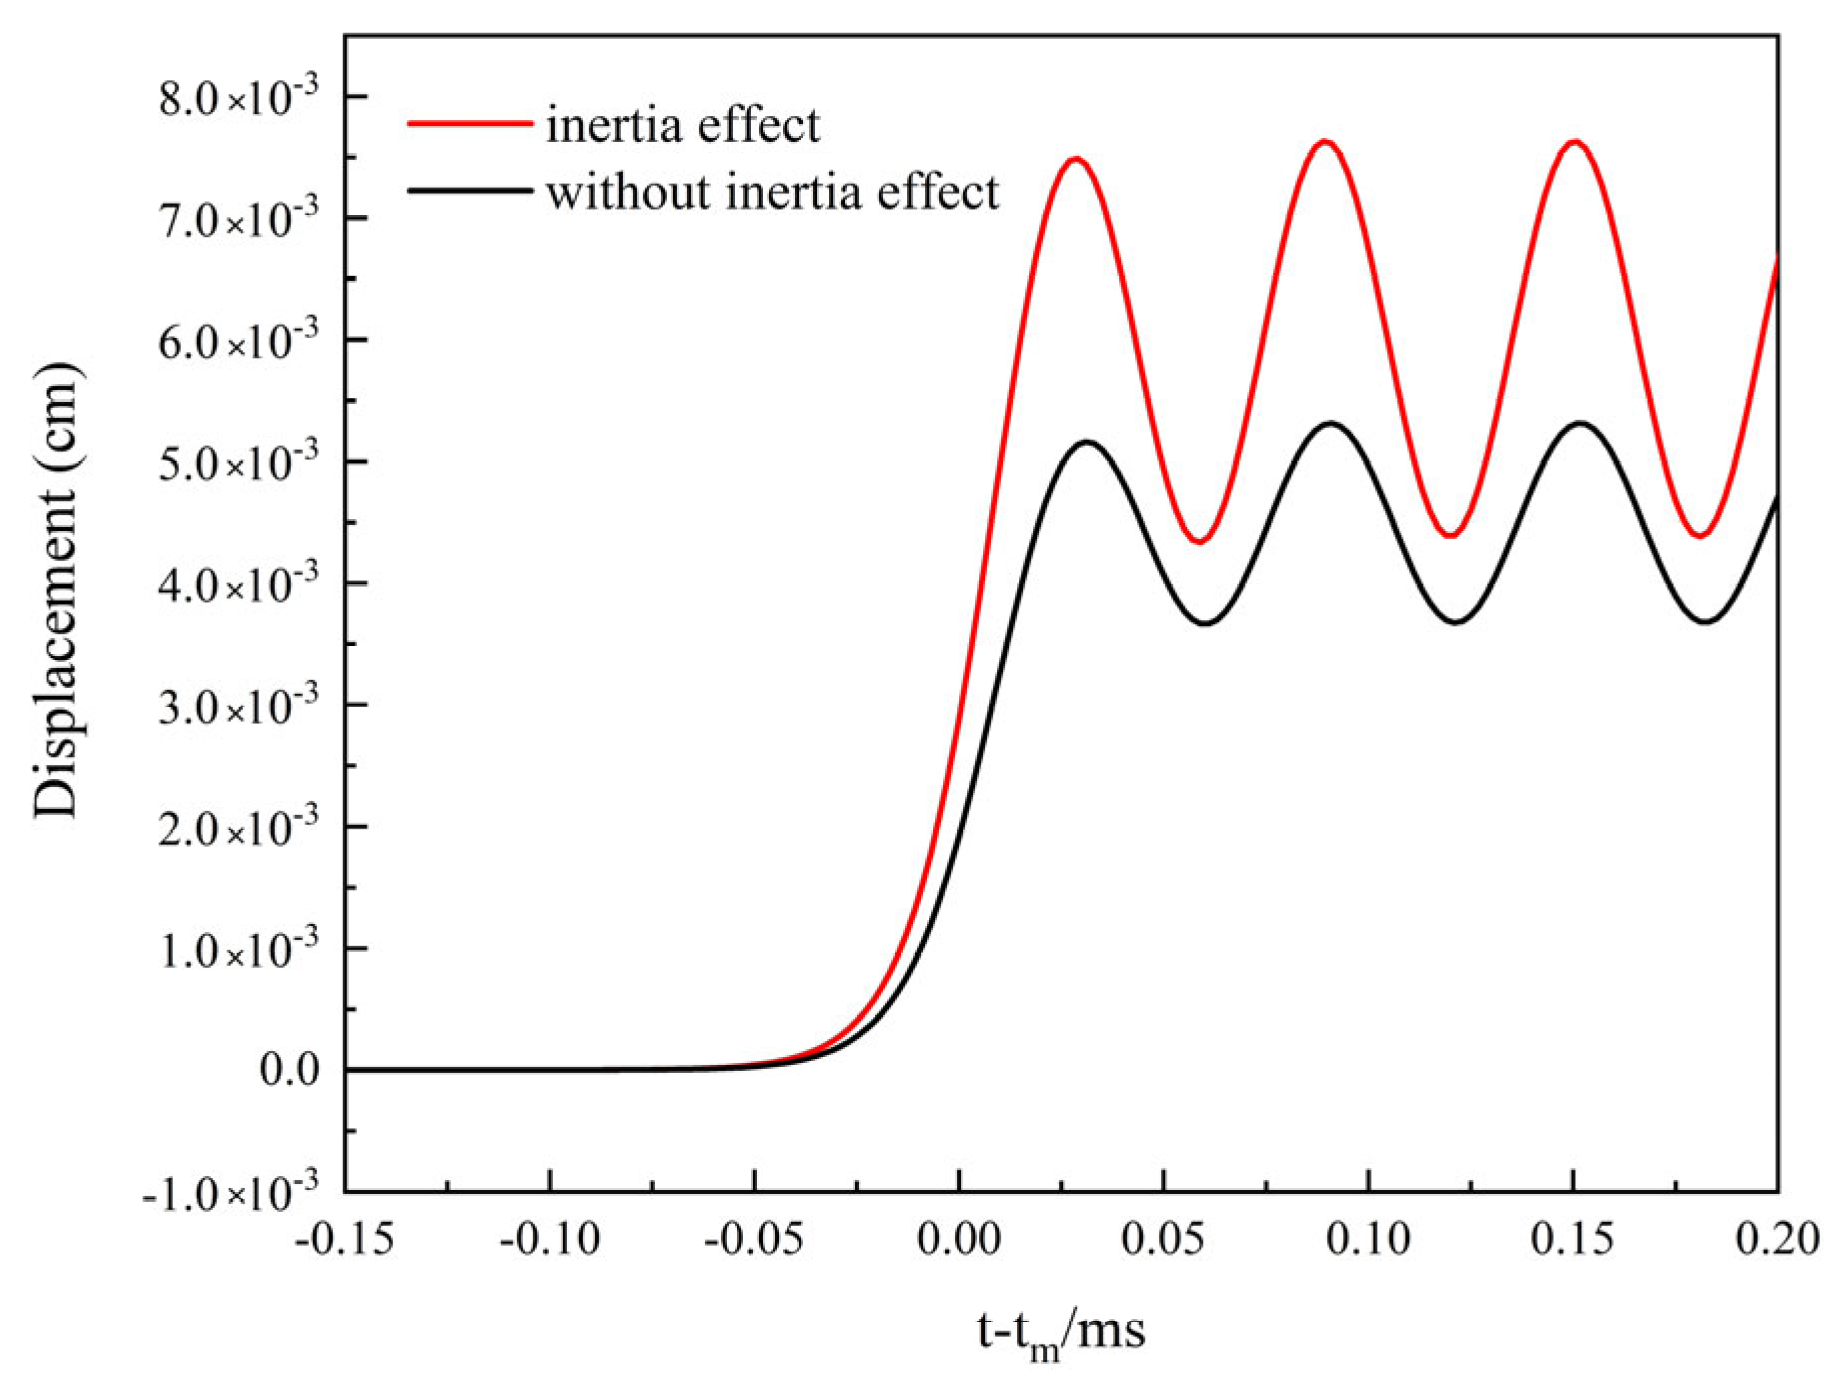
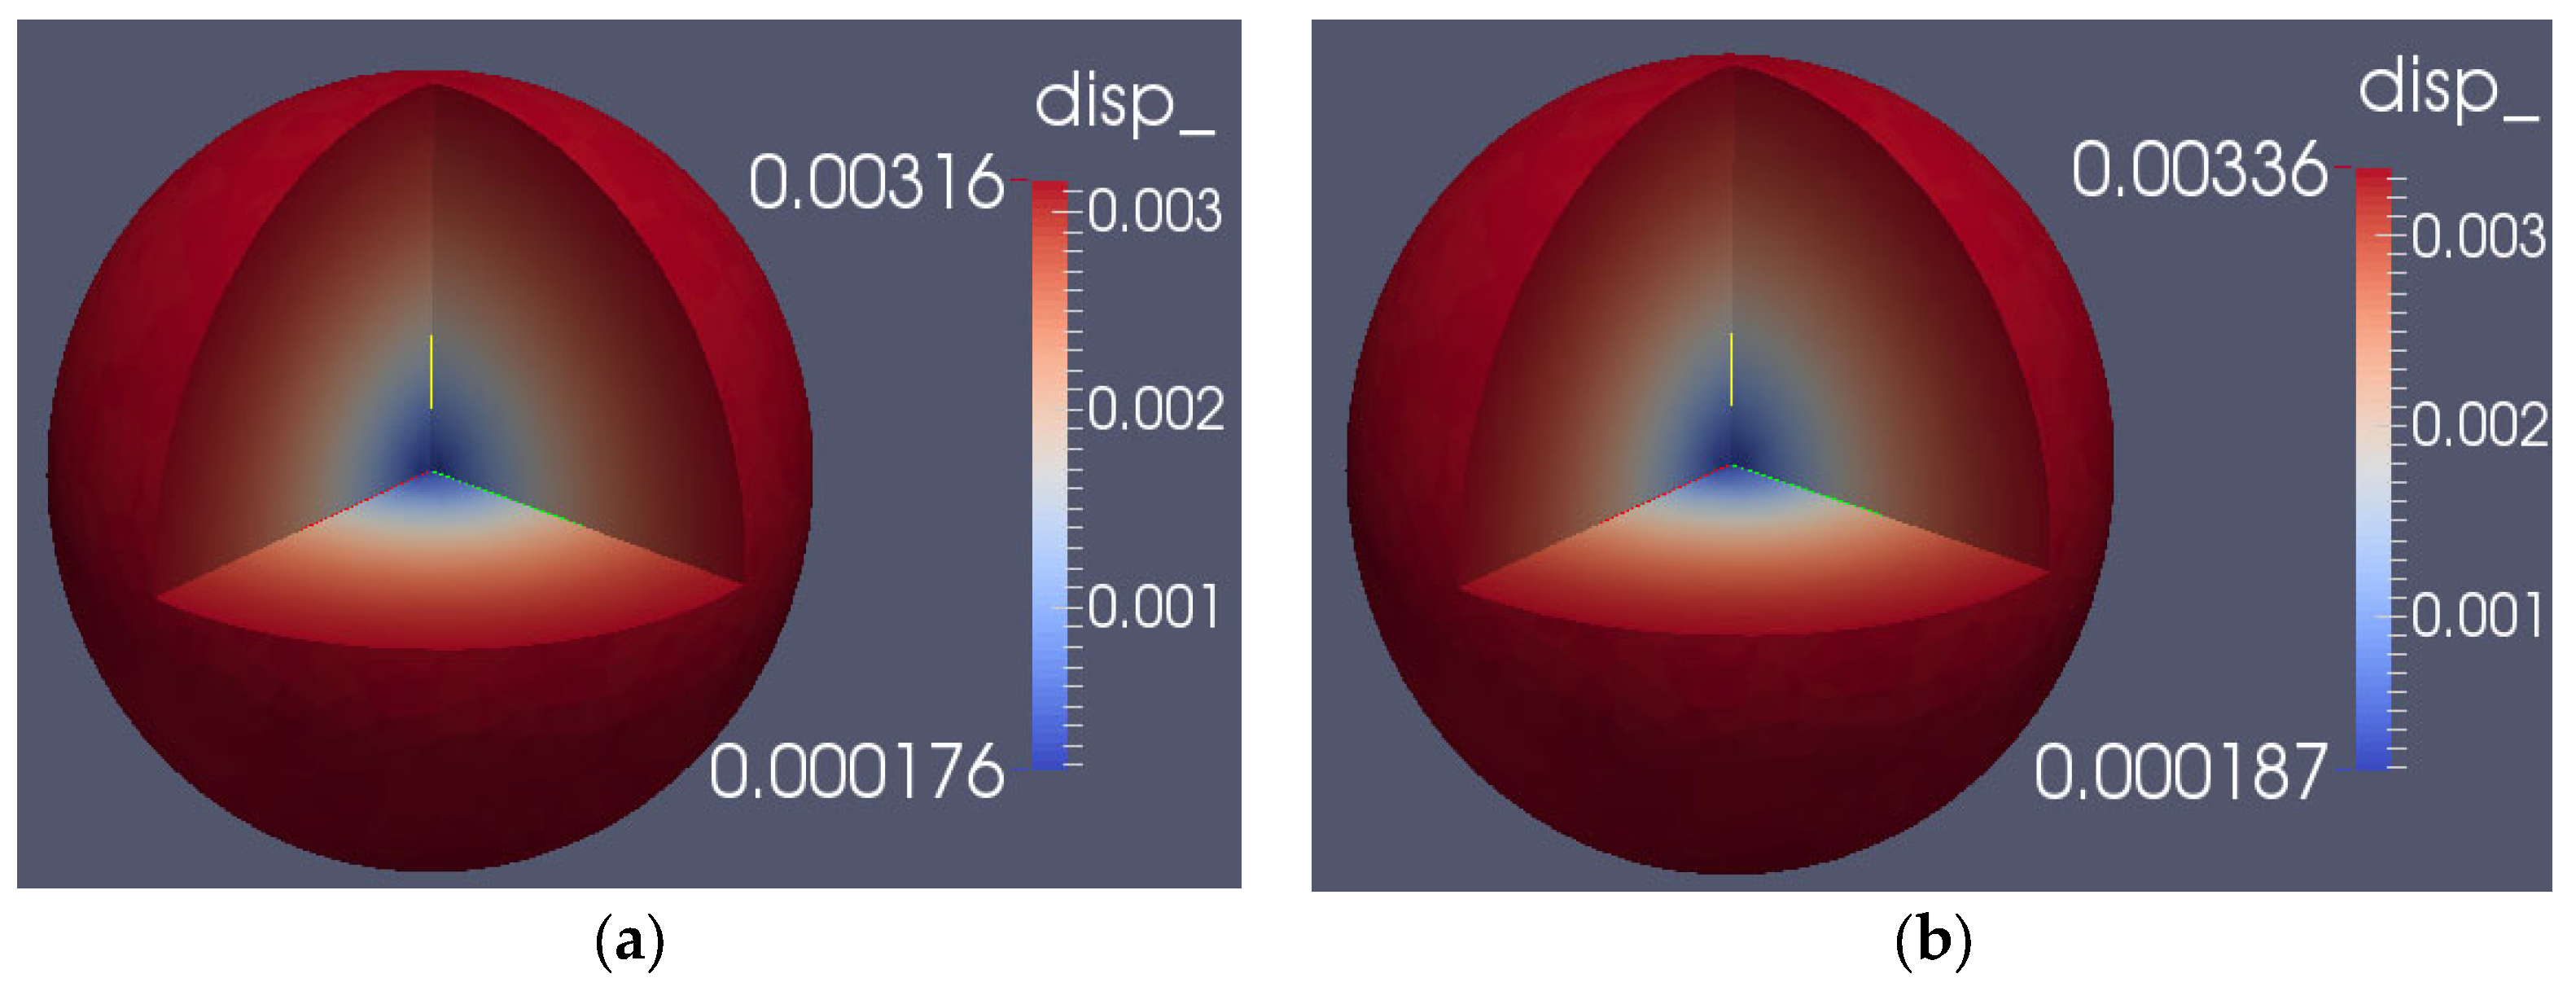
The displacement distribution of the initial pulse period of 16.2 μs is shown in Figure 23. It is observed that the core displacement is minimum at the center and maximum at the surface, which is consistent with the previous calculations for the initial pulse period of 16.2 μs and 29.5 μs. On the other hand, Figure 24 demonstrates the variation of the outer surface displacement with time. The results indicate that the outer surface displacement exhibits an oscillatory variation over time. It is noteworthy that the maximum displacement is 5.32 × 10⁻³ cm when the inertial effect is not taken into account and 7.63 × 10⁻³ cm when it is considered. Consequently, the maximum displacement on the outer surface with the inertia effect is 1.43 times greater than without the inertia effect. Hence, it can be observed that the inclusion of the inertia effect leads to a substantially higher core displacement in comparison to when the inertia effect is not considered.

3.3. Reflected Neutrons of Wall

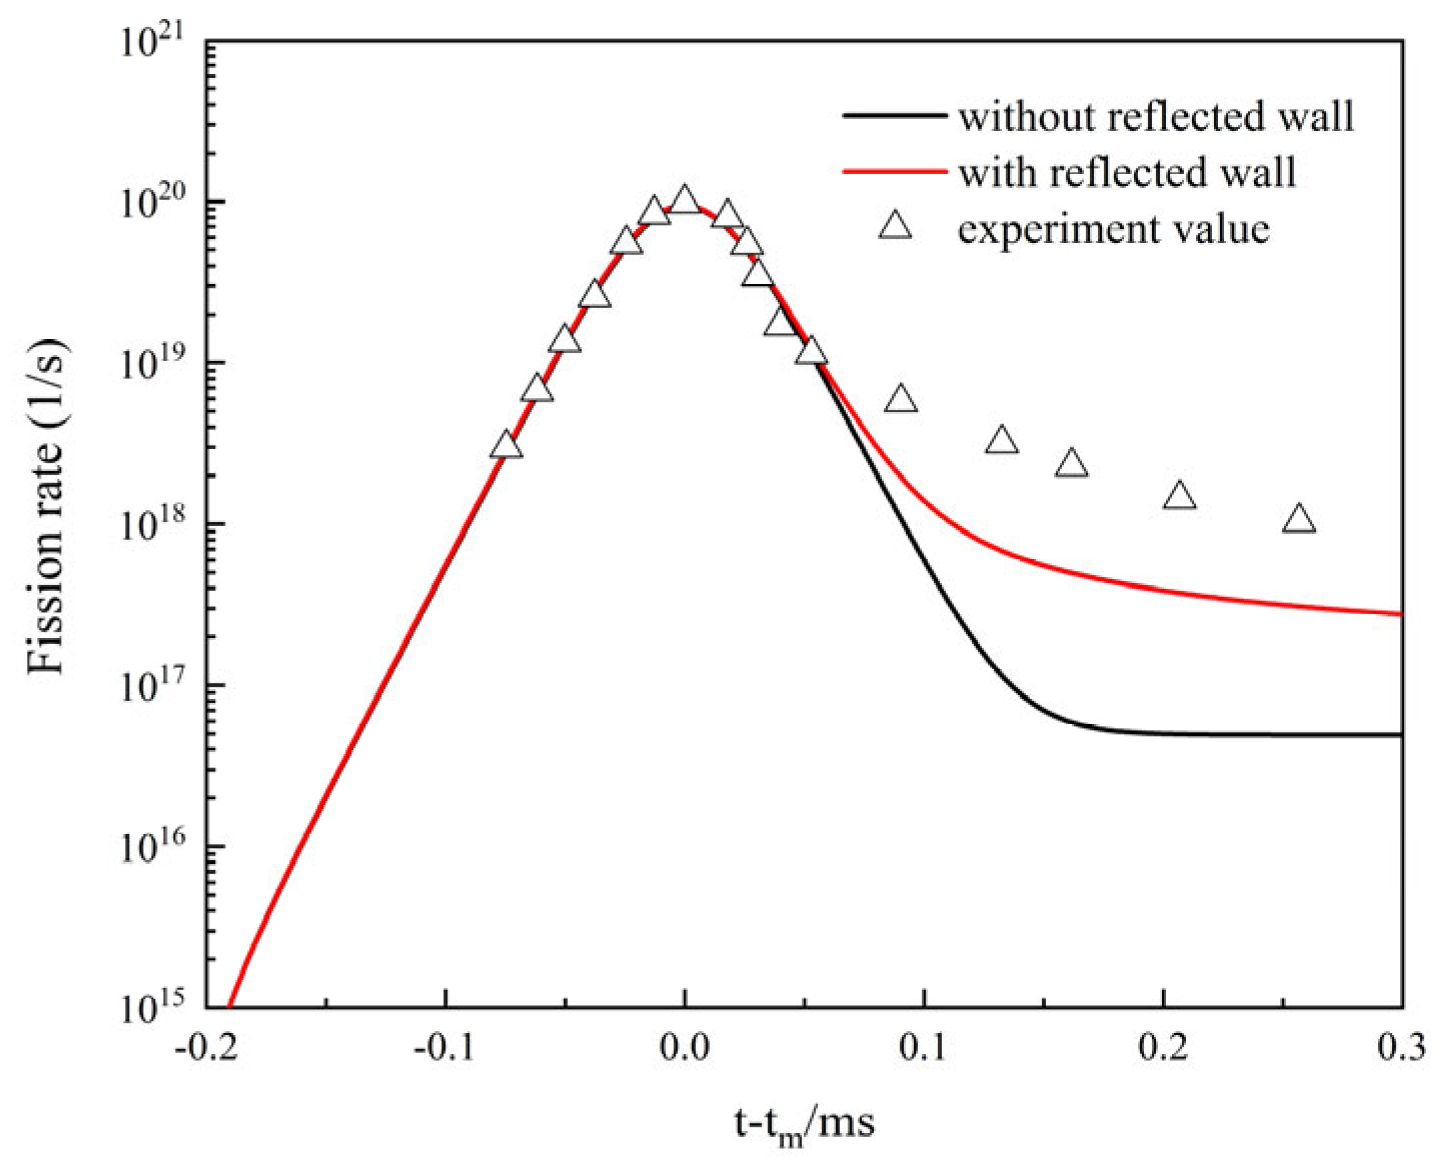
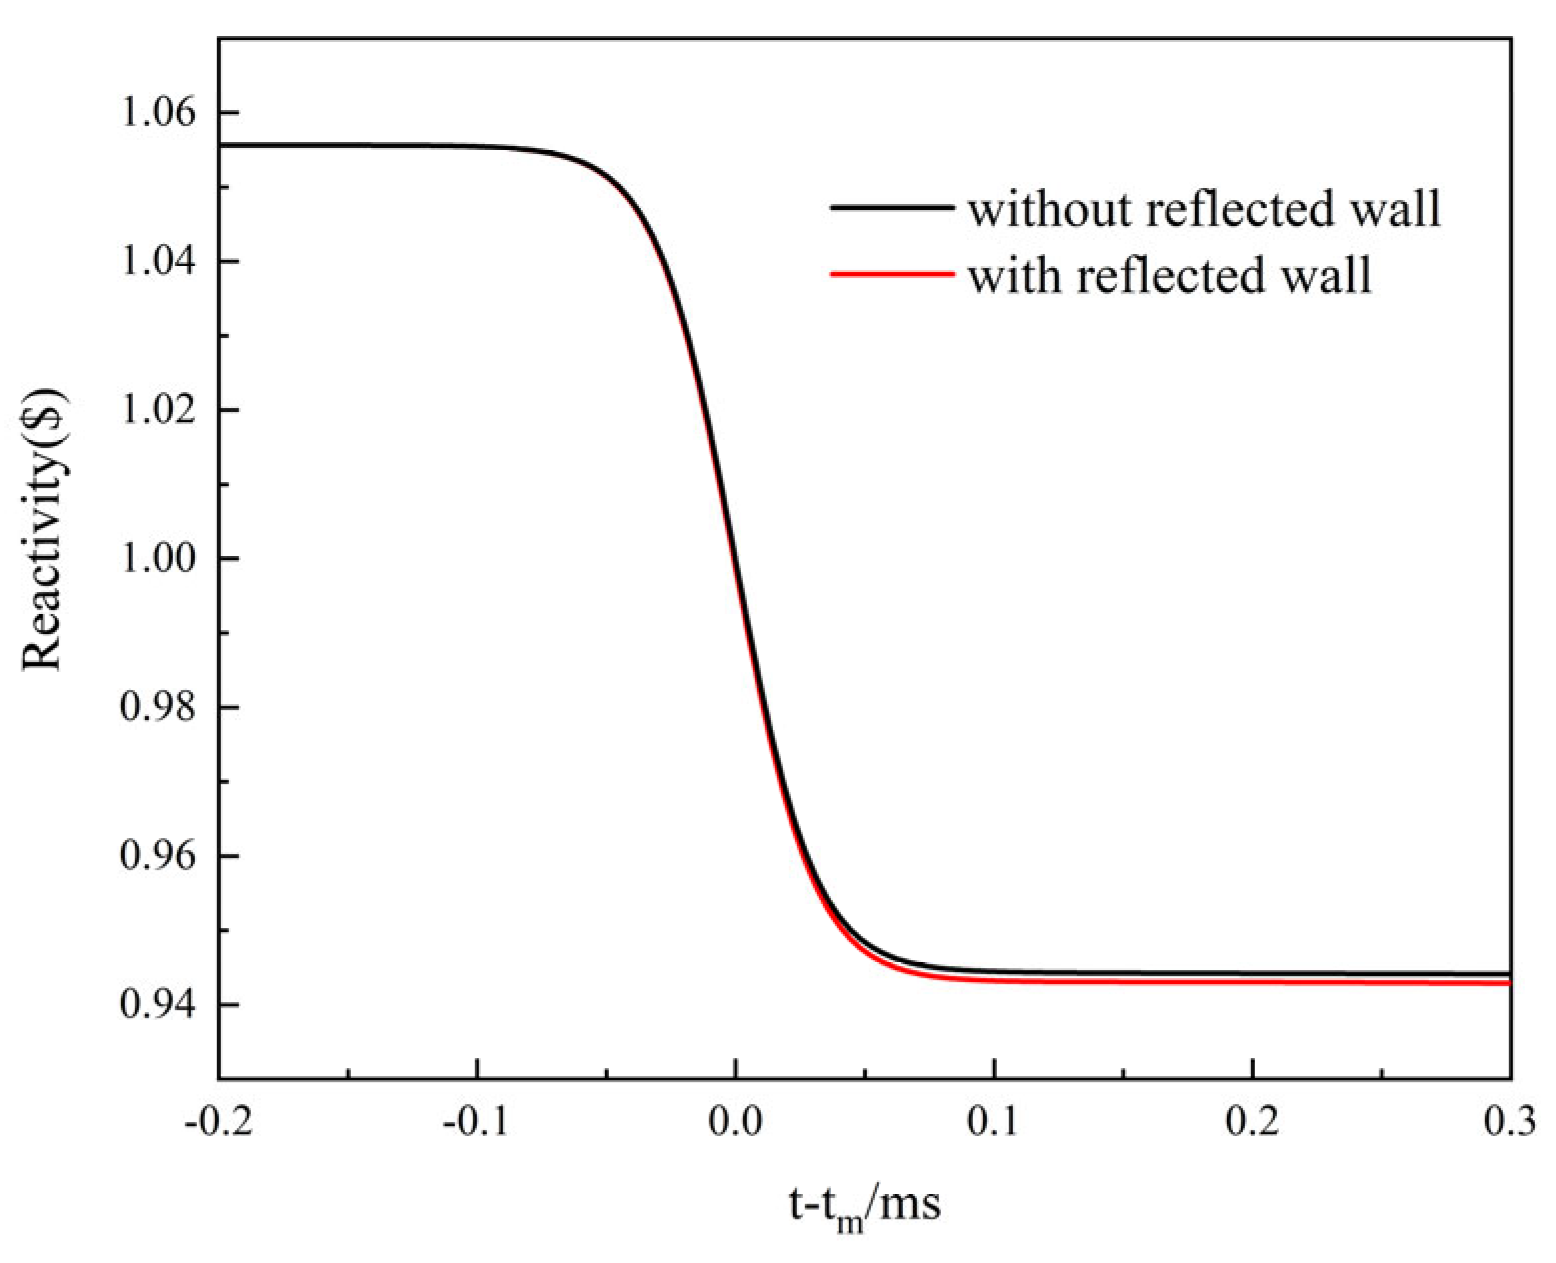
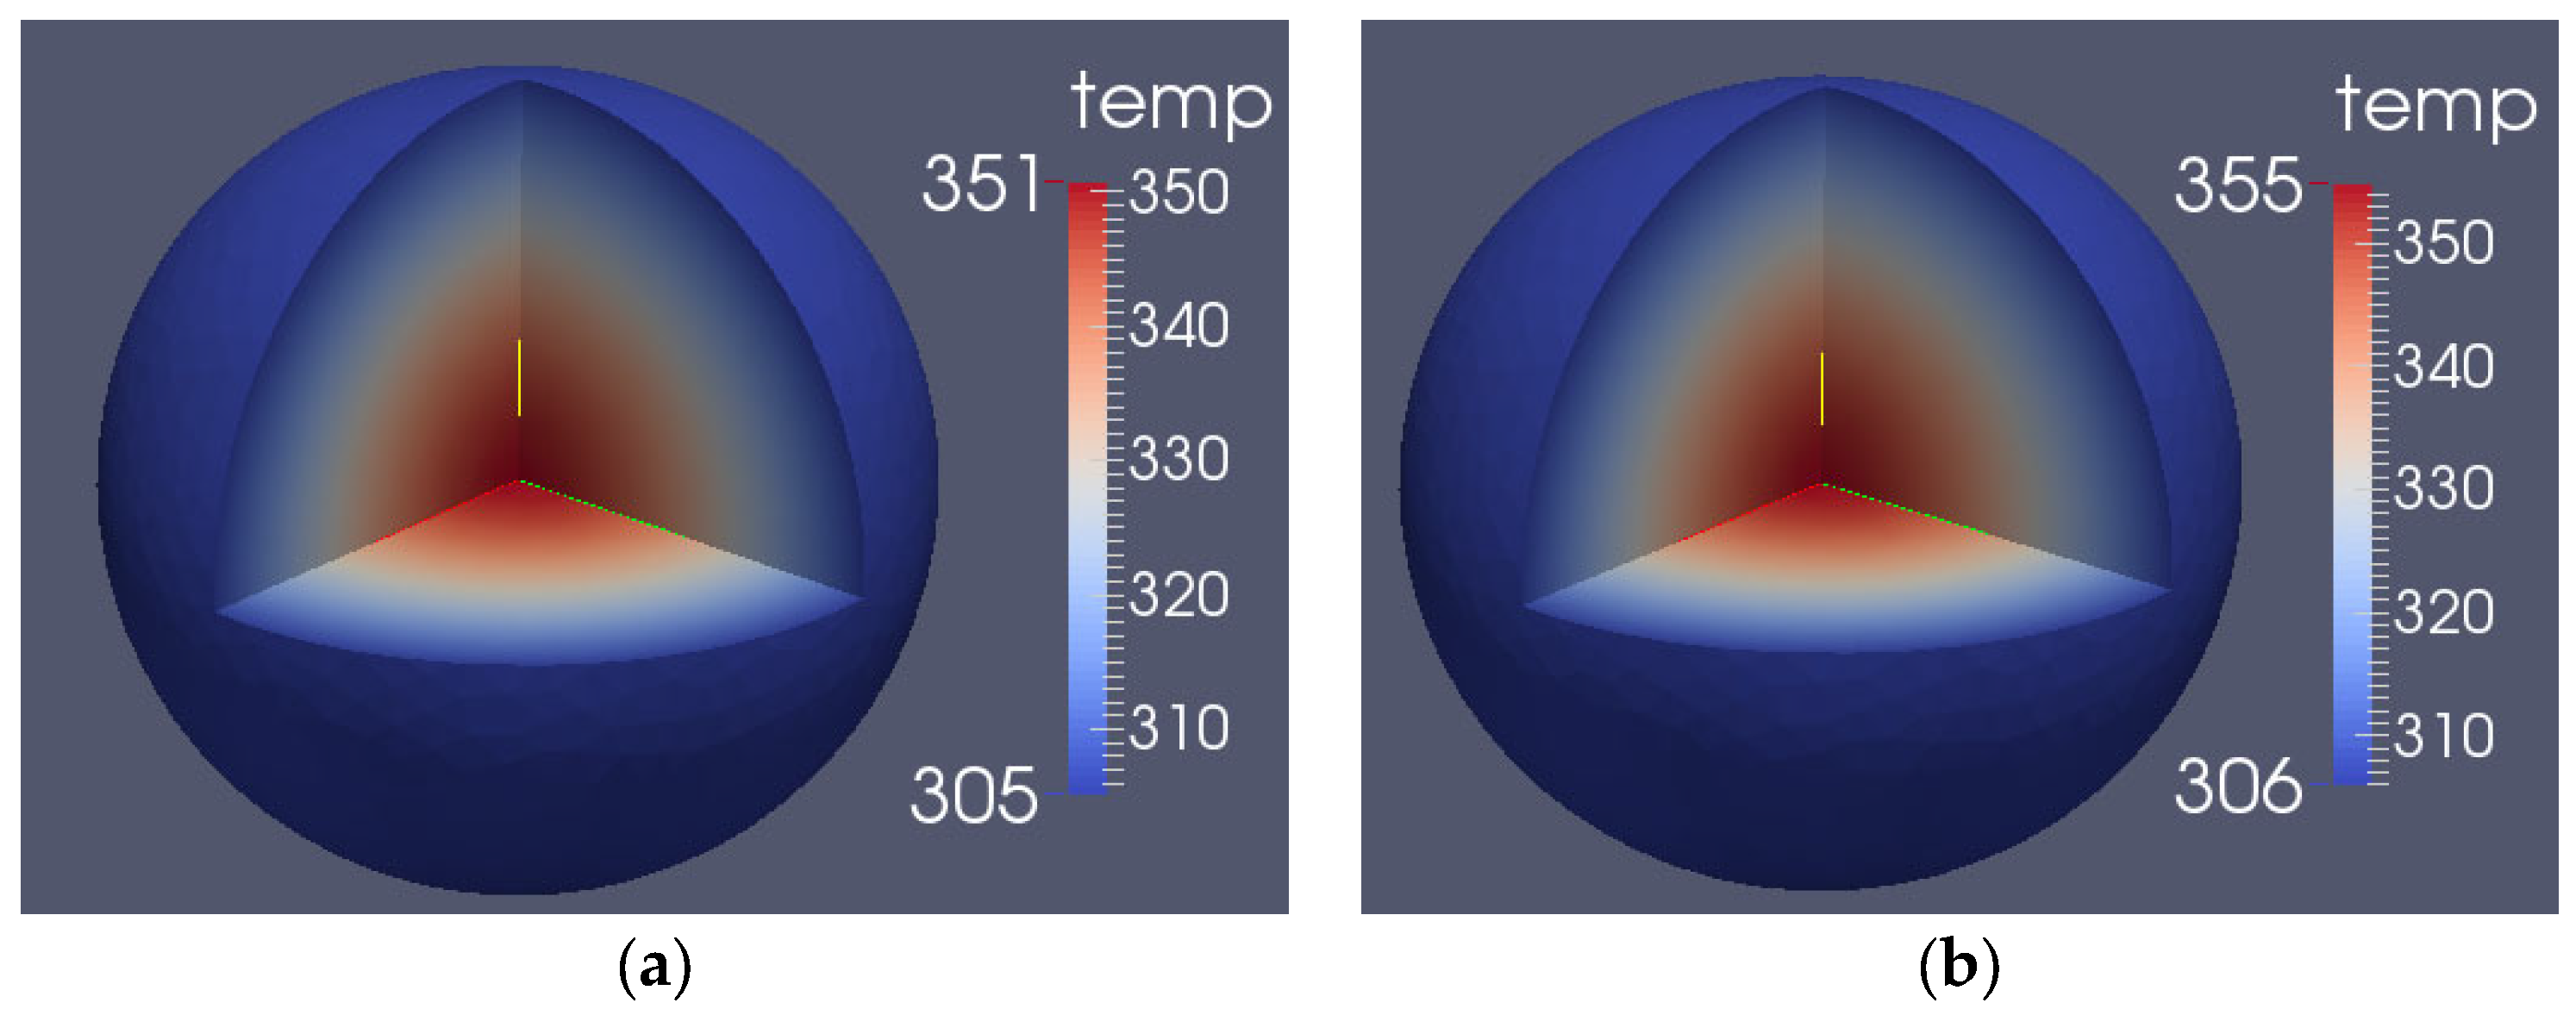
Figure 25 compares the fission rates with the reference values of the initial reactivity period of 16.2 μs. The calculated results, both with and without wall-reflected neutrons, agree well with the experimental values during the increase in fission rate. However, when the fission rate decreases, considering the reflected neutrons of the wall significantly increases the trailing edge of the fission rate. These reflected neutrons also alter the pulse waveform and elevate the pulse ping. Despite the improvement in the pulse trailing edge when considering reflected neutrons compared to the absence of consideration, there is still some error in relation to the experimental value. The primary source of this error lies in the discrepancy between the calculated hall arrangement and the actual Godiva-I pulsed reactor hall. The hall arrangement affects the return of reflected neutrons to the core, subsequently influencing the waveform. Figure 26 illustrates the variation of system reactivity over time. The results indicate that, after considering the reflected neutrons, the reactivity during the fission rate smoothing phase (punching ping) is slightly lower than when reflected neutrons from the walls are not taken into account. This minor difference suggests that reactivity is influenced by multiple physical phenomena, whereas the fission rate is not. Therefore, it is crucial to consider reflected neutrons in the overall analysis, as the fission rate is the primary and most important value for the nuclear-thermal-mechanical coupling of nuclear metal devices. Figure 27 displays the temperature distribution with and without reflected neutrons. Upon considering the reflected neutrons, there is a slight increase in both the maximum and minimum temperature of the core during the initial reactivity period of 16.2 μs.
As shown in Figure 27, after considering the reflected neutrons, the average temperature rises of the core at the initial reactivity period 16.2 μs is 27 °C and the maximum temperature rise of the core is 59.6 °C; the temperature rises of the core after considering the reflected neutrons of the wall is about 1.1 times higher.
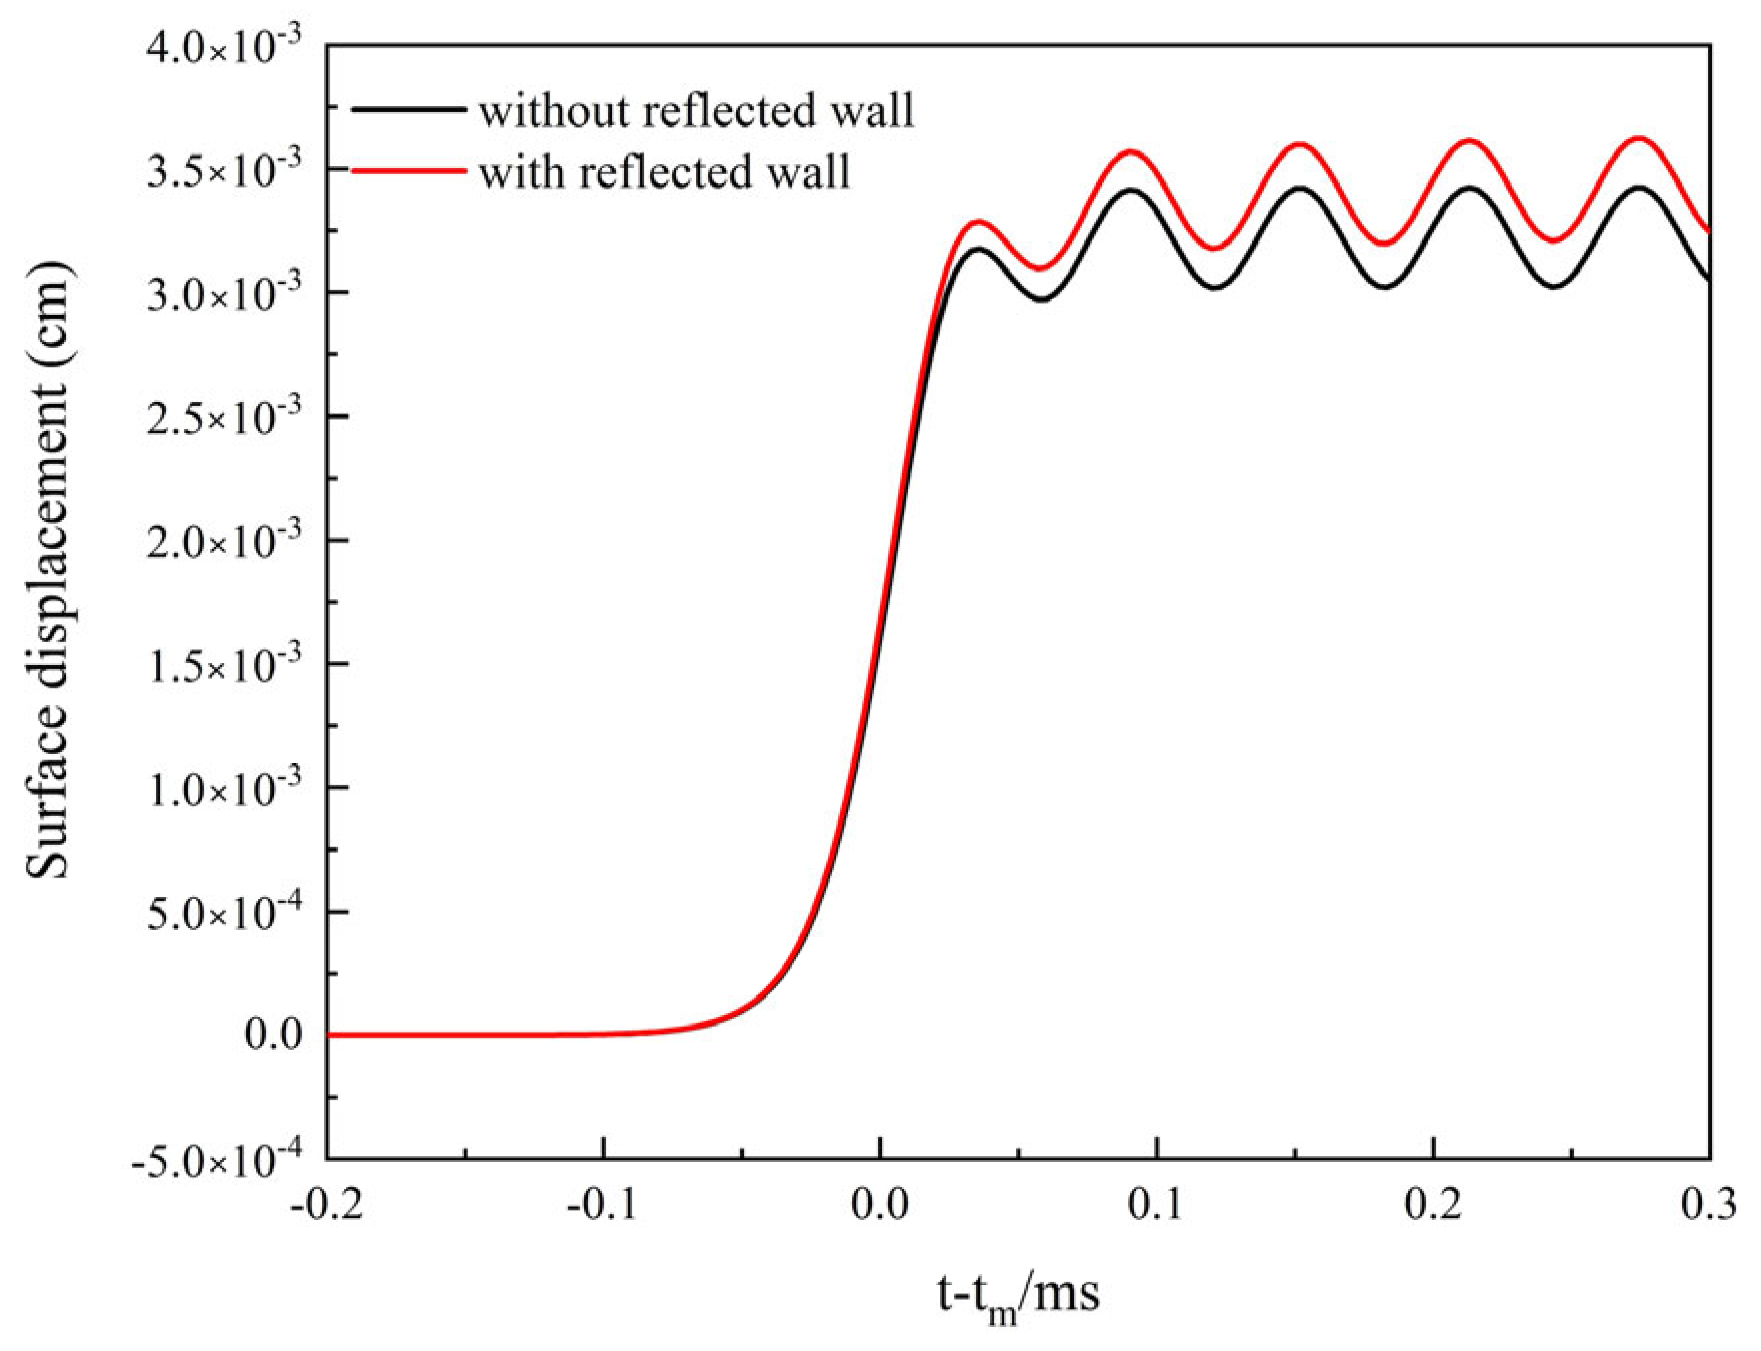
The displacement distribution of the initial reactivity period of 16.2 μs is shown in Figure 28 after considering the reflected neutrons. The core exhibits the same displacement expansion trend as when the reflected neutrons from the walls are not considered. Figure 29 demonstrates a significant oscillation in the core. The maximum surface displacement for the initial reactivity period of 16.2 μs is 3.63 × 10⁻³ cm, whereas the maximum surface displacement without considering the reflected neutrons is 3.42 × 10⁻³ cm. In summary, the inclusion of reflected neutrons leads to a slowdown in pulse trailing edge decay, an increase in pulse ping power, an expansion of pulse width, and a rise in fission yield. Additionally, considering reflected neutrons results in an increase in core temperature, stress, and displacement compared to not considering reflected neutrons.

3.4. Sensitivity Analysis

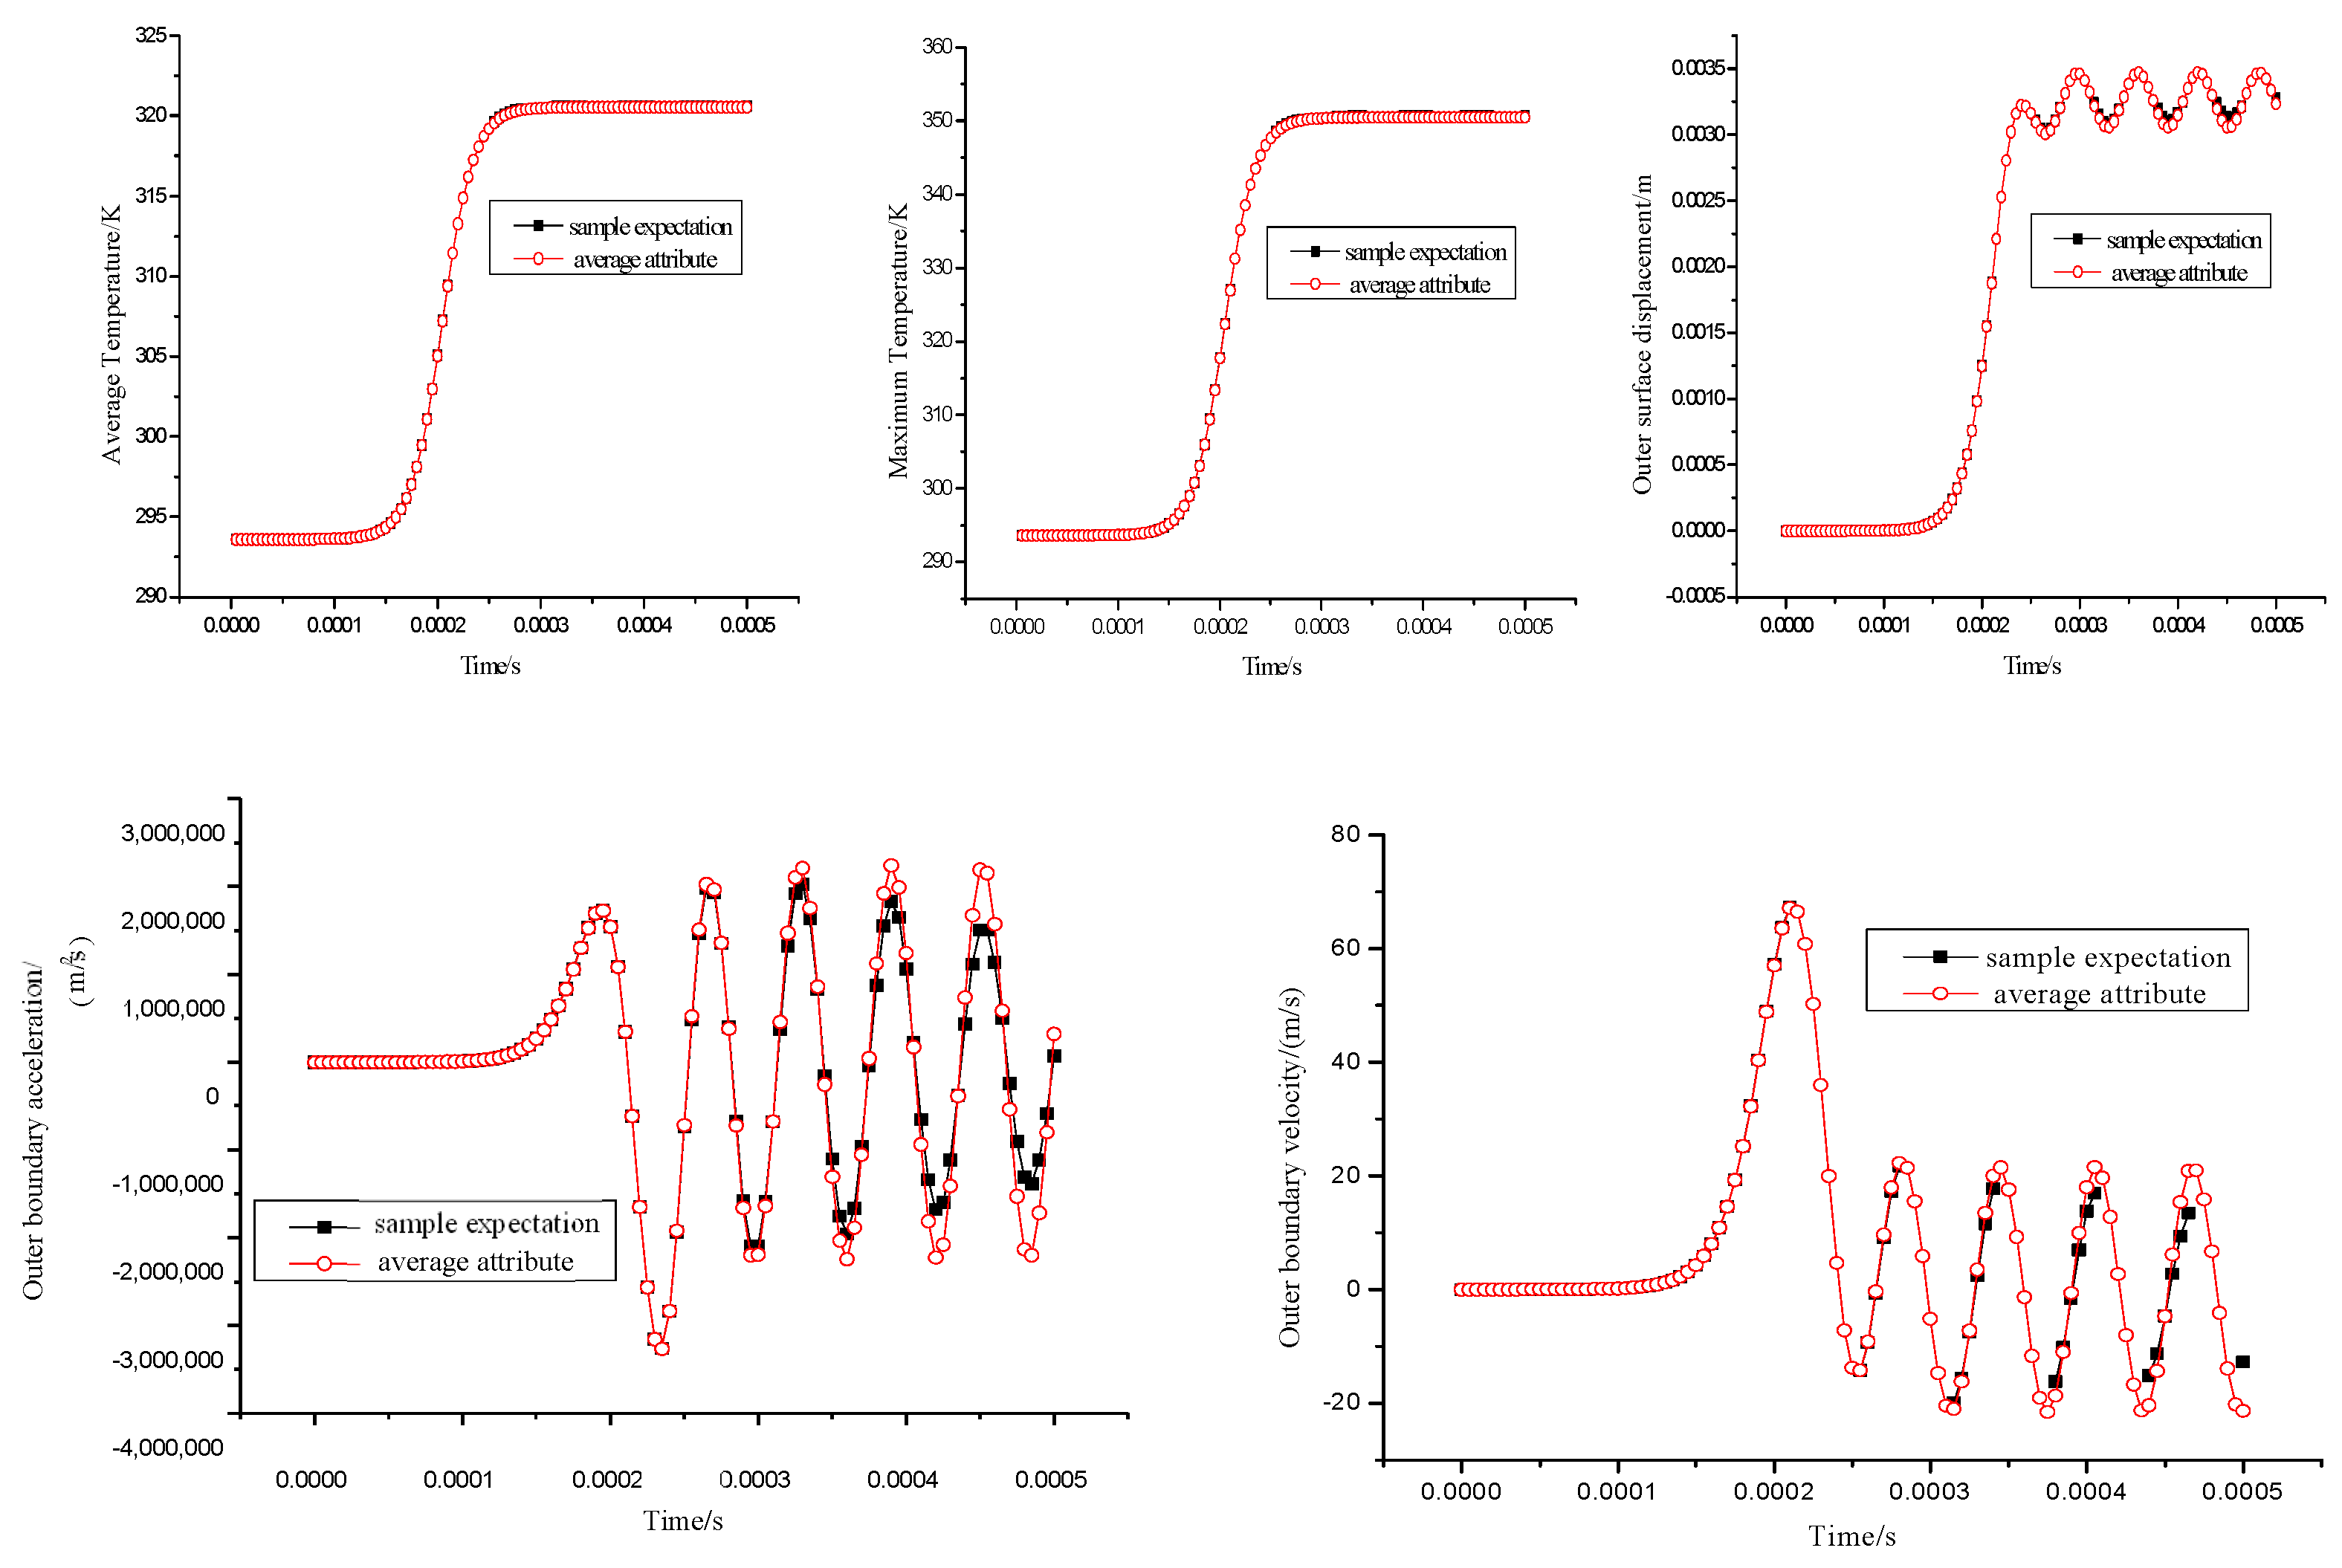
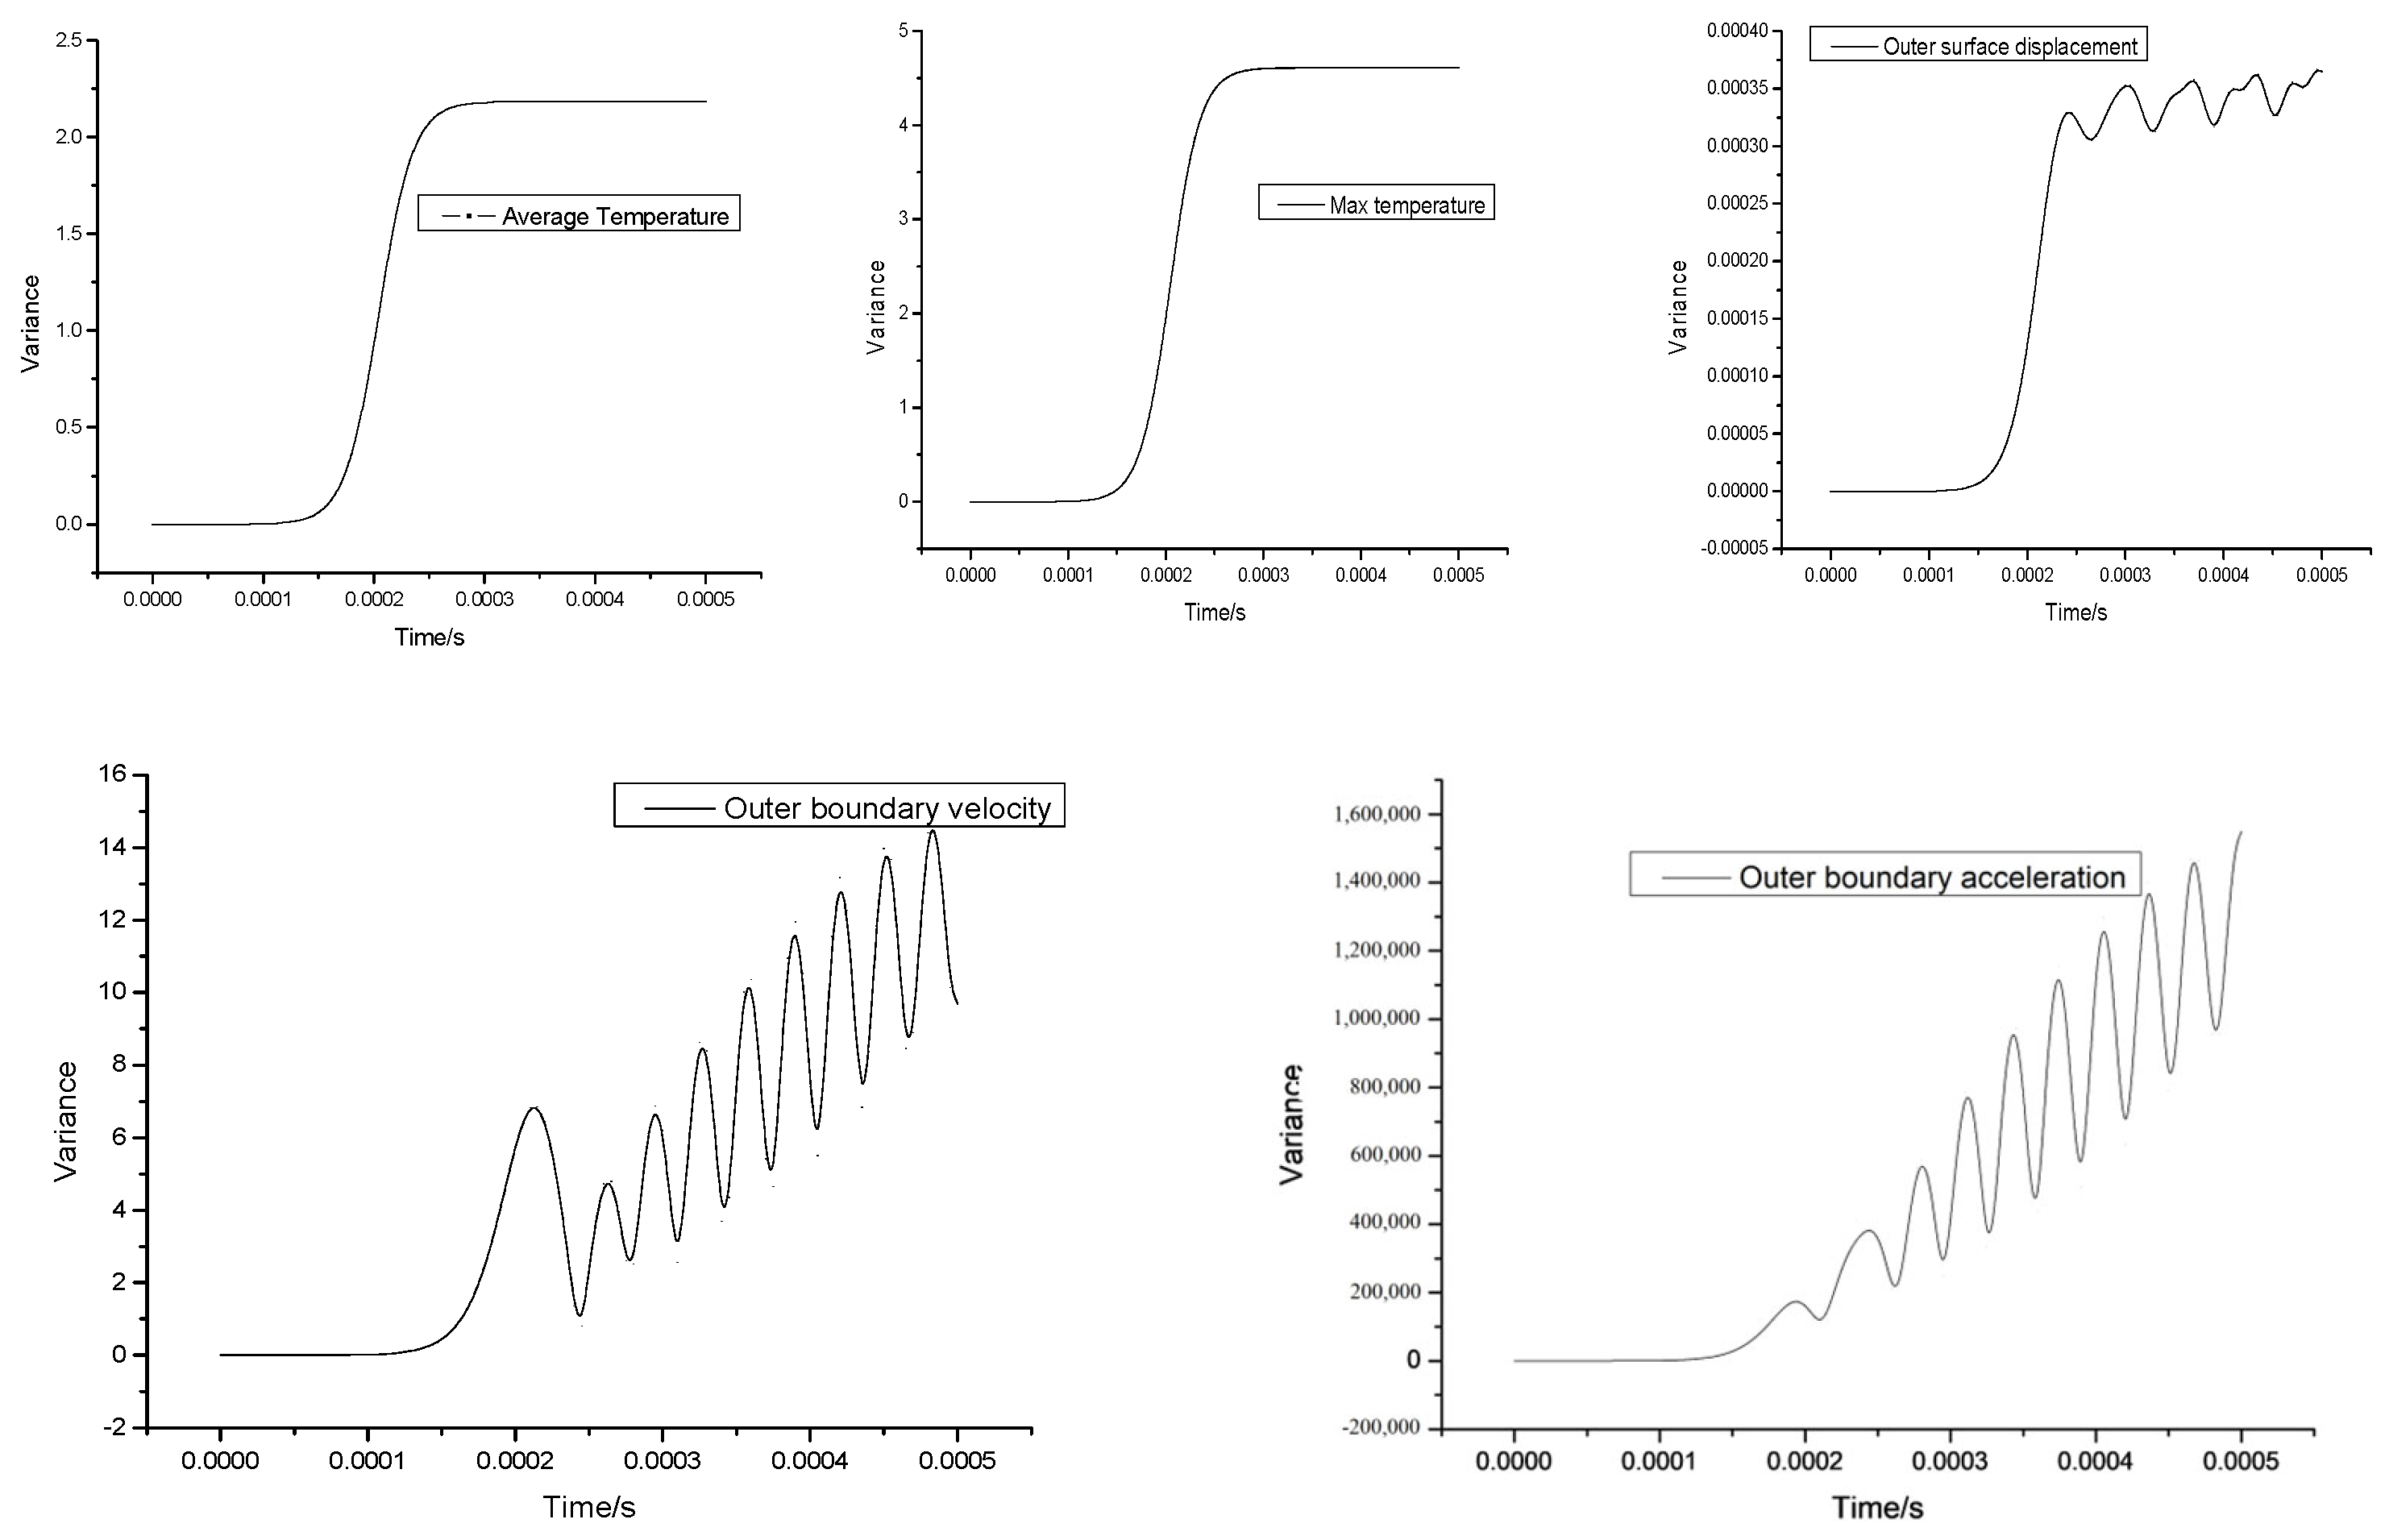
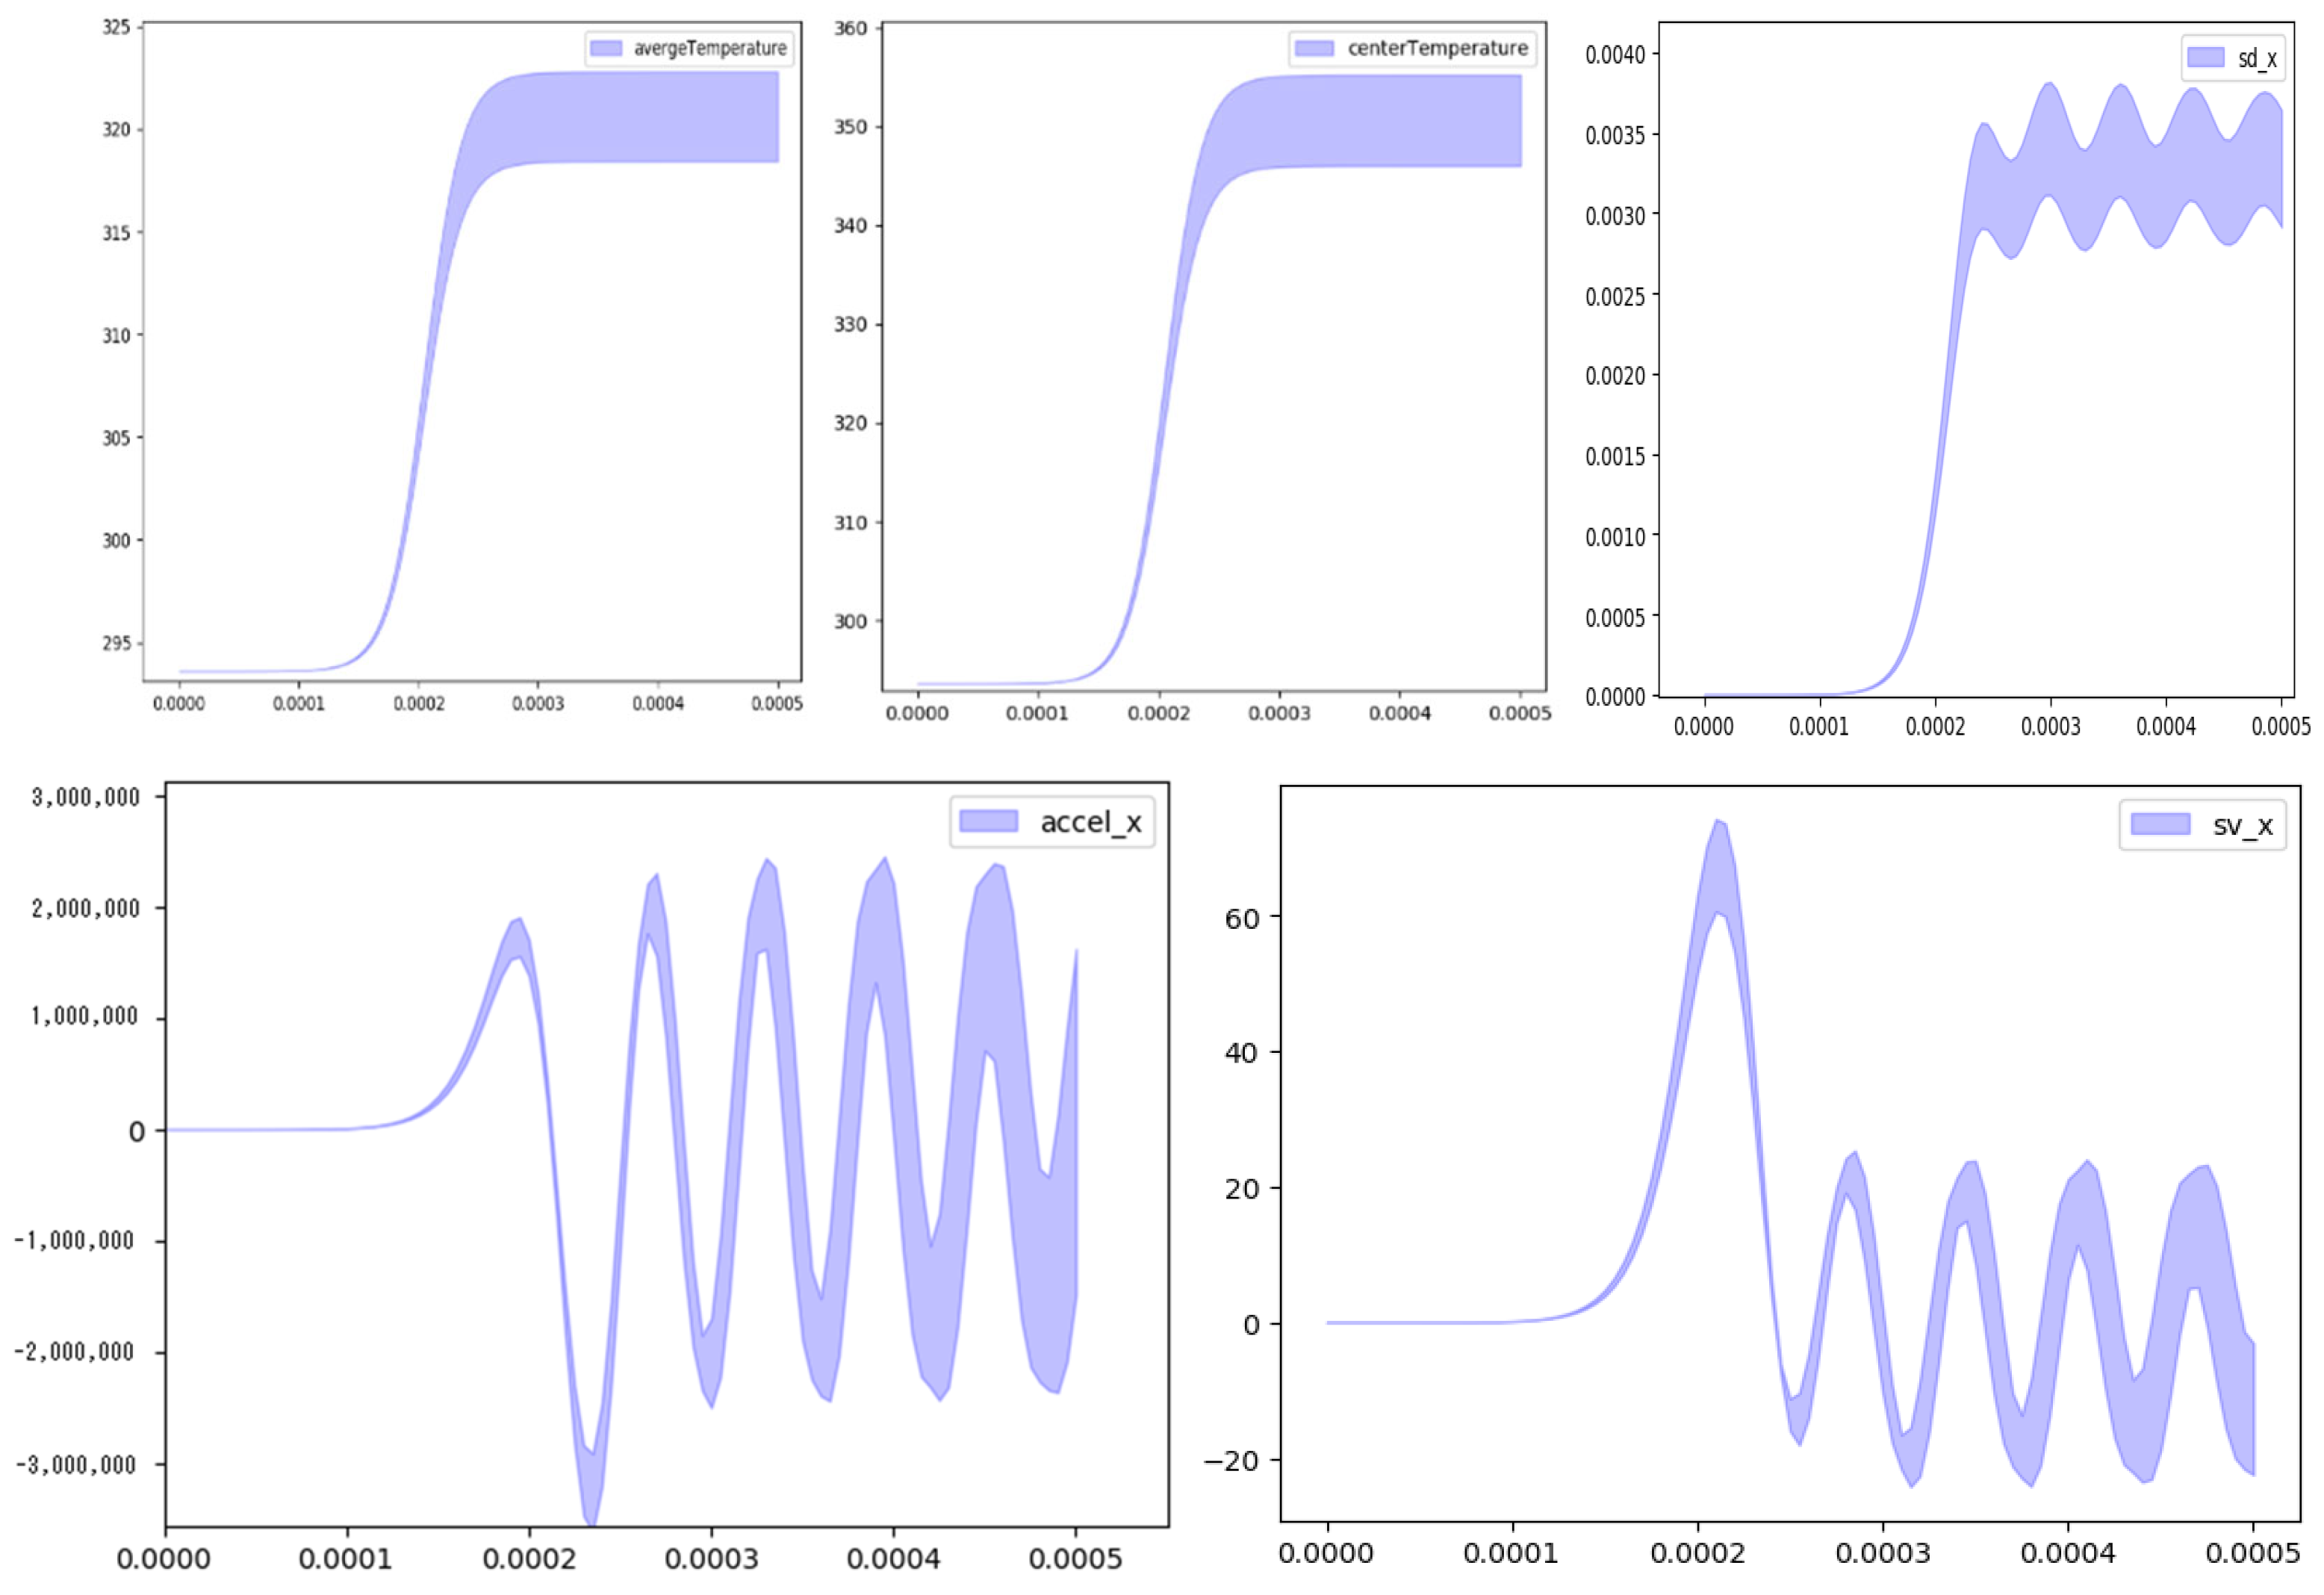
The five response quantities perturbed according to the material properties described in 1.4 are the average temperature of the sphere, the maximum temperature of the sphere, the outer surface displacement, the outer surface velocity, and the outer surface acceleration. The time-dependent statistics of these response quantities are shown in Figure 30. Comparisons were made between the mean values of 1000 samples and the results obtained using the average properties of the material. It was observed that the difference between the velocity and acceleration of the outer boundary and the material properties increased slowly with time. This indicates that the nonlinear effect between the velocity and acceleration of the outer boundary and the material properties becomes stronger over time, primarily due to the inertia effect. The variance of Figure 31 also shows that as time progresses, the uncertainty region of the mean ±1 standard deviation of these five response quantities can be deduced from the variance of Figure 32. It is evident that the uncertainty range of the mean temperature, maximum temperature, and outer boundary displacement remains mostly unchanged as time extrapolates. However, the uncertainty region of the outer boundary velocity and acceleration will continuously expand with time.
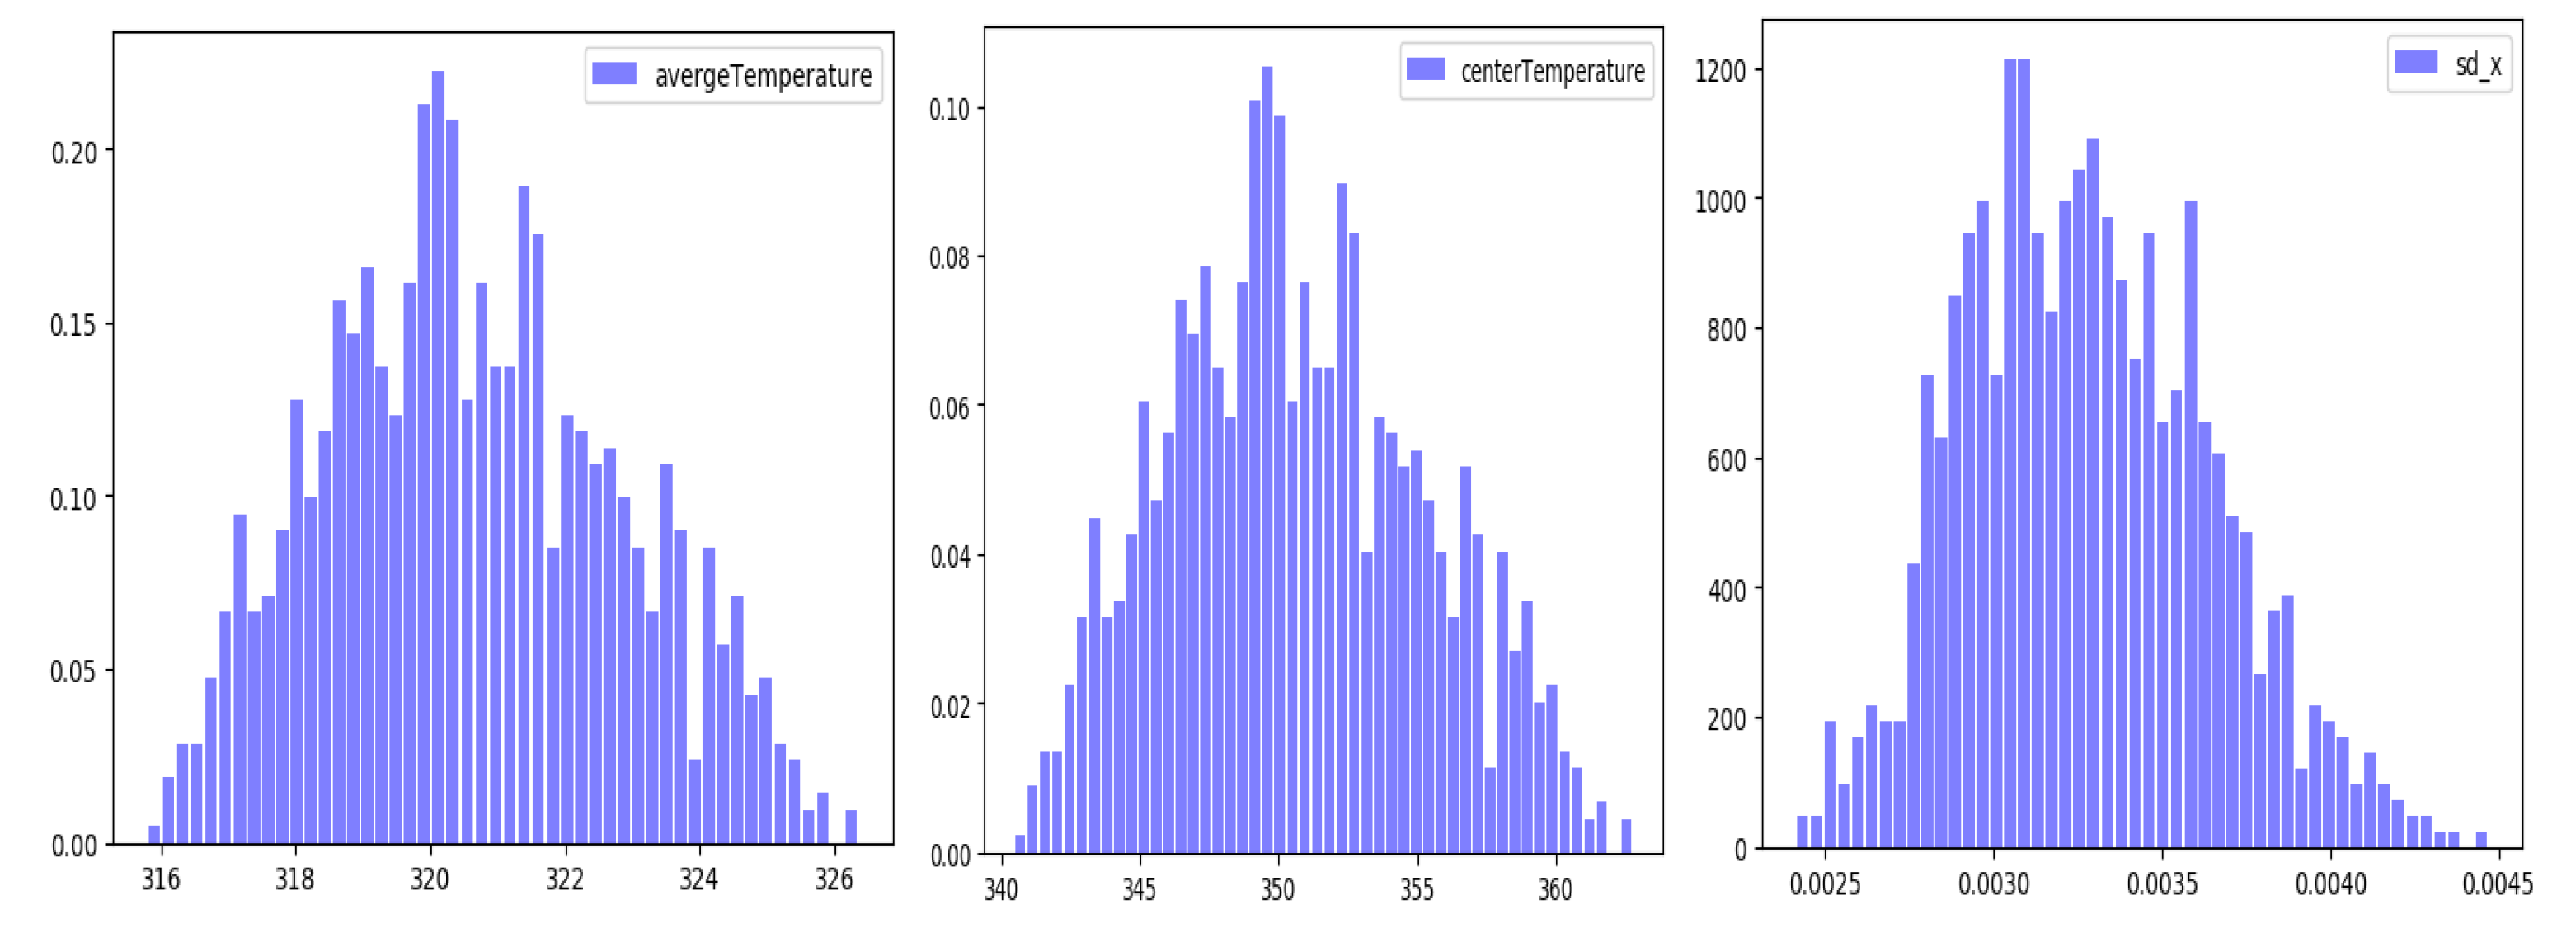
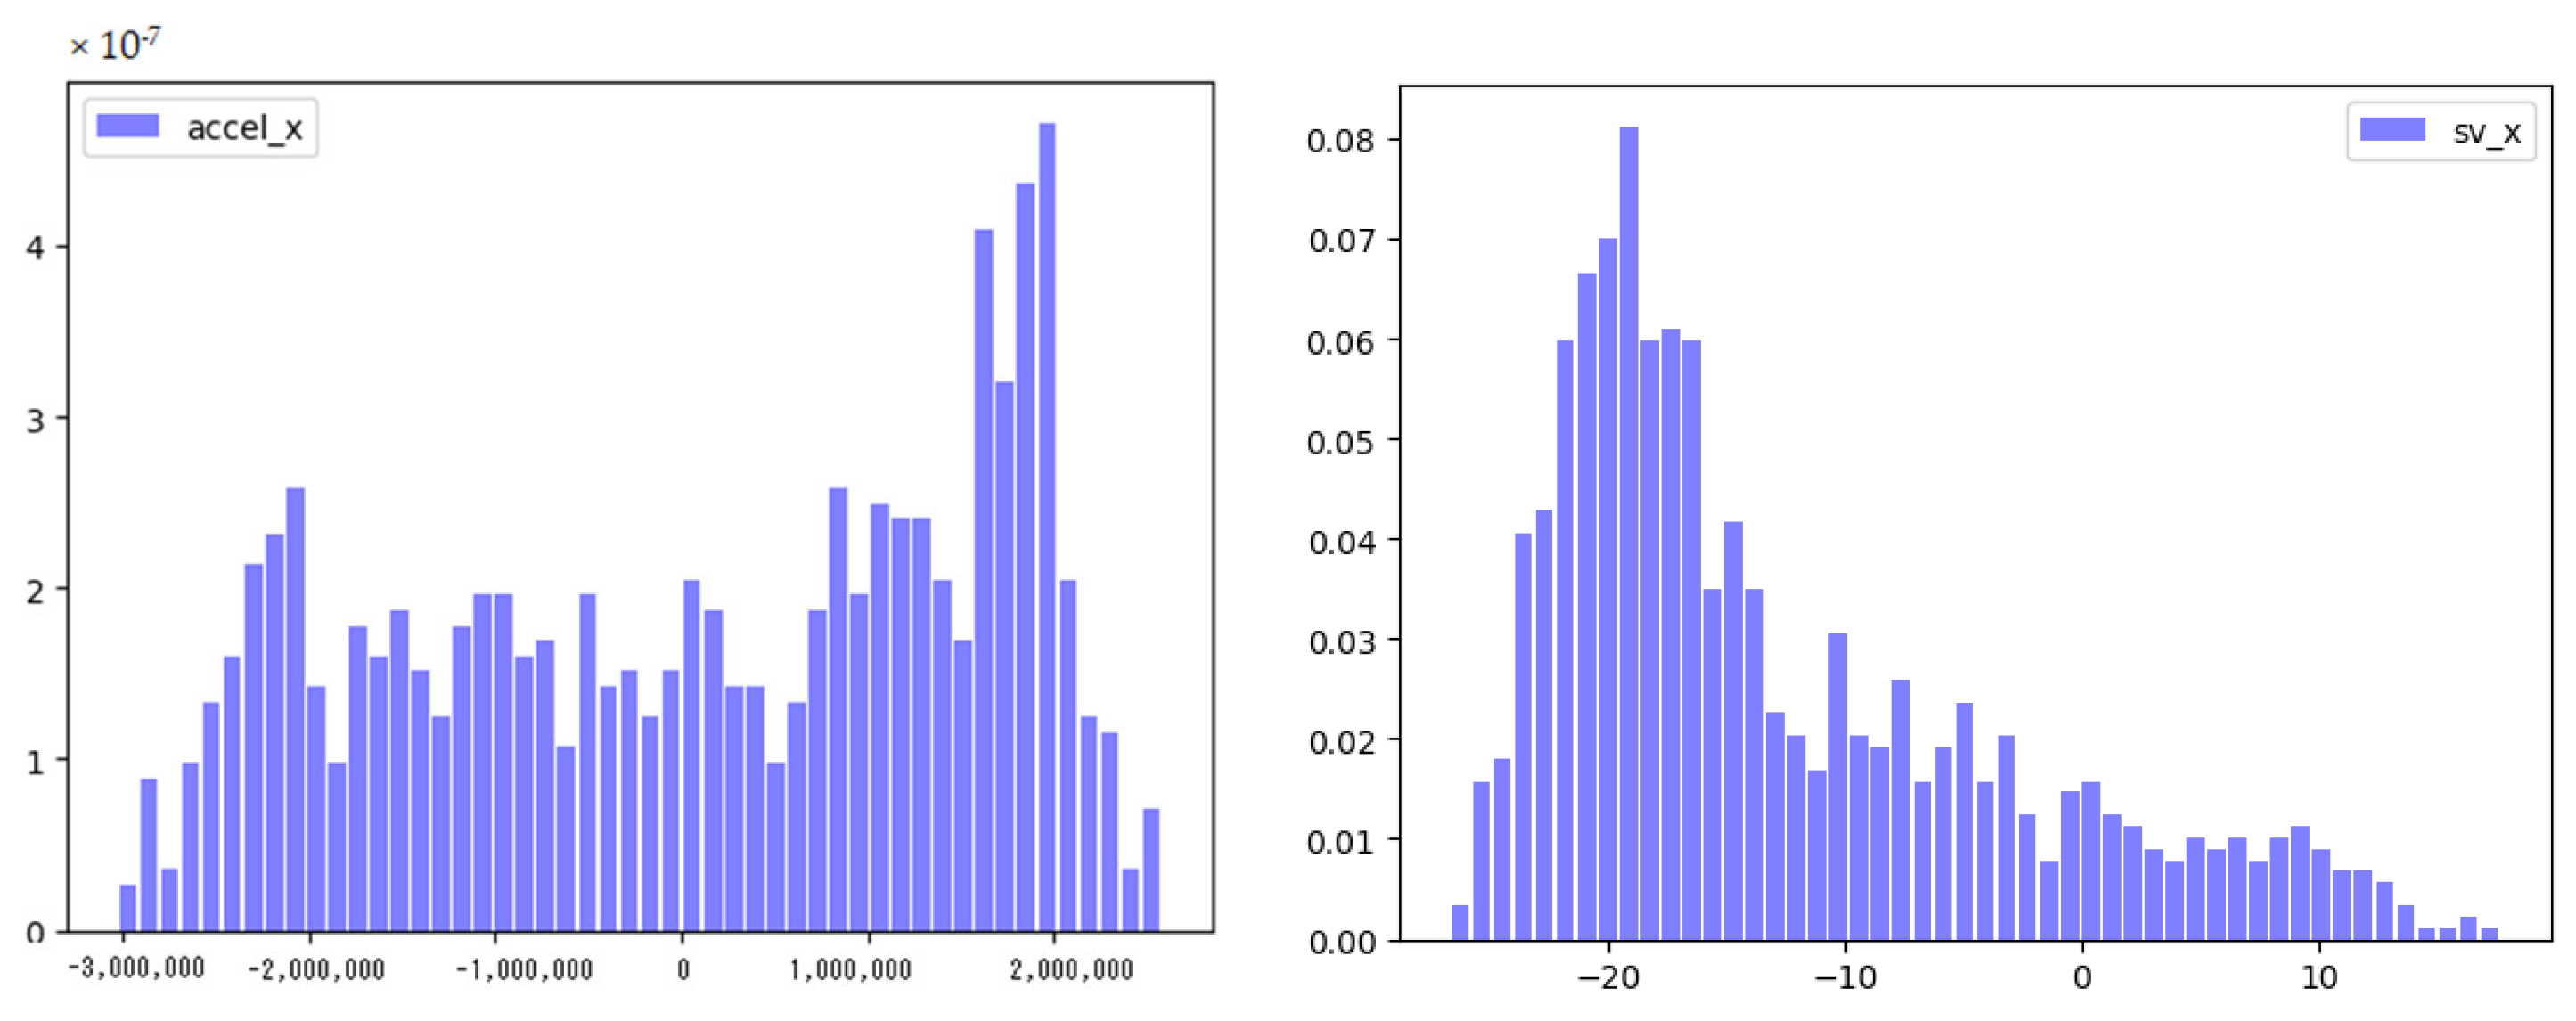
In this paper, the spectral distributions of the values of these five response quantities at the last time step are statistically presented in the form of histograms, as shown in Figure 33. The histogram distributions of the average temperature, maximum temperature, and outer boundary displacement are approximately Gaussian, indicating their better linear characteristics and consistency with the material properties’ distribution. However, the histogram distributions of the velocity and acceleration of the outer boundary show greater deviations from the Gaussian distribution. Specifically, the velocity distribution is similar to the beta distribution, while the acceleration distribution is similar to the Poisson distribution. These differences in distribution indicate that the nonlinear characteristics of the two responses are not the same.
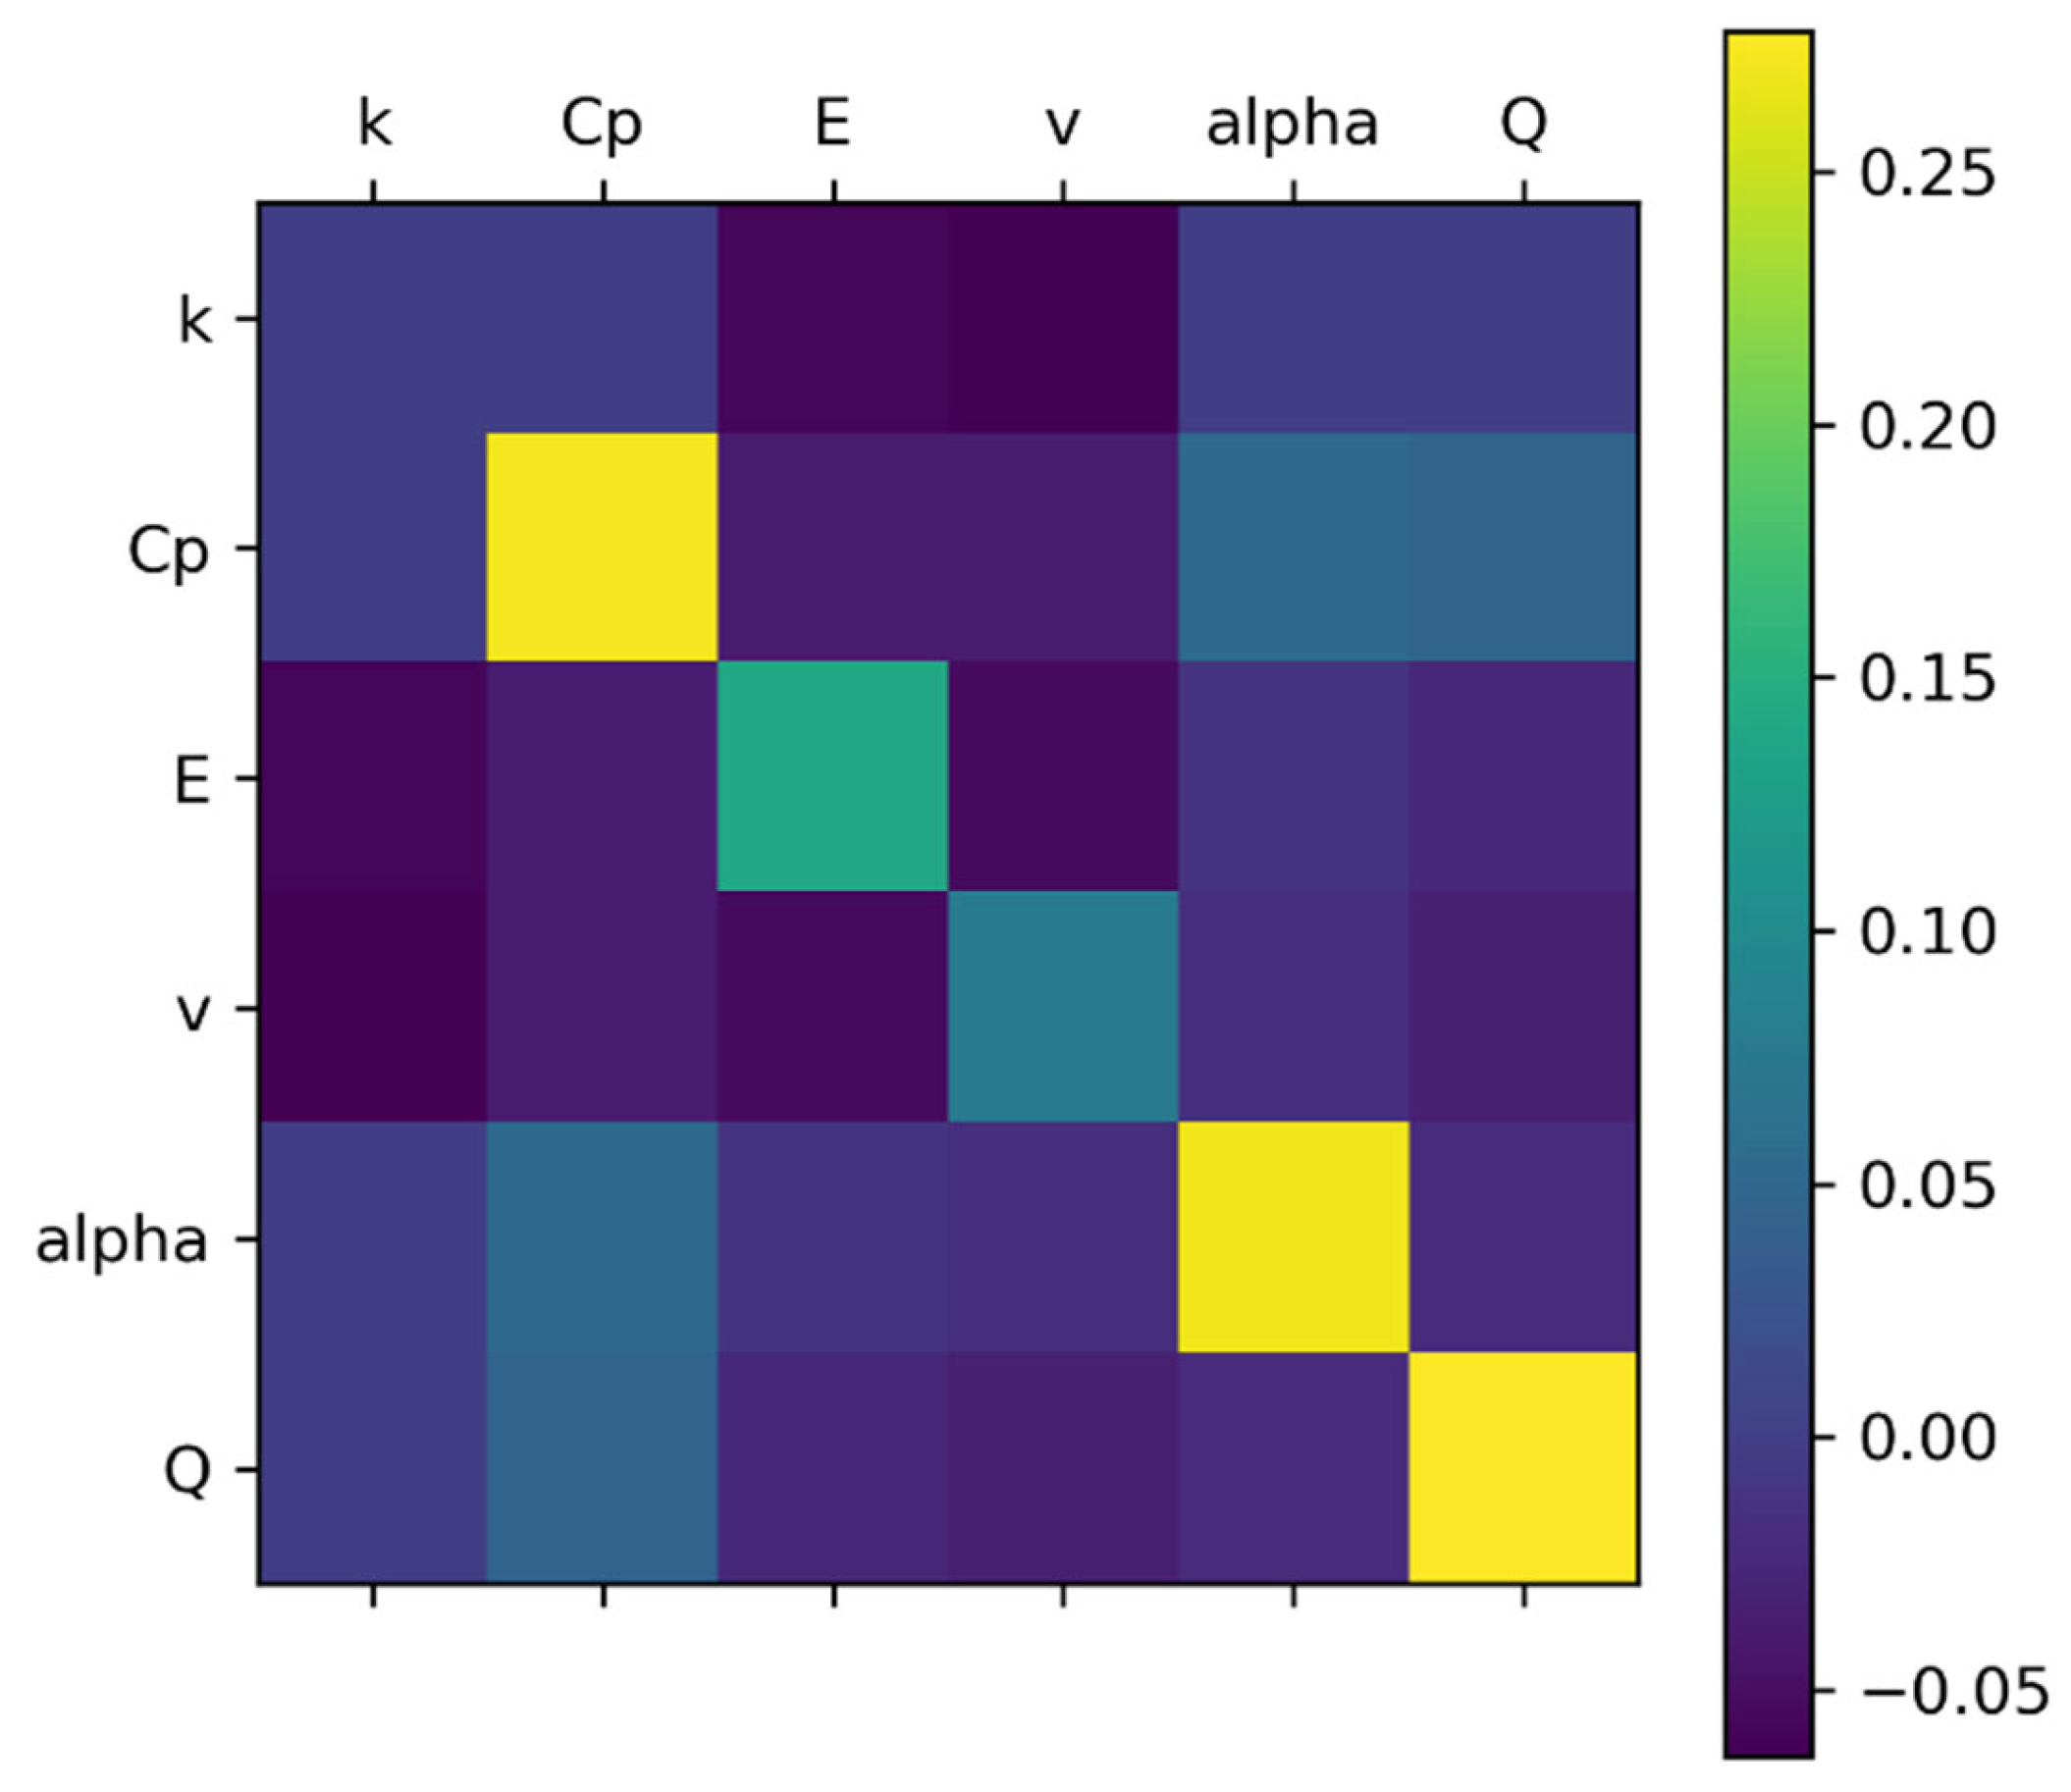
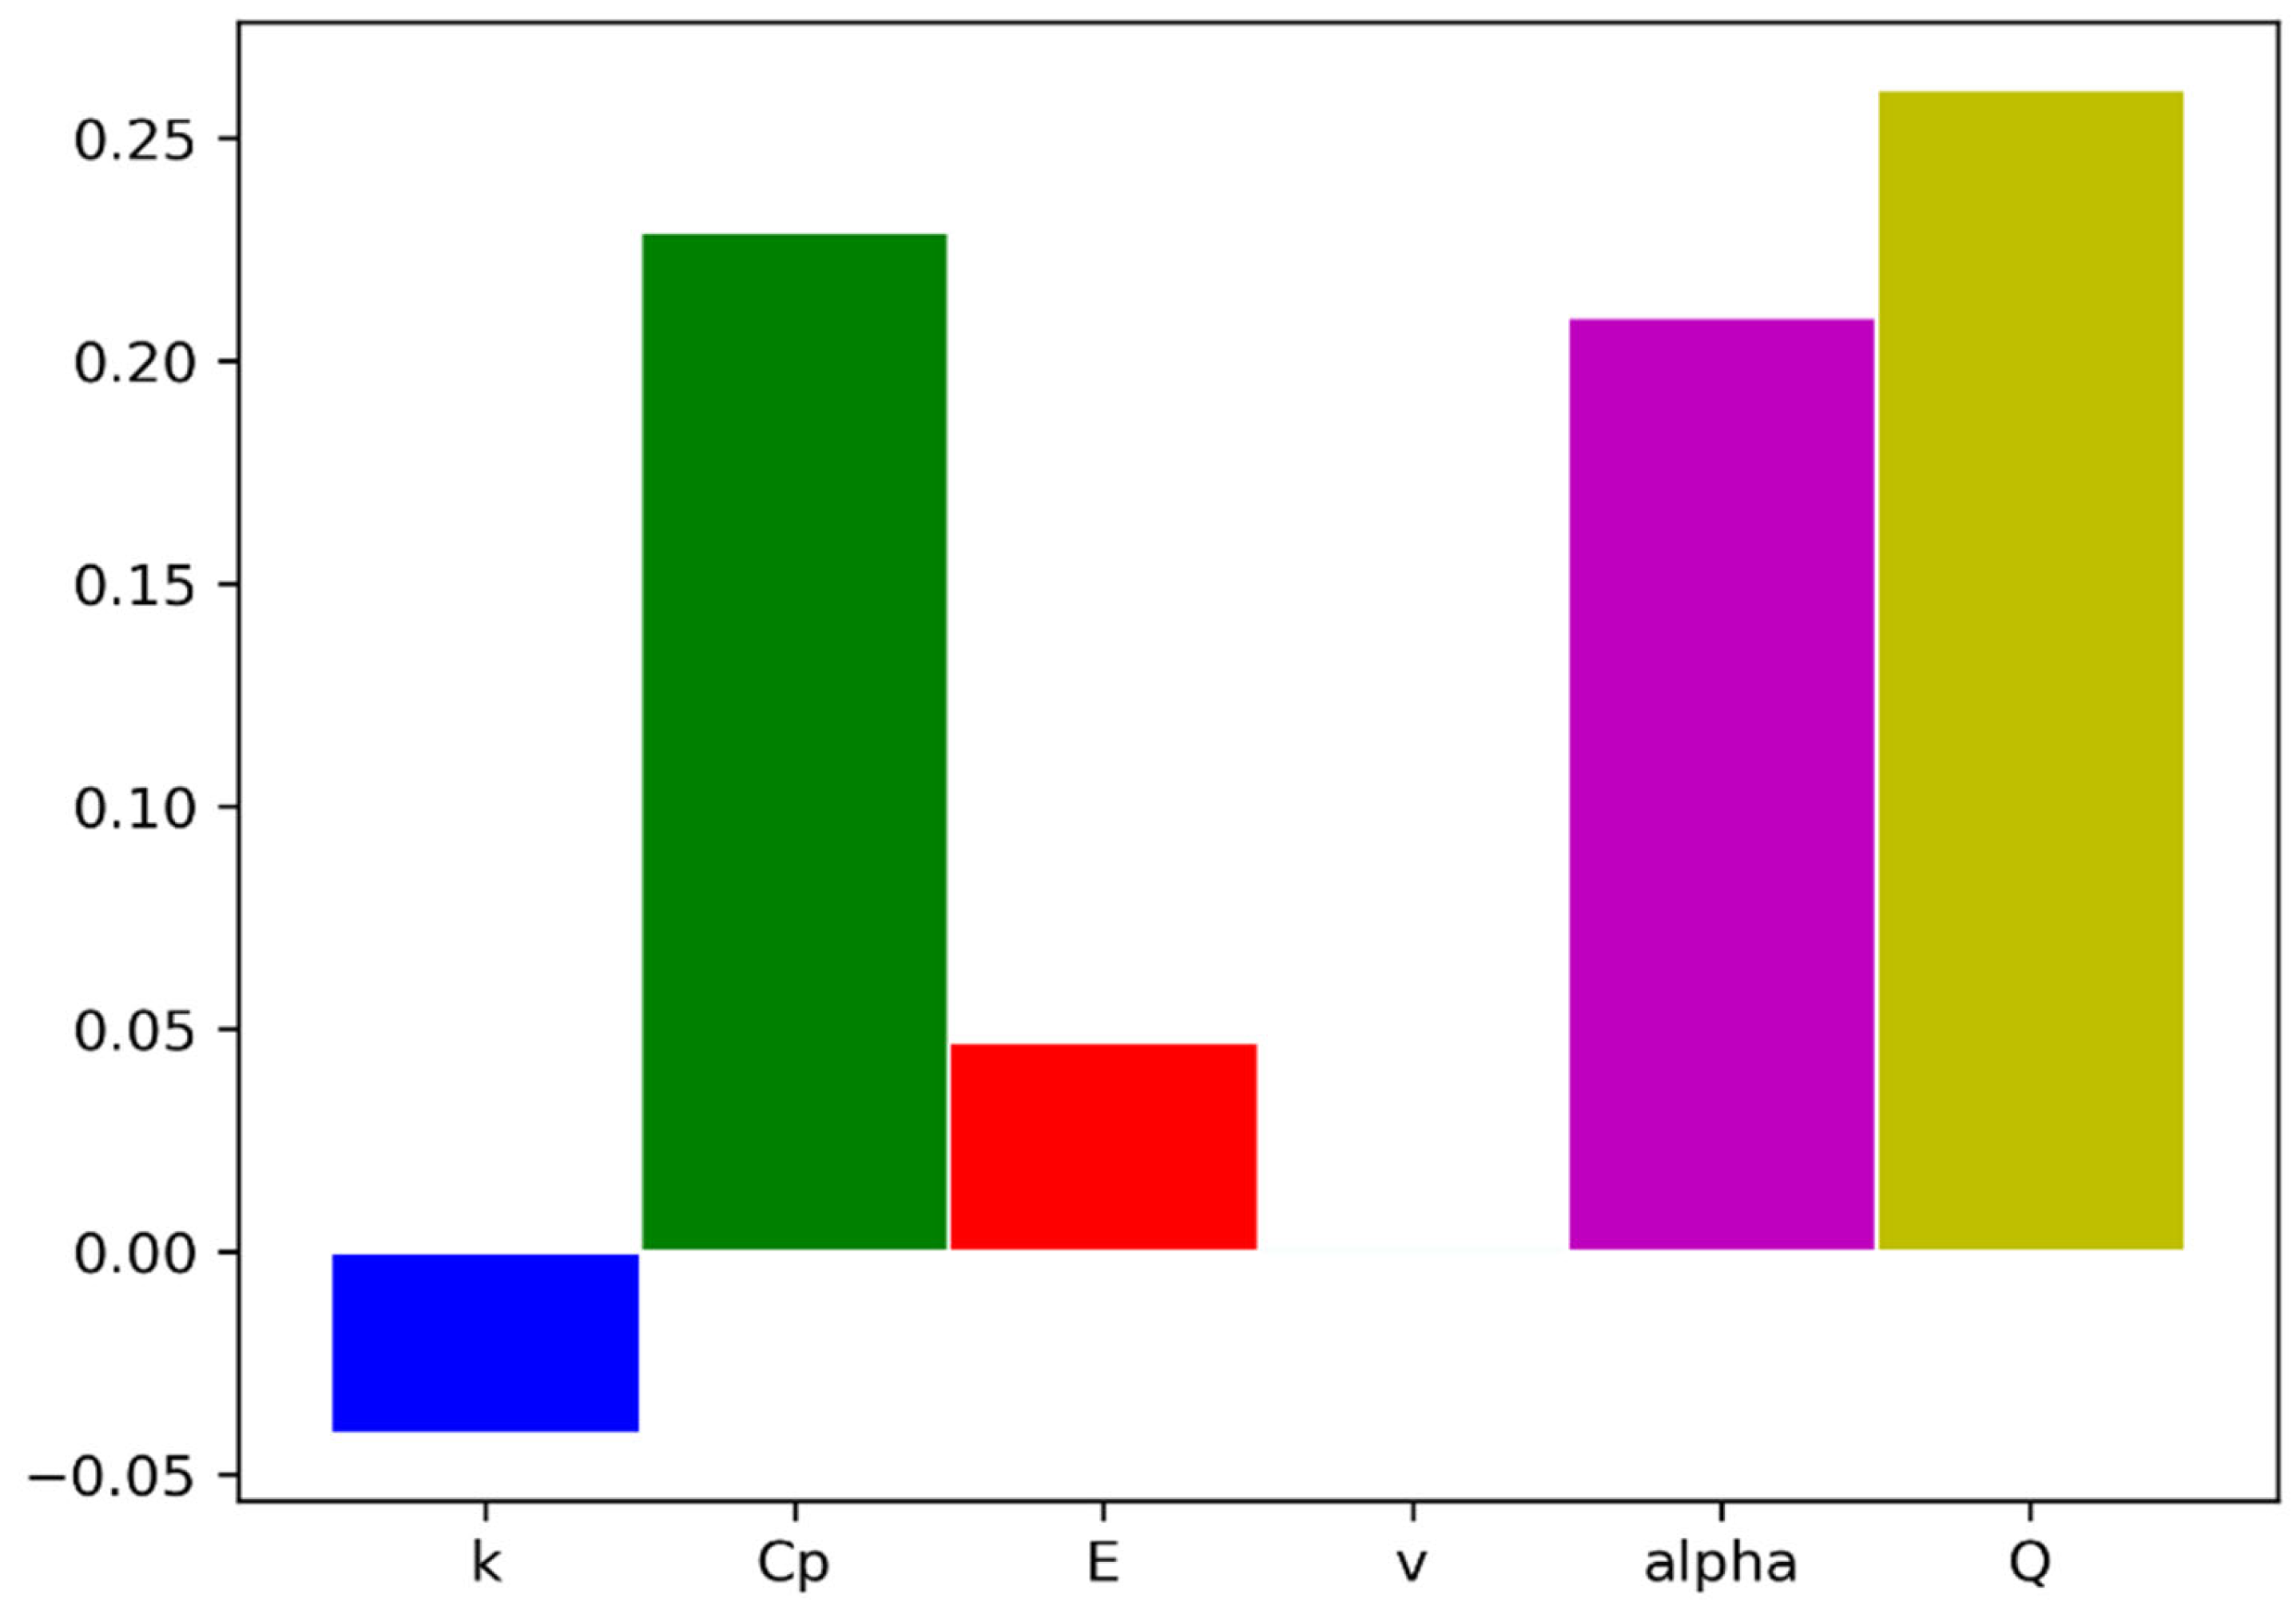
Figure 34 shows the distribution of the first-order and second-order sensitivity coefficients for the input parameters under the outer surface displacement response volume, taking the sensitivity coefficient between the external surface displacement and material properties at the last time step as an example. In this figure, the diagonal term represents the first-order sensitivity coefficient, while the non-diagonal term represents the second-order sensitivity coefficient. It can be observed that the external surface displacement is more sensitive to the specific heat capacity (Cp), thermal expansion coefficient, and heat source magnitude factor. Additionally, the second-order sensitivity coefficient of specific heat capacity shows a stronger relationship with both the thermal expansion coefficient and heat source amplitude factor. The remaining sensitivity coefficients are essentially zero, and any negative values in the table are due to the small sample size. In reality, these negative values would be very close to zero. Furthermore, Figure 35 presents the distribution of the total sensitivity coefficients for each parameter. The analysis of this figure reveals that the sensitivity coefficients, ranked by importance, are as follows: heat source amplitude factor, specific heat capacity, and thermal expansion coefficient for the response quantity of external surface displacement.

4. Discussion

Based on the calculation of the reactivity feedback effect, the peak of the fission rate curve basically matches the experimental value; the core temperature gradually decreases from the core to the surface, the core stress deformation gradually increases from the core to the surface, and the trend of vibration changes with time. The non-uniform density variation must be considered in the actual analysis for the steady-state reactivity temperature coefficient. In addition, it can be seen that the contribution to reactivity after thermal expansion displacement change is a positive effect, and density change is a negative effect; if only density change is considered and displacement change is neglected, it will make the absolute value of negative reactivity coefficient large and overestimate the negative feedback characteristics of the fast pulsed reactor, which is not good for assessing the real transient characteristics of the reactor. For the JFNK method and MultiApp method, the calculation results of core temperature rise, displacement, and stress are almost the same, but the running time and memory consumption of the JFNK method are small. JFNK uses the unified matrix to solve thermal-mechanical coupling formulas, while MultiApp only executes one thermal calculation and one mechanical calculation in which there is no coupling in these two fields. In reality, these two fields should be coupled with each other, so JFNK is recommended. The main method in this paper is the point kinetics and Monte Carlo method; its prospect is using the quasi-static Monte Carlo method to solve the point kinetics and Monte Carlo transport problem at the same time.
The effect of inertia must be taken into consideration when analyzing the fast pulsed reactor based on the calculation of inertial effect. If the analysis neglects the inertia effect, the calculated results will be smaller than the actual value. Consequently, the thermal stress generated during the pulse burst may exceed the yield limit of the material and cause damage to the fast pulsed reactor.
When designing a pulsed reactor, it is necessary to adopt measures to reduce the impact of reflected neutrons on the core. This is because the wall-reflected neutrons significantly change the pulse waveform, raising the pulse trailing edge. As a result, the fission yield is increased, leading to elevated core temperature rise, displacement, stress, and other parameters. Underestimating the effect of reflected neutrons in the reactor hall can result in lower measured values of control rod values than the actual ones and may cause accidents in certain cases. Therefore, reducing the reflected neutrons from the walls is crucial in order to minimize these risks. Based on the calculation of the wall-reflected neutron effect, it is evident that the impact of reflected neutrons on the core can be effectively reduced by implementing such measures.
The uncertainties of Godiva’s time-dependent response results of temperature, surface displacement, and other quantities of interest were obtained using the calculation of uncertainty and sensitivity analysis. This was done under the input perturbations of multiple material properties and heat source amplitude factors. The quantification of sensitivity coefficients for different input parameters was carried out to investigate the potential of this metal fuel reactor in relation to external surface displacement.

5. Conclusions

This paper simulates the transient experiment process of the Godiva-I critical device. Two methods are used: the point reactor kinetic method and the Monte Carlo method. The paper also investigates the reactivity feedback effect, inertia effect, and wall-reflected neutrons effect in the MOOSE platform via simulation. Subsequently, the model undergoes uncertainty and sensitivity analysis at different times using the Stochastic Tools module. The study yields several conclusions, which are listed as follows:
(1)
The calculation of reactivity feedback effects showed that the neutron flux in the core followed a distribution trend with the highest flux in the core and the lowest at the surface. The surface flux was about 21.5% of the center flux. After considering displacement and density, the relative deviation of the steady-state reactivity temperature coefficient was found to be 1.27%. In transient calculations, the relative deviation of the peak fission rate was less than 5%. Additionally, the temperature rises in the core, as calculated using the Multi-App and JFNK methods, were almost the same in transient thermal-mechanical calculations. The displacement of the core increased gradually from the core to the surface, with the vibration trend changing over time. The JFNK method was found to have less time and memory consumption, making it more realistic due to its consideration of the coupling between the temperature field and the stress field.
(2)
The inertia effect calculation shows that when the initial period is 11.6 μs, the peak value of the fission rate is 2.78 × 10²⁰/s, and the relative deviation of the experimental value is −1.35%; the average temperature rise and the maximum temperature rise of the core are 47.34 °C and 104.53 °C, which is about 1.3 times of that without considering the inertia effect; The maximum displacement on the outer surface is 7.63 × 10⁻³ cm which is about 1.43 times without considering the inertia effect. In conclusion, the inertia effect can significantly increase the core fission yield and increase the temperature and displacement of the core.
(3)
The wall-reflected neutrons effect calculation shows that when the initial period is 16.2 us, the temperature calculated by considering the reflected neutron effect is higher than that of the unconsidered, and the maximum displacement of the outer surface of the reactor is 3.63 × 10⁻³ cm, 1.06 times of that without considering the reflected neutrons. The wall-reflected neutrons significantly change the pulse waveform and raise the pulse trailing edge, which in turn raises the fission yield, resulting in elevated core temperature rise and displacement.
(4)
The analysis of uncertainty and sensitivity reveals that the external surface displacement is most affected by the specific heat capacity, thermal expansion coefficient, and heat source magnitude factor.

Author Contributions

Conceptualization, Methodology, Investigation, Writing—Original Draft, L.W.; Resources, Writing—Revise and Editing, Data Curation, S.G.; Methodology, Formal analysis and Script, T.H.; Writing—Review and Editing, Visualization, D.J.; Validation and Review, X.Z.; Writing—Review, Experiment, L.C.; Review and Editing, Supervision, X.J. All authors have read and agreed to the published version of the manuscript.

Funding

This research was funded by the National Natural Science Foundation of China, grant numbers 12275219 and 12205237.

Data Availability Statement

The data presented in this study are available on request from the corresponding authors. The data are not publicly available due to privacy.

Conflicts of Interest

The authors declare no conflict of interest.

References

  1. Wimett, T.F. Fast Burst Reactors in the USA; Los Alamos Scientific Laboratory: Los Alamos, NM, USA, 1965.
  2. Paxton, H.C. History of Critical Experiments at Pajarito Site; Los Alamos National Laboratory: Los Alamos, NM, USA, 1983.
  3. Wang, J.; Liang, W.; Chen, S.; Zhou, H.; Xie, Q.; Fan, X.; Qian, D. Dynamic behavior in fast burst reactor with three-dimensional coupled multiphysics method. Nucl. Eng. Des. 2018, 338, 16–22. [Google Scholar] [CrossRef]
  4. Wang, J.M.; Gao, H.; Xie, Q.L.; Fan, X.Q.; Qian, D.Z. Development of a display reactivity feedback model for dynamic behavior simulation in fast burst reactor. Nucl. Sci. Technol. 2019, 30, 10. [Google Scholar] [CrossRef]
  5. He, R.; Deng, M. Experimental Physics of Fast Neutron Critical Devices and Pulse Reactors; National Defense Industry Press: Beijing, China, 2012; pp. 34–37. (In Chinese) [Google Scholar]
  6. Zhang, C.; Zhou, Q.; Zhu, Q.F.; Xia, Z.D.; Zheng, J.Y. Research on Transient Characteristics Analysis of Metal Nuclear Fuel Systems. At. Energy Sci. Technol. 2016, 50, 2170–2174. (In Chinese) [Google Scholar]
  7. McLaughlin, T.P. A Review of Criticality Accountants 2000 Revision; Los Alamos National Laboratory: Los Alamos, NM, USA, 2000.
  8. Liang, W.F.; Xie, Q.L.; Gao, H.; Qiu, D.; Yang, C.D. Coupled calculation of fast neutron pulse reactors based on waveform approximation. At. Energy Sci. Technol. 2016, 50, 2018–2022. (In Chinese) [Google Scholar]
  9. Wilson, S.C.; Biegalski, S.R.; Coats, R.L. Computational Modeling of Coupled Thermomechanical and Neutron Transport Behavior in a Godiva Like Nuclear Assembly. Nucl. Sci. Eng. 2007, 157, 344–353. [Google Scholar] [CrossRef]
  10. Liang, W.; Qiu, D.; Yang, C.; Fan, X.; Xie, Q.; Yin, Y. Dynamic Response Simulation of Fuel Elements under Thermal Shock Based on ANSYS. Sci. Technol. Eng. 2014, 14, 51–55. (In Chinese) [Google Scholar]
  11. Wimett, T.F. Dynamics and power prediction in session bursts. Nucl. Sci. Eng. 1992, 3, 209–236. [Google Scholar] [CrossRef]
  12. Li, B.; Fan, X.; Deng, M. Dynamic character research of fast neutron burst reactor. Nucl. Electron. Detect. Technol. 2001, 21, 277–280. (In Chinese) [Google Scholar]
  13. Zhong, L.; Gao, H.; Liang, W.; Li, J. Calculation of inertia effect on metal burst reactors. High Power Laser Part. Beams 2017, 29, 146–149. (In Chinese) [Google Scholar]
  14. Gao, H.; Song, L.-L.; Li, B. Influence of reflected neutrons of wall on waveform of burst reactors. Acta Phys. Sin. 2018, 67, 172801. (In Chinese) [Google Scholar] [CrossRef]
  15. Aufiero, M.; Fiorina, C.; Laureau, A.; Rubiolo, P.; Valtavirta, V. Serpent-OpenFOAM coupling in transient model of a Godiva prompt critical burst. J. Perio-Dontal Res. 2015, 37, 154–160. [Google Scholar]
  16. Wang, Y.; Schunert, S.; Ortensi, J.; Gleicher, F.N.; Laboure, V.M.; Baker, B.A.; De Hart, M.; Martineau, R.C. Demonstration of MAMMOTH Fully Coupled Simulation with the Godiva Benchmark Problem. In Proceedings of the International Conference on Mathematics & Computational Methods Applied to Nuclear Science & Engineering, Niagara Falls, ON, Canada, 13–17 August 2017. [Google Scholar]
  17. Peterson, R.E. Lady Godiva: An Un-Reflected Uranium-235 Critical Assembly; Los Alamos National Laboratory: Los Alamos, NM, USA, 1953.
  18. Wimett, T.F.; Engle, L.B.; Graves, G.A.; Keepin, G.R., Jr.; Orndoff, J.D. Time Behavior of Godiva through Prompt Critical; Los Alamos National Laboratory: Los Alamos, NM, USA, 1956; pp. 1–39.
  19. Gaston, D.; Newman, C.; Hansen, G.; Lebrun-Grandie, D. MOOSE: A parallel computational framework for coupled systems of nonlinear equations. Nucl. Eng. Des. 2009, 239, 1768–1778. [Google Scholar] [CrossRef]
  20. Shabalin, E.P. Fast Pulsed and Burst Reactor; Pergamon Press: New York, NY, USA, 1979. [Google Scholar]
  21. Stratton, W.R. Analysis of Prompt Excursions in Simple Systems on Idealized Fast Reactors; Proceeding and International Conference on Peacefue Uses of Atomic Energy; Los Alamos National Laboratory: Los Alamos, NM, USA, 1958.
  22. Zhang, X. Theoretical calculation of fast-neutron pulsed reactor. J. Chang. Teach. Coll. Tecnol. 1995, 1, 1–12. (In Chinese) [Google Scholar]
  23. Cohn, C.E. Reflected-reactor kinetics. Nucl. Sci. Eng. 1962, 1, 12–17. [Google Scholar] [CrossRef]
  24. Li, B.; Lu, Y.; Gao, H. Kinetic effect of scattering neutrons on super-prompt critical system. High Power Laser Part. Beams 2016, 28, 056001. (In Chinese) [Google Scholar]
  25. Zhang, X.; Zhang, L.; Jiang, X.; He, B.; Wang, L.; Guo, H.; Jiang, D.; Zhu, Y. Study on Influence of Depletion on Neutron Generation Time for Xi’an Pulsed Reactor. Nucl. Sci. Eng. 2019, 39, 357–362. (In Chinese) [Google Scholar]
  26. Slaughter, A.E.; Prince, Z.M.; German, P.; Halvic, I.; Jiang, W.; Spencer, B.W.; Dhulipala, S.L.N.; Gaston, D.R. MOOSE Stochastic Tools: A module for performing parallel, memory-efficient in situ stochastic simulations. SoftwareX 2023, 22, 101345. [Google Scholar] [CrossRef]
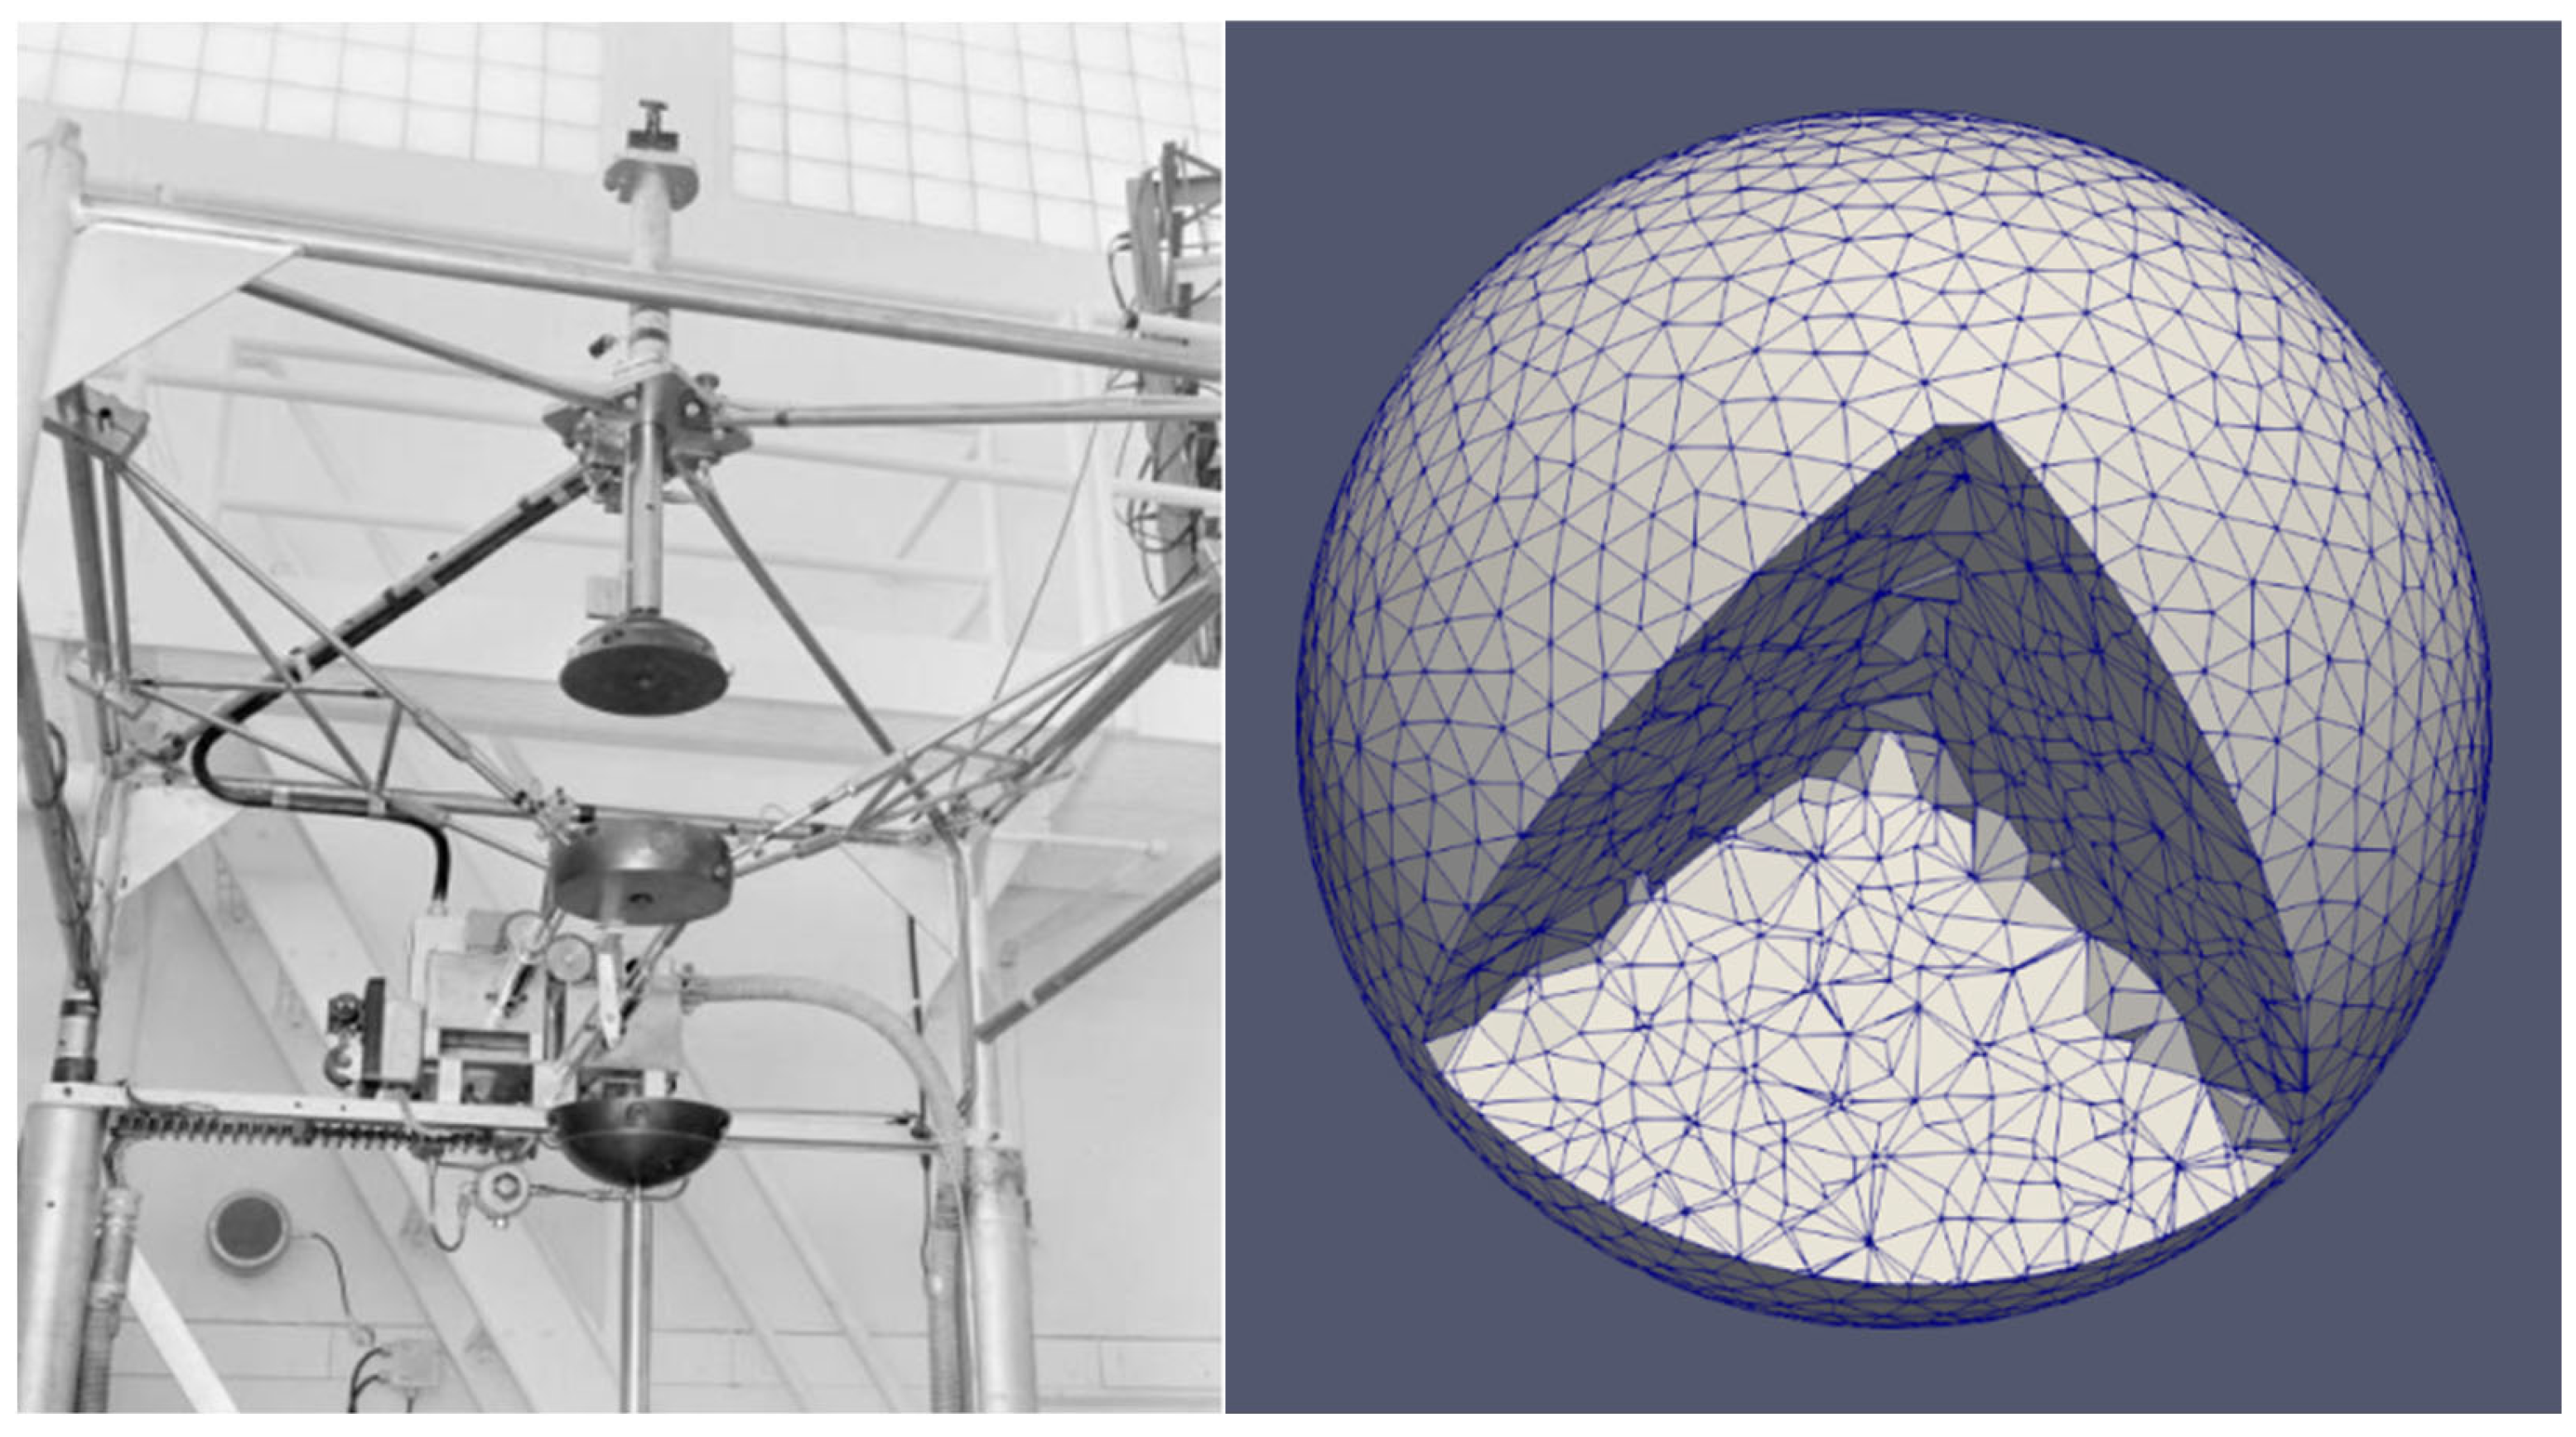
Figure 1. Problem of Godiva-I.
Energies 16 06575 g001
Figure 2. Flow of Thermal-Mechanics Coupling of JFNK and Multi-App method.
Energies 16 06575 g002
Figure 3. Displacement of surface.
Energies 16 06575 g003
Figure 4. Normalized oscillation displacement.
Energies 16 06575 g004
Figure 5. Decay curve of neutron flux density.
Energies 16 06575 g005
Figure 6. Effect of the wall thickness of the neutron scattering.
Energies 16 06575 g006
Figure 7. Calculation of core model.
Energies 16 06575 g007
Figure 8. Number of neutrons in reactor core.
Energies 16 06575 g008
Figure 9. Equivalent source of one leakage neutron.
Energies 16 06575 g009
Figure 10. Radial Distribution of Neutron Flux.
Energies 16 06575 g010
Figure 11. Changes of Radial Displacement.
Energies 16 06575 g011
Figure 12. Relationship between Reactivity and Temperature Rise. (a) different density type; (b) effect of density and displacement.
Energies 16 06575 g012
Figure 13. Comparison of fission rates with reference values. Initial reactivity period: (a) 16.2 μs; (b) 29.5 μs.
Energies 16 06575 g013
Figure 14. Changes in system reactivity over time. Initial reactivity period: (a) 16.2 μs; (b) 29.5 μs.
Energies 16 06575 g014
Figure 15. System average temperature with time. Initial reactivity period: (a) 16.2 μs; (b) 29.5 μs.
Energies 16 06575 g015
Figure 16. Temperature distribution at the end time. Initial reactivity period: (a) 16.2 μs; (b) 29.5 μs.
Energies 16 06575 g016
Figure 17. Change of system surface displacement over time (MultiApp VS JFNK). Initial reactivity period: (a) 16.2 μs; (b) 29.5 μs.
Energies 16 06575 g017
Figure 18. Distribution of Displacement at 16.2 μs initial reactivity period. (a) JFNK; (b) MultiApp.
Energies 16 06575 g018
Figure 19. Distribution of Displacement at 29.5 μs initial reactivity period. (a) JFNK; (b) MultiApp.
Energies 16 06575 g019
Figure 20. Comparison of Fission Rates with Reference of the 11.6 μs initial periods.
Energies 16 06575 g020
Figure 21. Comparison of Temperature Rise.
Energies 16 06575 g021
Figure 22. Temperature Distribution. (a) without inertia effect; (b) Inertia effect.
Energies 16 06575 g022
Figure 23. Distribution of displacement. (a) without inertia effect; (b) Inertia effect.
Energies 16 06575 g023
Figure 24. Changes of System Surface Displacement over Time.
Energies 16 06575 g024
Figure 25. Comparison of Fission Rates with Reference considering reflected neutrons.
Energies 16 06575 g025
Figure 26. Changes of Reactivity over Time.
Energies 16 06575 g026
Figure 27. Temperature Distribution. (a) without reflected neutrons; (b) reflected neutrons.
Energies 16 06575 g027
Figure 28. Distribution of displacement. (a) without reflected neutrons; (b) with reflected neutrons.
Energies 16 06575 g028
Figure 29. Changes of System Surface Displacement over Time.
Energies 16 06575 g029
Figure 30. Differences between the sample expectation and the average attribute calculation values for mean temperature, maximum temperature, outer surface displacement, outer boundary velocity, and outer boundary acceleration over time.
Energies 16 06575 g030
Figure 31. Variation of sample mean temperature, maximum temperature, outer surface displacement, outer boundary velocity, and outer boundary acceleration variance with time.
Energies 16 06575 g031
Figure 32. Mean temperature, maximum temperature, outer surface displacement, outer boundary velocity, and outer boundary acceleration uncertainty over time.
Energies 16 06575 g032
Figure 33. Histogram of average temperature, maximum temperature, outer surface displacement, outer boundary velocity, and outer boundary acceleration at the last time step.
Energies 16 06575 g033aEnergies 16 06575 g033b
Figure 34. First and second-order sensitivity coefficients of external surface displacement response.
Energies 16 06575 g034
Figure 35. Distribution of the total sensitivity coefficient for each parameter.
Energies 16 06575 g035
Table 1. Input parameter and its units.
ParametersValueUnit
Density (ρ)18.7398g/cm3
Poisson’s ratio (v)0.23
Young’s modulus (E)208GPa
Thermal conductivity (k)27.5W·m−1·K−1
Thermal expansion coefficient (α)1.39 × 10⁻⁵K−1
Specific heat capacity (c)117.72J·Kg−1·K−1
Table 2. Neutron spectrum of the Godiva critical facility.
Energy Spectrum (MeV)(%)Energy Spectrum (MeV)(%)
0–0.0050.0103 3–47.1324
0.005–0.010.0272 4–53.8565
0.01–0.020.1030 5–62.0459
0.02–0.050.6152 6–71.0504
0.05–0.11.7876 7–80.5047
0.1–0.25.1520 8–90.2416
0.2–0.517.7245 9–100.1173
0.5–122.7261 10–150.1096
1–224.0981 15–200.0024
2–312.6952
Table 3. Input parameter region and distribution.
Parameters (Unit)Value RangeAverage ValueDistribution Type
Coefficient (W/m·K)[0.2475, 0.3025] 27.5Gaussian
Specific heat capacity (W/m·K)[0.105948, 0.129492] 0.118877Gaussian
Young’s modulus (Pa)[1.872 × 105,2.288 × 105]2.1008 × 10⁵Gaussian
Poisson’s ratio[0.207, 0.253]0.2323Gaussian
Thermal expansion coefficient (1/K)[1.251 × 10−5, 1.529 × 10⁻⁵] 1.4039 × 10⁻⁵Gaussian
Heat source factor[0.9, 1.1]1.01Gaussian
Table 4. Comparison of JFNK and MultiApp runtime and memory consumption.
MethodInitial Reactivity Period of 16.2 μsInitial Reactivity Period of 29.5 μs
RuntimeMemoryRuntimeMemory
JFNK252.33 s91 MB348.25 s90 MB
Multi-App270.08 s112 MB263.09 s118 MB
Disclaimer/Publisher’s Note: The statements, opinions and data contained in all publications are solely those of the individual author(s) and contributor(s) and not of MDPI and/or the editor(s). MDPI and/or the editor(s) disclaim responsibility for any injury to people or property resulting from any ideas, methods, instructions or products referred to in the content.