Review

A Review of Sensing Technologies for New, Low Global Warming Potential (GWP), Flammable Refrigerants †

by
Viktor Reshniak
1,
Praveen Cheekatamarla
2,*,
Vishaldeep Sharma
2 and
Samuel Yana Motta
2
1
Computer Science and Mathematics Division, Oak Ridge National Laboratory, 1 Bethel Valley Rd., Oak Ridge, TN 37830, USA
2
Buildings and Transportation Science Division, Oak Ridge National Laboratory, 1 Bethel Valley Rd., Oak Ridge, TN 37830, USA
*
Author to whom correspondence should be addressed.
Department of Energy (DOE). The US government retains and the publisher, by accepting the article for publication, acknowledges that the US government retains a nonexclusive, paid-up, irrevocable, worldwide license to publish or reproduce the published form of this manuscript, or allow others to do so, for US government purposes. DOE will provide public access to these results of federally sponsored research in accordance with the DOE Public Access Plan (http://energy.gov/downloads/doe-public-access-plan, accessed on 2 September 2023).
Energies 2023, 16(18), 6499; https://doi.org/10.3390/en16186499
Submission received: 31 July 2023 / Revised: 21 August 2023 / Accepted: 1 September 2023 / Published: 8 September 2023

Abstract

:
Commercial refrigeration systems currently utilize refrigerants with global warming potential (GWP) values ranging from 1250 to 4000. The advent of low GWP alternatives (GWP < 150 ) is expected to significantly curtail direct emissions from this segment and greatly influence the ongoing electrification and decarbonization efforts. Most of the low GWP alternatives exhibit flammability risk and hence require robust sensing solutions for a reliable and safe operation of the equipment. This review article aims to provide an overview of different sensing mechanisms suitable for potential applications in systems employing flammable refrigerants, particularly those designated as A2L class. A summary of different A2L refrigerants and their properties is provided followed by a broad review of different classes of sensors, their working principle, transduction method, features, advantages, and limitations. Additionally, key performance characteristics of accuracy, selectivity, sensitivity, dynamic characteristic, and durability among other properties are discussed. Finally, areas of improvement and corresponding approaches are suggested for potential sensors in the successful adoption of A2L class refrigerants.

1. Introduction

Large food retail establishments, including supermarkets, frequently adopt multiplex direct expansion refrigeration systems that operate in conjunction with hydrofluorocarbon refrigerants such as R-404A and R-407C. These systems incorporate refrigerant charges that can amount to several thousand pounds, and feature extensive refrigerant piping networks connecting to and from the refrigerated display cases. The annual estimation of refrigerant leakage for these systems during operation varies between 5% and 35%. This range is attributed to the age of the equipment, with older systems demonstrating higher annual leak rates (exceeding 25%) and newer systems displaying lower rates (below 15%) according to ICF (2005). Given the substantial global warming potential (GWP) associated with hydrofluorocarbon refrigerants commonly deployed in these systems, in addition to the combination of substantial refrigerant charges, lengthy refrigerant piping setups, and notable refrigerant leakage rates, there is a notable release of greenhouse gases directly into the atmosphere [1].
Most of the low-GWP refrigerants proposed to replace R-404A and other hydrofluorocarbon refrigerants in commercial refrigeration applications are flammable class 2 L ASHRAE Std 34 refrigerants [2], shown in Table 1. Considering the high leakage potential of a traditional refrigeration system due to its rigorous operating conditions along with close proximity of shoppers to the refrigerant in display cases, the retailers are hesitant to use flammable refrigerants in their stores. Therefore, leak detectors are needed to ensure safety and desired system performance during operation. A need exists for sensor technologies to fulfill the requirements for ASHRAE Std 15, Std 15 2P [3]; UL 60335-2-40, UL 60335-2-89 [4,5]:
  • capable of operating safely with any 2 L refrigerant without becoming an ignition source themselves,
  • very high reliability during the lifetime of a typical system (25-year lifetime desired/5-year lifetime minimum),
  • ready to operate with smart control and fault detection and diagnostics systems employed in these applications,
  • wireless capabilities (Internet of Things connectivity) to simplify distribution in typical supermarket stores,
  • capable of measuring refrigerant concentration with sufficient accuracy, and of providing adequate response time according to the appropriate safety standards,
  • acceptable cost for mass-production equipment such as refrigeration systems.
Table 1. A2L refrigerants from ANSI/ASHRAE Standard 34-2019 [2].
Refrigerant NumberTypeChemical Name/Composition MassChemical Formula/Composition ToleranceOEL, ppm v/vRCLGWP (AR4)
ppm v/vlb/Mcfg/ m 3
Methane series
32HFCdifluoromethane (methylene fluoride) C H 2 F 2 100036,0004.877675
Ethane series
143aHFC1,1,1-trifluoroethane C H 3 C F 3 100021,0004.5704470
Unsaturated Organic Compounds
1234yfHFO2,3,3,3-tetrafluoro-1-propene C F 3 C F = C H 2 50016,0004.7754
1234ze(E)HFOTrans-1,3,3,3-tetrafluoro-1-propene C F 3 C F = C F H 80016,0004.7756
Zeotropes
444AHFC blendR-32/152a/1234ze(E) 12.0/5.0/83.0±1/±1/±285021,0005.18187
444BHFC blendR-32/152a/1234ze(E) 41.5/10.0/48.5±1/±1/±189023,0004.369293
445AHFC blendR-744/134a/1234ze(E) 6.0/9.0/85.0±1/±1/±293016,0004.267129
446AHFC blendR-32/1234ze(E)/600 68.0/29.0/3.0 + 0.5 , 1.0 / + 2.0 , 0.6 / + 0.1 , 1.0 96016,0002.539459
447AHFC blendR-32/125/1234ze(E) 68.0/3.5/28.5 + 1.5 , 0.5 / + 1.5 , 0.5 / + 1.0 , 1.0 90016,0002.642582
447BHFC blendR-32/125/1234ze(E) 68.0/8.0/24.0 + 1.0 , 2.0 / + 2.0 , 1.0 / + 1.0 , 2.0 97030,00023360739
451AHFC blendR-1234yf/134a 89.8/10.2±0.2/±0.252018,0005.381146
451BHFC blendR-1234yf/134a 88.8/11.2±0.2/±0.253018,0005.381160
452BHFC blendR-32/125/1234yf 67.0/7.0/26.0±2.0/±1.5/±2.087030,00023360696
454AHFC blendR-32/1234yf 35.0/65.0+2.0/−2.0, +2.0/−2.069016,00028450236
454BHFC blendR-32/1234yf 68.9/31.1+1.0/−1.0, +1.0/−1.085019,00022360465
454CHFC blendR-32/1234yf 21.5/78.5±0.2/±0.262019,00029460145
455AHFC blendR-744/32/1234yf 3.0/21.5/75.5 + 2.0 , 1.0 / + 1.0 , 2.0 /±2.065030,00023380145
457AHFC blendR-32/1234yf/152a 18.0/70.0/12.0 + 0.5 , 1.5 / + 0.5 , 1.5 / + 0.1 , 1.9 65015,00025400136
459A R-32/1234yf/1234ze(E) 68.0/26.0/6.0 + 0.5 , 1.0 2.0 / + 1.5 , 0.5 87027,00023360
459B R-32/1234yf/1234ze(E) 21.0/69.0/10.0 + 0.5 , 1.0 2.0 / ± 1.0 64016,00030470
Azeotropes
516A R-1234yf/134a/152a 77.5/8.5/14.0± 1.4 / + 0.5 , 1.5 / + 0.1 , 1.9 59027,0007.0110
Numerous promising sensor technologies hold potential for detecting A2L refrigerants, including infrared (IR) sensors, metal oxide semiconductor (MOS) sensors, catalytic bead sensors, electrical conductivity (EC) sensors, and heat diode sensors. However, these sensors in their current form are not suitable for use in commercial refrigeration systems. Presently available IR sensors lack the necessary detection range to accurately measure 20–25% of the Lower Flammability Limit (LFL), a crucial range for A2L refrigerant detection in commercial refrigeration contexts. MOS sensors pose significant challenges due to their susceptibility to cross-sensitivity with various chemicals like exhaust fumes from gasoline, diesel, and propane, solvents, ethanol, which could prove problematic within industrial and commercial settings. Additionally, MOS sensors tend to experience drift from extended exposure to refrigerants. Catalytic bead sensors are not a viable choice for detecting A2L refrigerants, primarily due to the creation of detrimental byproducts during the combustion-based measurement of fluorinated compounds, leading to sensor poisoning. EC sensors are projected to be highly vulnerable to typical failure modes in refrigerant detection systems found in commercial settings. Heated diode systems face notable susceptibility to common failure modes, both in commercial and industrial environments. Their sensitivity to factors like moisture, oils, and other refrigerant gases, including those used in neighboring systems, hinders their ability to selectively detect refrigerants.
A focused research effort is required to develop a reliable, affordable and durable sensor which could work in commercial settings (high temperature, high humidity, vibration, etc.). Also, since flammable refrigerants have never been used in commercial refrigeration systems, the development of a refrigerant system controller with feedback-based autonomous control algorithm will be needed. The development of low-cost, highly reliable sensors for A2L refrigerants along with refrigerant system controller will require a thorough assessment of state-of-the-art sensor and control technologies.
In this review, an investigation of different gas sensing mechanisms is conducted to understand the advantages and limitations of current state-of-the-art refrigerant sensing technologies. Subsequently, experimental evaluations of these commercially available sensors will be conducted to identity technological gaps. Based upon the experimental findings, prototype refrigerant sensors for commercial refrigeration systems with higher efficiency and cost-competitive technologies will be developed and evaluated. The main impact of this effort will be on the large commercial refrigeration markets and can be equally useful for residential heat pump applications.
Several previous reports provided a comparative assessment of the commercially available sensor technologies suitable for A2L leak detection. The AHRTI report No. 9009 [6] identified metal oxide semiconductor (MOS) and nondispersive infrared (NDIR) technologies as the most promising among those that can comply with safety requirements imposed by ASHRAE and UL standards. This conclusion was made in several industry reports as well [7,8]. Table 2 provides a compilation of the findings in [6]. Based on an analysis of the likelihood and severity of the failure modes, infrared sensors were claimed as the most viable option for the commercial/industrial sector while MOS sensors were anticipated as the most viable option for a residential setting. Electrochemical cells were identified as the most susceptible to common failure modes in both residential and industrial settings mainly due to the likelihood of overexposure and the high impact of false-triggering gases. Catalytic sensors were not recommended for the detection of A2L refrigerants due to potential poisoning of the sensor by the combustion byproducts formed during the measurement. Heated diode sensors were also not recommended given their cross-sensitivity to moisture, oils, and other refrigerants, and due to the absence of stationary solutions.
A detailed experimental evaluation of the sensors’ performance characteristics and reliability appeared in the later AHRTI report No. 9014 [9]. It compared eleven existing sensors based on the MOS, NDIR as well as thermal conductivity (TC), and Micro Machined Membrane (MMM) technologies for detecting the R32 refrigerant. Table 3 provides a compilation of this study’s findings. One can see that MMM was the only sensor technology that complied with all the requirements. NDIR demonstrated the second-best result followed by TC. MOS sensors showed the worst performance.
The current review complements previous reports by assessing refrigerant sensing technologies from a broader perspective. Particularly, for each considered technology, we review the literature on the topic to explore the current state of the field, describe its sensing mechanism and identify the trends and potential approaches that can lead to improvements in existing technologies in the near future. We start with a brief description of the gas-sensing mechanisms and performance characteristics, followed by a detailed discussion of specific sensing mechanisms, their advantages, limitations, and strategies for improvement. We conclude with our findings regarding the current state and promising directions for the design of selective and stable gas sensors that can comply with the safety standards requirements for detecting A2L refrigerants.

2. Gas Sensors

A chemical sensor is a device with two functions: recognition and transduction [11,12]. Interaction of the analyte with a sensing element leads to changes in its chemical or physical properties thus fulfilling the recognition function of a sensor. Transduction is responsible for converting this change into a measurable quantity. Physical principles of recognition and transduction distinguish various sensing technologies and define their capabilities and limitations.

2.1. Recognition and Transduction Mechanisms

Gas sensors commonly employ two predominant methods for recognition: ion recognition and gas sorption. Ion recognition involves the use of materials and reagents carrying a charge opposite to that of the analyte ion. This allows for effective identification and measurement. On the other hand, gas sorption methods rely on the absorption of gas either on the material’s surface (adsorption) or within its structure (absorption), facilitating accurate recognition and detection.
The transduction methods used in gas sensors are more versatile and include thermometric, resistive, capacitive, electrochemical, optical, acoustic methods, and their various combinations. In particular:
  • Thermometric transduction is based on the registration of the thermal effect of a catalytic reaction of the analyte near the surface of a sensing element. It is suitable for catalytic processes that generate a lot of heat such as the combustion of flammable gases.
  • Resistive/capacitive transduction is based on measuring the change of the resistance/capacitance of the sensing material due to interaction with a gas.
  • Electrochemical transduction is based on measuring the change in electrical potential or current due to ion/electron transfer reactions at the surface of a solid sensing element.
  • Optical transduction is achieved by detecting modulation of some properties of electromagnetic radiation in ultraviolet–visible–infrared domains during its interaction with a sensing element that is commonly the gas itself.
  • Acoustic transduction entails the measurement of the characteristics of acoustic waves produced within the sensing element as a result of the recognition process.
Additionally, sensor arrays, multivariable sensors, and smart sensors equipped with data-processing capabilities can combine multiple recognition and transduction mechanisms in a single device often leading to enhanced performance of the sensor.

2.2. Performance Characteristics

Sensor characteristics are often summarized as “4S”: sensitivity, selectivity, stability, and speed of response and recovery. More detailed characterization of the sensor performance can be described by the following parameters [11,12,13]:
  • Selectivity is the extent to which a sensor can determine a particular analyte without interfering with other components.
  • Operating limits, detection and quantification capabilities:
    • sensitivity is the change in a sensor’s response to the unit change in concentration,
    • limit of detection (LOD) is the lowest concentration level that can be distinguished from the absence of a substance (blank value, y b ) within a stated confidence interval,
    • response range is the range between LOD and the concentration at which the sensor response starts to significantly deviate from the calibration function,
    • resolution is the smallest detectable change in concentration. It is the ratio of the smallest detectable change in response to the sensitivity of a sensor.
  • Environmental characteristics (operating temperature, humidity, etc.) within which the sensor maintains its accuracy.
  • Dynamic characteristics:
    • warm-up time is the time delay between the excitation signal and the moment when the sensor can operate within its specified accuracy,
    • response time is the time required for a sensor to attain a stationary response after adding the analyte.
  • Reliability of the measurement, defined by the
    • accuracy is the discrepancy between the measured and true concentrations,
    • precision is the discrepancy between independent measurements under similar conditions.
  • Lifetime, stability, reversibility: drift or aging is related to irreversible degradation of sensor materials.
  • Response to harsh conditions as defined in UL and MIL-STD-883 standards.
Sensing characteristics of different technologies are limited by the physical nature of their sensing mechanism. In the following sections, we provide a review of suitable technologies, their sensing mechanisms, advantages and limitations, and potential strategies for improvement.
Based on the desired performance characteristics described above, a comprehensive multi-objective test campaign can identify the suitable sensor for an application in question. For instance, some sensors may be exposed to harsher environments compared to others (e.g., include humidity, poisoning species such as NOx, CO, cleaning solvents, etc.). In such cases, the envisioned test matrix in Table 4 will easily identify the operational boundaries and sensitivities and help the user in selecting the appropriate sensor solution.

3. Electrically Transduced Sensors

Electrical transducers convert the physical response of the sensing materials into electrical signals that can be reliably correlated with the measured physical quantities. Semiconductors and electrochemical cells are the most widespread sensing materials realizing this transduction mechanism.

3.1. Semiconductor Sensors

The principle of semiconducting sensing materials relies on changes in charge density at the semiconductor surface resulting from the sensor’s interaction with ions or molecules in the gas analyte. This, in turn, alters the material’s electrical properties, such as conductivity, allowing correlation with gas concentration.
The change in material properties can be conveniently explained using band theory [14]. Electronic bands represent energy ranges where electrons in a material can exist, while the band gap denotes an energy range devoid of electron states. Semiconductors have a relatively large gap between their valence and conduction bands, which lie just above and below the Fermi level—an energy level that electrons have with a probability of one-half. Under normal conditions, the valence band is predominantly occupied, and the conduction band is nearly empty, creating a sizable band gap that prevents electrons from transitioning from the valence to the conduction band, resulting in limited conductivity in the material.
The conductivity of semiconductors can be altered through material doping with impurities or by applying external electric or magnetic fields. When impurities with an excess of electrons relative to the intrinsic semiconductor are added, the Fermi level shifts toward the conduction band, enabling electrons to occupy energy levels at the bottom. Such materials are known as n-type semiconductors because the dominant charge carriers are negatively charged electrons. In contrast, doping elements with fewer electrons shifts the Fermi level towards the valence band, allowing for a relatively large probability of unoccupied electron states, known as holes. The charge carriers in these materials, called p-type semiconductors, are positively charged holes. Due to the different dominant charge carriers in n-type and p-type semiconductors, their electronic and related gas-sensing mechanisms are quite distinct.
Semiconductors make good sensors because their properties can be manipulated upon exposure to external conditions such as temperature, light, heat, mechanical stress or chemicals [15]. Common semiconductor materials for gas sensing include metal oxides, conducting polymers, carbon nanotubes, and 0-, 1-, 2-D materials [13]. Metal oxides are the most mature and widespread in commercial sensors.

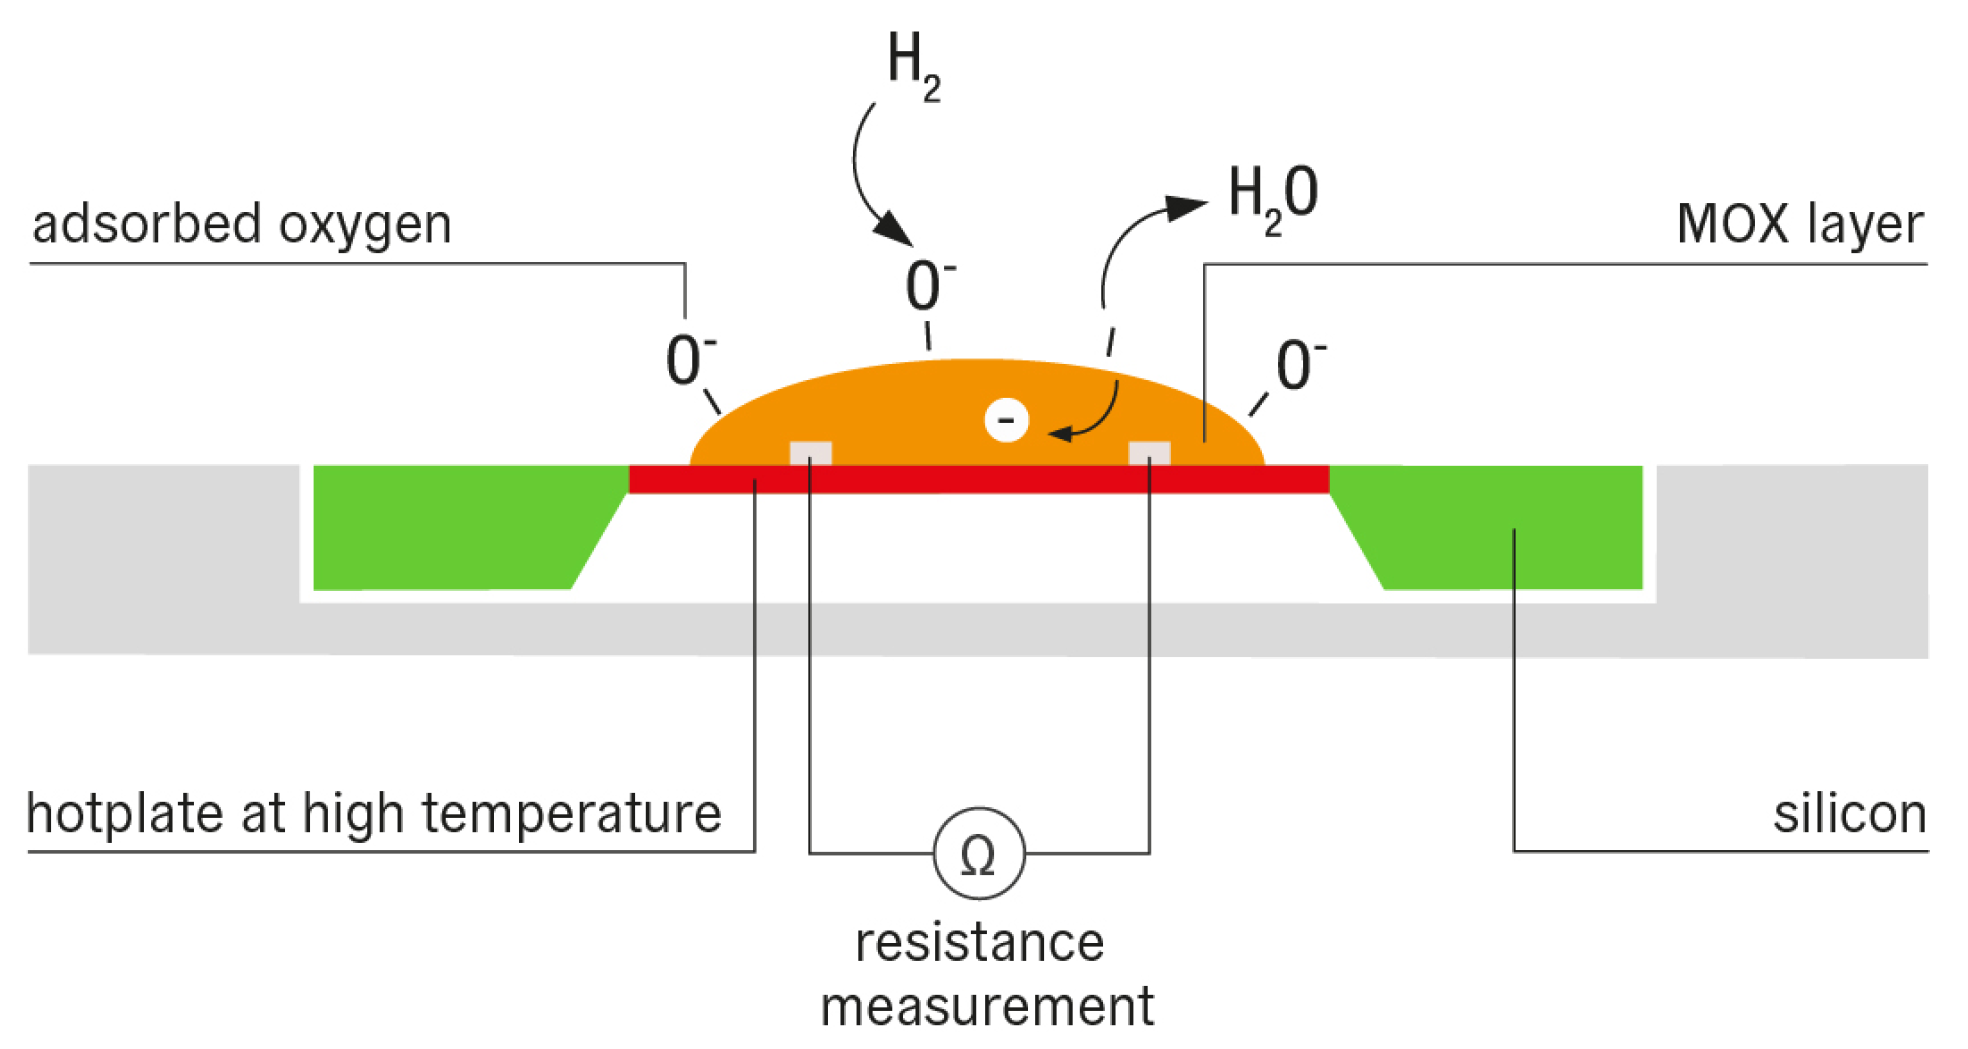
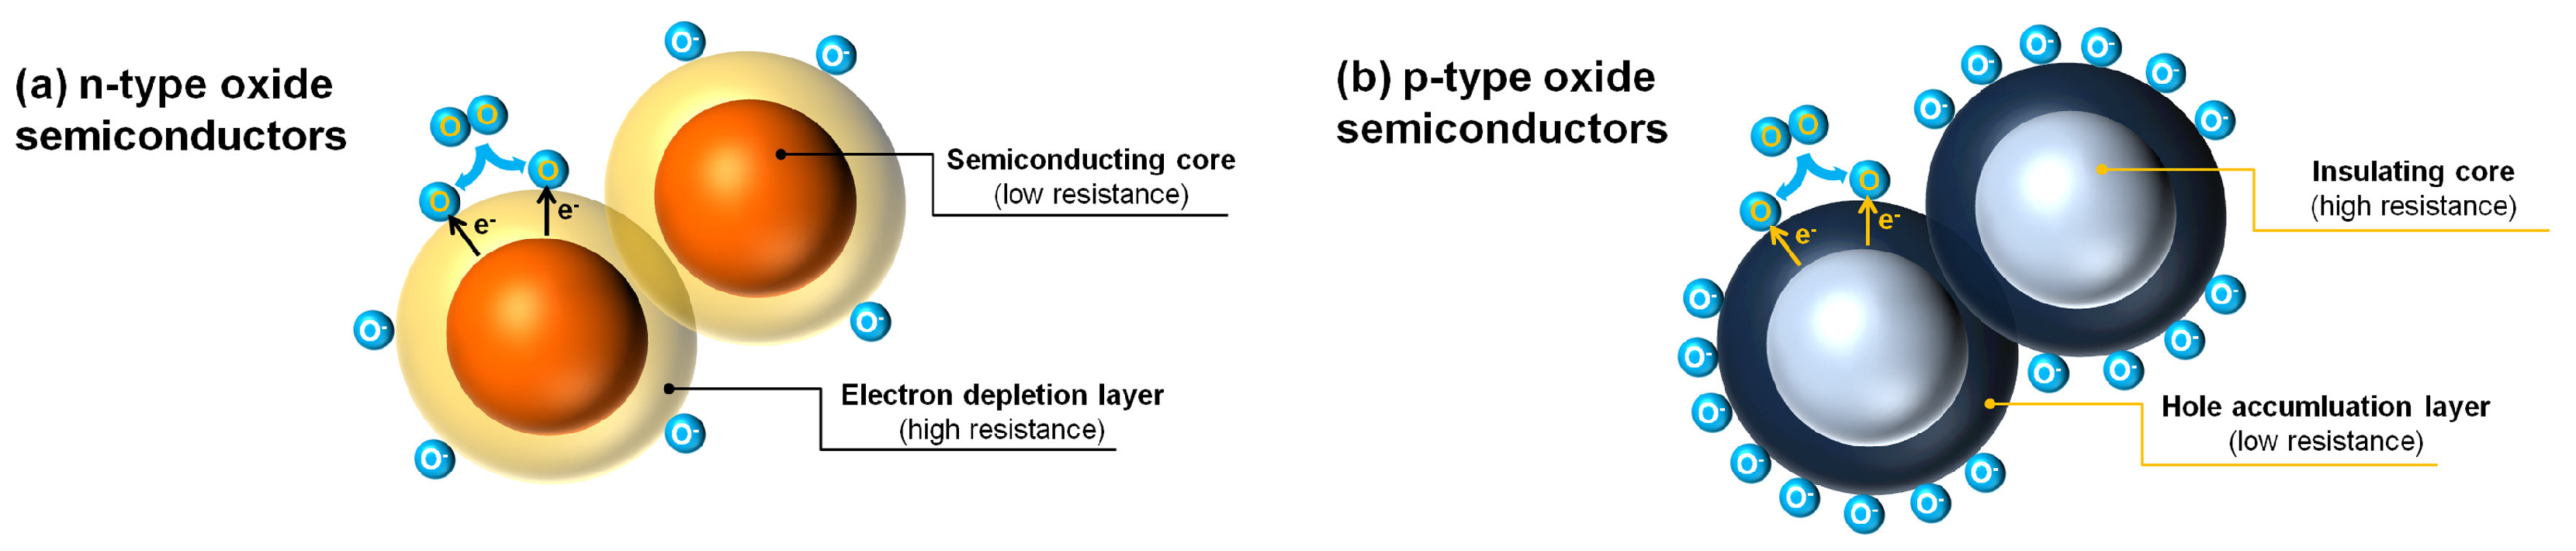
3.1.1. Metal Oxide Semiconductors (MOS)

Standard semiconductors are obtained by doping a silicon crystal with the donors (n-type) or acceptors (p-type) of the electrons. In contrast, semiconductivity in metal oxides is a result of a nonstoichiometry, i.e., the vacancy of oxygen or metal ions in n- or p-type semiconductors, respectively, [16]. These materials have a large band gap which allows them to demonstrate a wide range of electronic properties, from insulating to semiconducting. Typical n- and p-type MOS materials are Z n O , S n O 2 , T i O 2 , W O 3 , F e 2 O 3 , and C u O , N i O , C r 2 O 3 , C o 3 O 4 , M n 3 O 4 , respectively.

Sensing Mechanism

Metal oxide sensors are chemoresistive gas sensors [17]. The gas-sensing mechanism of MOS materials can be explained using microscopic or macroscopic approaches. Microscopic methods explain the change in the electrical properties of MOS materials at a fundamental theoretical level using mechanisms such as Fermi level control theory, grain boundary barrier control theory, and EDL/HAL theory. Macroscopic methods focus on the interaction of the gas and the sensing material, e.g., adsorption/desorption models fall into this category [18]. Understanding these sensing mechanisms is important for identifying potential directions for improving the sensing performance of MOS sensors.
Oxygen adsorption is a major mechanism used to describe the sensing properties of MOS materials (Figure 1). Oxygen from the ambient air is adsorbed at the surface of a heated semiconductor where it takes the electrons from the material and, depending on the temperature, forms anions such as O 2 (<150 ), O (between 150 and 400 ), or O 2 (>400 ). This leads to the formation of an electronic core-shell configuration, i.e., a semiconducting core with a resistive electron-depletion layer in n-type oxide semiconductors, or an insulating core with a semiconducting hole-accumulation layer (HAL) in p-type oxide semiconductors (Figure 2). When an n-type sensing material is exposed to the reducing gas, the gas is oxidized by the ionized oxygen and electrons are released back into the shell. This reduces the resistance of the shell-to-shell contacts between the MOS particles and hence reduces the overall measured resistance of the sensing layer. In contrast, the conductance in p-type materials occurs along the narrow shells surrounding the insulating core, the injection of electrons reduces the number of hole carriers in the shell which in turn decreases the thickness of the HAL and increases the resistance of the sensor. However, if the size of MOS particles is large, the change in the HAL thickness will have only a minor impact on the change in its resistance. For example, it has been reported that the sensitivity of p- vs. n-type MOS materials with equivalent morphologies follows the square root relation S p = S n [19]. This relation makes the design of sensitive p-type MOS materials more challenging.
Another sensing mechanism employs the direct chemical adsorption of a gas at the surface of a MOS material. For example, in the reaction 2 H 2 S + S n O 2 S n S 2 + 2 H 2 O , the presence of S n S 2 can reduce the bulk resistance of the MOS grains, thereby increasing sensitivity [20]. This mechanism is often overlooked and rarely used to describe the sensing properties of metal oxides. Its impact on the sensing process in practical conditions is yet to be studied. In particular, the presence of S n S 2 in the above reaction can impact the recovery time of a sensor because a certain amount of time is required to convert S n S 2 back to S n O 2 .
Physical adsorption is yet another mechanism resulting from the interaction of the MOS with a gas by means of intermolecular forces without chemical changes. In most cases, its impact on the sensing properties of MOS is negligible.
As mentioned above, the formation of specific oxygen anions at the surface of MOS is temperature dependent. Higher temperatures of the hotplate lead to the formation of reactive O or O 2 resulting in a high rate of the surface chemical reaction and, as a result, higher sensitivity. At lower temperatures, less reactive O 2 anions are formed and gas diffusion into the pores of the sensing material becomes a rate-determining step emphasizing the impact of the surface morphology on the sensing properties of MOS [21]. Temperature dependence of the sensitivity of MOS materials should be taken into account in the design of sensors for flammable gases.

Advantages and Limitations

Metal oxides were first used in a commercial sensor in the 1960s and still remain the most commonly used gas-sensing material. The advantages of using MOS sensors include low cost, easy fabrication, simplicity of use, high sensitivity to various gases, high stability, and reasonably short response time. The main disadvantages are low selectivity, high power consumption, high operating temperature, and long recovery period after gas exposure [13].
The majority of commercially available MOS sensors are of n-type. p-type MOS sensors are less widespread due to their lower sensitivity. However, existing research results show significant potential for developing p-type sensors with enhanced selectivity [16]. Reduced response to humidity is another potential advantage of p-type over n-type MOS sensors.

Strategies for Improvement

Selectivity, response time, operating temperature, and to lesser extent sensitivity are the main targets for improvements in MOS sensors. Strategies for improvement can be put into three main categories: (a) increasing the surface reaction rate, (b) increasing electron transfer speed in the material, and (c) increasing the rate of gas diffusion into the surface of the material [18]. The means for achieving these goals include surface functionalization, heteroatom doping, heterojunctions, and morphological design.
Surface functionalization is most commonly performed by loading nanoparticles of noble metals, such as A u , A g , P t , and P d , onto surfaces of metal oxides. Electronic and chemical sensitizations are two mechanisms that best describe the outcome of such enhancement. Electronic sensitization refers to the improvement of the gas response of the material by changing the concentration of charge carriers [22]. The work function, i.e., the energy required to remove an electron from a material, of noble metals is higher than that of MOS materials. Hence the redistribution of charge at the interface with the noble metal is required to achieve an equilibrium. This prevents the recombination of separated electron-hole pairs and improves the gas response of the MOS. Chemical sensitization refers to the ability of noble metals to catalyze certain surface reactions. The gas adsorbs on a noble metal cluster, dissociates and produces active atomic species that migrate to the surface of metal oxide and accelerate the chemical adsorption [18]. Significant increases in gas adsorption and reduction in sensing temperature have been also reported as outcomes of the surface functionalization with noble metals. However, this process can increase the risk of material failure caused by catalyst poisoning, i.e., the deactivation of catalyst due to chemical reaction.
Heteroatom doping is achieved by substituting base metal atoms in MOS with atoms of other metals, non-metals or rare earth elements. This changes the energy band structure, but may also change the specific surface area and porosity of the material leading to improved sensitivity. Higher selectivity of doped p-type MOS material has been also observed due to increased catalytic activity [16]. At the same time, care should be taken when metals are used as dopants because it may also decrease the Fermi level of the material reducing its sensing ability [23].
The morphological design of MOS materials has a significant impact on their electron transfer properties since the total resistance of the sensing layer is controlled by the bulk resistance of the MOS grains and the resistance of the interparticle contacts [24,25]. The large surface-to-volume ratio of nanostructures is what makes them particularly useful for enhancing the sensing properties of materials. Table 5 provides a classification of typical nanostructures employed in MOS sensors [26]. The main advantage of 0D materials is their largest among all nanostructures specific surface area. Another advantage is attributed to the possibility to design the particles of size smaller than twice the Debye length, the penetration depth of the charge carrier redistribution. In this case, the electron depletion layer penetrates the entire material and the response of the sensor reaches its maximum [27]. 0D nanoparticle MOS sensors with a high and fast response at rather low operating temperatures (60 °C) have been reported in the literature [28]. The benefits of 1D materials include well-defined crystal orientations, controlled unidirectional electrical properties, and self-heating phenomenon. The availability of large-scale fabrication methods for nanowire growth also makes it possible to develop low-cost and highly efficient and stable gas-sensing devices. Additionally, 1D nanotubes with meso- and macro-sized pores have been shown to facilitate gas diffusion into the material leading to improved sensing properties [29]. Similarly, 2D materials with porous nanostructures have demonstrated ultra-high response, short response time, and low detection limit under relatively low operating temperature (120 °C) [30]. The main challenge in the design of sensing nanostructures is to make full use of their properties. For example, the uniform distribution of 0D nanoparticles is crucial to achieving the above-mentioned benefits. Several approaches to tackle this challenge have been proposed including three-dimensional hierarchical design of nanostructures comprised of lower dimensional MOSs [31], assembly of 1D MOSs in 3D stacks [32], layered nanostructures comprised of 2D nanosheets [33], and highly macro-mesoporous structures functionalized with noble metals [34].
It is difficult to achieve the optimal parameters of a MOS sensor based on a single material. A possible step towards achieving this goal is the design of heterojunctions, i.e., the contact transition zones between MOS materials with different properties. In p-n junctions, due to different Fermi levels of the materials, the ‘band bending’ is formed at the interface. The holes from p-type MOS move into n-type MOS and the electrons move in the opposite direction. This leads to larger electron depletion layer and hence larger sensitivity. In n-n heterojunctions, the electrons accumulate at the surface of the material with a lower energy conduction band state, and a larger electron depletion layer is hence formed in the other material. It is worth noting that heterojunctions may disappear upon contact of the material with the target gas which can reduce it sensitivity. It was also shown that the sensing mechanism of such materials is different from standard redox reactions of a typical MOS [35].
Reducing the operating temperature of MOS sensors is important for safe detection of flammable gases. High-working temperatures can also impact the lifetime and long-term stability of sensors due to possible degradation of the sensing material. Unmodified MOS materials achieve best sensitivity at temperatures above 400 °C. As mentioned above, noble metal functionalization and heteroatom doping can increase the sensitivity of MOS materials and enable their efficient application at lower temperatures. Light activation is another such mechanism [36,37]. Moreover, since the best sensing temperature varies for different gases, such temperature variations can be also used to improve the selectivity of MOS sensors by choosing the temperature with best sensitivity and response time [38,39]. Catalytic filtering [40] and membrane coatings [41] have been also proposed to improve the selectivity of MOS sensors.
Finally, miniaturization of MOS sensors can have a positive impact on the selectivity via the design of sensor arrays [42] and on the power consumption by replacing ceramic substrates with microelectromechanical (MEMS) heaters [43].

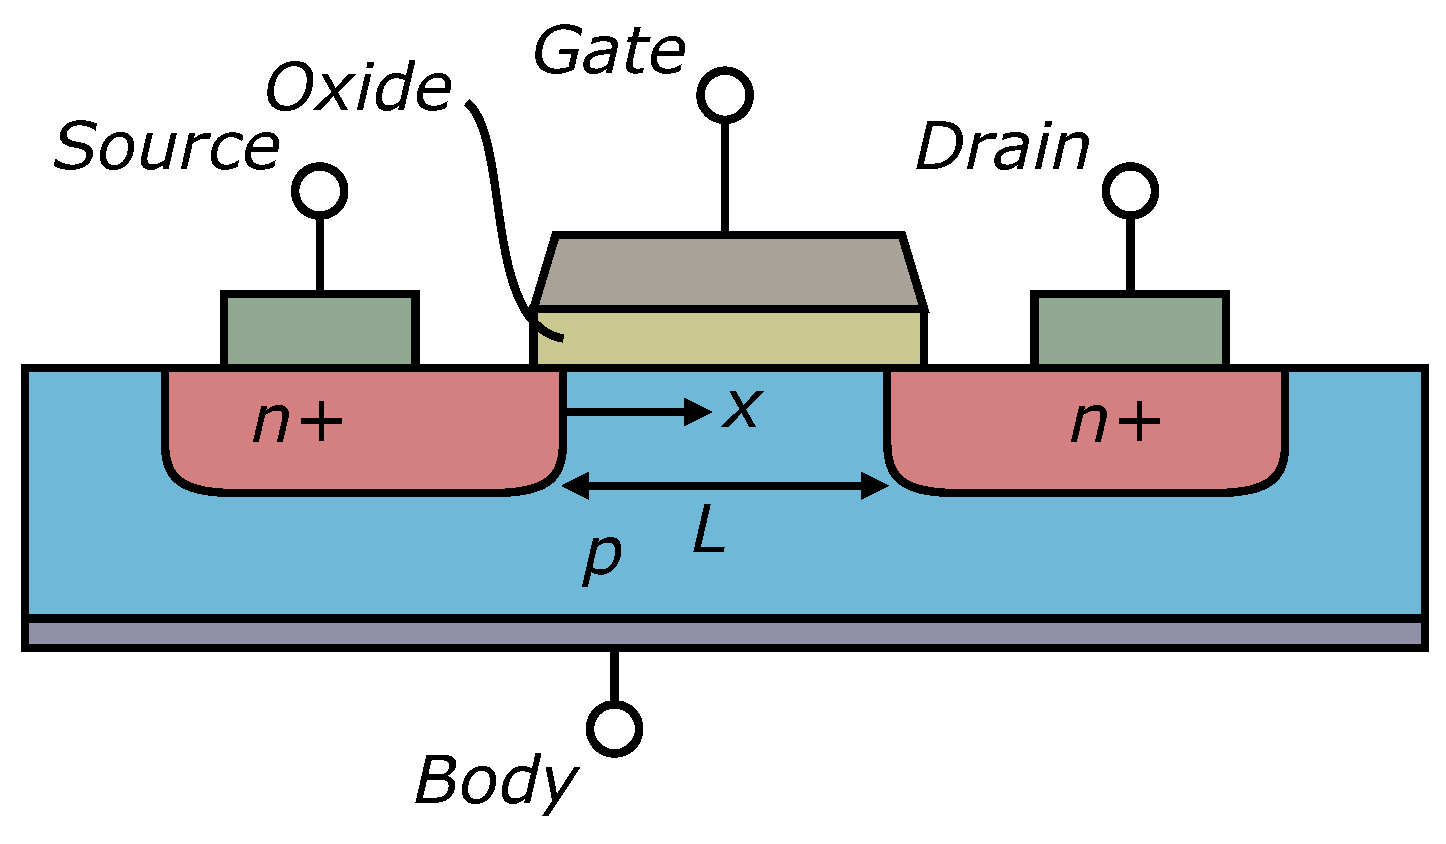
3.1.2. Field Effect Transistors (FET)

Field effect transistors operate by tuning the current flow by means of an electric field applied to a semiconducting material. Hence, they operate more as transducers while the recognition mechanism is realized by a sensing material that can change electrical properties upon interaction with an analyte. The sensing material in FET sensors plays the role of either the transistor gate or the channel. The particular configuration of the source, drain, gate, and sensing layer leads to various types of FET gas sensors, e.g., thin-film transistor (TFT), catalytic metal gate FET, suspended gate FET (SGFET), capacitively coupled FET (CCFET), and horizontal floating-gate FET (HFGFET). Various sensing materials have been proposed for FET sensors including organic materials, metal oxides, 2-D materials such as graphene, solid electrolytes, and transition metal dichalcogenides [44].

Sensing Mechanism

Figure 3 illustrates the cross-section of a typical metal-oxide field effect transistor (MOSFET). This device comprises a substrate of p-type, flanked by two n-type regions designated as the source and the drain. An insulating oxide layer is present, overlaying the substrate, and atop this resides a slender metallic layer known as the gate. Applying voltage between the source and drain does not lead to current flow within the channel connecting them, as one of the p-n junctions prevents it. When a positive electric charge is applied to the gate, it attracts available electrons from the source toward the substrate layer. This attraction initiates current flow in the channel, effectively transforming the p-type substrate into an n-type configuration in the region beneath the gate, known as the inversion layer. The inversion layer is activated only when a certain threshold voltage is applied, and the current through the channel varies nonlinearly with respect to the drain voltage. The variation in threshold voltage is the main response parameter measured by FET gas sensors.

Advantages and Limitations

The main advantage of FET gas sensors is their compatibility with the CMOS fabrication process. This allows high-volume fabrication of gas sensors integrated with CMOS circuits and micro heaters on a single chip. CMOS circuits can be used to process the sensor output signal, amplify it, and calibrate changes in environmental conditions. Moreover, TFT gas sensors are multi-parameter devices that can simultaneously measure threshold voltage, transconductance, field-effect mobility and drain current. This property can be used to design sensors with improved selectivity, see Section 5. Unfortunately, currently proposed FET sensors suffer from short lifetime, drift, interference with humidity, and slow response time on the order of tens of seconds to minutes [44].
Further improvements in sensing materials, transducers, and micro-heaters are required to enable the widespread commercial application of this technology.

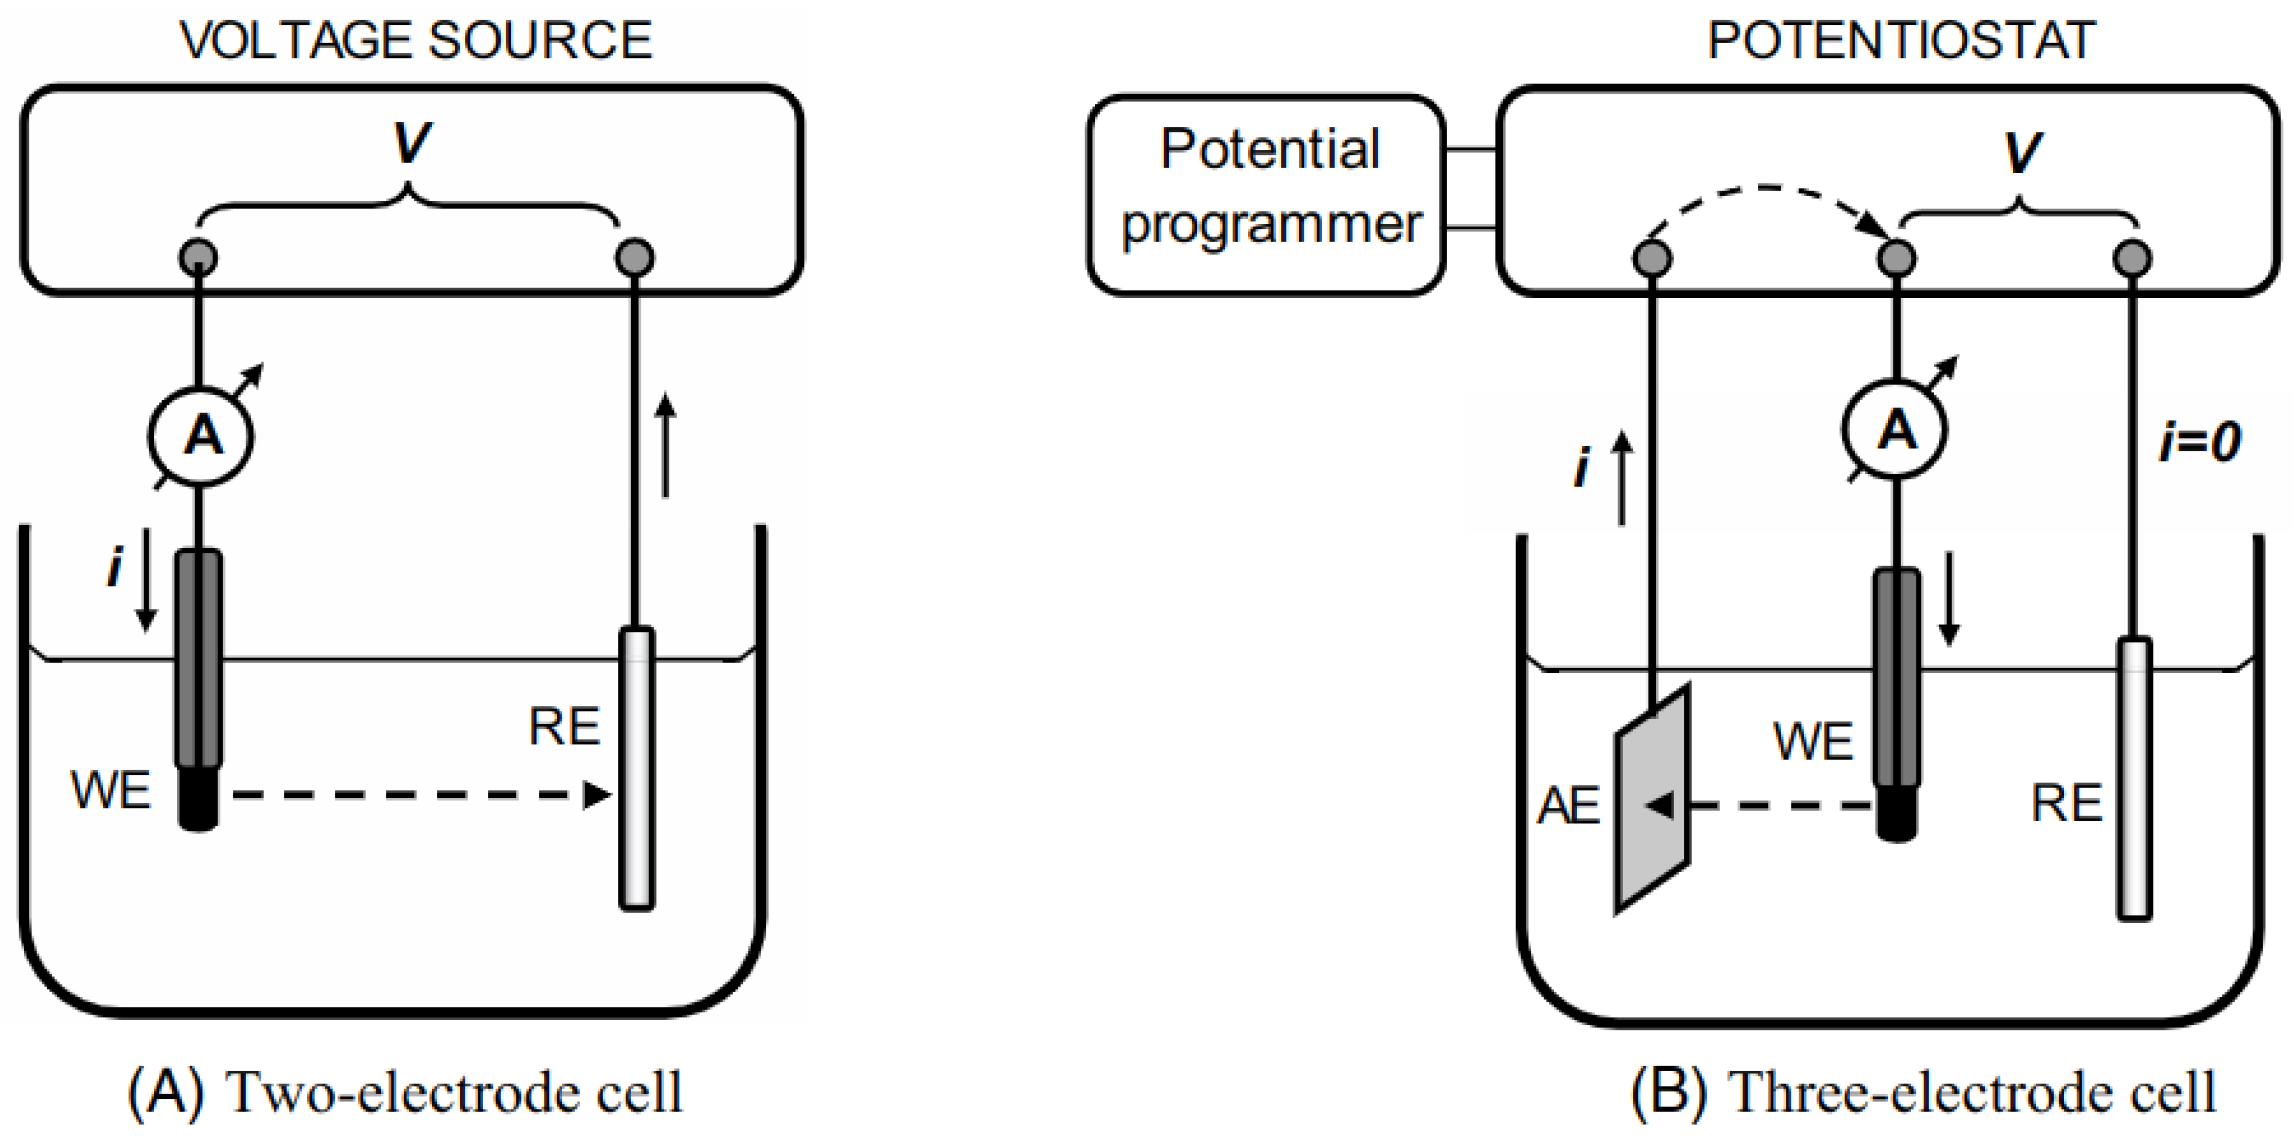
3.2. Electrochemical Sensors

Electrochemical sensors are two- or three-electrode devices implementing an ion-recognition sensing mechanism in a galvanic cell that consists of two half-cells, one of which is considered as the reference, see Figure 4. Each half-cell is comprised of an electrolyte and an electrode. The redox reactions at the surface of the electrodes produce the flow of electrons in a cell enabling the sensing mechanism. Selectivity to specific analytes is commonly achieved by adding ion-sensitive membranes between the electrolyte solutions, or by electrode coatings. Additionally, electrochemical gas sensors also contain a gas-permeable membrane to obtain an electrolyte solution in a working cell. The permeability properties of these membranes and coatings can have a significant impact on the performance of the sensor.

3.2.1. Sensing Mechanism

Electrochemical reactions can be monitored under either static or non-equilibrium conditions [11]. In the static case, the overall reaction rate is zero and the recognition mechanism is realized via potentiometric methods by measuring the electromotive force of the cell. The Nerst equation provides a basis for such a registration mechanism:
E = E 0 + R T n F ln c O c R ,
where E 0 is the formal potential fixed for the current cell configuration, R is the universal gas constant, T is the temperature, n is the ion charge, F is the Faraday constant, and c O , c R are the concentrations of the oxidized and reduced analytes.
In the non-equilibrium case, reactions proceed in a definite direction and the registration is achieved by measuring the current, i.e., such methods are amperometric. The cell’s configuration ensures that the analyte interacts solely with one of the two electrodes, referred to as the working electrode, see Figure 5. The pace of the reaction and, consequently, the resultant electrolytic current hinge upon the electrical potential applied to this specific electrode. This mechanism is described by the relationship
V = E w E r + R s i ,
where V is the applied voltage, E w and E r are the potentials of the working and reference electrodes, R s is the electrical resistance of the solution, and i is the electrolytic current. The measured current can be used to determine the required concentration by using the concept of the Nerst diffusion layer at the surface of the working electrode. This allows adopting the Nerst equation for measuring the concentration to the non-equilibrium case.

3.2.2. Advantages and Limitations

Electrochemical sensors are highly sensitive, have good selectivity to target gases, and are energy efficient. They provide linear measurements that allow to measure a real zero and have outstanding potential for miniaturization because their properties are largely independent of the number of reactive sites of the electrode. However, they have a narrow operating temperature range that limits their operation in cold weather and are cross sensitive to alkaline metals and silicone vapors [46]. Additionally, they have a short lifetime and need maintenance and calibration of the electrolyte solution [44]. Moreover, their dynamic characteristics depend on the gas diffusion rate through the membrane and/or on the time required to attain equilibrium in a cell.

3.2.3. Strategies for Improvement

Electrochemical sensors are among the most mature and polished sensing technologies. The current iteration of this technology has removed some of its inherent limitations, e.g., extending the temperature range by using ionic liquids as the ion conductor [46]. However, further improvements become increasingly challenging. For this reason, when compared to other well-established technologies such as MOS and NDIR, electrochemical sensors are usually not considered for refrigerant sensing [7,8].

4. Spectrochemical Sensors

Optical sensing methods rely on the interaction of electromagnetic radiation with an analyte or its chemical compound. The registration mechanism of such interaction is achieved either by spectrochemical methods via measuring the radiation power absorbed or emitted by the sample, or by optical monitoring of the physical property of the sensing layer upon its interaction with an analyte [11]. As a physical device, an optical sensor contains three components: light source, waveguide, and detector. Technological advancement in the field of optical gas sensing usually involves improvements to one or several of these components.

4.1. Absorption Spectroscopy

Due to the quantum mechanical nature of the interaction of light with materials, chemically bonded atom systems can absorb or emit light only at specific wavelengths that correspond to the quantization of electron energy levels [47,48]. Absorption or emission of light can occur in different spectral regions from ultraviolet to visible to infrared. The infrared (IR) region is characteristic of the vibrational modes of many gas molecules and is most often employed in practice. Strong absorption features are commonly observed in non-symmetrical molecules due to dipole-allowed transitions between electronic, vibrational, or rotational states [49,50].

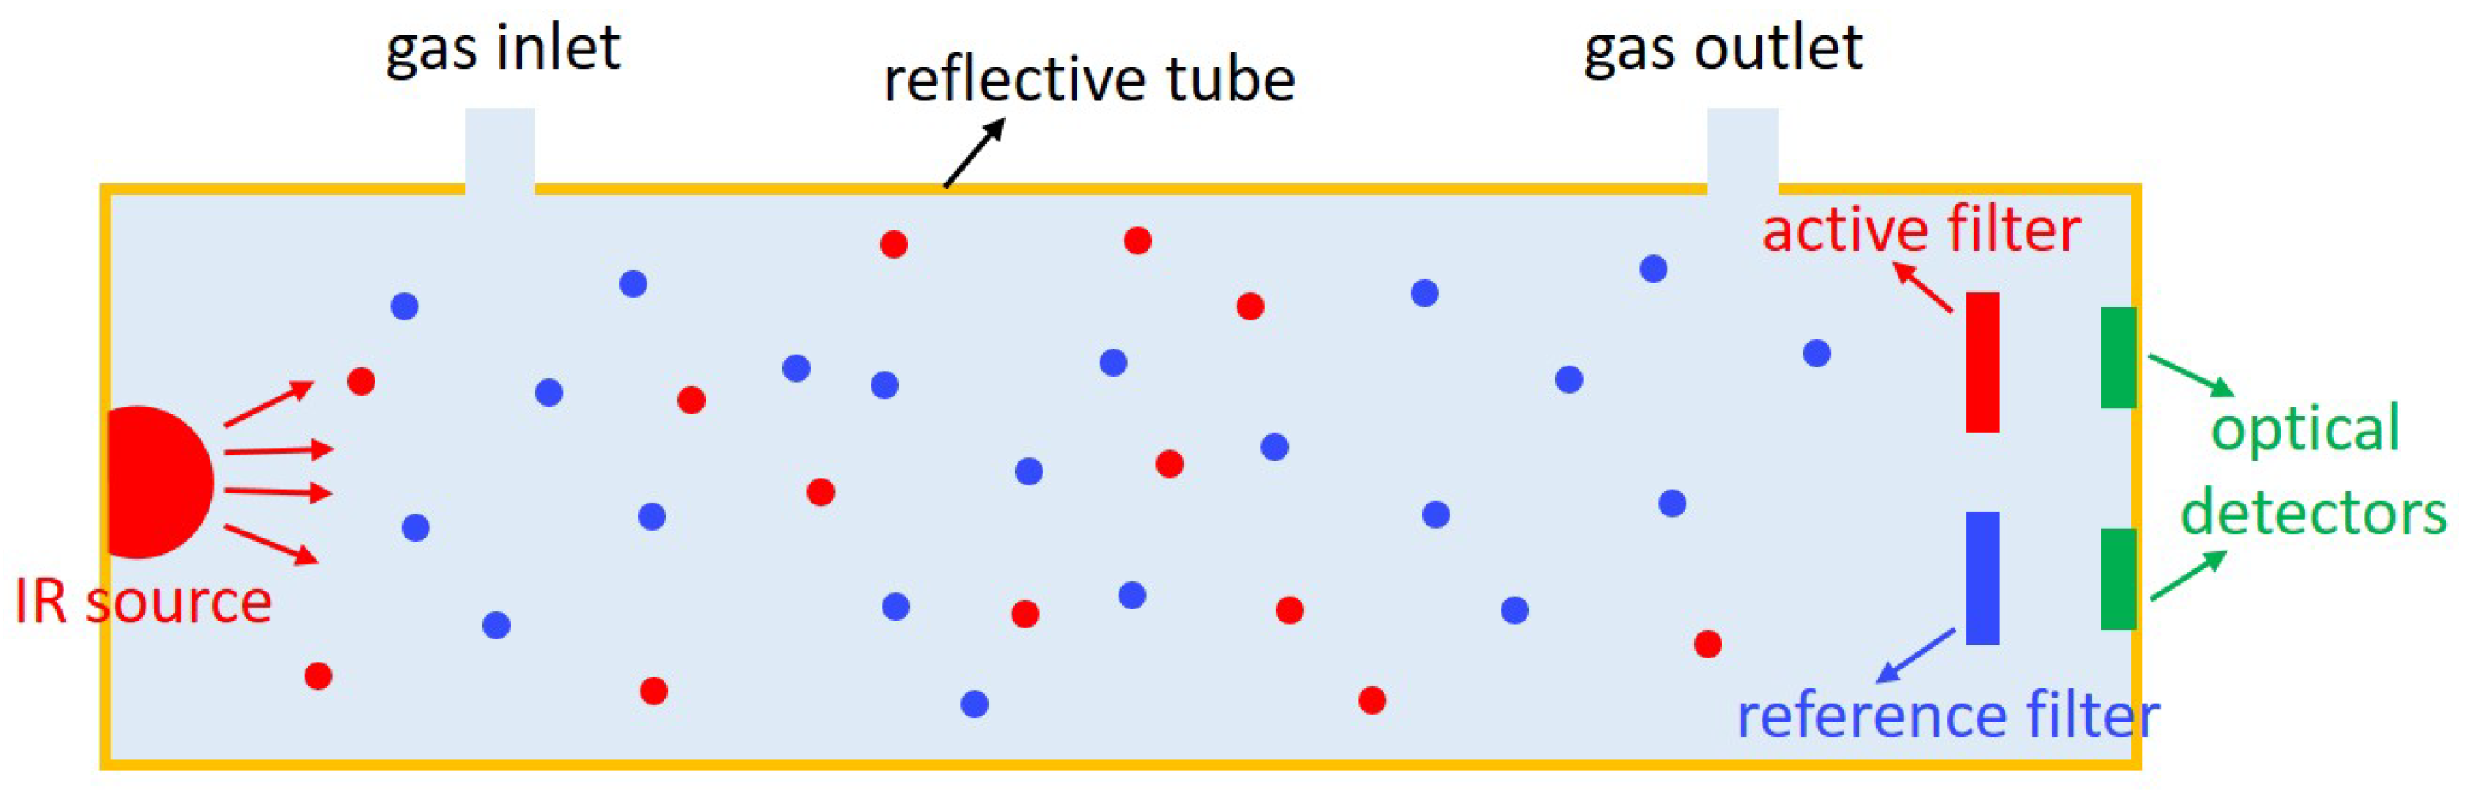
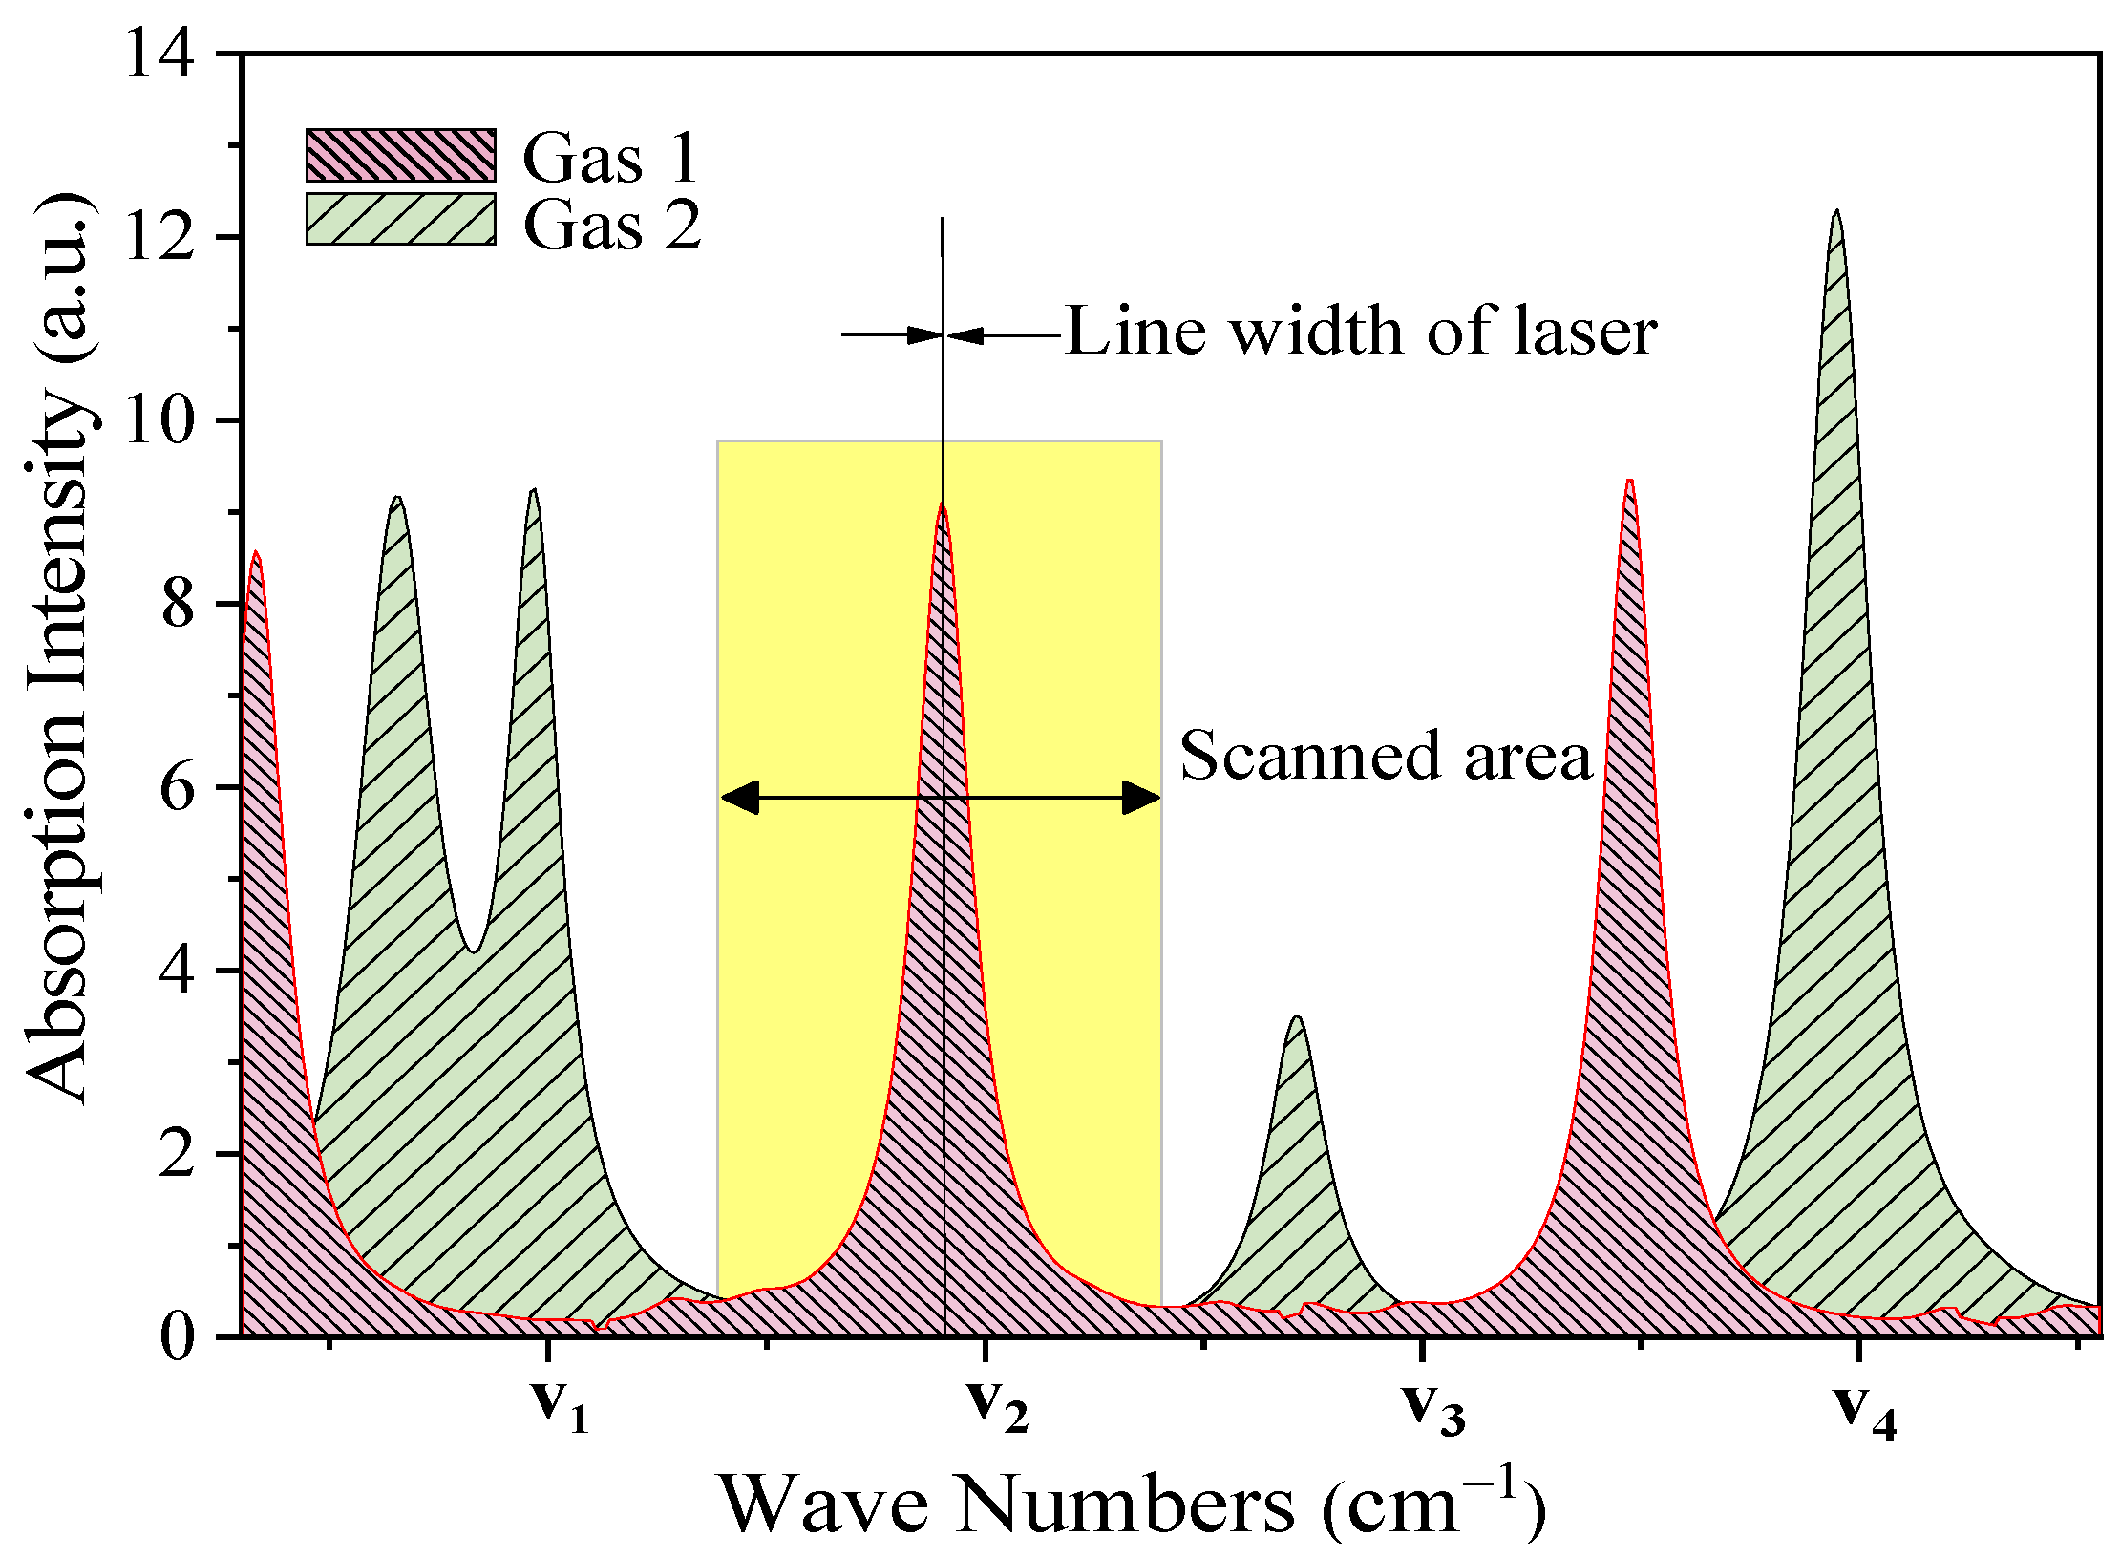
4.1.1. Sensing Mechanism

The mechanism of light absorption spectroscopy is based on measuring the intensity of light passing through the analyte. This process is well described by the Beer-Lambert law
I ( λ ) I 0 ( λ ) = e k p , T ( λ ) c L ,
where I 0 ( λ ) is the initial intensity of the light beam with the wavelength λ emitted by the source, I ( λ ) is the detected intensity of the beam after traversing the gas chamber, c is the target gas concentration, L is the optical path length, and k p , T is the absorption cross section that depends on the pressure, temperature and the wavelength. Hence, the concentration is directly proportional to the measured absorbance A ( λ ) = log I 0 ( λ ) I ( λ ) . The optical path length and the absorption cross section are the physical parameters that can be adjusted to ensure the maximum sensitivity.
Common absorption-based sensing technologies include nondispersive infrared spectroscopy (NDIR) and its recent enhancements such as tunable diode laser absorption spectroscopy (TDLAS), photoacoustic spectroscopy (PAS), and photothermal (PTS) spectroscopy methods. NDIR is a nondispersive technique in the sense that no dispersive elements are necessary to separate the light beam into its spectral components, see Figure 6. In its standard configuration, NDIR utilizes relatively low-resolution broadband light sources and detectors. Three major types of used IR emitters are filament-based lamps, microelectromechanical (MEMS) heaters, and light emitting diodes (LED) [50]. A filament lamp is a simple and low-cost solution that was historically the first choice of IR emitters and is still utilized in commercial sensors today. The main disadvantages of bulbs are the bulkiness, high power consumption, and limited emitted spectrum due to the glass cover of the lamp. MEMS heaters have better energy efficiency and reliability, fast response time, and small size. They are usually combined with collecting and projecting cups to concentrate the beam precisely on the detector. Another advantage of MEMS emitters is their compatibility with a standard semiconductor manufacturing process that allows for mass production and utilization of advanced material properties at micro and nano scales. Similarly to MEMS emitters, LED emitters have low power consumption, good stability, and the ability to generate relatively narrowband IR light.
Conventional detectors utilized in NDIR sensors are thermopiles, bolometers, pyroelectric detectors, and photodiodes. Thermopiles, bolometers, and pyroelectric detectors are devices to measure radiant heat. Bolometers have the disadvantage of slow response time and low selectivity, and thermopiles are prone to a high noise-to-signal ratio. The noise levels of pyroelectric detectors are at least one order less which, combined with low cost and high resolution in the mid-IR spectrum, makes them a better choice for the detector. Photodiodes operate by measuring the photocurrent and have the advantage of low power consumption and high stability. High operating temperature is a possible disadvantage of photovoltaic diodes.
Laser-based gas detection techniques improve on the NDIR approach by using lasers as light emitters. Modern quantum cascade lasers and interband cascade lasers are reliable, have much better spectral resolution than conventional IR sources, and are capable of long-term and maintenance-free operation [52]. In TDLAS, a single-mode telecom-type diode laser is centered onto one of the fine absorption lines corresponding to the desired gas. Typically, each gas measurement necessitates the use of a distinct laser. Subsequently, the laser is fine-tuned over a narrow spectrum by manipulating temperature or current. This tuning procedure scans the absorption line, ultimately yielding information regarding gas concentration, as depicted in Figure 7. Thanks to the exceptional precision of these absorption lines, the susceptibility to interference from other gases is virtually negligible. Nonetheless, it is worth noting that telecom-type laser diodes are exclusively accessible at wavelengths reaching up to 2.7 µm while most of the fundamental gas absorption lines are in the range between 3 and 9 µm. Instead, TDLAS is commonly applied to measure first overtones of the absorption bands. This allows the use of affordable near-infrared telecom lasers and detectors [53].
Similarly, PAS improve on the NDIR and TDLAS approaches via enhancing the detector component of the sensor, see Figure 8. The sensing principle of such systems is based on measuring the local pressure variations induced along the modulated excitation laser beam [49]. These pressure variations can be detected with sensitive microphones [55]. Outstanding progress has been recently achieved after inventing the quartz-enhanced photoacoustic spectroscopy (QEPAS) that substitutes microphones with tuning forks. QEPAS systems are among the most sensitive chemical sensors proposed to date.

4.1.2. Advantages and Limitations

The advantages of modern absorption-based spectroscopic methods include high sensitivity, low power consumption, low operating temperature, better selectivity and response time than those of the conventional MOS sensors. Since the sensing principle is based on the intrinsic properties of a gas and does not involve chemical reactions, the method also demonstrates high stability, low drift, and long lifetime.
Possible disadvantages of broadband NDIR sensors include interference with water vapor due to its significant absorption in the infrared region, potential interference between multiple gases due to limited resolutions of the light source and detector, and high detection limit [49,56]. The bulkiness of the device due to the potentially complicated lens system might be also considered a disadvantage of some sensors. Laser-based approaches allow some of the interference issues to be resolved.

4.1.3. Strategies for Improvement

The main targets for improvement in absorption-based optical sensors are selectivity and detection limit. The main strategies for improvement are enhancing properties of light sources and detectors and optical design of the waveguide.
The cross-sensitivity of NDIR sensors is due to the overlapping absorption bands of different gases and the relatively low resolutions of standard sources and detectors. The final output of such sensors is essentially the result of the spectral convolution of both the emitter and the detector [49]. Standard approaches to resolve this issue are by means of optical bandpass filters added to the source and/or detector. High-precision sources and detectors that became available in recent years can resolve this issue directly. For example, efficient high-resolution photothermal detectors have been proposed recently; these detectors rely on detecting the extremely small variations of the refractive index of the measured gas sample due to localized density changes generated similarly to PAS [57]. Most recent works also considered two-dimensional nanomaterials based on graphene, transition metal oxides, and other layered materials as photodetectors [58,59]. The development of new and refinement of existing light sources and detectors is an active research area with numerous applications, gas sensing being only one of them. More developments can be expected in upcoming years.
The optical design is another factor to be optimized. According to Beer–Lambert law, the optical path length is a critical parameter since it is proportional to the amount of absorbed light. Longer path length results in better resolution and stability, it provides a stronger output signal hence reducing the relative impact of humidity and improving cross-sensitivity. Various optimizations have been proposed based on optical cavities, mirrors, geometries of the waveguide, and the shape of the gas cell. The optical design of commercially available sensors has matured over the decades of improvements. Further improvements in this direction can be expected in the miniaturization of optical waveguides.

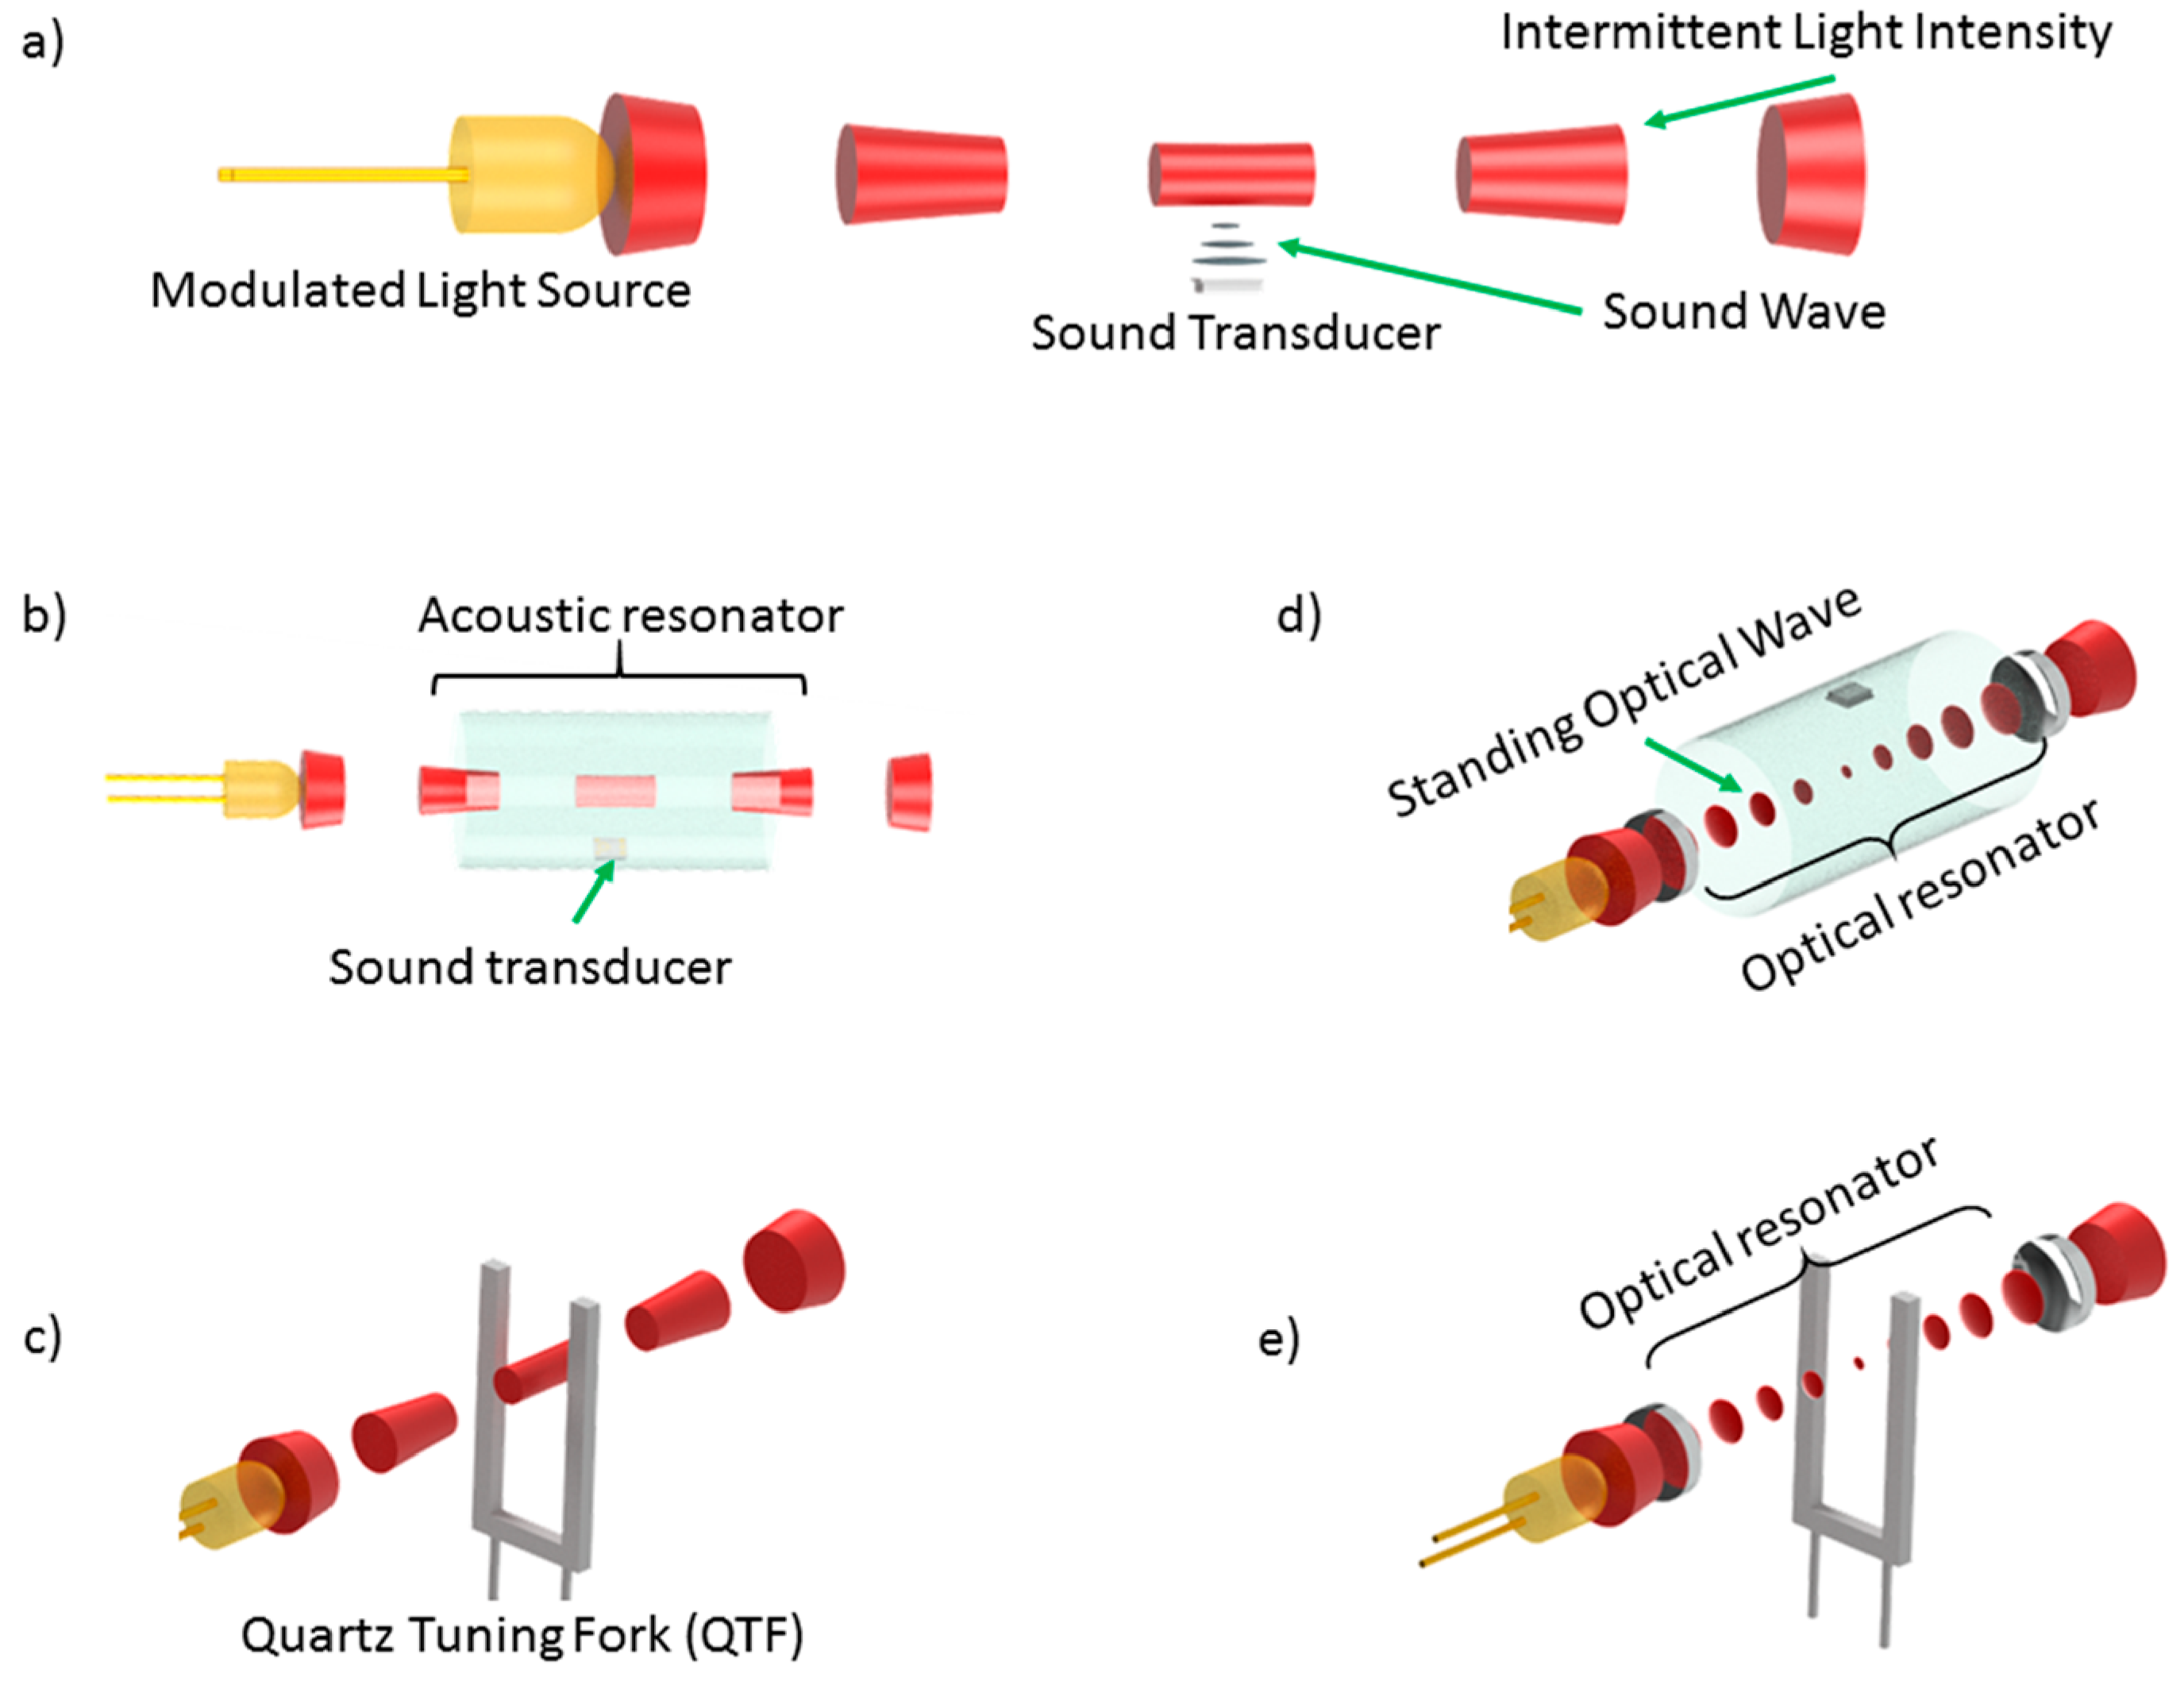
4.2. Vibrational Spectroscopy

Vibrational spectroscopy is a general technique that allows the production of unique fingerprint spectra due to the interaction of gas with electromagnetic radiation. Fourier transform infrared (FTIR) and Raman spectroscopies are two complementary examples of this approach [60]. FTIR examines the absorption of light across a range of wavelengths instead of a particular narrow band as is done in NDIR. Contrary, Raman spectrum is a result of the inelastic scattering of a monochromatic laser beam by gas molecules, it has a strong peak at the excitation frequency and secondary peaks corresponding to multiple intensities of the scattered light due to different modes of energy exchange between the photon and the target molecule.
The main advantage of both methods is that they are highly selective due to the unique spectra of each molecule and can be configured to measure multiple gases simultaneously. Moreover, FTIR is a common technique employed in continuous emission control systems and gas analyzers. On the other hand, these methods are costly and require complicated and bulky optics that are sensitive to shocks and vibrations. Vibrational spectroscopic methods and other analytical solutions such as mass spectrometry and gas chromatography are considered laboratory-class instrumentation.

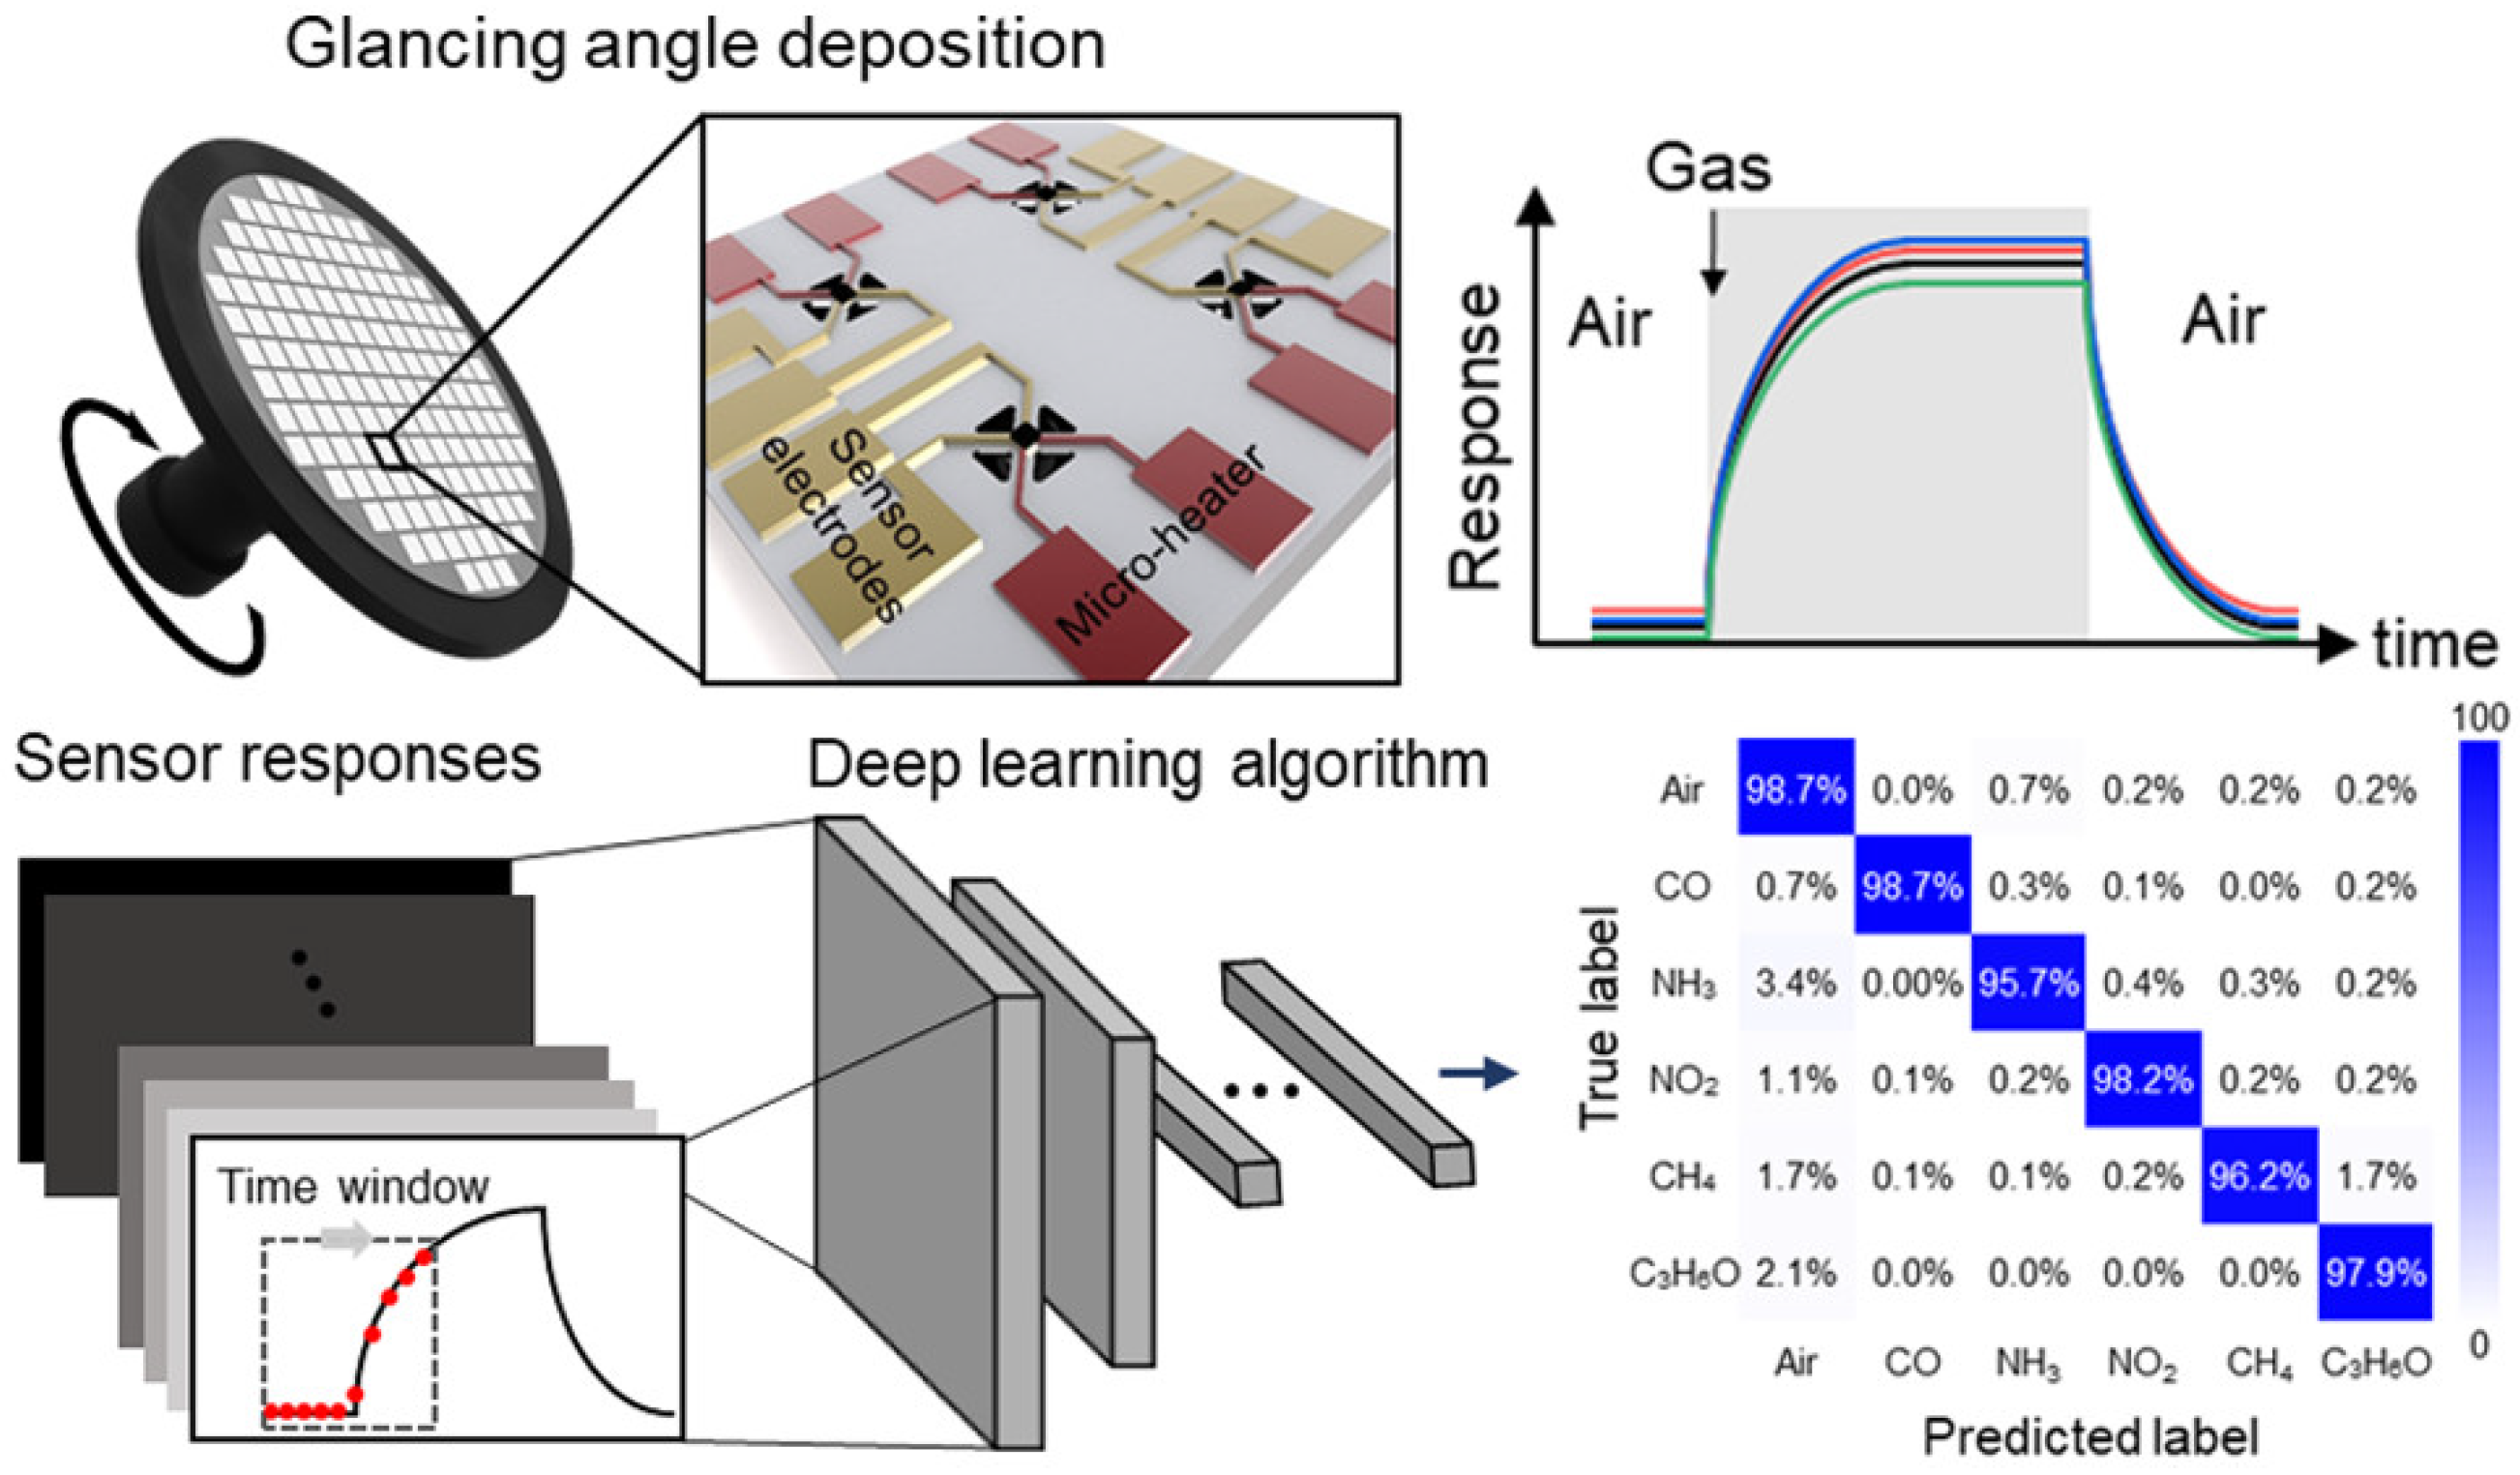
5. Sensor Arrays, Multivariable Sensors, and Data Processing

Cross-sensitivity, poor selectivity, and inability to preserve accuracy in the presence of unknown interferences are the most pronounced performance limiting factors of conventional sensing technologies. Advances in materials and components either solve these issues only partially or lead to excessively complicated and expensive solutions. It is also known that sensor selectivity conflicts with sensor reversibility explaining why commercially available sensors come with a large list of interferences [61].
Sensor arrays achieved a breakthrough in selectivity by considering the collections of cross-selective sensors linked together by a data-processing layer. Various array solutions have been considered including chemiresisitive [62], optical [63], and graphene-based [64] variants. As an example, Figure 9 illustrates a MOS sensor array with a deep learning algorithm capable of conducting pattern recognition of the sensor responses in real-time with 98% accuracy.
An array with n sensors produces an n-dimensional output when exposed to an analyte. One could hope that this would give a high-dimensional fingerprint of the analyte that is close in its expressive power to the unique spectral fingerprint. In practice, however, due to the cross-sensitivity of the sensors in an array, the number of true independent components of the array response is much smaller, and one needs to reside to dimensionality reduction approaches such as, e.g., the principal component analysis (PCA) to extract the relevant information [65,66,67].
The number of independent outputs of a sensor is called the dispersion of the sensor device. This parameter is critical for the identification and quantification of the individual components in gas mixtures, as well as for the rejection of interferences and self-correction ability against environmental instabilities [69]. Sensor arrays can achieve high dispersion values but have a serious unsolved problem of drift in long-term applications. This happens because each sensor in an array has a different sensing material with its own drift and aging which inevitably leads to the eventual decalibration of the whole array.
The problem of stability and decalibration is largely resolved in multivariable sensors. Unlike sensor arrays, these sensors comprise a single sensing material that is deliberately engineered to exhibit a multi-response mechanism when exposed to various gases. Additionally, these sensors are equipped with a multivariable transducer featuring several partially or entirely independent outputs, each dedicated to recognizing distinct gas responses. Refer to Figure 10 for a visual representation. For example, temperature modulation of a MOS sensing film has been shown to drastically improve the ability to recognize multiple odors in a single sensor by rapidly cycling through multiple temperatures ranging from 50 to 480 °C [70].
Improvements in the design of multivariable sensors can be achieved by (1) designing new materials with diverse multiresponse mechanisms, (2) designing new transducer mechanisms to expand sensor dispersion, (3) improving sensor manufacturability, and (4) improving data analysis tools. The first three factors are the same as for the conventional sensors. The last point though brings new opportunities to solving issues associated with sensor design because it potentially allows enhancements in performance of an existing sensor via purely algorithmic approaches.

6. Conclusions

Detecting and discriminating between A2L refrigerants can be a challenging task due to a large number of blends with multiple components that have tight composition tolerances. There is no existing independent study that performs an extensive analysis of the sensors’ performance for refrigerants beyond R32. In this effort, we aimed to make a step towards this goal by reviewing the recent developments in gas sensing technologies and focusing on the trends that look promising for A2L sensing. The analysis of conventional technologies, including MOS and NDIR, shows that significant improvements require substantial research efforts in the design of new materials and components. Such developments are costly, time-consuming, and often produce only diminishing returns on invested efforts. Nevertheless, metal oxides remain the dominant semiconducting material for chemical sensing and a significant amount of academic research is devoted to enhancing their properties. While this might lead to improvements of the technology in the future, significant advancements are not expected soon. The situation is better for optical sensors that can benefit from recent breakthroughs in the design of cheap, reliable, and high-resolution light sources and detectors. Combined with excellent stability, highly optimized technology, and availability of rugged devices, this makes NDIR sensors a potentially good choice for A2L sensing. This conclusion is additionally supported by previous reports.
The two most promising directions for the design of highly selective and stable gas sensors that we have identified as the result of this study are the development of multiresponse materials and the miniaturization of conventional technologies enabling their combination into sensor arrays and integration with micromechanical systems on chip. Both approaches allow for the production of multidimensional fingerprints of sensed analytes that are qualitatively close to the measurements of laboratory-grade spectrum analyzers but at a much lower cost and with increased robustness and stability. The recognition mechanism of such sensors usually involves a data-processing step that can be performed on the same chip as the sensor. With recent developments in machine learning and signal-processing algorithms, this approach is very flexible for the adaptation of the available sensing platform to detecting new analytes and their blends by modifying the algorithm rather than the sensor itself. Also, this approach potentially allows room for further improvements or modifications to the sensing platform during the lifetime of the sensor without the need for replacement. Several startup companies, including the manufacturer of the MMM sensor mentioned in AHRTI Report No. 9014 (see also Table 3), have already proposed their solutions based on this approach. It is expected that even more solutions will appear in the near future.
In conclusion, our findings highlight inherent limitations within certain sensing mechanisms commonly employed in traditional sensors. It is evident that fresh research endeavors are necessary to harmonize the current sensing technologies with the safety regulations demanded for flammable refrigerants. Considering the evolving landscape of refrigerant regulations, we anticipate that both manufacturers and consumers will derive value from the present manuscript as they work towards creating and choosing innovative A2L refrigerant sensing solutions. Furthermore, the ongoing exploration of sensing mechanisms, as presented in this review, will be succeeded by an updated experimental investigation of commercially accessible products. The outcomes of this study will be shared in the imminent future.

Author Contributions

Conceptualization and writing original draft preparation, V.R., P.C., V.S. and S.Y.M.; methodology, V.R.; validation, P.C., V.S. and S.Y.M.; investigation, V.R., P.C., V.S. and S.Y.M.; funding acquisition, V.S. and S.Y.M.; project administration, V.S. and S.Y.M. All authors have read and agreed to the published version of the manuscript.

Funding

This research is supported by the US Department of Energy (DOE), Building Technologies Office, under Contract DE-AC05-00OR22725 with UT-Battelle LLC. This research used resources at the Building Technologies Research and Integration Center (BTRIC), a DOE Office of Science User Facility operated by the Oak Ridge National Laboratory.

Data Availability Statement

Data are contained within the article.

Conflicts of Interest

The authors declare no conflict of interest.

References

  1. Sharma, V.; Fricke, B.; Bansal, P. Comparative analysis of various CO2 configurations in supermarket refrigeration systems. Int. J. Refrig. 2014, 46, 86–99. [Google Scholar] [CrossRef]
  2. ANSI/ASHRAE 34-2019; Designation and Safety Classification of Refrigerants. ASHRAE: Atlanta, GA, USA, 2019.
  3. ANSI/ASHRAE 15-2019; Safety Standard for Refrigeration Systems. ASHRAE: Atlanta, GA, USA, 2019.
  4. 60335-2-89; Standard for Household And Similar Electrical Appliances—Safety—Part 2-40: Particular Requirements for Electrical Heat Pumps, Air-Conditioners and Dehumidifiers. 3rd ed. UL Enterprise: Northbrook, IL, USA, 2019.
  5. 60335-2-40; Household and Similar Electrical Appliances–Safety–Part 2-89: Particular Requirements for Commercial Refrigerating Appliances and Ice-Makers with an Incorporated or Remote Refrigerant Unit or Motor-Compressor. 2nd ed. UL Enterprise: Northbrook, IL, USA, 2021.
  6. Wagner, M.; Ferenchiak, R. Leak Detection of A2L Refrigerants in HVACR Equipment; Technical Report 9009; AHRTI: Washington, DC, USA, 2017. [Google Scholar]
  7. Refrigerant Leak Detection: IR vs. Semiconductor Sensors. Available online: https://www.nenvitech.com/news/refrigerant-leak-detection-ir-vs-semiconductor-sensors/ (accessed on 30 September 2022).
  8. Eckstein, M.; Lee, K. Market Trends in Refrigerant Leakage Detection. Available online: https://sensirion.com/products/product-insights/specialist-articles/market-trends-in-refrigerant-leakage-detection/ (accessed on 25 September 2022).
  9. Zheng, J.; Zang, F.; Yu, C.N.; Elbel, S. Refrigerant Detector Characteristics for Use in HVACR Equipment; Technical Report 9014; AHRTI: Washington, DC, USA, 2021. [Google Scholar]
  10. Summary of Findings from 2020 AHRTI Report, “Refrigerant Detector Characteristics for Use in HVACR Equipment—Phase I”. Available online: https://nevadanano.com/wp-content/uploads/2020/05/SM-AN-0012-04-Leak-Detection-Technologies-for-A2L-Refrigerants-in-HVACR-Equipment-AHRTI-2020-Phase-I-Report-Summary.pdf (accessed on 30 September 2022).
  11. Banica, F.G. Chemical Sensors and Biosensors: Fundamentals and Applications; John Wiley & Sons: Hoboken, NJ, USA, 2012. [Google Scholar]
  12. Fraden, J. Handbook of Modern Sensors: Physics, Designs, and Applications; Springer International Publishing: Cham, Switzerland, 1998. [Google Scholar]
  13. Nikolic, M.V.; Milovanovic, V.; Vasiljevic, Z.Z.; Stamenkovic, Z. Semiconductor Gas Sensors: Materials, Technology, Design, and Application. Sensors 2020, 20, 6694. [Google Scholar] [CrossRef]
  14. Kittel, C. Introduction to Solid State Physics; John Wiley & Sons, Inc.: Hoboken, NJ, USA, 2005. [Google Scholar]
  15. Raju, P.; Li, Q. Semiconductor materials and devices for gas sensors. J. Electrochem. Soc. 2022, 169, 057518. [Google Scholar] [CrossRef]
  16. Kim, H.J.; Lee, J.H. Highly sensitive and selective gas sensors using p-type oxide semiconductors: Overview. Sens. Actuators B Chem. 2014, 192, 607–627. [Google Scholar] [CrossRef]
  17. Barsan, N.; Koziej, D.; Weimar, U. Metal oxide-based gas sensor research: How to? Sens. Actuators B Chem. 2007, 121, 18–35. [Google Scholar] [CrossRef]
  18. Ji, H.; Zeng, W.; Li, Y. Gas sensing mechanisms of metal oxide semiconductors: A focus review. Nanoscale 2019, 11, 22664–22684. [Google Scholar] [CrossRef]
  19. Hübner, M.; Simion, C.; Tomescu-Stănoiu, A.; Pokhrel, S.; Bârsan, N.; Weimar, U. Influence of humidity on CO sensing with p-type CuO thick film gas sensors. Sens. Actuators B Chem. 2011, 153, 347–353. [Google Scholar] [CrossRef]
  20. Xiao, X.; Liu, L.; Ma, J.; Ren, Y.; Cheng, X.; Zhu, Y.; Zhao, D.; Elzatahry, A.A.; Alghamdi, A.; Deng, Y. Ordered mesoporous tin oxide semiconductors with large pores and crystallized walls for high-performance gas sensing. ACS Appl. Mater. Interfaces 2018, 10, 1871–1880. [Google Scholar] [CrossRef]
  21. Wang, X.; Wang, Y.; Tian, F.; Liang, H.; Wang, K.; Zhao, X.; Lu, Z.; Jiang, K.; Yang, L.; Lou, X. From the surface reaction control to gas-diffusion control: The synthesis of hierarchical porous SnO2 microspheres and their gas-sensing mechanism. J. Phys. Chem. C 2015, 119, 15963–15976. [Google Scholar] [CrossRef]
  22. Yamazoe, N. New approaches for improving semiconductor gas sensors. Sens. Actuators B Chem. 1991, 5, 7–19. [Google Scholar] [CrossRef]
  23. Chen, H.; Zhao, Y.; Shi, L.; Li, G.D.; Sun, L.; Zou, X. Revealing the relationship between energy level and gas sensing performance in heteroatom-doped semiconducting nanostructures. ACS Appl. Mater. Interfaces 2018, 10, 29795–29804. [Google Scholar] [CrossRef] [PubMed]
  24. Rothschild, A.; Komem, Y. The effect of grain size on the sensitivity of nanocrystalline metal-oxide gas sensors. J. Appl. Phys. 2004, 95, 6374–6380. [Google Scholar] [CrossRef]
  25. Korotcenkov, G.; Han, S.D.; Cho, B.K.; Brinzari, V. Grain Size Effects in Sensor Response of Nanostructured SnO2 and In2O3 Based Conductometric Thin Film Gas Sensor. Crit. Rev. Solid State Mater. Sci. 2009, 34, 1–17. [Google Scholar] [CrossRef]
  26. Ma, J. (Ed.) Gas Sensors; IOP Publishing: Bristol, UK, 2021; pp. 2053–2563. [Google Scholar]
  27. Liang, S.; Li, J.; Wang, F.; Qin, J.; Lai, X.; Jiang, X. Highly sensitive acetone gas sensor based on ultrafine α-Fe2O3 nanoparticles. Sens. Actuators B Chem. 2017, 238, 923–927. [Google Scholar] [CrossRef]
  28. Zhou, S.; Chen, M.; Lu, Q.; Zhang, Y.; Zhang, J.; Li, B.; Wei, H.; Hu, J.; Wang, H.; Liu, Q. Ag nanoparticles sensitized In2O3 nanograin for the ultrasensitive HCHO detection at room temperature. Nanoscale Res. Lett. 2019, 14, 365. [Google Scholar] [CrossRef] [PubMed]
  29. Zhang, Y.; Jia, C.; Kong, Q.; Fan, N.; Chen, G.; Guan, H.; Dong, C. ZnO-decorated In/Ga oxide nanotubes derived from bimetallic In/Ga MOFs for fast acetone detection with high sensitivity and selectivity. ACS Appl. Mater. Interfaces 2020, 12, 26161–26169. [Google Scholar] [CrossRef]
  30. Wang, X.; Su, J.; Chen, H.; Li, G.D.; Shi, Z.; Zou, H.; Zou, X. Ultrathin In2O3 nanosheets with uniform mesopores for highly sensitive nitric oxide detection. ACS Appl. Mater. Interfaces 2017, 9, 16335–16342. [Google Scholar] [CrossRef] [PubMed]
  31. Li, Y.X.; Guo, Z.; Su, Y.; Jin, X.B.; Tang, X.H.; Huang, J.R.; Huang, X.J.; Li, M.Q.; Liu, J.H. Hierarchical morphology-dependent gas-sensing performances of three-dimensional SnO2 nanostructures. ACS Sens. 2017, 2, 102–110. [Google Scholar] [CrossRef]
  32. Agarwal, S.; Rai, P.; Gatell, E.N.; Llobet, E.; Güell, F.; Kumar, M.; Awasthi, K. Gas sensing properties of ZnO nanostructures (flowers/rods) synthesized by hydrothermal method. Sens. Actuators B Chem. 2019, 292, 24–31. [Google Scholar] [CrossRef]
  33. Han, Y.; Liu, Y.; Su, C.; Chen, X.; Zeng, M.; Hu, N.; Su, Y.; Zhou, Z.; Wei, H.; Yang, Z. Sonochemical synthesis of hierarchical WO3 flower-like spheres for highly efficient triethylamine detection. Sens. Actuators B Chem. 2020, 306, 127536. [Google Scholar] [CrossRef]
  34. Ma, J.; Ren, Y.; Zhou, X.; Liu, L.; Zhu, Y.; Cheng, X.; Xu, P.; Li, X.; Deng, Y.; Zhao, D. Pt Nanoparticles Sensitized Ordered Mesoporous WO3 Semiconductor: Gas Sensing Performance and Mechanism Study. Adv. Funct. Mater. 2018, 28, 1705268. [Google Scholar] [CrossRef]
  35. Shao, F.; Hoffmann, M.; Prades, J.; Zamani, R.; Arbiol, J.; Morante, J.; Varechkina, E.; Rumyantseva, M.; Gaskov, A.; Giebelhaus, I.; et al. Heterostructured p-CuO (nanoparticle)/n-SnO2 (nanowire) devices for selective H2S detection. Sens. Actuators B Chem. 2013, 181, 130–135. [Google Scholar] [CrossRef]
  36. Xu, F.; HO, H.P. Light-Activated Metal Oxide Gas Sensors: A Review. Micromachines 2017, 8, 333. [Google Scholar] [CrossRef] [PubMed]
  37. Zhu, L.; Zeng, W. Room-temperature gas sensing of ZnO-based gas sensor: A review. Sens. Actuators B Chem. 2017, 267, 242–261. [Google Scholar] [CrossRef]
  38. Liu, X.; Cheng, S.; Liu, H.; Hu, S.; Zhang, D.; Ning, H. A Survey on Gas Sensing Technology. Sensors 2012, 12, 9635–9665. [Google Scholar] [CrossRef] [PubMed]
  39. Berger, F.; Sanchez, J.B.; Heintz, O. Detection of hydrogen fluoride using SnO2-based gas sensors: Understanding of the reactional mechanism. Sens. Actuators B Chem. 2009, 143, 152–157. [Google Scholar] [CrossRef]
  40. Kwon, C.H.; Yun, D.H.; Hong, H.K.; Kim, S.R.; Lee, K.; Lim, H.Y.; Yoon, K.H. Multi-layered thick-film gas sensor array for selective sensing by catalytic filtering technology. Sens. Actuators B Chem. 2000, 65, 327–330. [Google Scholar] [CrossRef]
  41. Wong, K.; Tang, Z.; Sin, J.; Chan, P.; Cheung, P.; Hiraoka, H. Study on selectivity enhancement of tin dioxide gas sensor using non-conducting polymer membrane. In Proceedings of the 1995 IEEE Hong Kong Electron Devices Meeting, Hong Kong, China, 1 July 1995; pp. 42–45. [Google Scholar] [CrossRef]
  42. Ng, K.T.; Boussaid, F.; Bermak, A. A CMOS Single-Chip Gas Recognition Circuit for Metal Oxide Gas Sensor Arrays. IEEE Trans. Circuits Syst. I Regul. Pap. 2011, 58, 1569–1580. [Google Scholar] [CrossRef]
  43. Long, H.; Harley-Trochimczyk, A.; He, T.; Pham, T.; Tang, Z.; Shi, T.; Zettl, A.; Mickelson, W.; Carraro, C.; Maboudian, R. In situ localized growth of porous tin oxide films on low power microheater platform for low temperature CO detection. ACS Sens. 2016, 1, 339–343. [Google Scholar] [CrossRef]
  44. Hong, S.; Wu, M.; Hong, Y.; Jeong, Y.; Jung, G.; Shin, W.; Park, J.; Kim, D.; Jang, D.; Lee, J.H. FET-type gas sensors: A review. Sens. Actuators B Chem. 2021, 330, 129240. [Google Scholar] [CrossRef]
  45. Field-Effect Transistor. Available online: https://en.wikipedia.org/wiki/Field-effect_transistor (accessed on 30 September 2022).
  46. Yenn, T.S. Electrochemical vs. Semiconductor Gas Detection—A Critical Choice. Industrial Automation Asia, August 2019; 42–43. [Google Scholar]
  47. Dirac, P.A.M.; Bohr, N.H.D. The quantum theory of the emission and absorption of radiation. Proc. R. Soc. Lond. Ser. A Contain. Pap. Math. Phys. Character 1927, 114, 243–265. [Google Scholar] [CrossRef]
  48. Grynberg, G.; Aspect, A.; Fabre, C.; Cohen-Tannoudji, C. Introduction to Quantum Optics: From the Semi-Classical Approach to Quantized Light; Cambridge University Press: Cambridge, UK, 2010. [Google Scholar] [CrossRef]
  49. Palzer, S. Photoacoustic-Based Gas Sensing: A Review. Sensors 2020, 20, 2745. [Google Scholar] [CrossRef] [PubMed]
  50. Jha, R.K. Non-Dispersive Infrared Gas Sensing Technology: A Review. IEEE Sens. J. 2022, 22, 6–15. [Google Scholar] [CrossRef]
  51. Jia, X.; Roels, J.; Baets, R.; Roelkens, G. On-Chip Non-Dispersive Infrared CO2 Sensor Based on an Integrating Cylinder. Sensors 2019, 19, 4260. [Google Scholar] [CrossRef]
  52. Haas, J.; Mizaikoff, B. Advances in Mid-Infrared Spectroscopy for Chemical Analysis. Annu. Rev. Anal. Chem. 2016, 9, 45–68. [Google Scholar] [CrossRef]
  53. Questions and Answers about Tunable Diode Laser Gas Spectroscopy (TDLS). Available online: https://www.axetris.com/en/lgd/frequently-asked-questions-tdls-technology (accessed on 30 September 2022).
  54. Chen, Y.; Wang, Z.; Li, Z.; Zheng, H.; Dai, J. Development of an Online Detection Setup for Dissolved Gas in Transformer Insulating Oil. Appl. Sci. 2021, 11, 12149. [Google Scholar] [CrossRef]
  55. Scholz, L.; Palzer, S. Photoacoustic-based detector for infrared laser spectroscopy. Appl. Phys. Lett. 2016, 109, 041102. [Google Scholar] [CrossRef]
  56. Dinh, T.V.; Choi, I.Y.; Son, Y.S.; Kim, J.C. A review on non-dispersive infrared gas sensors: Improvement of sensor detection limit and interference correction. Sens. Actuators B Chem. 2016, 231, 529–538. [Google Scholar] [CrossRef]
  57. Dudzik, G.; Krzempek, K.; Abramski, K.; Wysocki, G. Solid-state laser intra-cavity photothermal gas sensor. Sens. Actuators B Chem. 2021, 328, 129072. [Google Scholar] [CrossRef]
  58. Koppens, F.; Mueller, T.; Avouris, P.; Ferrari, A.; Vitiello, M.; Polini, M. Photodetectors based on graphene, other two-dimensional materials and hybrid systems. Nat. Nanotechnol. 2014, 9, 780–793. [Google Scholar] [CrossRef] [PubMed]
  59. Goldstein, J.; Lin, H.; Deckoff-Jones, S.; Hempel, M.; Lu, A.Y.; Richardson, K.A.; Palacios, T.; Kong, J.; Hu, J.; Englund, D. Waveguide-integrated mid-infrared photodetection using graphene on a scalable chalcogenide glass platform. Nat. Commun. 2022, 13, 3915. [Google Scholar] [CrossRef]
  60. Rohman, A.; Windarsih, A.; Lukitaningsih, E.; Rafi, M.; Betania, K.; Fadzillah, N. A The use of FTIR and Raman spectroscopy in combination with chemometrics for analysis of biomolecules in biomedical fluids: A review. Biomed. Spectrosc. Imaging 2019, 8, 55–71. [Google Scholar] [CrossRef]
  61. Janata, J. Principles of Chemical Sensors; Springer: Boston, MA, USA, 2009. [Google Scholar]
  62. Hannon, A.; Lu, Y.; Li, J.; Meyyappan, M. A Sensor Array for the Detection and Discrimination of Methane and Other Environmental Pollutant Gases. Sensors 2016, 16, 1163. [Google Scholar] [CrossRef]
  63. Rubio, R.; Santander, J.; Fonseca, L.; Sabaté, N.; Gràcia, I.; Cané, C.; Udina, S.; Marco, S. Non-selective NDIR array for gas detection. Sens. Actuators B Chem. 2007, 127, 69–73. [Google Scholar] [CrossRef]
  64. Gupta, R.K.; Alqahtani, F.H.; Dawood, O.M.; Carini, M.; Criado, A.; Prato, M.; Garlapati, S.K.; Jones, G.; Sexton, J.; Persaud, K.C.; et al. Suspended graphene arrays for gas sensing applications. 2D Mater. 2020, 8, 025006. [Google Scholar] [CrossRef]
  65. Chen, Z.; Chen, Z.; Song, Z.; Ye, W.; Fan, Z. Smart gas sensor arrays powered by artificial intelligence. J. Semicond. 2019, 40, 111601. [Google Scholar] [CrossRef]
  66. Yaqoob, U.; Younis, M.I. Chemical Gas Sensors: Recent Developments, Challenges, and the Potential of Machine Learning—A Review. Sensors 2021, 21, 2877. [Google Scholar] [CrossRef] [PubMed]
  67. Michelucci, U.; Baumgartner, M.; Venturini, F. Optical Oxygen Sensing with Artificial Intelligence. Sensors 2019, 19, 777. [Google Scholar] [CrossRef]
  68. Kang, M.; Cho, I.; Park, J.; Jeong, J.; Lee, K.; Lee, B.; Del Orbe Henriquez, D.; Yoon, K.; Park, I. High accuracy real-time multi-gas identification by a batch-uniform gas sensor array and deep learning algorithm. ACS Sens. 2022, 7, 430–440. [Google Scholar] [CrossRef]
  69. Potyrailo, R.A. Multivariable sensors for ubiquitous monitoring of gases in the era of internet of things and industrial internet. Chem. Rev. 2016, 116, 11877–11923. [Google Scholar] [CrossRef]
  70. Meier, D.C.; Raman, B.; Semancik, S. Detecting Chemical Hazards with Temperature-Programmed Microsensors: Overcoming Complex Analytical Problems with Multidimensional Databases. Annu. Rev. Anal. Chem. 2009, 2, 463–484. [Google Scholar] [CrossRef] [PubMed]
Figure 1. MOS measurements mechanism. Reprinted with permission from [8].
Energies 16 06499 g001
Figure 2. Electronic core−shell structures in (a) n−type and (b) p−type oxide semiconductors. Reprinted with permission from [16].
Energies 16 06499 g002
Figure 3. Cross-section of a typical MOSFET [45].
Energies 16 06499 g003
Figure 4. Schematic representation of a galvanic cell. Reprinted with permission from [11].
Energies 16 06499 g004
Figure 5. Two- and three-electrode cells for amperometric measurements. WE: working electrode; RE: reference electrode; AE: auxiliary electrode. Reprinted with permission from [11].
Energies 16 06499 g005
Figure 6. Schematic of a typical NDIR sensor. Reprinted with permission from [51].
Energies 16 06499 g006
Figure 7. Scanning principle of TDLAS. Reprinted with permission from [54].
Energies 16 06499 g007
Figure 8. A schematic depiction of various arrangements of photoacoustic spectroscopy sensors. (a) Basic setup: a light beam generates a photoacoustic wave that is measured at sound transducer, (b) Photoacoustic wave is enhanced at acoustic resonator, (c) A quartz tuning fork (QTF) is used as bandwidth resonator, (d,e) An optical resonator is used to multiply the signal. Reprinted with permission from [49].
Energies 16 06499 g008
Figure 9. Schematic diagram of a gas sensor array with data-processing layer. Sensor response to different gases is depicted with different colors. Reprinted with permission from [68].
Energies 16 06499 g009
Figure 10. Importance of sensor response dispersion. (A) 1-D dispersion provides a single response mechanism that is not enough to distinguish between different gases with cross-sensitivities. (B,C) Higher dimensional dispersions of multivariable sensors assign unique response directions to each gas which allows to correct for environmental interferences and cross-sensitivities. Reprinted with permission from [69].
Energies 16 06499 g010
Table 2. Compilation of the findings in AHRTI report No. 9009 [6].
InfraredECMOSCatalyticHeated Diode
Features
CostHandheldUSD 300–400 USD 100–500
StationaryUSD 1000–12,000USD 250–1600USD 500–1300USD 700–1500
Sensing
element
USD 100–200USD 3–100USD 50–100
Size1–20 lbs.0.5–4 lbs.1 × 1 × 1 in2–3.5 lbs.Handheld system
Power
requirements
13–30 VDC
4–5 W
12–30 VDC
4–10 W
12–24 VDC
1–5 W
12–24 VDC
1 –10 W
Battery-operated
Refrigerant typesHFCs, HFOs, HCs, CFCs, HCFCs N H 3 CFC, HFCs, HCFCs, HFOsHCs, N H 3 , other flammable gasesHFCs, HFOs, and blends
CalibrationPIR: Required every 6 months
NDIR: Calibration not
required. Re-zeroing is
required every 0.5 C
internal temp. change or
every year
Required every 12 monthsRecommended every 6 monthsRequired every 3–6 months depending on environment where usedAutomatic or manual zeroing
Limitations
Measurement range0–10,000 ppm0–1000 ppm20–10,000 ppm0–1000 ppm
0–100% LEL
6.6- < 0.1 oz/yr
high/low sensitivity
Response timeSingle-zone: 5–30 s
Multi-zone: 5–300 s
T90: <90 sT90: 15–90 sT50: 5–10 s
T90: 20–30 s
0.5–1 s
warm-up: 30 s
recovery: ∼9 s
Operating temperature−40–167 F
−40–75 C
−4–122 F
−20–50 C
−30–158 F
−34–170 C
−40–300 F
−40–150 C
−4–122 F
−20–50 C
Humidity0–10%
some sensors require non-condensing environment
15–90%0–95%0–95%unknown
VibrationSensor can be placed inside a protective structureSensor can be placed inside a protective structureShould not be affected by normal workplace vibrationsTypically, not impactfuln/a
False-triggering chemicalsNoneOrganic solvents (e.g., alcohols, acetone), cross-sensitivity with other gasesGasoline, diesel, and propane exhaust, fumes from solvents, paints, and cleansersNoneMoisture, oils, sensors are not selective
Interfering chemicalsAcetylene, overexposure of refrigerant gasNoneEthanol, silicones, highly corrosive gases, alkaline metals, overexposure to refrigerant, condensationSilicone or sulfur, heavy metals, halogenated hydrocarbons, overexposure to refrigerant, poisoningMoisture, oils, overexposure to refrigerant
Reliability
LifetimeHandheld: 5 years
Stationary: 10–15 years
1–3 years (based on exposure to gas)3–5 years2–5 years2–3 years, up to 5 years
RepairableReplace air filters every yearEC cell can be replacedSensing element can be replacedSensing element can be replacedSensing element and filters can be replaced
Self-testing abilitiesCertain monitoring devices incorporate active diagnostics that continuously monitor the system for proper operationNone observedCompensator element acts as a constant control mechanismn/a
Table 3. Compilation of the findings in AHRTI report No. 9014 [9,10].
Letter CodeSensor Type% of Requirements PassedAverage Time Delay, θ [s]Average Time Constant, τ [s] T 63.2 = θ + τ [s]
AMMM100%4.50.254.75
BNDIR96%1.615.817.4
CTC86%0.00.10.1
DNDIR79%0.113.713.8
EMOS75%Cannot be determined
FMOS64%Cannot be determined
Table 4. Test matrix for selecting an appropriate sensor solution.
AttributeRangeTest method
Concentration/accuracy
  • 5– 25 % LFL; ± 3 %
Signal response vs. concentration
Time constant/response time
  • 1– 25 % LFL
Signal response time after leak initiation
Sensitivity and selectivity
  • Humidity (10–90%)
  • Temperature ( 30 °F to + 275 °F)
  • C O 2 (0.05% to 1%)
  • Other refrigerants (134a, 404A, 407A)
  • ( N O X —ppmv; CO—ppmv)
  • Impact of fractionation, oil, cleaning agents, engine exhaust
Presence of humidity, temperature, C O 2 , other refrigerants, poison species: co-injection
Repeatability
  • Signal variance between sensors
Simultaneous evaluation
Reliability
  • Continuous exposure time
  • Oversaturation (pure refrigerant exposure)
  • On/off cycling
  • Powered sensor
  • Signal drift vs. time
Exposure to different test conditions
Location
  • Floor vs. Ceiling
Impact of density
Robustness (vibration/shock)Vibration sensitivity, shock sensitivity
Flexibility
  • Multiple A2L blends
Cross compatibility feasibility
Table 5. The classification of nanostructures and typical morphology [26].
StructureDescriptionTypical Morphology
0-dimensionalAll dimensions are nanometricQuantum dot, nanoparticles, clusters
1-dimensionalTwo dimensions are nanometricNanowires, nanorods, nanotubes, nanofibers
2-dimensionalOne dimension is nanometricThin film, nanosheets, nanobelts, nanoplates
3-dimensionalComposed of lower-dimensional structuresNanoflowers, nanospheres
Disclaimer/Publisher’s Note: The statements, opinions and data contained in all publications are solely those of the individual author(s) and contributor(s) and not of MDPI and/or the editor(s). MDPI and/or the editor(s) disclaim responsibility for any injury to people or property resulting from any ideas, methods, instructions or products referred to in the content.

