Review

Energy Consumption and Human Well-Being: A Systematic Review

by
Gereon tho Pesch
1,2,3,
Anna Kristín Einarsdóttir
1,
Kevin Joseph Dillman
4 and
Jukka Heinonen
1,*
1
Faculty of Civil and Environmental Engineering, School of Engineering and Natural Sciences, University of Iceland, 107 Reykjavík, Iceland
2
Department of Geography, Faculty of Mathematics and Natural Sciences, University of Bonn, 53115 Bonn, Germany
3
Department of Economics, Faculty of Law and Economics, University of Bonn, 53113 Bonn, Germany
4
Environment and Natural Resources, School of Engineering and Natural Sciences, University of Iceland, 107 Reykjavík, Iceland
*
Author to whom correspondence should be addressed.
Energies 2023, 16(18), 6494; https://doi.org/10.3390/en16186494
Submission received: 17 August 2023 / Revised: 4 September 2023 / Accepted: 6 September 2023 / Published: 8 September 2023
(This article belongs to the Section C: Energy Economics and Policy)

Abstract

:
Understanding the relationship between energy use and well-being is crucial for designing holistic energy policy. The latter has to both effectively mitigate climate change driven by current fossil-based energy systems as well as promote human development, which requires energy. While a significant body of research investigates this relationship, study designs differ significantly, so findings cannot be easily generalized. This machine learning-aided review provides an overview of the current state of the literature examining this relationship. We highlight and discuss methodological differences between the studies, including their perspective (top-down or bottom-up), spatial scope, and the respective energy and well-being indicators used. The review reveals that most research takes a top-down perspective, analyzing country-level data across multiple countries. These studies typically find a positive relationship between energy use and well-being, and most confirm the existence of a saturation effect. We reveal that countries in the Global South are underrepresented in current studies. Bottom-up studies focus on specific countries or country groups using household-level data, yielding more nuanced findings that can be further disaggregated by consumption domain. We find that energy and well-being indicators differ substantially across studies, yet the implications of this choice are not always sufficiently discussed. The review shows and discusses the current shift from production- to consumption-based energy indicators.

1. Introduction

Deep and fast emissions cuts to our fossil-based energy system are necessary to mitigate the effects of the climate crisis. Current policies are far from sufficient to limit anthropogenic climate change to 2 °C, let alone 1.5 °C [1]. Emission reductions require decarbonizing the energy system with renewable energy, but also improving energy efficiency and reducing demand for energy services—energy sufficiency. The latter two have historically received less attention but are urgently needed [2]. Sufficiency is rooted in the framework of a safe and just operating space, as outlined by Raworth [3]. It directs our attention to sustainable consumption that exists within the ecological ceiling, defined by the planetary boundaries described by Rockström et al. [4] while simultaneously ensuring the fulfillment of basic needs above the social floor. Thus, the concept of energy sufficiency highlights that there can be both too little energy consumption (less than what is required to be above the social floor) and too much energy consumption (crossing the ecological threshold due to associated environmental impacts) [2].
Energy is a fundamental component of human development and well-being [5], and access to energy resources constitutes a precondition for leading a decent life [6,7]. Energy systems are therefore essential for meeting basic human needs such as cooking, heating, and lighting. Reliable and affordable energy services enhance education, healthcare, and economic productivity, empowering individuals and communities to thrive [8]. Furthermore, energy consumption is an essential input for almost all economic activities [9]. Despite recognizing the significance of energy systems in the United Nations’ Sustainable Development Goals [10], a substantial portion of the global population still lacks access to adequate energy [11]. In the Global South, billions of people do not have access to clean and reliable energy, relying on traditional biomass and coal for cooking, which has detrimental effects on human well-being, exacerbates inequalities, and hinders social progress [5,8,11]. In the Global North, fossil fuels have historically driven economic growth [12]. Many affluent nations consume excessive amounts of energy, either directly in their homes or cars or indirectly embedded in their foods, goods, and services, far beyond what is necessary for decent living standards. This overconsumption contributes to significant environmental problems [13,14]. Implementing demand-side solutions aimed at reducing energy demand could pave the way for a more equitable distribution of energy resources, thereby enabling decent living conditions for all [15,16,17]. Therefore, understanding how energy use translates to well-being is paramount to designing appropriate energy policy, which must resolve conflicting goals between environmental protection and human development. In contrast to the long-prevailing view that higher energy consumption always means higher levels of human development, it is nowadays recognized that higher energy consumption also increases greenhouse gas emissions, contributing to anthropogenic climate change and indirectly reducing human development [9].
Under which conditions does well-being increase when energy use is increased? Is there a threshold beyond which further increases in energy consumption yield only marginal, negligible, or even negative improvements in well-being? Many studies have covered the relationship but have found varying results. Since they employ different methods—including variations in the energy and well-being indicator used, spatial scope, and perspective—it is difficult to generalize the findings. To the authors’ knowledge, no review systematically covers the existing studies and considers the relationship between energy use and well-being specifically. Burke [2] provides a recent review of the relationship between carbon emissions and well-being and, therefore, also indirectly addresses the relationship between energy use and well-being while conceptually focusing on well-being. Tran et al. [9] draw attention to the ambiguous findings in the field that can be caused by the chosen study design, stating that there has not been much focus on the connection between energy use and human development. With this systematic machine learning-aided literature review, we thus aim to draw attention to differences in study design that may impact results, potential generalizable results, and focus on the energy use component.
RQ1
How has the field of literature developed?
RQ2
How do the studies differ conceptually and technically?
RQ3
What do the studies suggest about the relationship between energy use and well-being?
RQ4
Where do gaps in the literature exist, and how can the field develop to fill them?
Our review finds that many studies using country-level data find a positive relationship between energy use and identify diminishing marginal utility of increased energy use, describing a saturation phenomenon. Findings become more nuanced when looking at subsets of countries and bottom-up studies, showing that, depending on country-specific circumstances, the relationship can be positive, insignificant, or negative. We discuss the importance of the chosen energy and well-being metrics and how they can influence results. We also draw attention to the importance of explicitly stating and critically discussing said choice. We show that the spatial data coverage of “global” studies underrepresents countries from the Global South and propose future research directions.
The rest of this article is organized as follows. Section 2 introduces measures of well-being, while Section 3 is devoted to energy measures. Section 4 provides a brief historical summary of the field, including literature from before the period covered by the systematic review. Section 5 then introduces the review process, and Section 6 describes the main conceptual and technical differences between the studies and their main findings. Section 7 concludes the paper, drawing conclusions from the findings and suggesting directions for future research.

2. Measuring Well-Being

Defining what constitutes a “good life” is intricate and subject to intense debate—a discussion that has persisted for centuries. Hedonic and eudaimonic well-being are two prominent schools of thought that seek to define well-being and have a history dating back to the fourth century BC. Hedonic well-being primarily revolves around the pursuit of pleasure and the avoidance of pain, while eudaimonic well-being centers on the realization of human potential, personal growth, and purpose [18]. Happiness and immediate pleasure and gratification are central to hedonic well-being, whereas flourishing is central to eudaimonia. The latter seeks to distinguish between needs and desires that are focused on momentary and immediate pleasure and those that promote self-worth and meaning in one’s life [19,20].
Measuring human well-being is, therefore, a highly contested matter, much like defining a good and happy life. Two broad approaches—objective and subjective—can be identified. They differ in their perspectives and methods for quantifying well-being [5,21]. Objective measures of well-being focus on external factors that influence well-being. They are based on fulfilling predetermined universal needs or criteria essential for human well-being [22]. Objective indicators of well-being primarily focus on material resources such as income, housing, and nutrition, as well as social attributes including education, health, safety, and political participation [23,24].
The Human Development Index (HDI) is a widely used objective measure of well-being developed under the United Nations Development Programme in 1990. It is based on the capabilities approach developed by Sen [25,26] and expanded on by Nussbaum [22,27]. It emphasizes the significance of individuals’ capabilities across domains such as education, health, political participation, and social opportunities. The basic needs approach is another objective well-being concept that identifies universal human needs independent of individual preferences. Numerous attempts have been made to categorize these needs, encompassing physiological and psychological aspects, e.g., [28,29,30,31,32,33]. The Theory of Human Needs proposed by Doyal and Gough [30] is a frequently used framework for assessing well-being, considering fundamental physical health and essential autonomous needs.
Subjective measures of well-being focus on individuals’ own perceptions, evaluations, and subjective experiences. It acknowledges the inherent subjectivity and personal variation in well-being [34]. Subjective well-being measures usually involve self-report questionnaires and surveys where individuals are asked to reflect and evaluate their own well-being and life satisfaction [35]. Various tools and scales have been developed within this framework to assess subjective well-being, including Cantril’s Ladder [36] and the Satisfaction with Life Scale [37].
The assessment of well-being is complex, with a diverse array of perspectives and approaches. Defining and measuring well-being involves navigating different frameworks and methodologies, posing inherent challenges. It is important to recognize the limitations of any measurement approach, as no single framework can fully capture the multidimensional and subjective nature of well-being. Acknowledging these limitations allows for a more nuanced interpretation of well-being data.

3. Measuring Energy

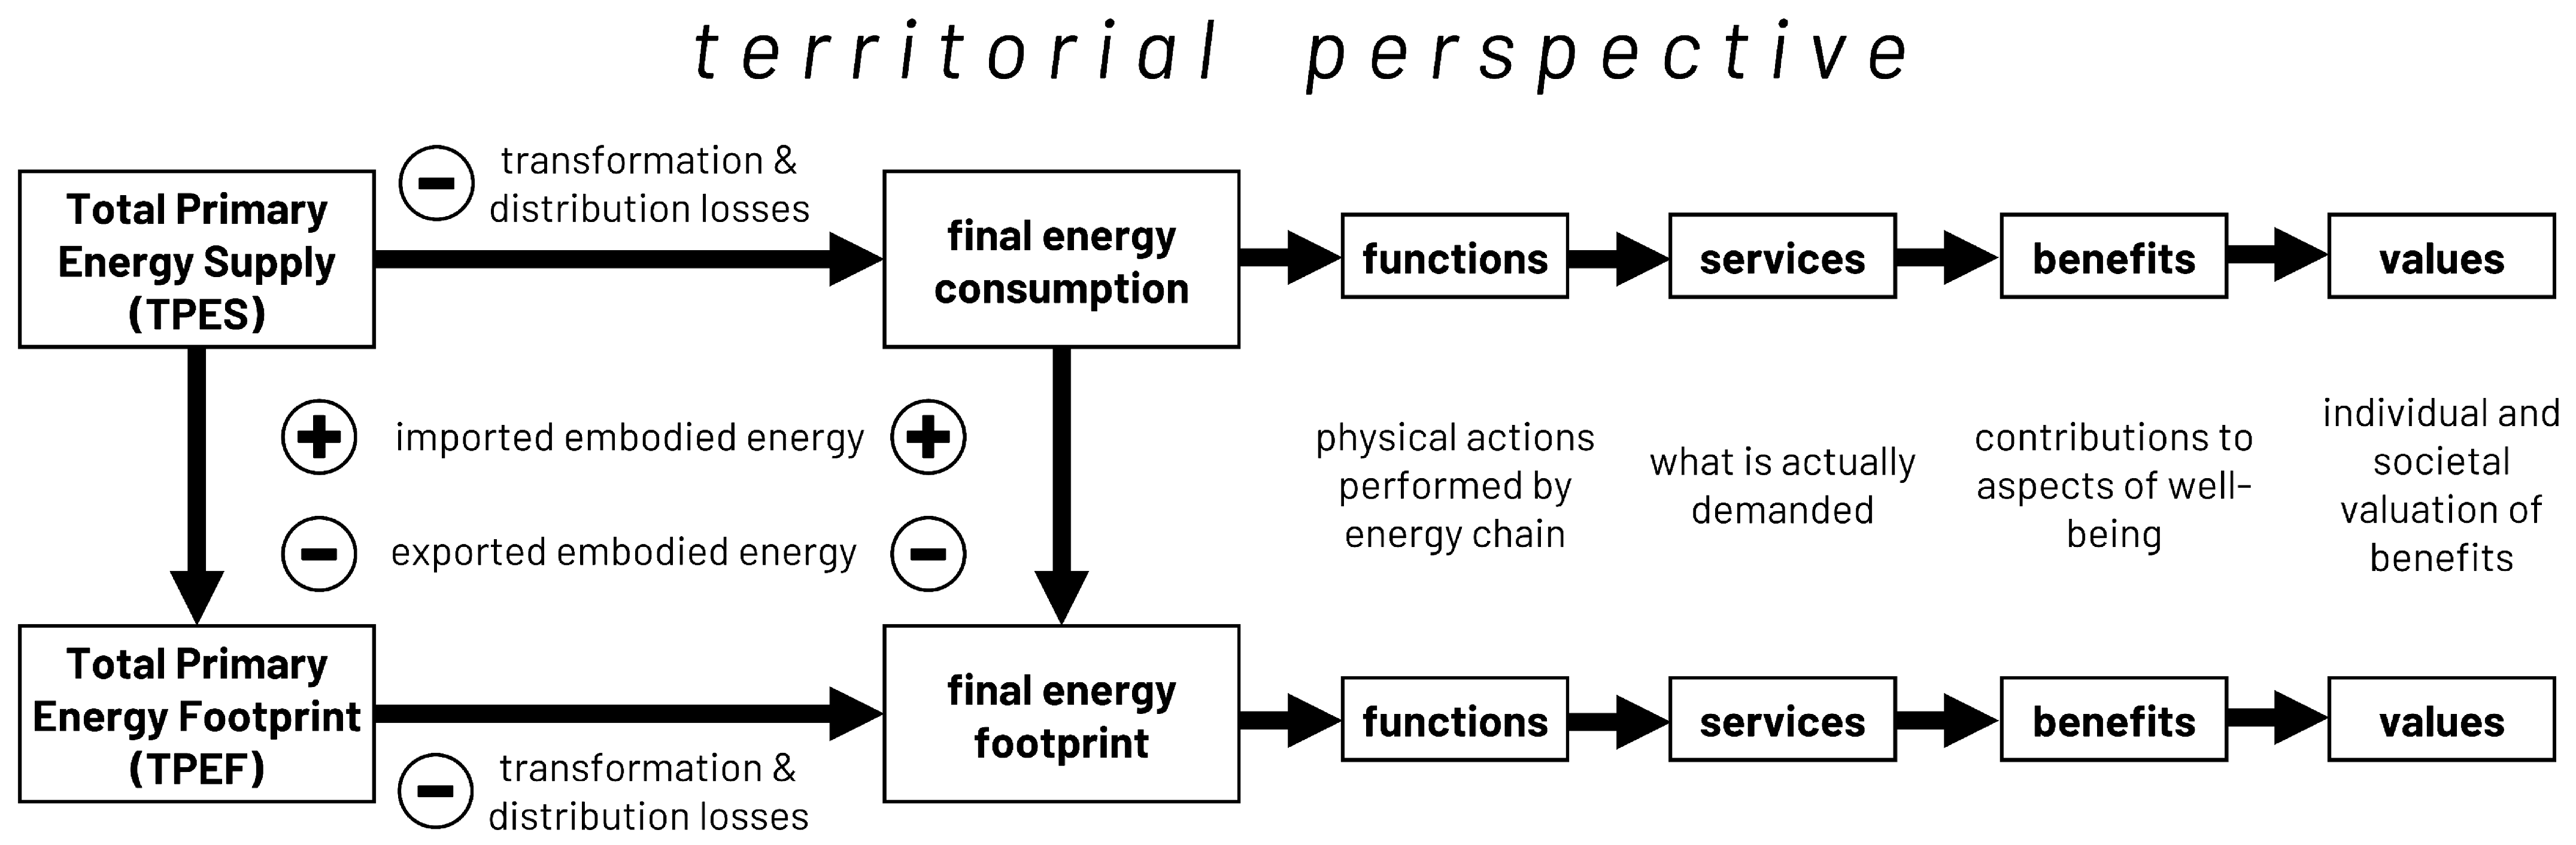
3.1. Characterizing Energy Services

When investigating the relationship between energy and well-being, one must understand how the two relate to each other. It is well established in the literature that there is no demand for energy as such (measured in physical units, e.g., 1 MWh of electricity), as it does not directly contribute to human well-being. Rather, there is demand for the services enabled by energy use, which in turn contribute to well-being, e.g., [38,39]. While the term energy services has been widely used in the literature, its definition can vary widely [40]. Hereinafter, we will use the terminology established by Kalt et al. [39] in the Energy Service Cascade framework (see Figure 1): They refer to functions as physical actions performed using energy as an input (e.g., running a heat pump for space heating), to services as what is demanded (e.g., higher room temperature), to benefits as how the service relates to well-being (e.g., thermal comfort), and to values when attributing a valuation to the benefits (individually and societally). In the literature, both functions and services are commonly and interchangeably referred to as energy services. The further we move along the Energy Service Cascade, the better the indicator as a proxy for the contribution to well-being, but also the more indirect the measurability in physical units. Therefore, as Kalt et al. [39] point out, many studies investigating the link between energy use and well-being forgo linking energy use to benefits or values in favor of straightforward measurability. Still, it is worthwhile to characterize energy use ranges [41] since energy is a necessary input for the Energy Service Cascade. Conversely, emissions are only an (avoidable) byproduct of energy use [42,43]. The relationship between emissions and well-being is also subject to a wide body of scientific research [44].

3.2. Primary vs. Final Metrics

Energy indicators can be divided into primary and final energy metrics. Primary metrics such as Total Primary Energy Supply (TPES) and Total Primary Energy Footprint (TPEF) measure the energy input into the system, thus including transformation and distribution losses as well as the final consumption by consumers. Final metrics such as final energy consumption or final energy footprint only include final consumption [42].

3.3. Consumption vs. Production-Based Metrics

Historically, a country’s energy consumption has been measured using production-based metrics such as TPES, which includes all the energy generated and used in a country, adding imported energy (e.g., coal imports) and subtracting exported energy (e.g., oil exports). Thus, it uses the territorial perspective, most prominently employed by the International Energy Agency (IEA) [45]. Importantly, production-based metrics do not include the energy embodied in internationally traded goods and services. The energy footprint (EF), a consumption-based accounting (CBA) method similar to the more established carbon footprint, addresses this drawback [42]. Some countries’ TPEF exceeds their TPES, meaning they are a net importer of embodied energy. This mostly applies to countries from the Global North. On the other hand, countries from the Global South often have a TPES that exceeds their TPEF, meaning they are net exporters of embodied energy. Consequently, some countries from the Global North seemingly reduce their energy consumption as measured by TPES while outsourcing energy consumption to other countries by importing energy embodied in products and services. The energy used to produce these products or enable these services is, however, part of the producing country’s TPES [45].
While production-based metrics are widely available for most countries through the IEA, international data availability is limited for consumption-based metrics [46,47], and mostly countries from the Global North are covered by EF studies [48]. Non-monetary consumption, most prevalently traditional biomass for cooking not bought on the market in low-income countries, presents a further accounting challenge in energy footprinting [48]. Footprint calculations require more data since trade flows must be modeled using input-output (IO) models, and calculations are not standardized (e.g., using different IO models), which can lead to studies calculating significantly different footprints for the same country, thereby limiting inter-study comparability [46]. Furthermore, issues of double accounting are prevalent but can be avoided [49]. Footprint data years typically lag behind more than TPES [46].

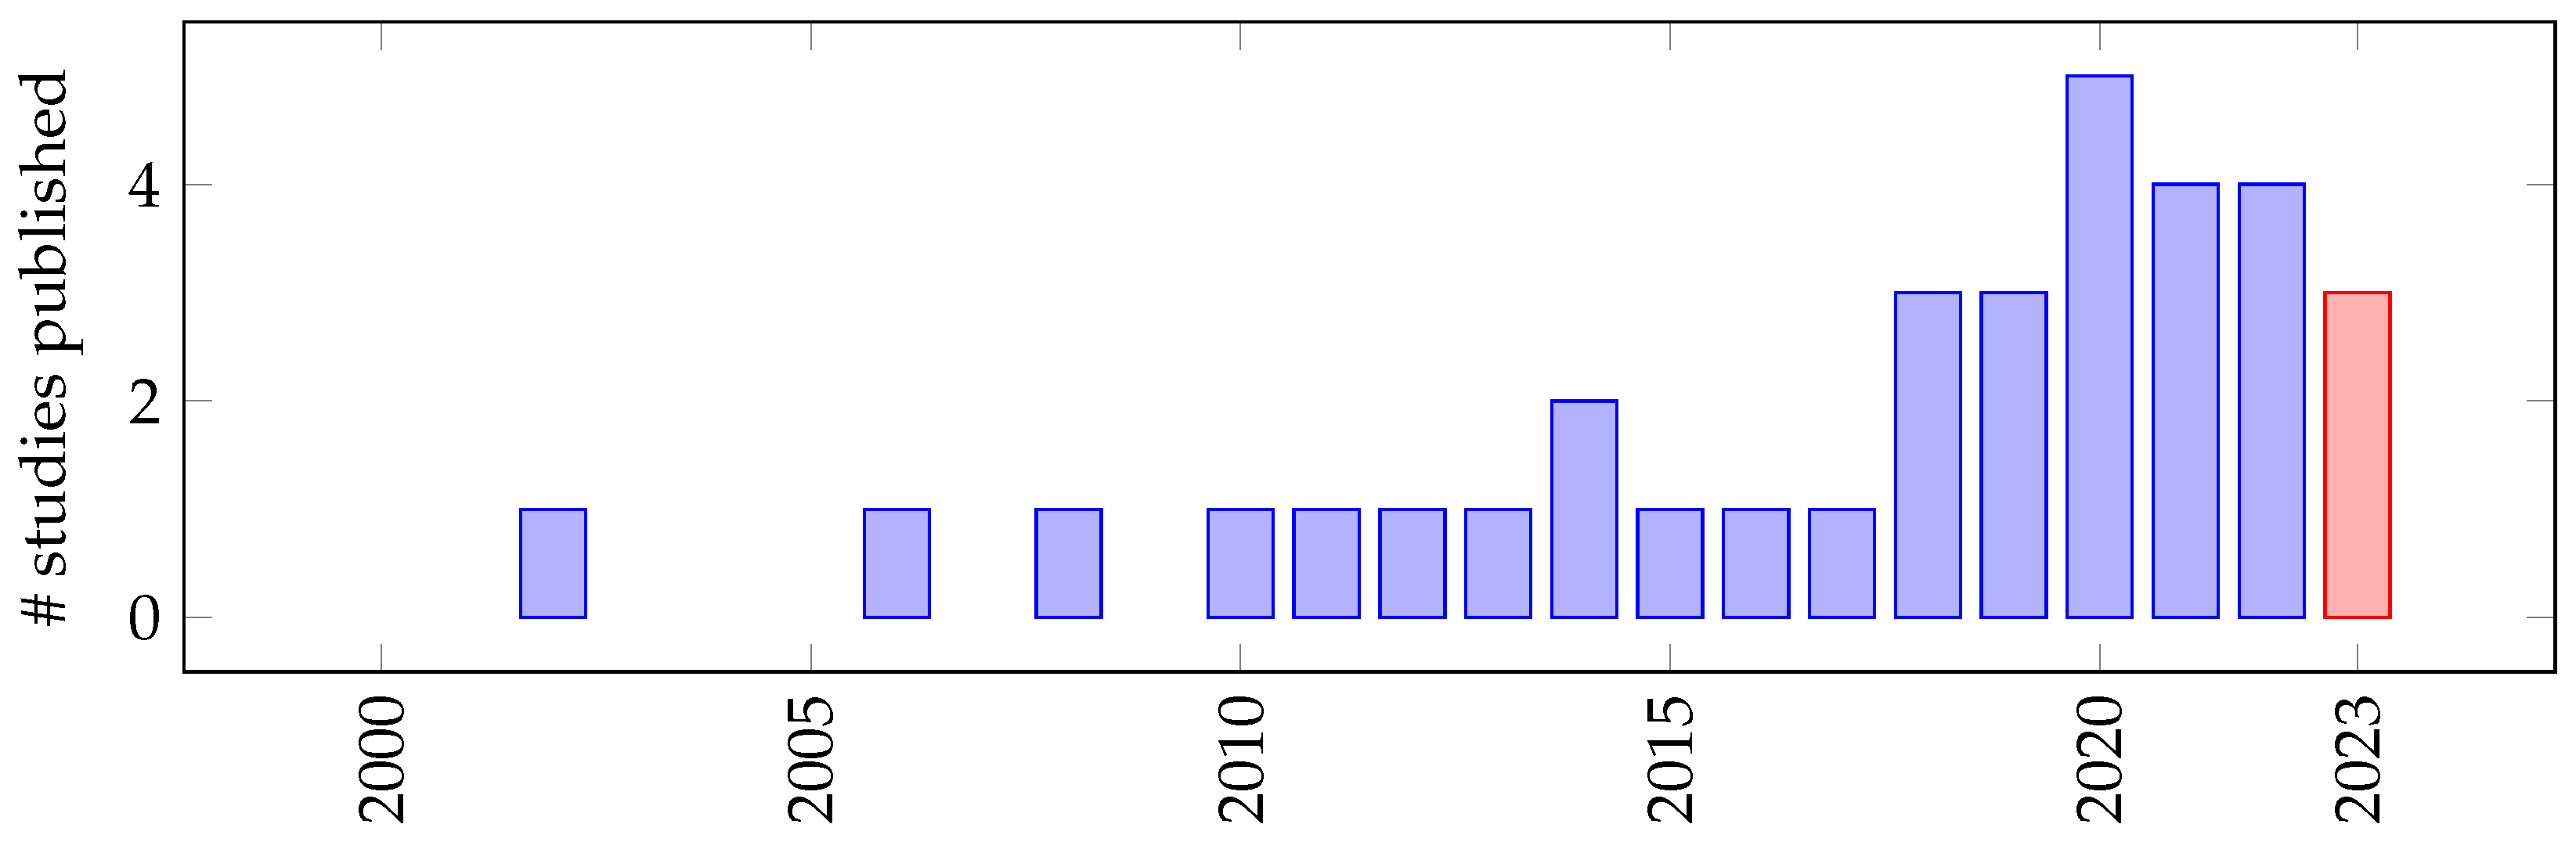
4. Development of the Field
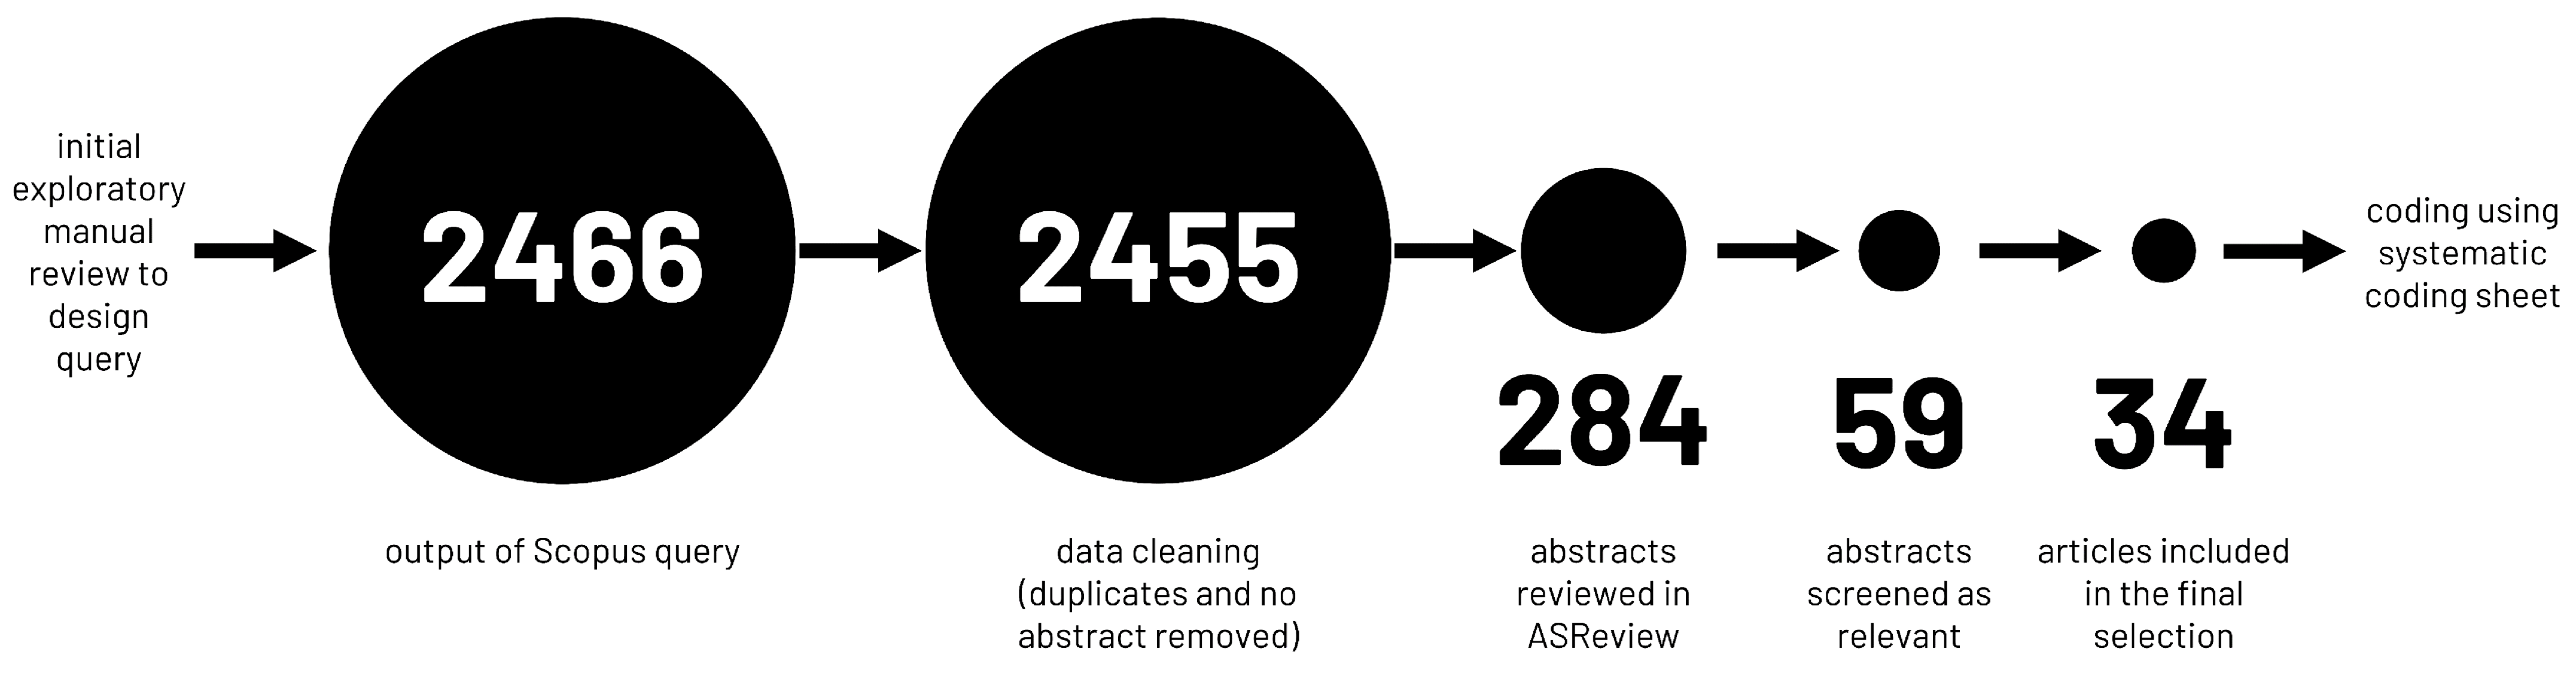
Studies examining the relationship between energy use and human well-being date back to the 1970s. Gross Domestic Product (GDP) or Gross National Product (GNP) served as the dominant proxy for measuring well-being at that time [50]. However, the limitations of using GDP or GNP as a well-being indicator had already been recognized, and alternative ways to measure well-being and its relationship to energy use had started to emerge. Prior to the 2000s, research studying the relationship between energy use and well-being was relatively scarce, with only a limited number of studies published [51,52,53,54,55,56,57]. The earliest study identified for this paper was conducted in 1974 when Mazur and Rosa [53] studied the relationship between energy use and 27 quality of life indicators—economic and non-economic—across 55 countries. Starting from the 2000s, a modest increase was observed in the number of studies exploring this relationship, but it was not until around 2010 that a significant surge in publications took place.
Many studies highlight differences in the relationship between energy consumption and well-being between developed and developing countries. In developing countries with lower per capita energy levels, increased energy consumption is associated with a significant improvement in well-being. However, developed countries with higher levels of energy use often exhibit diminishing returns beyond a certain level of energy use e.g., [47,58,59]. This phenomenon is called a “plateau” [60] or more frequently described as “saturation” [59] in the literature.
The majority of earlier studies examining the relationship between energy consumption and well-being were cross-sectional analyses, e.g., [53,56,59,61,62,63]. While some earlier studies did consider multiple points in time [57,60], Steinberger and Roberts [64] performed novel longitudinal analyses spanning the years 1975 to 2005 in 2010. The dominant energy indicator in research exploring the relationship between energy use and human well-being is TPES. However, due to the criticism TPES has faced in today’s globalized world, there has been an increased interest in TPEF in more recent studies [42,65], which have also introduced the concept of energy sufficiency [47,58].
The most recent development of the field, which has taken place after 2020, has been the increase in studies exploring the relationship between household-level energy use and well-being, deviating from the predominant country-level research found in the vast majority of the literature [13,48,66]. These studies highlight the unequal distribution of energy use within countries. Specifically, those with high income levels and well-being are shown to drive excessive energy consumption [13]. They also emphasize the importance of providing access to collective provisioning systems in developing countries, suggesting that it holds greater significance for household need satisfaction than individual income or energy consumption [48,66].

5. Review Process

After an exploratory manual review, the scientific literature database Scopus was used to identify articles discussing the relationship between energy and well-being. The energy-related terms used for the search queries were ‘energy demand’, ‘energy use’, ‘energy consumption’, ‘energy footprint’, ‘primary energy’, and ‘final energy’. The well-being-related terms used were ‘well-being’, ‘happiness’, ‘life satisfaction’, ‘human development’, ‘welfare’, ‘human needs’, and ‘quality of life’. The Boolean search string used for the Scopus query was “TITLE-ABS-KEY ((“energy demand” OR “energy use” OR “energy consumption” OR “energy footprint” OR “primary energy” OR “final energy”) AND (“well-being” OR happiness OR “life satisfaction” OR “human development” OR welfare OR “human needs” OR “quality of life”)) AND (LIMIT-TO (DOCTYPE, “ar”) OR LIMIT-TO (DOCTYPE, “re”))”. The search was limited to articles and review papers in English and was performed in April 2023. It was conducted within the article title, abstract, and keywords, and initially yielded 2466 articles, which was reduced to 2455 after removing articles without abstracts (see Figure 2). Only papers released from 2000 onwards were considered for the final selection.
The query results, including article title, keywords, and abstract, were used as inputs for the machine learning tool ASReview, which uses an active learning language-based machine learning model to facilitate the reviewing process [67]. Initially, the model was provided with three relevant and three irrelevant articles that had already been identified during the initial literature review. Through continuous evaluation of relevant and irrelevant abstracts by the reviewers, the model was trained, with it providing the most relevant remaining article from the remaining set of articles. The screening of abstracts was stopped after encountering thirty consecutive irrelevant articles, leading to 284 abstracts being reviewed. Fifty-nine articles were deemed relevant in ASReview based on the abstract.
To be included in the analysis, a paper had to investigate the quantitative relationship between energy use and well-being specifically. Furthermore, the analysis required the energy use component to encompass all energy use, irrespective of whether a consumption- or production-based metric was utilized. As a result, papers focusing solely on energy consumed within the house or in transport were excluded. Additionally, the selected papers had to examine historical data—future scenario analyses were not considered. Papers that solely employed GDP as a proxy for well-being were excluded from the analysis. After evaluating the papers beyond the abstract, thirty-four articles met the inclusion criteria and were coded.
The coding sheet consisted of information about the location and spatial level of the study as well as detailed information about the energy and well-being indicator/s being used in the study. Additionally, it incorporated the study’s objectives, key findings, analysis method, policy relevance, recommendations, and potential avenues for further research if indicated within the study.
The relationship between energy use and well-being has received increasing attention in the scientific community in the last five years. This is shown by an increasing number of publications included in our systematic review from 2000 onwards (see Figure 3).

6. Results: Main Conceptual Differences between the Studies

6.1. Top-Down vs. Bottom-Up

6.1.1. Top-Down

A main conceptual difference between studies is the perspective they take, with the vast majority (29 of 34, see Table 1) taking a top-down (TD) angle. Generally, TD and bottom-up (BU) studies use fundamentally different approaches, both regarding the indicators used as well as data sources and analysis methods. TD studies use country-level data and, with one exception [68], look at multiple countries to establish relationships between the chosen energy and well-being variables. Due to the nature of the data being used, TD studies capture the energy used by all those using the area, not only residents. There is, therefore, no direct connection between the energy use of the residents and their well-being in such studies, which separates them from BU studies. Some TD studies only look at a single data year, e.g., [47,59,65] while most use panel data covering up to 30 years, e.g., [69,70,71] to assess changes over time, first recommended by Mazur and Rosa [72]. A few studies also use multi-year averages [35,73].
The overwhelming majority of TD studies provide evidence for a positive relationship between energy use and well-being, using a wide variety of measures of well-being and energy use [35,41,42,47,58,59,61,64,65,72,74,75,76,77,78,79,80,81,82]. Most also report diminishing marginal gains in well-being with increasing energy use—a saturation effect—resulting in negligible increases in well-being at high levels of energy use [35,41,42,47,58,59,61,64,65,72,74,75,76,77,78]. Akizu-Gardoki et al. [65] question whether the relationship is monotonically increasing and theorize the existence of a well-being turning point, but cannot provide conclusive evidence thereof.
Table 1. The papers included in the review with selected key information.
AuthorYearSpatial LevelNumber of Countries/States/CountiesTD/BU *Energy
Indicator
Well-Being IndicatorWell-Being Indicator Objective/Subjective
El-Ghannam [83]2002country103TDTPESComposite indicator: (1) Infant mortality rate; (2) Literacy rate; (3) Life expectancy at birthobjective
Dias et al. [61]2006countrynot statedTDunclear(old) HDIobjective
Martínez and Ebenhack [59]2008country120TDunclearHDIobjective
Steinberger and Roberts [64]2010country80–110TDTPES3: Life expectancy; Literacy; HDIobjective
Mazur [72]2011country21TDTPES13: Life expectancy; Infant mortality rate; Physicians and hospital beds/cap; Rate of enrollment in college; Internet users/cap; Fixed and mobile phone subscribers/cap; % households with television; Passenger cars/cap; GDP per capita; Male suicides/cap; Divorce rate; % population satisfied with their lifeobjective and subjective
Pasten and Santamarina [74]2012country118TDTPESQoL index: (1) Life expectancy at birth; (2) Mean years of schoolingobjective
Ouedraogo [84]2013country15TDunclearHDIobjective
Jorgenson et al. [69]2014country12TDTPESLife expectancy at birthobjective
Ugursal [75]2014countrynot statedTDunclearHDIobjective
Lamb and Rao [76]2015country, region67TDfinal energy consumption2: Composite indicator: (1) Access to improved sanitation facilities; (2) Access to household electricity; (3) Access to improved water source; (4) Adequate nourishment; (5) Access to education; (6) Survival rate to 5 years; Life expectancy at birthobjective
Arto et al. [42]2016country40 + rest of world regionTDTPEF and TPESHDIobjective
Ribas et al. [85]2017country118TDTPESInclusive Wealth Indicatorobjective
Akizu-Gardoki et al. [70]2018country126TDTPEFHDIobjective
Nadimi and Tokimatsu [77]2018country112TDTPESLinear QoL index: (1) Mean years of schooling; (2) GDP/cap; (3) GNI/cap; (4) Infant health rate; (5) Life expectancy at birth; (6) Improved water accessobjective
Nadimi and Tokimatsu [78]2018country112TDfinal energy consumptionLinear QoL index: (1) Mean years of schooling; (2) GDP/cap; (3) GNI/cap; (4) Infant health rate; (5) Life expectancy at birth; (6) Improved water accessobjective
Afia [79]2019country47TDunclearHappiness levelsubjective
Liu and Matsushima [73]2019country66TDunclear8: HDI; Gender Inequality Index; Corruption Perceptions Index; Environmental Performance Index, Education Index; Life expectancy at birth; Total unemployment rate; Under-five mortality rateobjective
Tran et al. [9]2019country93TDTPESHDI growth rateobjective
Akizu-Gardoki et al. [65]2020country176TDfootprint (primary)5: HDI (also its disaggregated components); Gallup Global Wellbeing; Happy Planet Index; Sustainable Society Index; Better Life Indexobjective and subjective
Long et al. [86]2020province30 provincesBUunclearNormalized index: (1) Population mortality; (2) Infant mortality; (3) Maternal mortalityobjective
Makarova et al. [80]2020country77TDTPESHDIobjective
Okulicz-Kozaryn and Altman [35]2020country, state, countynot statedTDTPESSubjective well-beingsubjective
Torchio et al. [71]2020country6TDTPES; (TPES-AFC **)HDIobjective
Baltruszewicz et al. [66]2021household1BUfootprint (final)4: Health (malnutrition) status of children; Access to clean water; Education; Nutritionobjective
Baltruszewicz et al. [48]2021household3BUfootprint (final)4: Access to modern cooking fuels; Access to clean water; Education; Nutritionobjective
Frigo et al. [41]2021countrynot statedTDTPESHDIobjective
Vogel et al. [47]2021country106TDfinal energy consumption6: Life expectancy at birth; % meeting dietary energy requirements; % access to improved water source; % access to improved sanitation facilities; Education index; Abundance of income shortfallobjective
Banday and Kocoglu [81]2022country20TDTPESHDIobjective
Jackson et al. [58]2022country140TDTPES9: Access to electricity; Air quality; Food supply; Gini coefficient; Happiness; Infant mortality; Life expectancy; Prosperity; Sanitationobjective
Li and Chen [87]2022household25 provincesBUenergy use from energy expenditure dataLife satisfactionsubjective
Musakwa and Odhiambo [68]2022country1TDunclearHDIobjective
Balsamo et al. [82]2023country183TDunclear2: HDI; Coefficient of Human Inequalityobjective
Baltruszewicz et al. [13]2023household1BUfootprint (final)7: Mental Health Index; Physical Health Index; Loneliness Index; Subjective Well-Being Index; Subjective Financial Situation; Energy Poverty; Above the poverty lineobjective and subjective
Piao and Managi [88]2023country37BUenergy use from energy expenditure data2: Life satisfaction; Happinesssubjective
* top-down/bottom-up; ** energy available for final consumption.
Most studies that show a saturation effect propose a relationship with strictly decreasing marginal benefits of increased energy use (e.g., using a logarithmic function). Nadimi and Tokimatsu [77,78] propose using a sigmoid function, where they found that in pre-developing countries with very low energy use, an increase in energy use would not yield high gains in quality of life. Many papers also draw attention to significant inter-country variance in well-being for a given level of energy use [35,47,59,74,75,80], arguing that energy use is a necessary but not sufficient condition for need satisfaction and that provisioning factors play an important role that is typically overlooked, leading to overestimating the importance of energy use [47]. An implication of the observed variance is that countries “transform” energy into well-being at different levels of efficiency [59,74]. Looking at outliers can, therefore, provide insights into what (not) to do with regard to energy policy [59].
However, there are also studies that do not find an effect of energy use on well-being, most notably Tran et al. [9]. They attempted to isolate a causal relationship, whereas many other studies present correlations without making causal claims. They found no significant impact of energy consumption on the HDI in the short run for a global country sample, including developing and developed countries. Generally, there are calls for more research investigating the causal relationship [9,81]. Other studies focusing on certain country groups find no significant relationship (see Section 6.2). As a country’s energy use increases, the effects on well-being arguably materialize with some time lag. Martínez and Ebenhack [59] point out this issue with regard to energy use and HDI, stating that comparing data for the same data year may not be useful. We encourage further research on this time lag.

6.1.2. Bottom-Up

In contrast to TD studies, BU studies model energy use and associated levels of well-being at the household level, requiring survey data, including household expenditure, to calculate energy use and well-being data. Elements of TD studies can be included in a BU framework as shown by Li and Chen [87], who consider macro factors such as GDP alongside micro factors such as per capita income.
Some BU studies use separate datasets for expenditure surveys (used for energy use calculation) and well-being: Due to a lack of a common household identifier, Baltruszewicz et al. [13] perform statistical matching on common variables to link the datasets. Other BU studies use datasets that include both expenditure and well-being data points [66], eliminating statistical matching as an error source. Okulicz-Kozaryn and Altman [35] call for collecting energy use data when conducting surveys for subjective well-being (SWB) data. Generally, thus, BU studies are often limited by data availability, resulting in issues due to misaligned datasets and data points not being available for all households in the sample—especially for studies covering multiple countries [66]. Compared to TD studies, BU studies have the issue of representativeness of the sample of the population analyzed when scaling the results to the entire population. The dataset used by Baltruszewicz et al. [66] includes demographic weights that allow scaling up results to the entire population. However, these weights are another potential error source. Using more than one survey dataset to calculate energy use and/or well-being and comparing the results, as done by Baltruszewicz et al. [13], can help to show internal validity.
In line with most inter-country findings from TD studies, Baltruszewicz et al. [13] show that the relationship between the household-level EF and well-being in the United Kingdom also follows a saturation curve, with diminishing gains in well-being as the EF increases. However, the data show that high well-being is also attainable at low levels of energy use, suggesting that other variables such as provisioning systems and socio-economic factors may be central. Furthermore, this shows that it is difficult to establish a specific energy threshold required for the attainment of high well-being. In a literature review on energy sufficiency, Burke [2] defines energy sufficiency as being measured on the aggregate societal level, which, in light of the results discussed above, may not always be a helpful definition. Future BU studies can contribute to the understanding of the importance (or non-importance) of energy use on well-being on the micro-level to further the discourse on energy sufficiency thresholds.
TD studies can only analyze country-level aggregate data. In contrast, BU studies can link energy use to well-being levels on a household scale, thus uncovering patterns hidden on the country level. Referring to the Energy Services Cascade, these studies usually do not investigate the relationship between functions enabled by energy and respective benefits for well-being [39]. For example, Baltruszewicz et al. [48] find that final EFs in the housing domain in Zambia, Nepal, and Vietnam decrease when basic well-being outcomes are attained, which can be attributed to households with lower well-being using traditional biomass for cooking. In comparison, households with higher well-being have shifted to so-called modern, more efficient fuels such as gas. Meanwhile, the footprint associated with transport and indirect energy (i.e., energy embodied in products and services) increases when households attain basic well-being outcomes. These findings show the value of disaggregating energy consumption data by domain when linking them to well-being, contradicting the common narrative from most TD studies that more energy is required to improve well-being. The findings are also in line with findings from a TD study on 15 developing countries, where a negative relationship between energy use and HDI was found, explained by the effect of the use of traditional biomass [84].
While most BU studies focus on one or a handful of countries, Piao and Managi [88] conduct a survey with more than 100,000 observations across 37 countries to investigate, amongst others, the relationship between energy use and SWB. They show that, generally, increased energy use is associated with higher SWB, with the effect being weaker in high-income countries. On the country level, they show a positive relationship in 27 out of 37 countries, with no significant relationship in several high-income countries, which they attribute to these countries having reached a saturation point.

6.2. Spatial Scope

Due to their reliance on household-level survey data, BU studies typically only cover a single country or a handful of countries. In contrast to TD studies, individual household energy use can be linked to other characteristics identified in the survey, including location. Thus, spatial disaggregation is enabled by the granularity of the data. For BU studies, Baltruszewicz et al. [66] call for more studies on often understudied countries in the Global South. Generally, many authors call for studying different country contexts [71,73,80,81,87].
In addition to energy use, BU studies also identify well-being indicators on the household level. In contrast to TD studies, where only aggregate country-level energy use and well-being can be analyzed, BU studies can link and analyze these metrics on a micro level. BU studies, therefore, enable linking disaggregated energy use with well-being indicators, taking household-level socio-economic variables such as income as well as geographical factors into account. This makes BU studies a powerful tool to estimate the energy requirements contained in energy services. TD studies, on the other hand, can provide guidance for macro-level policies [44]. Both perspectives can show inequality, with TD studies capturing inter-country inequality and BU studies showing inequality within countries.
While some TD studies only look at countries within certain areas of the world (e.g., by development level [72,81,83,84], regional country groups [69,71], or even a single country [68]), many studies look at more than 100 countries. Some studies perform further analyses for subsamples, estimating separate coefficients for country groups (e.g., OECD/non-OECD [73], excluding outliers [65], or self-constructed country groups [59]). Tran et al. [9] suggest exploring transitional economies as a group, and many studies recommend further research for other countries [66,69,72,73,80,85,87], and taking the country-specific climatic context into account [72,80].
There are TD studies looking at a non-global sample that do not find a positive relationship: Okulicz-Kozaryn and Altman [35] find no significant relationship between SWB and energy use amongst US states, and Mazur [72] find insignificant correlations between energy use and various QoL indicators in developed countries using time series data for three decades. Both studies, therefore, analyze countries and regions that, in a typical global TD study, would have been at the saturated part of the relationship. At this point, well-being gains for additional energy use are small/non-existent, thus providing further evidence for the saturation phenomenon [35,72]. Musakwa and Odhiambo [68] find that energy consumption does not have an impact on human development in South Africa using a longitudinal TD approach.
Many studies include more than 100 countries in their analysis. Still, some do not specify which countries are included, and some do not even state the number of countries. Some indicate that they include countries based on data availability, e.g., [82,85]; Others define a minimum population threshold for a country to be included in the sample [72,74]. While not all studies include a list of included countries, we compiled and mapped data from all 10 TD studies with a global panel of countries (i.e., studies that do not limit their scope to a particular group of countries) that explicitly list the countries included in the assessment [9,64,65,70,73,77,78,80,82,85], see Figure 4. It is apparent that especially Sub-Saharan African countries are underrepresented in global analyses, which may skew results. Future TD global research should strive to use comprehensive datasets and discuss the implications of country coverage.
Beyond what is visible on the map, many small countries are often excluded from analyses. The average number of studies covering Small Island Developing States (SIDS) is only 2.7, with the overall average being 6.0. However, in how far small nations such as SIDS affect the overall results depends on whether the regressions are unweighted or performed with population weights. This is especially important since small countries often show patterns of energy use and well-being that differ from the global trend [64]. When regressions are used for descriptive statistics, weighting is required to achieve representativeness of the target population. In analyses that aim at establishing causal relationships, the question of whether or not to apply weights becomes more nuanced [89].
Steinberger and Roberts [64] justify applying population weights by arguing that large countries better represent global patterns, in part because small countries could import energy-intensive goods and services. While applying population weights does mitigate this issue, it arguably does not solve it at its root. Rather, the rationale presented is a reason to switch to a consumption-based energy indicator (see Section 6.3). Generally, however, performing both weighted and unweighted regressions is considered good practice. Contradictions between the two can be a red flag that the chosen specification for the regression is not appropriate [89]. Steinberger and Roberts [64] perform their regressions with and without weights and discuss the results, finding that the goodness-of-fit parameter R 2 is significantly lower without applying population weights, which they attribute to many smaller countries deviating from the global trend. Akizu-Gardoki et al. [65] also find that small countries with high levels of energy consumption significantly affect their findings when using an unweighted regression, leading to an apparent negative marginal effect of energy consumption on well-being at high levels of energy consumption which disappears when using population weights.

6.3. Energy Indicator

In TD studies, the energy indicator is typically TPES per capita, and data from the IEA are used. The energy indicator used was not specified in around a third of TD studies reviewed. While most studies that did not discuss the energy indicator in detail probably used TPES per capita, it is important that studies specify the type of indicator used. This is paramount to be able to interpret the results correctly and compare different studies’ results.
Authors using primary energy metrics, which include transformation and distribution losses, draw attention to the importance of technological advancements in energy transformation and transmission and how they relate to human well-being [64,85]. Authors using final energy argue that final energy is closer to the point of consumption and, therefore, a better proxy for needs satisfaction [13,48,66,76]. Most authors neither discuss their choice between primary or final energy nor the implications thereof for interpreting the results.
Martínez and Ebenhack [59] find that the correlation between TPES and HDI improves when just considering energy from modern sources, thereby questioning the importance of traditional biomass as an explanatory variable for well-being. This is in line with a TD study covering 15 developing countries, which finds no short-term effect of energy use on HDI and a negative long-term effect. They attribute this to the prevalent use of inefficient biomass in the country sample. They find a positive relationship between electricity use and HDI [84], underlining the importance of energy quality rather than quantity [48,84]. In contrast to this, Steinberger and Roberts [64] perform their analyses on a global sample, both including and excluding traditional biomass and waste combustion, and do not find a significant difference.
The clear majority of the papers, 28 of 34, only use territorial energy metrics, mostly TPES (this reasonably assumes that studies that do not specify the energy metric used employ a territorial metric). While some studies acknowledge the limitations of TPES, namely not including energy embodied in internationally traded goods, the vast majority of studies do not critically reflect on their choice of energy indicator. Future studies should include a discussion of the implications of choosing a territorial or consumption-based energy indicator and take it into account when evaluating their data. At the same time, the importance of a consumption perspective has been stressed for some time in the literature [64]. CBA as operationalized by the TPEF has been first used by Arto et al. [42] in the context of well-being and has seen increasing use in recent years: In the three TD-footprint studies, taking a global perspective on the country level, the TPEF per capita per year is calculated using IEA TPES data and different IO databases (World Input-Output Database [42], Eora26 [65,70]). Some studies resort to using production-based metrics because international energy footprint data are not readily available [47].
Arto et al. [42] perform regressions with both TPEF and TPES and find positive relationships to the HDI for both, but stress that the goodness of fit is higher for TPEF and that, for a given level of development, energy requirements are higher when measured as TPEF. BU footprint studies typically investigate a single or a handful of countries on the household level, which is enabled by combining representative household survey data for expenditure with input-output databases (Global Trade Analysis Project (GTAP) [48,66]; UKMRIO and EXIOBASE [13]), have only been published in recent years. BU studies that use expenditure data to infer energy use require accurate pricing information for accurate results, which can be challenging to obtain and can potentially skew the results [88].

6.4. Well-Being Indicator

The vast majority of TD studies employ an objective measure of well-being, with the majority using the HDI as either the only or one of the well-being indicators used. Akizu-Gardoki et al. [65] also analyze the three components of the HDI separately, investigating the contributing factors individually. Generally, studies that do not use the HDI often use similar objective measures of well-being to the components of the HDI, notably indicators for life expectancy and education. While some TD studies that use multiple indicators of well-being analyze the relationship separately for each indicator, e.g., [58,64,73], others either use a pre-existing composite indicator such as the HDI or construct their own composite indicator [74,76,77,78,83]. Authors computing their own well-being indicators are strongly encouraged to provide comprehensive insights into the calculation methodology. Furthermore, clear information on data sources and data years is important, regardless of the well-being indicators used. Due to the complex nature of measuring well-being, authors suggest iterating on studies using different measures of well-being [39,65,71,73,85].
Most BU studies build on the Theory of Human Needs proposed by Doyal and Gough [90] and employ a composite, self-calculated, eudaimonic indicator of well- being [13,48,66]. While some BU studies use hedonic well-being indicators [87,88], some authors argue that eudaimonia should be the preferred well-being framework in this context [39]. Depending on the survey setting, self-reporting, and selection biases may also systematically skew results [66,88], and depending on how the survey was disseminated, data may also be subject to selection bias, for example by using an internet-based survey in a lower-income country, thereby skewing the sample to wealthy households. Face-to-face interviews can be used to mitigate this issue [88].

7. Discussion

Understanding the relationship between energy use and well-being is key to effectively mitigating anthropogenic climate change and promoting human development in our current fossil-based energy system. This review examined the current state of the literature, focusing on and discussing methodological differences between study designs. While the relationship between energy use and well-being has been subject to scientific inquiry since the 1970s, literature prior to the 2000s was scarce. Since then, and especially since the 2010s, the number of TD studies has rapidly increased, primarily using TPES and the HDI. BU studies and CBA have only become mainstream in the late 2010s. Therefore, most studies considered in this review take a TD perspective—correlational studies on the country level. Historically, these have used production-based energy metrics, but recent studies increasingly employ footprinting methodology to account for the energy embodied in international trade. Most TD studies use an objective measure of well-being—namely the HDI—while BU studies use both objective and subjective well-being indicators on the household level. TD studies typically find a positive relationship between energy use and well-being; most confirm the existence of a saturation effect, where marginal increases in energy use yield high gains in well-being at low levels of energy use and low to non-existent gains at high levels of energy use. Significant variance exists in the level of well-being for a given level of energy use on the country level, and not all studies find statistically significant relationships. The shift from inefficient, traditional biomass to modern cooking fuels explains that some studies looking at low-income countries/households find a negative relationship between energy use and well-being, thereby questioning the explanatory value of traditional biomass for the relationship in question. The few BU studies overall support the hypothesis of a positive relationship and a saturation effect but offer more granular insights on the household level and disaggregated by energy use domains.
There is an abundance of TD country-level correlational studies showing the historical relationship between energy use and well-being. We agree with Vogel et al. [47] in that there is greater value in longitudinal studies than further examinations of the relationship at a single point in time. Because most but not all studies show strictly decreasing marginal utility, we suggest future TD studies to explore the shape of the relationship further, as some studies also propose a sigmoid function to describe the relationship best. As countries with low energy use are also currently underrepresented in these studies, including them in future analyses is vital.
Many studies provide evidence for the existence of a saturation effect, also on the country level, which provides important insights into the potential of energy sufficiency strategies that are urgently needed to tackle the climate crisis. BU studies can not only link energy use and well-being data on the household level and thus establish a closer link—they also enable a more granular understanding of the relationship by energy domain. This is vital since aggregation may hide trends in the underlying domains. The BU literature has only recently emerged, and there is much room for studies to investigate other country contexts as well as furthering the methodology. Following the country classification introduced by Nadimi and Tokimatsu [77], BU studies can inform different types of energy policy depending on the country context: In low-income countries, BU studies can investigate the energy associated with increased well-being by domain on the household level. These insights are vital to enabling poverty reduction. In countries with medium incomes, BU studies can inform eco-efficiency policy by highlighting sectors where energy can be “transformed” into well-being more efficiently, thus reducing energy use for a given level of well-being. According to studies using country-level data, some high-income countries may have already reached a saturation point where additional energy use is no longer associated with increased well-being. There, BU studies can draw attention to eco-sufficiency, thereby reducing excess energy use that does not contribute to improving well-being. We thus see great potential in exploring the relationship in novel country contexts using a BU framework and CBA.
Most existing studies use production-based energy metrics, thereby ignoring the impact of international trade flows. We recommend using footprinting methods where possible. Furthermore, we find that it is common for authors to not properly disclose the energy metric used in their analysis, and barely any studies using TPES mention that it does not include energy embodied in international trade. Explicitly stating the energy metric used is not only vital for reproducibility—it is also the prerequisite to critically discuss results and acknowledge limitations. Footprinting, because it requires IO models, relies more heavily on assumptions made by researchers and means that results can vary between studies. Furthermore, international EF data availability is currently limited. We, therefore, encourage stating the assumptions made in footprinting calculations to increase comparability between studies. We recommend iterating on existing TD studies using CBA, especially ensuring to choose IO models that do not systematically exclude countries from the Global South.
In BU studies, using a footprinting approach combined with household-level survey data can establish a closer link between energy use and well-being by differentiating between domains and disaggregating by socio-economic characteristics. Such studies can investigate characteristics linked to both excessive energy use and energy poverty. Energy poverty exists globally, with affluent regions facing affordability issues [13,91], while developing nations deal with limited access to clean energy [92]. Factors such as ethnicity, age, socio-economic status, and gender have been associated with energy poverty and lower well-being outcomes [13], often driven by a lack of distributional and procedural injustice which do not recognize these vulnerable groups across and within nations, where these factors tend to be overlooked in environmental policy and research [93,94]. By connecting these societal disparities in energy use to well-being attainment, such studies can enable tailored interventions to achieve more equitable access to energy resources in diverse socio-economic contexts [13,93]. The importance of such studies is only enhanced in the face of rapidly changing geopolitical energy contexts (e.g., the energy crisis since the beginning of the war in Ukraine) [95] and as we seek to achieve a safe—and just—energy transition [96], both of which have the potential to exacerbate energy poverty across consumption domains if not well managed. Although not our study’s primary focus, energy poverty is a crucial, complex consideration for the energy-use and well-being relationship.
Calculating EFs with household survey data are complex and requires further assumptions, as expenditure data are typically used. This is especially difficult in country contexts where non-monetary energy consumption, most notably self-collected traditional biomass, is prevalent. As studies have raised questions regarding the importance of traditional biomass in explaining well-being, future studies should consider comparing their results with and excluding traditional biomass in their energy metric. We recommend, where possible, collecting well-being data along with household expenditure surveys to avoid the need to statistically match datasets in BU studies. Iterating on studies using different measures of well-being can make findings more robust, and critically discussing the limitations of said measures is vital to correctly interpreting a study’s findings. When calculating a new measure of well-being, it is essential that authors clearly state the calculation methodology. For TD studies that currently often use the HDI, we recommend moving beyond the HDI as the sole well-being indicator and incorporating other indicators that do not directly include GDP.
Looking beyond the narrow scope of this review, other strands of literature have identified so-called provisioning factors—socio-economic factors that are relevant for the provisioning of goods and services—that may explain differences in well-being among countries with similar levels of energy use that many studies in this review identified, e.g., [47]. It is furthermore important to remember that the studies included in this review do not consider the relationship between the energy services (what is actually demanded) and well-being, but rather the energy that enables said services through functions. An emerging field of studies, e.g., [97] not considered in this review attempts to operationalize the concept of energy services, which is also better suited to draw up future energy use scenarios that ensure well-being. It is furthermore vital to recognize that future energy use and well-being pathways are not constrained to patterns found in historical data. These future scenarios, however, are best created by understanding historical data through BU methodology and then drawing up scenarios based on the insights gained, also considering the role of provisioning factors.

Limitations

While this paper aims to provide a comprehensive overview of the current state of the literature that explores the relationship between energy use and well-being, we also acknowledge its limitations. As a review, it has inherent limitations that come with both traditional and systematic literature reviews. Capturing all relevant articles exploring the relationship at hand is challenging as the vocabulary used is inconsistent. The query chosen was therefore designed to yield a large number of results, only a few of which were actually relevant to the review. We chose a machine learning-aided approach, which allowed us to rapidly screen the most relevant articles from the query. This is subject to error, as it is possible that relevant articles may have never been screened by a reviewer. It is, however, estimated that this error rate is no greater than that of a human reviewer [67]. While this review briefly covers well-being metrics, we refer to Li and Chen [44] for a recent in-depth overview. We draw attention to the questionable role of traditional biomass as an explanatory variable in the relationship, but did not consider literature that examines the relationship between different energy sources (e.g., non-renewable and renewable) on well-being, e.g., [98,99]. While recognizing the importance of this field, the energy production perspective was not considered in this review. Furthermore, an evaluation of the econometric methods used in the papers was beyond the scope of this review. Since the methodology fundamentally differs between TD and BU studies, future studies can evaluate the two separately. Additionally, while we took one approach in our machine learning-based review method, future researchers could use different methods, such as topic modeling, to further cluster and analyze the concepts presented in this paper. Such approaches could model how these topics are approached both spatially and temporally.

8. Conclusions

This work performed a machine learning-aided systematic review of studies that connected energy footprints and human well-being, eudaimonic and hedonic. Reviewing 34 articles, most found that a saturation effect exists for energy consumption where the marginal benefits of increased energy consumption decline. Of the two primary approaches that studied this topic (TD and BU), we found that BU studies using footprinting methods get closer to energy services than country-level studies using a production-based energy metric because of their ability to disaggregate energy data by consumption domain within a country and because they account for international trade. However, most of the studies reviewed took a TD approach and used production-based energy metrics, thus leading us to conclude that there is a need for more BU studies in different country contexts to be able to understand the household-level processes around energy use and well-being. We believe the development of more such studies could aid in crafting energy policy that can more effectively address the distributional aspects of energy poverty, hopefully serving to mediate between the potentially conflicting goals of human development and staying within planetary boundaries.

Author Contributions

Conceptualization, G.t.P., A.K.E., K.J.D. and J.H.; writing—original draft preparation, G.t.P. and A.K.E.; writing—review and editing, J.H., K.J.D., A.K.E. and G.t.P.; visualization, G.t.P.; supervision, K.J.D. and J.H.; funding acquisition, K.J.D. and J.H. All authors have read and agreed to the published version of the manuscript.

Funding

This research was funded by Vísindasjóður Orkuveitu Reykjavíkur (VOR) and Orkurannsóknasjóður Landsvirkjunar.

Data Availability Statement

No new data were created or analyzed in this study. Data sharing is not applicable to this article.

Conflicts of Interest

The funders had no role in the design of the study; in the collection, analyses, or interpretation of data; in the writing of the manuscript; or in the decision to publish the results.

Abbreviations

The following abbreviations are used in this manuscript:
BUBottom-up
CBAConsumption-based accounting
GDPGross Domestic Product
GNPGross National Product
HDIHuman Development Index
IOInput–output
IEAInternational Energy Agency
SIDSSmall Island Developing States
SWBSubjective well-being
TDTop-down
TPEFTotal Primary Energy Footprint
TPESTotal Primary Energy Supply

References

  1. IPCC. Climate Change 2022: Mitigation of Climate Change. Contribution of Working Group III to the Sixth Assessment Report of the Intergovernmental Panel on Climate Change; Cambridge University Press: Cambridge, UK; New York, NY, USA, 2022. [Google Scholar]
  2. Burke, M.J. Energy-Sufficiency for a Just Transition: A Systematic Review. Energies 2020, 13, 2444. [Google Scholar] [CrossRef]
  3. Raworth, K. A Safe and Just Space for Humanity: Can We Live within the Doughnut? Oxfam: Oxford, UK, 2012. [Google Scholar]
  4. Rockström, J.; Steffen, W.; Noone, K.; Persson, A.; Chapin, F.S.; Lambin, E.F.; Lenton, T.M.; Scheffer, M.; Folke, C.; Schellnhuber, H.J.; et al. A safe operating space for humanity. Nature 2009, 461, 472–475. [Google Scholar] [CrossRef] [PubMed]
  5. Brand-Correa, L.I.; Steinberger, J.K. A Framework for Decoupling Human Need Satisfaction From Energy Use. Ecol. Econ. 2017, 141, 43–52. [Google Scholar] [CrossRef]
  6. Day, R.; Walker, G.; Simcock, N. Conceptualising energy use and energy poverty using a capabilities framework. Energy Policy 2016, 93, 255–264. [Google Scholar] [CrossRef]
  7. Rao, N.D.; Min, J. Decent Living Standards: Material Prerequisites for Human Wellbeing. Soc. Indic. Res. 2018, 138, 225–244. [Google Scholar] [CrossRef]
  8. United Nations. Theme Report on Energy Acces Towards the Achievement of SDG 7 and Net-Zero Emissions; Technical Report; United Nations: New York, NY, USA, 2021. [Google Scholar]
  9. Tran, N.V.; Tran, Q.V.; Do, L.T.T.; Dinh, L.H.; Do, H.T.T. Trade off between environment, energy consumption and human development: Do levels of economic development matter? Energy 2019, 173, 483–493. [Google Scholar] [CrossRef]
  10. United Nations. Transforming Our World: The 2030 Agenda for Sustainable Development; Technical Report; United Nations: New York, NY, USA, 2015. [Google Scholar]
  11. Karekezi, S.; McDade, S.; Boardman, B.; Kimani, J.; Lustig, N. Energy, Poverty, and Development. In Global Energy Assessment: Toward a Sustainable Future; Cambridge University Press: Cambridge, UK, 2012; pp. 151–190. [Google Scholar]
  12. Höök, M.; Tang, X. Depletion of fossil fuels and anthropogenic climate change—A review. Energy Policy 2013, 52, 797–809. [Google Scholar] [CrossRef]
  13. Baltruszewicz, M.; Steinberger, J.K.; Paavola, J.; Ivanova, D.; Brand-Correa, L.I.; Owen, A. Social outcomes of energy use in the United Kingdom: Household energy footprints and their links to well-being. Ecol. Econ. 2023, 205, 107686. [Google Scholar] [CrossRef]
  14. Wiedmann, T.; Lenzen, M.; Keyßer, L.T.; Steinberger, J.K. Scientists’ warning on affluence. Nat. Commun. 2020, 11, 3107. [Google Scholar] [CrossRef]
  15. Grubler, A.; Wilson, C.; Bento, N.; Boza-Kiss, B.; Krey, V.; McCollum, D.L.; Rao, N.D.; Riahi, K.; Rogelj, J.; De Stercke, S.; et al. A low energy demand scenario for meeting the 1.5 °C target and sustainable development goals without negative emission technologies. Nat. Energy 2018, 3, 515–527. [Google Scholar] [CrossRef]
  16. Kikstra, J.S.; Mastrucci, A.; Min, J.; Riahi, K.; Rao, N.D. Decent living gaps and energy needs around the world. Environ. Res. Lett. 2021, 16, 095006. [Google Scholar] [CrossRef]
  17. Millward-Hopkins, J.; Steinberger, J.K.; Rao, N.D.; Oswald, Y. Providing decent living with minimum energy: A global scenario. Glob. Environ. Chang. 2020, 65, 102168. [Google Scholar] [CrossRef]
  18. Ryan, R.M.; Deci, E.L. On Happiness and Human Potentials: A Review of Research on Hedonic and Eudaimonic Well-Being. Annu. Rev. Psychol. 2001, 52, 141–166. [Google Scholar] [CrossRef] [PubMed]
  19. Huta, V. Pursuing eudaimonia versus hedonia: Distinctions, similarities, and relationships. In The Best within Us: Positive Psychology Perspectives on Eudaimonia; American Psychological Association: Washington, DC, USA, 2013; pp. 139–158. [Google Scholar]
  20. Huta, V.; Waterman, A.S. Eudaimonia and Its Distinction from Hedonia: Developing a Classification and Terminology for Understanding Conceptual and Operational Definitions. J. Happiness Stud. 2014, 15, 1425–1456. [Google Scholar] [CrossRef]
  21. Alatartseva, E.; Barysheva, G. Well-being: Subjective and Objective Aspects. Procedia—Soc. Behav. Sci. 2015, 166, 36–42. [Google Scholar] [CrossRef]
  22. Nussbaum, M. Capabilities as Fundamental Entitlements: Sen and Social Justice. Fem. Econ. 2003, 9, 33–59. [Google Scholar] [CrossRef]
  23. Diener, E.; Suh, E. Measuring quality of life: Economic, social, and subjective indicators. Soc. Indic. Res. 1997, 40, 189–216. [Google Scholar] [CrossRef]
  24. Western, M.; Tomaszewski, W. Subjective Wellbeing, Objective Wellbeing and Inequality in Australia. PLoS ONE 2016, 11, e0163345. [Google Scholar] [CrossRef]
  25. Sen, A. Commodities and Capabilities; Oxford University Press: New Delhi, India, 1987. [Google Scholar]
  26. Sen, A. Development as Freedom; Technical Report; Oxford University Press: Oxford, UK, 1999. [Google Scholar]
  27. Nussbaum, M.C. Creating Capabilities: The Human Development Approach; Harvard University Press: Cambridge, MA, USA, 2011. [Google Scholar]
  28. Costanza, R.; Fisher, B.; Ali, S.; Beer, C.; Bond, L.; Boumans, R.; Danigelis, N.L.; Dickinson, J.; Elliott, C.; Farley, J.; et al. Quality of life: An approach integrating opportunities, human needs, and subjective well-being. Ecol. Econ. 2007, 61, 267–276. [Google Scholar] [CrossRef]
  29. Di Giulio, A.; Defila, R. The ‘good life’ and Protected Needs. In The Routledge Handbook of Global Sustainability Governance; Routledge: London, UK, 2019; pp. 100–114. [Google Scholar] [CrossRef]
  30. Doyal, L.; Gough, I. A Theory of Human Need; Guilford Press: New York, NY, USA, 1991. [Google Scholar]
  31. Nussbaum, M.; Sen, A. The Quality of Life; Clarendon Press: Oxford, UK, 1993. [Google Scholar]
  32. Maslow, A.H. A theory of human motivation. Psychol. Rev. 1943, 50, 370–396. [Google Scholar] [CrossRef]
  33. Max-Neef, M.A. Human Scale Development: Conception, Application and Further Reflections; The Apex Press: New York, NY, USA, 1991. [Google Scholar]
  34. Diener, E. Subjective well-being: The science of happiness and a proposal for a national index. Am. Psychol. 2000, 55, 34. [Google Scholar] [CrossRef] [PubMed]
  35. Okulicz-Kozaryn, A.; Altman, M. The Happiness-Energy Paradox: Energy Use is Unrelated to Subjective Well-Being. Appl. Res. Qual. Life 2020, 15, 1055–1067. [Google Scholar] [CrossRef]
  36. Cantril, H. The Pattern of Human Concerns; Rutgers University Press: New Brunswick, NJ, USA, 1965. [Google Scholar]
  37. Diener, E.D.; Emmons, R.A.; Larsen, R.J.; Griffin, S. The satisfaction with life scale. J. Personal. Assess. 1985, 49, 71–75. [Google Scholar] [CrossRef] [PubMed]
  38. Brand-Correa, L.I.; Martin-Ortega, J.; Steinberger, J.K. Human Scale Energy Services: Untangling a ‘golden thread’. Energy Res. Soc. Sci. 2018, 38, 178–187. [Google Scholar] [CrossRef]
  39. Kalt, G.; Wiedenhofer, D.; Görg, C.; Haberl, H. Conceptualizing energy services: A review of energy and well-being along the Energy Service Cascade. Energy Res. Soc. Sci. 2019, 53, 47–58. [Google Scholar] [CrossRef]
  40. Fell, M.J. Energy services: A conceptual review. Energy Res. Soc. Sci. 2017, 27, 129–140. [Google Scholar] [CrossRef]
  41. Frigo, G.; Baumann, M.; Hillerbrand, R. Energy and the Good Life: Capabilities as the Foundation of the Right to Access Energy Services. J. Hum. Dev. Capab. 2021, 22, 218–248. [Google Scholar] [CrossRef]
  42. Arto, I.; Capellán-Pérez, I.; Lago, R.; Bueno, G.; Bermejo, R. The energy requirements of a developed world. Energy Sustain. Dev. 2016, 33, 1–13. [Google Scholar] [CrossRef]
  43. Oswald, Y.; Owen, A.; Steinberger, J.K. Large inequality in international and intranational energy footprints between income groups and across consumption categories. Nat. Energy 2020, 5, 231–239. [Google Scholar] [CrossRef]
  44. Li, Q.; Chen, H. The Relationship between Human Well-Being and Carbon Emissions. Sustainability 2021, 13, 547. [Google Scholar] [CrossRef]
  45. Akizu, O.; Urkidi, L.; Bueno, G.; Lago, R.; Barcena, I.; Mantxo, M.; Basurko, I.; Lopez-Guede, J.M. Tracing the emerging energy transitions in the Global North and the Global South. Int. J. Hydrogen Energy 2017, 42, 18045–18063. [Google Scholar] [CrossRef]
  46. Akizu-Gardoki, O.; Wakiyama, T.; Wiedmann, T.; Bueno, G.; Arto, I.; Lenzen, M.; Lopez-Guede, J.M. Hidden Energy Flow indicator to reflect the outsourced energy requirements of countries. J. Clean. Prod. 2021, 278, 123827. [Google Scholar] [CrossRef]
  47. Vogel, J.; Steinberger, J.K.; O’Neill, D.W.; Lamb, W.F.; Krishnakumar, J. Socio-economic conditions for satisfying human needs at low energy use: An international analysis of social provisioning. Glob. Environ. Chang. 2021, 69, 102287. [Google Scholar] [CrossRef]
  48. Baltruszewicz, M.; Steinberger, J.K.; Ivanova, D.; Brand-Correa, L.I.; Paavola, J.; Owen, A. Household final energy footprints in Nepal, Vietnam and Zambia: Composition, inequality and links to well-being. Environ. Res. Lett. 2021, 16, 025011. [Google Scholar] [CrossRef]
  49. Usubiaga, A.; Arto, I.; Acosta-Fernández, J. Double accounting in energy footprint and related assessments: How common is it and what are the consequences? Energy 2021, 222, 119891. [Google Scholar] [CrossRef]
  50. Giovannini, E.; Hall, J.; d’Ercole, M.M. Measuring well-being and societal progress. In Proceedings of the Conference Beyond GDP-Measuring Progress, True Wealth, and the Well-Being of Nations, European Parliament, Brussels, Belgium, 19–20 November 2007; pp. 19–20. [Google Scholar]
  51. Alam, M.S.; Bala, B.K.; Huq, A.M.Z.; Matin, M.A. A model for the quality of life as a function of electrical energy consumption. Energy 1991, 16, 739–745. [Google Scholar] [CrossRef]
  52. Alam, M.S.; Roychowdhury, A.; Islam, K.K.; Huq, A.M.Z. A revisited model for the physical quality of life (PQL) as a function of electrical energy consumption. Energy 1998, 23, 791–801. [Google Scholar] [CrossRef]
  53. Mazur, A.; Rosa, E. Energy and Life-Style. Science 1974, 186, 607–610. [Google Scholar] [CrossRef] [PubMed]
  54. Nader, L.; Beckerman, S. Energy as it Relates to the Quality and Style of Life. Annu. Rev. Energy 1978, 3, 1–28. [Google Scholar] [CrossRef]
  55. Olsen, M.E. The energy consumption turnaround and socioeconomic wellbeing in industrial societies in the 1980s. Adv. Hum. Ecol. 1992, 1, 197–234. [Google Scholar]
  56. Rosa, E.; Keating, K.M.; Staples, C.L. Energy, economic growth and quality of life: A cross-national trend analysis. In The Quality of Life: Systems Approaches; Lasker, G.E., Ed.; Pergamon: Bergama, Turkey, 1981; pp. 258–264. [Google Scholar]
  57. Suez, C.E. Energy needs for sustainable human development. In Energy as an Instrument for Socio-Economic Development; Goldemberg, J., Johansson, T., Eds.; United Nations Development Programme: New York, NY, USA, 1995. [Google Scholar]
  58. Jackson, R.B.; Ahlström, A.; Hugelius, G.; Wang, C.; Porporato, A.; Ramaswami, A.; Roy, J.; Yin, J. Human well-being and per capita energy use. Ecosphere 2022, 13, e3978. [Google Scholar] [CrossRef]
  59. Martínez, D.M.; Ebenhack, B.W. Understanding the role of energy consumption in human development through the use of saturation phenomena. Energy Policy 2008, 36, 1430–1435. [Google Scholar] [CrossRef]
  60. Pasternak, A.D. Global energy futures and human development: A framework for analysis. In Proceedings of the Global 2001 International Conference on: “Back-End of the Fuel Cycle: From Research to Solutions”, Paris, France, 9–13 September 2001. [Google Scholar]
  61. Dias, R.A.; Mattos, C.R.; Balestieri, J.A.P. The limits of human development and the use of energy and natural resources. Energy Policy 2006, 34, 1026–1031. [Google Scholar] [CrossRef]
  62. Schipper, L.; Lichtenberg, A.J. Efficient Energy Use and Well-Being: The Swedish Example. Science 1976, 194, 1001–1013. [Google Scholar] [CrossRef] [PubMed]
  63. Smil, V. Energy at the Crossroads: Global Perspectives and Uncertainties; The MIT Press: Cambridge, MA, USA, 2003. [Google Scholar]
  64. Steinberger, J.K.; Roberts, J.T. From constraint to sufficiency: The decoupling of energy and carbon from human needs, 1975–2005. Ecol. Econ. 2010, 70, 425–433. [Google Scholar] [CrossRef]
  65. Akizu-Gardoki, O.; Kunze, C.; Coxeter, A.; Bueno, G.; Wiedmann, T.; Lopez-Guede, J.M. Discovery of a possible Well-being Turning Point within energy footprint accounts which may support the degrowth theory. Energy Sustain. Dev. 2020, 59, 22–32. [Google Scholar] [CrossRef]
  66. Baltruszewicz, M.; Steinberger, J.K.; Owen, A.; Brand-Correa, L.I.; Paavola, J. Final energy footprints in Zambia: Investigating links between household consumption, collective provision, and well-being. Energy Res. Soc. Sci. 2021, 73, 101960. [Google Scholar] [CrossRef]
  67. van de Schoot, R.; de Bruin, J.; Schram, R.; Zahedi, P.; de Boer, J.; Weijdema, F.; Kramer, B.; Huijts, M.; Hoogerwerf, M.; Ferdinands, G.; et al. An open source machine learning framework for efficient and transparent systematic reviews. Nat. Mach. Intell. 2021, 3, 125–133. [Google Scholar] [CrossRef]
  68. Musakwa, M.T.; Odhiambo, N.M. Energy Consumption and Human Development in South Africa: Empirical Evidence from Disaggregated Data. Stud. Univ. “Vasile Goldis” Arad—Econ. Ser. 2022, 32, 1–23. [Google Scholar] [CrossRef]
  69. Jorgenson, A.K.; Alekseyko, A.; Giedraitis, V. Energy consumption, human well-being and economic development in central and eastern European nations: A cautionary tale of sustainability. Energy Policy 2014, 66, 419–427. [Google Scholar] [CrossRef]
  70. Akizu-Gardoki, O.; Bueno, G.; Wiedmann, T.; Lopez-Guede, J.M.; Arto, I.; Hernandez, P.; Moran, D. Decoupling between human development and energy consumption within footprint accounts. J. Clean. Prod. 2018, 202, 1145–1157. [Google Scholar] [CrossRef]
  71. Torchio, M.F.; Lucia, U.; Grisolia, G. Economic and Human Features for Energy and Environmental Indicators: A Tool to Assess Countries’ Progress towards Sustainability. Sustainability 2020, 12, 9716. [Google Scholar] [CrossRef]
  72. Mazur, A. Does increasing energy or electricity consumption improve quality of life in industrial nations? Energy Policy 2011, 39, 2568–2572. [Google Scholar] [CrossRef]
  73. Liu, B.; Matsushima, J. Annual changes in energy quality and quality of life: A cross-national study of 29 OECD and 37 non-OECD countries. Energy Rep. 2019, 5, 1354–1364. [Google Scholar] [CrossRef]
  74. Pasten, C.; Santamarina, J.C. Energy and quality of life. Energy Policy 2012, 49, 468–476. [Google Scholar] [CrossRef]
  75. Ugursal, V.I. Energy consumption, associated questions and some answers. Appl. Energy 2014, 130, 783–792. [Google Scholar] [CrossRef]
  76. Lamb, W.F.; Rao, N.D. Human development in a climate-constrained world: What the past says about the future. Glob. Environ. Chang. 2015, 33, 14–22. [Google Scholar] [CrossRef]
  77. Nadimi, R.; Tokimatsu, K. Modeling of quality of life in terms of energy and electricity consumption. Appl. Energy 2018, 212, 1282–1294. [Google Scholar] [CrossRef]
  78. Nadimi, R.; Tokimatsu, K. Energy use analysis in the presence of quality of life, poverty, health, and carbon dioxide emissions. Energy 2018, 153, 671–684. [Google Scholar] [CrossRef]
  79. Afia, N.B. The Relationship Between Energy Consumption, Economic Growth and Happiness. J. Econ. Dev. 2019, 44, 41–57. [Google Scholar]
  80. Makarova, O.; Kalashnikova, T.; Novak, I. The impact of energy consumption on quality of life in the world: Methodological aspects of evaluation. Econ. Ann.-XXI 2020, 184, 29–37. [Google Scholar] [CrossRef]
  81. Banday, U.J.; Kocoglu, M. Modelling Simultaneous Relationships Between Human Development, Energy, and Environment: Fresh Evidence from Panel Quantile Regression. J. Knowl. Econ. 2022, 14, 1559–1581. [Google Scholar] [CrossRef]
  82. Balsamo, M.; Montagnaro, F.; Anthony, E.J. Socio-economic parameters affect CO2 emissions and energy consumption—An analysis over the United Nations Countries. Curr. Opin. Green Sustain. Chem. 2023, 40, 100740. [Google Scholar] [CrossRef]
  83. El-Ghannam, A.R. The Determinants of Social Well-being, Economic Development, and Development Index in the Third World Countries. Perspect. Glob. Dev. Technol. 2002, 1, 51–69. [Google Scholar] [CrossRef]
  84. Ouedraogo, N.S. Energy consumption and human development: Evidence from a panel cointegration and error correction model. Energy 2013, 63, 28–41. [Google Scholar] [CrossRef]
  85. Ribas, A.; Lucena, A.F.P.; Schaeffer, R. Bridging the energy divide and securing higher collective well-being in a climate-constrained world. Energy Policy 2017, 108, 435–450. [Google Scholar] [CrossRef]
  86. Long, R.; Zhang, Q.; Chen, H.; Wu, M.; Li, Q. Measurement of the Energy Intensity of Human Well-Being and Spatial Econometric Analysis of Its Influencing Factors. Int. J. Environ. Res. Public Health 2020, 17, 357. [Google Scholar] [CrossRef]
  87. Li, J.; Chen, F. The Impacts of Carbon Emissions and Energy Consumption on Life Satisfaction: Evidence from China. Front. Environ. Sci. 2022, 10, 901472. [Google Scholar] [CrossRef]
  88. Piao, X.; Managi, S. Household energy-saving behavior, its consumption, and life satisfaction in 37 countries. Sci. Rep. 2023, 13, 1382. [Google Scholar] [CrossRef]
  89. Solon, G.; Haider, S.J.; Wooldridge, J.M. What Are We Weighting For? J. Hum. Resour. 2015, 50, 301–316. [Google Scholar] [CrossRef]
  90. Doyal, L.; Gough, I. A theory of human needs. Crit. Soc. Policy 1984, 4, 6–38. [Google Scholar] [CrossRef]
  91. Bonatz, N.; Guo, R.; Wu, W.; Liu, L. A comparative study of the interlinkages between energy poverty and low carbon development in China and Germany by developing an energy poverty index. Energy Build. 2019, 183, 817–831. [Google Scholar] [CrossRef]
  92. Sy, S.A.; Mokaddem, L. Energy poverty in developing countries: A review of the concept and its measurements. Energy Res. Soc. Sci. 2022, 89, 102562. [Google Scholar] [CrossRef]
  93. Ivanova, D.; Middlemiss, L. Characterizing the energy use of disabled people in the European Union towards inclusion in the energy transition. Nat. Energy 2021, 6, 1188–1197. [Google Scholar] [CrossRef]
  94. Jenkins, K.; McCauley, D.; Heffron, R.; Stephan, H.; Rehner, R. Energy justice: A conceptual review. Energy Res. Soc. Sci. 2016, 11, 174–182. [Google Scholar] [CrossRef]
  95. Guan, Y.; Yan, J.; Shan, Y.; Zhou, Y.; Hang, Y.; Li, R.; Liu, Y.; Liu, B.; Nie, Q.; Bruckner, B.; et al. Burden of the global energy price crisis on households. Nat. Energy 2023, 8, 304–316. [Google Scholar] [CrossRef]
  96. Dillman, K.; Heinonen, J. A ‘just’ hydrogen economy: A normative energy justice assessment of the hydrogen economy. Renew. Sustain. Energy Rev. 2022, 167, 112648. [Google Scholar] [CrossRef]
  97. Fuchs, D.; Steinberger, J.; Pirgmaier, E.; Lamb, W.; Brand-Correa, L.; Mattioli, G.; Cullen, J. A corridors and power-oriented perspective on energy-service demand and needs satisfaction. Sustain. Sci. Pract. Policy 2021, 17, 162–172. [Google Scholar] [CrossRef]
  98. Hashemizadeh, A.; Bui, Q.; Zaidi, S.A.H. A blend of renewable and nonrenewable energy consumption in G-7 countries: The role of disaggregate energy in human development. Energy 2022, 241, 122520. [Google Scholar] [CrossRef]
  99. von Möllendorff, C.; Welsch, H. Measuring renewable energy externalities: Evidence from subjective well-being data. Land Econ. 2017, 93, 109–126. [Google Scholar] [CrossRef]
Figure 1. Energy indicators from the territorial and consumption perspective as inputs for the “Energy Services Cascade” (adapted and expanded from Kalt et al. [39]).
Energies 16 06494 g001
Figure 2. Machine learning-aided review process using ASReview.
Energies 16 06494 g002
Figure 3. Studies published per year. Note that only studies published up to April 2023 are included.
Energies 16 06494 g003
Figure 4. The geographic coverage of the 10 TD studies with a global country scope [9,64,65,70,73,77,78,80,82,85]. Shaded countries = not covered by any study.
Energies 16 06494 g004
Disclaimer/Publisher’s Note: The statements, opinions and data contained in all publications are solely those of the individual author(s) and contributor(s) and not of MDPI and/or the editor(s). MDPI and/or the editor(s) disclaim responsibility for any injury to people or property resulting from any ideas, methods, instructions or products referred to in the content.

