Article

Study of Contact Pressure Distribution in Bolted Encapsulated Proton Exchange Membrane Fuel Cell Membrane Electrode Assembly

1
School of Mechanical and Automotive Engineering, Shanghai University of Engineering Science, Shanghai 201620, China
2
School of Mechanical and Power Engineering, Shanghai Jiao Tong University, Shanghai 200030, China
*
Author to whom correspondence should be addressed.
Energies 2023, 16(18), 6487; https://doi.org/10.3390/en16186487
Submission received: 14 August 2023 / Revised: 2 September 2023 / Accepted: 4 September 2023 / Published: 8 September 2023

Abstract

:
The distribution of contact pressure on the Membrane Electrode Assembly (MEA) significantly affects the performance of a Proton Exchange Membrane Fuel Cell (PEMFC). This paper establishes a PEM fuel cell model to investigate the impact of bolt load and its distribution, sealing gasket hardness, and size on the magnitude and distribution of contact pressure on the MEA during assembly. Thermal–mechanical coupling is employed to simulate the thermal effects resulting from chemical reactions under operational conditions. The findings reveal that there is an extremum of pressure uniformity in the range of 5000 to 6250 N for bolt loads. When the average bolt load is lower than this extremum, altering the distribution of the load can effectively enhance the uniform distribution of contact pressure. Stiffer gaskets reduce the contact pressure on the MEA while increasing the pressure on the gasket itself, resulting in reduced deformation. A rational matching relationship among gaskets, Gas Diffusion Layers (GDLs), and seal grooves is proposed. During operational conditions, thermal effects decrease the sealing performance and also impact the magnitude and distribution of contact pressure on the MEA. These outcomes provide significant guidance for the assembly and performance evaluation of PEMFCs.

1. Introduction

Proton Exchange Membrane Fuel Cells (PEMFCs) are clean energy conversion devices that efficiently transform the energy of hydrogen and oxygen into electrical energy. Their high efficiency and low environmental impact have garnered significant interest in the global green energy field [1,2,3]. During the assembly of a PEMFC, the amount of clamping force applied plays a decisive role in its performance. An insufficient clamping force can lead to a high contact resistance (ICR) between the Bipolar Plate (BPP) and the Gas Diffusion Layer (GDL), thereby reducing cell performance [4]. Additionally, it may cause severe safety issues like sealing gas leakage [5]. On the other hand, excessive clamping force can result in elevated contact pressure between the BPP and the GDL, leading to irreversible deformation and high mechanical stresses in the GDL. This adversely affects the contact pressure distribution and reduces the GDL’s porosity, impeding gas transport [6,7]. Furthermore, an uneven contact pressure distribution on the Membrane Electrode Assembly (MEA) can lead to uneven current density and heat distribution [8]. Hence, the magnitude and distribution of the clamping force significantly impact the PEMFC’s performance.
In the field of proton exchange membrane fuel cells, extensive research has been conducted to understand the impact of the contact pressure’s magnitude and distribution on the cell performance. Lee et al. [9] demonstrated varying optimal bolt torques across different GDL cell types, emphasizing the correlation between optimal power density bolt torque and gas diffusion layer compression force. Zhao et al. [10] revealed that a bolt load exceeding 7 MPa leads to diminished GDL porosity. Dey et al. [11] concluded that contact pressures on the MEA’s central region are notably lower than those on the edge, influencing overall cell performance. Chien et al. [12] highlighted an optimal bolt locking sequence that achieves a uniform contact pressure distribution on the MEA. Carral et al. [13] introduced a finite element model for PEMFC stack assembly, revealing enhanced pressure uniformity on the MEA’s center surface through increased cell stacking. Investigating multi-cell stacks, Bates et al. [14] located high-stress regions in the spacer between bipolar plates and the MEA. Bograchev et al. [15] developed a two-dimensional fuel cell model, indicating plastic deformation in the maximum stress zones during cell assembly. Mikkola et al. [16] presented a versatile finite element model predicting the pressure distribution in fuel cell stacks across different temperatures and structures. Zhang et al. [6] showcased the significant impact of assembly load compression on both contact resistance and mass transfer capability. Toghyani et al. [17] revealed that assembly pressure reduces GDL thickness and porosity, subsequently raising gas transport resistance and lowering PEMFC performance. Interestingly, this assembly-induced GDL deformation along the gas flow channel also optimizes the channel’s gas flow area, thus improving overall cell performance.
The aforementioned studies have provided valuable insights into the impact of clamping forces on fuel cell performance. However, there remains a significant research gap concerning the clamping problem itself in proton exchange membrane fuel cells. Bolts and shims play pivotal roles in the clamping system, and the proper selection of bolt loads and shim design rules is crucial for optimizing cell performance. Consequently, this study focuses on investigating the effects of bolt load, shim material, and geometrical parameters on the contact pressure on the MEA. The actual working conditions at a certain temperature and humidity were also considered. These results are instructive for the design of the clamping force of the PEMFC, the fabrication and design of the sealing structure (selection of gasket material, matching of the gasket to the dimensions of the GDL and the sealing groove), and the evaluation of the performance during operation.

2. Materials and Methods

In this paper, the model geometry is derived from an electric stack provided by a company. A comprehensive three-dimensional finite element model of the PEMFC single cell is developed, encompassing various aspects such as geometry, material properties, interactions, loading conditions, and boundary conditions.

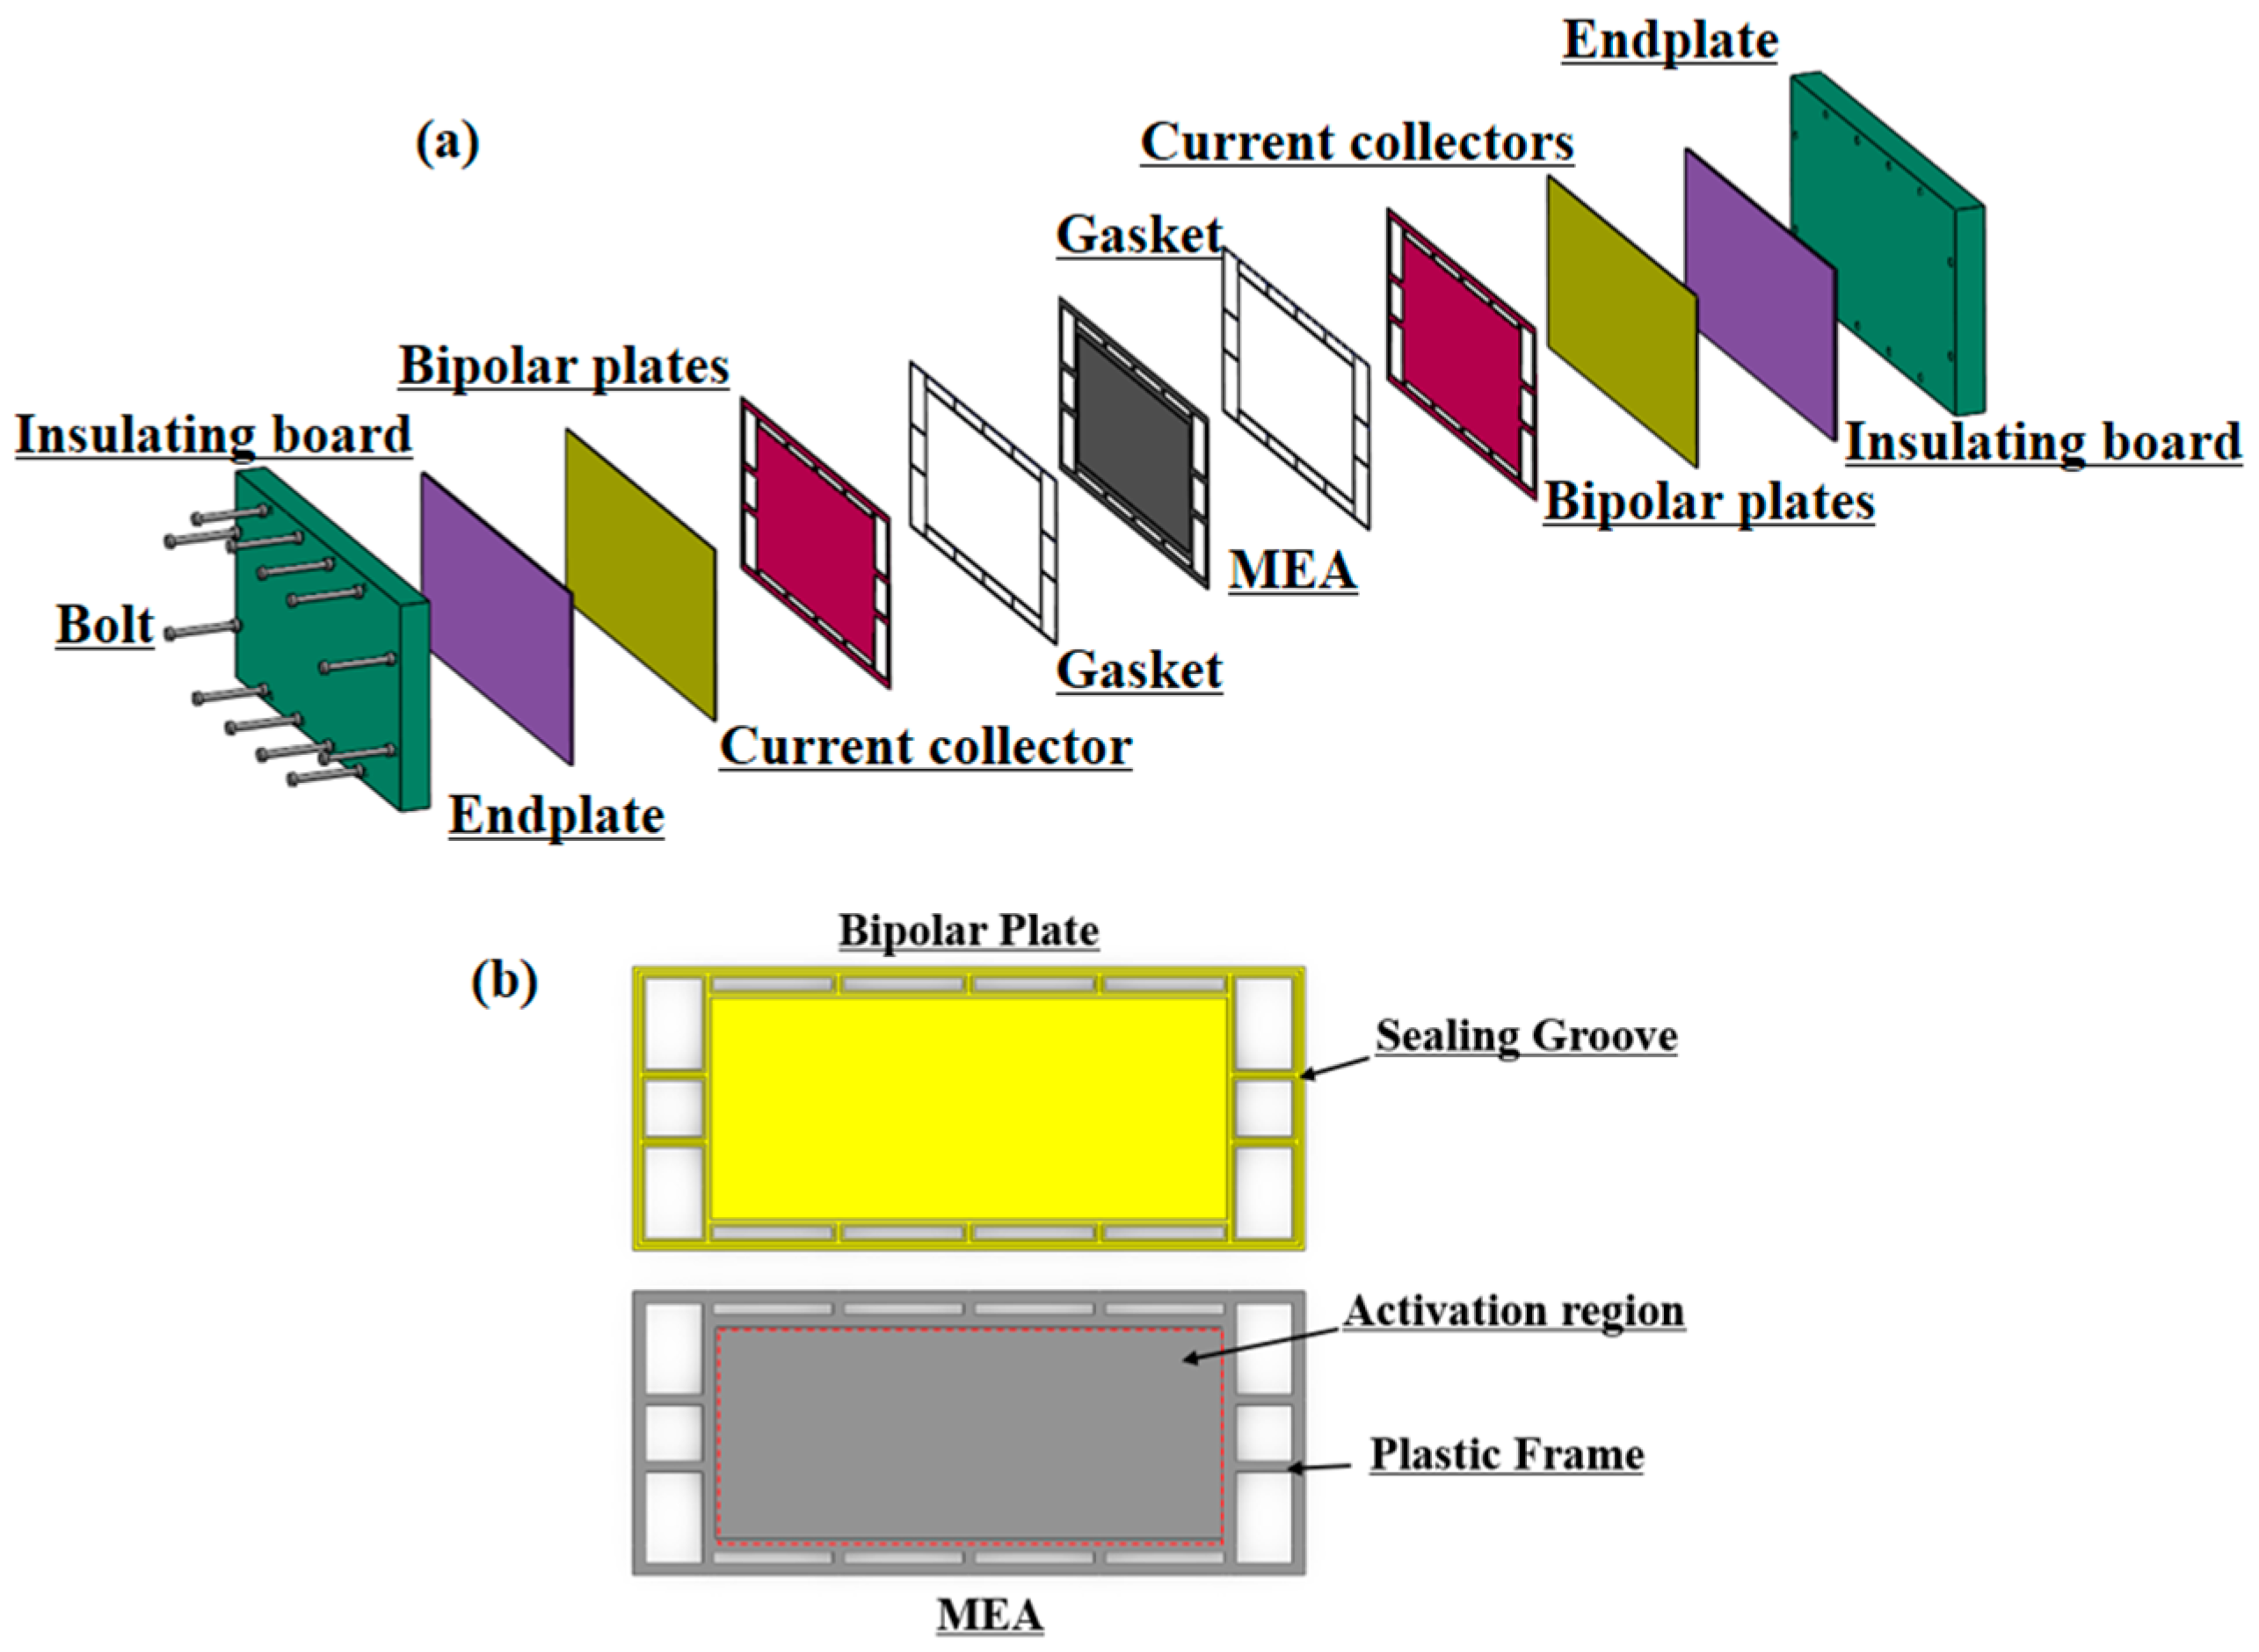
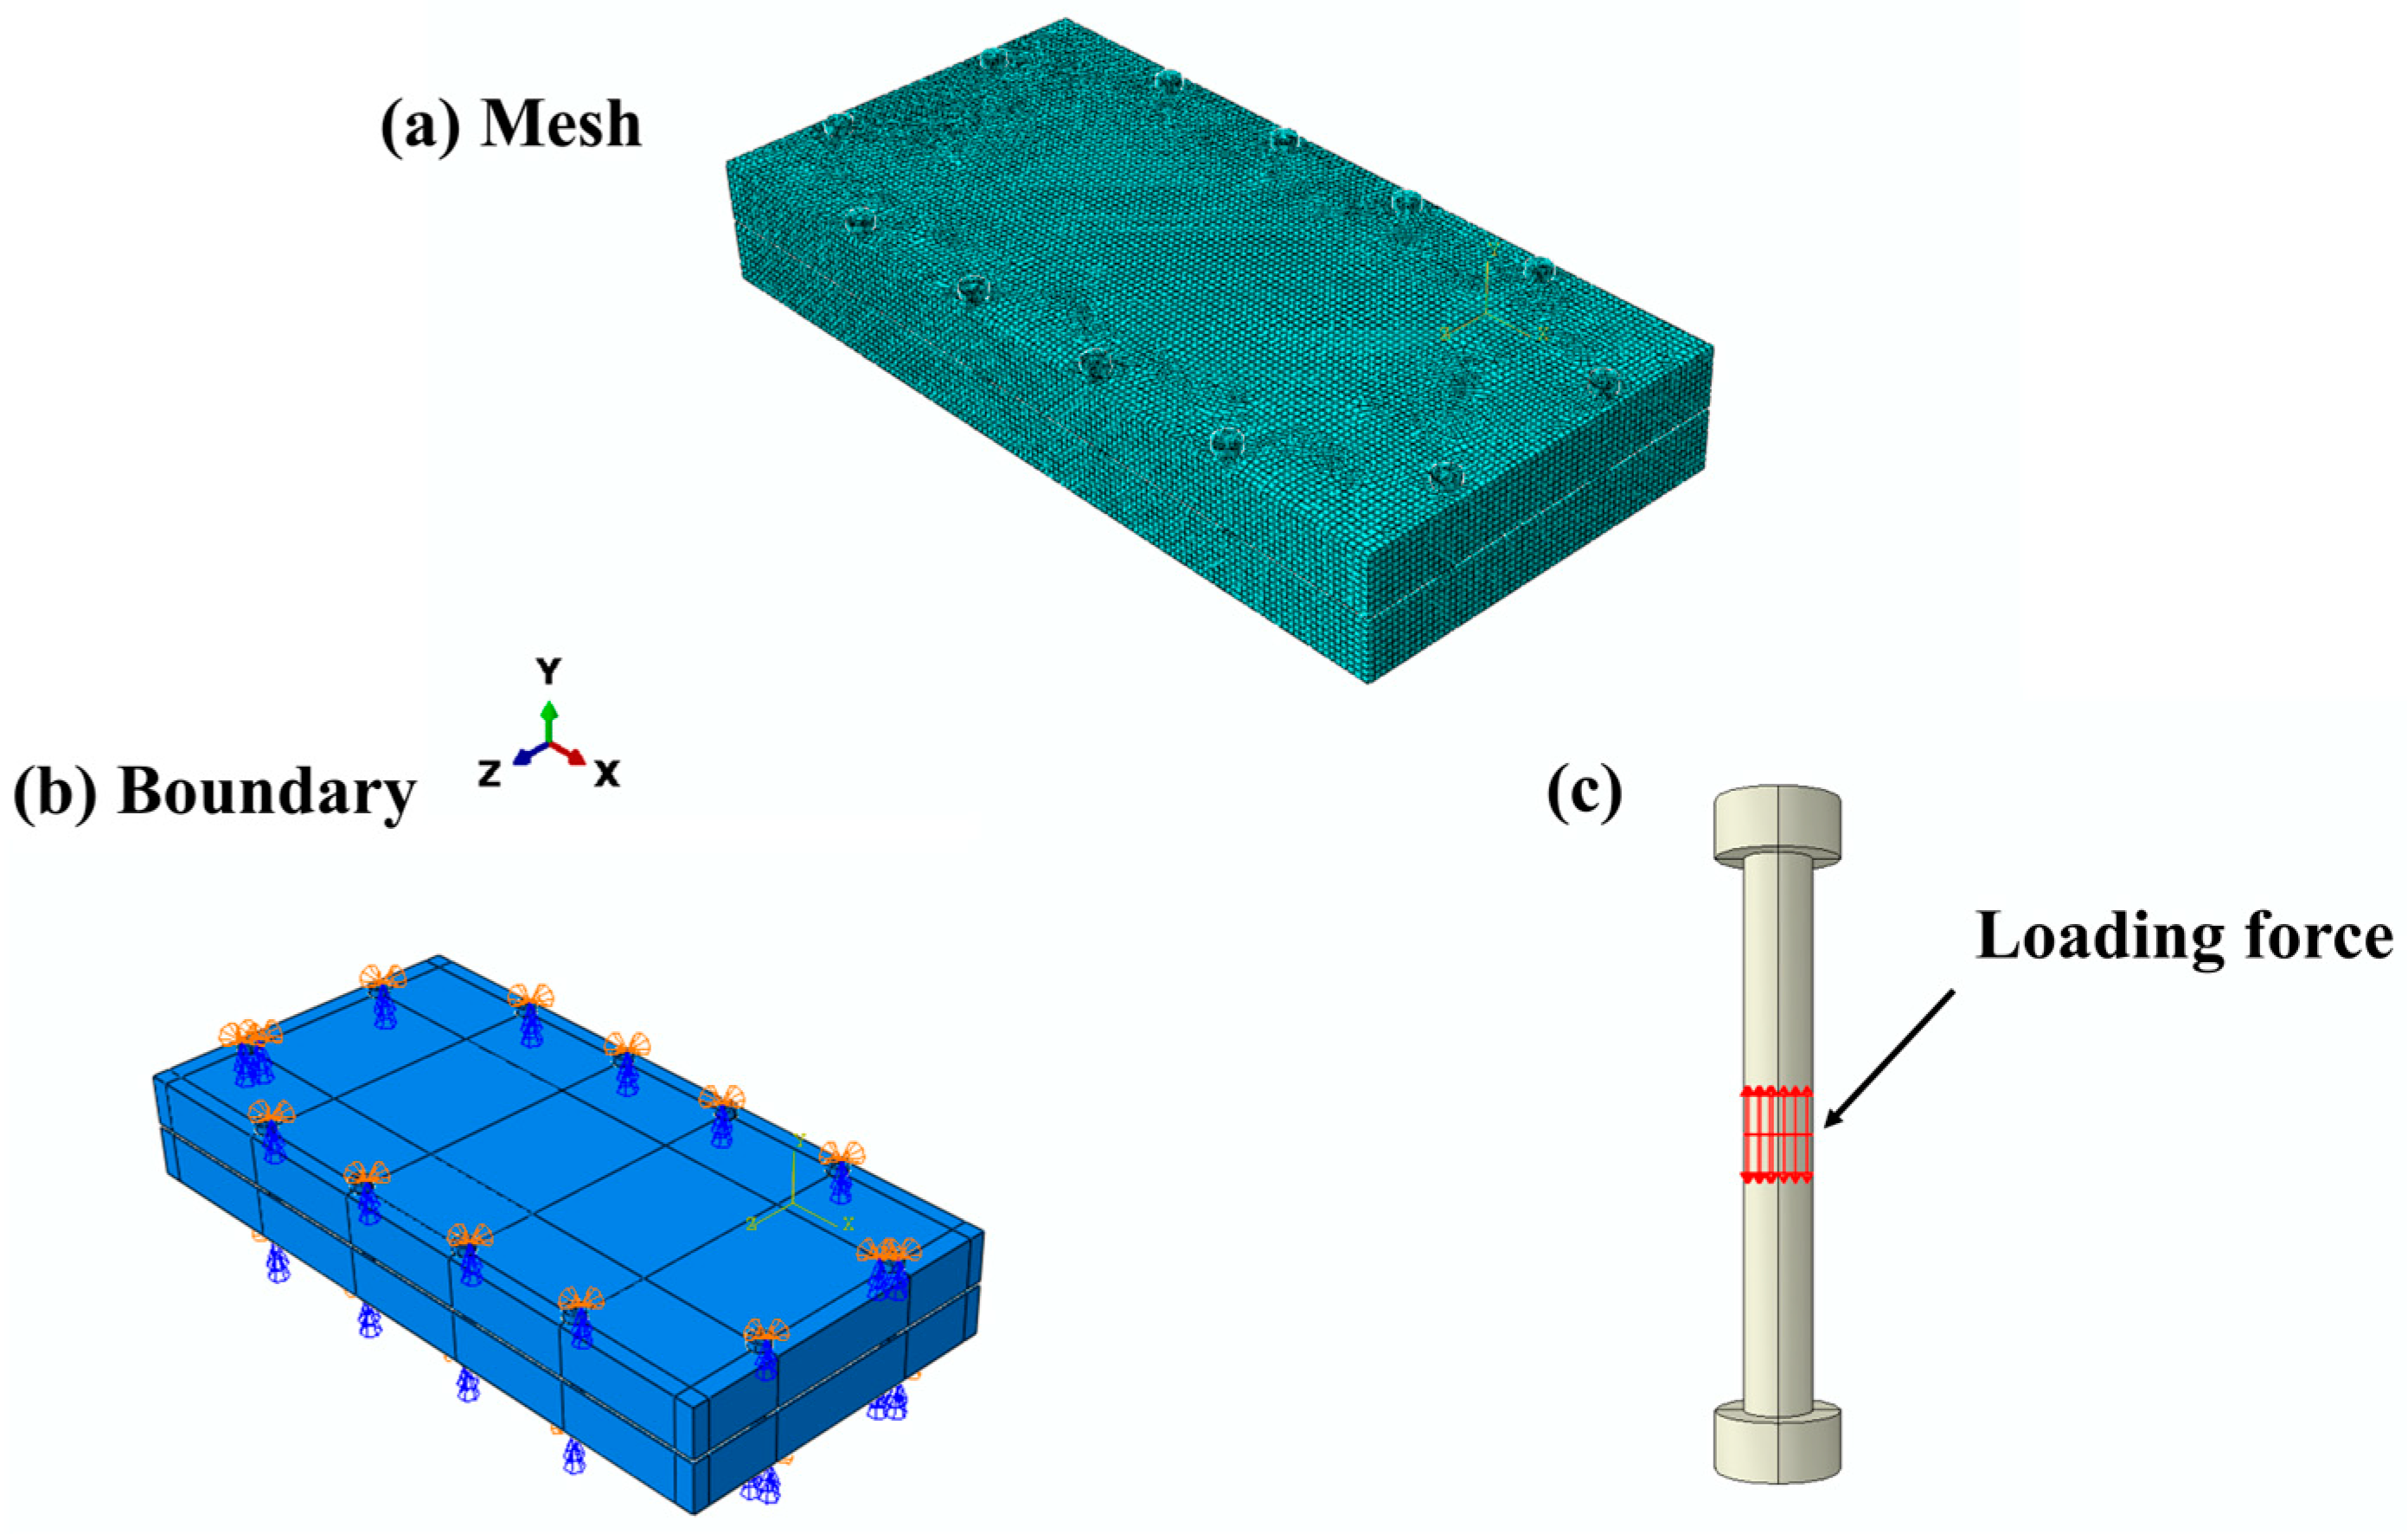
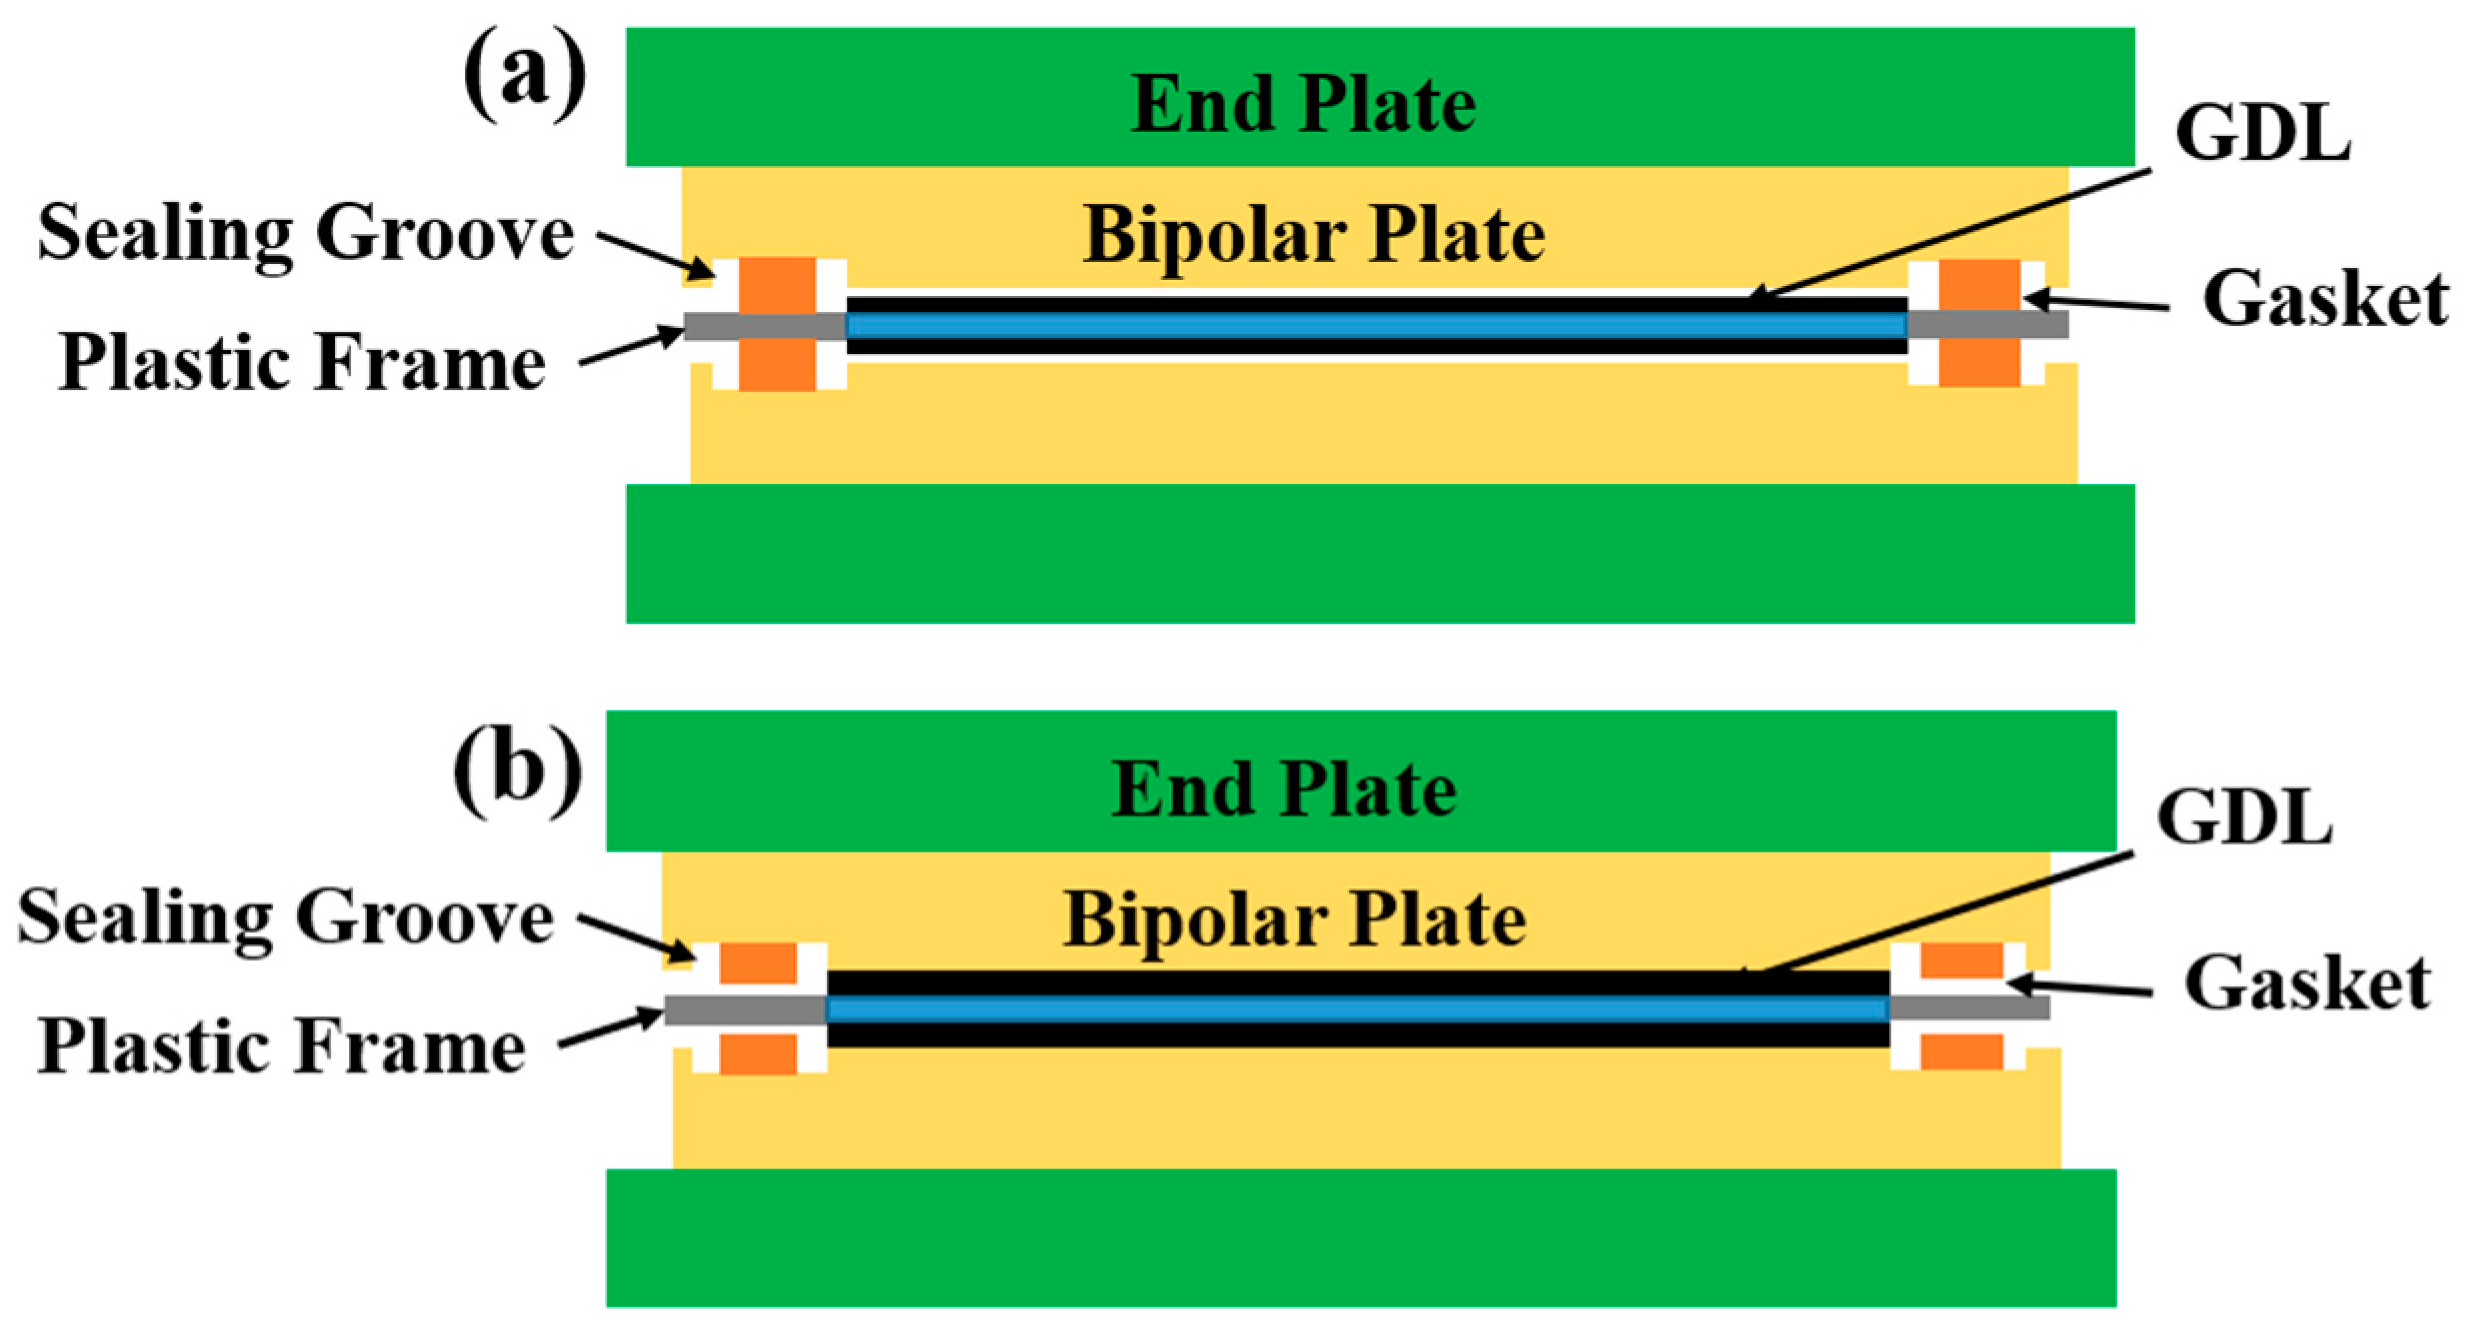
2.1. Geometry and Mesh

PEMFCs are typically composed of multiple single cells connected in series, and the number of cells stacked together is determined based on the specific operational requirements to provide different power outputs. Essentially, a single cell consists of a bipolar plate, an MEA, and sealants. The MEA is the central component of the PEMFC and is a “five-in-one” structure composed of two GDLs, two catalyst layers (CLs), and a polymer electrolyte membrane (PEM). The GDL is typically made of materials such as carbon paper or carbon fiber cloth and possesses a porous structure, occupying the majority of the MEA’s volume. Therefore, the finite element model was based on the following assumptions: (1) Due to the thinness of the CL and PEM compared to the GDL, the MEA is treated as a whole for the assembly condition [18,19] and the material properties are determined by the GDL [20]. (2) All component materials are subject to isotropic and linear elastic behavior. (3) The flow channel structure of the bipolar plate does not impact the distribution trend of contact pressure [21]; thus, it is disregarded in the model, and the bolt and nut connections are integrated. (4) The rib end plates are simplified to flat plates, which affects the contact pressure distribution in the horizontal direction differently in the experiments than in the simulations but does not affect the validation of the arguments. In addition, the spacer between the bipolar plate and the collector is omitted. (5) The hardness of the gasket has no direct effect on its coefficient of thermal expansion, and the gas pressure during operation is considered to be uniform and has no effect on the trend of contact pressure distribution in the direction of the clamping force. (6) The temperature difference between the anode and the cathode is neglected.
Figure 1 presents a schematic diagram of the single-cell assembly model secured by 12 bolts. The dimensions of the various components were as follows: the end plate measured 25 mm × 418 mm × 202 mm; the insulation plate measured 3 mm × 378 mm × 168 mm; the current collector measured 1.5 mm × 378 mm × 168 mm; and the bipolar plate measured 0.9 mm × 378 mm × 168 mm. Additionally, the bipolar plate structure included a sealing recess with a depth of 0.4 mm and a width of 2.7 mm. The core component of the proton exchange membrane fuel cell, known as the MEA, possessed a reaction area of 285 mm × 125 mm. The MEA boasted a thickness of 0.41 mm, where the PEM was considered to have a thickness of 0.05 mm under operating conditions, while the frame surrounding it had a thickness of 0.33 mm.
Mesh partitioning is a crucial and decisive step in finite element analysis as it directly impacts the accuracy and efficiency of the calculated results. The finer the mesh, the higher the precision of the calculations, but this comes at the cost of longer analysis times. To optimize computational efficiency, a targeted approach was adopted for mesh partitioning, with particular emphasis on the single-cell region in this study. The MEA had a bipolar plate seed size of 0.8 mm, and a gasket seed size of 0.4 mm. Local grid refinement was performed in this area using 210,000 eight-node hexahedral cells. Various mesh parameters including the transverse to longitudinal ratio, Jacobian distortion factor, parallel error, and maximum inflection were carefully monitored and fell within reasonable ranges. Previous studies involving single cells of similar dimensions employed 100,000 meshes and achieved highly accurate results [22]. In comparison, this paper utilized twice the number of meshes, ensuring that the calculation results met the required precision standards. The end plates, collector plates, insulating plates, and bolts were larger in size compared to a single cell, necessitating an appropriate increase in mesh size. Figure 2a illustrates the mesh partitioning of the overall structure.

2.2. Boundary Conditions and Loads

In the assembly condition, the bolt load was applied to the internal cross-section, as shown in Figure 2c. The interior of the stack was compressed and interacted with the bolt load, the contact surfaces of the bolt and the end plate were set as binding constraints, and the normal contact between the components in the stack was defined as a “hard” contact, the tangential contact was defined as a “penalized” contact, and the coefficient of friction was 0.3. Figure 2b shows the boundary constraints of the model. In order to fix the stack, the bolts were constrained to slide in the X and Z directions and rotated in the Y direction. The ambient temperature of the assembly was considered to be 25 °C, and the convective heat transfer coefficient on the surface of the stack was set to be 6 W/(m2·°C), based on assumption (6), and the MEA as a whole was set as a heat source.

2.3. Material Properties

The Mooney–Rivlin model is known for its stability in accurately describing the deformation behavior of rubber materials within a small strain range of 150%. This model is particularly suitable for simulating the assembly of the power stack, where the compression ratio of the sealing system typically falls between 10% and 25%. To capture the mechanical properties of the rubber seal effectively, the Mooney–Rivlin model was employed and represented by the following equation [23]:
W = C 10 I 1 3 + C 01 I 2 3
where W is the strain potential energy of the sample; I1 and I2 are the first and second strain invariants; C10 and C01 are the material constant coefficients, which can be obtained with the following equation [24]:
E = 0.351 e 0.034 H A
E = 6 C 10 + C 01
C 01 = 0.25 C 10
where HA denotes the Shore hardness of the rubber and E denotes the modulus of elasticity.
In the PEMFC encapsulation process, the deformation of the GDL accounts for the majority of the total deformation of the MEA, and the deformation of the CL and PEM can be neglected. Therefore, the structures of the PEM and CL were neglected in the model. However, this paper needed to couple the effect of temperature, and this study showed that the contribution of PEM dominates in the expansion (shrinkage) deformation of the MEA subject to changes in temperature and relative humidity, and Figure 3 shows the variation in the water absorption and expansion of the Nafion®112 film with the relative humidity and temperature. Considering the reasonableness of the model, the expansion of the PEM with temperature and relative humidity variations was coupled together to compose the equivalent thermal expansion coefficient of the PEM [25]:
α P E M T , R H = 1 + α P E M T Δ T 1 + β P E M R H , T R H T 1 Δ T
where α P E M is the thermal expansion coefficient of the PEM; β P E M is the water-absorption expansion coefficient of the PEM, and Δ R H and Δ T are the changes in relative humidity and temperature, respectively, when the state is changed. The equivalent thermal expansion coefficient of the MEA as a whole was obtained by superimposing the thermal expansion coefficient of the PEM in the above equation with that of the GDL:
α M E A = α G D L L G D L + α P E M L P E M L M E A  
where L represents the thickness, as the CL was only slightly affected by the above factors and was not considered in the coupled model. In this way, the expansion of temperature and humidity could be considered simultaneously in the simulation. The material parameters for each component were provided by the corporations and are shown in Table 1.

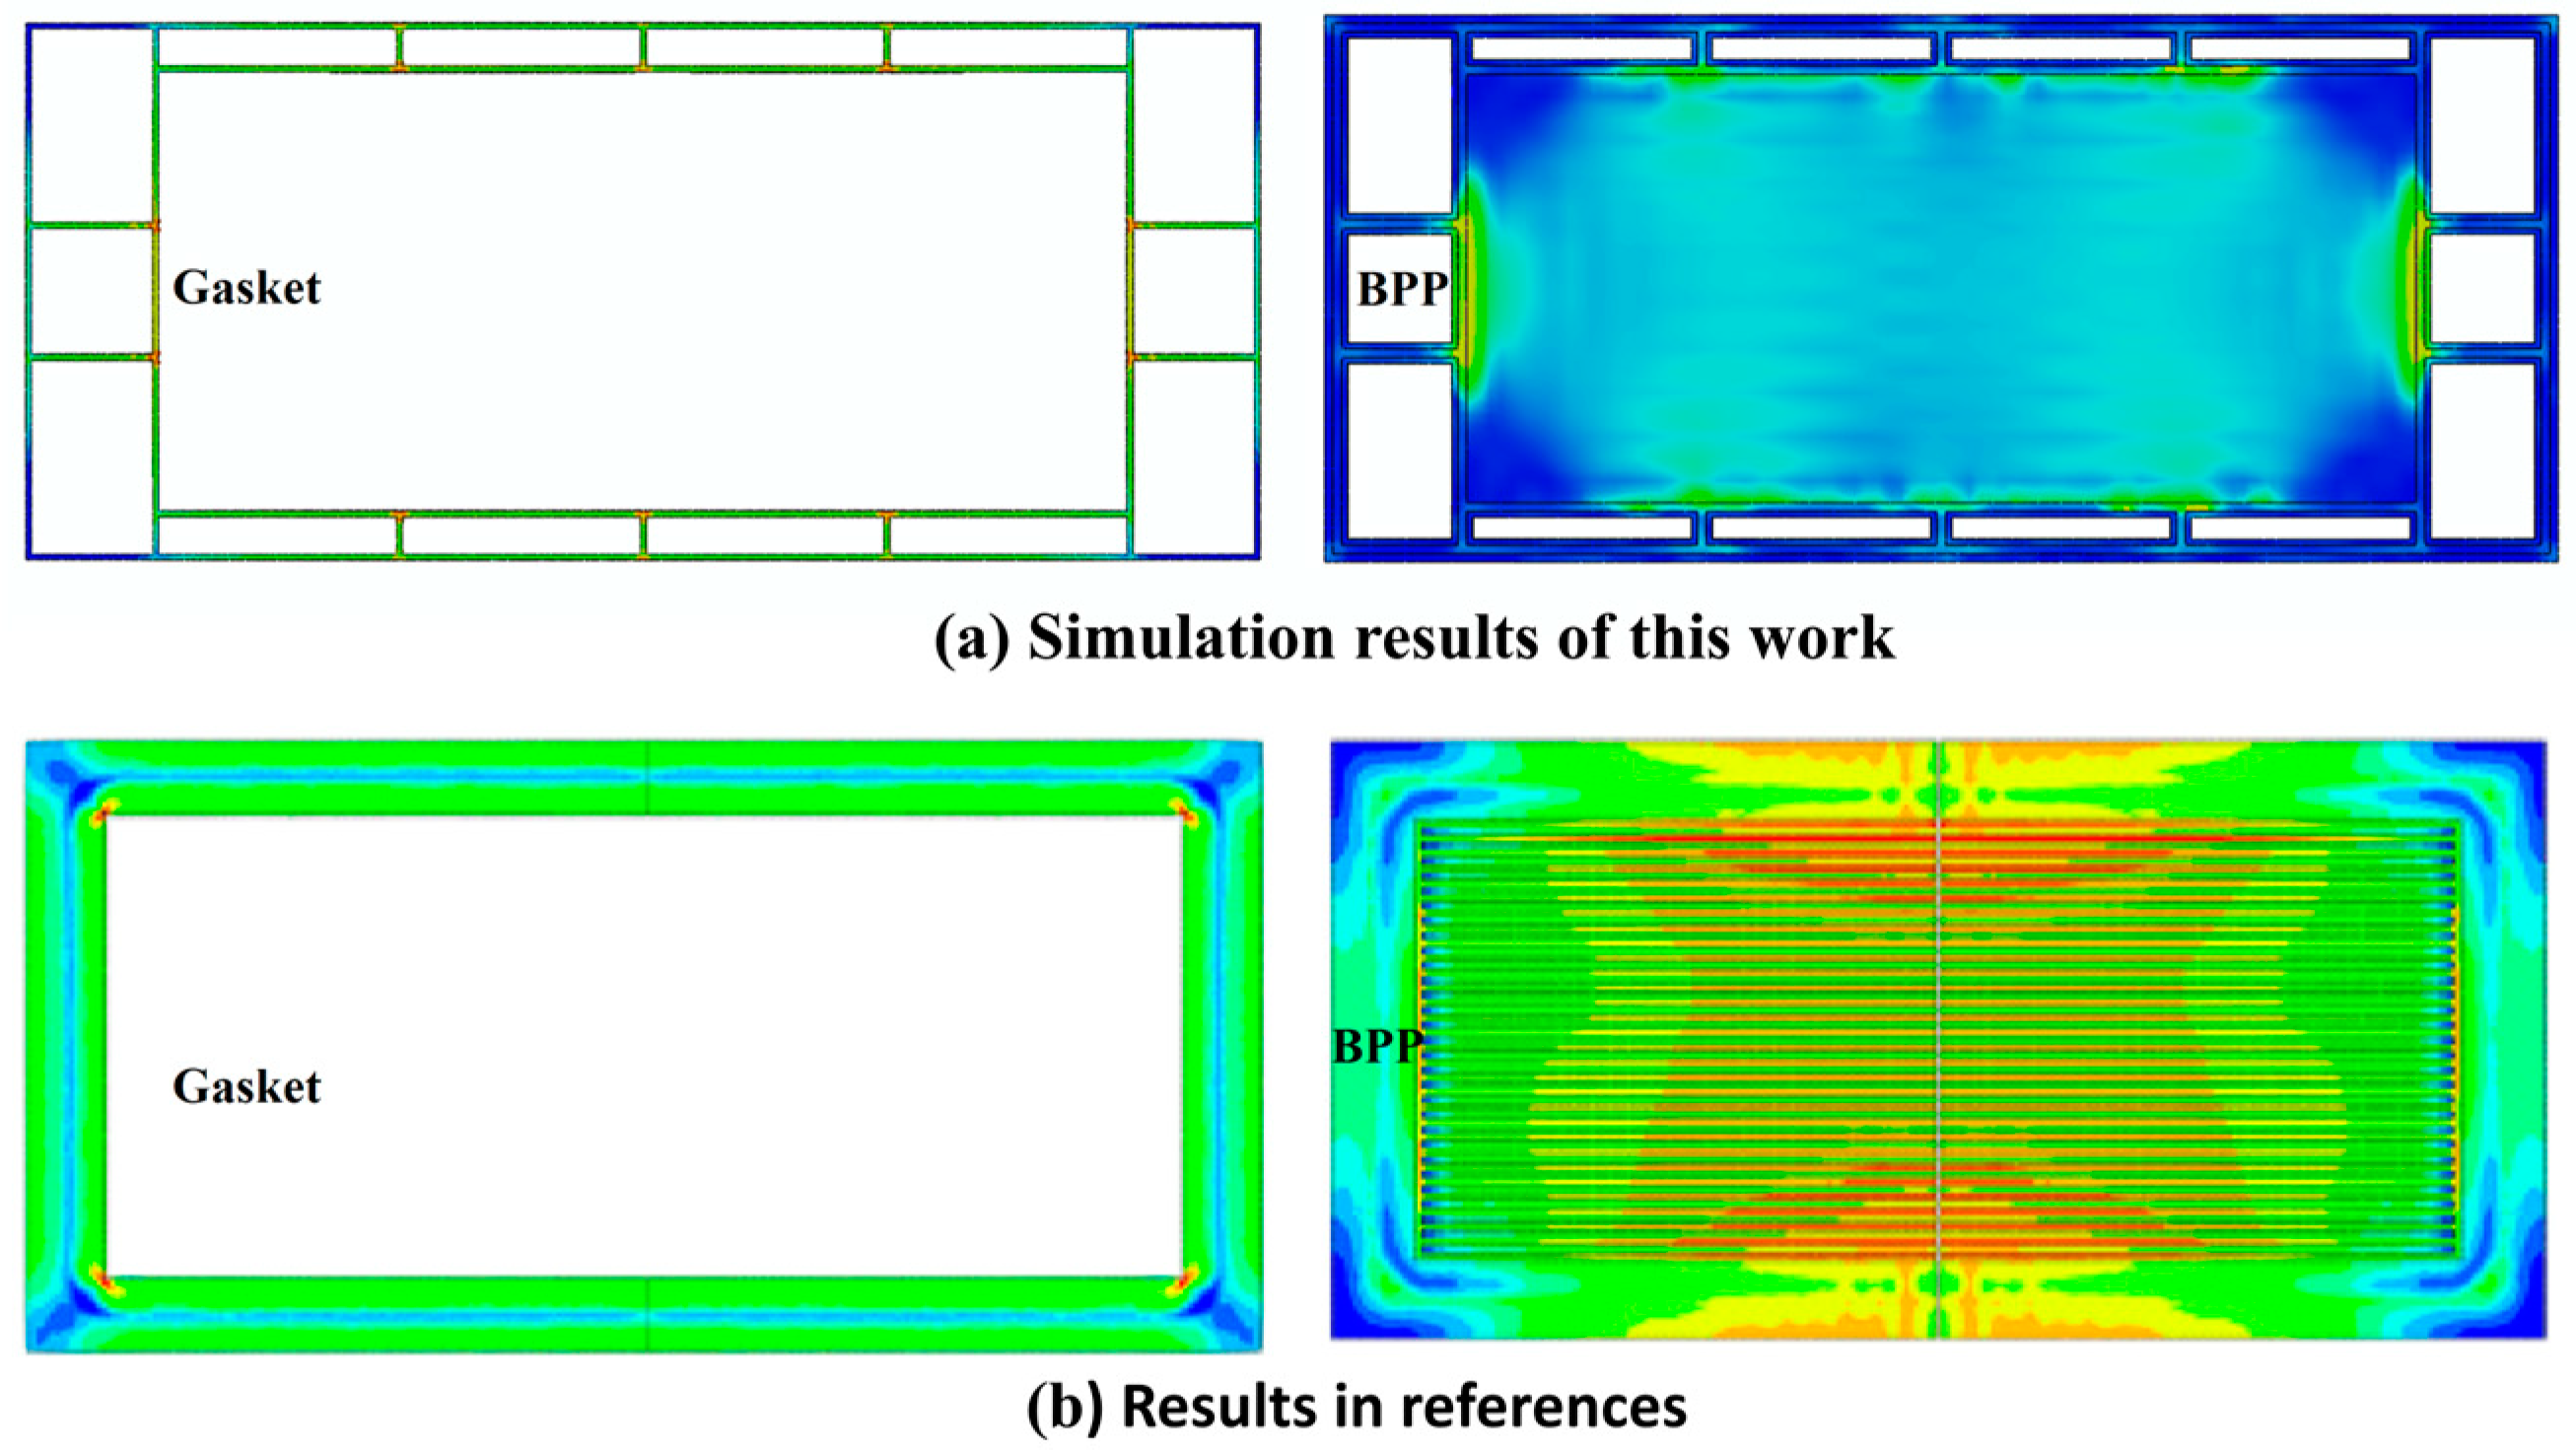
3. Results and Discussion

When assembling a PEMFC, torque is applied to the bolts and the torque is converted into axial load in the stack assembly by thread contact. The bolt torque conversion equation is as follows:
T = K × F × D
where T is the bolt torque; K is the torque coefficient (this paper takes K as 0.2); F is the bolt axial load; D is the bolt diameter.
The standard deviation of the contact pressure between the MEA and BPP surfaces provides valuable insight into the uniformity of the contact pressure distribution, while the mean value represents the average magnitude of the contact pressure. The ratio of these two parameters is referred to as the coefficient of variation, which serves as a performance indicator of magnitude one and offers a more comprehensive assessment of the homogeneity of the contact pressure. A lower coefficient of variation indicates a more uniform and consistent contact pressure distribution, whereas a higher value suggests greater variability in the pressure across the surfaces. Therefore, the coefficient of variation is a crucial metric for evaluating the performance and quality of the contact between the MEA and BPP in the PEMFC assembly.
μ = i = 1 i = N p i N
σ = i = 1 i = N ( p i μ ) 2 N
  C V = σ μ
where μ is the mean, σ is the standard deviation, and C V is the coefficient of variation. The larger the coefficient of variation, the greater the degree of dispersion and the lesser the homogeneity.

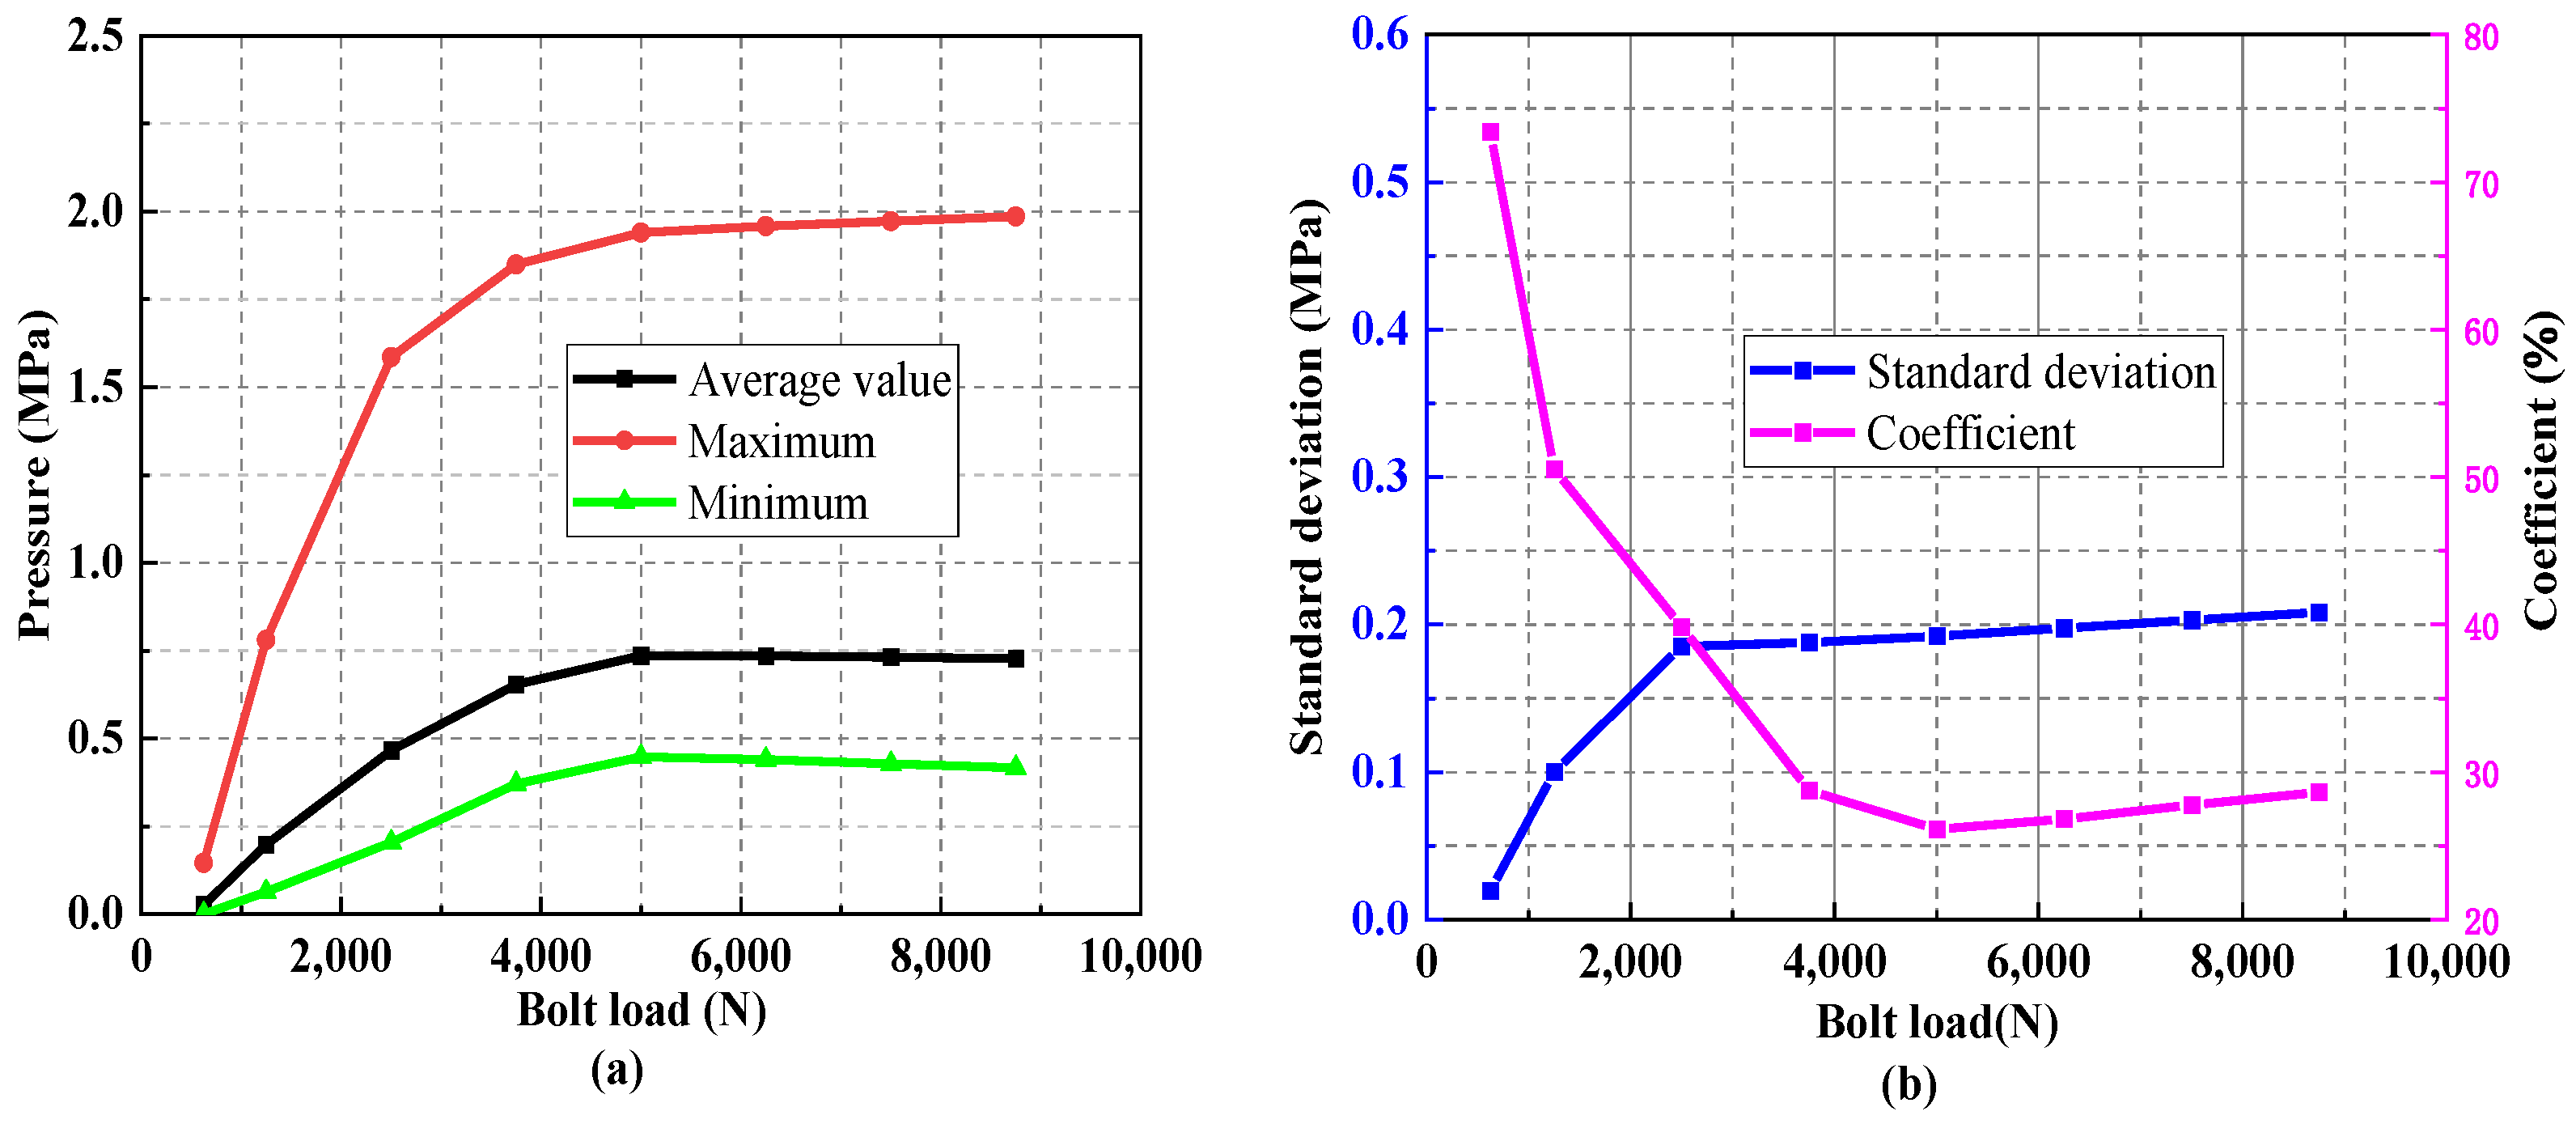
3.1. Effect of Bolt Load

PEMFC encapsulation typically involves clamping using bolts to apply a uniform load, ensuring no reactant leakage, and minimizing the interfacial contact resistance. However, excessive bolt torque can adversely affect cell components and lead to warpage and deformation of the end plates, impacting the uniformity of the MEA contact pressure distribution [13]. Thus, it is crucial to investigate the influence of bolt load on the contact pressure distribution between the BPP and the MEA.
In the experiments in this study, a double-layer ultra-low-pressure (LLW) Prescale film was utilized. This film comprised two polyester bases, one coated with a microencapsulated color-forming material that reacts under pressure, showing varying color intensity when combined with the other layer coated with a color-developing material. The darker the color, the higher the pressure value. The measuring range of the pressure-sensitive paper used in this study was 0.5 MPa to 2.5 MPa, with the white area indicating pressure below 0.5 MPa. To maintain the color change of the pressure-sensitive paper within an observable range, bolt torques of 4 N·m, 6 N·m, 8 N·m, and 10 N·m were selected for the experiments, corresponding to bolt loads of 2500 N, 3750 N, 5000 N, and 6250 N, respectively. The bolt torque was applied in stages of every 0.5 N-m until it was applied to the desired torque magnitude; Figure 4 shows a single cell to be encapsulated.
Figure 5 shows the MEA contact pressure distribution under the experiment, and it can be observed that the indentation is obvious at the plus rib, which is related to the structure of the end plate in the experiment. However, from the vertical direction of the runner, the intermediate pressure was significantly smaller than the edge pressure, which is in line with the existing conclusion [11]. As the bolt torque increased, the contact pressure indentation on the MEA occupied a larger area, i.e., increasing the bolt torque improved the uniformity of the contact pressure distribution.
It should be emphasized that, during the torque increase from 8 N·m to 10 N·m, the bolt and the threaded coupling structure were already tightly fastened. Consequently, the bolt torque was not further increased during the experiments to protect the integrity of the coupling structure. To comprehensively explore the influence of the bolt load on the contact pressure distribution across the MEA, the contact pressure values were extracted from uniformly distributed junctions on the MEA’s surface through numerical simulations. These values were obtained for bolt loads of 625 N, 1250 N, 250 KN, 3750 N, 5000 N, 6250 N, 7500 N, and 8750 N, respectively. Figure 6 shows the distribution of contact pressure on the MEA under different load conditions. Observing this graph, it is noticeable that, for bolt loads under 3750 N, the maximum, minimum, and average values exhibited an almost linear rise in correlation with the applied load. When the bolt load surpassed 3750 N, the escalating trend leveled off, and notably, the minimum value even experienced a decline. This phenomenon can be attributed to the fact that, as the MEA compresses to a certain degree, the MEA’s frame initiates contact with the BPP. This contact, to some extent, serves as a buffer against excessive compression of the MEA. Additionally, the warping deformation of the end plate contributes to a reduction in the minimum value within the central region.
From Figure 6b, it can be seen that the deformation coefficient decreased and then increased, which indicates that the contact pressure uniformity increased and then decreased. Notably, between the bolt loads of 5000 N and 6250 N, there must be an extreme value that results in the most uniform distribution of contact pressure. In the experiments where the bolt torque was increased from 8 N·m to 10 N·m, the uniformity of the MEA contact pressure distribution improved. This improvement can be attributed to several factors: (1) the addition of ribs to the structure, (2) a reduction in errors while applying bolt loads, (3) an appropriate sequence of tightening the bolts, (4) the thickness of the pressure-sensitive paper itself.

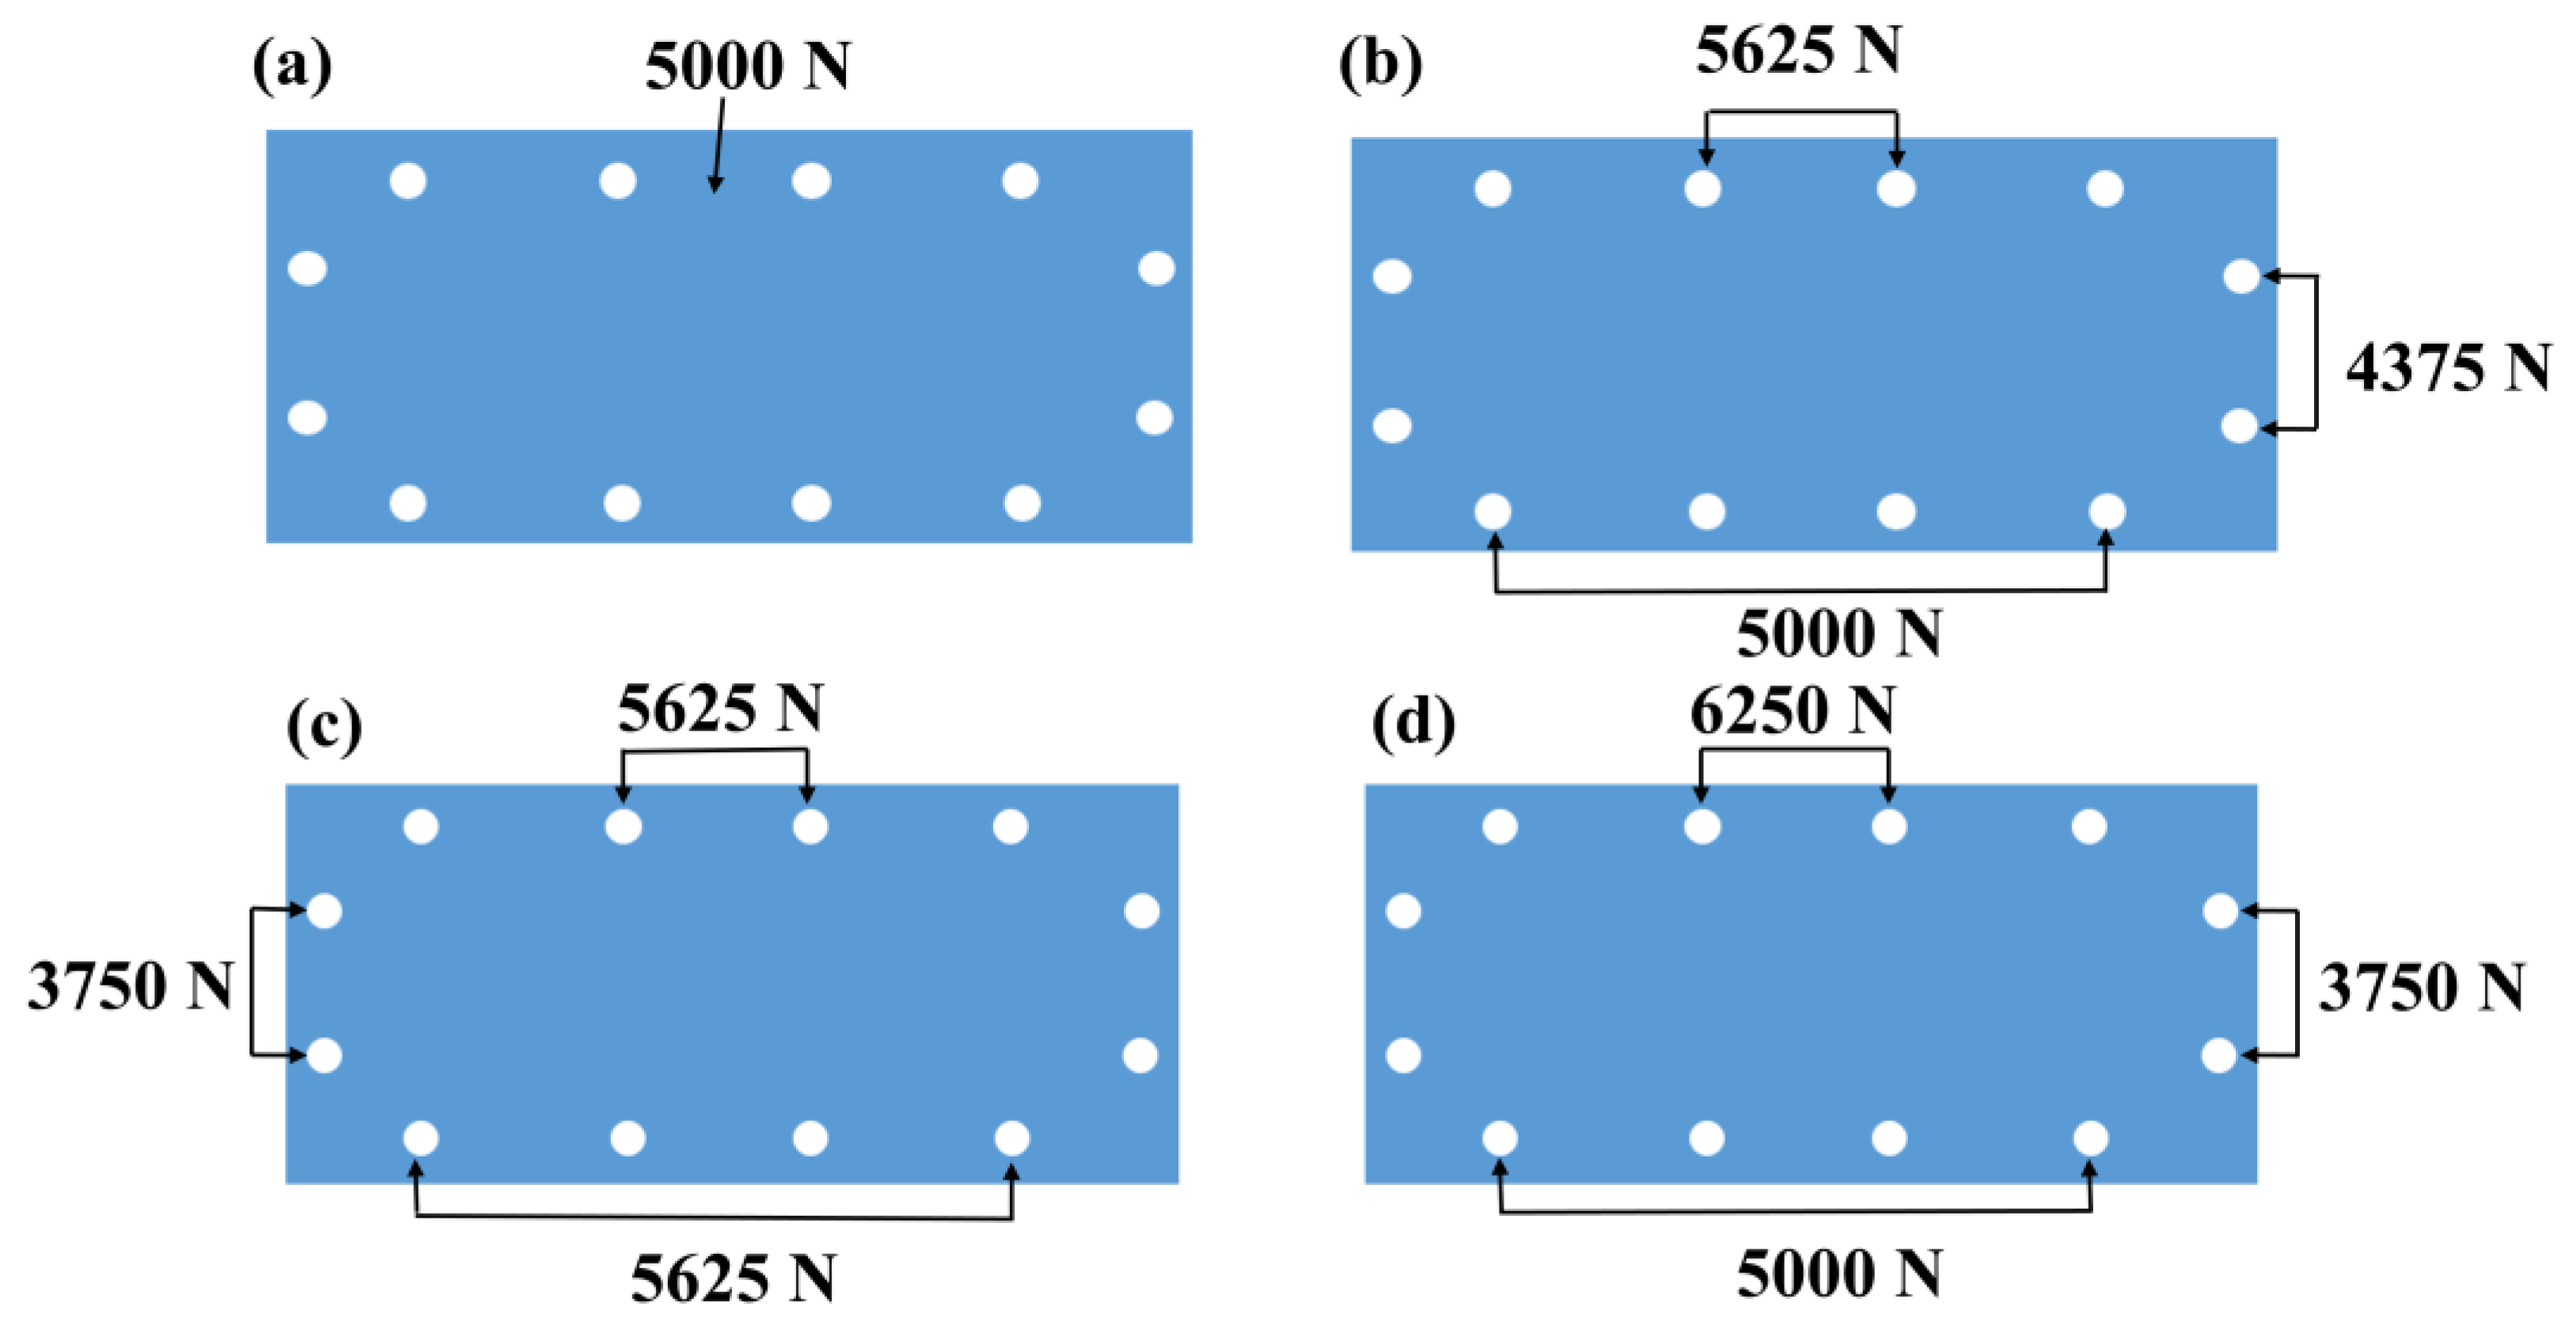
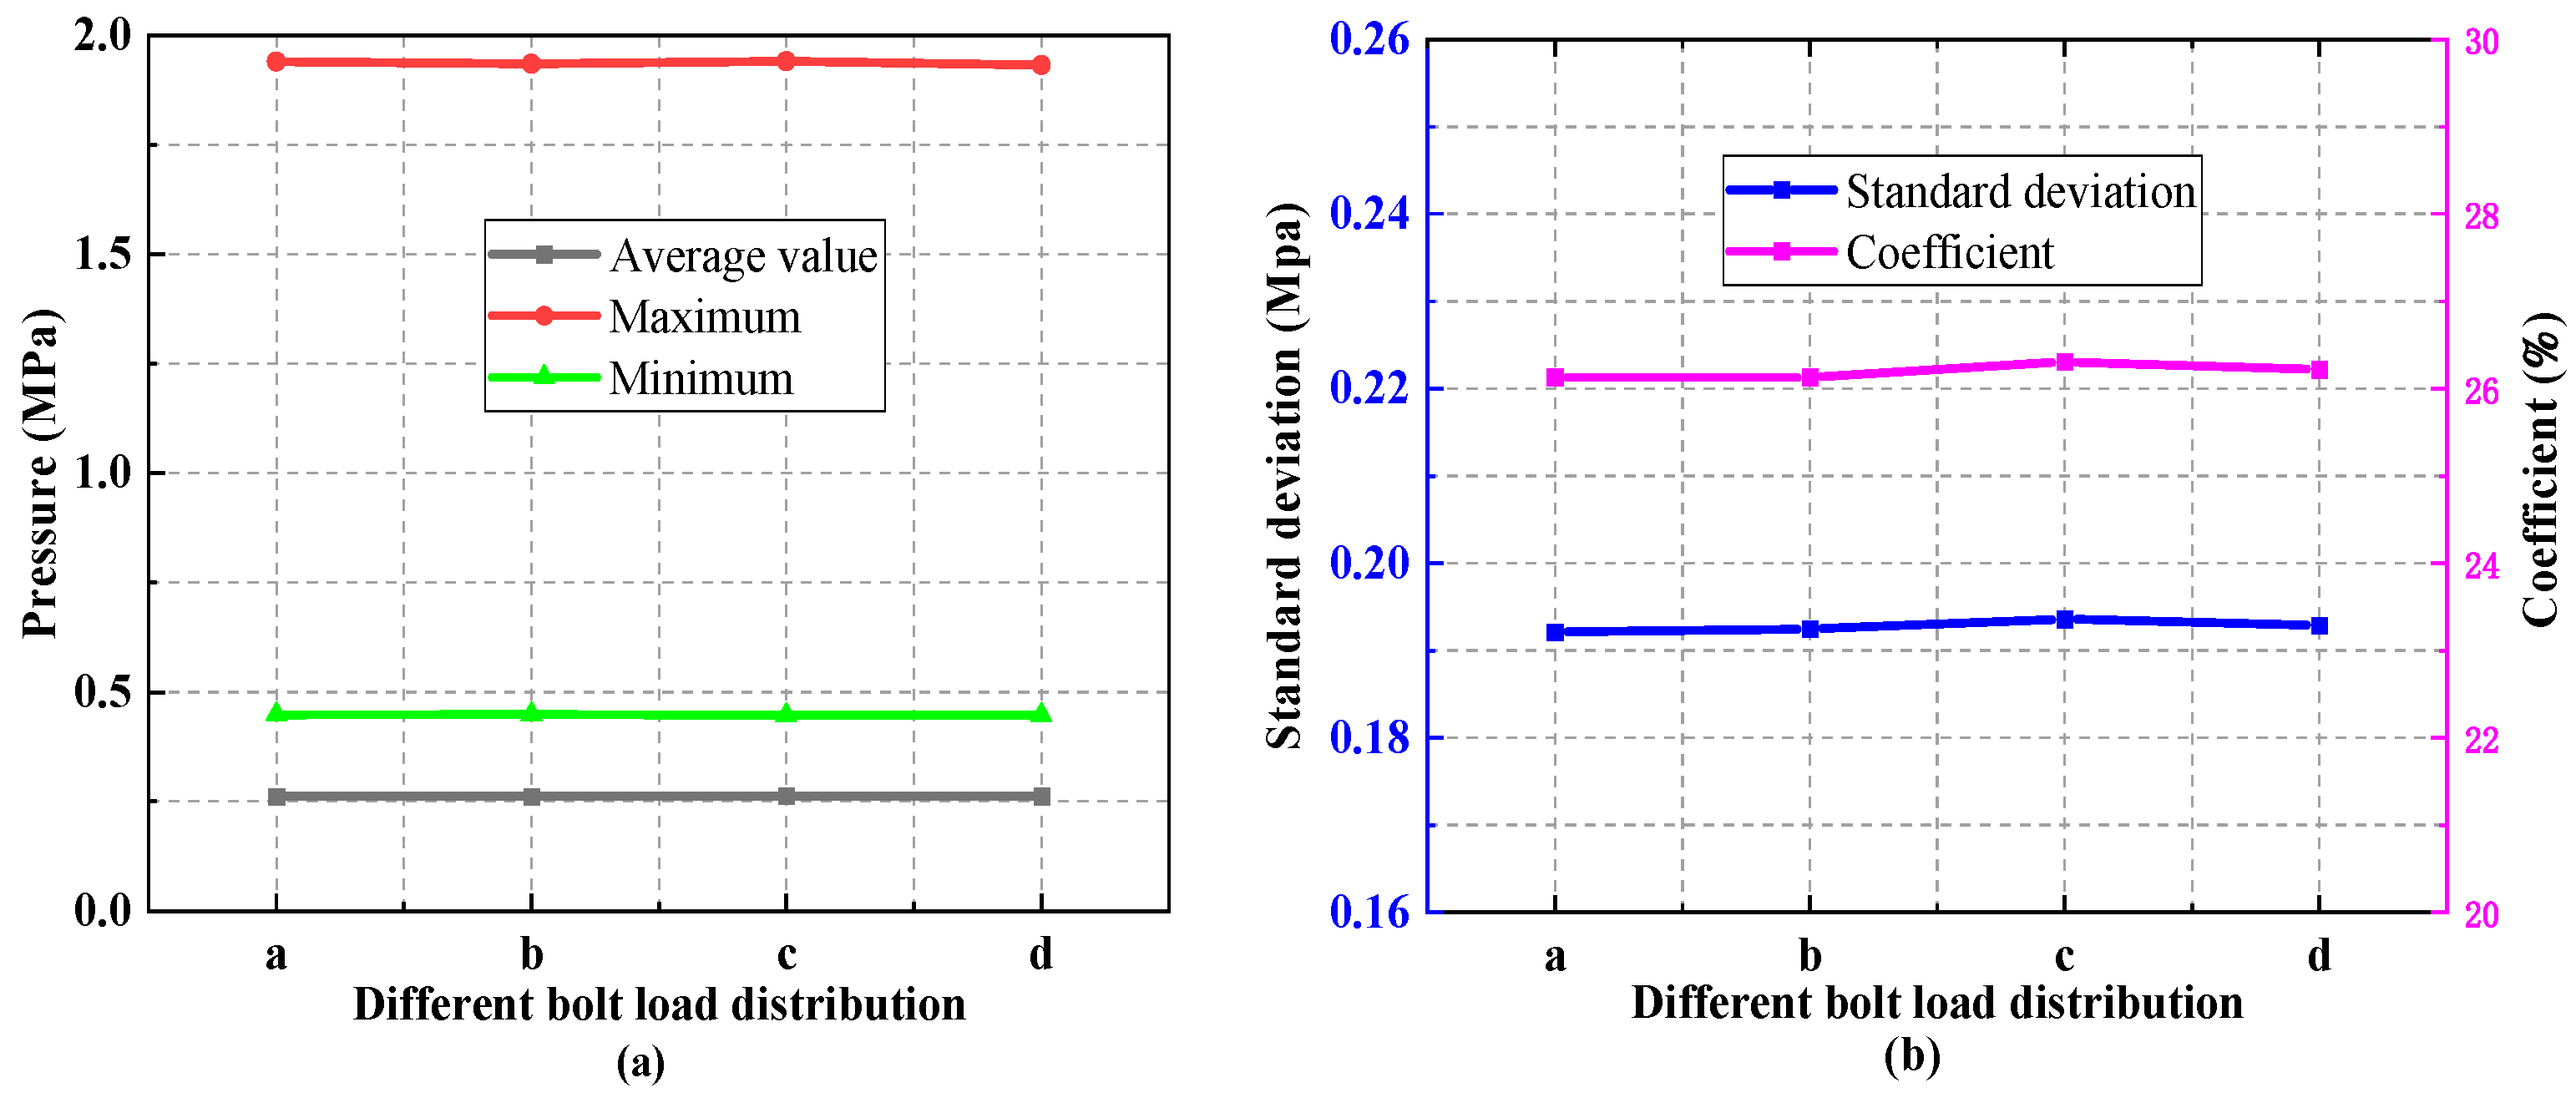
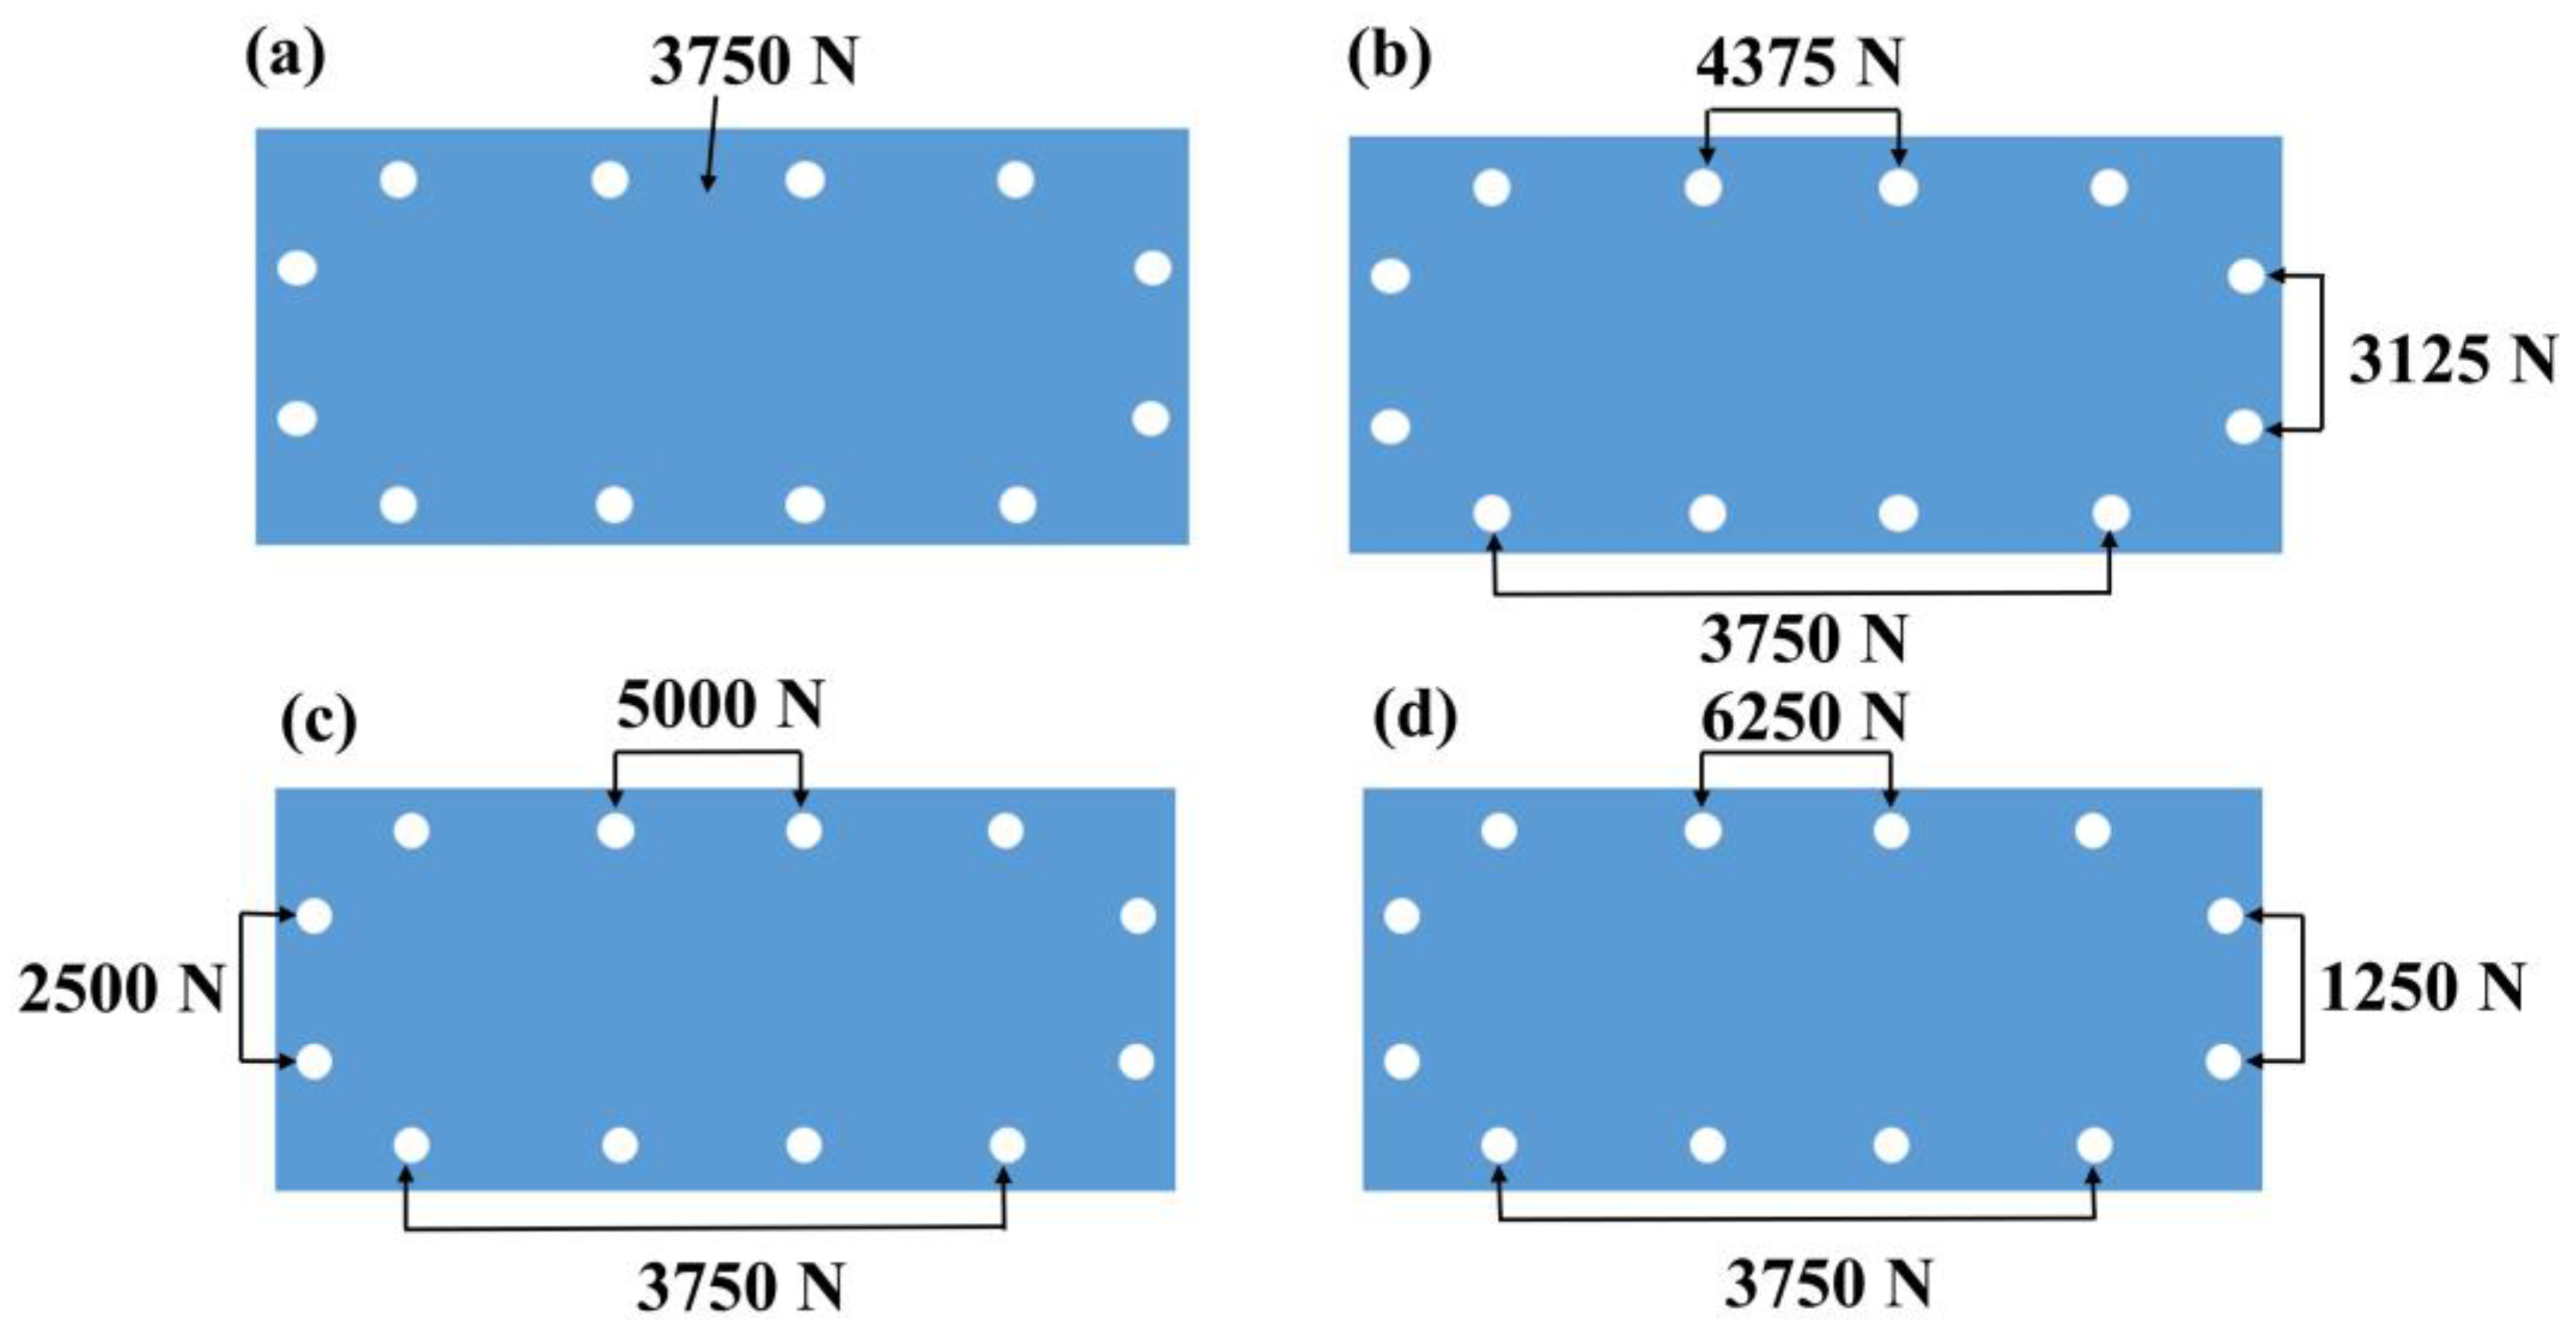
3.2. Effect of Bolt Load Distribution

The uniformity of the contact pressure distribution on the MEA plays a vital role in enhancing fuel cell performance. Numerous studies have focused on end plate designs aimed at achieving a more uniform pressure distribution. One common approach is to increase the thickness of the end plate or use materials with higher moduli of elasticity [27]. However, this often leads to an increase in the mass of the end plate, resulting in reduced specific power of the stack [28]. To address this challenge, various innovative approaches have been proposed by researchers. For example, Yu et al. [29] designed a composite pre-bent end plate that becomes flat after loading, thereby improving the uniform distribution of contact pressure. Alizadeh et al. [30] developed an end plate with a pneumatic pressure chamber, utilizing air pressure to optimize the uniformity of the contact pressure distribution on the MEA. Wang et al. [31] designed an end plate containing a built-in pressurized pocket, allowing for a more uniform contact pressure distribution. However, these approaches often introduce complexity in the manufacturing process and may reduce the reliability of the clamping system.
In this section, we explore the influence of the bolt load distribution on the end plate regarding the contact pressure distribution without altering the cell structure. The methodology involves applying a specific load to each bolt, after which the total load is kept constant, and the contact pressure distribution on the MEA surface is examined for different load distributions. Based on the previously studied case, wherein an extreme value was identified between bolt loads of 5000 N and 6250 N, we chose an average bolt load of 5000 N for this investigation. Figure 7 presents the load distribution for different bolts, where Figure 7a represents a load of 5000 N per bolt, while in Figure 7b–d, the bolt loads are symmetrically applied in the simulation. These load distribution analyses aim to provide insights into optimizing the clamping system to achieve a more uniform contact pressure distribution on the MEA, thereby improving fuel cell performance without requiring significant changes to the cell structure.
The designations a, b, c, and d in Figure 8 correspond to distinct MEA contact pressure distributions associated with the various bolt distributions presented in Figure 7. Upon examination of the illustration, it becomes evident that alterations in the maximum, minimum, mean, standard deviation, and coefficient of variation of the contact pressure on the MEA were marginal as the bolt load at the central position was augmented. Consequently, for an average load of 5000 N, modifying the bolt load at the central position while reducing it at both sides resulted in minimal changes in the uniformity of the contact pressure on the MEA. In fact, there was even a slight reduction in uniformity. This outcome can be attributed to the fact that elevating the bolt load at the central position mitigates buckling deformation along the longer side of the end plate while exacerbating such deformation along the shorter side. Consequently, there was no marked enhancement in the uniformity of the MEA contact pressure distribution. For a more in-depth exploration of the impact of bolt load distribution on the contact pressure distribution, the average bolt load was set at 3750 N. Figure 9 displays the various bolt load distributions considered, while Figure 10 provides an insight into the corresponding contact pressure distribution. As illustrated by Figure 10, altering the load arrangement resulted in improved contact with the bipolar plate at the MEA’s center, consequently elevating the average value. Nevertheless, as the bolt load progressively increased at the intermediate position, the warping deformation of the end plate diminished the average value. The uniformity of the contact pressure experienced an initial augmentation followed by a decline with the rise in intermediate loads. It can be anticipated that the uniformity of the contact pressure would deteriorate as the intermediate bolt load continues to rise. Hence, adjusting the load distribution judiciously, while maintaining a consistent average load of 3750 N, proves advantageous in enhancing the uniformity of the contact pressure distribution.
Figure 11a–c correspond to experiments using pressure-sensitive paper in the cases of Figure 9a–c, respectively. Compared to Figure 11a, the percentage of indentation area increased when increasing the bolt load at the middle position while keeping the average bolt load at 3750 N, thus improving the uniformity of the contact pressure distribution. In conclusion, this section provides an insight into the effect of bolt load distribution on contact pressure for certain load cases. Although the experimental methodology is different from the endplate structural simulation, the results of the analysis provide valuable insights into the design of direct planar end plate clamping forces without complex processes.

3.3. Effect of Gasket Material Properties

The gasket in a fuel cell serves a dual purpose: it acts as a seal to prevent gas leakage and also provides the necessary positive contact pressure on the cell components [32]. When designing the gasket, it is essential to consider the magnitude and distribution of the contact pressure between the gas diffusion layer and the bipolar plate. The material and geometrical parameters of the gasket significantly influence the distribution of contact pressure and contact resistance [33,34]. Previous research by Alisadeh et al. [21] indicated that the hardness of the shim, a type of gasket, had no significant effect on the distribution of contact pressure. However, Gatto et al. [35] found that using different shim materials could vary the ohmic resistance at the interface between the membrane electrode assembly and the bipolar plate. In this section, a detailed investigation is conducted to explore the effect of gasket hardness on the contact pressure distribution on the MEA. Gasket hardness values of 30 HA, 40 HA, 50 HA, 60 HA, and 70 HA were selected, and the material parameters of the rubber are provided in Table 2. The experiments were carried out with a bolt load of 3750 N.
Figure 12 depicts the contact pressure distribution for varying gasket hardnesses. As evident from Figure 12a, the contact pressure’s maximum, minimum, and average values exhibited a decrease in tandem with heightened gasket hardness. In Figure 12b, the coefficient of variation displays an augmentation with escalating gasket hardness, underlining how augmented gasket hardness compromises the uniformity of contact pressure. To delve deeper into the variations in contact pressure on the MEA, it becomes imperative to account for the deformation of the gasket in conjunction with the MEA. Notably, the model established a stacking-direction gap height of 0.06 mm between the MEA and the bipolar plate. Consequently, upon application of a specific bolt load, the bipolar plate initially interfaced with the shims, and as shim compression increased, interaction between the bipolar plate and the MEA generated contact pressure.
Figure 13a illustrates the contact relationships within the PEMFC model   ( d g a s k e t d g r o o v e d G D L > 0 ). Suppose the part of the MEA that is higher than its frame is the GDL, its thickness and the thickness of the gasket are d G D L and d g a s k e t respectively, and the depth of the sealing recess is d g r o o v e . Before the force is applied, there is a gap ∆d ( d g a s k e t d g r o o v e d G D L ) between the bipolar plate and the GDL. During compression, let the compression of the GDL be δ G D L and the compression of the gasket be δ g a s k e t ( δ G D L + d ). Throughout the elastic deformation phase, it is known from Hooke’s law that stress and strain are directly proportional to each other. Based on the relationship between elastic modulus, stress, and strain, the contact pressure ( p G D L ) between the GDL and BPP surfaces can be expressed using the following equation:
  p G D L = δ G D L d G D L × E G D L
The trend of contact pressure between the gasket and BPP can be approximately represented as follows:
  p g a s k e t δ g a s k e t d g a s k e t × E g a s k e t
where E g a s k e t is the modulus of elasticity of the gasket and E G D L is the modulus of elasticity of the GDL.
From Equation (2), it can be observed that, as the hardness of the gasket increases, its modulus of elasticity increases, which means that the compression of the gasket ( δ g a s k e t ) decreases for the same compression force, which also represents a decrease in the GDL compression δ G D L ). Therefore, the MEA surface contact pressure decreases, and the surface contact pressure of the gasket increases. On the other hand, an increase in gasket hardness results in an increase in the force of the MEA having the same amount of compression, so a reasonably chosen gasket hardness is required.

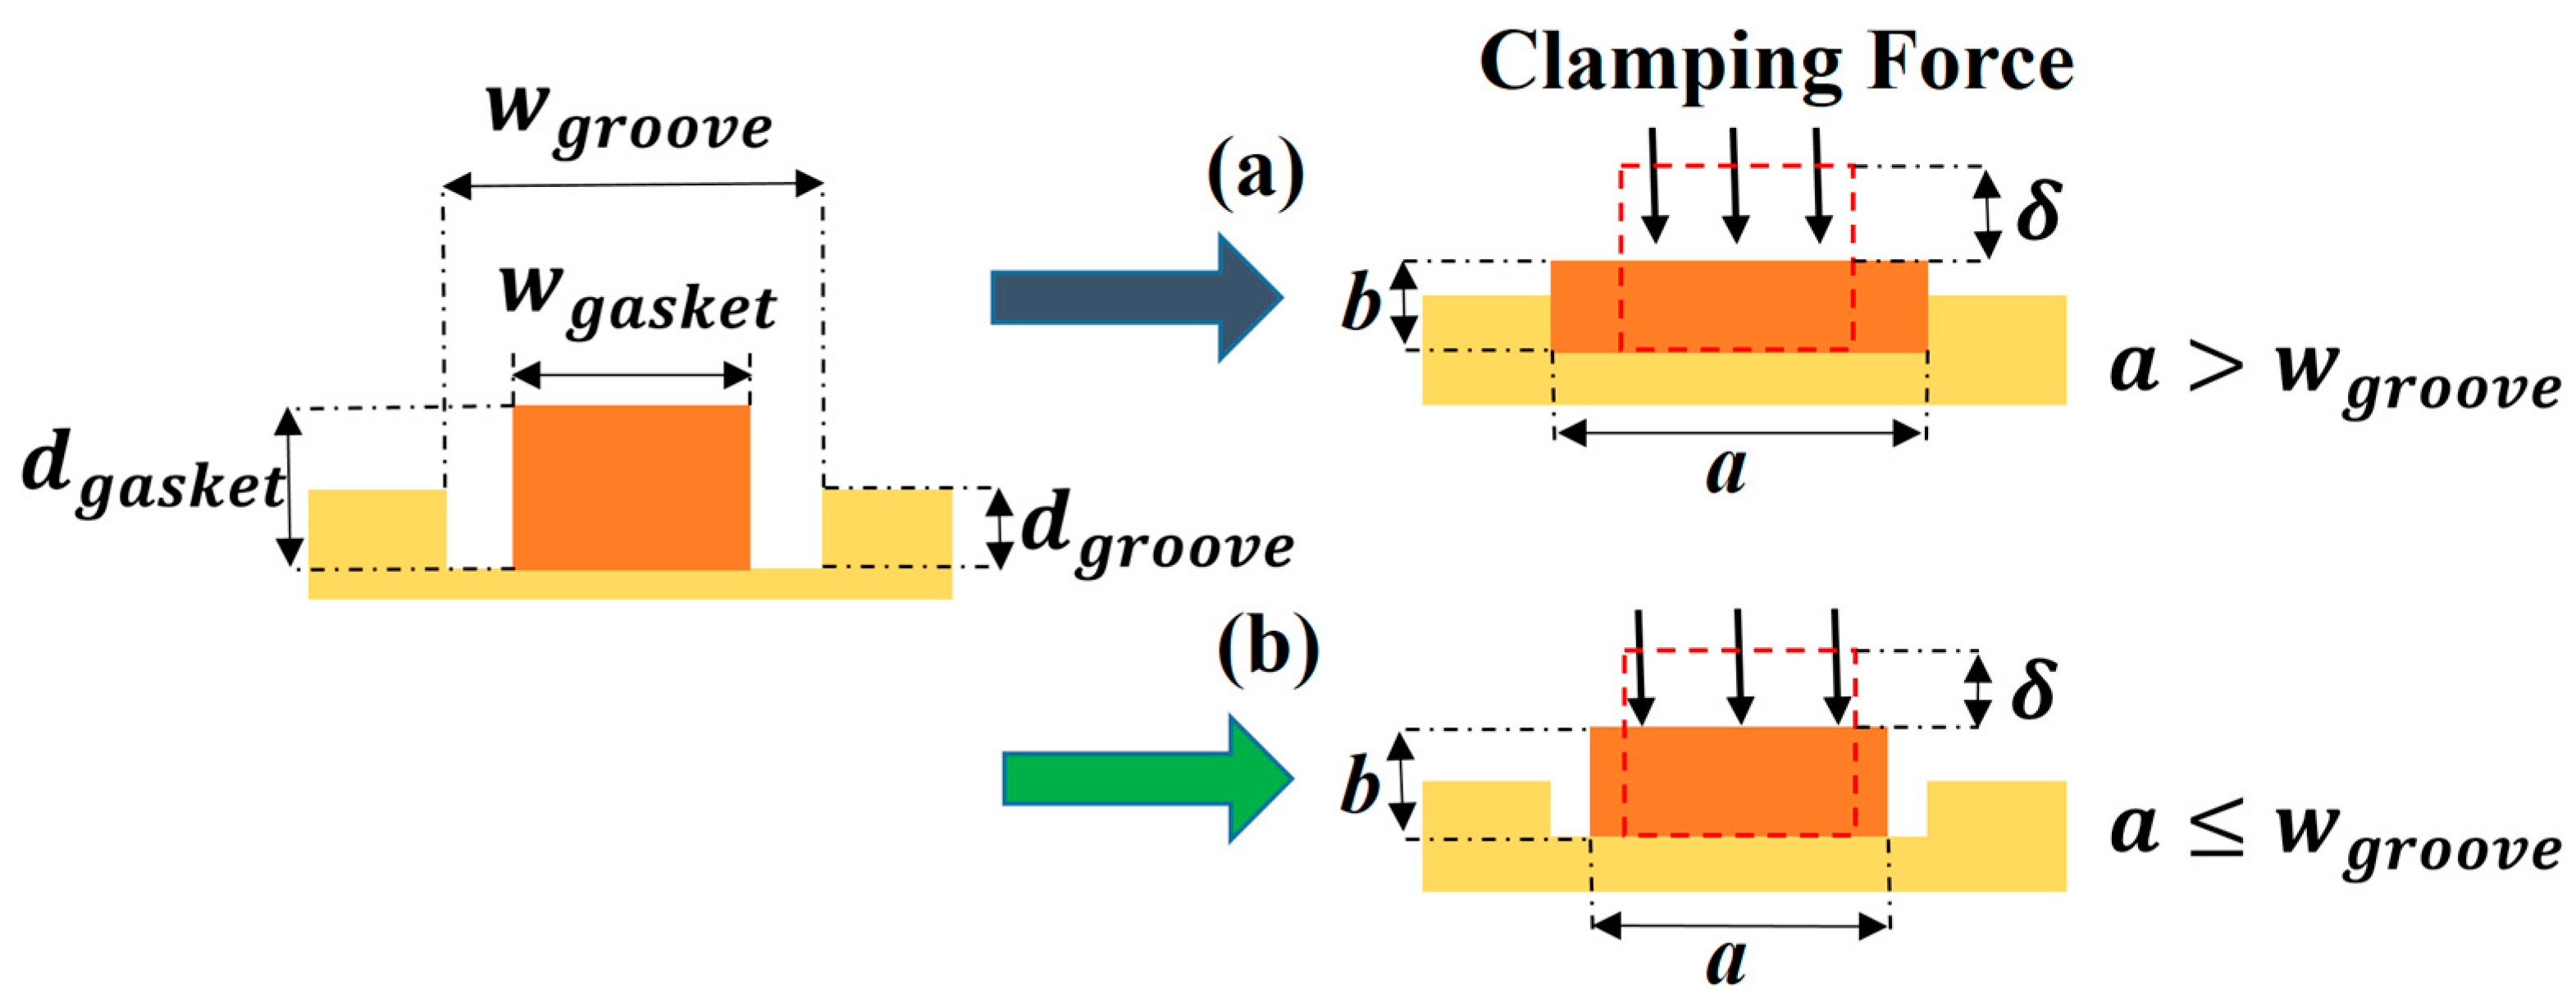
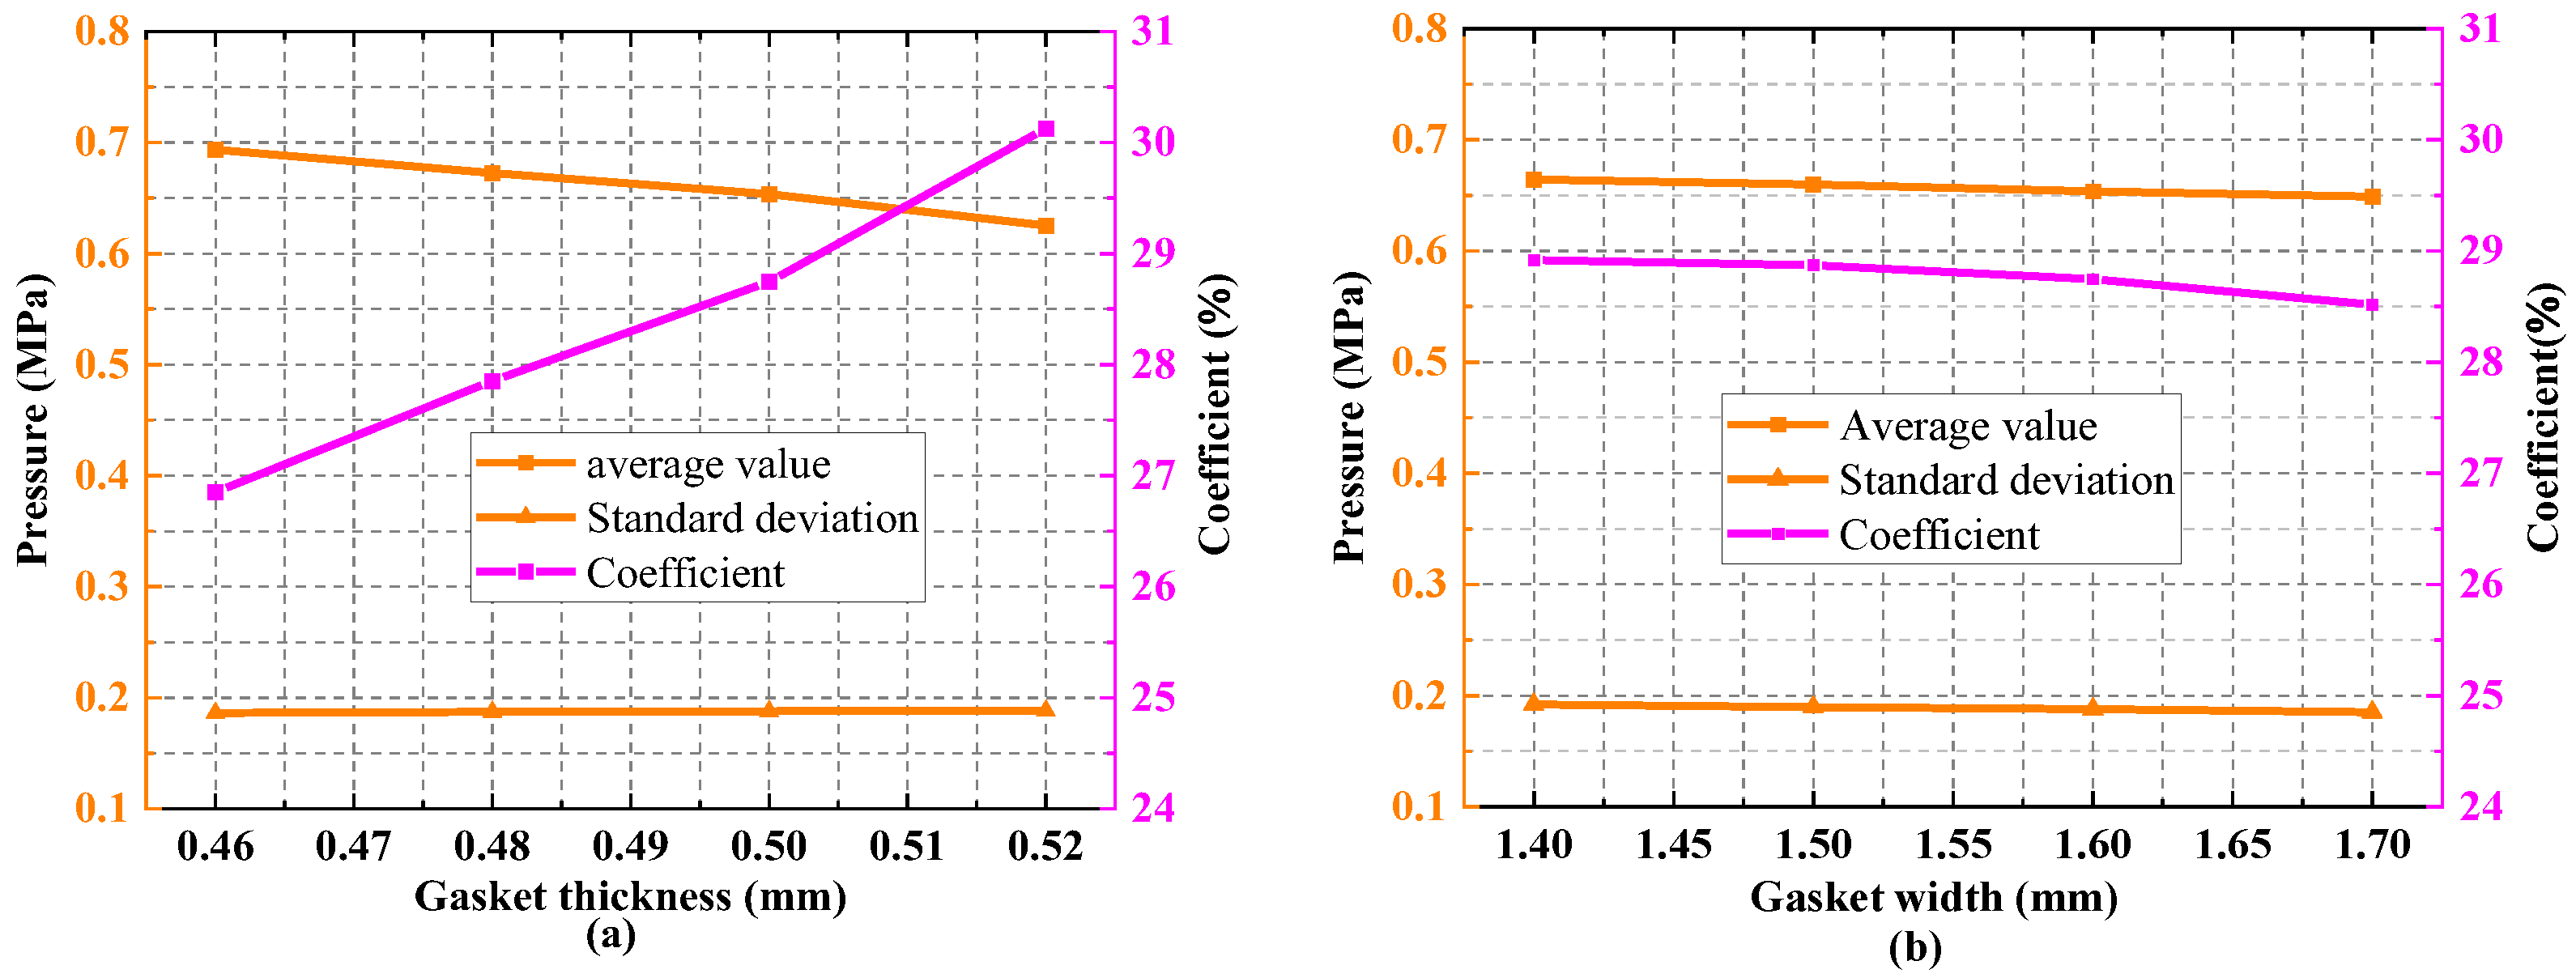
3.4. Effect of Gasket Size

To the best of our knowledge, there has been less research into the dimensional aspects of fuel cell spacers. El-kharouf et al. [36] concluded that the shims undergo no irreversible changes in the thickness direction during compression and that the deformation is so small as to be negligible. Hashimasa et al. [37] showed that there is an optimum match between the thickness of the shim and the GDL. This means that the magnitude of the contact pressure between the GDL and the bipolar plate should be taken into account during the design of the gasket. Figure 13b illustrates the contact relationship corresponding to Figure 13a ( d g a s k e t < d g r o o v e + d G D L ), a phenomenon that is related to the height of the gasket. During the clamping process, the bipolar plate is the first to come into contact with the GDL, and when the GDL is compressed to a certain amount, the spacer starts to come into contact with the bipolar plate and the MEA rim. As the modulus of elasticity of the GDL in this paper is much greater than the modulus of elasticity of the gasket, the sealing performance is not guaranteed under this contact relationship-; therefore, the following studies are based on the contact relationship in Figure 13b.
When not initially under pressure, the gasket has a height in the longitudinal direction greater than the sum of the height of the sealing groove and the thickness of the GDL, and a gap in the transverse direction to the sealing recess. This allows the gasket to undergo longitudinal compression deformation and transverse tensile deformation under pressure. The gasket is considered to be an incompressible superelastic material so that the volume remains constant before and after compression, when the stress does not exceed the proportional limit with the following equation:
a = d g s k k e t × w g a s k e t b
b = d g a s k e t δ g a s k e t
where a is the compressed gasket width, b is the compressed gasket thickness, and   δ g a s k e t is the gasket compression.
As shown in Figure 14a, the gasket extends laterally in contact with the sealing groove during compression, indicating that the gasket achieves maximum compression in the sealing groove, and if the optimum compression of the GDL has not been reached at this point, the GDL cannot be made to achieve optimum compression by continuing to apply pressure. As shown in Figure 14b, in the range of compression δ g a s k e t ( δ g a s k e t < d G D L   m a x + d ), the gasket lateral extension does not reach the edge of the sealing recess, and the gasket compression can be adjusted by increasing or decreasing the pressure to find the best compression of the GDL. The dimensions of the sealing groove, gasket, and GDL should, therefore, be reasonably matched and, for design safety, defined in combination with a certain safety factor n:
  d g a s k e t × w g a s k e t   w g r o o v e d G D L d G D L   m a x + d g r o o v e n
where d G D L   m a x is the maximum compression of the GDL in the elastic phase. It should be noted that the optimal compression of the GDL is less than d G D L   m a x . Based on the previous analysis, this section analyzes the effect of shim thickness and width on the contact pressure distribution of the MEA in the fuel cell within a reasonable range.
  • Gasket thickness (fixed width):
Figure 15a shows the contact pressure distribution for different shim thicknesses. The average pressure decreases with increasing thickness. This means that thicker shims require more clamping force to achieve the same MEA compression ratio, and the larger clamping force increases the end plate warpage deformation. The figure also shows that the coefficient of variation increases with increasing shim thickness, indicating that the contact pressure becomes less uniform across the MEA surface.
2.
Gasket width (fixed thickness):
Figure 15b shows the contact pressure distribution for different shim widths. It shows that the mean, standard deviation, and coefficient of variation of the contact pressure decrease slightly with increasing width. This means that increasing the shim width helps to improve the uniformity of the contact pressure distribution. In order to compare the effect of shim thickness and width on pressure, the increase in volume was calculated by varying the thickness, which resulted in an increase in volume of 4.3%, 8.6%, and 13.0% for a width of 1.6 mm, respectively. Similarly, at a thickness of 0.5 mm, varying the width increased the volume by 7.1%, 14.2%, and 21.4%, respectively. Therefore, based on the trend of the coefficient of variation in the figure, it can be concluded that the shim thickness has a greater effect on the MEA contact pressure distribution compared to the width.

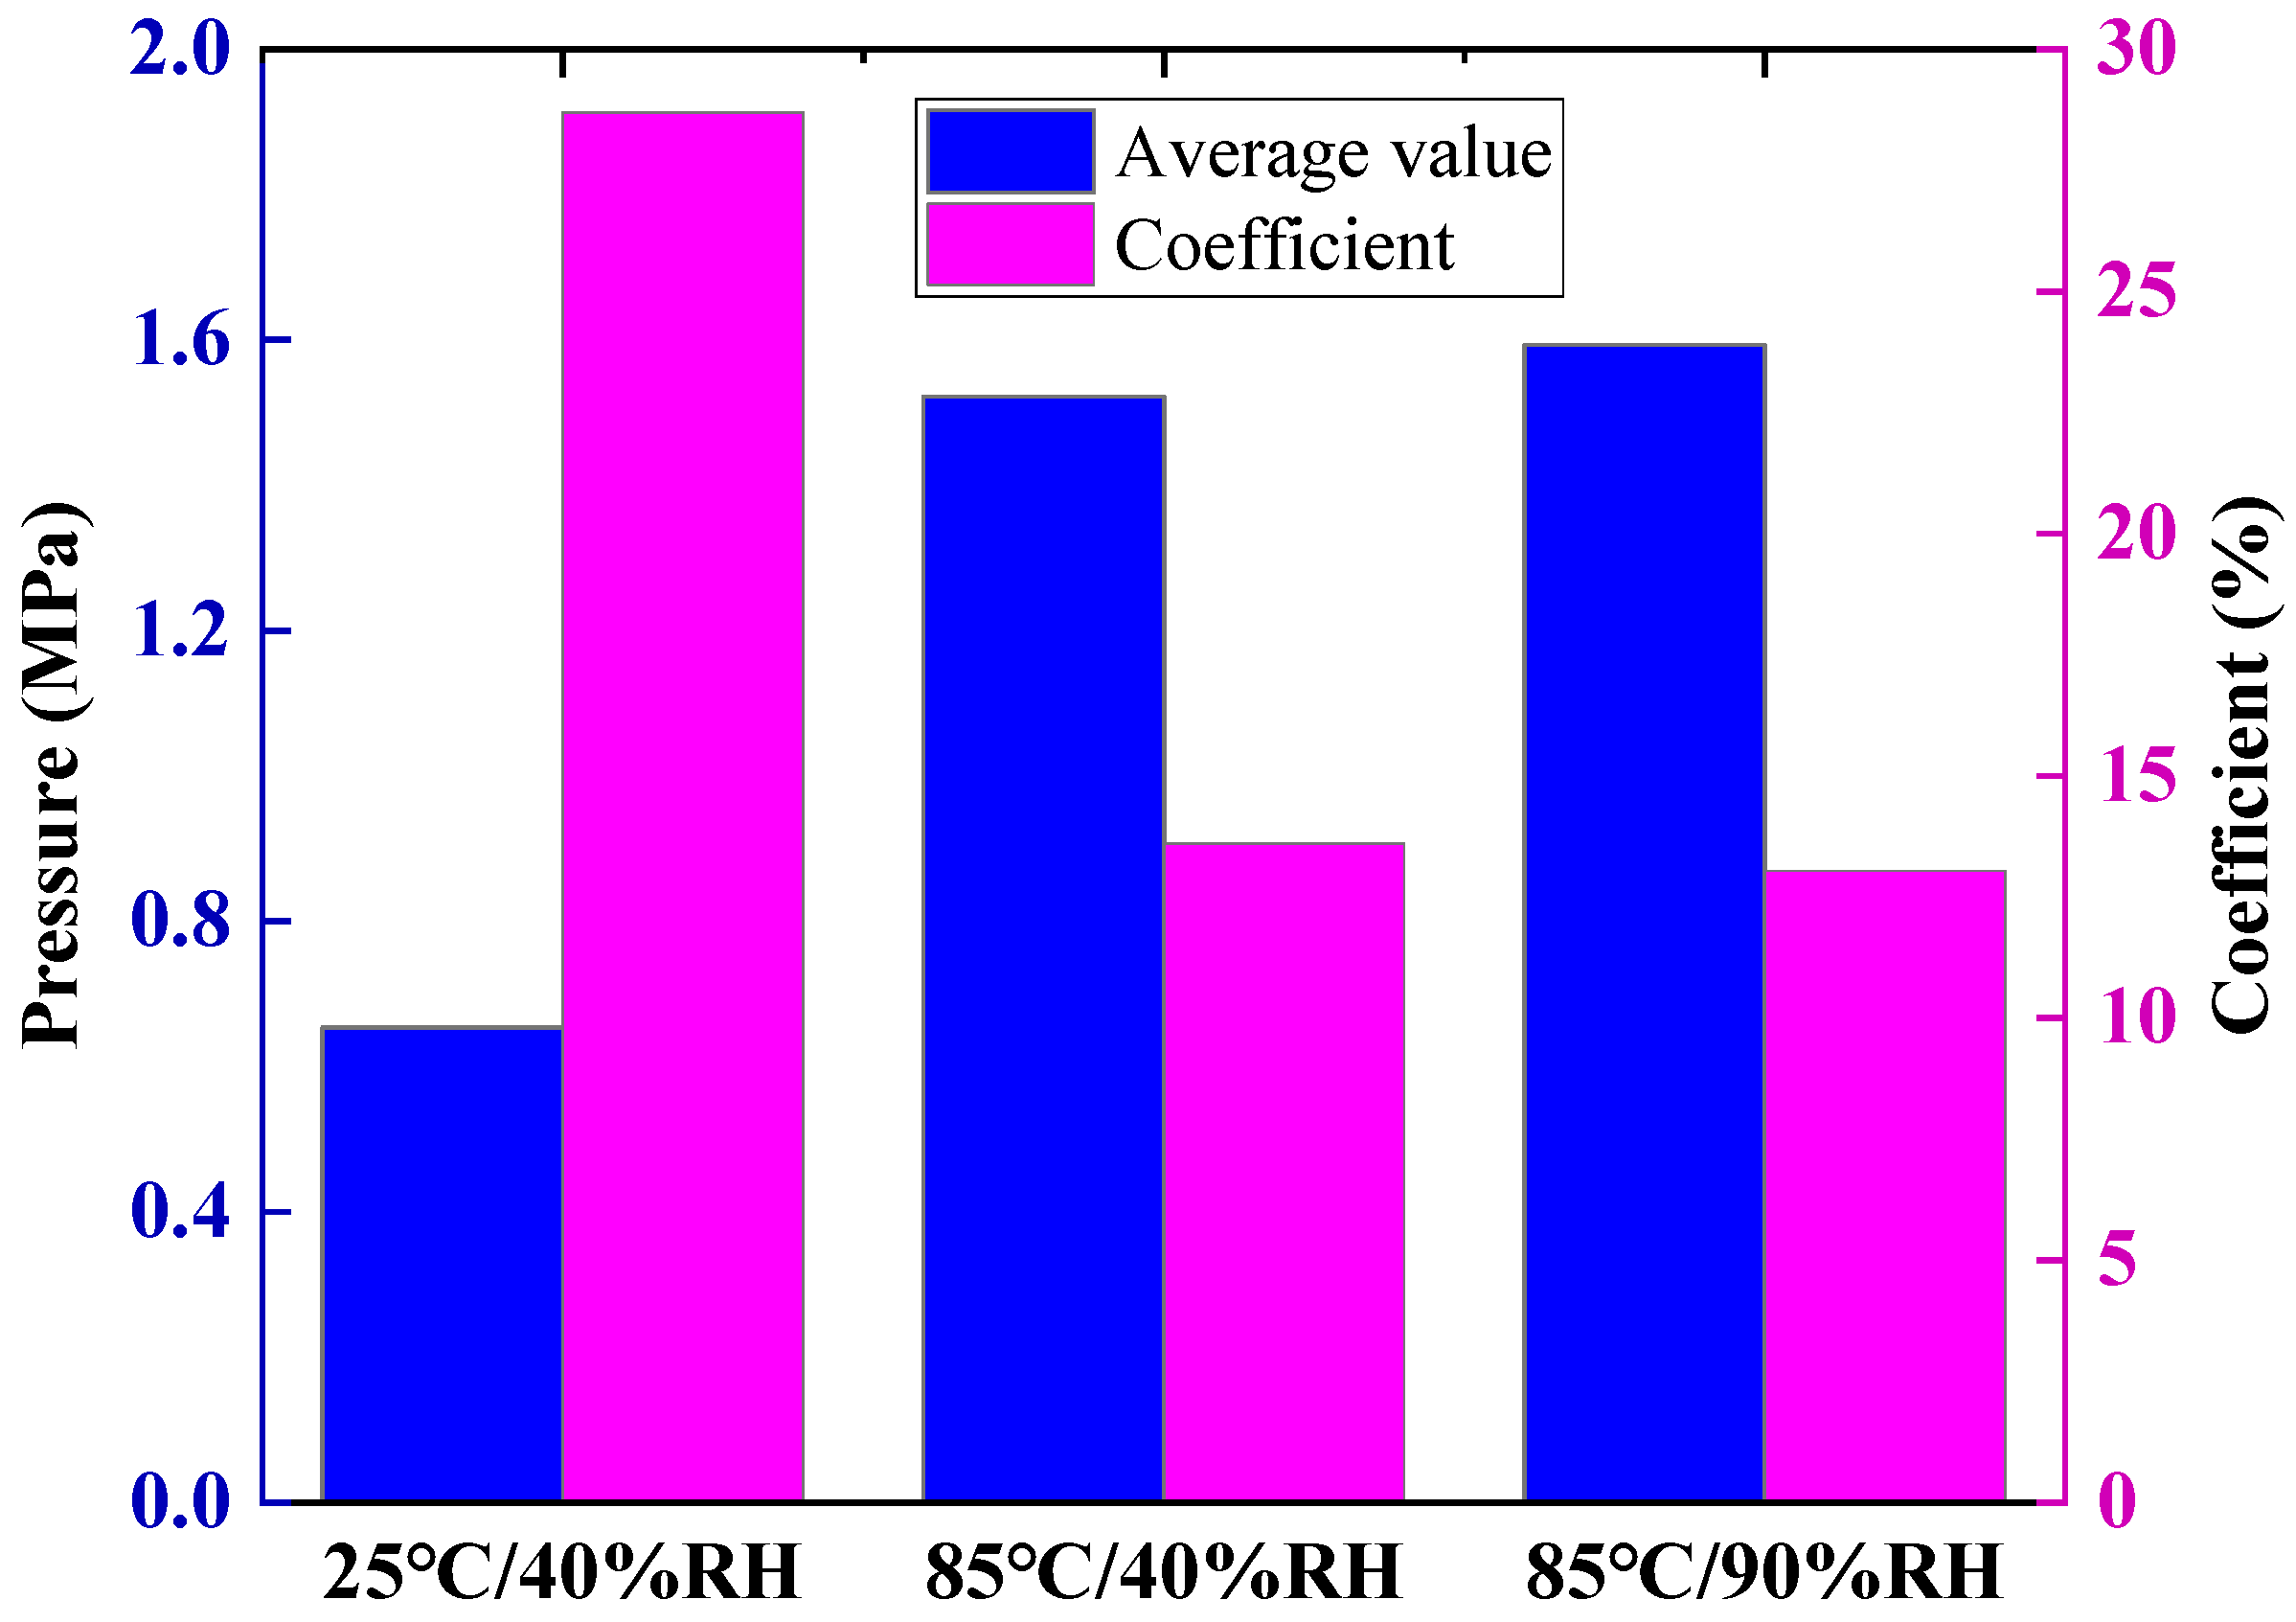
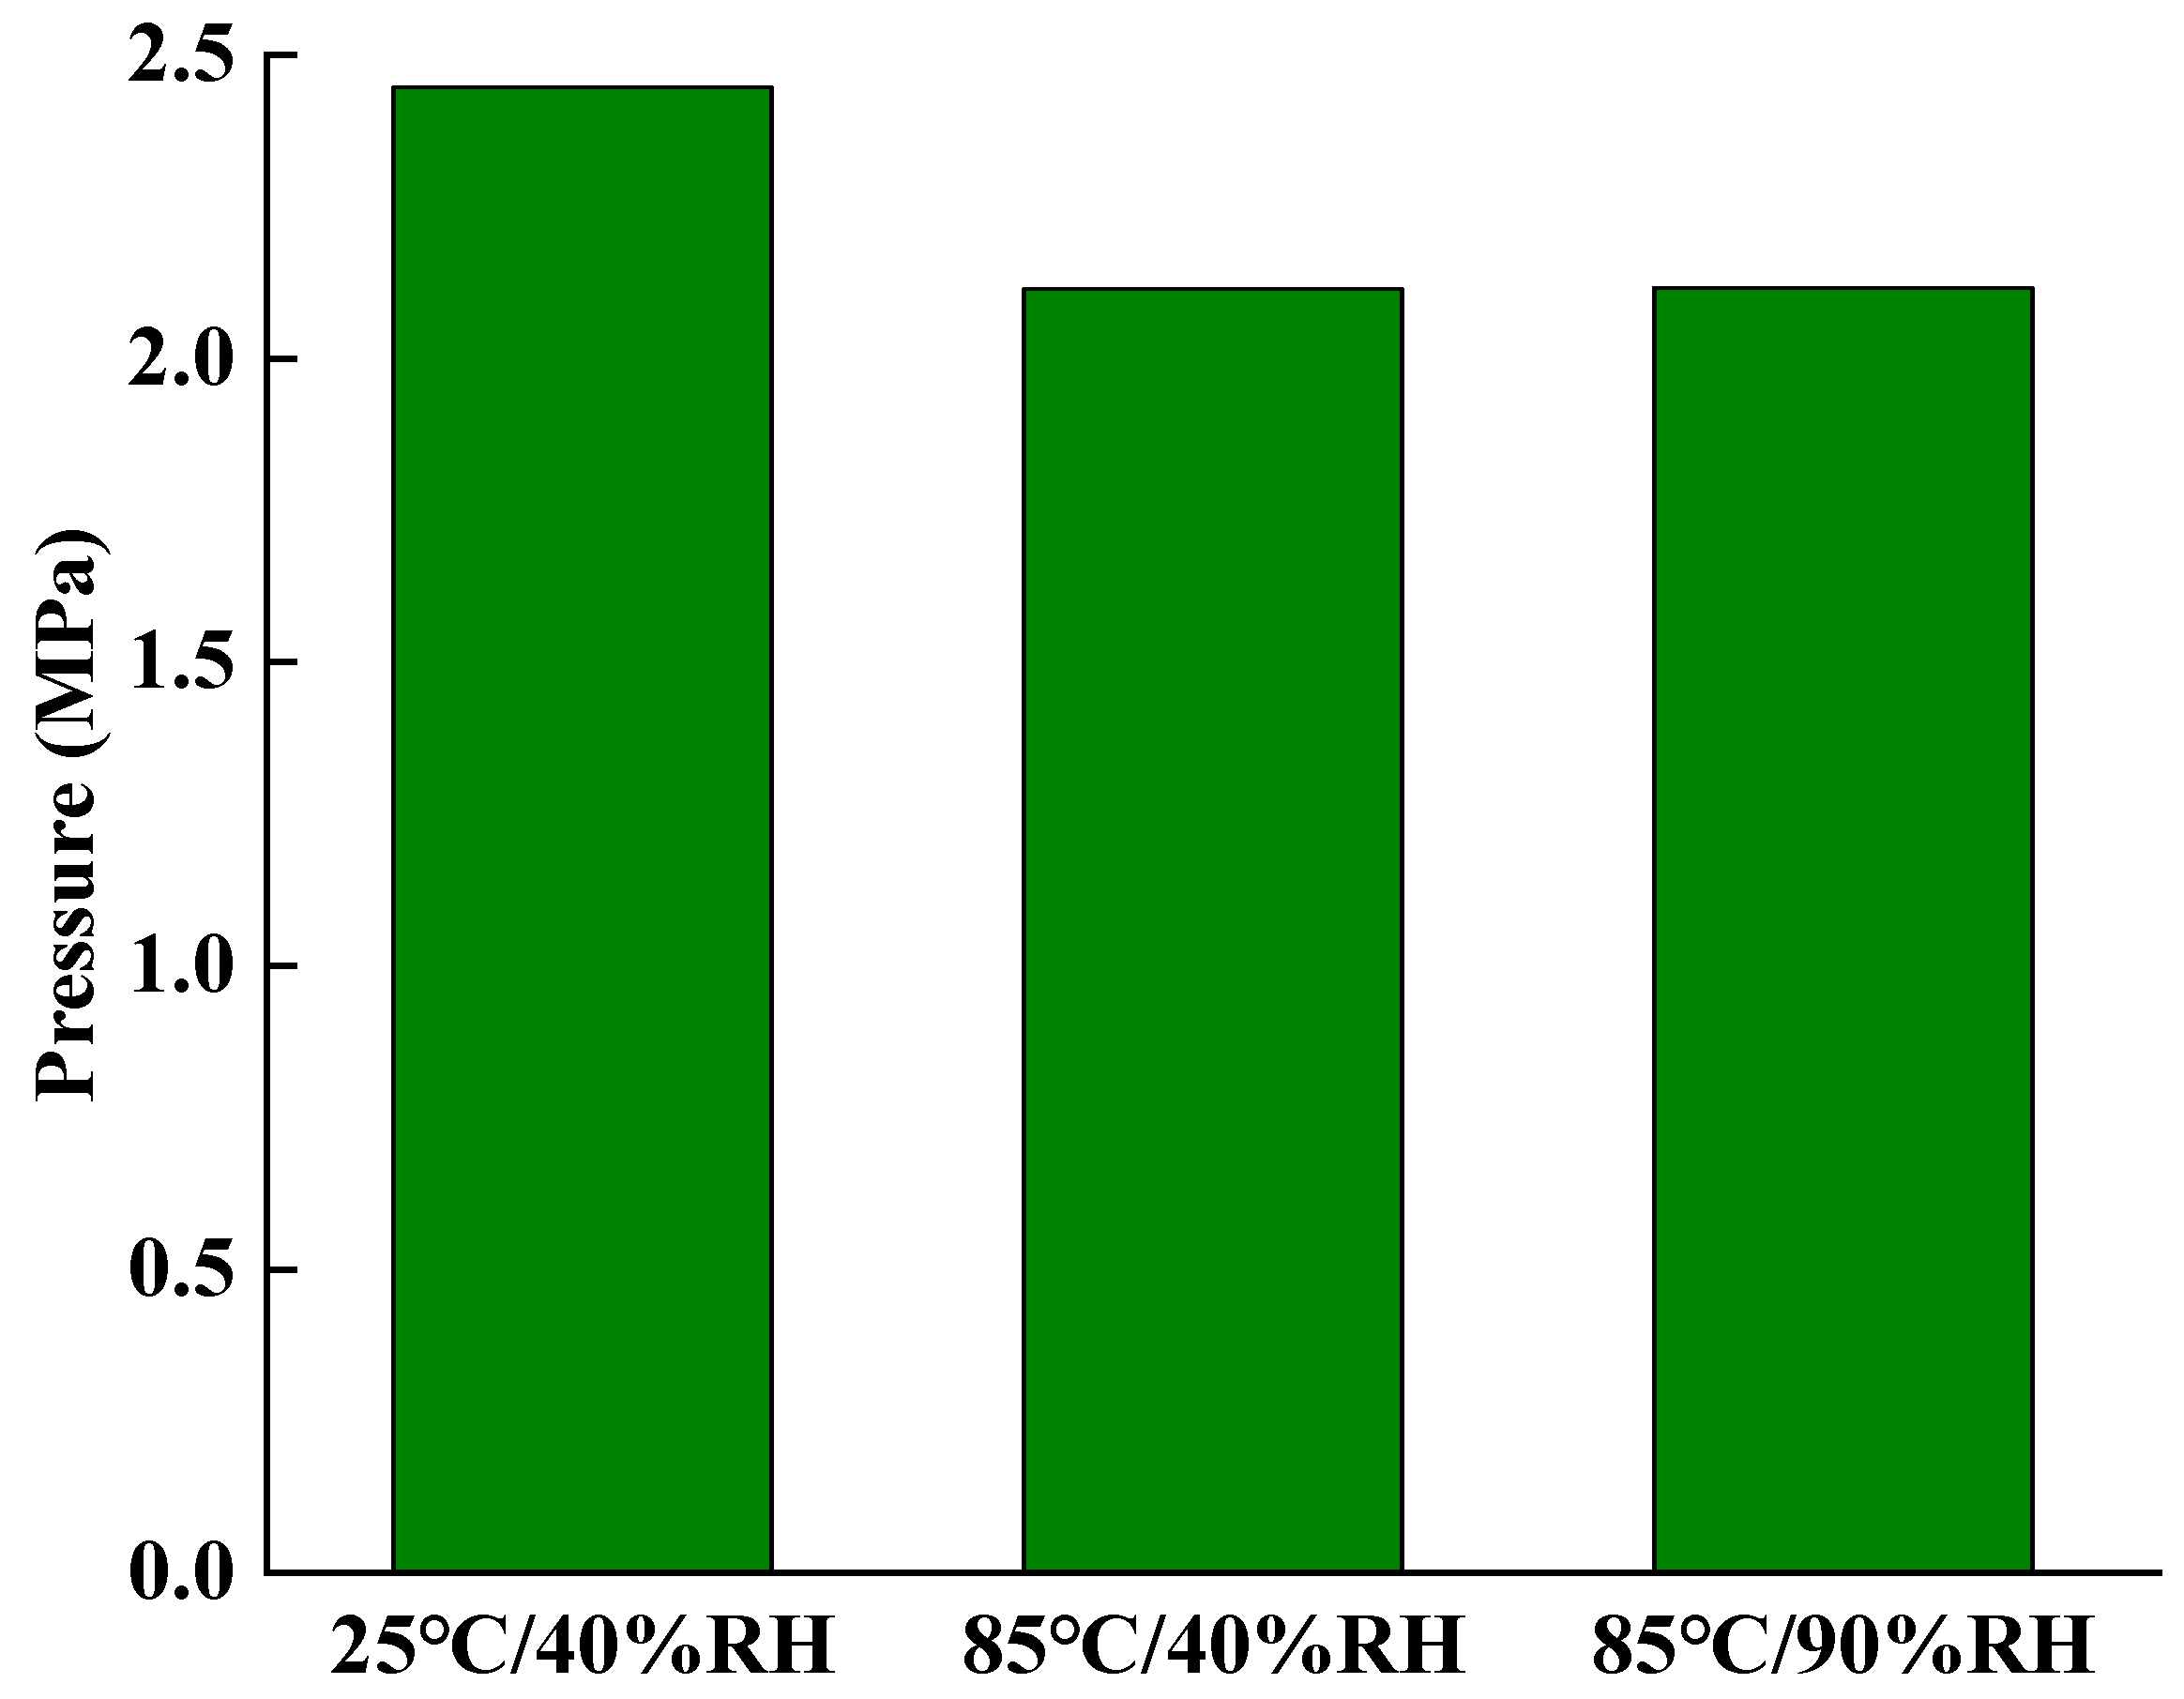
3.5. Effects of Working Operating Conditions

The PEMFC is assembled at room temperature, and its ideal operating temperature under stable conditions is 80 °C due to the heat generated by the chemical reaction during the working process. Under operating conditions, the temperature difference between the inside and outside of the cell in this paper is 9 °C, a result experimentally studied in the range of 4 °C–15 °C in line with [38]. In addition, the von Mises stress of the BPP with gaskets considering thermal effects at 80 °C was also compared with the literature [39]. Figure 16 shows the comparison results with good agreement.
A certain amount of humidity is also required in operation to maintain cell performance, and considering the variation in PEM expansion with temperature and humidity, the simulated temperature and humidity increase cases are 85 °C and 40% RH, and 85 °C and 90% RH, which are compared to the base case at 25 °C and 40% RH. Figure 17 shows the variation in the contact pressure on the MEA versus the coefficient of variation for different operating conditions, and it can be seen that the contact pressure on the MEA becomes larger with increasing temperature and humidity, which is a redistribution of stresses caused by the expansion of the component. At the same time, the increase in temperature and humidity also leads to an increase in the uniformity of the contact pressure and the temperature has a greater effect than the humidity. Figure 18 shows the variation in the average contact pressure of the gaskets for the corresponding cases, and it can be seen that the thermal effect reduces the sealing performance of the fuel cell, while the effect of humidity is not significant.

4. Conclusions

In this study, a numerical simulation method was employed to investigate the impact of bolt load, load distribution, gasket hardness, and size on the contact pressure distribution on the MEA during the assembly process. Additionally, pressure-sensitive paper experiments were conducted for comparison purposes. The findings reveal that there exists an extreme value for contact pressure uniformity during the process of increasing bolt load. Higher bolt loads lead to end plate warping and deformation, thereby impeding the improvement of contact pressure uniformity through alterations in bolt load distribution. However, when the average bolt load is below the extreme value, enhancing the bolt load at the intermediate position can enhance the uniformity of contact pressure distribution on the MEA. To mitigate end plate warpage deformation, reducing the load applied to the bolts is one approach, which can be accomplished by employing softer shims. The size of the gasket plays a crucial role in cell performance, with variations in gasket thickness and contact behavior between the BPP, GDL, and gasket. It is essential to ensure appropriate matching between GDL compression, gasket material and geometrical parameters, and sealing grooves. A wider gasket contributes to improved uniformity in the contact pressure distribution on the MEA, while the gasket thickness exerts a more significant influence on contact pressure than its width. Moreover, under operating conditions, thermal expansion impacts both the magnitude and distribution of contact pressure on the MEA and diminishes cell sealing performance.
In conclusion, this study has provided valuable guidance for the design and production of clamping systems for Proton Exchange Membrane Fuel Cells (PEMFCs), effectively addressing certain research gaps. However, it is important to note that there are numerous other factors yet to be explored. One of the future research areas will focus on optimizing assembly processes under diverse operating conditions to enhance cell performance.

Author Contributions

Formal analysis, J.C. and X.M.; data curation, L.P. and Y.W.; writing—original draft, G.R.; supervision, Y.X. All authors have read and agreed to the published version of the manuscript.

Funding

This study was supported by the Science and Technology Development Fund of Pudong New Area: [PKX2021-W08] and the Shanghai Natural Science Foundation [20ZR1422600].

Data Availability Statement

The data used to support the findings of this study are included within the article.

Conflicts of Interest

The authors declare no conflict of interest.

References

  1. Kim, C.; Cho, S.H.; Cho, S.M.; Na, Y.; Kim, S.; Kim, D.K. Review of hydrogen infrastructure: The current status and roll-out strategy. Int. J. Hydrog. Energy 2023, 48, 1701–1716. [Google Scholar] [CrossRef]
  2. Aminudin, M.A.; Kamarudin, S.K.; Lim, B.H.; Majilan, E.; Masdar, M.; Shaari, N. An overview: Current progress on hydrogen fuel cell vehicles. Int. J. Hydrog. Energy 2023, 48, 4371–4388. [Google Scholar] [CrossRef]
  3. Olabi, A.G.; Wilberforce, T.; Alanazi, A.; Vichare, P.; Sayed, E.T.; Maghrabie, H.M.; Elsaid, K.; Abdelkareem, M.A. Novel Trends in Proton Exchange Membrane Fuel Cells. Energies 2022, 15, 4949. [Google Scholar] [CrossRef]
  4. Wen, C.-Y.; Lin, Y.-S.; Lu, C.-H. Experimental study of clamping effects on the performances of a single proton exchange membrane fuel cell and a 10-cell stack. J. Power Sources 2009, 192, 475–485. [Google Scholar] [CrossRef]
  5. Mao, X.; Ying, R.; Yuan, Y.; Li, F.; Shen, B. Simulation and analysis of hydrogen leakage and explosion behaviors in various compartments on a hydrogen fuel cell ship. Int. J. Hydrog. Energy 2021, 46, 6857–6872. [Google Scholar] [CrossRef]
  6. Zhang, Z.; Tao, W.-Q. Effect of assembly pressure on the performance of proton exchange membrane fuel cell. Energy Storage Sav. 2023, 2, 359–369. [Google Scholar] [CrossRef]
  7. Martín-Alcántara, A.; González-Morán, L.; Pino, J.; Guerra, J.; Iranzo, A. Effect of the Gas Diffusion Layer Design on the Water Management and Cell Performance of a PEM Fuel Cell. Processes 2022, 10, 1395. [Google Scholar] [CrossRef]
  8. Asghari, S.; Shahsamandi, M.H.; Ashraf Khorasani, M.R. Design and manufacturing of end plates of a 5kW PEM fuel cell. Int. J. Hydrog. Energy 2010, 35, 9291–9297. [Google Scholar] [CrossRef]
  9. Lee, W.; Ho, C.-H.; Van Zee, J.W.; Murthy, M. The effects of compression and gas diffusion layers on the performance of a PEM fuel cell. J. Power Sources 1999, 84, 45–51. [Google Scholar] [CrossRef]
  10. Zhao, C.; Xing, S.; Liu, W.; Chen, M.; Wang, Y.; Wang, H. An experimental study on pressure distribution and performance of end-plate with different optimization parameters for air-cooled open-cathode LT-PEMFC. Int. J. Hydrog. Energy 2020, 45, 17902–17915. [Google Scholar] [CrossRef]
  11. Dey, T.; Deshpande, J.; Singdeo, D.; Ghosh, P.C. Study of PEM Fuel Cell End Plate Design by Structural Analysis Based on Contact Pressure. J. Energy 2019, 2019, 1–11. [Google Scholar] [CrossRef]
  12. Chien, C.-H.; Hu, Y.-L.; Su, T.-H.; Liu, H.-T.; Wang, C.-T.; Yang, P.-F.; Lu, Y.-X. Effects of bolt pre-loading variations on performance of GDL in a bolted PEMFC by 3-D FEM analysis. Energy 2016, 113, 1174–1187. [Google Scholar] [CrossRef]
  13. Carral, C.; Mélé, P. A numerical analysis of PEMFC stack assembly through a 3D finite element model. Int. J. Hydrog. Energy 2014, 39, 4516–4530. [Google Scholar] [CrossRef]
  14. Bates, A.; Mukherjee, S.; Hwang, S.; Lee, S.C.; Kwon, O.; Choi, G.H.; Park, S. Simulation and experimental analysis of the clamping pressure distribution in a PEM fuel cell stack. Int. J. Hydrog. Energy 2013, 38, 6481–6493. [Google Scholar] [CrossRef]
  15. Bograchev, D.; Gueguen, M.; Grandidier, J.-C.; Martemianov, S. Stress and plastic deformation of MEA in fuel cells. Int. J. Hydrog. Energy 2008, 180, 393–401. [Google Scholar]
  16. Mikkola, M.; Tingelöf, T.; Ihonen, J.K. Modelling compression pressure distribution in fuel cell stacks. J. Power Sources 2009, 193, 269–275. [Google Scholar] [CrossRef]
  17. Toghyani, S.; Moradi Nafchi, F.; Afshari, E.; Hasanpour, K.; Baniasadi, E.; Atyabi, S.A. Thermal and electrochemical performance analysis of a proton exchange membrane fuel cell under assembly pressure on gas diffusion layer. Int. J. Hydrog. Energy 2018, 43, 4534–4545. [Google Scholar] [CrossRef]
  18. Kusoglu, A.; Karlsson, A.M.; Santare, M.H.; Cleghorn, S.; Johnson, W.B. Mechanical behavior of fuel cell membranes under humidity cycles and effect of swelling anisotropy on the fatigue stresses. J. Power Sources 2007, 170, 345–358. [Google Scholar] [CrossRef]
  19. Tang, Y.; Santare, M.H.; Karlsson, A.M.; Cleghorn, S.; Johnson, W.B. Stresses in Proton Exchange Membranes Due to Hygro-Thermal Loading. J. Fuel Cell Sci. Technol. 2006, 3, 119–124. [Google Scholar] [CrossRef]
  20. Kleemann, J.; Finsterwalder, F.; Tillmetz, W. Characterisation of mechanical behaviour and coupled electrical properties of polymer electrolyte membrane fuel cell gas diffusion layers. J. Power Sources 2009, 190, 92–102. [Google Scholar] [CrossRef]
  21. Alizadeh, E.; Barzegari, M.M.; Momenifar, M.; Ghadimi, M.; Saadat, S. Investigation of contact pressure distribution over the active area of PEM fuel cell stack. Int. J. Hydrog. Energy 2016, 41, 3062–3071. [Google Scholar] [CrossRef]
  22. Liu, B.; Liu, L.F.; Wei, M.Y.; Wu, C.W. Vibration mode analysis of the proton exchange membrane fuel cell stack. J. Power Sources 2016, 331, 299–307. [Google Scholar] [CrossRef]
  23. Zhang, J.; Hu, Y. Sealing performance and mechanical behavior of PEMFCs sealing system based on thermodynamic coupling. Int. J. Hydrog. Energy 2020, 45, 23480–23489. [Google Scholar] [CrossRef]
  24. Huang, X.; Liu, S.; Yu, X.; Liu, Y.; Zhang, Y.; Xu, G. A mechanism leakage model of metal-bipolar-plate PEMFC seal structures with stress relaxation effects. Int. J. Hydrog. Energy 2022, 47, 2594–2607. [Google Scholar] [CrossRef]
  25. Zhou, Y.; Lin, G.; Shih, A.; Hu, S. Assembly pressure and membrane swelling in PEM fuel cells. J. Power Sources 2009, 192, 544–551. [Google Scholar] [CrossRef]
  26. Tang, Y.; Karlsson, A.M.; Santare, M.H.; Gilbert, M.; Cleghorn, S.; Johnson, W.B. An experimental investigation of humidity and temperature effects on the mechanical properties of perfluorosulfonic acid membrane. Mater. Sci. Eng. A 2006, 425, 297–304. [Google Scholar] [CrossRef]
  27. Shinde, U.; Koorata, P.K. Numerical investigation on the sensitivity of endplate design and gas diffusion material models in quantifying localized interface and bulk electrical resistance. Int. J. Hydrog. Energy 2021, 46, 17358–17373. [Google Scholar] [CrossRef]
  28. Pacheco, C.; Barbosa, R.; Ordoñez, L.; Sierra, J.; Escobar, B. Design, simulation and experimental characterization of a high-power density fuel cell. Int. J. Hydrog. Energy 2021, 46, 26197–26204. [Google Scholar] [CrossRef]
  29. Yu, H.N.; Kim, S.S.; Suh, J.D.; Lee, D.G. Composite endplates with pre-curvature for PEMFC (polymer electrolyte membrane fuel cell). Compos. Struct. 2010, 92, 1498–1503. [Google Scholar] [CrossRef]
  30. Alizadeh, E.; Ghadimi, M.; Barzegari, M.M.; Saadat, S.H.M. Development of contact pressure distribution of PEM fuel cell’s MEA using novel clamping mechanism. Energy 2017, 131, 92–97. [Google Scholar] [CrossRef]
  31. Wang, X.; Song, Y.; Zhang, B. Experimental study on clamping pressure distribution in PEM fuel cells. J. Power Sources 2008, 179, 305–309. [Google Scholar] [CrossRef]
  32. Chen, Z.; Xing, Y.; Cao, J.; Yang, F.; Zhang, X. Leakage Analysis of PEMFC Sealing System Considering Temperature Cycling. Energies 2023, 16, 5475. [Google Scholar] [CrossRef]
  33. Xing, S.; Zhao, C.; Liu, W.; Zou, J.; Chen, M.; Wang, H. Effects of bolt torque and gasket geometric parameters on open-cathode polymer electrolyte fuel cells. Appl. Energy 2021, 303, 117632. [Google Scholar] [CrossRef]
  34. Uzundurukan, A.; Bilgili, M.; Devrim, Y. Examination of compression effects on PEMFC performance by numerical and experimental analyses. Int. J. Hydrog. Energy 2020, 45, 35085–35096. [Google Scholar] [CrossRef]
  35. Gatto, I.; Urbani, F.; Giacoppo, G.; Barbera, O.; Passalacqua, E. Influence of the bolt torque on PEFC performance with different gasket materials. Int. J. Hydrog. Energy 2011, 36, 13043–13050. [Google Scholar] [CrossRef]
  36. El-Kharouf, A.; Steinberger-Wilckens, R. The Effect of Clamping Pressure on Gas Diffusion Layer Performance in Polymer Electrolyte Fuel Cells. Fuel Cells 2015, 15, 802–812. [Google Scholar] [CrossRef]
  37. Hashimasa, Y.; Numata, T.; Moriya, K.; Watanabe, S. Study of fuel cell structure and heating method. J. Power Sources 2006, 155, 182–189. [Google Scholar] [CrossRef]
  38. Pharoah, J.G.; Burheim, O.S. On the temperature distribution in polymer electrolyte fuel cells. J. Power Sources 2010, 195, 5235–5245. [Google Scholar] [CrossRef]
  39. Zhang, J.; Hu, Y.; Han, C.; Zhang, H. Stress response and contact behavior of PEMFC during the assembly and working condition. Int. J. Hydrog. Energy 2021, 46, 30467–30478. [Google Scholar] [CrossRef]
Figure 1. Single-cell composition diagram of a proton exchange membrane fuel cell: (a) exploded view and (b) MEA and BPP structure.
Energies 16 06487 g001
Figure 2. (a) Grid division diagram, (b) boundary constraint diagram, and (c) schematic diagram of bolt load application.
Energies 16 06487 g002
Figure 3. Swelling expansion as a function of humidity and temperature for Nafion®112 [26].
Energies 16 06487 g003
Figure 4. Single cell to be encapsulated with 12 bolts.
Energies 16 06487 g004
Figure 5. Contact pressure indentation distribution on MEA at different bolt torques.
Energies 16 06487 g005
Figure 6. MEA contact pressure under different bolt loads: (a) maximum, minimum, and average values; (b) standard deviation and coefficient of variation.
Energies 16 06487 g006
Figure 7. Schematic diagram of the different bolt load distributions with an average load of 5000 N: (a) Each bolt load 5000 N, (bd) load distribution as shown in figure.
Energies 16 06487 g007
Figure 8. MEA contact pressure distribution with different bolt load distributions with an average load of 5000 N: (a) maximum, minimum and average values, (b) standard deviation and coefficient of variation.
Energies 16 06487 g008
Figure 9. Schematic diagram of the different bolt load distributions with an average load of 3750 N: (a) Each bolt load 3750 N, (bd) load distribution as shown in figure.
Energies 16 06487 g009
Figure 10. MEA contact pressure distribution with different bolt load distributions with an average load of 3750 N: (a) Maximum, minimum and average values, (b) Standard deviation and coefficient of variation.
Energies 16 06487 g010
Figure 11. Contact pressure indentation distribution on MEA for different bolt distributions in Figure 9: (a) Figure 9a situation, (b) Figure 9b situation, (c) Figure 9c situation.
Energies 16 06487 g011
Figure 12. Effect of gasket hardness on contact pressure on the MEA: (a) maximum, minimum, and average values, (b) standard deviation and coefficient of variation.
Energies 16 06487 g012
Figure 13. Schematic diagram of PEMFC internal contacts: (a) ( d g a s k e t > d g r o o v e + d G D L ) and (b) ( d g a s k e t < d g r o o v e + d G D L ).
Energies 16 06487 g013
Figure 14. Lateral contact of sealing grooves: (a) a > w g r o o v e and (b) a w g r o o v e .
Energies 16 06487 g014
Figure 15. Effect of gasket size on MEA contact pressure distribution: (a) gasket thickness and (b) gasket width.
Energies 16 06487 g015
Figure 16. Comparison of von Mises stress clouds for gaskets and BPP in this paper with those of Ref. [39] at 80 °C considering thermal effects.
Energies 16 06487 g016
Figure 17. Mean contact pressure and coefficient of variation of MEA under different operating conditions.
Energies 16 06487 g017
Figure 18. Average contact pressure of gasket for different operating conditions.
Energies 16 06487 g018
Table 1. Material parameters for PEMFC components.
PartMaterialsModulus of Elasticity (Mpa)Poisson’s Ratio
(/°C)
Density
(kg/m3)
Thermal Conductivity
(/W·m−1·°C−1)
Coefficient of Thermal Expansion (/10−6)Specific Thermal Capacity/(/J·kg−1·°C−1)
End plateAlloy137,8000.332850217.722.2880
Bipolar PlateStainless steel210,0000.30785016.318510
GasketRubber60 HA11000.25771400
FramePolymer10,0000.289000.4781200
PEMNafion®112NeglectedNeglectedNeglectedNeglected123Neglected
GDLCarbon cloth6.30.094001.70.8710
InsulatorNylon15,0000.110001.41371500
Collector plateCopper100,0000.33892040116.6390
Bolts–NutsStainless steel210,0000.30785016.318510
Table 2. Material parameters of the rubber in the model.
HA3040506070
C100.128790.182340.256180.359920.50567
C010.0455850.045590.064050.089980.12642
Disclaimer/Publisher’s Note: The statements, opinions and data contained in all publications are solely those of the individual author(s) and contributor(s) and not of MDPI and/or the editor(s). MDPI and/or the editor(s) disclaim responsibility for any injury to people or property resulting from any ideas, methods, instructions or products referred to in the content.

