Article

Numerical Modeling of Shale Oil Considering the Influence of Micro- and Nanoscale Pore Structures

Research Institute of Petroleum Exploration and Development, No. 20 Xueyuan Road, Haidian District, Beijing 100083, China
*
Author to whom correspondence should be addressed.
Energies 2023, 16(18), 6482; https://doi.org/10.3390/en16186482
Submission received: 29 July 2023 / Revised: 16 August 2023 / Accepted: 26 August 2023 / Published: 8 September 2023

Abstract

:
A shale reservoir is a complex system with lots of nanoscale pore throat structures and variable permeability. Even though shale reservoirs contain both organic and inorganic matter, the slip effect and phase behavior complicate the two-phase flow mechanism. As a result, understanding how microscale effects occur is critical to effectively developing shale reservoirs. In order to explain the experimental phenomena that are difficult to describe using classical two-phase flow theory, this paper proposes a new simulation method for two-phase shale oil reservoirs that takes into account the microscale effects, including the phase change properties of oil and gas in shale micro- and nanopores, as well as the processes of dissolved gas escape, nucleation, growth and aggregation. The presented numerical simulation framework, aimed at comprehending the dynamics of the two-phase flow within fractured horizontal wells situated in macroscale shale reservoirs, is subjected to validation against real-world field data. This endeavor serves the purpose of enhancing the theoretical foundation for predicting the production capacity of fractured horizontal wells within shale reservoirs. The impact of capillary forces on the fluid dynamics of shale oil within micro- and nanoscale pores is investigated in this study. The investigation reveals that capillary action within these micro- and nanoscale pores of shale formations results in a reduction in the actual bubble point pressure within the oil and gas system. Consequently, the reservoir fluid persists in a liquid monophasic state, implying a constrained mobility and diminished flow efficiency of shale oil within the reservoir. This constrained mobility is further characterized by a limited spatial extent of pressure perturbation and a decelerated pressure decline rate, which are concurrently associated with a relatively elevated oil saturation level.

1. Introduction

Shale reservoirs exhibit distinct features encompassing the proliferation of micro- and nanoscale pores along with elevated organic content, which collectively contribute to the manifestation of significant reservoir heterogeneity. The intricate interactions occurring at the liquid–solid interface under diverse occurrence states present substantial challenges when attempting to anticipate the flow dynamics of shale oil. Consequently, these challenges considerably hinder the effective advancement of unconventional shale oil development within our nation. The conventional permeability theory rooted in Darcy law falls short in precisely depicting the microscopic flow phenomena transpiring within shale formations under intricate conditions. As a result, the precise mechanism underlying the slippage of liquid hydrocarbons within nanoscale pores in shale remains elusive. The dominance of nanoscale pore velocity slip and other factors further complicates the understanding of the transport behavior of liquid hydrocarbons in different occurrence states within multiscale pore spaces, ultimately affecting the accuracy of predicting reservoir flow parameters [1,2,3,4].
Shale rocks exhibit an intricate and complex composition. Using X-ray diffraction mineral analysis, Ambrose and colleagues [5] found that shale reservoirs are made up of two separate components: organic and inorganic. The organic matter is classified as oil-wet kerogen, while the inorganic component includes hydrophilic minerals, such as quartz and clay minerals. These minerals exhibit different surface properties, leading to significant variations in their interaction mechanisms with fluids. Although many scholars have studied the flow mechanisms of gas in shale, the molecular diffusion of liquids is less pronounced compared to shale gas. Liquid–solid surface interactions are strong, and slip phenomena in microscale flows are more complex than in gas flows [6,7]. Song Fuquan [8] investigated the surface wetting and slip phenomena in liquid argon Poiseuille flow between parallel plates using molecular dynamics simulations as an example. Wang et al. [9,10,11,12] employed nonequilibrium molecular dynamics simulation methods within nanoscale pore throats to explore the microscopic flow behavior of methane, revealing significant differences in the flow characteristics of alkanes within pores with different mineral compositions. Attributable to disparities in frictional interactions between fluids and solids, the velocity of oil flow is most rapid within pores constituted by organic matter, followed by those composed of quartz, and notably slower within pores constituted by calcite. The slip length of saline water flowing over organic matter in shale was measured by Javadpour et al. [13] through atomic force microscopy. They developed a preliminary model for calculating the apparent permeability of liquids and found that the apparent permeability of liquids is significantly greater than the intrinsic matrix permeability. Most of the aforementioned studies are molecular simulation studies conducted in nanoscale channels. Arora et al. [14] constructed molecular dynamics structural models of curved single-layer carbon nanotubes using a splicing method and simulated diffusion mechanisms of pure N2 and pure O2 inside curved carbon nanotubes. The wettability and surface energy of reservoir rocks vary greatly with different mineral compositions. Zhang [15] conducted an extensive investigation on the wettability of clay minerals’ surfaces, examining the impact of surface functional groups and mineralization on the wettability of reservoir surfaces. The study suggested that salt ions adsorbed on clay surfaces promote greater hydrophilicity. Wang et al. [9] used molecular simulations to show that the wetting angle of water in shale pores decreases with decreasing pore sizes, with a concomitant increase in the mercury contact angle. Chang et al. [16] systematically investigated the natural wettability of nanoscale rock surfaces, exploring the interactions between dodecane molecules and water molecules with rock surfaces. Graphene-dodecane bonding is more robust than water bonding, explaining why different rocks have different wettability properties at a microscopic scale. Research on fluid transport in nanopores forms the foundation of understanding microscale flow mechanisms. Many experts and scholars have investigated the flow behavior of different fluids in carbon nanotubes. Majumder et al. [13] investigated the augmented flow behavior of water, n-hexane, ethanol and alkanes within multilayered carbon nanotubes. The investigation revealed that the dimensions of the composite membrane were 4 to 5 orders of magnitude greater than values derived from calculations based on the slip-free Hagen–Poiseuille (HP). The determined slip length spanned from 3–70 µm, significantly surpassing the radius of the nanotubes (7 nm). Furthermore, owing to the robust interaction between liquid hydrocarbon molecules and the surface of carbon nanotubes, the slip length diminishes as the fluid exhibits increased hydrophobic characteristics. Whitby and Quirke [17,18] experimentally studied the water flow inside carbon nanotubes and discovered that the flow velocity of water in carbon nanotubes was 560 to 8400 times higher than the results calculated using the slip-free HP equation. Molecular dynamics simulations have been used by Falk et al. [19] to compute the coefficients of friction that govern the flow of fluids in carbon nanotubes with different radii and geometrical configurations. Their research also evaluated the augmentation factor of the Hagen–Poiseuille (HP) flow when slip was absent. In their work, Wu et al. [20] succinctly outlined the mechanisms governing water transport within nanopores, identifying noteworthy fluctuations in water flow dynamics contingent upon the relative intensity of interactions between liquid molecules and the boundaries of the nanopores. The aforementioned foundational theoretical studies mainly focused on the flow analysis and characterization of water or other fluids in carbon nanotubes. Wang et al. [9] introduced the concepts of “slip length” and “apparent viscosity” and developed mathematical models for alkane flow in nanoscale pore throats composed of different minerals. They established relationships between slip length and pore size, among other factors. Cui et al. [21] built an apparent permeability calculation model for liquids in organic nanopores based on the Mattia and Calabro [22] model. The study indicated the absence of initiation pressure gradients and nonlinear flow characteristics in oil within kerogen and that the physical adsorption of liquid hydrocarbons has a minimal impact on the permeability of organic matter nanopores. Zhang et al. [23] expanded the aforementioned model and mathematically represented a flow model considering the oil flow in both organic matter and nonorganic matter. In this manuscript, a numerical simulation framework is developed to address the intricate fluid flow dynamics within micro- and nanoscale pores of shale reservoirs. Specifically, the study focuses on mathematically characterizing the slip phenomenon prevalent in these pores. Leveraging the concept of apparent permeability, the slip effect is integrated into the foundational mathematical formulation of flow within porous media. Consequently, an advanced numerical simulation model is established, encapsulating the influence of micro- and nanoscale pores in shale oil dynamics. The construction of this model presents a novel avenue for the evaluation of shale oil reservoirs, thereby contributing a pioneering technological approach to reservoir assessment.

2. Microscale Effects in Shale Oil Reservoir

2.1. Stochastic Apparent Permeability Model

Fluids in porous media are usually transported in tortuous capillaries with a constant radius, according to researchers (Figure 1A). Natural porous media (like shale) have pores and throats, so fluid transport paths have variable radiuses. To clarify the oil transport process within shale formations, a modification has been made to the capillary model that previously relied on a constant radius assumption. This improved version of the model involves incorporating considerations for variable radii, as shown in Figure 1B. Capillaries with a constant radius are used to represent pores in this model (I, III and V in Figure 1B), and the throats are represented by the variable radius part between two pores (II and IV in Figure 1B).
Based on the no-slip H-P equation, the volumetric flow rate in a capillary with a constant radius is as follows:
Q n o s l i p = π r 4 8 μ b o Δ p l
where Q n o s l i p is the no-slip volumetric flow rate; r is the capillary radius; μ b o is the bulk oil viscosity; Δ p is the pressure drop across the capillary; and l is the length of the tortuous capillary.
There are two different types of pores and throats in the shale: (1) pores and throats in organic matter and (2) pores and throats in the inorganic matrix. The sizes of the two types are mostly at a nanometer scale. Therefore, slip and viscosity correction of Equation (1) is needed, which can be expressed as
Q s l i p = π r 4 8 μ e f f + π l s r 3 2 μ i o Δ p l
where Q s l i p is the volumetric flow rate corrected by slip and viscosity; μ e f f is the adjusted viscosity that takes into account the influence of spatial variations in viscosity; μ i o is the oil viscosity near the wall; and l s is the slip length.
The slip length is a parameter characterized as the theoretical distance from the surface at which the extrapolation of the tangential velocity attains zero. For a smooth wall without dissolved gases, it is possible to calculate the slip length in terms of the contact angle.
l s = C s 1 + cos α 2
where α is the oil–wall contact angle; C s = 0.41 is used in this work.
Based on the varying impact of wall molecular forces, the oil molecules within the nanotubes can be classified into two distinct regions: the interface region in proximity to the wall and the bulk region, as illustrated in Figure 1B. The viscosity of the oil within the interface region differs from that within the bulk region. Specifically, in nanopores embedded within organic matter, the substantial interactions between oil and the pore walls result in an elevated viscosity for the interface oil compared to the bulk oil viscosity [25,26,27]. In contrast, for nanopores in an inorganic matrix, the interface oil viscosity is smaller than the bulk oil viscosity. According to MDS results, the thickness of the interface region for oil in nanotubes is about 0.98 nm [28,29,30]. By employing experimental data and MDS data, it is possible to establish an expression governing the relationship of oil viscosity between these two distinct regions:
μ i o = 0.018 α + 3.25 μ b o
To account for the effect of the viscosity difference between two regions, the effective viscosity is introduced.
μ e f f = μ i o A i o A t + μ b o A b o A t
where A i o , A b o and A t represent the area of the interface, the bulk and the entire tube. The relationship between these parameters can be expressed as follows: A t = A i o + A b o .
By analogy with the definition of resistance in electrical theory, the hydrodynamic resistance of oil transport in a nanotube can be expressed as follows:
R s l i p = Δ p Q s l i p = l π r 4 8 μ e f f + π l s r 3 2 μ i o 1
The mass flow rate through organic micro- and nanoscale pores can be expressed as follows:
J o r g = Q s l i p ρ o = π r 4 8 μ e f f + π l s r 3 2 μ i o Δ p l ρ o
where Jorg is the organic matter mass flow rate and ρ o is the density of shale oil.
The mass flow rate of inorganic micro- and nanoscale pores is as follows:
J i o r g = Q s l i p ρ o = π r 4 8 μ e f f Δ p l ρ o
where Jiorg is the inorganic matter mass flow rate.
The main types of porous media in shale include organic porous media within the kerogen and inorganic porous media within the matrix. Therefore, considering the absence of mass exchange between the inorganic and organic porous media, the introduction of the organic porosity content β allows us to obtain the coupled mass flow rate within the shale porous media. Among them, the porosity content of organic matter β is approximately replaced by the TOC in shale reservoirs.
J t = 1 β J i o r g + β J o r g = Δ p l ρ o 1 β π r 4 8 μ e f f + β π r 4 8 μ e f f + π l s r 3 2 μ i o
where J t is the coupled mass flow rate within the porous medium and   β is the dimensionless organic porosity content of shale.
The expression for mass flow rate in Darcy’s law is given as follows:
J v = ρ o K o μ e f f Δ p
Equations (9) and (10) are used to express the apparent permeability of porous media in shale:
k α = 1 β π r 4 8 μ e f f + β π r 4 8 μ e f f + π l s r 3 2 μ i o μ e f f l
Building upon the aforementioned equation, it becomes feasible to construct a mathematical model that elucidates the dynamics of two-phase flow involving oil and water within the porous medium of a shale reservoir.
t ϕ m ρ o ρ o s c S o + ( ρ o ρ o s c K α k r o μ o p o ρ o g z ) = q o m i = 1 N f q o m , i f
t ϕ m ρ w ρ w s c S w + ( ρ w ρ w s c K α k r w μ w p w ρ w g z ) = q w m i = 1 N f q w i m , i f
where ϕ m is the pore volume,   ρ o s c , ρ w s c are the densities of the oil–water two-phase system under standard surface conditions,   z is the altitude variation, S o , S w are the saturation of oil and saturation of water, k r o , k r w are the relative permeability values of oil and water, N f is the number of fractures, q o m , i f , q w i m , i f are the fluid flux between the i-th fracture and the matrix for oil and water, and q o m , q w m are the source and sink terms of oil and water in the matrix.
For the problem of the channeling flow between fracture and matrix. The model developed in this paper uses the embedded discrete fracture model (EDFM), where the expression of the channeling flow between the matrix and the fracture is shown in Formula (14).
T i k N N C = K μ A i k d i k
where K is the fracture permeability, A i k is the area of intersection between the fracture grid and matrix grid, and d i k is the average normal distance from the matrix mesh to the fracture mesh.

2.2. Phase Change Characteristics in Micro- and Nanopores

Shale reservoirs have developed nanoscale pores, and the influence of capillary forces on the flow of oil and gas in both phases is not negligible. Combining the capillary force model with the thermodynamic equation of state can effectively describe the characteristics of oil and gas phase change in shale micro- and nanopores. The Peng–Robinson equation demonstrates a remarkable level of accuracy when applied to computations involving saturated vapor pressure, the molar volume of the liquid phase and similar properties. When the oil and gas system contains n components, taking the oil phase as an example, the fugacity coefficient of each component can be expressed as follows:
l n ϕ i = b i b Z 1 ln P V b R T a 2 2 b R T 2 x j a i j a b i b ln V + 2.414 b V 0.414 b
According to the mixing rule, the expressions a and b can be obtained as follows:
a = i = 1 n j = 1 n x i x j a i a j 1 k i j
b = i = 1 n x i b i
where x i is molar proportion of component i in the oil phase, with no factorization; x j is themolar proportion of component j in the oil phase, with no factorization; and k i j signifies the binary interaction coefficient between components i and j, with no factorization.
The expression of the capillary force in shale nanopores is given by the following:
f i l = x i ϕ i l p l
where p g is the gas-phase pressure, 10−6 MPa; p l is the oil-phase pressure, 10−6 MPa; σ   is the oil–gas interfacial tension, N·m−1; θ is the wetting angle, °; and r is the pore radius, m.
The oil–gas interfacial tension can be expressed as follows:
σ = i n K i x i ρ l ¯ y i ρ g ¯ 4
where K i   is the isotropic specific volume of component i, cm3·mol−1·mJ−1/4·m−1/2; y i is the molar fraction of component i in the gas phase, which is factorless; ρ l ¯ is the molar density of the oil phase, mol·cm−3; and ρ g ¯ is the molar density of the gas phase, mol·cm−3.
The pressures and chemical potentials of the oil and gas phases become equal as soon as the fluid reaches the two-phase equilibrium between the gas and liquid inside the nanopore:
f i g = f i l
σ = i n K i x i ρ l ¯ y i ρ g ¯ 4
Then,
f i g = y i ϕ i g p g
f i l = x i ϕ i l p l
The following relationship exists at the bubble point (saturation pressure):
i = 1 n y i = 1
The following relationship exists at the dew point:
i = 1 n x i = 1
In the scenario of diminutive pore radii, the capillary force exerts a heightened influence, leading to a discernible deviation between the actual bubble pressure and the bulk phase’s bubble pressure. The impact of the pore radius on the bubble point pressure diminishes with an elevation in the methane molar fraction. Given that nanoscale pores dominate the spatial composition of shale reservoirs, it becomes imperative to incorporate the influence of capillary forces in simulating the phase change attributes of oil and gas during two-phase flow within shale oil systems.

2.3. Shale Oil Reservoir Two-Phase Flow Mechanism

After the pressure drops to the saturation pressure, the dissolved gas in the reservoir undergoes a process of gas bubble nucleation, growth and coalescence, ultimately forming a continuous gas phase as the reservoir pressure decreases. The pore throat size of shale reservoirs is much smaller than that of conventional reservoirs. The continuous gas phase formed after gas bubble coalescence is subjected to the shear effect of the shale nanopore structure during flow and is then divided into dispersed gas bubbles.
When the reservoir pressure is high, the interfacial tension between oil and gas is small, and gas bubbles are not prone to coalesce. The coalescence rate of gas bubbles is smaller than the breakup rate, so gas bubbles mainly exist in a dispersed state in the pore space and cannot form a two-phase fluid flow of oil and gas. As the reservoir pressure further decreases, the interfacial tension between oil and gas gradually increases, and the coalescence rate of gas bubbles increases. When the coalescence rate of gas bubbles surpasses the breakup rate, the dispersed gas bubbles undergo swift coalescence, culminating in the establishment of a two-phase fluid flow encompassing oil and gas. Considering the theory of heavy oil dissolved in the gas drive flow, the pressure at which gas bubbles begin to coalesce rapidly in the rock pores is defined as the pseudo-bubble point pressure. According to the comprehensive analysis presented above, the progression of the shale oil two-phase flow can be categorized into four distinct stages, contingent upon variations in the reservoir pressure. During the initial stage, characterized by a reservoir pressure surpassing the saturation pressure (determined within the PVT chamber), both oil and gas constituents within the reservoir persist in a liquid state. In the second stage, the reservoir pressure is lower than the saturation pressure but higher than the actual bubble point pressure. If the effect of capillary force is not considered, bubbles start to nucleate and grow at this time, but the effect of the capillary force of shale micro–nanopores causes the actual bubble point pressure of the oil and gas system to decrease, and the reservoir fluid still exists in a liquid form; in stage 3, the reservoir pressure is lower than the actual bubble point pressure but higher than proposed bubble point pressure, and, at this time, bubbles nucleate, grow and merge in the pore, and the continuous gas formed after merging is affected by the shearing effect of the shale micro–nanopore throat. At this time, bubbles nucleate, grow and merge in the pore space and are affected by the shearing effect of the shale micro–nanopore throat, and the continuous gas formed after merging is divided into small bubbles. The gas bubbles become a continuous gas phase, forming oil–gas two-phase flow, and the gas phase flow rate exceeds that of the oil phase, leading to a rapid increase in the production gas–oil ratio and a decrease in the oil drive efficiency.

3. Two-Phase Flow Shale Simulation and Model Validation

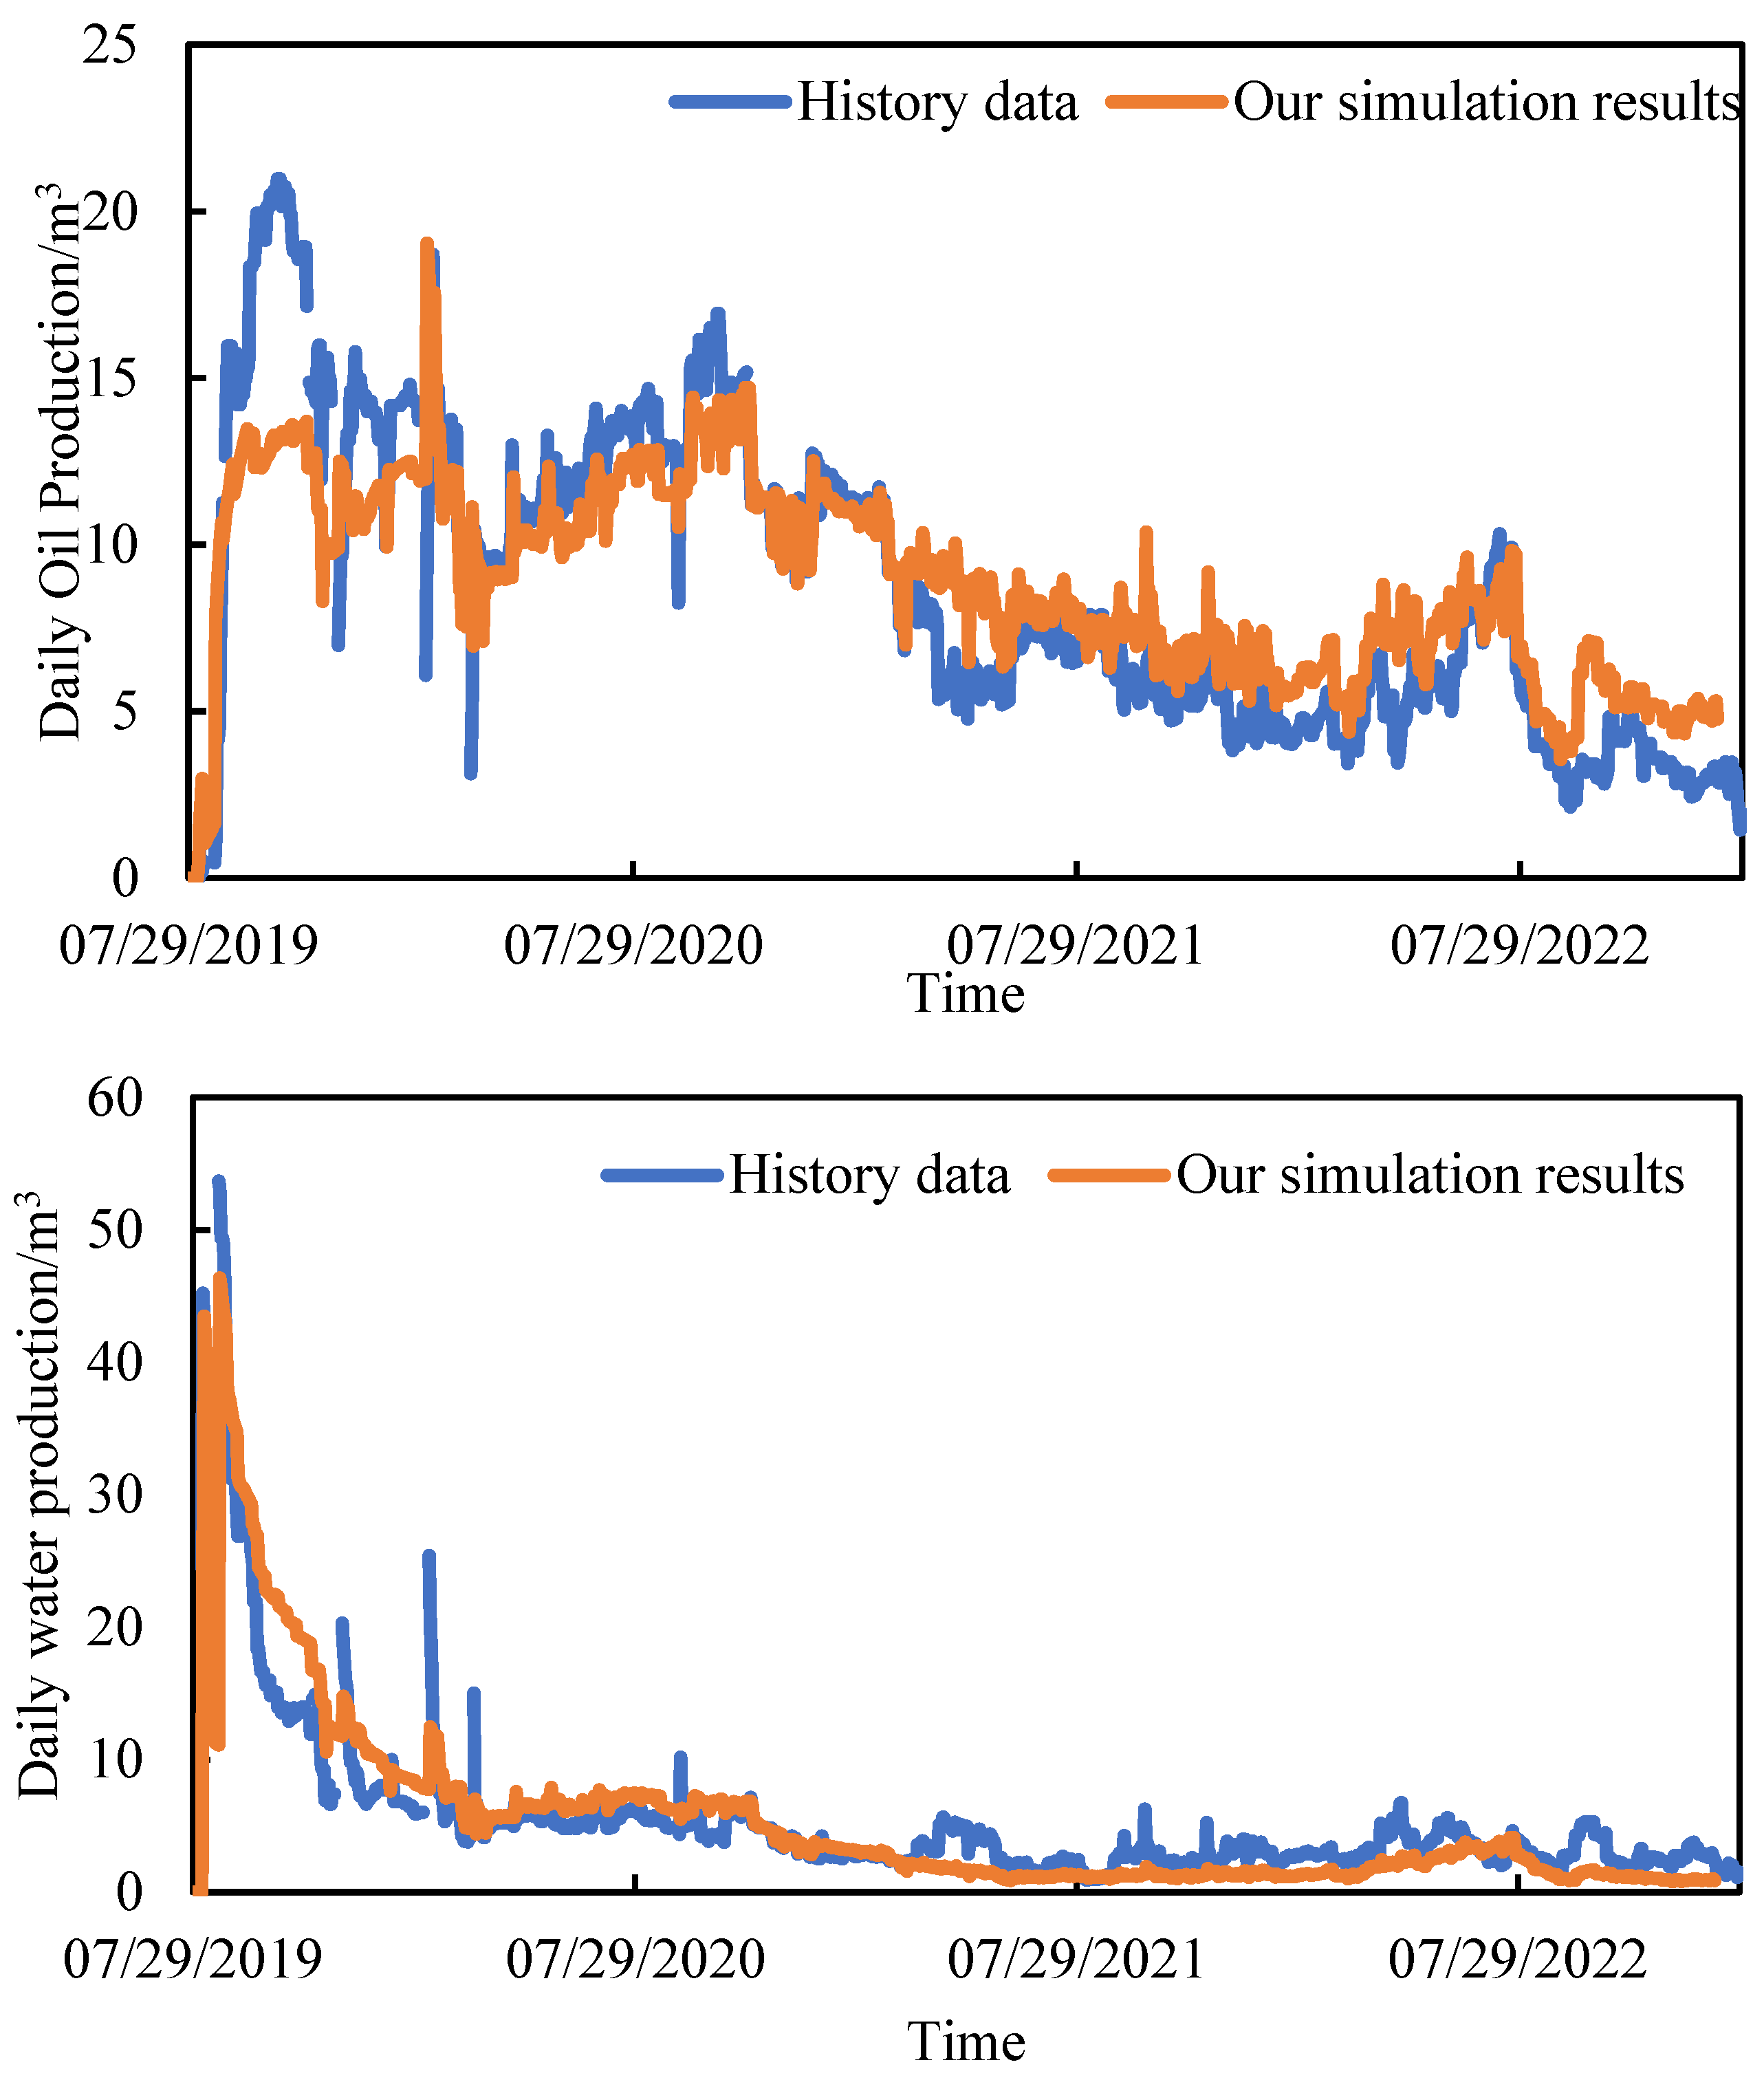
3.1. Model Validation

Historical fitting was executed employing empirical data extracted from a volumetric fractured horizontal well situated within the Changqing shale-oil-producing region in China (referred to as Changqing). The reservoir and fluid parameters pertinent to this analysis are outlined in Table 1. The adsorbed state oil per unit mass of shale to TOC ratio, adsorbed state oil recoverable per unit pressure difference to TOC ratio, and reaction frequency coefficients were determined by fitting production data as shown in Figure 2. Other model parameters were calculated following the numerical simulation characterization method of shale oil microscale flow in the reaction model. The overall permeability of the reservoir modification area is provided in the literature, so a single media model represents two-phase flow characteristics of this fractured horizontal well, assuming that the hydraulic fractures are equally spaced along the horizontal well, and a quarter of a single section of fractures is taken for simulation considering the symmetry of the model.
The changes in oil and gas production were simulated. They were derived from the real bottomhole pressure of the well, and the changes in the oil and gas production of the fractured horizontal well without considering the influence of shale nanopores were also simulated and compared with the production data. In scenarios where the influence of shale nanopores is disregarded, the theoretical calculation yields an approximate bubble point pressure of 28 MPa, extrapolated from the fluid component data available in the literature. Given that the bottomhole pressure registers below the bubble point pressure, the process of production leads to the liberation of dissolved gas, subsequently fostering the development of oil and gas two-phase flow. The simulated oil and gas production is therefore larger than the actual value. When factoring in the impact of shale nanopores, the bubble point pressure for both oil and gas phases decreases, leading to a higher bottomhole pressure. The fluid in the reservoir always remains in a single-phase liquid flow, resulting in a lower oil drive efficiency and reduced oil and gas production. Therefore, the simulation results are more in line with the real production.

3.2. Influence of Capillary Forces on Reservoirs Considering the Effects of Micro- and Nanoscale Pores

To conduct a more in-depth exploration of the impact exerted by micro- and nanoscale pores on the production and recovery scope of shale oil reservoirs, we extend the model by integrating capillary forces, as delineated in Equation (24). This augmentation enables us to capture the intricate influence stemming from the presence of micro- and nanoscale pores within shale oil reservoirs. Subsequently, we conduct a sensitivity analysis on the impact of introducing capillary forces on the mobilization of reservoir oil.
p c o w m = p o m p w m
where p c o w m is the capillary forces between oil and water phases; p o m is the oil phase pressure; and p w m is the water phase pressure.
Building upon the reservoir and fracture data elucidated in Table 1, we have developed a numerical conceptual model for shale oil reservoirs. We conducted a five-year production simulation considering the effects of capillary forces due to micro- and nanoscale pore considerations and compared it with a simulation without considering these effects. The cumulative oil production comparison curve is shown in Figure 3, which illustrates the impact of capillary forces on production over a five-year period when considering micro- and nanoscale pore effects. From Figure 3, it can be observed that incorporating capillary forces results in an approximately 6% lower oil production in shale oil reservoirs considering micro- and nanoscale pores over the five-year period.
The underlying rationale for this phenomenon stems from the intricate interplay of capillary forces, which are intrinsically influenced by the pore radius within the shale oil reservoir. Notably, the shale reservoir exhibits an exceptional prevalence of micro- and nanoscale pores, thereby inducing an intensified manifestation of capillary forces within the system. The consequential impact of these capillary forces is disproportionately pronounced in shaping the fluid migration behavior within the reservoir. As a result of the dominance of capillary effects, the cumulative oil production from the shale oil reservoir, when factoring in the influence of micro- and nanoscale pores, experiences a reduction of approximately 6%.
Through the aforementioned simulation, we obtained the variations in the oil saturation field and pressure field considering the effects of capillary forces with and without the consideration of micro- and nanoscale pores, as shown in Figure 4 and Figure 5. We analyzed the impact of including capillary forces and considering micro- and nanoscale pores on the pressure and flow field in shale oil reservoirs undergoing dynamic variations. From the figures, it can be observed that considering the effects of micro- and nanoscale pores leads to a smaller decline in the reservoir pressure and higher pressure values compared to the case where micro- and nanoscale pore effects are not considered. Moreover, analyzing the saturation field reveals that the oil saturation is generally higher when considering the effects of micro- and nanoscale pores compared to not considering them. This is attributed to the capillary forces acting on the micro- and nanoscale pores, which lower the actual bubble point pressure of the oil–gas system. As a result, the reservoir fluids exist predominantly in a liquid phase, limiting the mobility and flow efficiency of shale oil. Consequently, the pressure propagation range is smaller, and the pressure decline rate is reduced, resulting in a higher oil saturation.

3.3. Influence of Artificial Fractures on Productivity of Fractured Horizontal Wells in Shale Reservoirs

3.3.1. Fracture Number

The productivity of staged fractured horizontal wells within shale reservoirs is evaluated across various scenarios involving 6, 8, 10, 12 and 14 artificial fractures, respectively. The impact of different fracture numbers on productivity is scrutinized, as depicted in Figure 6. From the figure, it is observable that the number of artificial fractures mainly affects the initial phase of production from the horizontal well. The higher the number of artificial fractures, the greater the daily oil production and cumulative oil production, but, with the increase in the number of fractures, the increase in horizontal well productivity is smaller and smaller. In addition, the production of fracturing and nonfracturing in horizontal wells is quite different, so the shale reservoir has a better production effect after hydraulic fracturing.

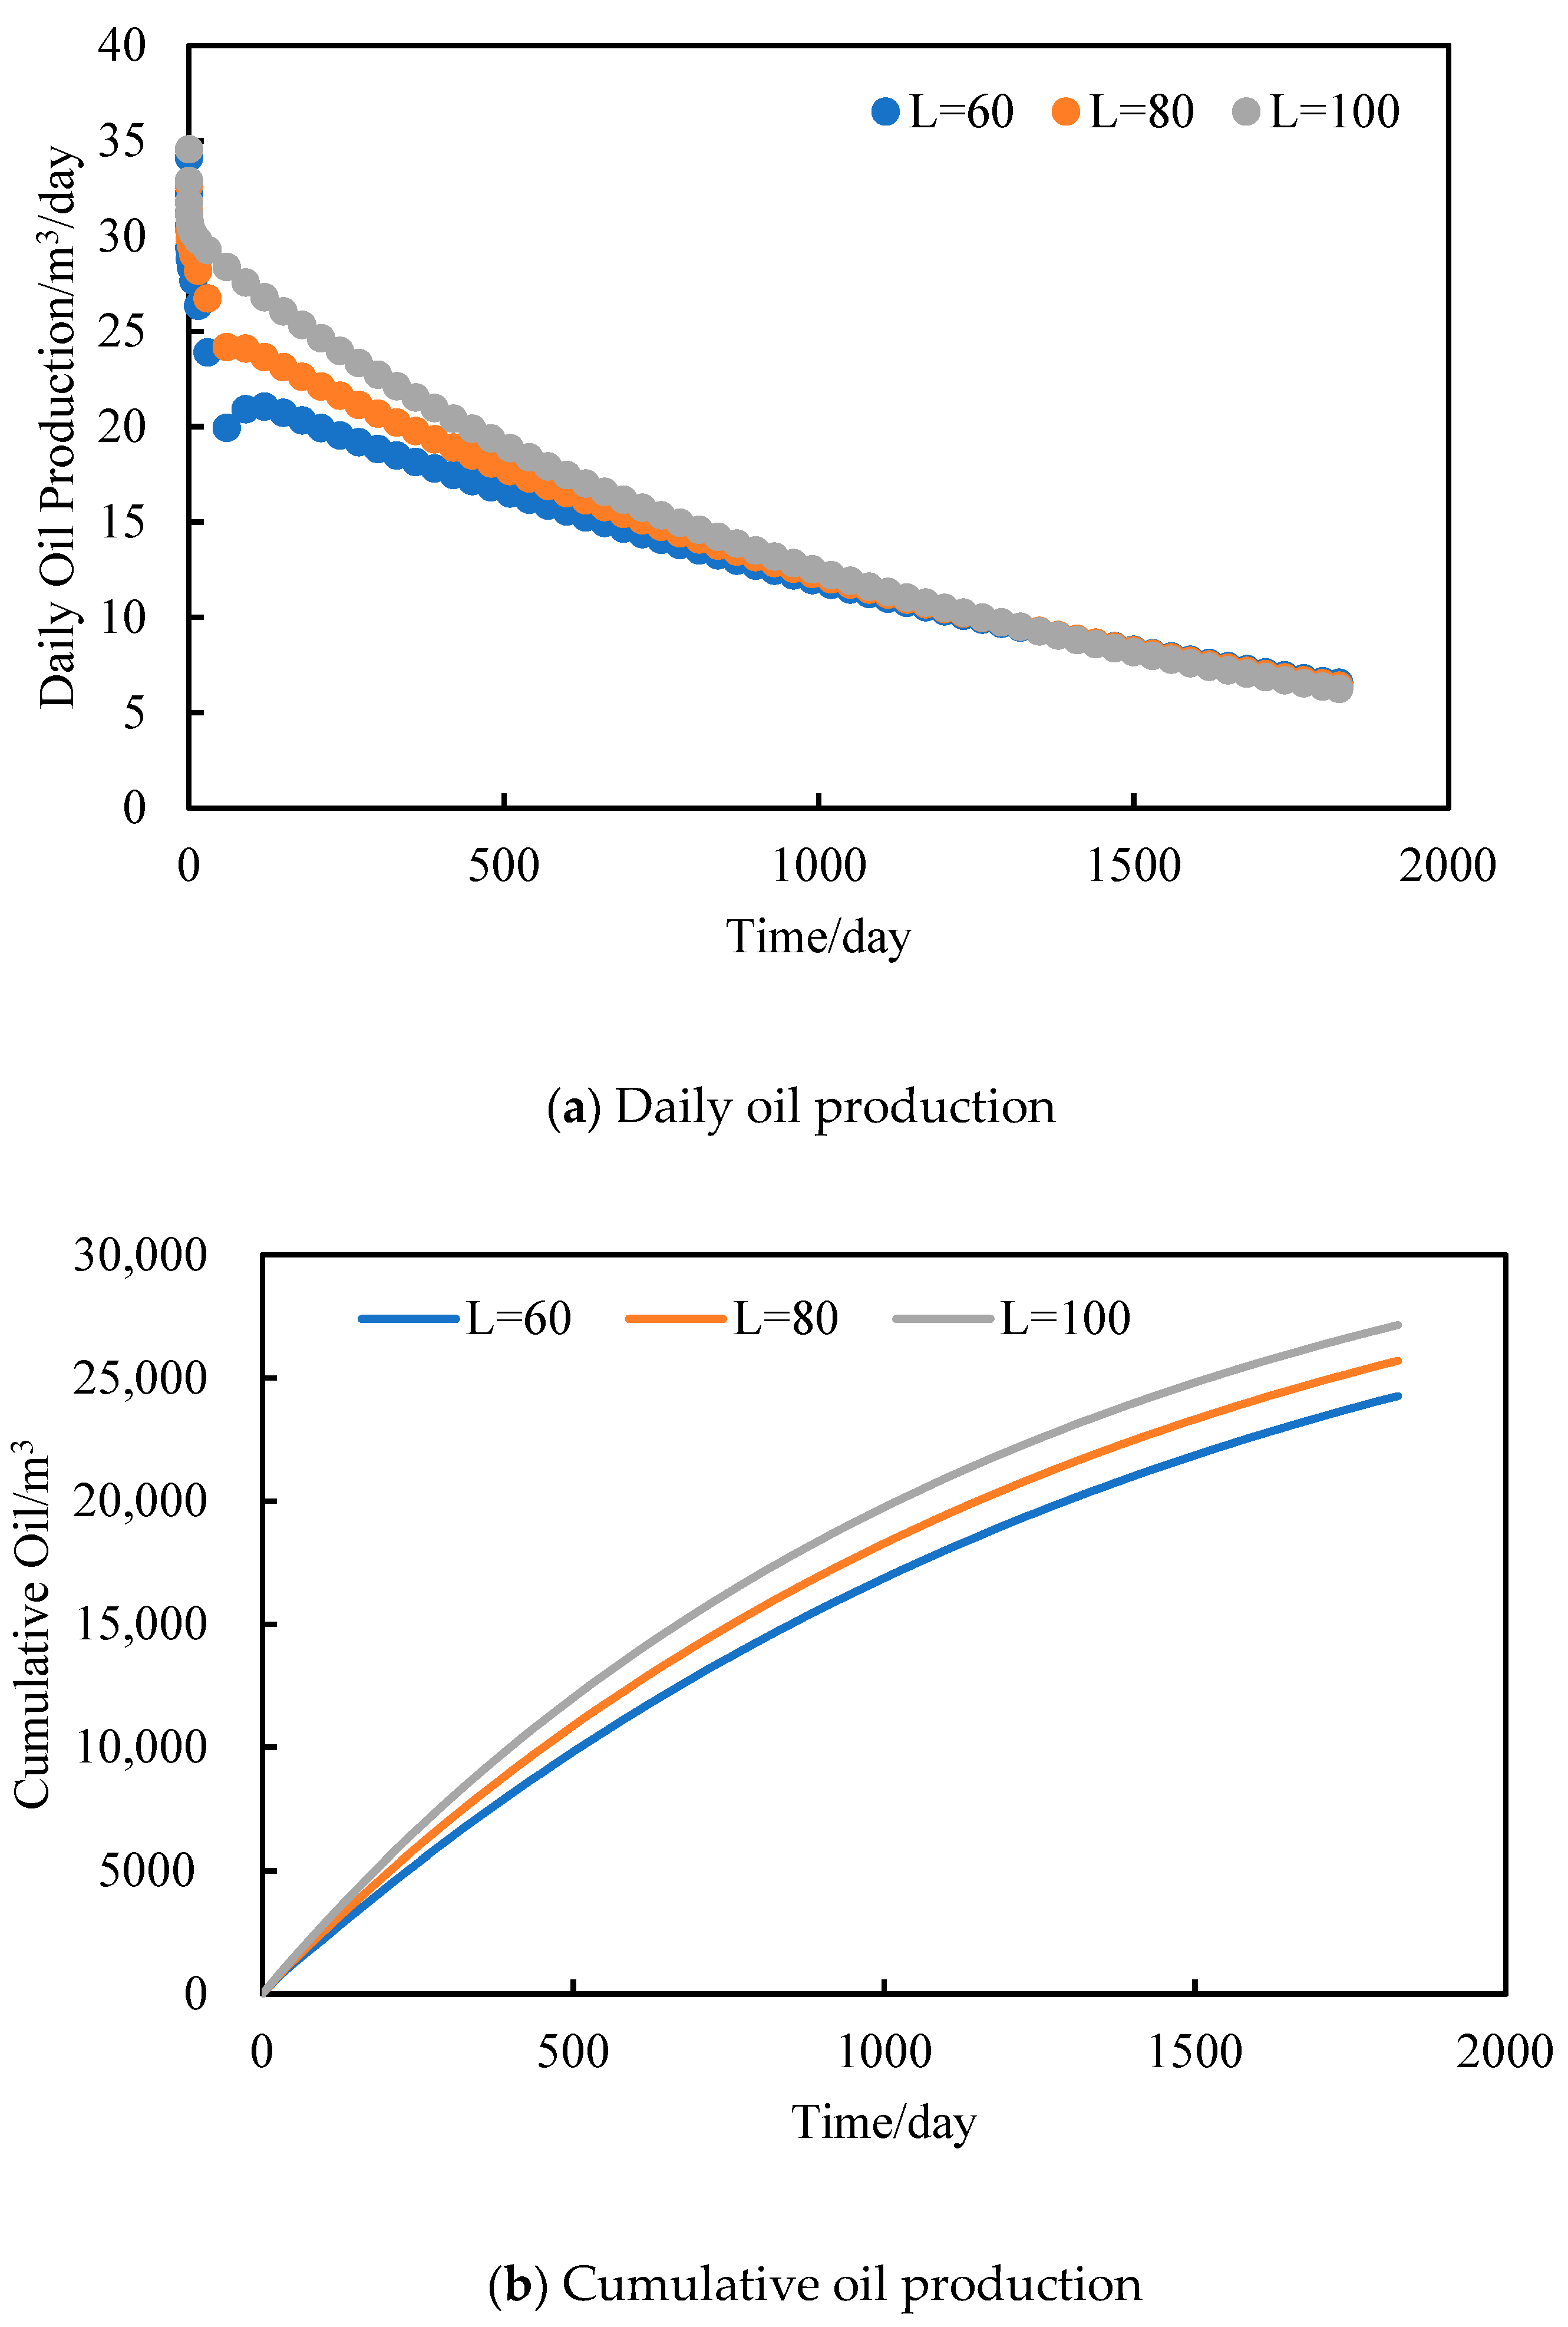
3.3.2. Fracture Spacing

Figure 7 illustrates the dynamic change in the productivity of fractured horizontal wells in shale reservoirs with micro–nano pores when the number of artificial fractures is fixed at 14 and the spacing of artificial fractures is 60 m, 80 m and 100 m. The graphical representation highlights that, under a constant number of fractures, an observable trend emerges: as the fracture spacing increases, the daily oil production of horizontal wells registers an elevation, accompanied by an augmented cumulative oil production. This is because, when the number of fractures is fixed, the larger the fracture spacing, the larger the area of fracturing transformation and the larger the range of artificial fractures, so the better the fracturing effect.

4. Conclusions

In this work, we derived the formula for the volumetric flow rate in a single nanotube with a variable radius and then formulated an apparent permeability model of a shale oil reservoir. Our study fully considers the impact of micro/nanopores on the flow of shale oil. The outcomes of our study elucidate the following:
(1)
By combining the capillary force model with the thermodynamic state equation and modifying the critical properties of each component, a reaction model can describe the flow mechanism of shale oil in different storage states and flow of dissolved gas, effectively characterizing two-phase flow characteristics of shale oil.
(2)
The oil and gas production rates of horizontal wells increase as a function of the enhancement of the vertical flow, and the impact of the vertical flow on shale oil production in a two-phase flow is more significant compared to a single-phase liquid flow. When the bottomhole pressure of the horizontal well is high, the oil and gas production rates are low. However, as the bottomhole pressure decreases, the elastic energy used for oil displacement increases, and more dissolved gas escapes from the crude oil, resulting in an increase in oil and gas production rates, with a greater increase in gas production compared to oil production.
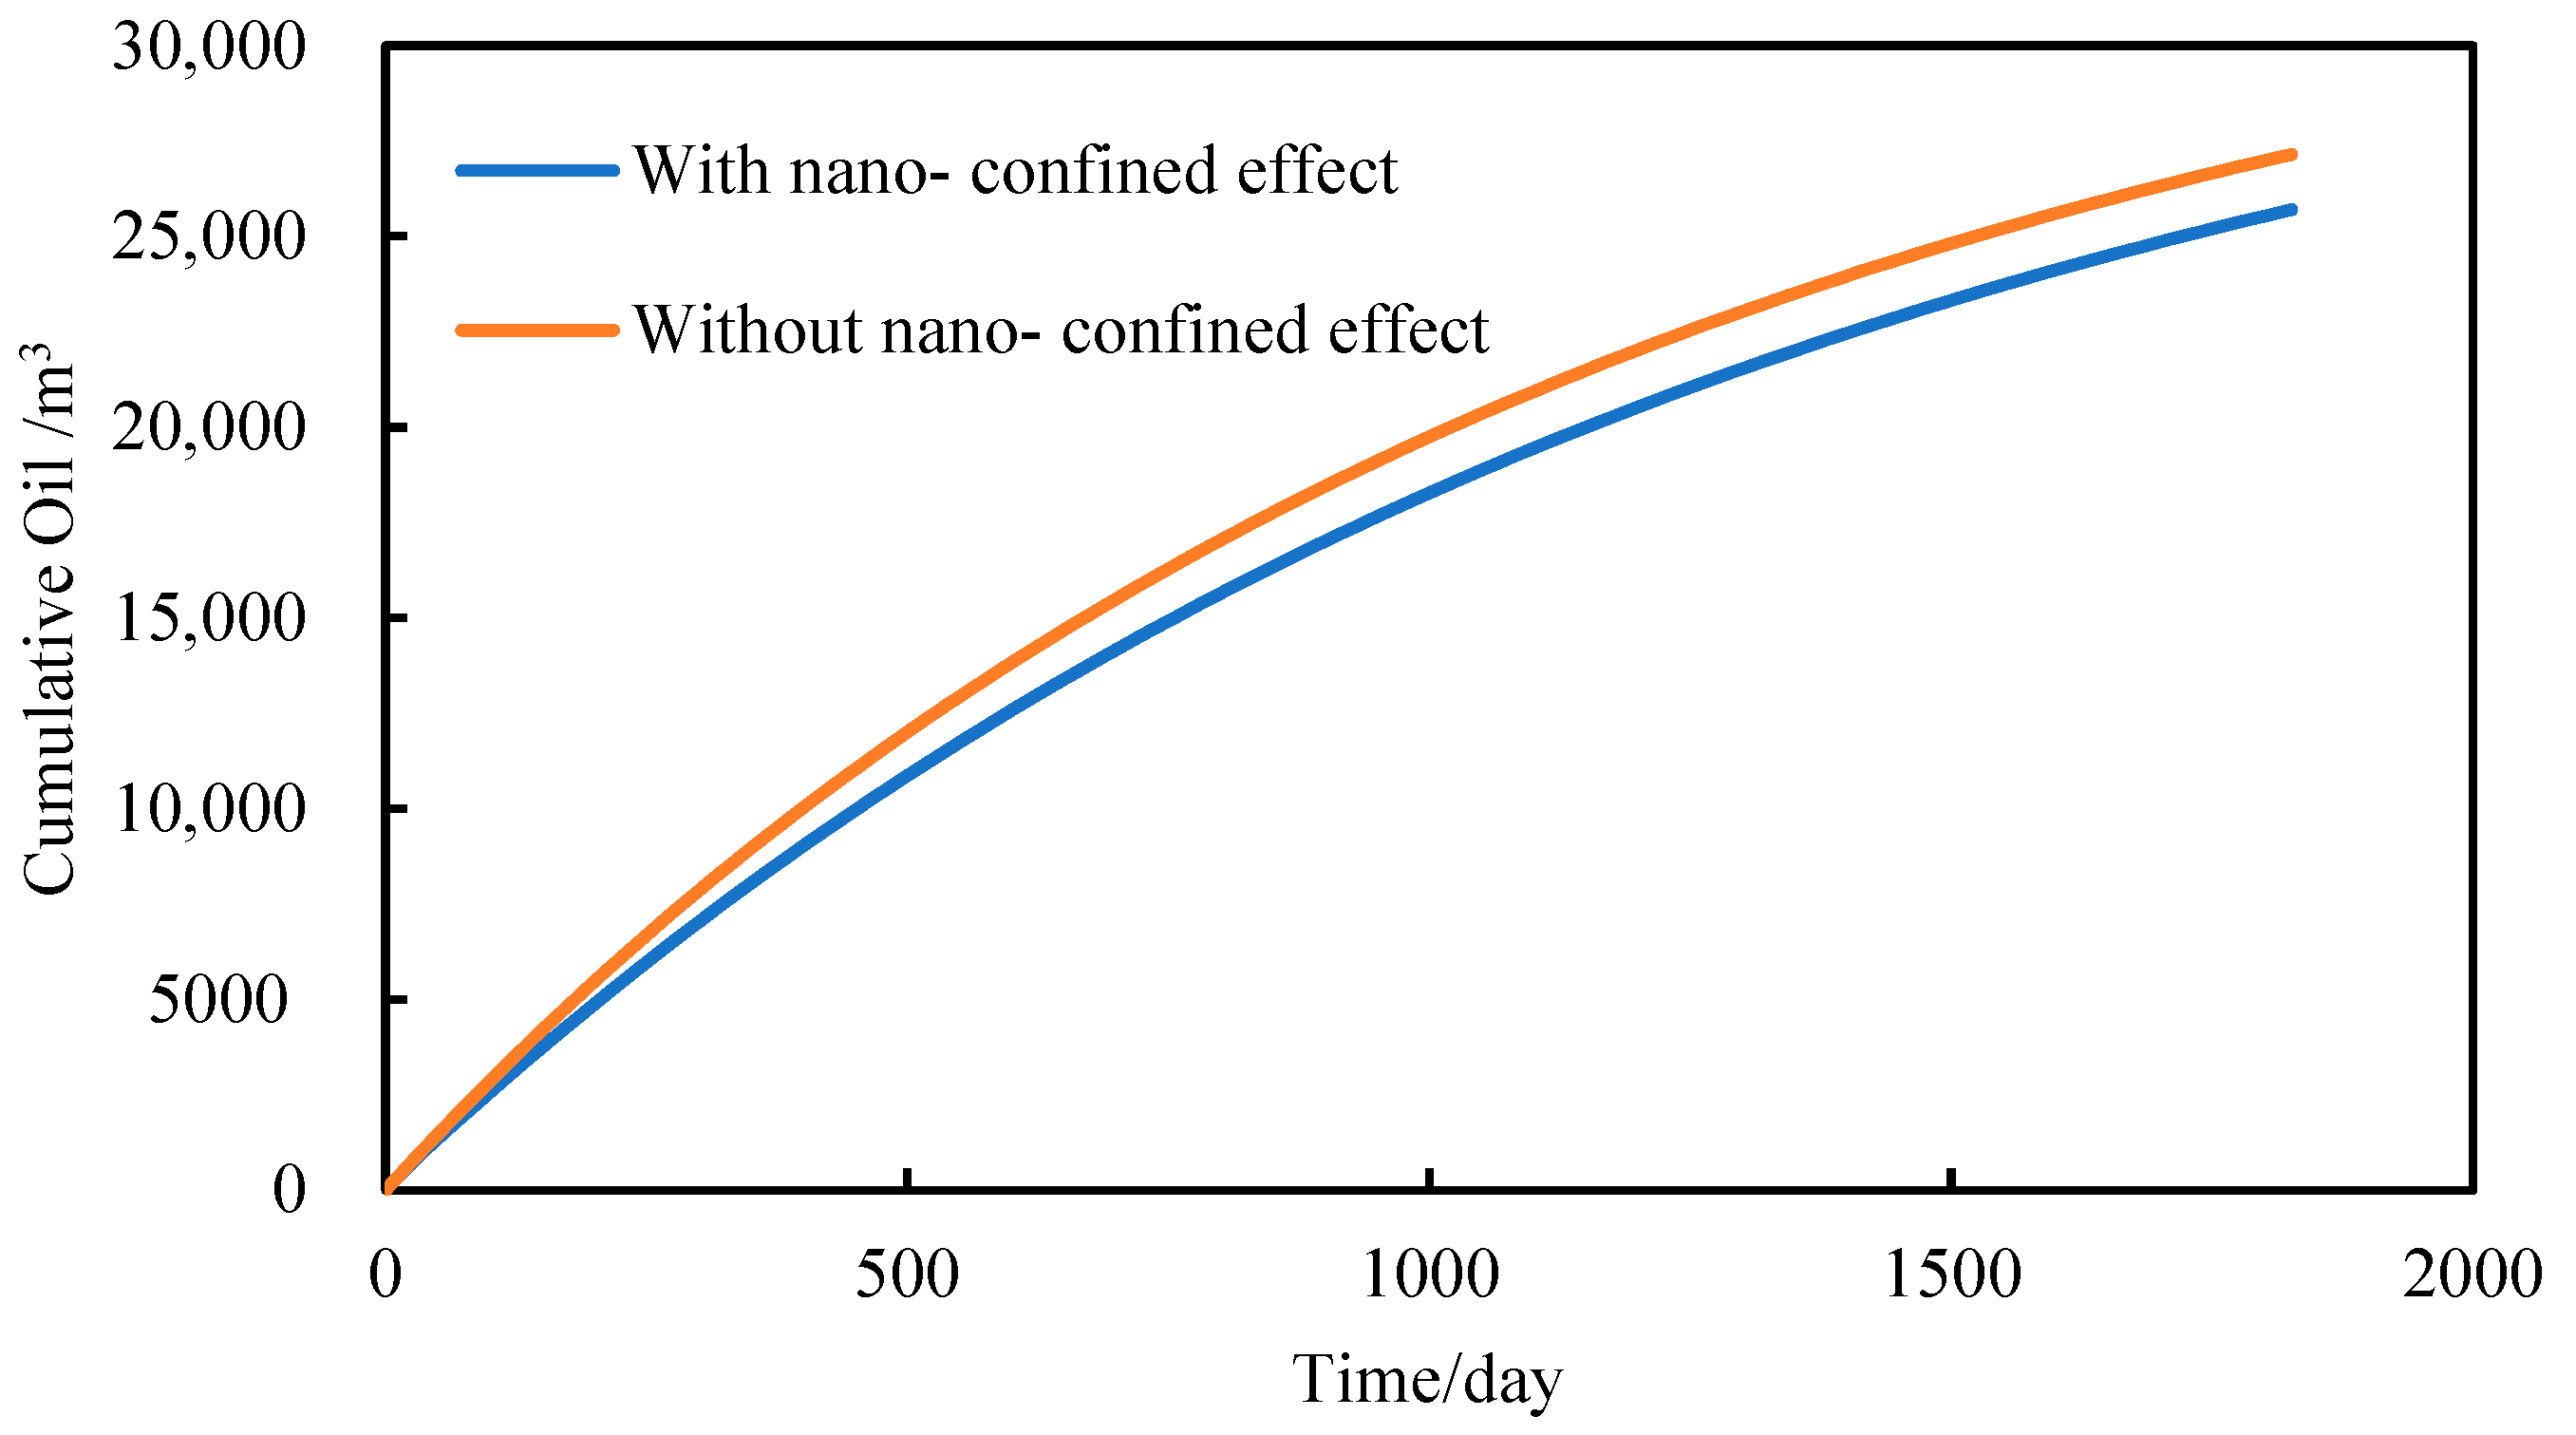
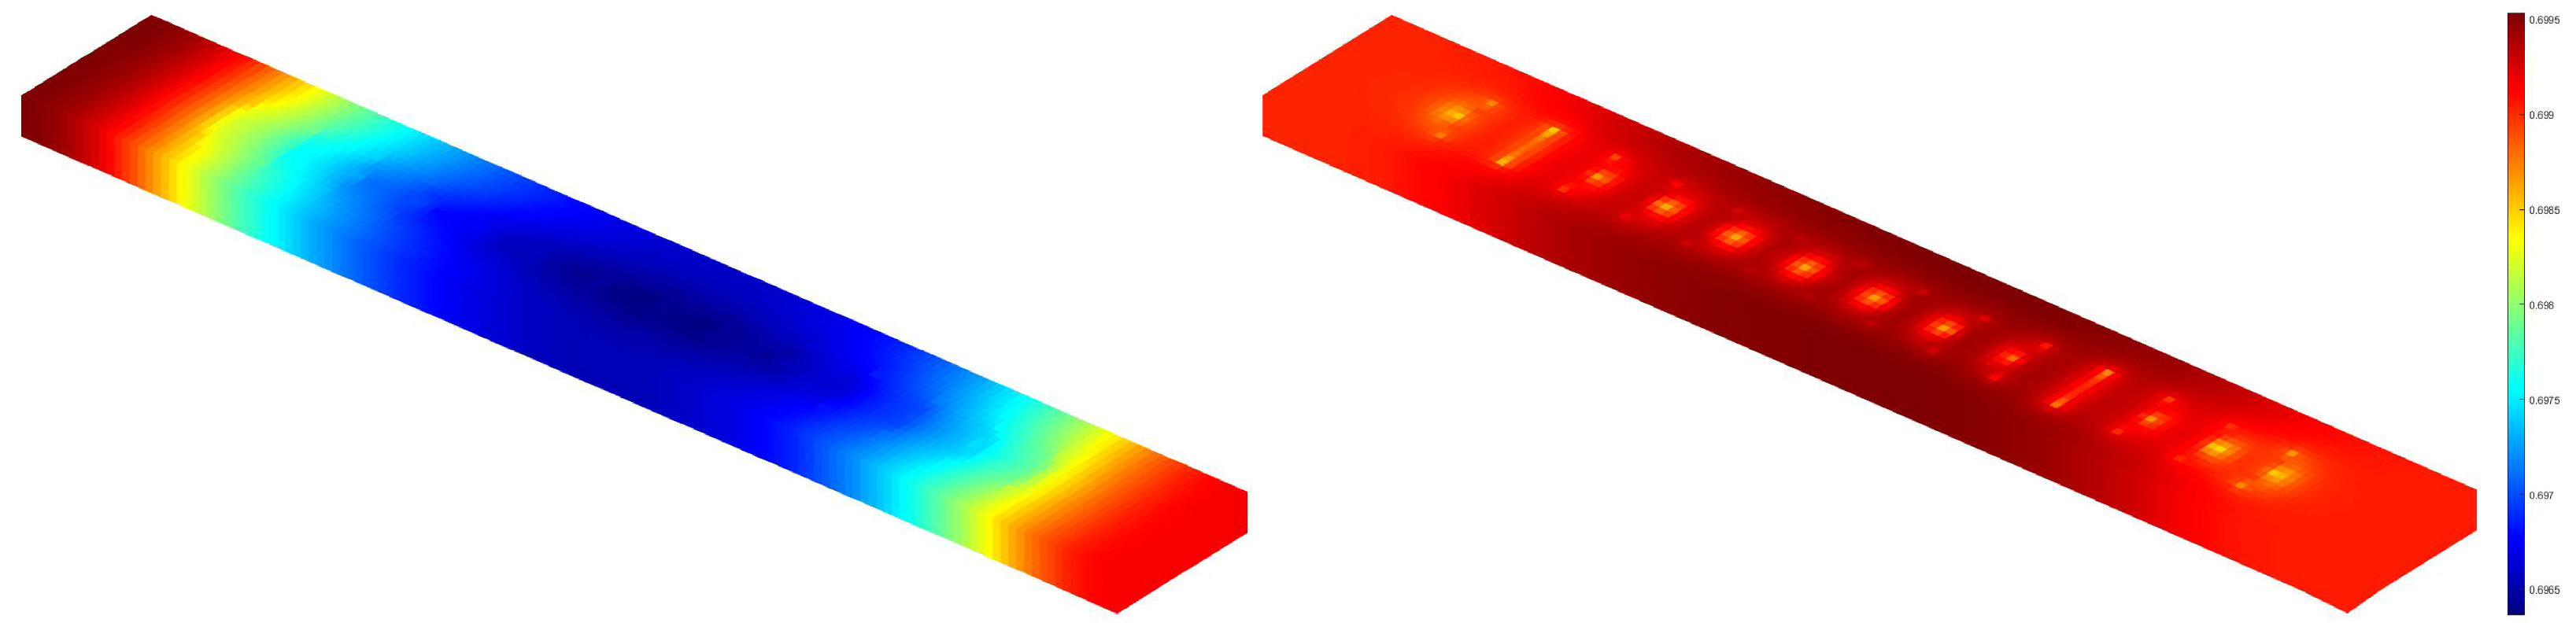
(3)
Upon analyzing the dynamic evolution of reservoir pressure fields and permeability fields with and without accounting for capillary forces, it is observed that the cumulative oil yield from shale oil, when considering the influence of micro- and nanoscale pores, is diminished by approximately 6% in comparison to the scenario without such consideration. Under the influence of micro- and nanoscale pores, the reservoir experiences heightened pressure fields and an elevated overall oil saturation distribution. This outcome is attributed to the capillary forces exerted by micro- and nanoscale pores within the shale. These capillary forces contribute to the reduction in the actual bubble point pressure within the oil and gas system. Consequently, the fluid within the reservoir remains in a monophasic liquid state, thus constraining the mobility of oil within the shale and subsequently leading to a reduced flow efficiency.
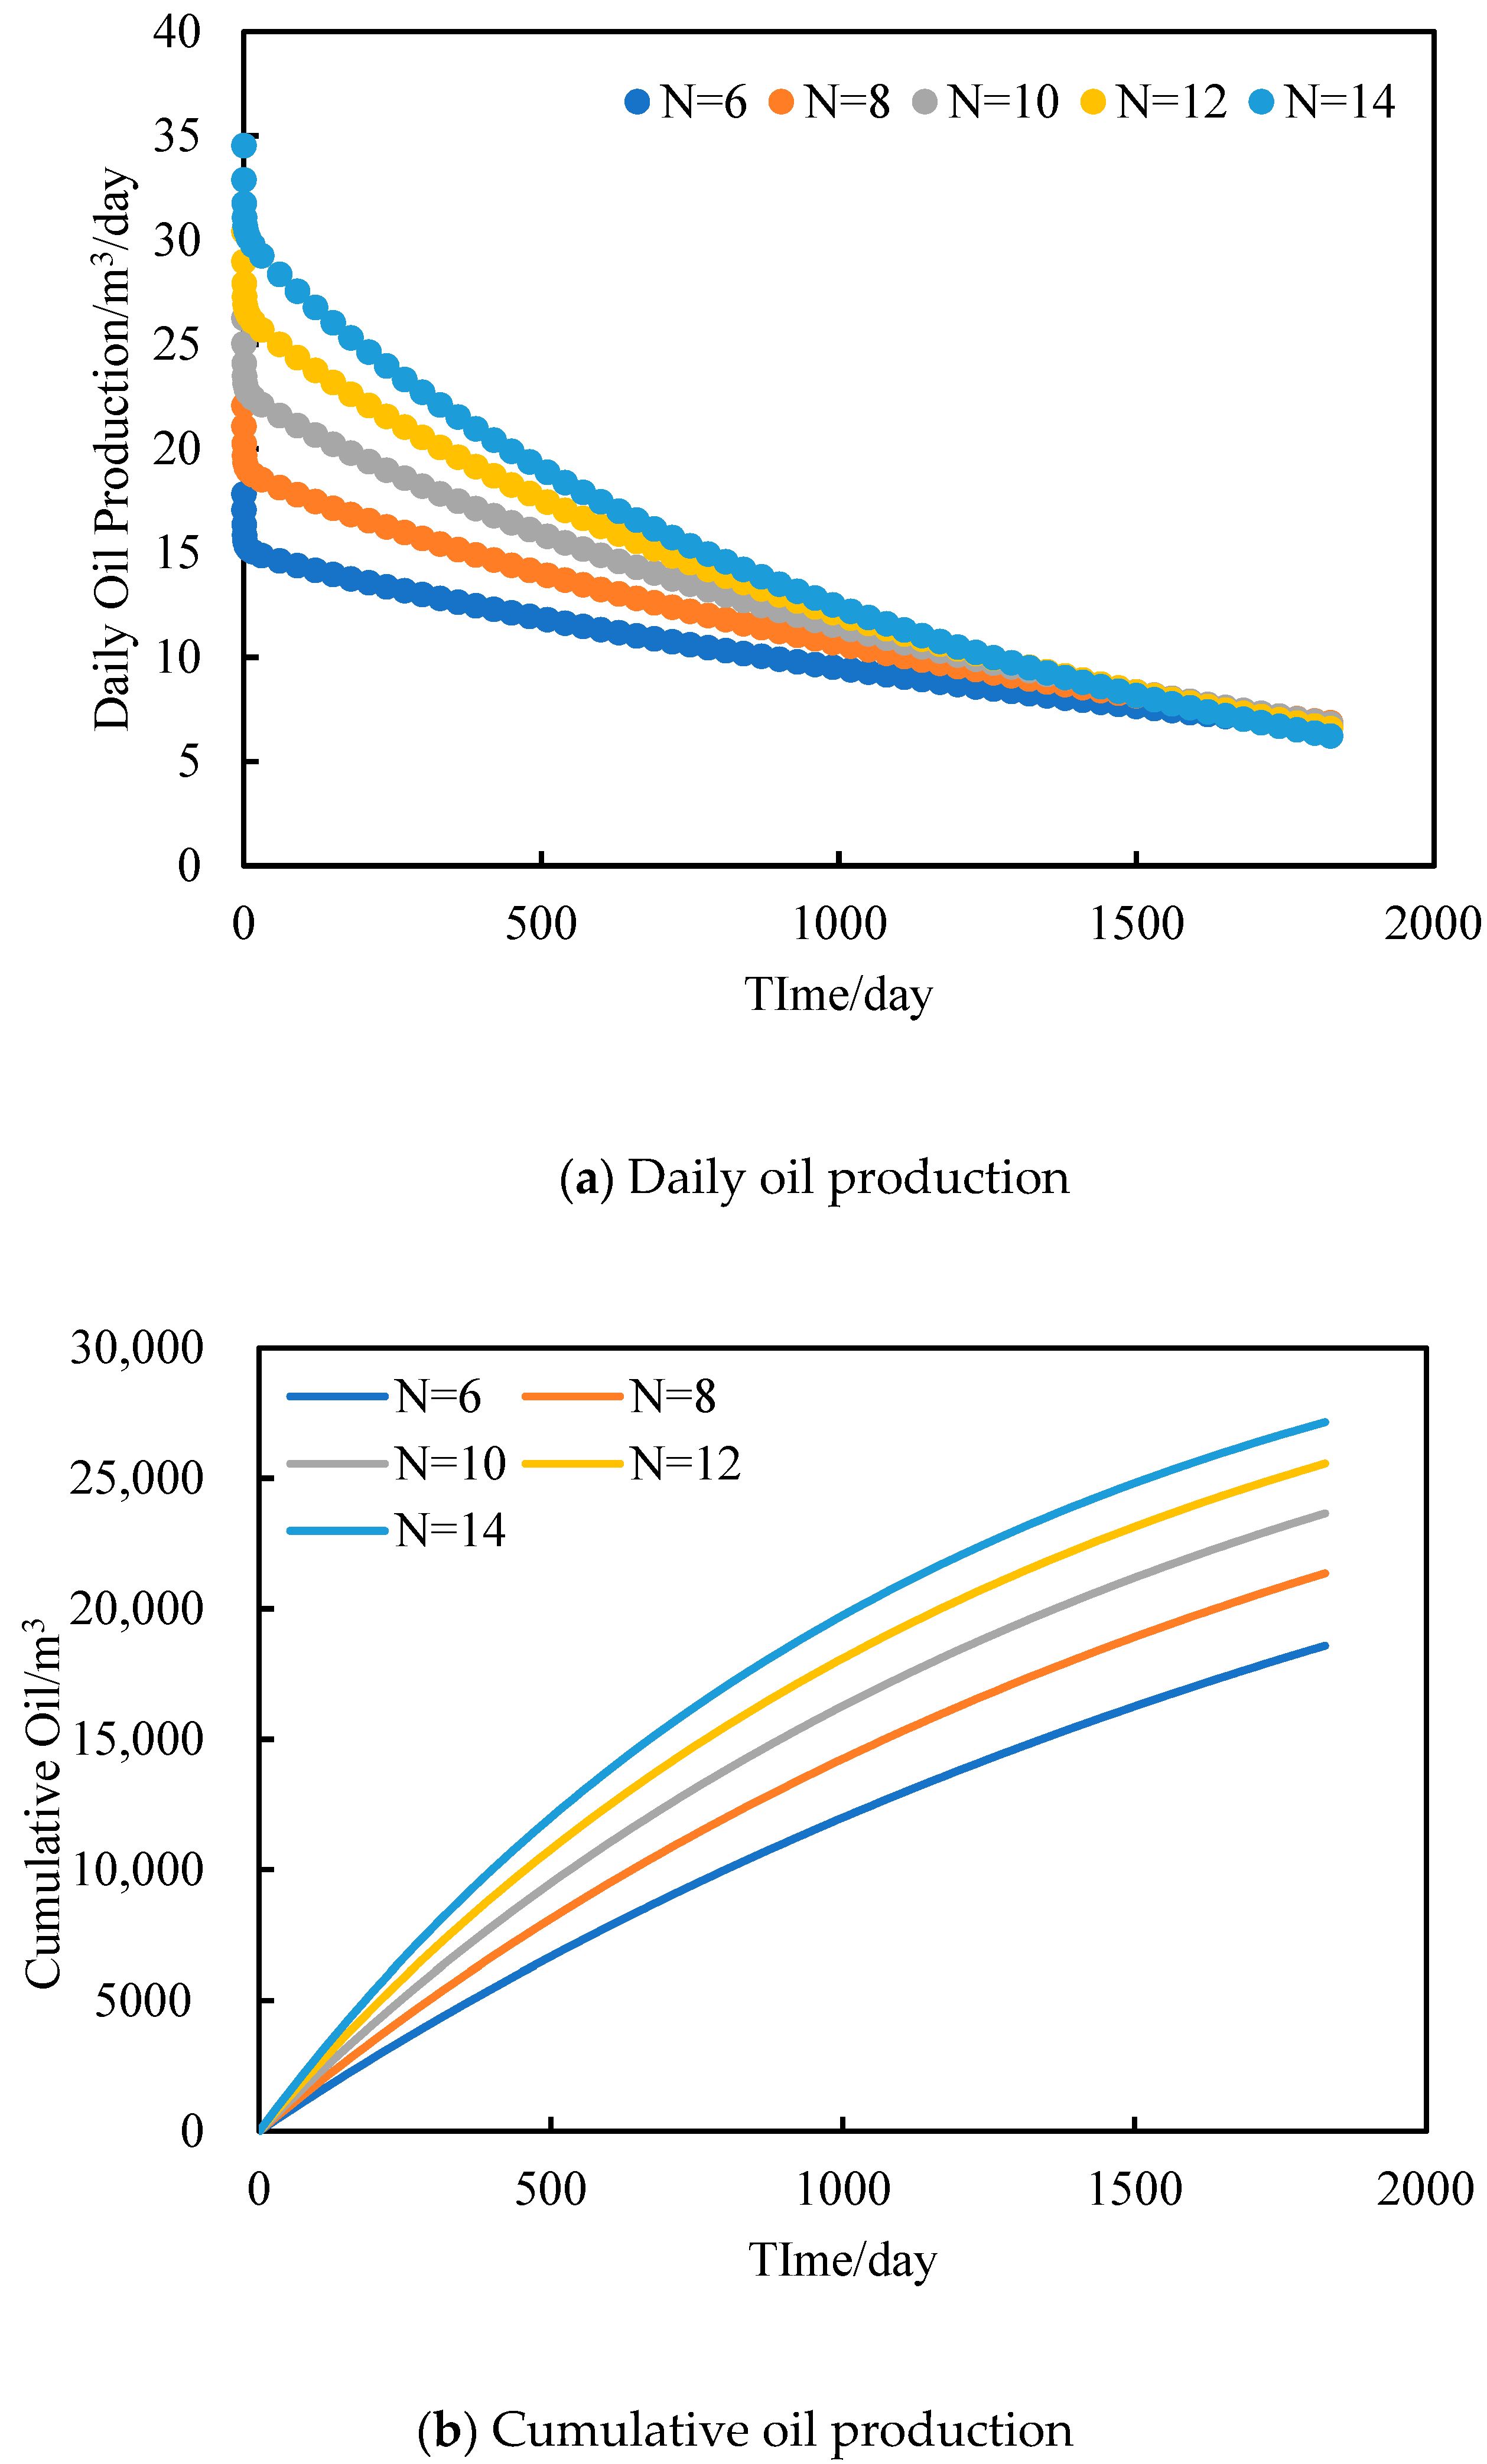
(4)
The number of artificial fractures mainly affects the early stage of horizontal well production. A discernible correlation emerges: an increase in the count of artificial fractures corresponds to a heightened daily oil production and an augmented cumulative oil production. However, with the increase in the number of fractures, the increase in the horizontal well productivity becomes smaller and smaller. Shale gas reservoirs have good production effects after hydraulic fracturing; when the number of fractures is fixed, the greater the fracture spacing, the higher the daily oil production of horizontal wells. This trend is further underscored by the observation that a higher cumulative oil production accompanies a more pronounced fracturing effect.

Author Contributions

Conceptualization, Q.R. and X.Z.; methodology, Q.R.; software, Q.R.; validation, X.Z., D.R. and Q.R.; formal analysis, D.R.; investigation, J.D.; resources, M.X.; data curation, R.L.; writing—original draft preparation, R.L.; writing—review and editing, M.X.; visualization, M.X.; supervision, J.D.; project administration, J.D.; funding acquisition, Q.R. All authors have read and agreed to the published version of the manuscript.

Funding

This research was funded by [Key Core Technology Research Projects of PetroChina Company Limited] grant number [2020B-4911]. And the APC was funded by [Research Institute of Petroleum Exploration and Development].

Data Availability Statement

Data available on request due to restrictions eg privacy or ethical. The data presented in this study are available on request from the corresponding author. The data are not publicly available due to the data in this paper is required to be confidential.

Acknowledgments

All individuals included in this section have consented to the acknowledgement.

Conflicts of Interest

The authors declare no conflict of interest.

References

  1. Hu, D.; Wei, Z.; Liu, R.; Wei, X.; Chen, F.; Liu, Z. Enrichment control factors and explo-ration potential of lacustrine shale oil and gas: A case study of Jurassic in the Fuling area of the Sichuan Basin. Nat. Gas Ind. B 2022, 9, 1–8. [Google Scholar] [CrossRef]
  2. Ju, W.; Niu, X.B.; Feng, S.B.; You, Y.; Xu, K.; Wang, G.; Xu, H.R. Predicting the present-day in situ stress distribution within the Yanchang Formation Chang 7 shale oil reservoir of Ordos Basin, central China. Pet. Sci. 2020, 17, 912–924. [Google Scholar] [CrossRef]
  3. Hu, T.; Pang, X.Q.; Jiang, F.J.; Wang, Q.F.; Wu, G.Y.; Liu, X.H.; Jiang, S.; Li, C.R.; Xu, T.W.; Chen, Y.Y. Key factors controlling shale oil enrichment in saline lacustrine rift basin: Implications from two shale oil wells in Dongpu Depression. Bohai Bay Basin. Pet. Sci. 2021, 18, 687–711. [Google Scholar] [CrossRef]
  4. Tang, Y.; Cao, J.; He, W.J.; Guo, X.G.; Zhao, K.B.; Li, W.W. Discovery of shale oil in alkaline lacustrine basins: The Late Paleozoic Fengcheng Formation, Mahu Sag, Junggar Basin, China. Pet. Sci. 2021, 18, 1281–1293. [Google Scholar] [CrossRef]
  5. Ambrose, R.J.; Hartman, R.C.; Diaz Campos, M.; Akkutlu, I.Y.; Sondergeld, C. New pore-scale considerations for shale gas in place calculations. In Proceedings of the SPE Unconventional Gas Conference, Pittsburgh, PA, USA, 23–25 February 2010. SPE-131772-MS. [Google Scholar]
  6. Wu, H.A.; Chen, J.; Liu, H. Molecular dynamics simulations about adsorption and displacement of methane in carbon nanochannels. J. Phys. Chem. C 2015, 119, 13652–13657. [Google Scholar] [CrossRef]
  7. Botan, A.; Vermorel, R.; Ulm, F.J.; Pellenq, R.J.M. Molecular simulations of supercritical fluid permeation through disordered microporous carbons. Langmuir 2013, 29, 9985–9990. [Google Scholar] [CrossRef]
  8. Song, F.; Chen, X. Molecular dynamics study of liquid wall slip. Hydrodyn. Res. Prog. 2012, 27, 80–86. [Google Scholar]
  9. Wang, S.; Javadpour, F.; Feng, Q. Molecular dynamics simulations of oil transport through inorganic nanopores in shale. Fuel 2016, 171, 74–86. [Google Scholar] [CrossRef]
  10. Wang, S.; Javadpour, F.; Feng, Q. Fast mass transport of oil and supercritical carbon dioxide through organic nanopores in shale. Fuel 2016, 181, 741–758. [Google Scholar] [CrossRef]
  11. Wang, S.; Feng, Q.; Javadpour, F.; Xia, T.; Li, Z. Oil adsorption in shale nanopores and its effect on recoverable oil-in-place. Int. J. Coal Geol. 2015, 147–148, 9–24. [Google Scholar] [CrossRef]
  12. Wang, S.; Feng, Q.; Cha, M.; Lu, S.; Qin, Y.; Xia, T.; Zhang, C. Molecular dynamics simulation of liquid alkane fugacity in shale organic matter pore joints. Pet. Explor. Dev. 2015, 42, 772–778. [Google Scholar] [CrossRef]
  13. Javadpour, F.; McClure, M.; Naraghi, M.E. Slip-corrected liquid permeability and its effect on hydraulic fracturing and fluid loss in shale. Fuel 2015, 160, 549–559. [Google Scholar] [CrossRef]
  14. Arora, G.; Sandler, S.I. Nanoporous carbon membranes for separation of nitrogen and oxygen: Insight from molecular simulations. Fluid Phase Equilibria 2007, 259, 3–8. [Google Scholar] [CrossRef]
  15. Zhang, L.; Lu, X.; Liu, X.; Yang, K.; Zhou, H. Surface Wettability of Basal Surfaces of Clay Minerals: Insights from Molecular Dynamics Simulation. Energy Fuels 2016, 30, 149–160. [Google Scholar] [CrossRef]
  16. Chang, X.; Xue, Q.; Li, X.; Zhang, J.; Zhu, L.; He, D.; Zheng, H.; Lu, S.; Liu, Z. Inherent wettability of different rock surfaces at nanoscale: A theoretical study. Appl. Surf. Sci. 2018, 434, 73–81. [Google Scholar] [CrossRef]
  17. Majumder, M.; Chopra, N.; Andrews, R.; Hinds, B. Nanoscale hydrodynamics: Enhanced flow in carbon nanotubes. Nature 2005, 438, 44. [Google Scholar] [CrossRef] [PubMed]
  18. Whitby, M.; Quirke, N. Fluid flow in carbon nanotubes and nanopipes. Nat. Nanotechnol. 2007, 2, 87–94. [Google Scholar] [CrossRef] [PubMed]
  19. Falk, K.; Sedlmeier, F.; Joly, L.; Netz, R.R.; Bocquet, L. Ultralow liquid/solid friction in carbon nanotubes: Comprehensive theory for alcohols, alkanes, OMCTS, and water. Langmuir 2012, 8, 14261–14272. [Google Scholar] [CrossRef]
  20. Wu, K.; Chen, Z.; Li, J.; Li, X.; Xu, J.; Dong, X. Wettability effect on nanoconfined water flow. Proc. Natl. Acad. Sci. USA 2017, 114, 3358–3363. [Google Scholar] [CrossRef]
  21. Cui, J.; Sang, Q.; Li, Y.; Yin, C.; Li, Y.; Dong, M. Liquid permeability of organic nanopores in shale: Calculation and analysis. Fuel 2017, 15, 426–434. [Google Scholar] [CrossRef]
  22. Mattia, D.; Calabro, F. Explaining high flow rate of water in carbon nanotubes via solid-liquid molecular intercations. Microfluid Nanofluid 2012, 13, 125–130. [Google Scholar] [CrossRef]
  23. Qi, Z.; Yuliang, S.; Wendong, W.; Mingjing, L.; Guanglong, S. Apparent permeability for liquid transport in nanopores of shale reservoirs: Coupling flow enhancement and near wall flow. Int. J. Heat Mass Transf. 2017, 115, 224–234. [Google Scholar]
  24. Xu, J.; Su, Y.; Wang, W.; Wang, H. Stochastic Apparent Permeability Model of Shale Oil Considering Geological Control. In Proceedings of the Unconventional Resources Technology Conference, Virtual, 20–22 July 2020; pp. 2443–2460. [Google Scholar]
  25. Wang, X.; Li, J.; Jiang, W.; Zhang, H.; Feng, Y.; Yang, Z. Characteristics, current exploration practices, and prospects of continental shale oil in China. Adv. Geo-Energy Res. 2022, 6, 454–459. [Google Scholar] [CrossRef]
  26. Sharifi, M.; Kelkar, M.; Karkevandi-Talkhooncheh, A. A workflow for flow simulation in shale oil reservoirs: A case study in woodford shale. Adv. Geo-Energy Res. 2021, 5, 365–375. [Google Scholar] [CrossRef]
  27. Feng, Q.; Xu, S.; Xing, X.; Zhang, W.; Wang, S. Advances and challenges in shale oil development: A critical review. Adv. Geo-Energy Res. 2020, 4, 406–418. [Google Scholar] [CrossRef]
  28. Su, Y.; Sun, Q.; Wang, W.; Guo, X.; Xu, J.; Li, G.; Pu, X.; Han, W.; Shi, Z. Spontaneous imbibition characteristics of shale oil reservoir under the influence of osmosis. Int. J. Coal Sci. Technol. 2022, 9, 69. [Google Scholar] [CrossRef]
  29. Bai, L.; Wang, Y.; Zhang, K.; Yang, Y.; Bao, K.; Zhao, J.; Li, X. Spatial variability of soil moisture in a mining subsidence area of northwest China. Int. J. Coal Sci. Technol. 2022, 9, 64. [Google Scholar] [CrossRef]
  30. Hamanaka, A.; Sasaoka, T.; Shimada, H.; Matsumoto, S. Amelioration of acidic soil using fly ash for mine revegetation in post-mining land. Int. J. Coal Sci. Technol. 2022, 9, 33. [Google Scholar] [CrossRef]
Figure 1. Schematic representation of the capillary model is depicted. (A) a tortuous capillary characterized by a constant radius is illustrated; (B) a tortuous capillary model is presented wherein the radius is variable. Parts I, III and V represent pores, while parts II and IV represent throats. Reproduced with permission from Jilong Xu (2020) [24].
Energies 16 06482 g001
Figure 2. History match of oil and water production.
Energies 16 06482 g002
Figure 3. Cumulative oil production curves considering the effects of capillary forces with and without the consideration of micro- and nanoscale pores.
Energies 16 06482 g003
Figure 4. Pressure field variations when capillary forces are included, comparing the scenario without considering the effects of micro- and nanoscale pores (left) and the scenario considering these effects (right).
Energies 16 06482 g004
Figure 5. Variation in oil saturation field when capillary forces are included, comparing the scenario without considering the effects of micro- and nanoscale pores (left) and the scenario considering these effects (right).
Energies 16 06482 g005
Figure 6. Figures of daily oil production (a) and cumulative production (b) of staged fracturing horizontal wells with different numbers of artificial fractures.
Energies 16 06482 g006
Figure 7. The daily oil production (a) and cumulative production (b) change diagram of staged fracturing horizontal wells with different artificial fracture spacing.
Energies 16 06482 g007
Table 1. Reservoir and fluid parameters for oil–water two-phase flow in shale formation.
ParameterValueParameterValue
Reservoir thickness/m45.72TOC/%3.00
Length of horizontal section/m1188.72Initial water saturation/%30
Number of fracturing14Initial oil saturation/%70
Hydraulic fracture length/m152.4Initial gas saturation/%0
Matrix porosity0.1Temperature/°C154.00
Permeability/10−3 μm20.13Initial pressures/MPa51.71
Composite compressibility/MPa−10.00018Theoretical bubble point pressure/MPa27.58
ParameterValueParameterValue
Reservoir thickness/m45.72fracture widths0.004
Disclaimer/Publisher’s Note: The statements, opinions and data contained in all publications are solely those of the individual author(s) and contributor(s) and not of MDPI and/or the editor(s). MDPI and/or the editor(s) disclaim responsibility for any injury to people or property resulting from any ideas, methods, instructions or products referred to in the content.

