

The Potential of Vapor Compression Heat Pumps Supplying Process Heat between 100 and 200 °C in the Chemical Industry

 ,
,  , ,
, ,  , and
, and
Abstract
:1. Introduction
- Competition with other heat generation technologies [12].
- Uncertainty about the reliability of coupling heat source and sink by industrial VCHPs, in particular for non-continuous processes [13]. Because extremely high reliabilities are required in the (petro)chemical sector, the heat supply needs to ensure robust and uninterrupted operation.
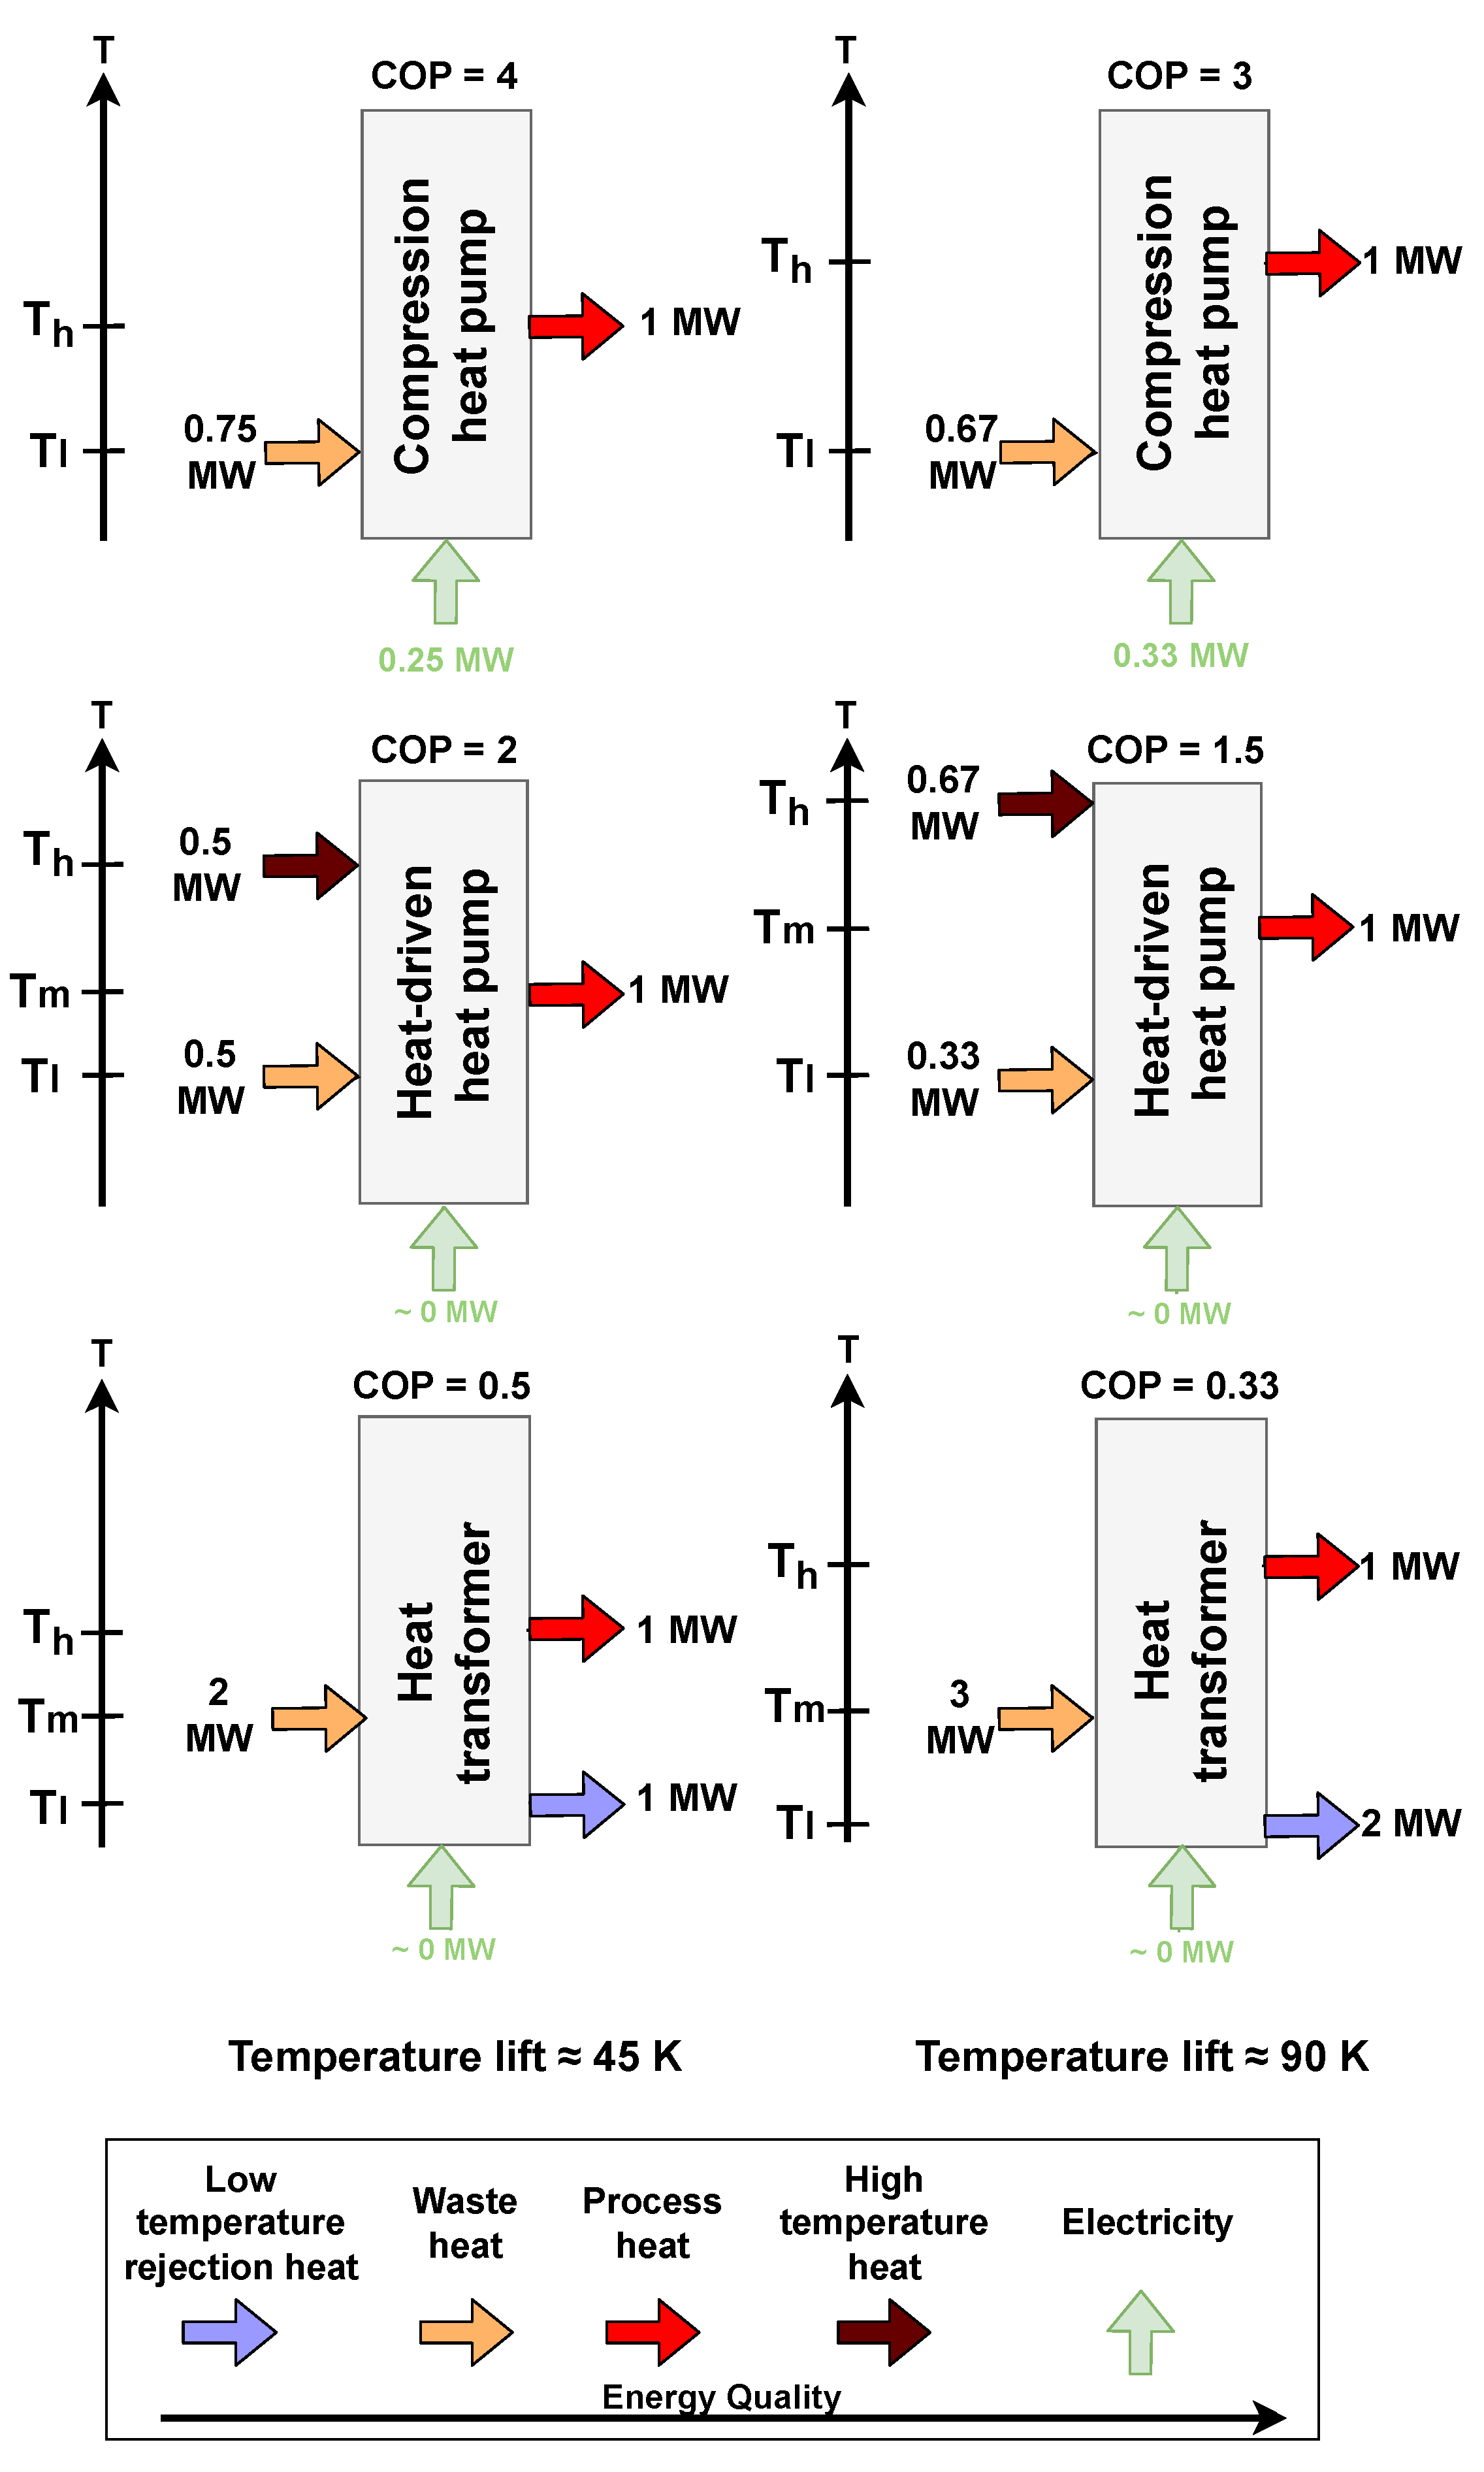
2. Heat Pump Technologies
2.1. Vapor Compression Heat Pumps
2.2. Heat-Driven Heat Pumps
2.3. Heat Transformers
2.4. Comparison of the Heat Pump Technologies
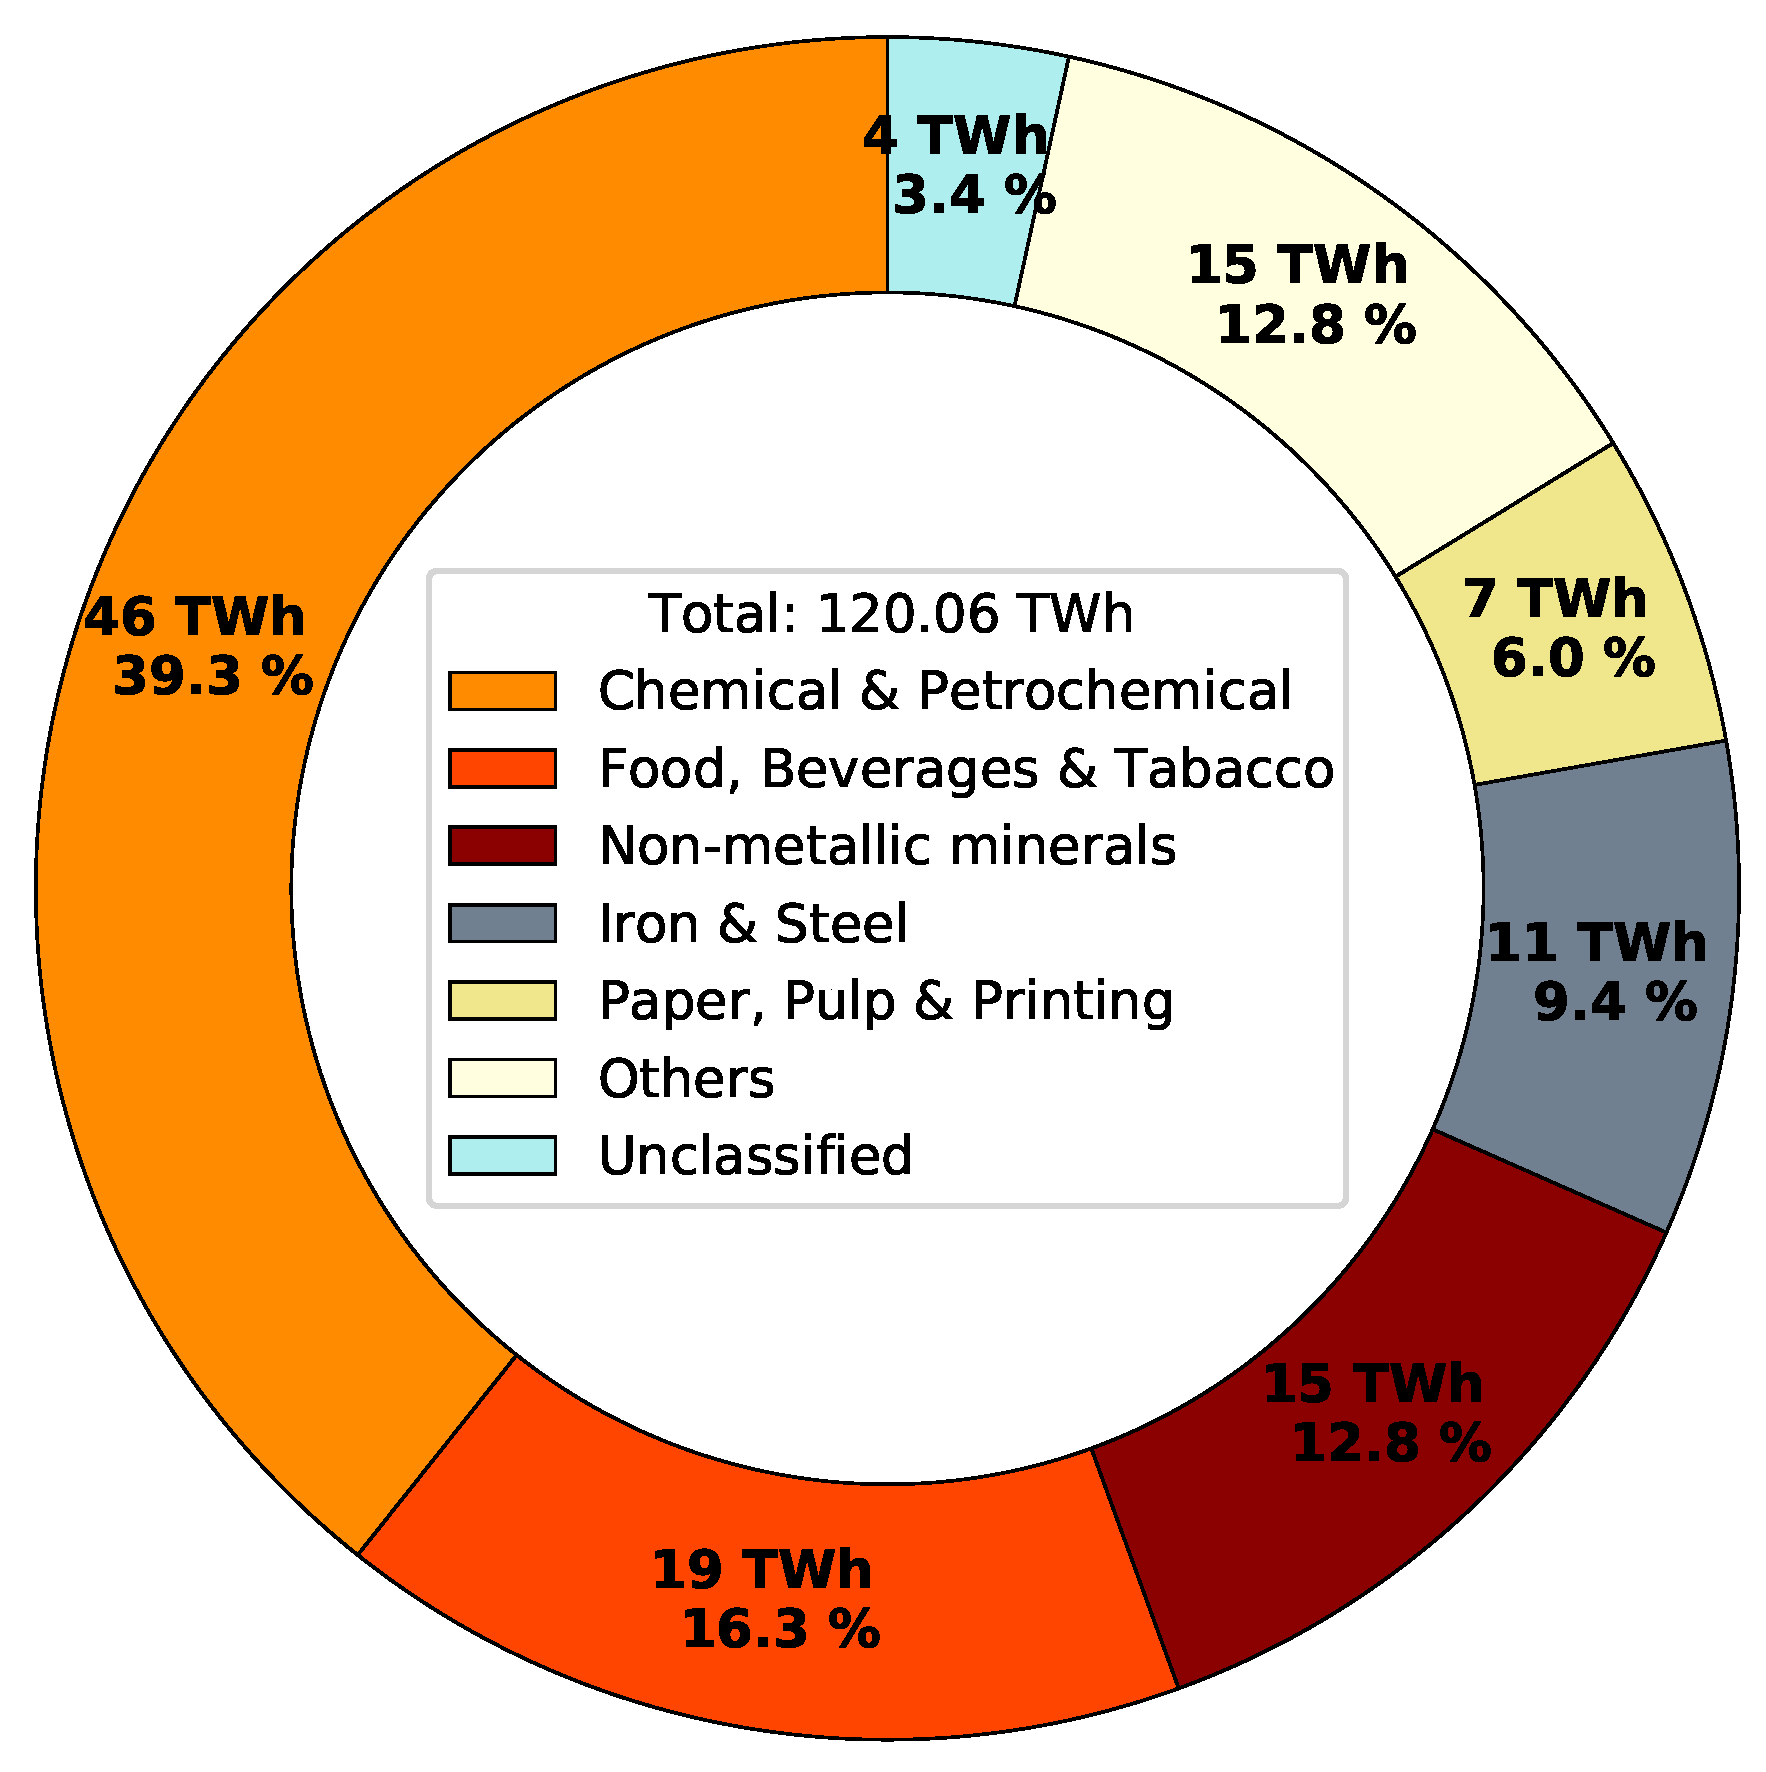
3. Relevant Applications in the Chemical Industry
3.1. Distillation
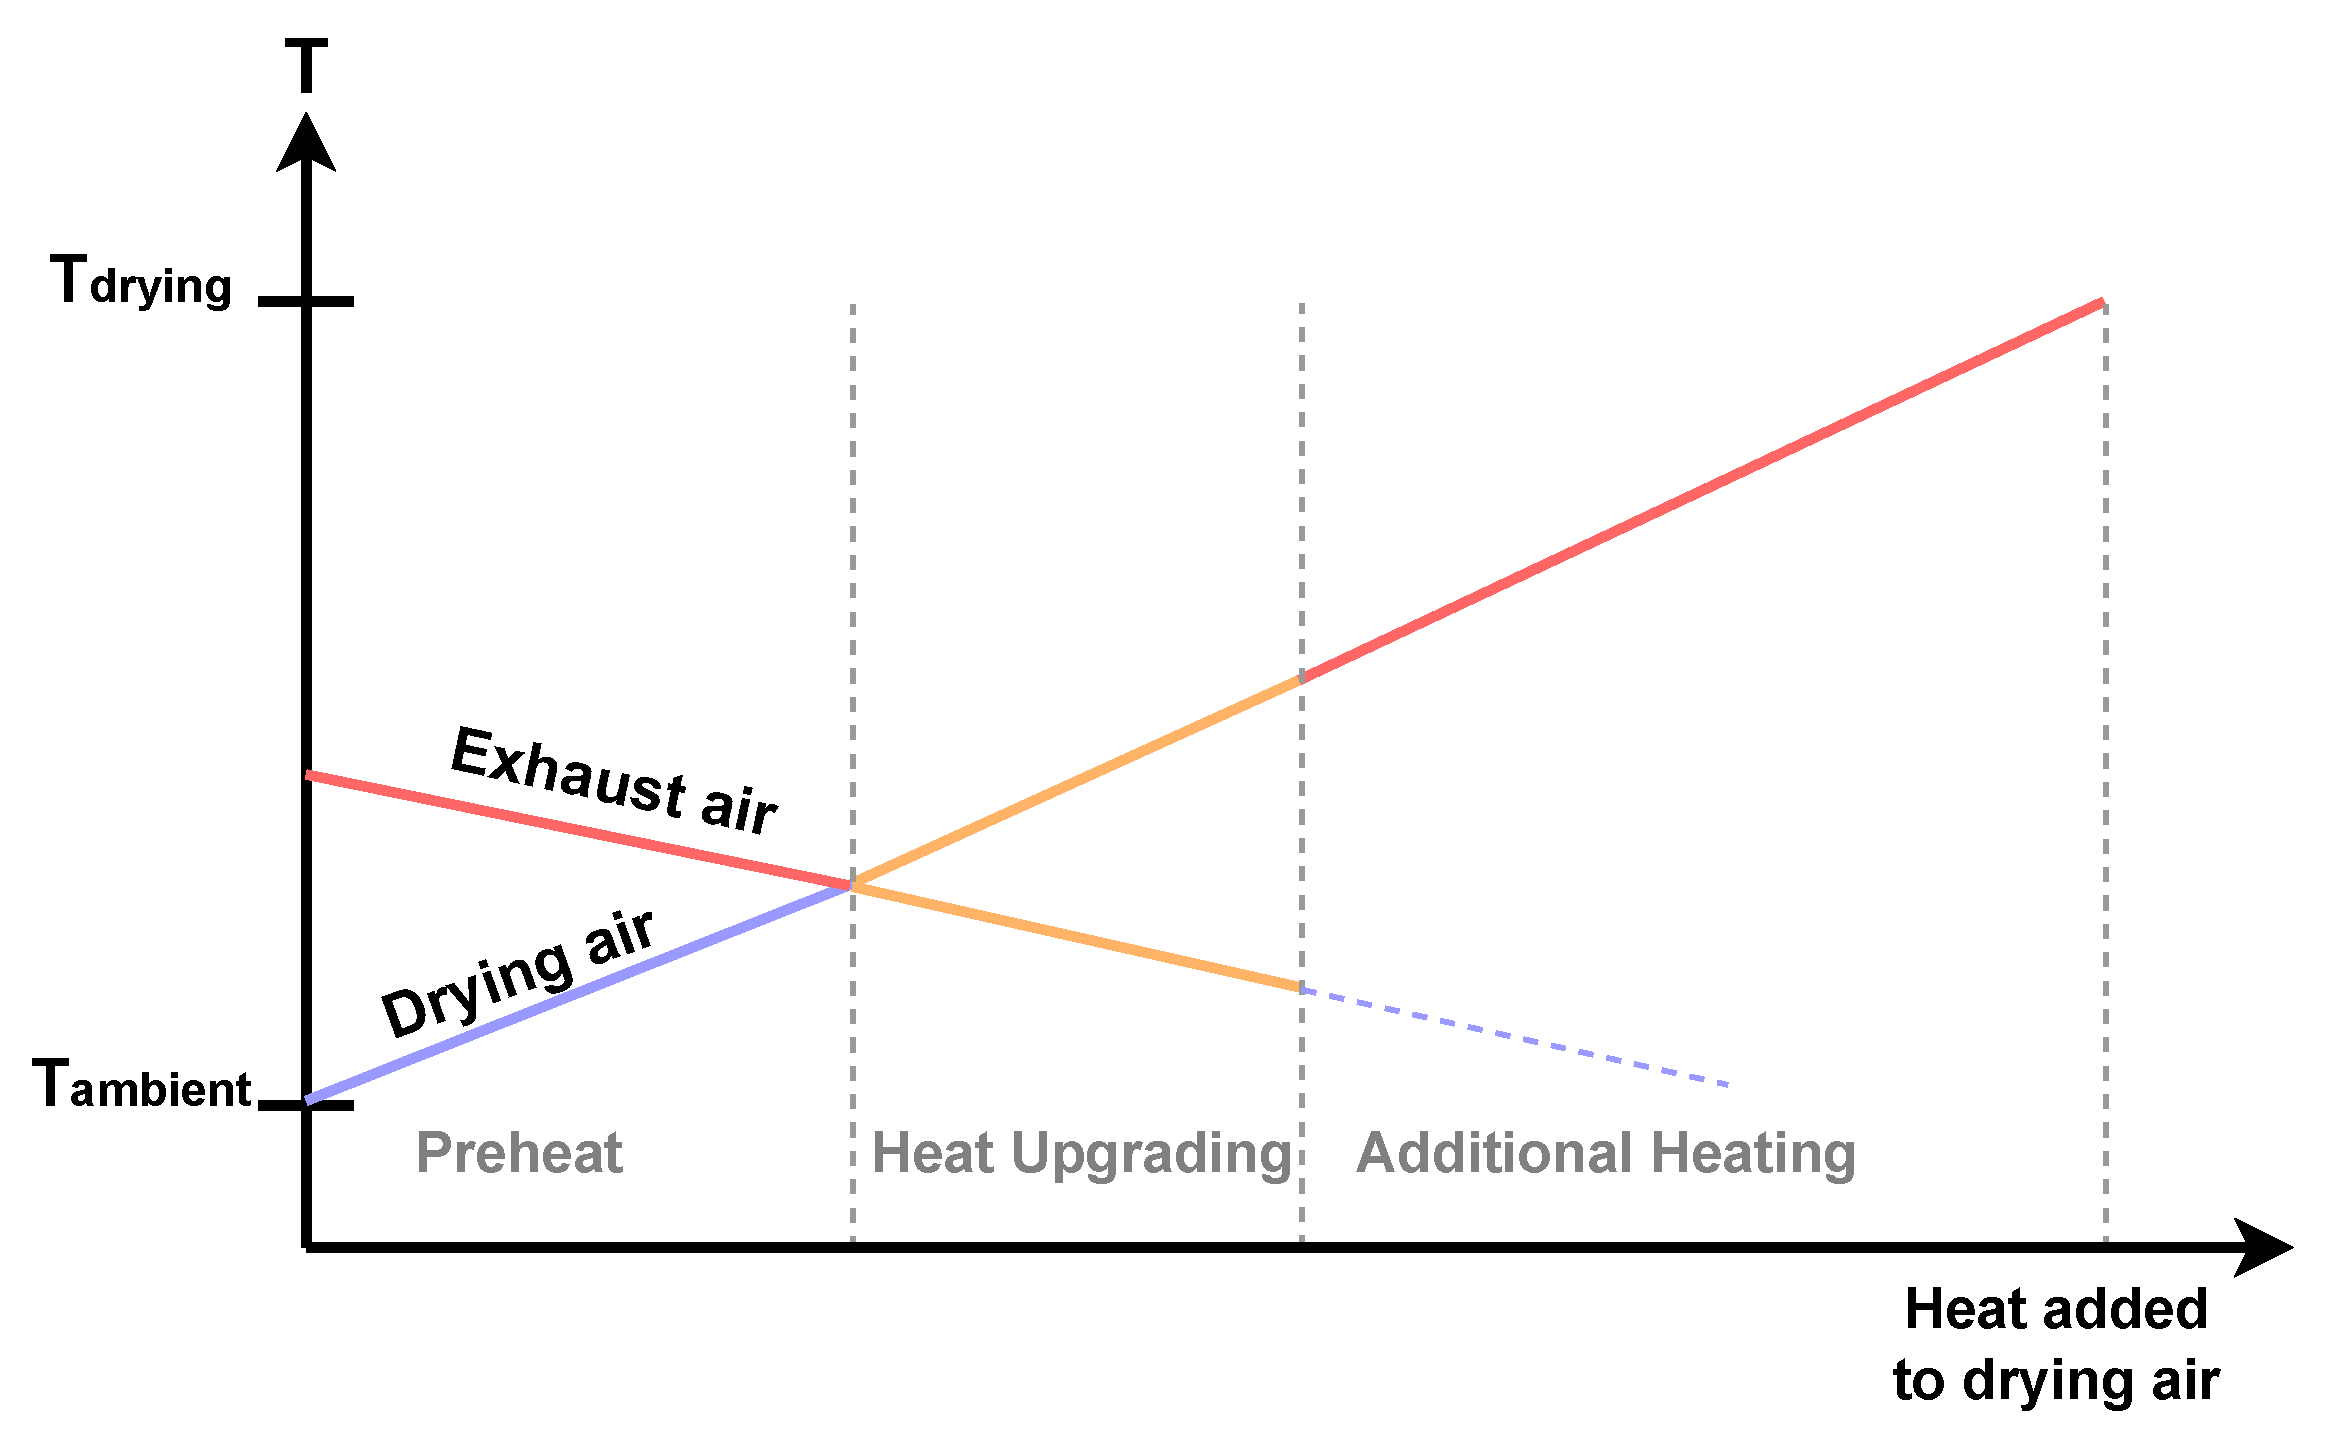
3.2. Drying
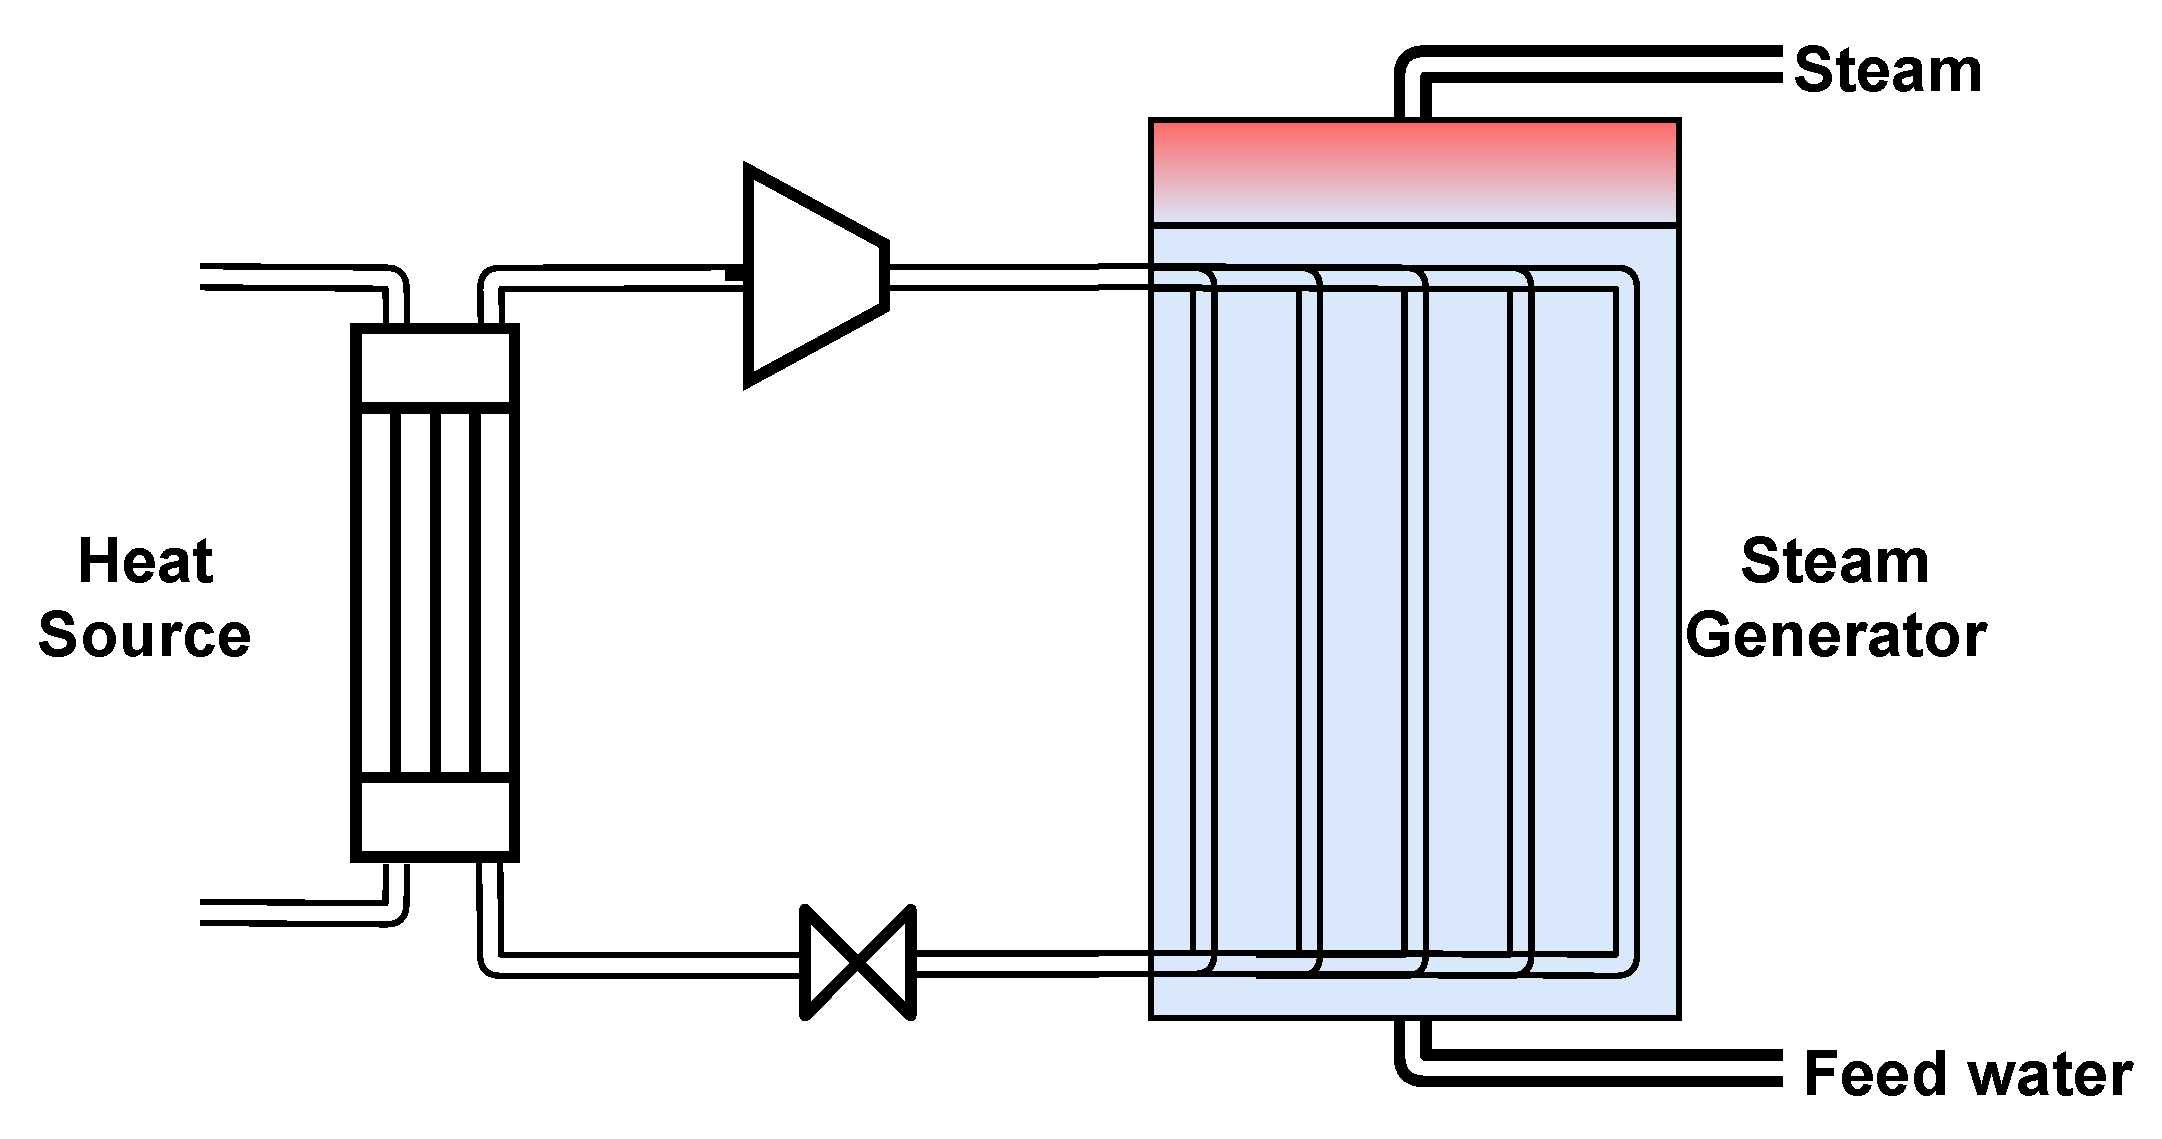
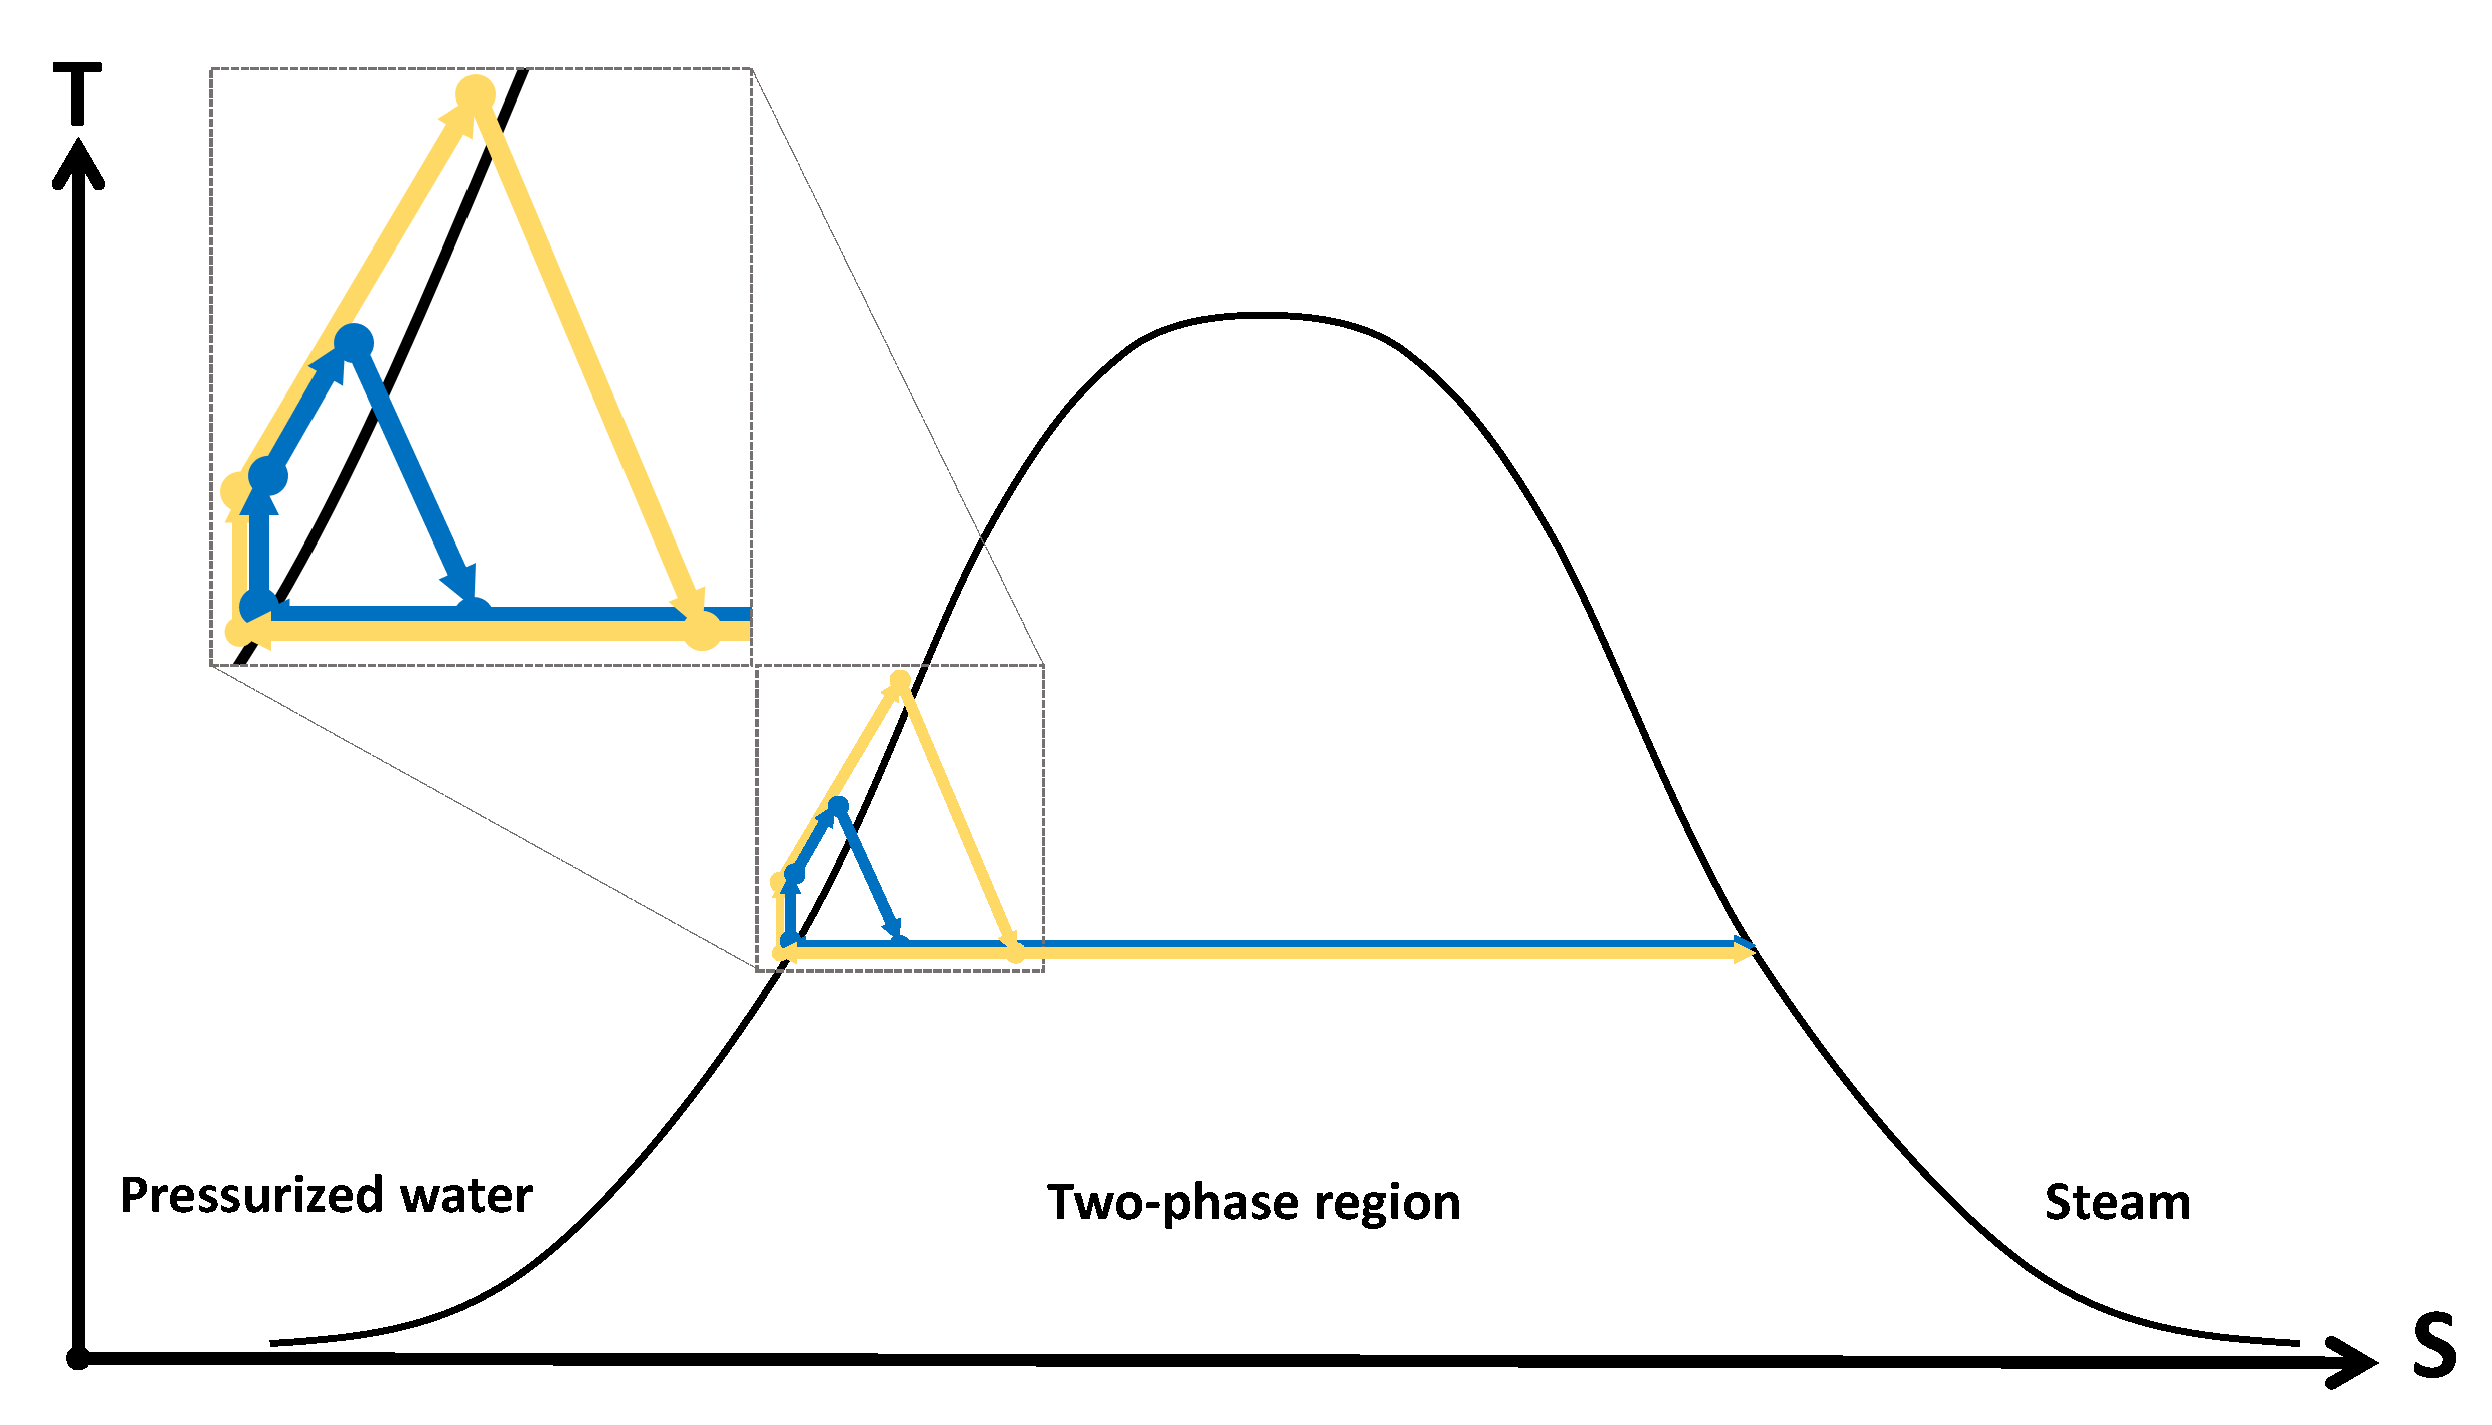
3.3. Steam Production
3.3.1. Direct Steam Production
3.3.2. Steam Flashing
3.3.3. Mechanical Vapor Compression
3.4. Case Studies
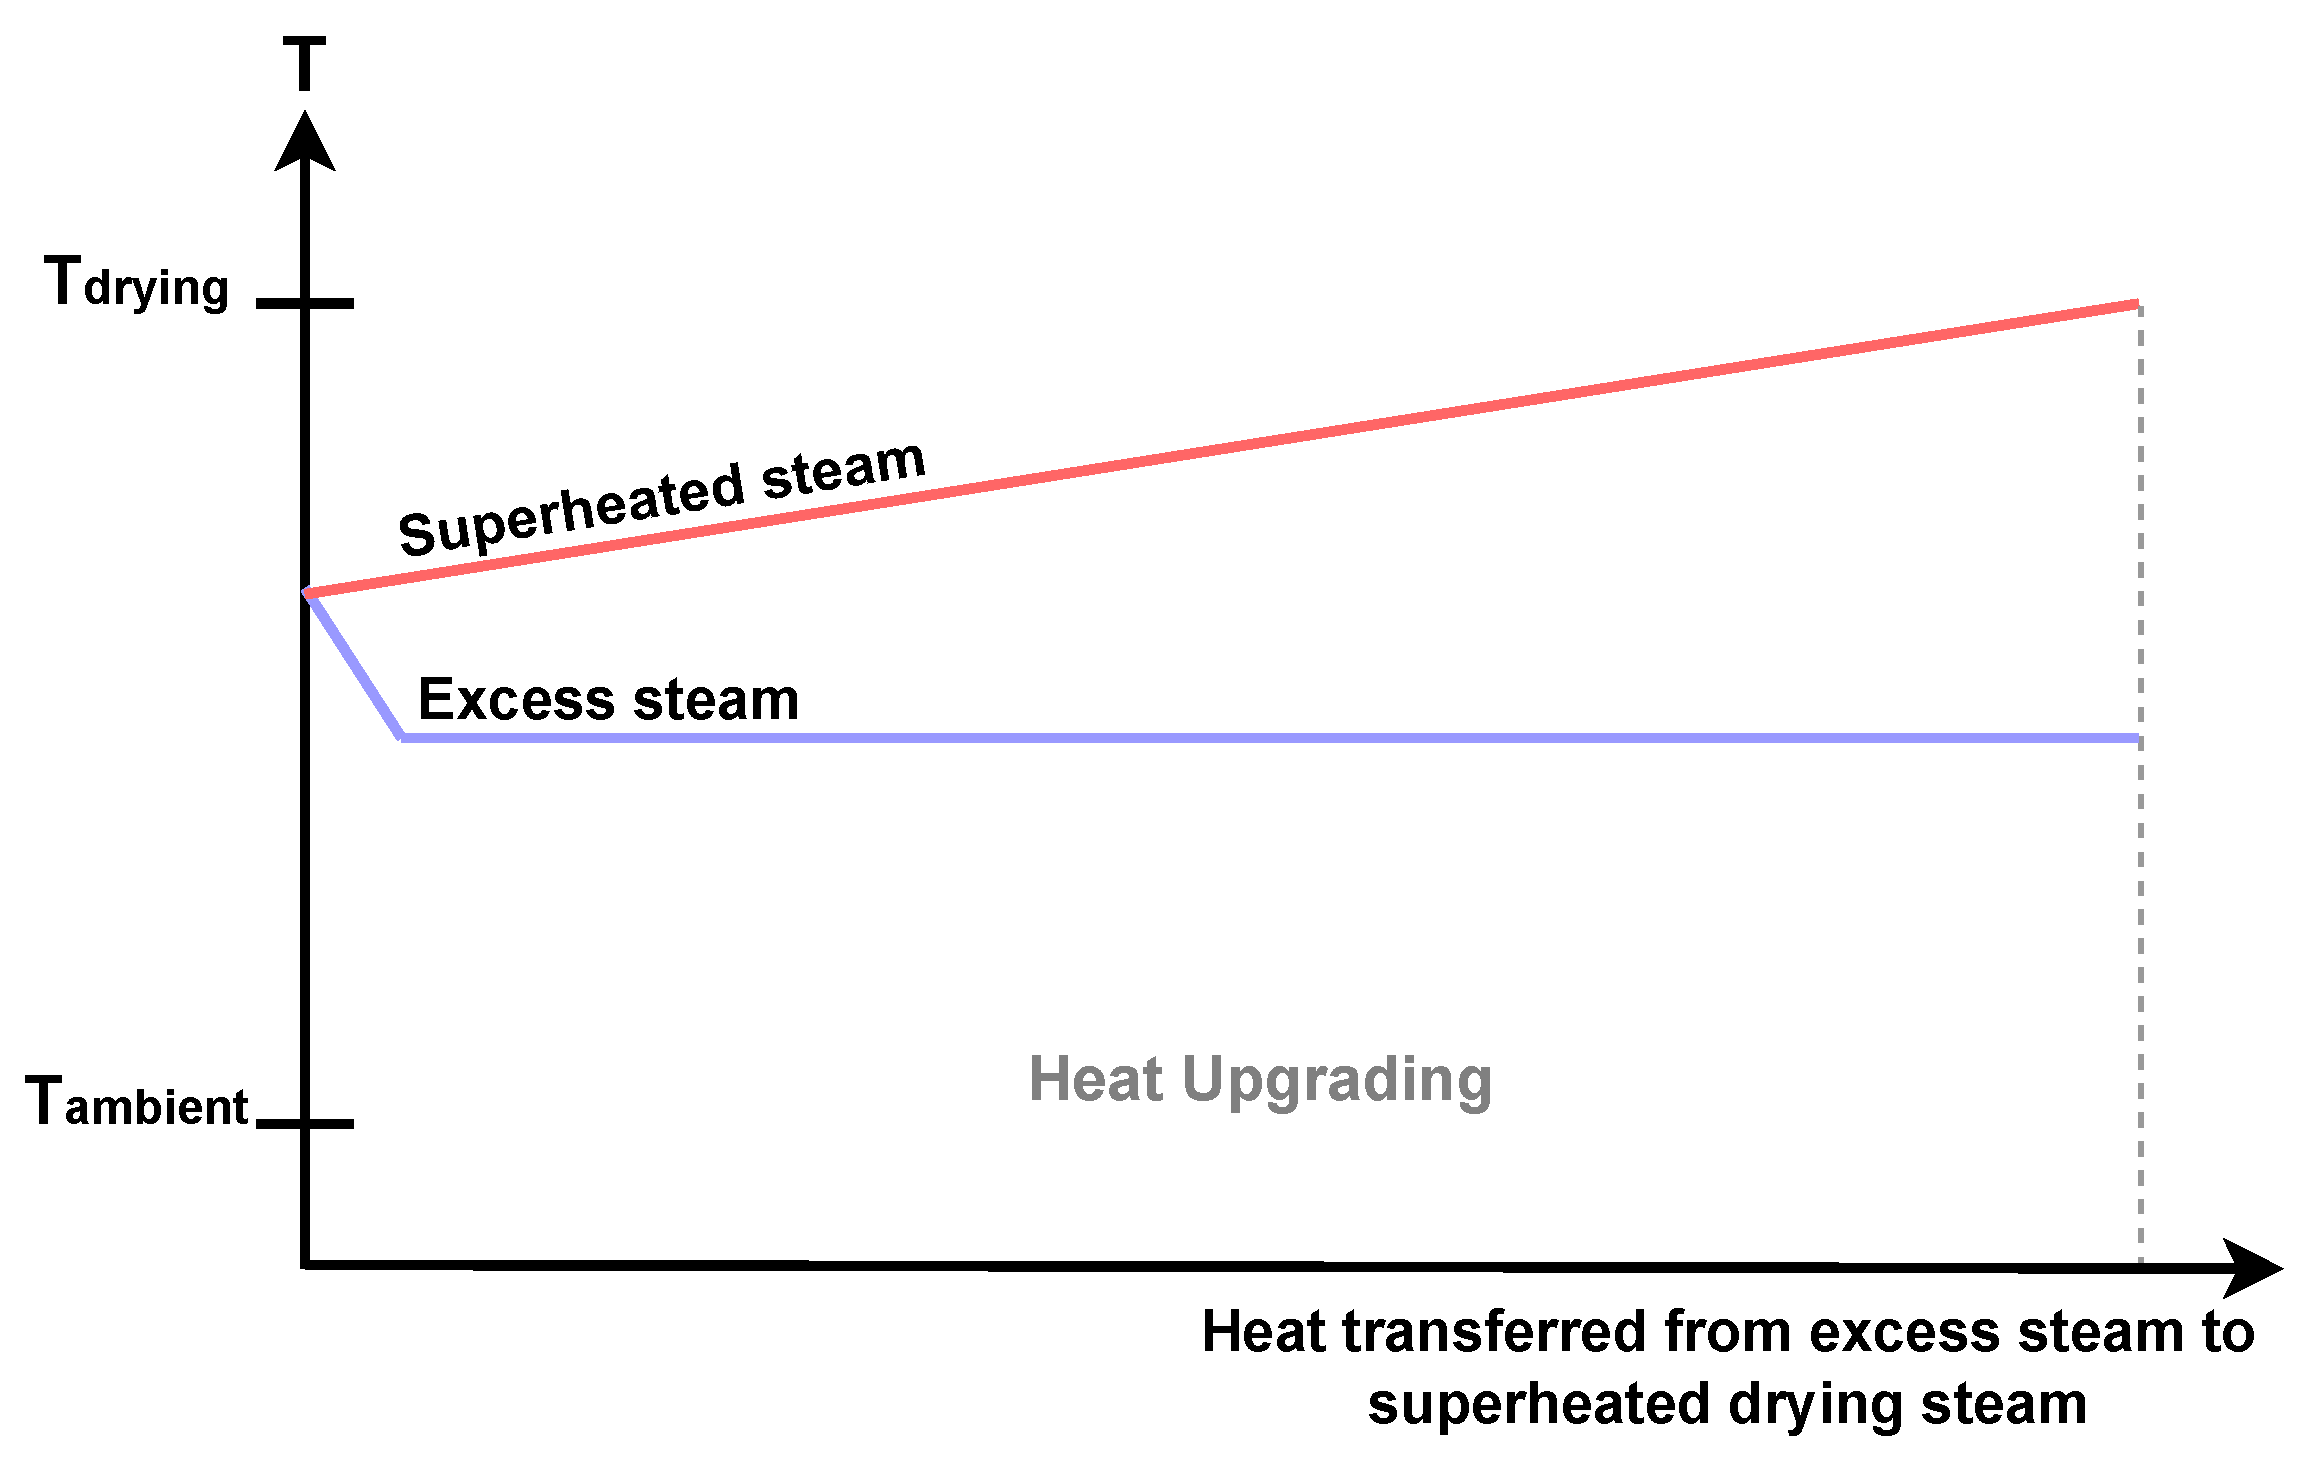
3.4.1. Superheated Steam Drying: Case Study
3.4.2. Steam Production: Case Study
4. Financial Analysis Case Studies
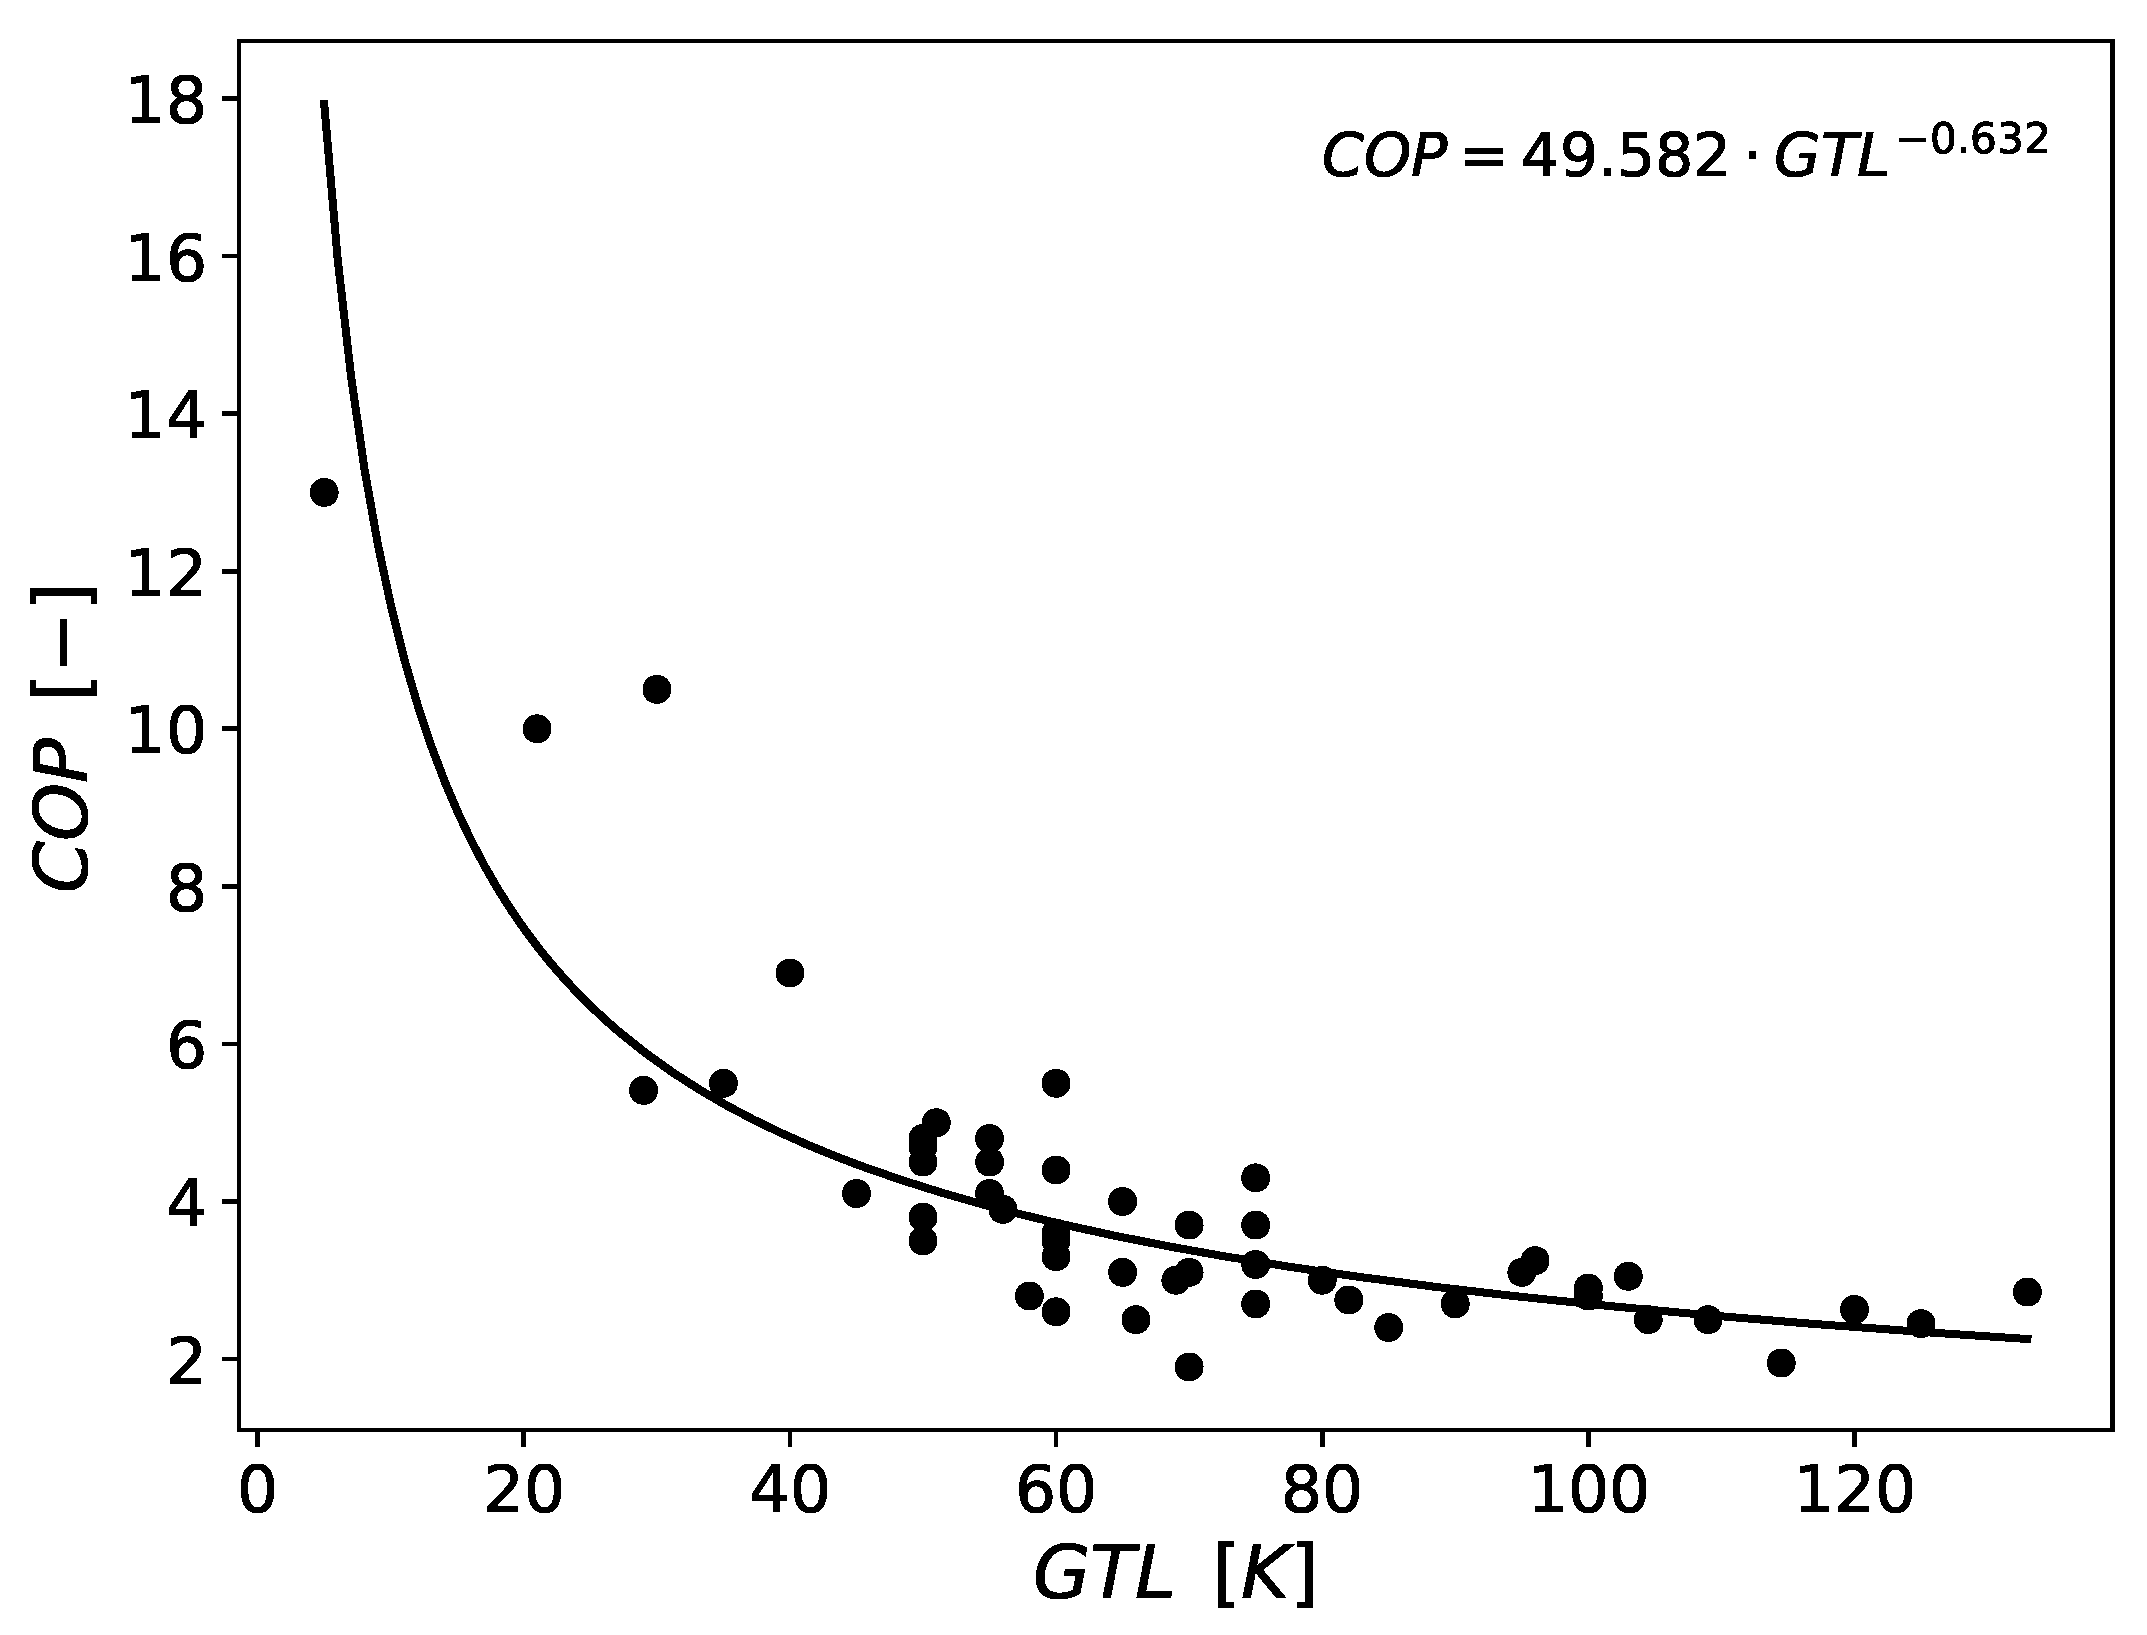
4.1. Performance Estimation
4.1.1. Vapor Compression Heat Pump
4.1.2. Heat Transformers
4.1.3. Electric and Natural Gas Boilers
4.2. Financial Framework
4.2.1. Levelized Cost of Heat
4.2.2. Financial Boundary Conditions
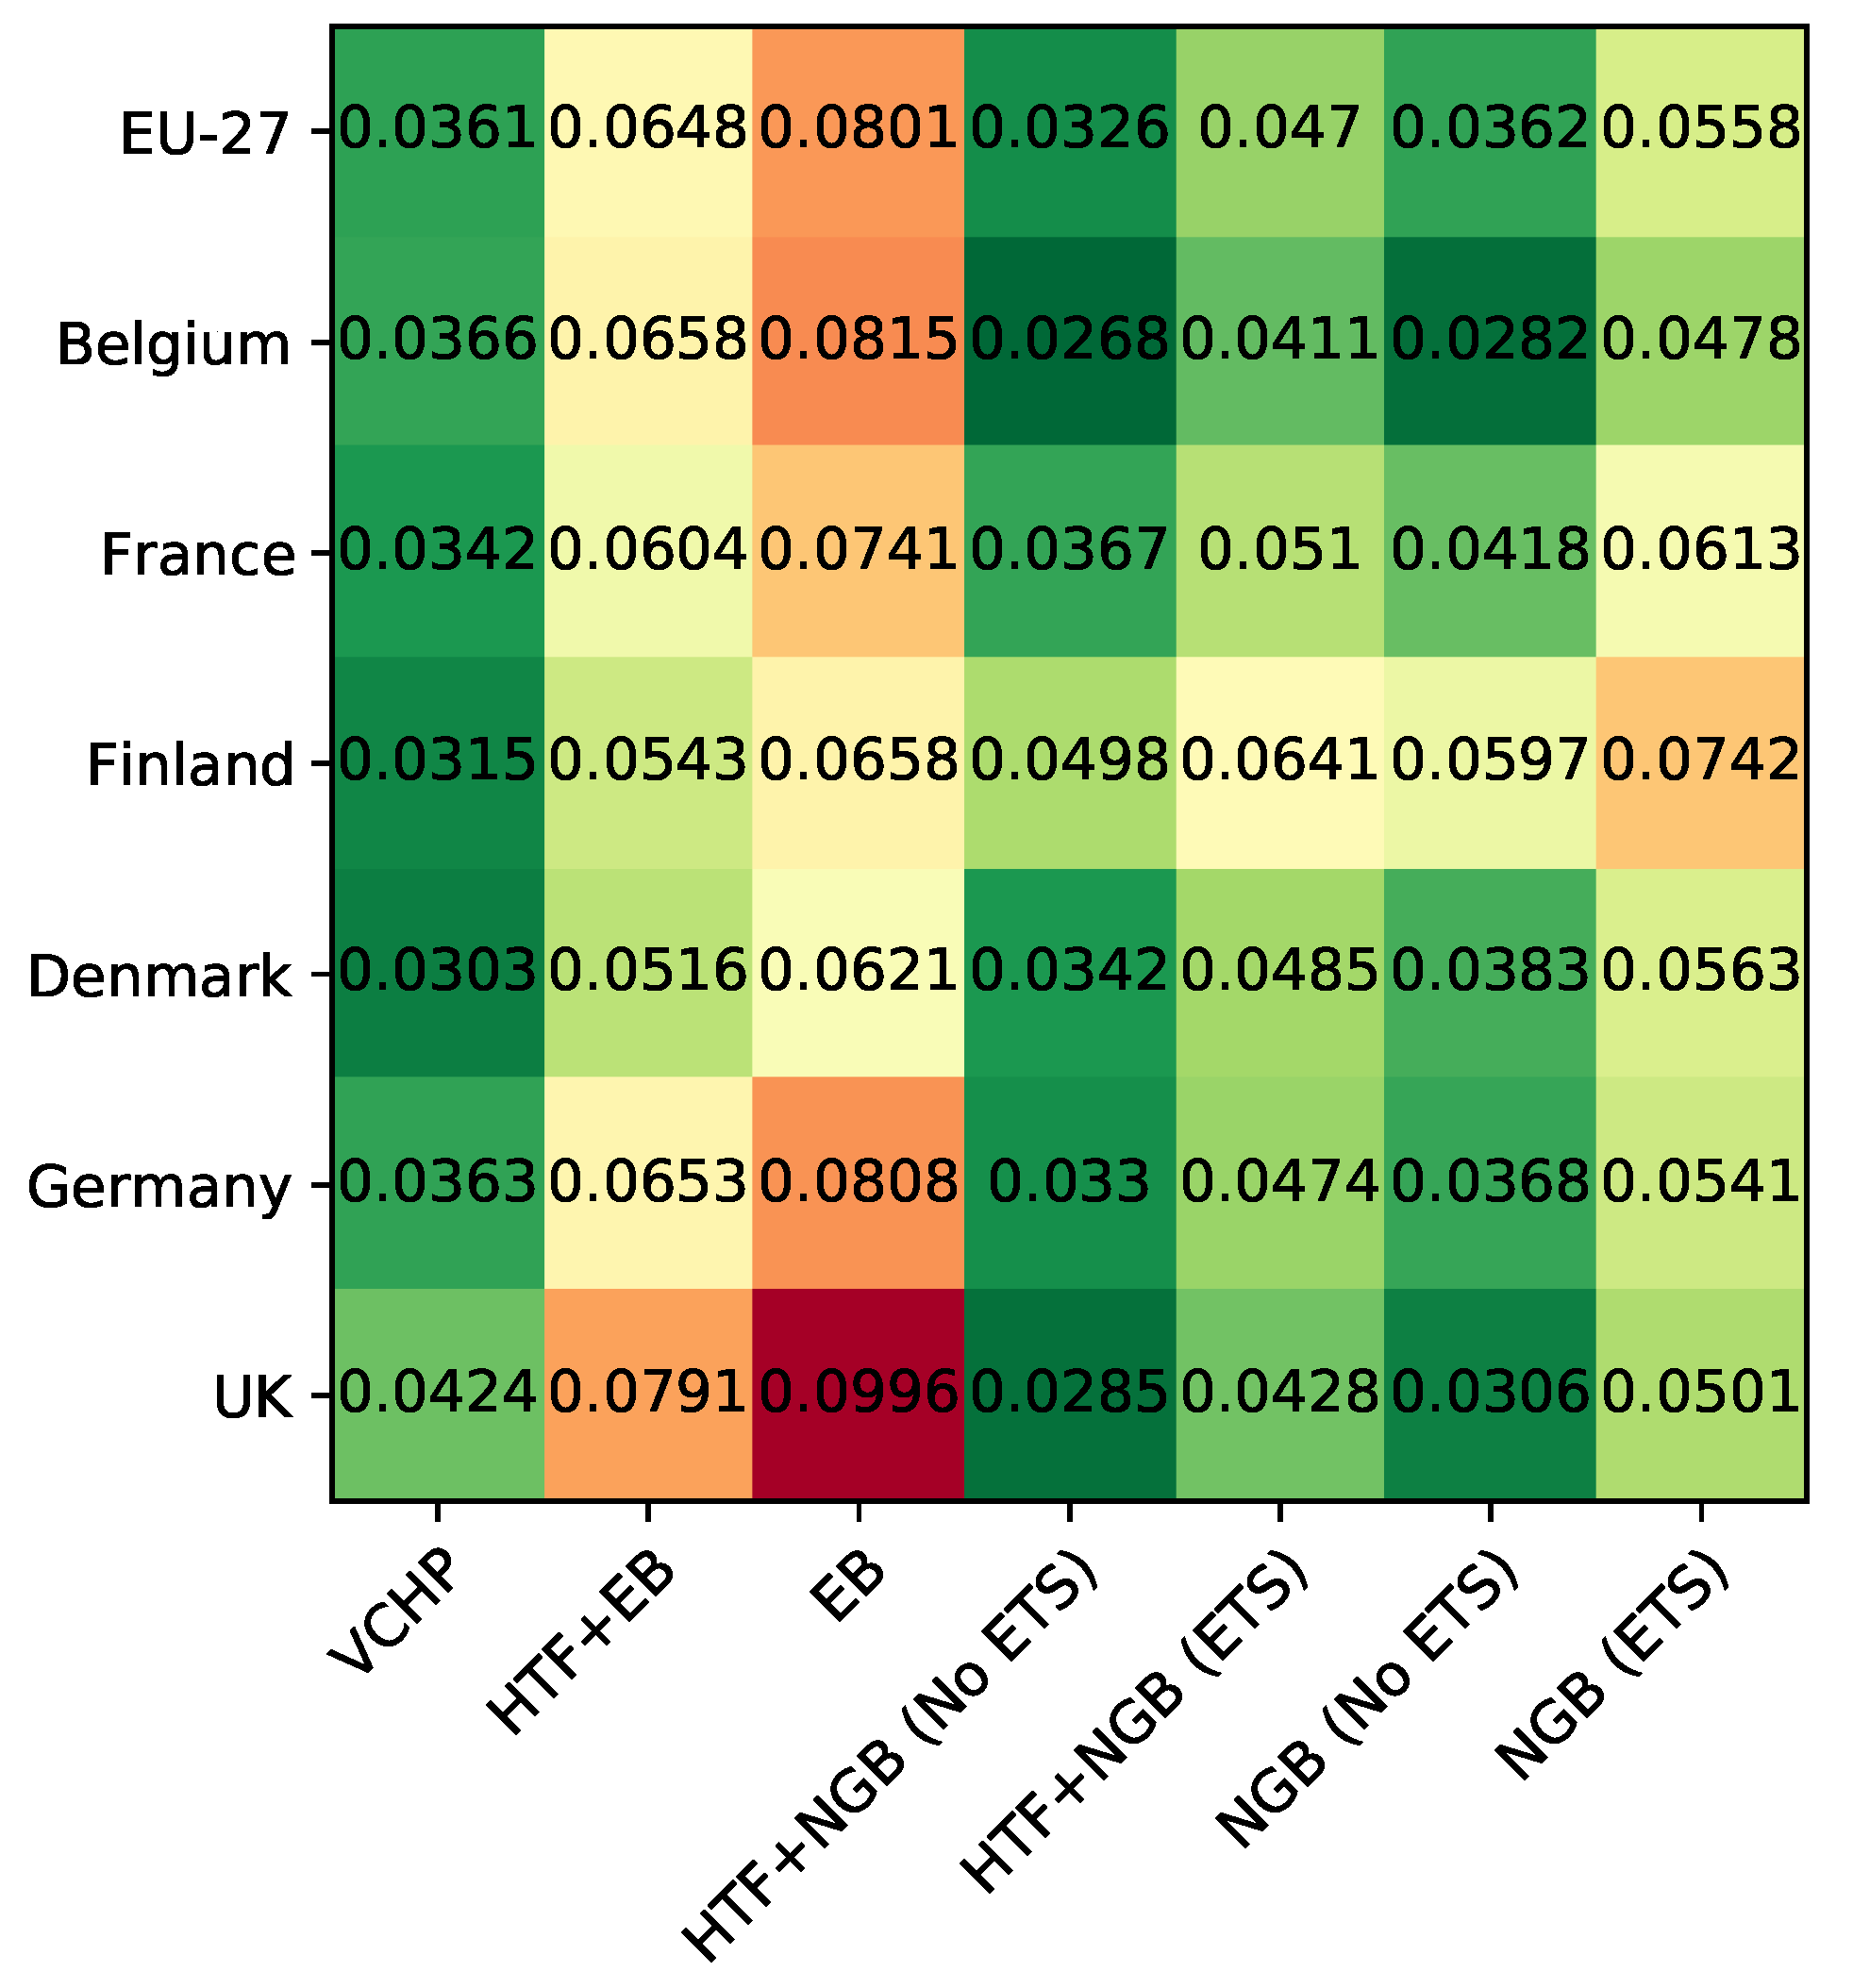
4.3. Financial Benchmark of the Case Studies
4.3.1. Superheated Steam Drying Benchmark
4.3.2. Steam Production Benchmark
5. Sensitivity Analysis
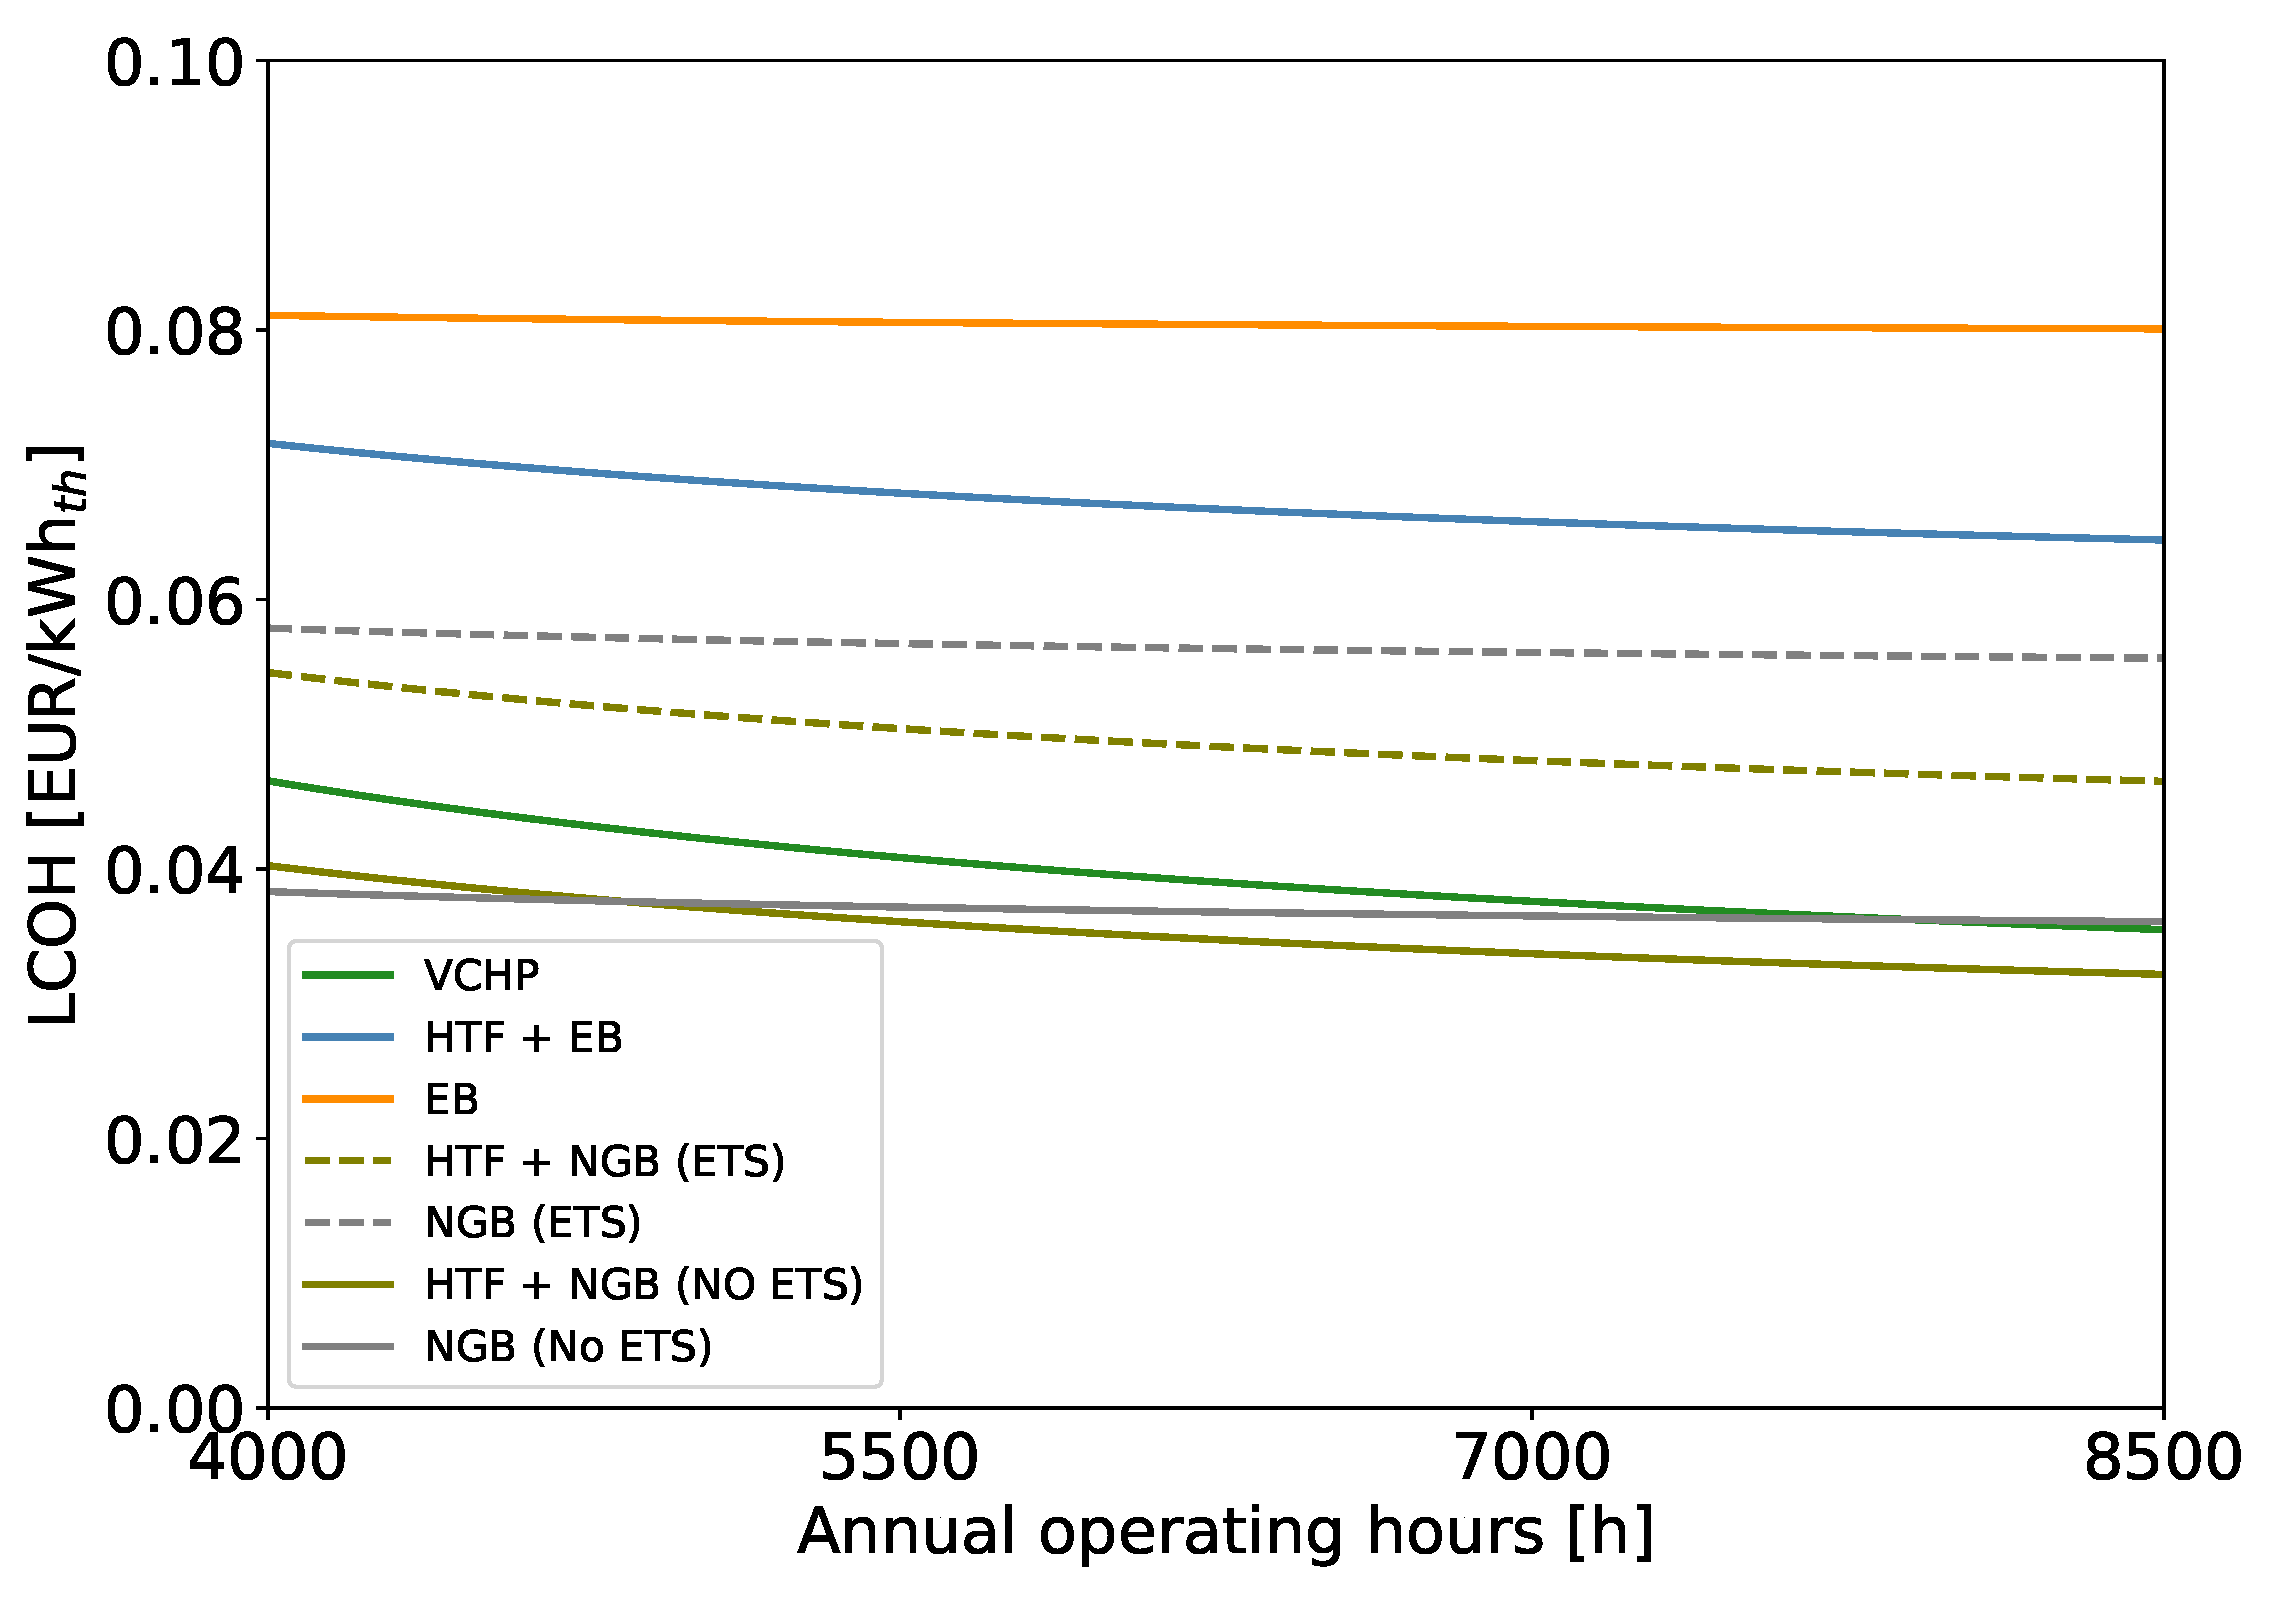
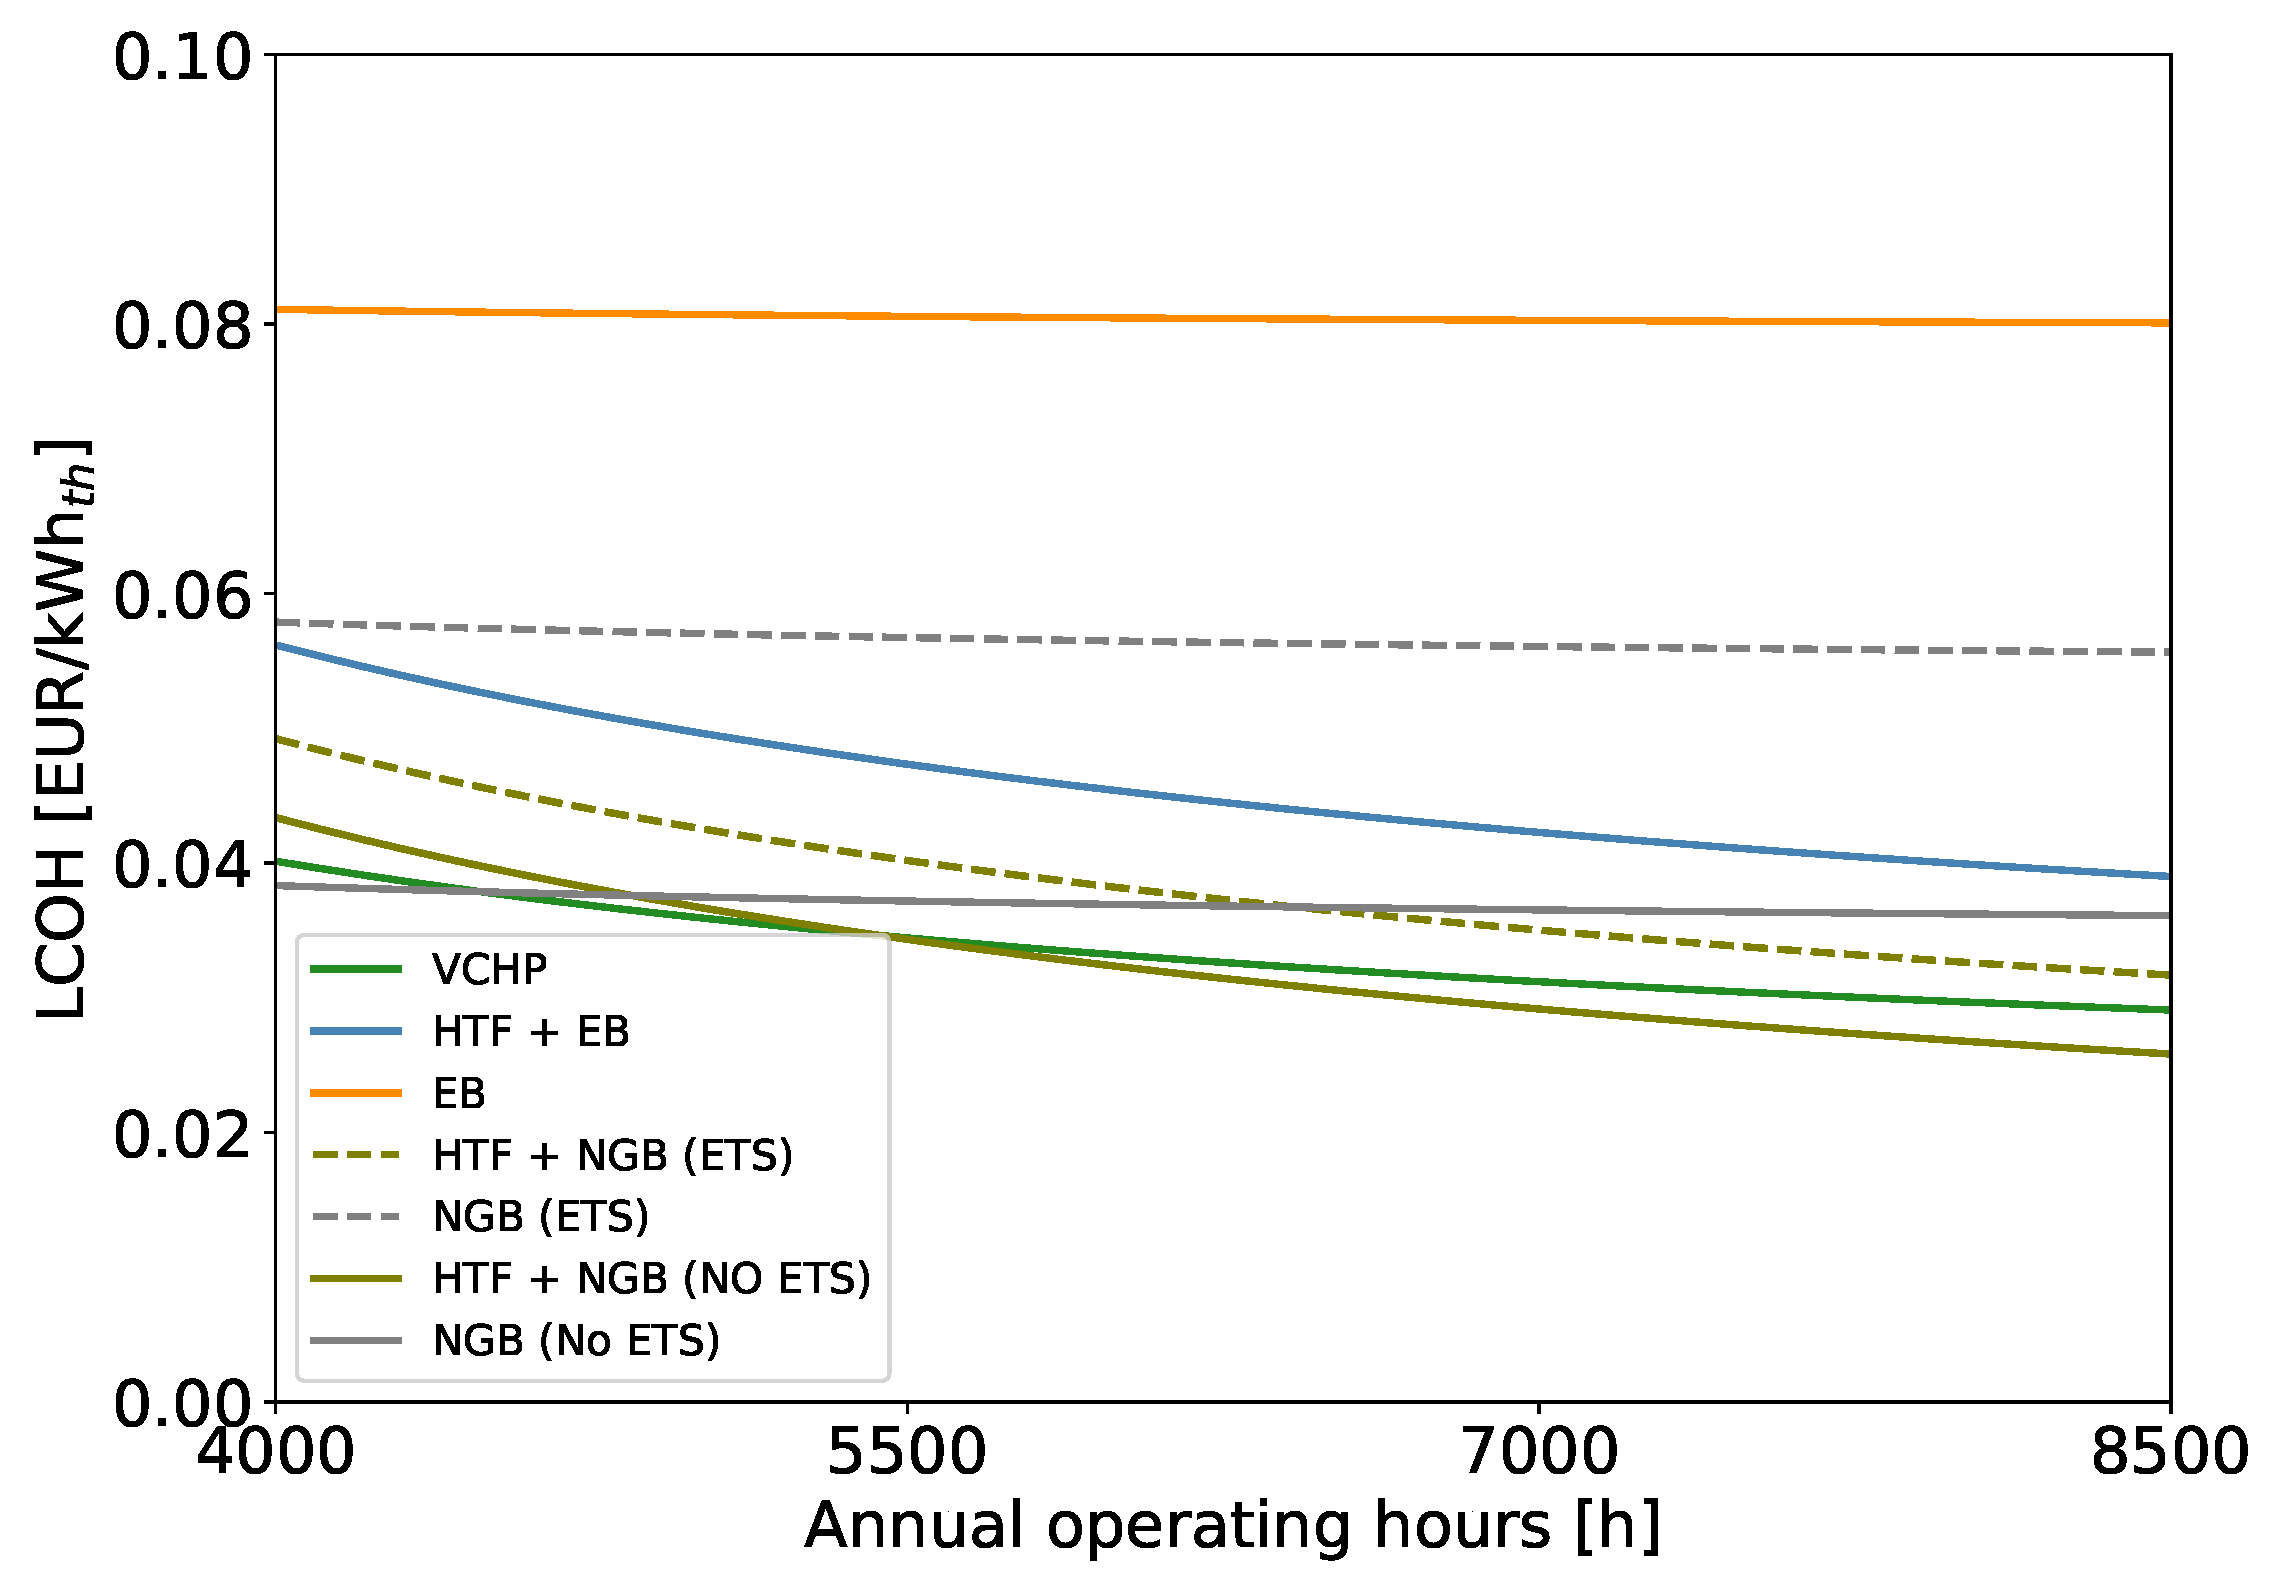
5.1. Influence of the Annual Operating Hours
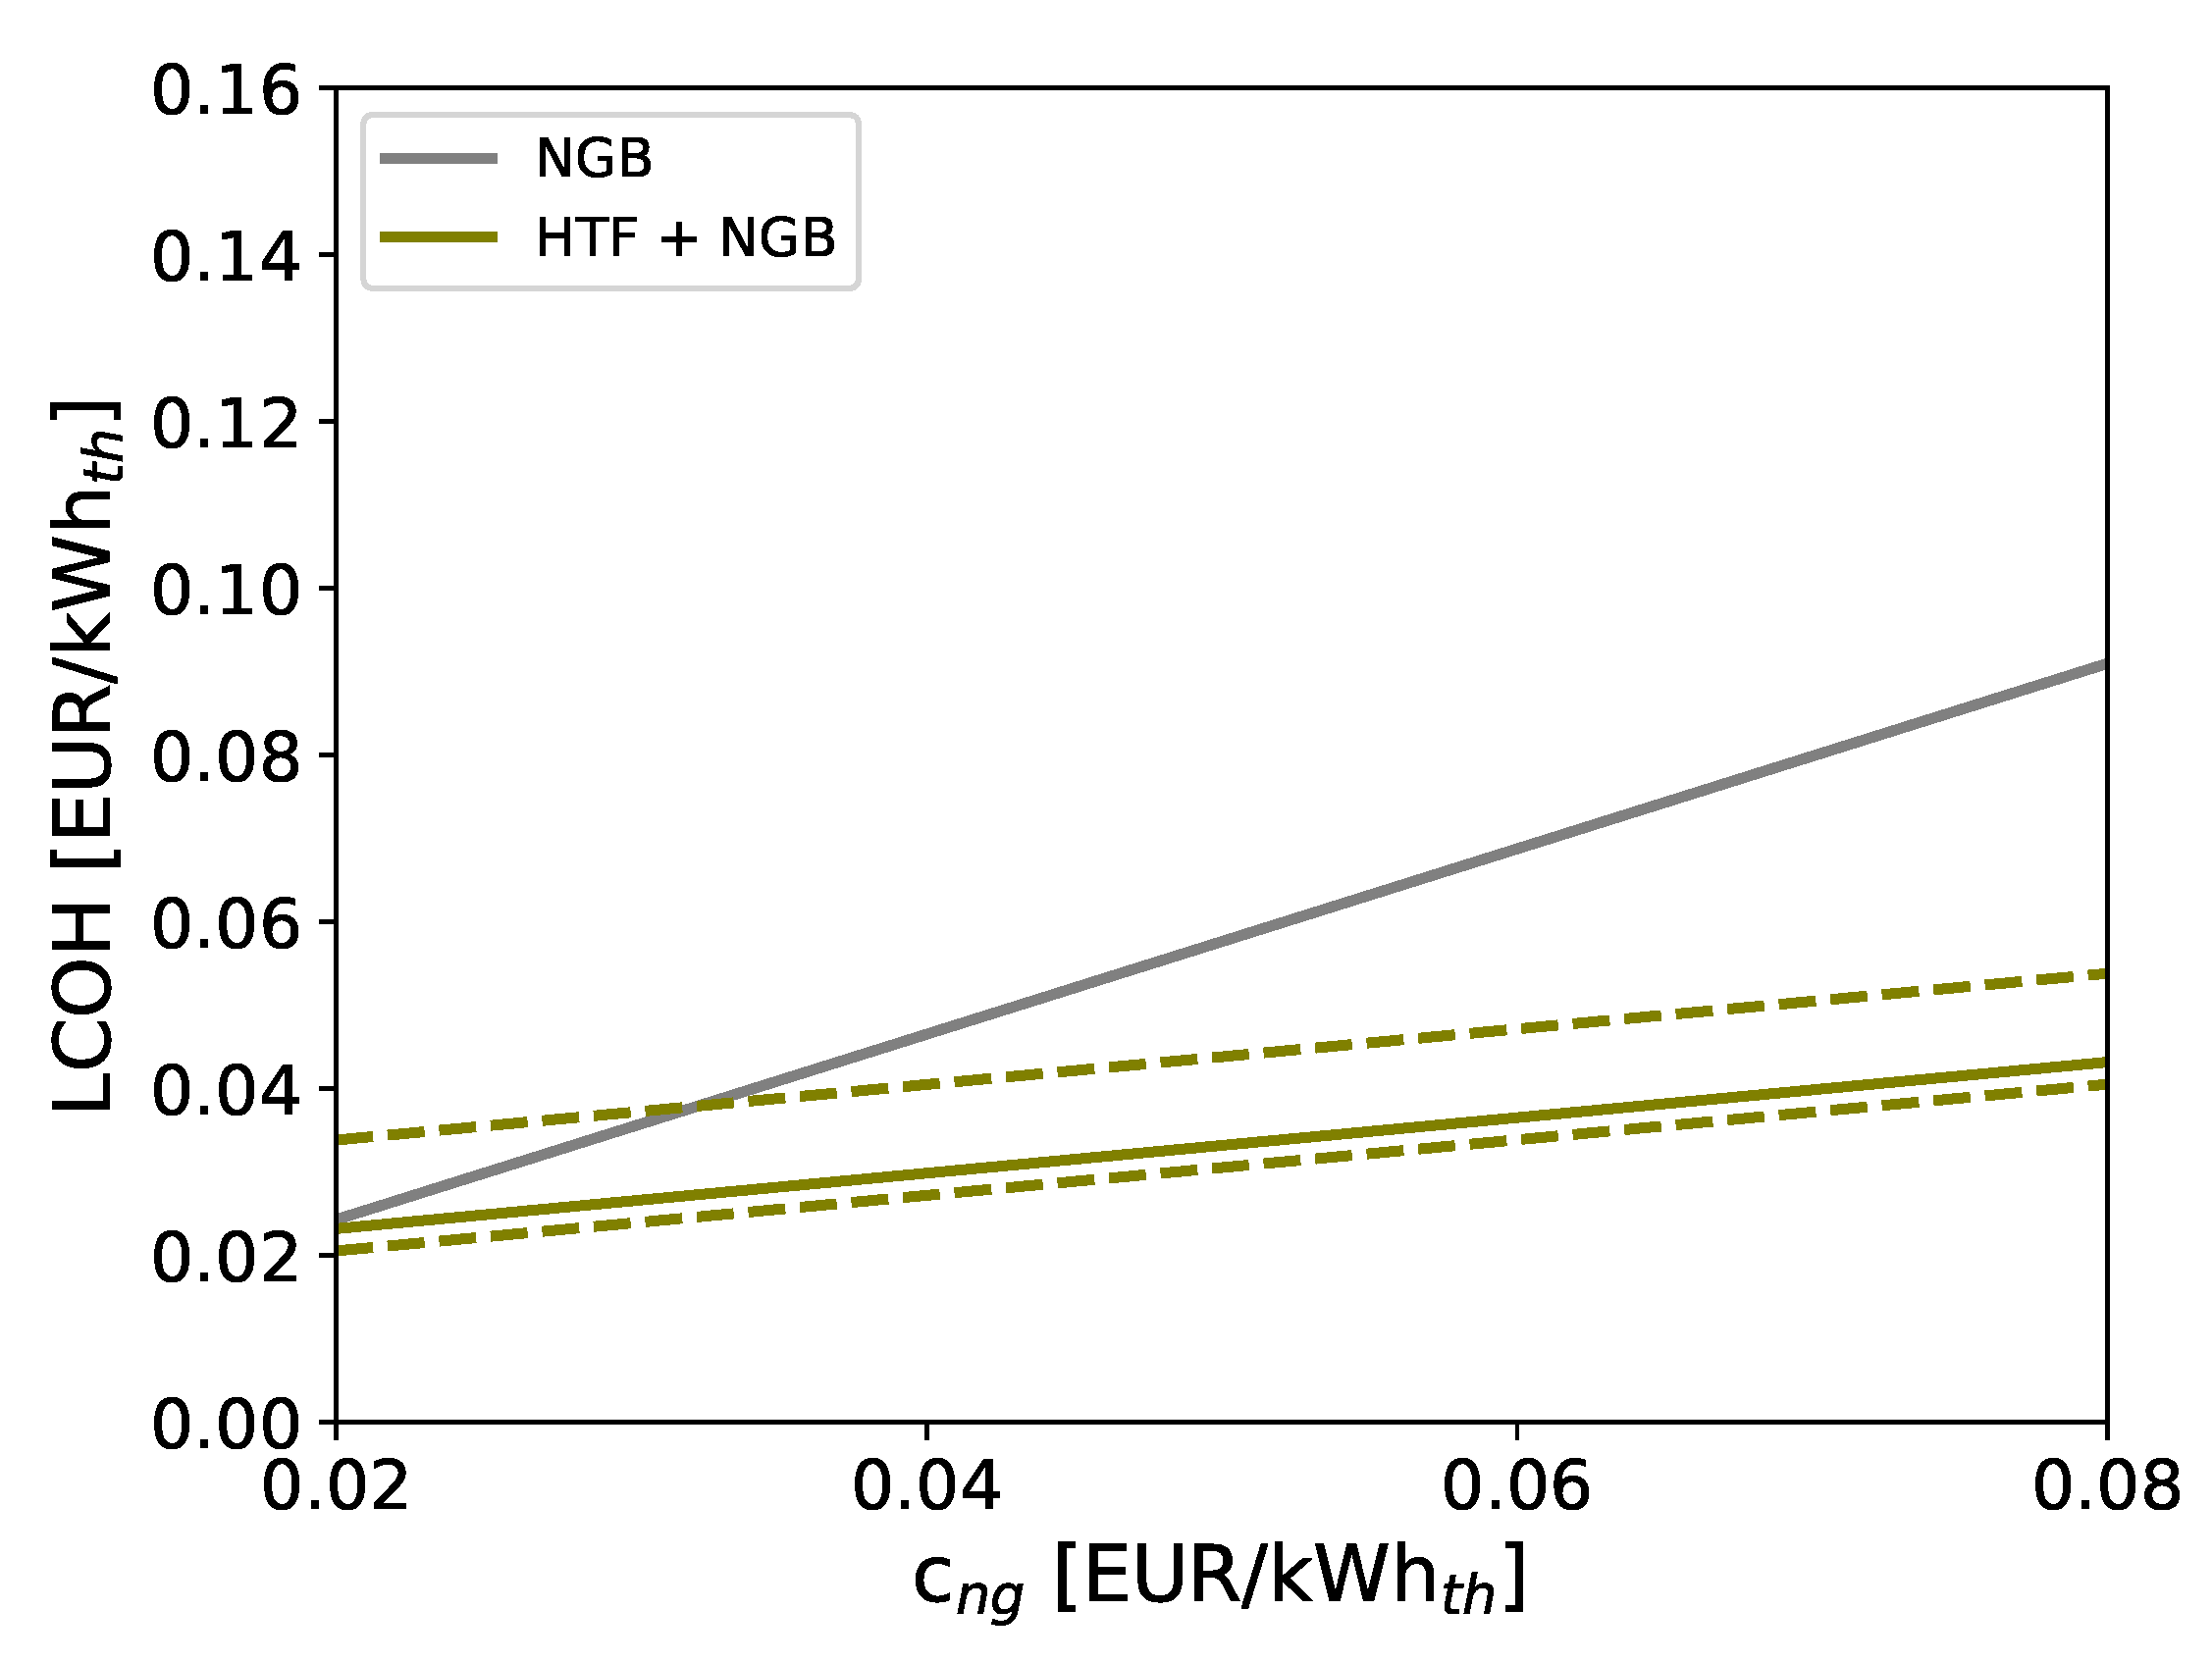
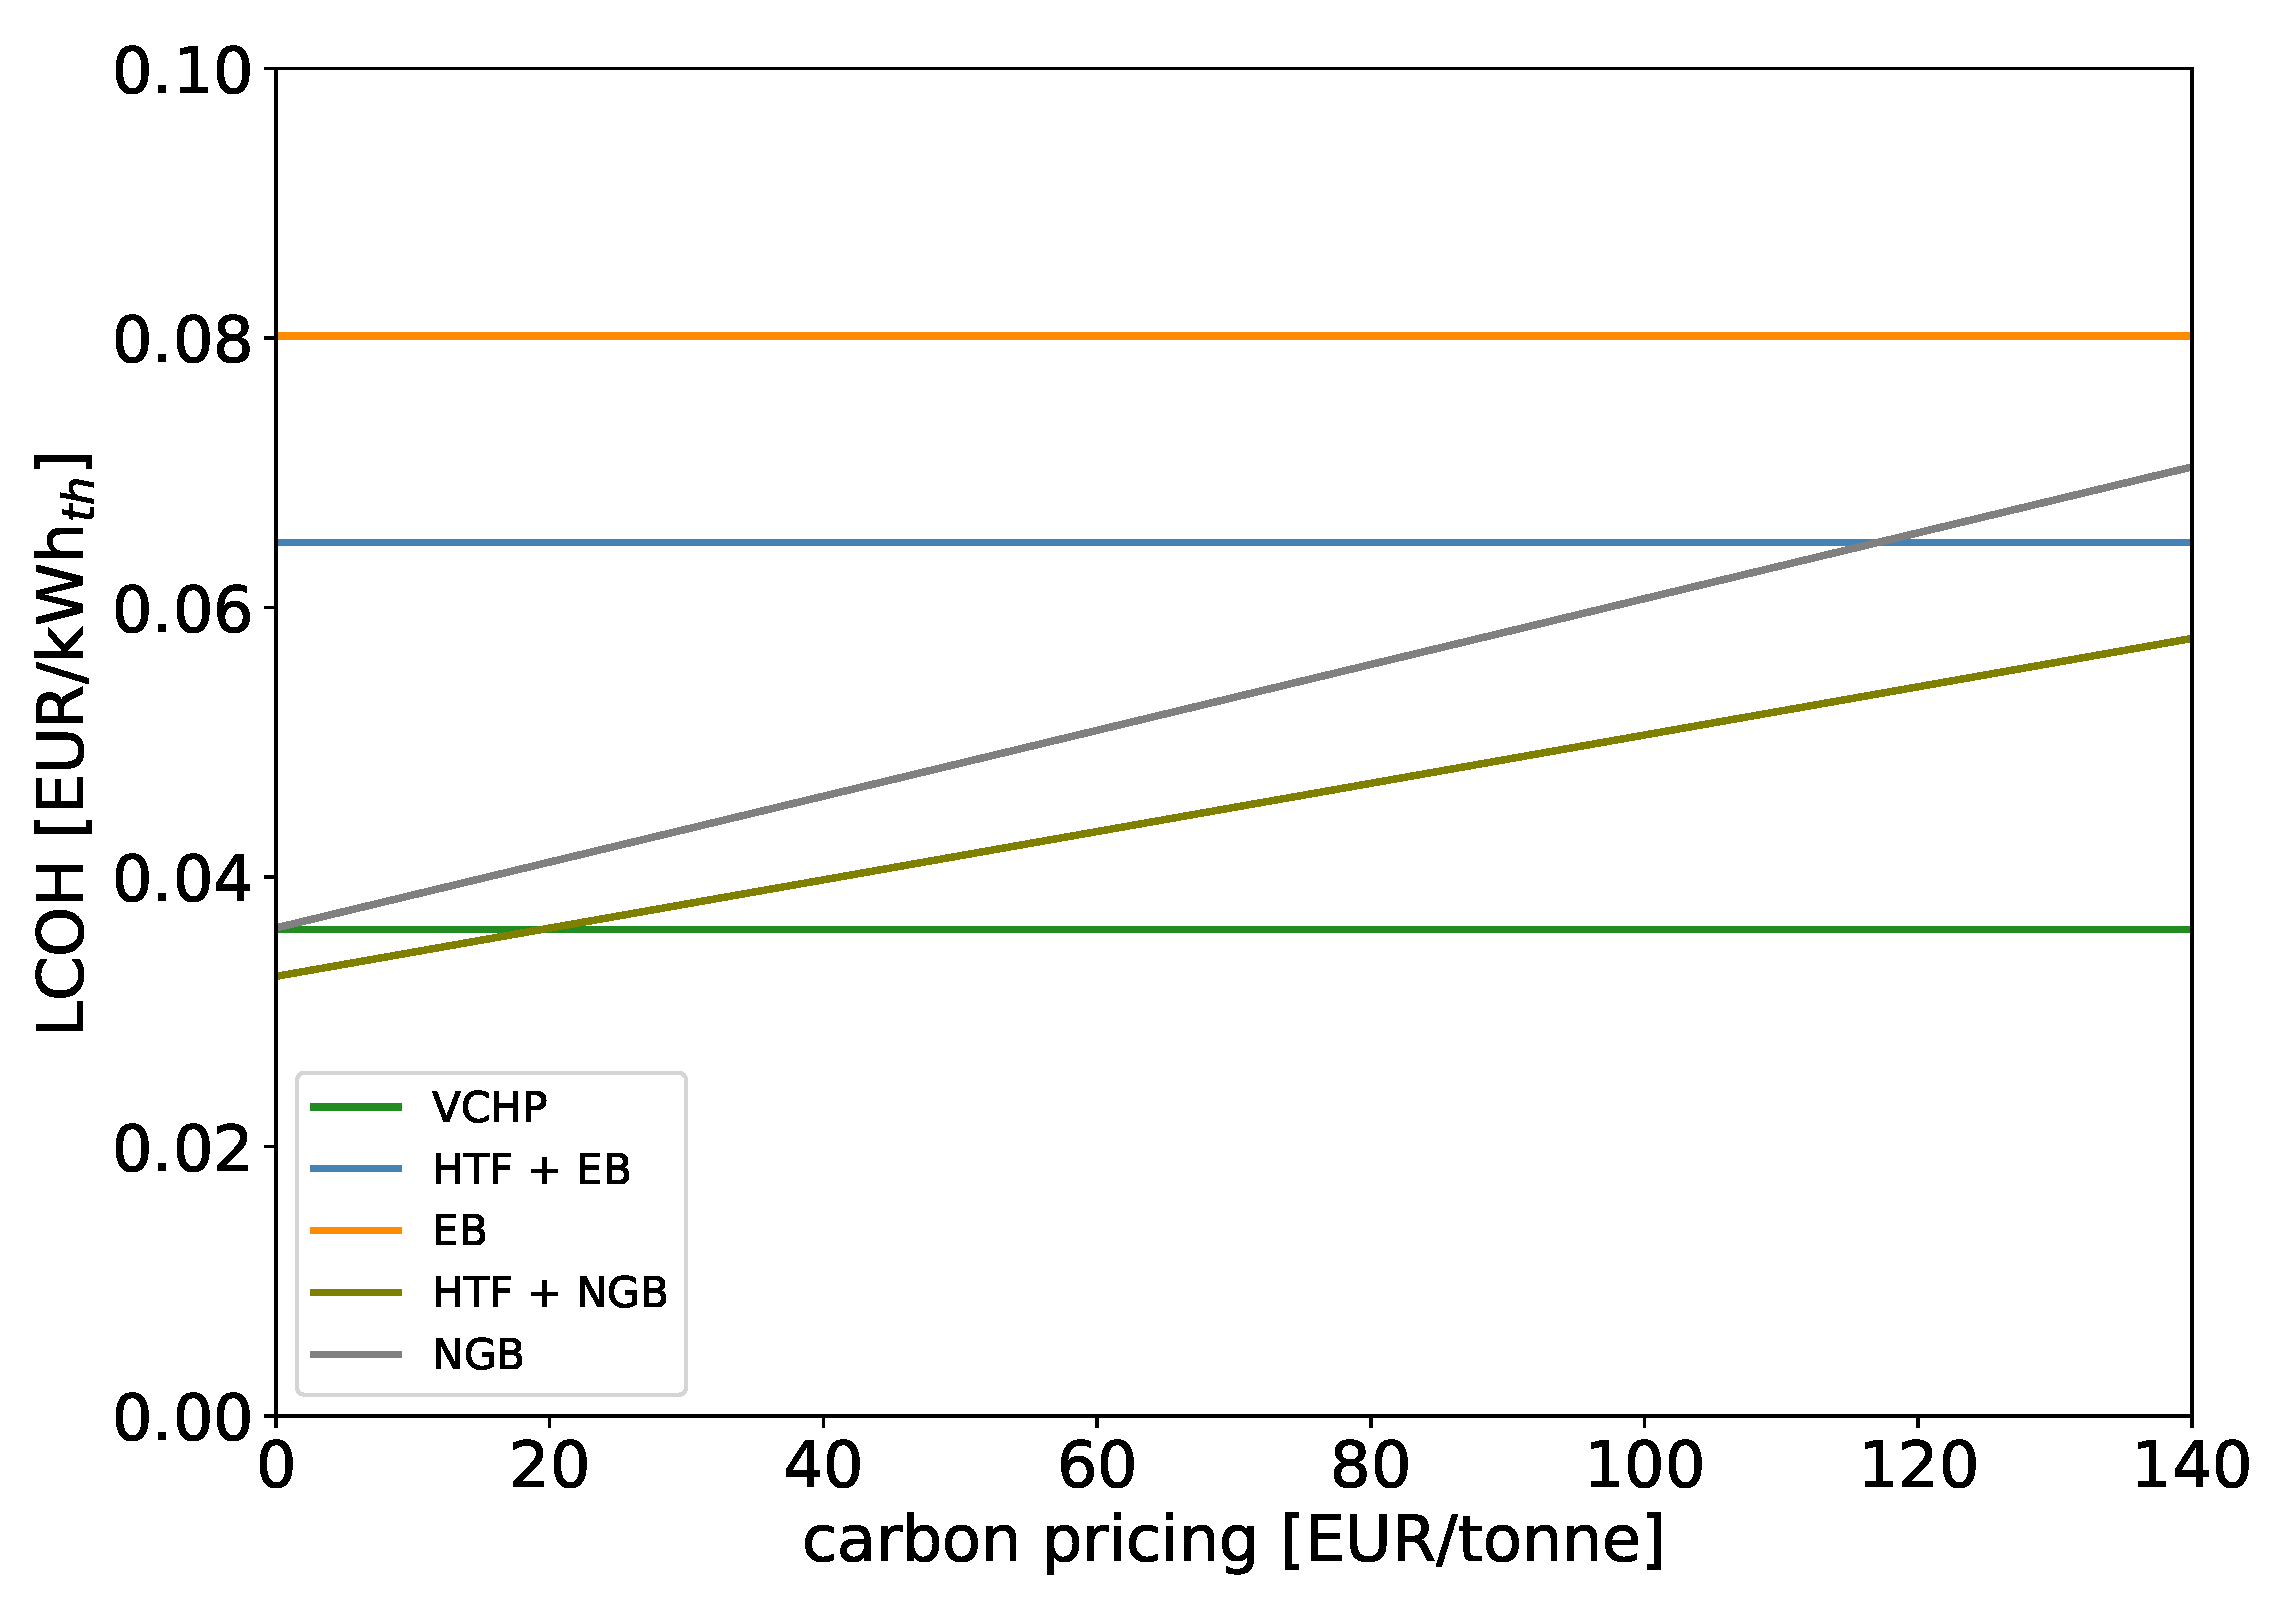
5.2. Influence of the ETS Carbon Pricing
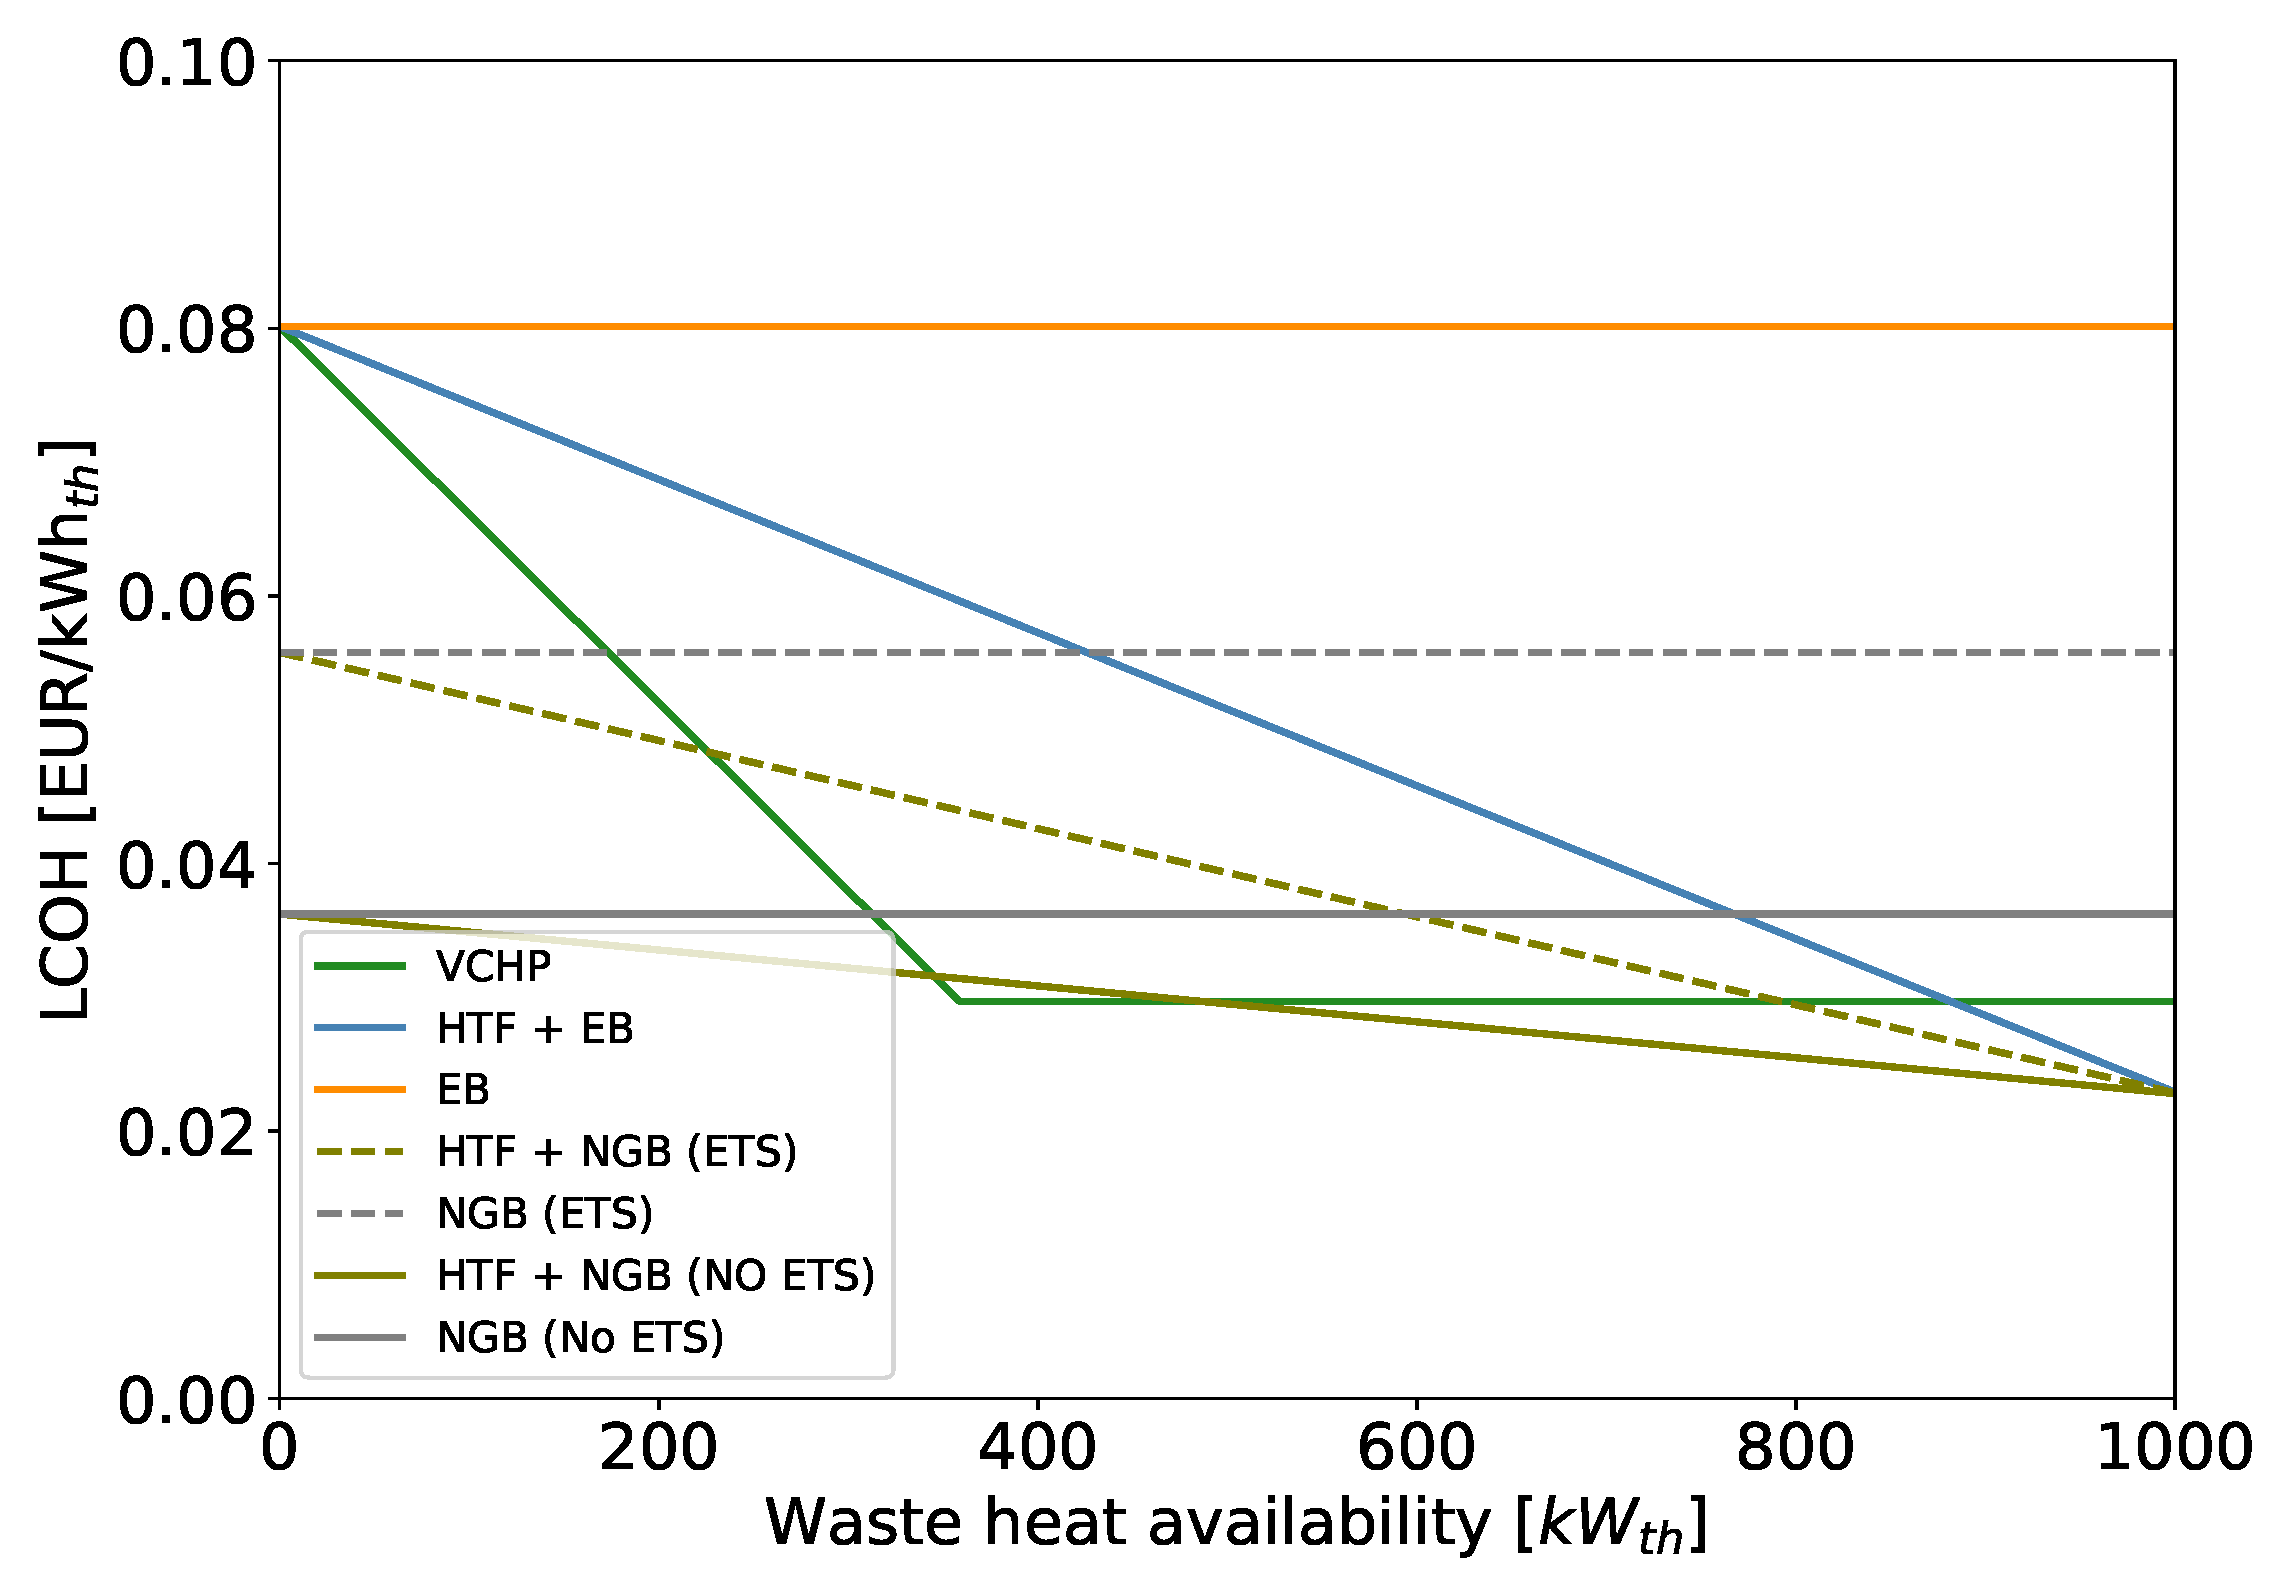
5.3. Influence of the Waste Heat Availability
6. Discussion
7. Conclusions
Author Contributions
Funding
Data Availability Statement
Acknowledgments
Conflicts of Interest
Abbreviations
| Acronyms | |
| C | Cost (EUR) |
| COP | Coefficient of performance |
| CRF | Capital recovery factor |
| ETS | Emissions trading scheme |
| EB | Electric boiler |
| GWP | Global warming potential |
| HDHP | Heat-driven heat pump |
| HTF | Heat transformer |
| HTF + EB | Heat transformer with auxiliary electrical boiler |
| HTF + NGB | Heat transformer with auxiliary natural gas boiler |
| HTHP | High-temperature heat pump |
| MVR | Mechanical vapor recompression |
| NGB | Natural gas boiler |
| SGHP | Steam generating heat pump |
| SSD | Superheated steam drying |
| TRL | Technology readiness level |
| VCHP | Vapor compression heat pump |
| Parameters | |
| GTL | Gross temperature lift (K) |
| C | Cost (EUR) |
| h | Enthalpy (kJ/(kg · K)) |
| i | Discount rate (%) |
| LCOH | Levelized cost of heat (EUR/kWhth) |
| Mass flow rate (kg/s) | |
| n | Lifetime (years) |
| p | Pressure (bar) |
| heat transfer rate (W) | |
| T | Temperature (K) |
| Power (W) | |
| x | Quality (-) |
| Subscripts | |
| a | annual |
| cap | capital |
| el | electrical |
| h | high |
| in | inlet |
| l | low |
| m | medium |
| ng | natural gas |
| out | outlet |
| th | thermal |
References
- Pagliaro, M. An Industry in Transition: The Chemical Industry and the Megatrends Driving Its Forthcoming Transformation. Angew. Chem. Int. Ed. 2019, 58, 11154–11159. [Google Scholar] [CrossRef] [PubMed]
- European Commission. Eurostat Energy Balances. 2019. Available online: https://ec.europa.eu/eurostat/web/energy/data/energy-balances (accessed on 7 July 2021).
- CEFIC—European Chemical Indusry Council. Landscape of the European Chemical Industry—Belgium. Available online: https://cefic.org/a-pillar-of-the-european-economy/landscape-of-the-european-chemical-industry/belgium/ (accessed on 26 January 2022).
- de Boer, R.; Marina, A.; Zühlsdorf, B.; Arpagaus, C.; Bantle, M.; Wilk, V.; Elmegaard, B.; Corberán, J.; Benson, J. Strengthening Industrial Heat Pump Innovation: Decarbonizing Industrial Heat. 2020. Available online: https://orbit.dtu.dk/en/publications/strengthening-industrial-heat-pump-innovation-decarbonizing-indus (accessed on 26 January 2022).
- Haites, E. Carbon taxes and greenhouse gas emissions trading systems: What have we learned? Clim. Policy 2018, 18, 955–966. [Google Scholar] [CrossRef]
- Egenhofer, C. The Making of the EU Emissions Trading Scheme: Status, Prospects and Implications for Business. Eur. Manag. J. 2007, 25, 453–463. [Google Scholar] [CrossRef]
- Zühlsdorf, B.; Bühler, F.; Bantle, M.; Elmegaard, B. Analysis of technologies and potentials for heat pump-based process heat supply above 150 °C. Energy Convers. Manag. X 2019, 2, 100011. [Google Scholar] [CrossRef]
- Vieren, E.; Couvreur, K.; Vander Heyde, J.; De Paepe, M.; Lecompte, S. Techno-economic analysis of high temperature heat pumps. In Proceedings of the HEFAT 2021, Virtual, 25–28 July 2021; pp. 2109–2114. [Google Scholar]
- Bergamini, R.; Jensen, J.K.; Elmegaard, B. Thermodynamic competitiveness of high temperature vapor compression heat pumps for boiler substitution. Energy 2019, 182, 110–121. [Google Scholar] [CrossRef]
- Marina, A.; Spoelstra, S.; Zondag, H.; Wemmers, A. An estimation of the European industrial heat pump market potential. Renew. Sustain. Energy Rev. 2021, 139, 110545. [Google Scholar] [CrossRef]
- International Energy Agency (IEA); Heat Pump Technologies (HPT). Annex58 Task 1: Technologies—State of the Art and Ongoing Developments for Systems and Components. 2022. Available online: https://heatpumpingtechnologies.org/annex58/task1/ (accessed on 7 July 2022).
- Arpagaus, C.; Bless, F.; Uhlmann, M.; Schiffmann, J.; Bertsch, S.S. High temperature heat pumps: Market overview, state of the art, research status, refrigerants, and application potentials. Energy 2018, 152, 985–1010. [Google Scholar] [CrossRef]
- Schlosser, F.; Jesper, M.; Vogelsang, J.; Walmsley, T.; Arpagaus, C.; Hesselbach, J. Large-scale heat pumps: Applications, performance, economic feasibility and industrial integration. Renew. Sustain. Energy Rev. 2020, 133, 110219. [Google Scholar] [CrossRef]
- van de Bor, D.; Infante Ferreira, C. Quick selection of industrial heat pump types including the impact of thermodynamic losses. Energy 2013, 53, 312–322. [Google Scholar] [CrossRef]
- Khamooshi, M.; Parham, K.; Yari, M.; Babadi, S.; Egelioglu, F.; Salati, H. Thermodynamic Analysis and Optimization of a High Temperature Triple Absorption Heat Transformer. Sci. World J. 2014, 2014, 980452. [Google Scholar] [CrossRef] [PubMed]
- Mounier, V.; Mendoza, L.C.; Schiffmann, J. Thermo-economic optimization of an ORC driven heat pump based on small scale turbomachinery and comparison with absorption heat pumps. Int. J. Refrig. 2017, 81, 96–110. [Google Scholar] [CrossRef]
- Xu, Z.; Wang, R. Absorption heat pump for waste heat reuse: Current states and future development. Front. Energy 2017, 11, 414–436. [Google Scholar] [CrossRef]
- Wu, D.; Hu, B.; Wang, R. Vapor compression heat pumps with pure Low-GWP refrigerants. Renew. Sustain. Energy Rev. 2021, 138, 110571. [Google Scholar] [CrossRef]
- Mateu-Royo, C.; Navarro-Esbrí, J.; Mota-Babiloni, A.; Amat-Albuixech, M.; Molés, F. Theoretical evaluation of different high-temperature heat pump configurations for low-grade waste heat recovery. Int. J. Refrig. 2018, 90, 229–237. [Google Scholar] [CrossRef]
- Jiang, J.; Hu, B.; Wang, R.; Deng, N.; Cao, F.; Wang, C.C. A review and perspective on industry high-temperature heat pumps. Renew. Sustain. Energy Rev. 2022, 161, 112106. [Google Scholar] [CrossRef]
- Vieren, E.; Demeester, T.; Beyne, W.; Arteconi, A.; De Paepe, M.; Lecompte, S. The thermodynamic potential of high-temperature transcritical heat pump cycles for industrial processes with large temperature glides. Appl. Therm. Eng. 2023, 234, 121197. [Google Scholar] [CrossRef]
- Bamigbetan, O.; Eikevik, T.M.; Nekså, P.; Bantle, M.; Schlemminger, C. Experimental investigation of a prototype R-600 compressor for high temperature heat pump. Energy 2019, 169, 730–738. [Google Scholar] [CrossRef]
- Sun, J.; Wang, Y.; Qin, Y.; Wang, G.; Liu, R.; Yang, Y. A Review of Super-High-Temperature Heat Pumps over 100 °C. Energies 2023, 16, 4591. [Google Scholar] [CrossRef]
- Boman, D.; Raymond, A.; Garimella, S. Adsorption Heat Pumps: Fundamentals and Applications; Springer: Cham, Switzerland, 2021. [Google Scholar] [CrossRef]
- U.S. Department of Energy. Industrial Heat Pumps for Steam and Fuel Savings. 2020. Available online: https://www.energy.gov/eere/amo/downloads/industrial-heat-pumps-steam-and-fuel-savings (accessed on 10 August 2021).
- Kühn, A. (Ed.) Thermally Driven Heat Pumps for Heating and Cooling; Universitätsverlag der TU: Berlin, Germany, 2013. [Google Scholar] [CrossRef]
- Wu, W.; Wang, B.; Shi, W.; Li, X. Absorption heating technologies: A review and perspective. Appl. Energy 2014, 130, 51–71. [Google Scholar] [CrossRef]
- Demir, H.; Mobedi, M.; Ülkü, S. A review on adsorption heat pump: Problems and solutions. Renew. Sustain. Energy Rev. 2008, 12, 2381–2403. [Google Scholar] [CrossRef]
- Parham, K.; Khamooshi, M.; Tematio, D.B.K.; Yari, M.; Atikol, U. Absorption heat transformers—A comprehensive review. Renew. Sustain. Energy Rev. 2014, 34, 430–452. [Google Scholar] [CrossRef]
- Donnellan, P.; Cronin, K.; Byrne, E. Recycling waste heat energy using vapour absorption heat transformers: A review. Renew. Sustain. Energy Rev. 2015, 42, 1290–1304. [Google Scholar] [CrossRef]
- Sözen, A.; Yücesu, H.S. Performance improvement of absorption heat transformer. Renew. Energy 2007, 32, 267–284. [Google Scholar] [CrossRef]
- Ma, X.; Chen, J.; Li, S.; Sha, Q.; Liang, A.; Li, W.; Zhang, J.; Zheng, G.; Feng, Z. Application of absorption heat transformer to recover waste heat from a synthetic rubber plant. Appl. Therm. Eng. 2003, 23, 797–806. [Google Scholar] [CrossRef]
- DeCicco, J.; Liu, D.; Heo, J.; Krishnan, R.; Kurthen, A.; Wang, L. Carbon balance effects of U.S. biofuel production and use. Clim. Chang. 2016, 138, 667–680. [Google Scholar] [CrossRef]
- Kosmadakis, G. Estimating the potential of industrial (high-temperature) heat pumps for exploiting waste heat in EU industries. Appl. Therm. Eng. 2019, 156, 287–298. [Google Scholar] [CrossRef]
- Brückner, S.; Liu, S.; Miró, L.; Radspieler, M.; Cabeza, L.F.; Lävemann, E. Industrial waste heat recovery technologies: An economic analysis of heat transformation technologies. Appl. Energy 2015, 151, 157–167. [Google Scholar] [CrossRef]
- Zhang, J.; Zhang, H.H.; He, Y.L.; Tao, W.Q. A comprehensive review on advances and applications of industrial heat pumps based on the practices in China. Appl. Energy 2016, 178, 800–825. [Google Scholar] [CrossRef]
- Saha, B.B.; Uddin, K.; Pal, A.; Thu, K. Emerging sorption pairs for heat pump applications: An overview. JMST Adv. 2019, 1, 161–180. [Google Scholar] [CrossRef]
- Dias, J.M.; Costa, V.A. Adsorption heat pumps for heating applications: A review of current state, literature gaps and development challenges. Renew. Sustain. Energy Rev. 2018, 98, 317–327. [Google Scholar] [CrossRef]
- Pinheiro, J.M.; Salústio, S.; Rocha, J.; Valente, A.A.; Silva, C.M. Adsorption heat pumps for heating applications. Renew. Sustain. Energy Rev. 2020, 119, 109528. [Google Scholar] [CrossRef]
- McLinden, M.O.; Kazakov, A.F.; Steven Brown, J.; Domanski, P.A. A thermodynamic analysis of refrigerants: Possibilities and tradeoffs for Low-GWP refrigerants. Int. J. Refrig. 2014, 38, 80–92. [Google Scholar] [CrossRef]
- Kosmadakis, G.; Arpagaus, C.; Neofytou, P.; Bertsch, S. Techno-economic analysis of high-temperature heat pumps with low-global warming potential refrigerants for upgrading waste heat up to 150 °C. Energy Convers. Manag. 2020, 226, 113488. [Google Scholar] [CrossRef]
- Bamigbetan, O.; Eikevik, T.M.; Nekså, P.; Bantle, M. Review of vapour compression heat pumps for high temperature heating using natural working fluids. Int. J. Refrig. 2017, 80, 197–211. [Google Scholar] [CrossRef]
- Ai, S.; Wang, B.; Li, X.; Shi, W. Analysis of a heat recovery system of the spray-drying process in a soy protein powder plant. Appl. Therm. Eng. 2016, 103, 1022–1030. [Google Scholar] [CrossRef]
- Matsuda, K.; Kurosaki, D.; Hayashi, D.; Aoyama, K. Industrial Heat Pump Study Using Pinch Technology for a Large Scale Petrochemical Site. Chem. Eng. Trans. 2012, 29, 67–72. [Google Scholar] [CrossRef]
- Zhang, Q.; Yang, S.; Shi, P.; Hou, W.; Zeng, A.; Ma, Y.; Yuan, X. Economically and thermodynamically efficient heat pump-assisted side-stream pressure-swing distillation arrangement for separating a maximum-boiling azeotrope. Appl. Therm. Eng. 2020, 173, 115228. [Google Scholar] [CrossRef]
- Shahandeh, H.; Jafari, M.; Kasiri, N.; Ivakpour, J. Economic optimization of heat pump-assisted distillation columns in methanol-water separation. Energy 2015, 80, 496–508. [Google Scholar] [CrossRef]
- Marina, A.; Spoelstra, S.; Zondag, H.; Wemmers, A. Industrial process and waste heat data for EU28. Mendeley Data 2020. [Google Scholar] [CrossRef]
- Kiss, A.A.; Smith, R. Rethinking energy use in distillation processes for a more sustainable chemical industry. Energy 2020, 203, 117788. [Google Scholar] [CrossRef]
- Luo, H.; Bildea, C.S.; Kiss, A.A. Novel Heat-Pump-Assisted Extractive Distillation for Bioethanol Purification. Ind. Eng. Chem. Res. 2015, 54, 2208–2213. [Google Scholar] [CrossRef]
- Jana, A. Advances in heat pump assisted distillation column: A review. Energy Convers. Manag. 2014, 77, 287–297. [Google Scholar] [CrossRef]
- Kiss, A.A.; Flores Landaeta, S.J.; Infante Ferreira, C.A. Towards energy efficient distillation technologies—Making the right choice. Energy 2012, 47, 531–542. [Google Scholar] [CrossRef]
- Chew, J.M.; Reddy, C.; Rangaiah, G. Improving energy efficiency of dividing-wall columns using heat pumps, Organic Rankine Cycle and Kalina Cycle. Chem. Eng. Process. Process. Intensif. 2014, 76, 45–59. [Google Scholar] [CrossRef]
- Kazemi, A.; Mehrabani-Zeinabad, A.; Beheshti, M. Recently developed heat pump assisted distillation configurations: A comparative study. Appl. Energy 2018, 211, 1261–1281. [Google Scholar] [CrossRef]
- You, X.; Rodriguez-Donis, I.; Gerbaud, V. Reducing process cost and CO2 emissions for extractive distillation by double-effect heat integration and mechanical heat pump. Appl. Energy 2016, 166, 128–140. [Google Scholar] [CrossRef]
- Goh, L.J.; Othman, M.Y.; Mat, S.; Ruslan, H.; Sopian, K. Review of heat pump systems for drying application. Renew. Sustain. Energy Rev. 2011, 15, 4788–4796. [Google Scholar] [CrossRef]
- Mujumdar, A. Handbook of Industrial Drying; CRC Press: Boca Raton, FL, USA, 2006. [Google Scholar]
- DryFiciency Project. Available online: http://dry-f.eu/ (accessed on 26 July 2021).
- Wang, J.; Brown, C.; Cleland, D. Heat pump heat recovery options for food industry dryers. Int. J. Refrig. 2018, 86, 48–55. [Google Scholar] [CrossRef]
- Zühlsdorf, B.; Bühler, F.; Mancini, R.; Cignitti, S.; Elmegaard, B. High Temperature Heat Pump Integration using Zeotropic Working Fluids for Spray Drying Facilities. In Proceedings of the 12th IEA Heat Pump Conference; Rotterdam, The Netherlands, 15–18 May 2017. [Google Scholar]
- Law, C.L.; Chen, H.H.; Mujumdar, A.S. Food Technologies: Drying. Encycl. Food Saf. 2014, 3, 156–167. [Google Scholar] [CrossRef]
- Romdhana, H.; Bonazzi, C.; Esteban-Decloux, M. Superheated Steam Drying: An Overview of Pilot and Industrial Dryers with a Focus on Energy Efficiency. Dry. Technol. 2015, 33, 1255–1274. [Google Scholar] [CrossRef]
- Bless, F.; Arpagaus, C.; Bertsch, S.S.; Schiffmann, J. Theoretical analysis of steam generation methods - Energy, CO2 emission, and cost analysis. Energy 2017, 129, 114–121. [Google Scholar] [CrossRef]
- Lee, G.; Lee, B.; Cho, J.; Ra, H.; Baik, Y.; Shin, H.K.; Lee, Y.S. Development of Steam Generation Heat Pump through Refrigerant Replacement Approach. In Proceedings of the 12th IEA Heat Pump Conference, Rotterdam, The Netherlands, 15–18 May 2017. [Google Scholar]
- Kang, D.H.; Na, S.I.; Kim, M.S. Recent Researches on Steam Generation Heat Pump System. Int. J. Air Cond. Refrig. 2017, 25, 1730005. [Google Scholar] [CrossRef]
- Kaida, T.; Sakuraba, I.; Hashimoto, K.; Hasegawa, H. Experimental performance evaluation of heat pump-based steam supply system. IOP Conf. Ser. Mater. Sci. Eng. 2015, 90, 012076. [Google Scholar] [CrossRef]
- Alicilar, A.; Doǧan, M.; Gürü, M. Optimization of a double stage flash system. Int. J. Energy Res. 1995, 19, 169–179. [Google Scholar] [CrossRef]
- Bang-Møller, C.; Rokni, M.; Elmegaard, B.; Ahrenfeldt, J.; Henriksen, U. Decentralized combined heat and power production by two-stage biomass gasification and solid oxide fuel cells. Energy 2013, 58, 527–537. [Google Scholar] [CrossRef]
- Clausen, L.R.; Elmegaard, B.; Ahrenfeldt, J.; Henriksen, U. Thermodynamic analysis of small-scale dimethyl ether (DME) and methanol plants based on the efficient two-stage gasifier. Energy 2011, 36, 5805–5814. [Google Scholar] [CrossRef]
- Meyers, S.; Schmitt, B.; Chester-Jones, M.; Sturm, B. Energy efficiency, carbon emissions, and measures towards their improvement in the food and beverage sector for six European countries. Energy 2016, 104, 266–283. [Google Scholar] [CrossRef]
- Ommen, T.; Jensen, J.K.; Brix Markussen, W.; Reinholdt, L.; Elmegaard, B. Mots-cles: Pompes a chaleur industrielles; Domaine de fonctionnement; Evaluation economique; Fluides actifs naturels; Methode de conception de Pinch. Int. J. Refrig. 2015, 55, 168–182. [Google Scholar] [CrossRef]
- Lemmens, S.; Lecompte, S. Case study of an organic Rankine cycle applied for excess heat recovery: Technical, economic and policy matters. Energy Convers. Manag. 2017, 138, 670–685. [Google Scholar] [CrossRef]
- Meyers, S.; Schmitt, B.; Vajen, K. The future of low carbon industrial process heat: A comparison between solar thermal and heat pumps. Sol. Energy 2018, 173, 893–904. [Google Scholar] [CrossRef]
- Pensini, A.; Rasmussen, C.N.; Kempton, W. Economic analysis of using excess renewable electricity to displace heating fuels. Appl. Energy 2014, 131, 530–543. [Google Scholar] [CrossRef]
- Akhtari, M.R.; Shayegh, I.; Karimi, N. Techno-economic assessment and optimization of a hybrid renewable earth—Air heat exchanger coupled with electric boiler, hydrogen, wind and PV configurations. Renew. Energy 2020, 148, 839–851. [Google Scholar] [CrossRef]
- Lee, S.F. Thermoeconomics of Lithium Bromide/Water Absorption Chillers and Heat Transformers; University of Florida: Gainesville, FL, USA, 1999. [Google Scholar]
- Enslin, J.H.R. Economic Aspects Of Utilizing Heat Transformer Technology. Open Access 2019, 7, 2. [Google Scholar]
- European Commission. Eurostat: Energy Statistics—Prices of Natural Gas and Electricity. 2021. Available online: https://ec.europa.eu/eurostat/web/energy/data/database (accessed on 7 July 2021).
- European Energy Exchange AG. EUA Emission Spot Primary Market Auction Report—History. 2022. Available online: https://www.eex.com/en/market-data/environmental-markets/eua-primary-auction-spot-download (accessed on 1 October 2021).
- Chau, J.; Sowlati, T.; Sokhansanj, S.; Preto, F.; Melin, S.; Bi, X. Techno-economic analysis of wood biomass boilers for the greenhouse industry. Appl. Energy 2009, 86, 364–371. [Google Scholar] [CrossRef]
- Bless, F.; Arpagaus, C.; Bertsch, S. Theoretical investigation of high-temperature heat pump cycles for steam generation. In Proceedings of the 13th IEA Heat Pump Conference, Jeju, Republic of Korea, 26–29 April 2021; pp. 1–9. [Google Scholar]
- Cudok, F.; Giannetti, N.; Ciganda, J.L.C.; Aoyama, J.; Babu, P.; Coronas, A.; Fujii, T.; Inoue, N.; Saito, K.; Yamaguchi, S.; et al. Absorption heat transformer—State-of-the-art of industrial applications. Renew. Sustain. Energy Rev. 2021, 141, 110757. [Google Scholar] [CrossRef]
- Han, Y.; Shen, B.; Zhang, T. A Techno-economic Assessment of Fuel Switching Options of Addressing Environmental Challenges of Coal-Fired Industrial Boilers: An analytical work for China. Energy Procedia 2017, 142, 3083–3087. [Google Scholar] [CrossRef]
- Wang, G.B.; Zhang, X.R. Thermoeconomic analysis of optimization potential for CO2 vapor compression cycle: From transcritical to supercritical operation for waste heat recovery from the steam condenser. Int. J. Energy Res. 2019, 43, 297–312. [Google Scholar] [CrossRef]
- Gilbert, T.; Menon, A.K.; Dames, C.; Prasher, R. Heat source and application-dependent levelized cost of decarbonized heat. Joule 2023, 7, 128–149. [Google Scholar] [CrossRef]
- Walraven, D.; Laenen, B.; D’haeseleer, W. Minimizing the levelized cost of electricity production from low-temperature geothermal heat sources with ORCs: Water or air cooled? Appl. Energy 2015, 142, 144–153. [Google Scholar] [CrossRef]
- Jesper, M.; Schlosser, F.; Pag, F.; Walmsley, T.G.; Schmitt, B.; Vajen, K. Large-scale heat pumps: Uptake and performance modelling of market-available devices. Renew. Sustain. Energy Rev. 2021, 137, 110646. [Google Scholar] [CrossRef]
- Le, V.L.; Kheiri, A.; Feidt, M.; Pelloux-Prayer, S. Thermodynamic and economic optimizations of a waste heat to power plant driven by a subcritical ORC (Organic Rankine Cycle) using pure or zeotropic working fluid. Energy 2014, 78, 622–638. [Google Scholar] [CrossRef]
- Ziemele, J.; Dace, E. An analytical framework for assessing the integration of the waste heat into a district heating system: Case of the city of Riga. Energy 2022, 254, 124285. [Google Scholar] [CrossRef]
- Fu, L.; Li, Y.; Wu, Y.; Wang, X.; Jiang, Y. Low carbon district heating in China in 2025—A district heating mode with low grade waste heat as heat source. Energy 2021, 230, 120765. [Google Scholar] [CrossRef]
- Pelda, J.; Stelter, F.; Holler, S. Potential of integrating industrial waste heat and solar thermal energy into district heating networks in Germany. Energy 2020, 203, 117812. [Google Scholar] [CrossRef]


| State | p | T | h | |
|---|---|---|---|---|
| [kg/s] | [bar] | [°C] | [kJ/(kg·K)] | |
| a | 0.32 | 1.013 | 15 | - |
| b | 0.19 | 1.008 | 115 | - |
| 1 | 2.40 | 1.008 | 115 | 2706 |
| 2 | 2.27 | 1.008 | 115 | 2706 |
| 3 | 2.27 | 1.018 | 116 | 2708 |
| 4 | 2.27 | 1.013 | 197 | 2869 |
| 5 | 0.13 | 1.008 | 115 | 2706 |
| Heat Source | Heat Sink | ||||||||
|---|---|---|---|---|---|---|---|---|---|
| Fluid | p | Fluid | p | ||||||
| [bar] | [kg/s] | [°C] | [°C] | [bar] | [kg/s] | [-] | [-] | ||
| Water | 1 | 9.32 | 78 | 60 | Water | 1.58 | 0.213 | 0 | 1 |
| Technology | Considered Cost | Minimum Cost | Maximum Cost |
|---|---|---|---|
| [EUR/kWth] | [EUR/kWth] | [EUR/kWth] | |
| Vapor compression | 550 | 250 | 900 |
| heat pump | |||
| Natural gas boiler | 100 | - | - |
| Electric boiler | 50 | - | - |
| Heat transformer | 1200 | 1000 | 2000 |
| Country | Electricity Price | Gas Price | Price Ratio |
|---|---|---|---|
| [] | [] | [-] | |
| EU-27 | 0.0792 | 0.0307 | 2.58 |
| Belgium | 0.0806 | 0.0235 | 3.43 |
| France | 0.0732 | 0.0357 | 2.05 |
| Finland | 0.0649 | 0.0518 | 1.25 |
| Denmark | 0.0612 | 0.0326 | 1.88 |
| Germany | 0.0799 | 0.0312 | 2.56 |
| UK | 0.0987 | 0.0256 | 3.85 |
| Economic Parameter | Value | Reference |
|---|---|---|
| Annual operating time (hour) | 8000 | [45,46] |
| Vapor compression heat pump lifetime, n (year) | 15 | [41,80] |
| Heat transformer lifetime, n (year) | 15 | [81] |
| Natural gas boiler lifetime, n (year) | 15 | [82] |
| Discount rate, i (%) | 5 | [41] |
| Yearly maintenance cost (% of investment cost) | 6 | [83] |
Disclaimer/Publisher’s Note: The statements, opinions and data contained in all publications are solely those of the individual author(s) and contributor(s) and not of MDPI and/or the editor(s). MDPI and/or the editor(s) disclaim responsibility for any injury to people or property resulting from any ideas, methods, instructions or products referred to in the content. |
© 2023 by the authors. Licensee MDPI, Basel, Switzerland. This article is an open access article distributed under the terms and conditions of the Creative Commons Attribution (CC BY) license (https://creativecommons.org/licenses/by/4.0/).
Share and Cite
Vieren, E.; Demeester, T.; Beyne, W.; Magni, C.; Abedini, H.; Arpagaus, C.; Bertsch, S.; Arteconi, A.; De Paepe, M.; Lecompte, S. The Potential of Vapor Compression Heat Pumps Supplying Process Heat between 100 and 200 °C in the Chemical Industry. Energies 2023, 16, 6473. https://doi.org/10.3390/en16186473
Vieren E, Demeester T, Beyne W, Magni C, Abedini H, Arpagaus C, Bertsch S, Arteconi A, De Paepe M, Lecompte S. The Potential of Vapor Compression Heat Pumps Supplying Process Heat between 100 and 200 °C in the Chemical Industry. Energies. 2023; 16(18):6473. https://doi.org/10.3390/en16186473
Chicago/Turabian StyleVieren, Elias, Toon Demeester, Wim Beyne, Chiara Magni, Hamed Abedini, Cordin Arpagaus, Stefan Bertsch, Alessia Arteconi, Michel De Paepe, and Steven Lecompte. 2023. "The Potential of Vapor Compression Heat Pumps Supplying Process Heat between 100 and 200 °C in the Chemical Industry" Energies 16, no. 18: 6473. https://doi.org/10.3390/en16186473
APA StyleVieren, E., Demeester, T., Beyne, W., Magni, C., Abedini, H., Arpagaus, C., Bertsch, S., Arteconi, A., De Paepe, M., & Lecompte, S. (2023). The Potential of Vapor Compression Heat Pumps Supplying Process Heat between 100 and 200 °C in the Chemical Industry. Energies, 16(18), 6473. https://doi.org/10.3390/en16186473