Article

Parametric Analysis and Optimization for Thermal Efficiency Improvement in a Turbocharged Diesel Engine with Peak Cylinder Pressure Constraints

1
State Key Laboratory of Engines, Tianjin University, No. 92 Weijin Road, Nankai District, Tianjin 300072, China
2
Xianhu Laboratory of the Advanced Energy Science and Technology Guangdong Laboratory, Foshan 528216, China
*
Author to whom correspondence should be addressed.
Energies 2023, 16(18), 6478; https://doi.org/10.3390/en16186478
Submission received: 30 July 2023 / Revised: 28 August 2023 / Accepted: 2 September 2023 / Published: 7 September 2023

Abstract

:
While the original equipment manufacturers are developing engines that can withstand higher PCP, the methodology to maximize the thermal efficiency gain with different PCP limits is still not well-known or documented in the literature. This study aims to provide guidance on how to co-optimize air system parameters, compression ratio, and intake valve closing (IVC) timing of heavy-duty turbocharged diesel engines to enhance thermal efficiency with peak cylinder pressure (PCP) constraints. In this study, a one-dimensional turbocharged engine model is established and validated by experimental data. The effects of turbocharger efficiency, boost pressure, high-pressure exhaust gas recirculation (HP EGR) ratio, compression ratio (CR), and IVC timing on diesel engine efficiency are assessed under PCP constraints through parametric analysis. The results indicate that for enhancing engine thermal efficiency under limited PCP, an increment in boost pressure and CR, and late IVC timing compared to baseline is required. By multiple parameter optimization, the best parameter combination under different PCP constraints is proposed. At a PCP limit of 20 MPa, the combination of a compression ratio of 18.57, boost pressure of 298 kPa, and IVC timing of −95.2 °CA ATDC yields a 1.56% (absolute value) improvement in ITEn over the baseline condition. Raising the PCP limits from 20 MPa to 25 MPa requires increasing the compression ratio to 21.92, boost pressure to 308 kPa, and delaying the intake valve closing timing to −88.7 °CA ATDC, which results in an absolute improvement of 0.86% in ITEn. Baseline engine configuration is updated accordingly to validate the thermal efficiency improvement strategy at a 25 MPa PCP limitation. Experimental results demonstrate a 2.2% (absolute value) improvement in brake thermal efficiency and 1.98% (absolute value) improvement in overall energy efficiency.

1. Introduction

As global climate change has drawn significant public attention, there is a pressing need to reduce carbon emissions in all sections, including transportation. Heavy-duty trucks, which are mostly powered by diesel engines, account for more than 40% of road transport-related CO2 emissions [1]. This percentage will persistently increase with the long-term growth of road freight transport activities and the electrification of light-duty vehicles [2]. Fuel cell and battery electric vehicles are the most promising solutions to decarbonize transportation [3]. However, the internal combustion (IC) engine will remain the predominant power source of heavy-duty trucks in the coming decades due to the advantages of IC engines in terms of durability, cost-effectiveness, power density, and infrastructure availability [4]. Energy efficiency improvement is the key pillar to a neutral scenario, which mitigates greenhouse gas emissions in the sectors where it may be challenging to directly transition to green energy sources [5,6]. Therefore, continuous efficiency improvement in diesel engines is needed to reduce the CO2 emission from heavy-duty trucks towards the 2 °C temperature rise commitment of COP21 [7]. Moreover, increasingly stringent fuel consumption standards and greenhouse gas regulations are implemented in most regions of the world to push original equipment manufacturers (OEMs) to improve engine efficiency [4].
The conversion efficiency of an IC engine is practically limited by friction, heat transfer, heat work conversion efficiency, and pumping work. Models that combine several sub-models for individual processes have been developed to simulate engine operation cycles, demonstrating that increasing CR is an effective way to increase thermal efficiency. Jerald [8] discussed the effect of CR on the maximum theoretical thermal efficiency through a zero-dimensional thermodynamic model. The results indicated when CR increases from 20 to 30, the maximum theoretical thermal efficiency is increased from 62.5% to 66.9%. Accordingly, the peak pressure is also increased from 20.9 MPa to 31.3 MPa. Miller et al. [9] conducted tests on a specialized device to determine the indicated thermal efficiency of compression ratios ranging from 30 to 100. The results showed that the indicated thermal efficiency ranged from 52% to 60%. When the compression ratio is less than 40, increasing the compression ratio can significantly improve the indicated thermal efficiency with PCP over 100 MPa. These studies showed that peak cylinder pressure will inevitably increase with each increment of thermal efficiency, which challenges the strength of the engine block.
When increasing the CR to improve thermal efficiency, another problem arises. Liu et al. [10] discussed the influence of CR on indicated thermal efficiency by a one-dimensional single-cylinder engine model. With the increase in CR, ITE first increased and then decreased due to the increase in heat transfer loss. Kenji [11] reported a heat loss percentage increase in a single-cylinder engine when CR increased from 18 to 26 at a 0.8 MPa IMEP load. Lean combustion is an essential strategy to lower the combustion temperature to reduce in-cylinder heat transfer losses, which is normally accomplished by increasing boost pressure. It has been proved by many studies that increasing boost pressure improves the indicated thermal efficiency [12,13]. Nevertheless, the increased boost pressure comes at the cost of pumping work [14,15] and higher PCP.
Combustion phasing is another factor that determines thermal efficiency. For the specified engine and operating conditions, there is an optimum combustion phasing that provides highest brake thermal efficiency. What is more, the optimum combustion phasing is the function of engine operating conditions and design variables. As the combustion phasing gradually advances before reaching the optimal CA50, both thermal efficiency and PCP increase synchronously [16].
From the above review, increasing CR, increasing combustion overall lean extent, or advancing combustion phasing is beneficial to ITEn, resulting in higher PCP. Therefore, these strategies for thermal efficiency improvement are challenged by PCP limitations. Motivated by these conclusions, OEMs are constantly strengthening the engine to withstand higher PCP [9]. For example, OEMs, such as Cummins, Volvo, Daimler, Navistar, and Paccar, raised the PCP limitations of diesel engines, resulting in brake thermal efficiency above 50% in the super-truck program. Table 1 lists the detailed engine specifications, which show that both high compression ratio and high peak cylinder pressure concepts are emphasized in their reports, and Volvo disclosed the PCP of 27 MPa.
Even though thermal efficiency improvement can be achieved by increasing PCP with the above strategy, high PCP leads to durability issues, an increment in manufacturing cost, and increased mechanical losses, which are detrimental to enhancing brake thermal efficiency [19]. Ryan [20] reported that increased CR did not show evident benefits in BTE, owing to increased friction accompanied by a significant increase in PCP. Therefore, considerable research has been conducted on improving thermal efficiency within PCP limits.
The Miller cycle is one of the ways to reduce PCP and extract more work from fuel-released energy, which features the actual compression ratio being lower than the actual expansion ratio [21]. The Miller cycle is supposed to improve theoretical cycle efficiency by reducing compression work consumption in the compression stroke. The Miller cycle can be achieved by early intake valve closing (IVC) timing or late IVC timing to reduce the effective compression ratio. On the one hand, reducing the effective compression ratio with late IVC timing at high loads can lower the PCP at high compression ratios. On the other hand, late or early IVC timing will cause volumetric efficiency reduction. Garcia [22] experimentally demonstrated that the volumetric efficiency of late IVC timing declined under constant boost pressure. Although late IVC timing under constant boost pressure reduced the PCP, the ITE also declined as the air–fuel ratio was reduced. However, the ITE improvement and PCP reduction could be achieved at the same time by combining late IVC timing, high boost pressure, and a higher efficiency turbocharging system. Hence, the Miller cycle strategy has been integrated with other strategies to improve thermal efficiency. Xiaoyang Yu et al. [23] conducted experimental research on a two-stage turbocharged diesel engine at a 2 MPa BMEP operating condition. The experimental results showed that the improvement in pumping work can be achieved by adjusting the pressure ratio distribution through a variable cross-section supercharger. The high boost pressure combined with a late intake valve closing strategy maintained the air density in the cylinder while improving the engine’s pumping work and combustion process. Kitabatake [24] reported that the BSFC of the J05 mode is improved by 8.9% when increasing CR from 16.2 to 20 and adjusting intake and exhaust valve timing by an electro–hydraulic cam-less system on a multi-cylinder heavy-duty diesel engine. Kongzhao et al. [25] combined 14.5 geometry CR with the Miller cycle in a natural gas engine, improving thermal efficiency by 4.1% at 19 bar BMEP. This literature proves that combining high-geometry CR and the Miller cycle can improve thermal efficiency under PCP constraints.
Another strategy is high-pressure exhaust gas recirculation (HP EGR), which is mainly used to reduce NOx emissions in modern diesel engines [26,27]. Giorgio’s [28,29] experiment found that increasing the opening of the HP EGR valve in a turbocharged multi-cylinder engine can reduce the brake-specific fuel consumption (BSFC) and the PCP of combustion as the result of a decline in pumping work. EGR-diluted low-temperature combustion also lowers the combustion temperature [30], which is beneficial to reducing heat losses. However, a reduction in cylinder oxygen concentration by EGR slows down the combustion rate and prolongs combustion duration, which is unfavorable for thermal efficiency improvement [31,32]. Moreover, HP EGR results in a portion of the exhaust gas energy being dissipated as cooling losses in the EGR cooler, which could have otherwise been utilized for expansion work in the turbine. What is more, the HP EGR ratio affects the isentropic efficiency of compressors and turbines, the boost pressure ratio, and the air mass flow rate in multi-cylinder engines [33]. Given the complicated impacts of the HP EGR ratio, it is unclear what HP EGR ratio should be applied to improve engine thermal efficiency under PCP limits.
Despite the extensive efforts made by scholars to improve diesel engine efficiency, they have primarily focused on only a subset of the factors. Consequently, there has been a lack of guidance on how to co-optimize air system parameters, compression ratio, and IVC timing to enhance thermal efficiency. In addition, how to utilize the advantage of higher PCP limitations to further improve thermal efficiency by co-optimizing air system parameters, compression ratio, and IVC timing is of interest. This study aims to explore practical approaches to improve turbocharged diesel engine efficiency while considering PCP limits, and to provide guidelines for designing highly efficient turbocharged diesel engines. In this paper, a one-dimensional (1D) engine model, including a turbocharger, is built to simulate the diesel engine operation cycle and to investigate the effects of turbocharging system efficiency, CR, boost pressure, HP EGR ratio, and late IVC timing on thermal efficiency under the PCP limits. The strategy to improve thermal efficiency is then proposed based on parametric analyses. The optimal boost pressure, compression ratio, and intake valve closing (IVC) timing for 20 MPa, 22 MPa, and 25 MPa PCP constraints were determined using multi-parameter optimization. In order to accelerate the multiple-parameter optimization process, a hybrid method is put forward, which combines the engine model and a data-driven model. In the final part, the optimized strategy is justified by experiment.

2. Materials and Methods

2.1. Engine Description

The modeled engine is a six-cylinder diesel engine, which is adopted in a hybrid powertrain of a heavy-duty vehicle. This diesel engine is a high-pressure common rail, turbocharged direct injection engine with a compression ratio of 17.5 and a displacement of 7.7 L. The baseline engine specifications are shown in Table 2. The air system consists of a single turbocharger and HP EGR. In this work, the exhaust gas introduction method is the cooled HP EGR method, which is common in modern diesel engines.
As commercial vehicle powertrains shift toward down-speeding and hybridization, the operation duration of low-speed high-load conditions increases [34]. This emphasizes the potential for improving fuel economy by increasing thermal efficiency at low-speed high-load conditions. Therefore, the operating condition selected for this study is the 1200 rpm and 1.96 MPa BMEP condition, which represents the highest thermal efficiency operating point of the engine and corresponds to the low-speed high-load condition. In the selected operating condition, the thermal efficiency improvement is challenged by PCP limits. The details of the operating condition are shown in Table 3.

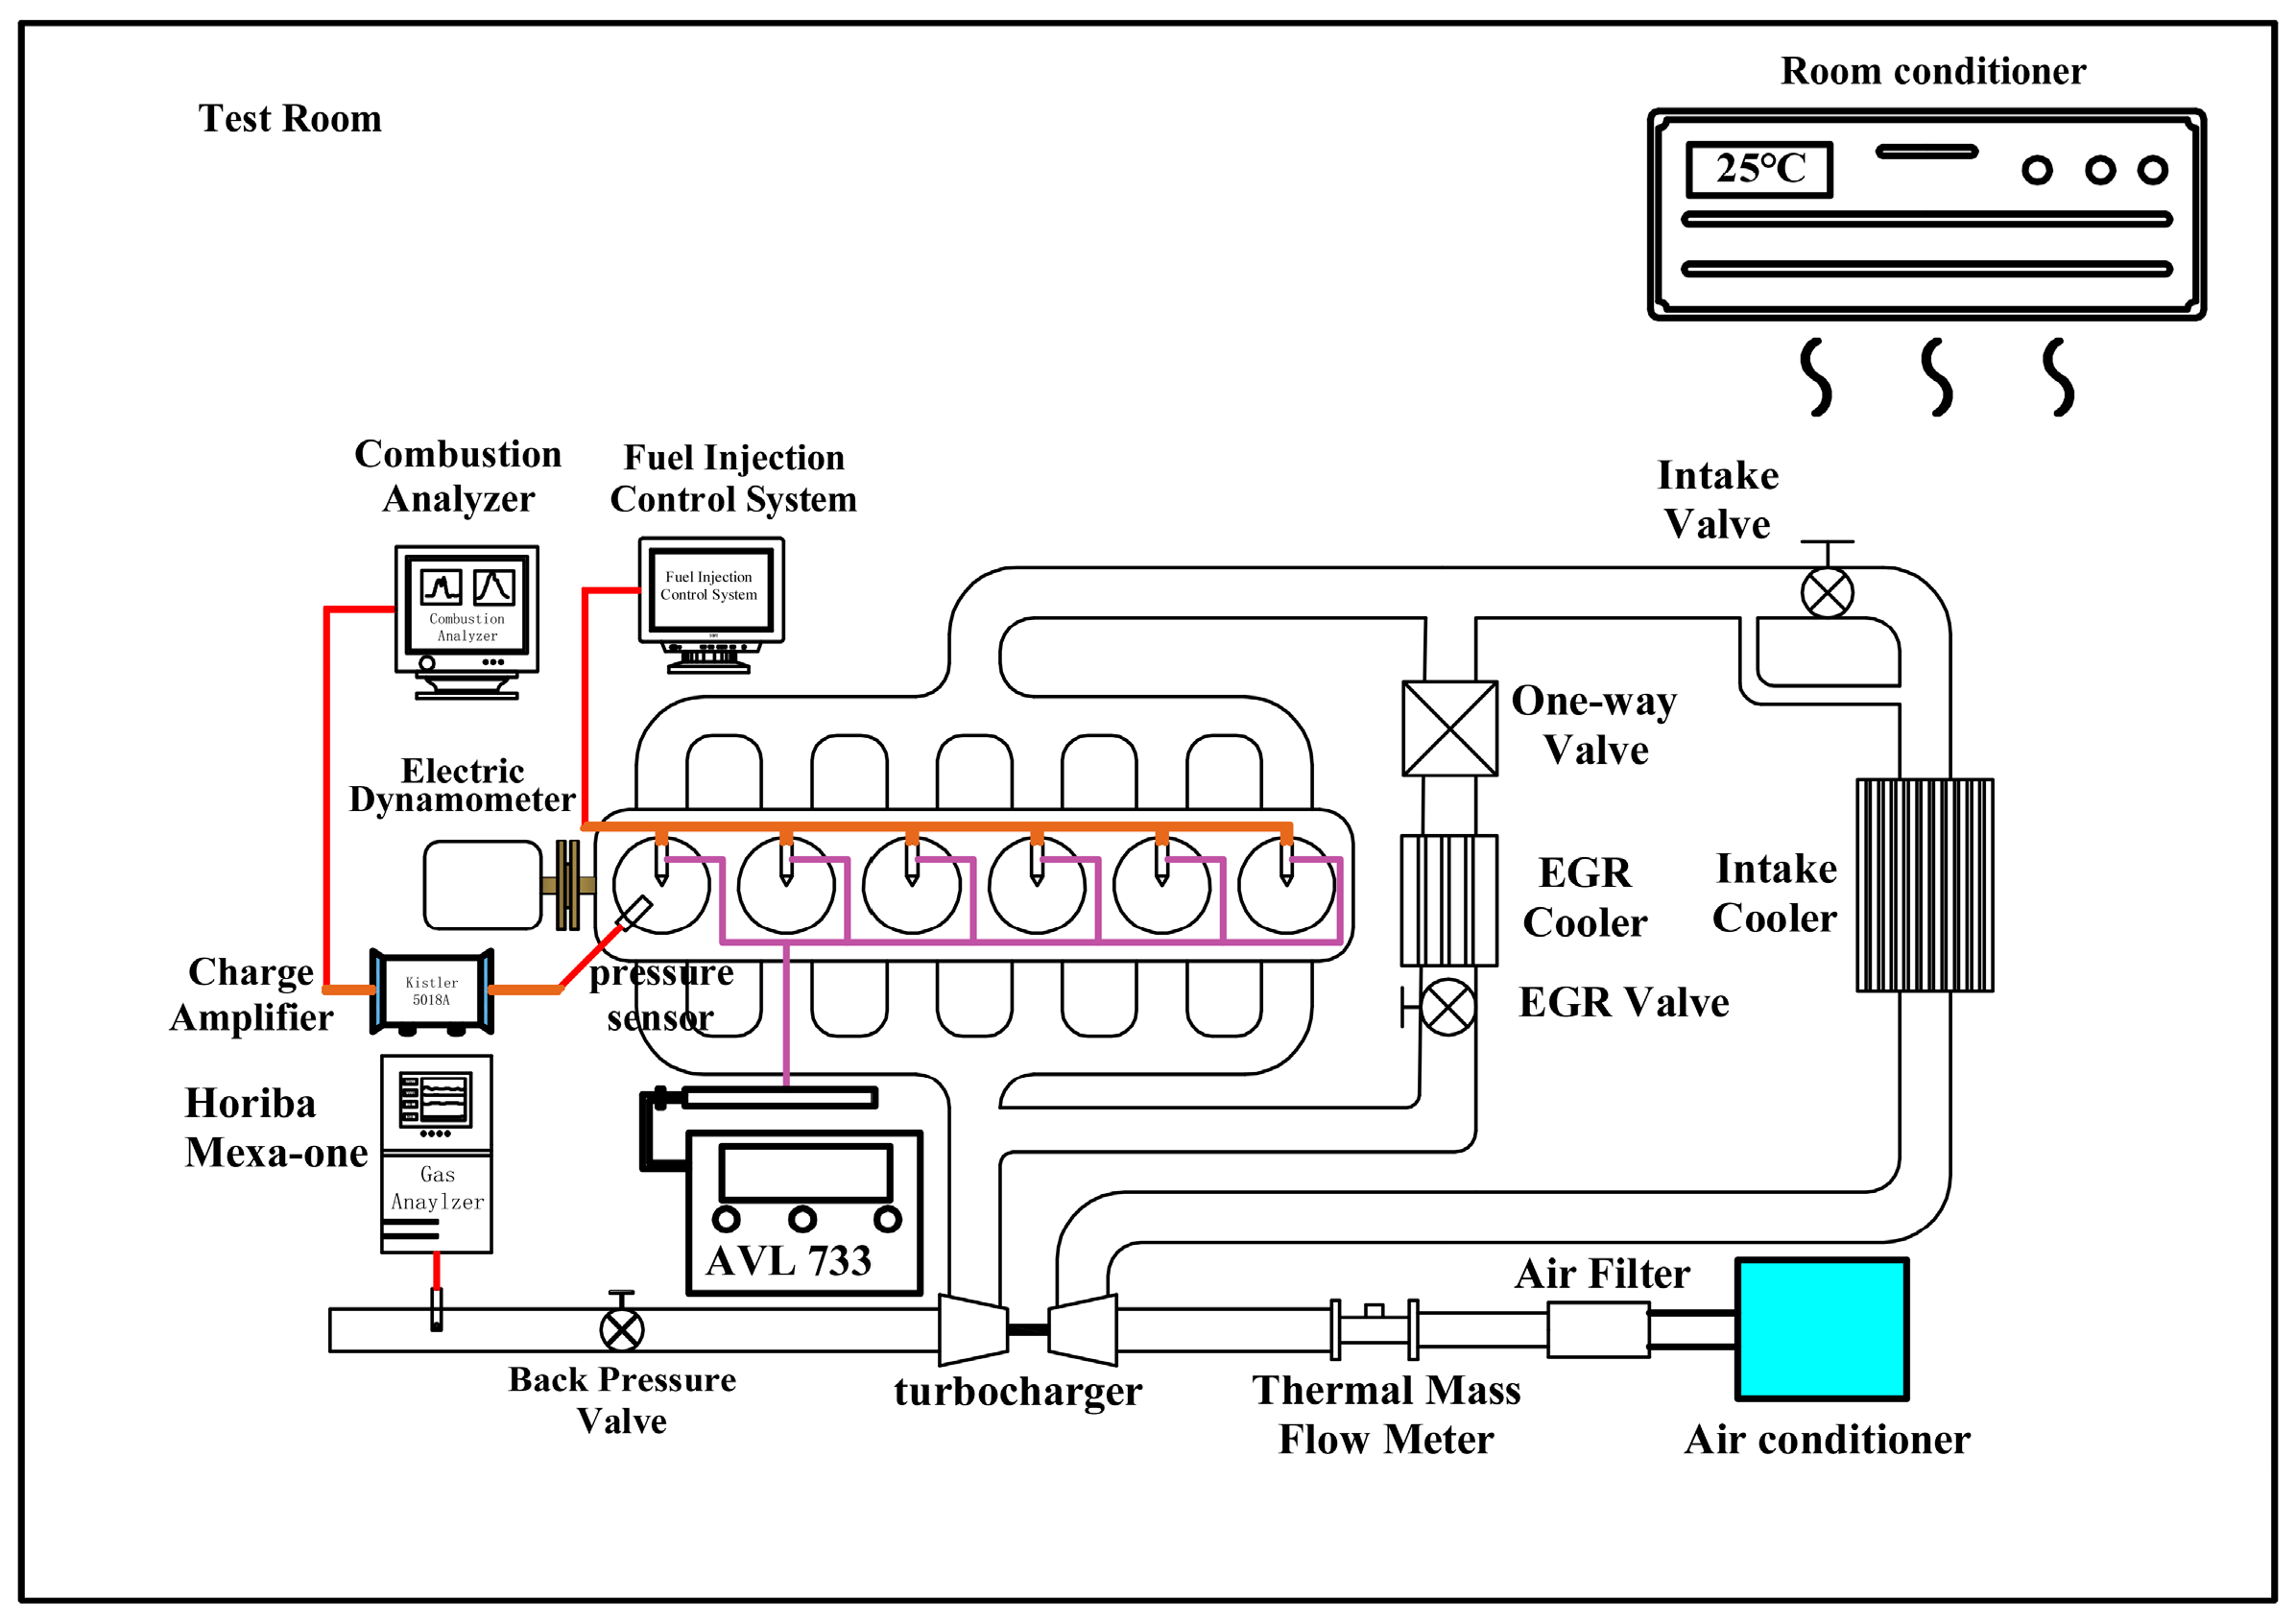
2.2. Experimental Setup and Test Procedure

The schematic diagram of the test bench is shown in Figure 1. The sixth cylinder pressure is recorded at the resolution of 0.5 °CA by a piezoelectric pressure sensor (Kistler 6125B) combined with a charge amplifier (Kistler 5018A), using an in-house data acquisition system. The pressure data of 100 consecutive cycles are averaged for apparent heat release rate (AHRR) calculation according to the thermodynamic model in the reference [21]. Further, fuel consumption is measured by AVL733. The test fuel is 0# diesel which is commercially available on the Chinese market. The diesel fuel’s low heat value in this study is taken as 42.8 MJ/kg. NOx emission is measured by Horiba Mexa-one. In addition, an environmental conditioner and intake air conditioner are applied to control the laboratory room temperature, intake air temperature, and humidity, respectively. The coolant-out temperature is maintained at 88 °C. The main specifications of the instruments are shown in Table 4.
The experiments were conducted in the following manner: Baseline engine performance data were first collected on this test bench, which is applied to validate the model. After engine parameter optimization was completed by the 1D model, the engine was upgraded with the corresponding component and tested at the selected operating condition on the same test bench.

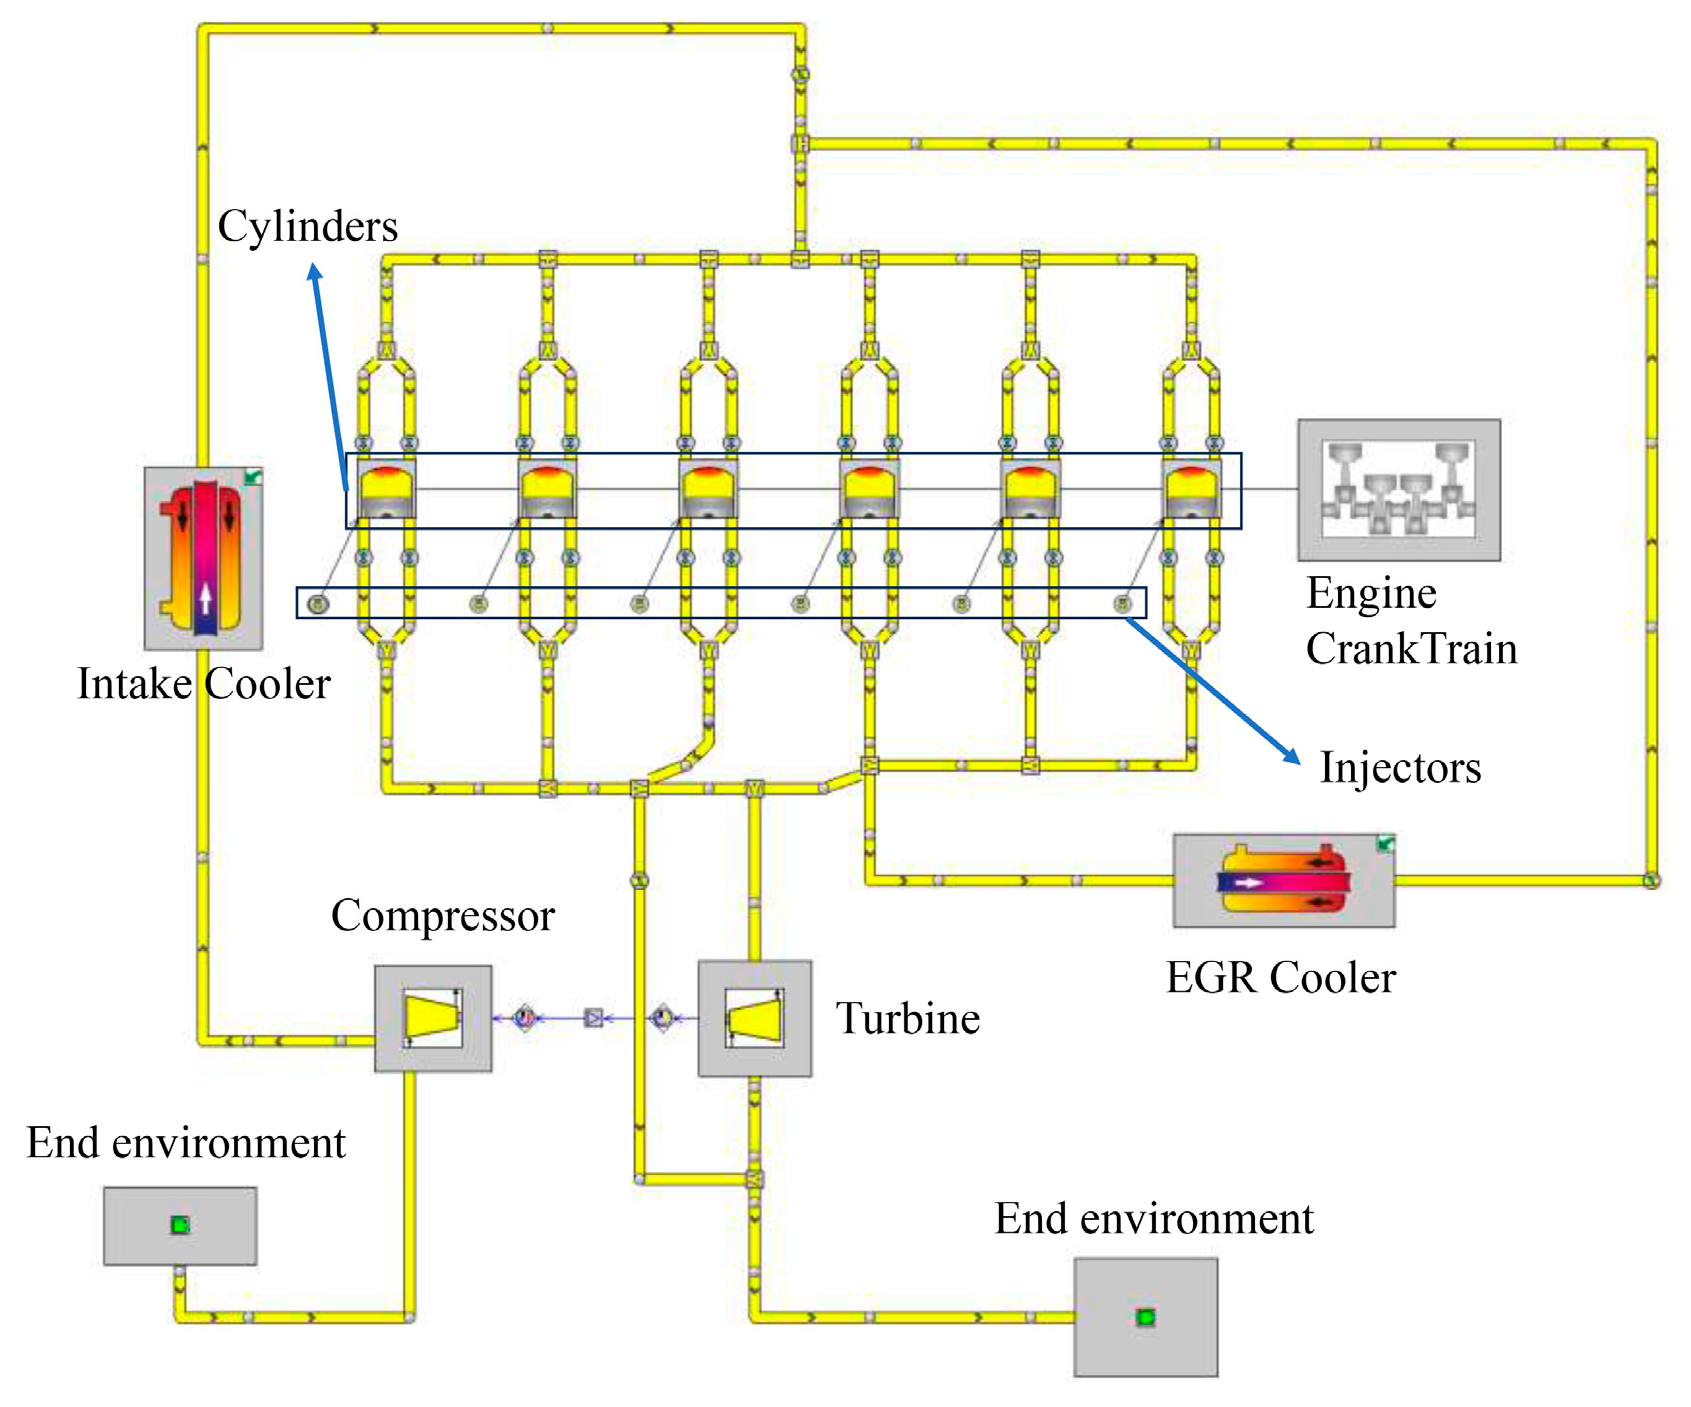
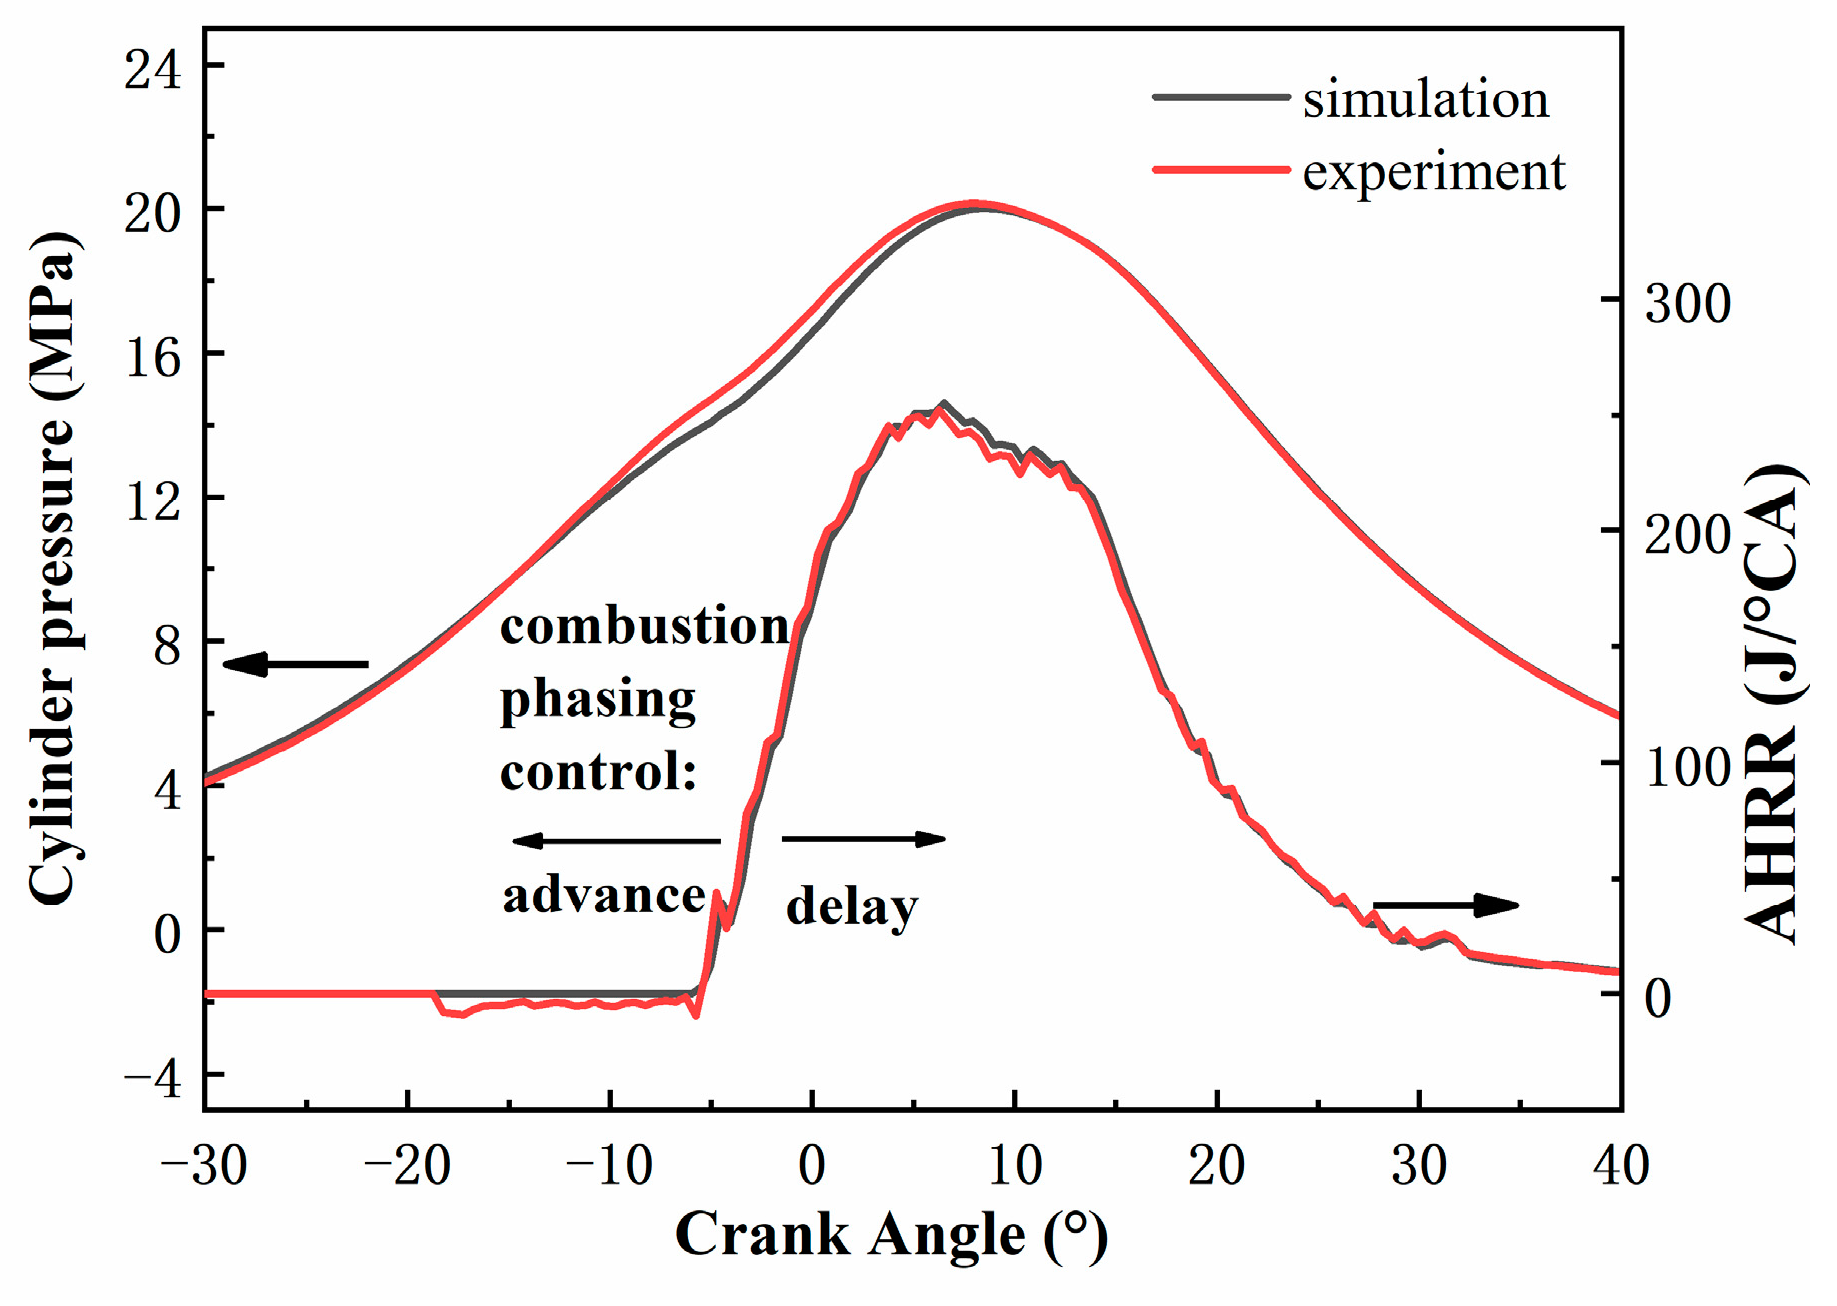
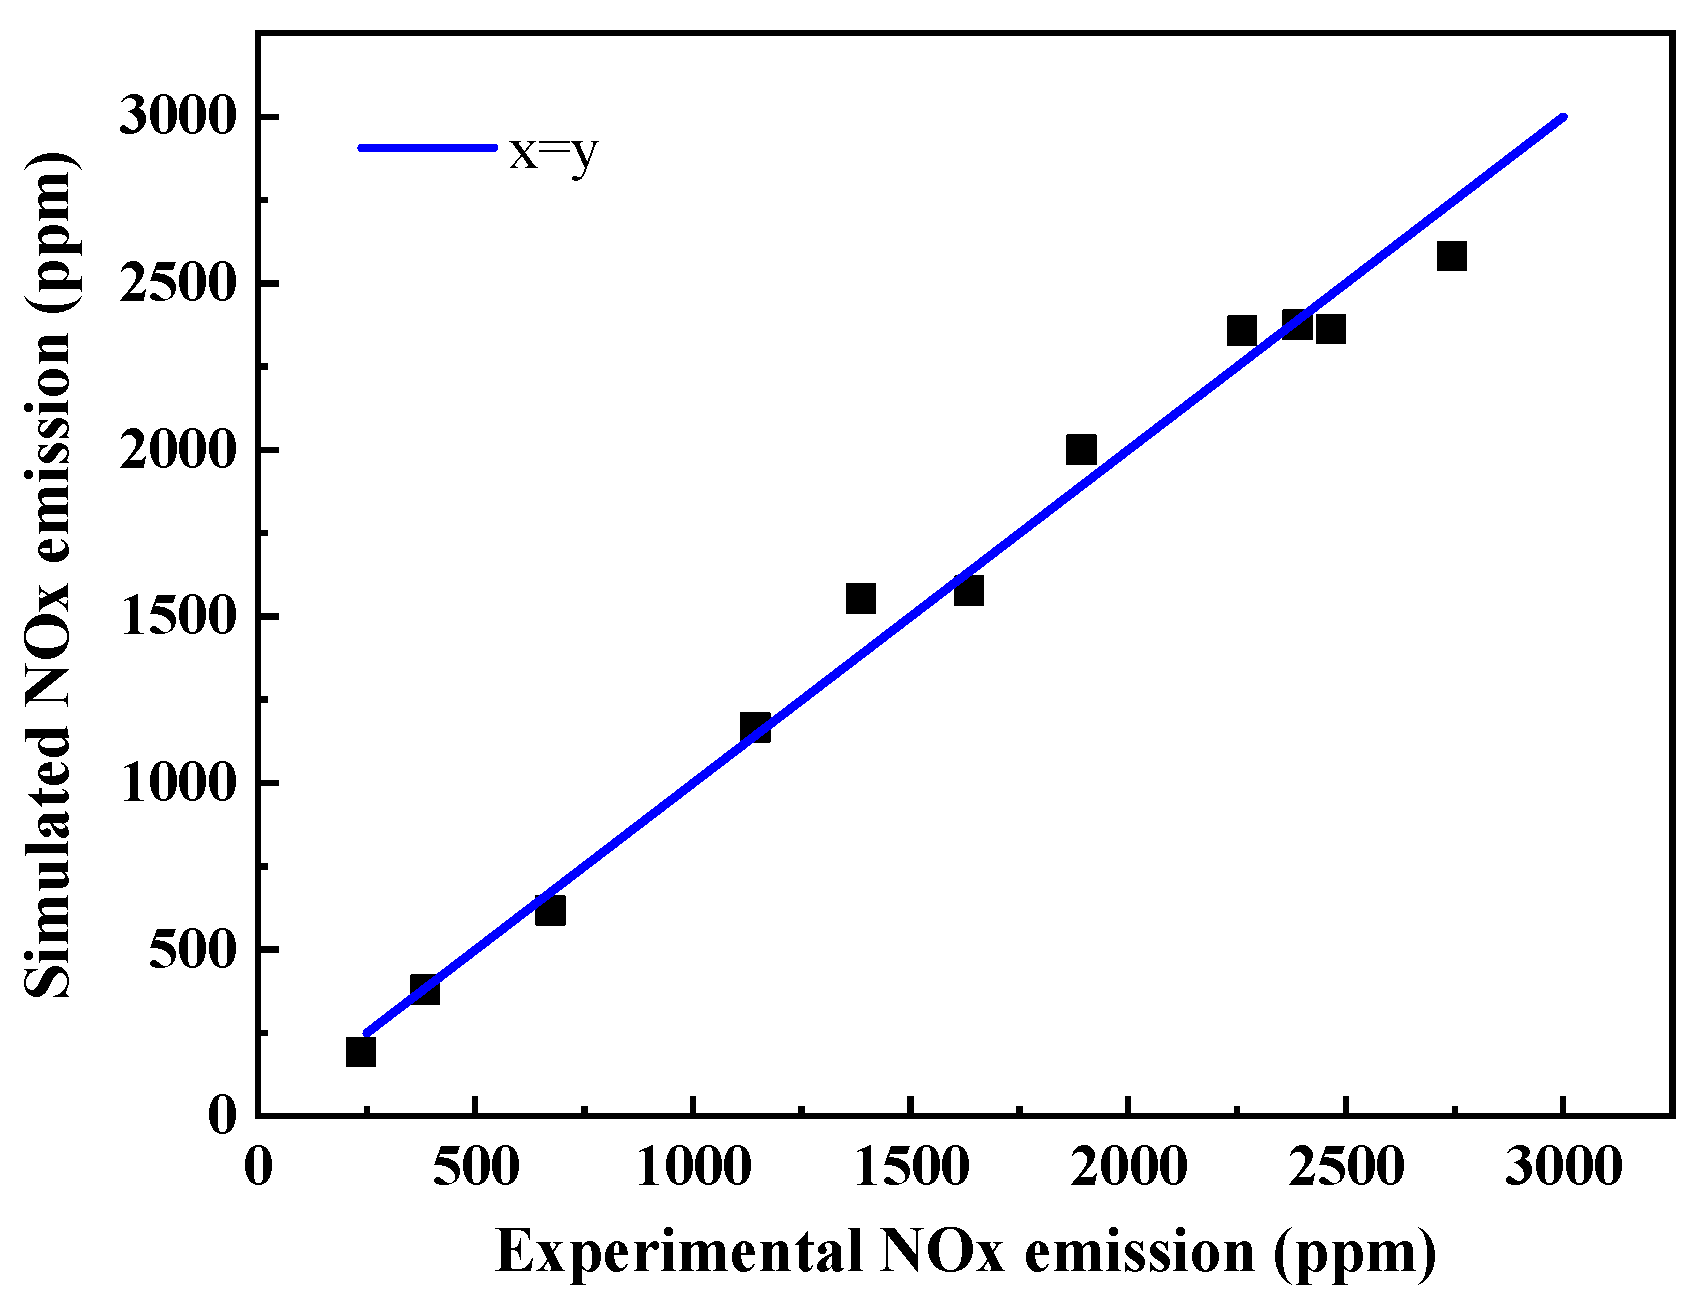
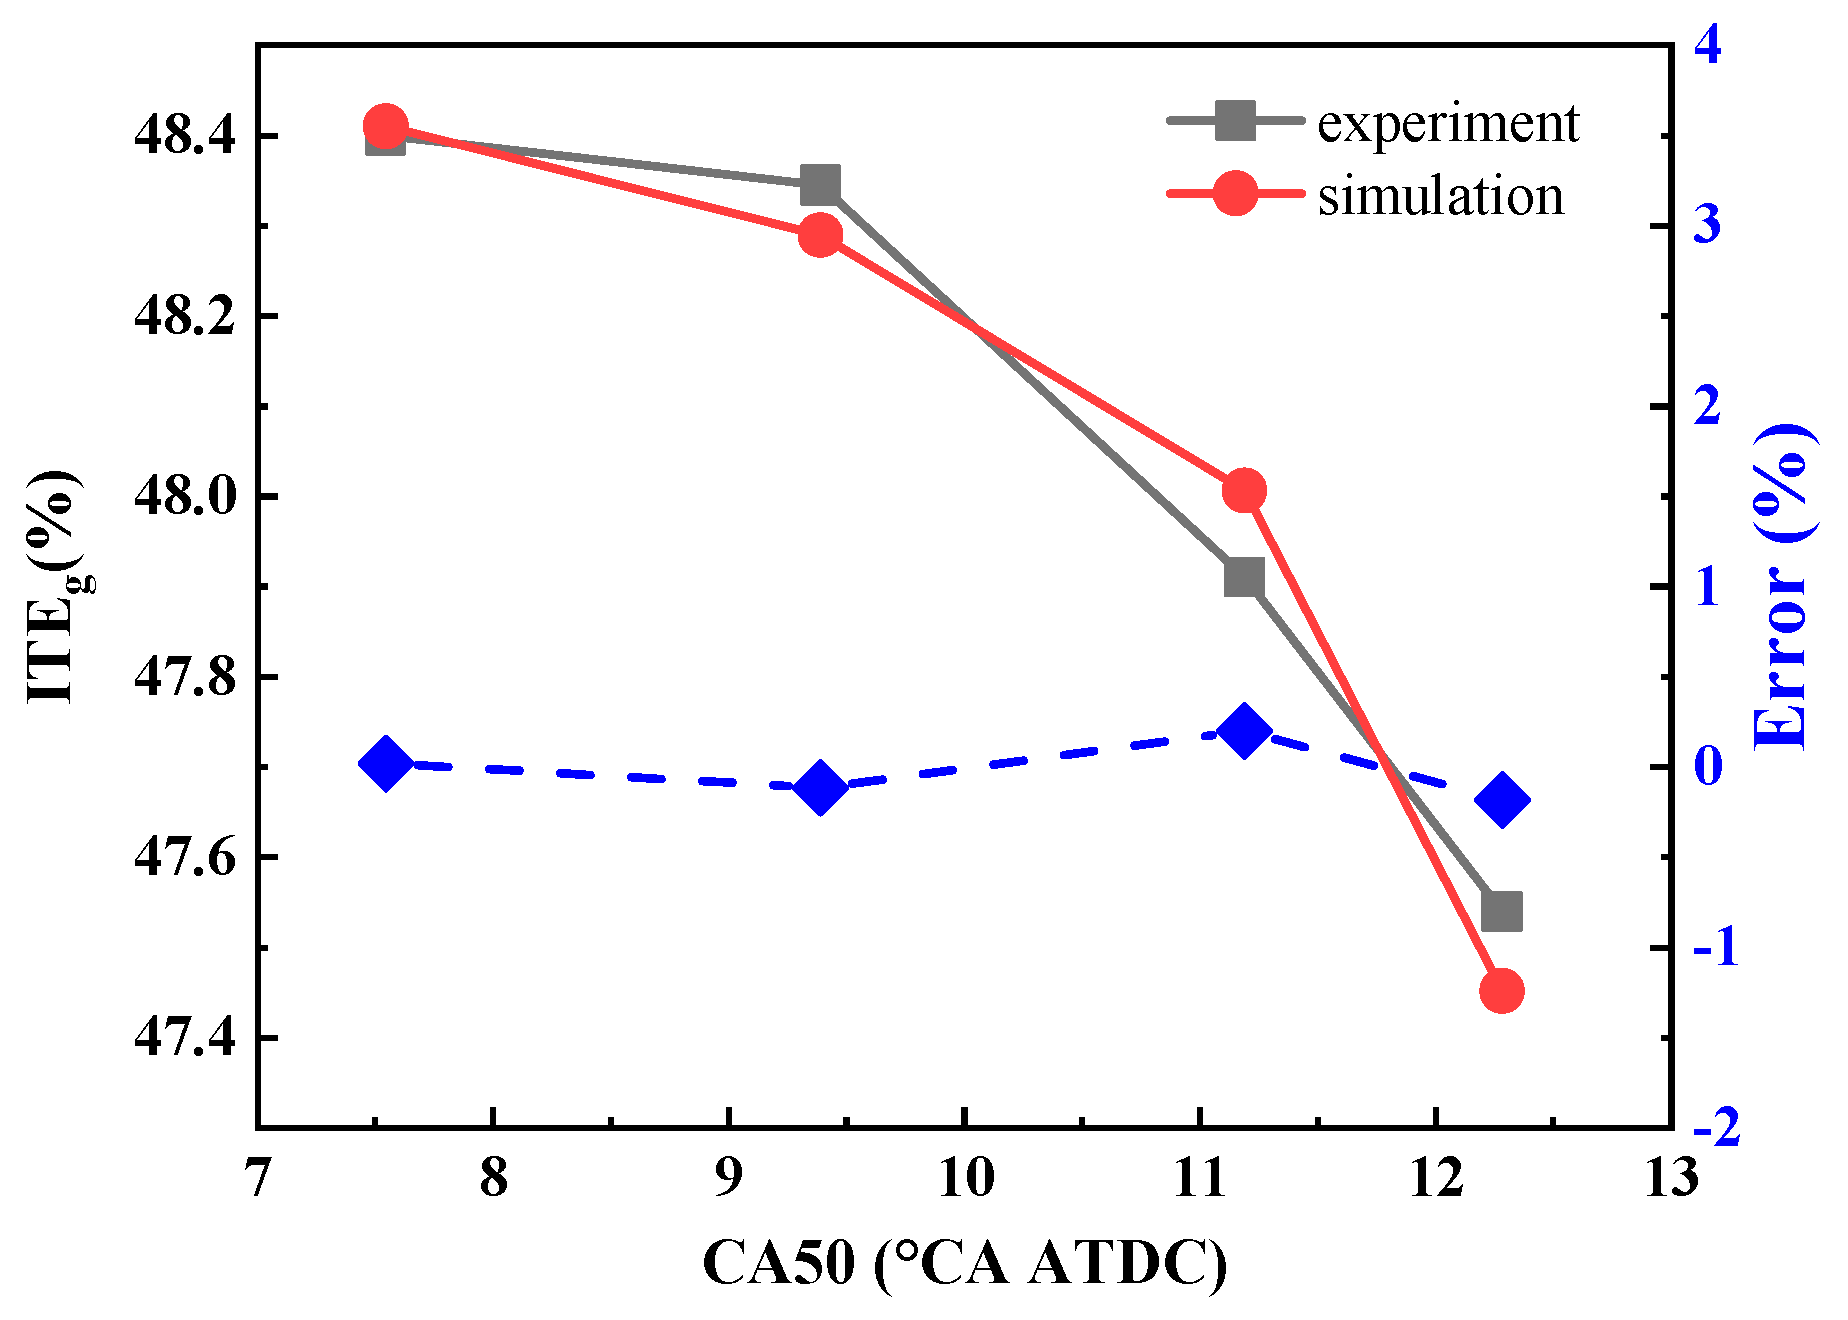
2.3. One-Dimensional Simulation Model Setup and Validation

Optimizing parameters in advance through simulation can indeed significantly reduce the cost of the experiment. By using simulation tools, researchers can explore different scenarios and evaluate the effects of parameter variations without the need for costly physical experiments. Additionally, the effects of variables such as the turbocharging overall efficiency, the boost pressure, and the EGR rate can easily investigated by simulation, which cannot be independently controlled during the experiments. Hence, the 1D engine model is built to simulate the operation cycle of a turbocharged diesel engine based on the commercial software, GT-power. The model diagram is shown in Figure 2. The employed sub-models are shown in Table 5. The peak cylinder pressure range evaluated in this study spans from 20 MPa to 25 MPa. Notably, the existing literature underscores that within this peak cylinder pressure variation, friction losses remain minimally impacted [19]. Hence, the prediction model for mechanical loss is not utilized. Instead, a constant Friction Mean Effective Pressure (FMEP) of 0.126 MPa is employed to predict BSFC, which was obtained from experimental results.
For combustion modeling, a user-imposed combustion profile model is used to describe the combustion process, which assumes that the rate of conversion from reactant to product is proportion to the imposed burn rate. No kinetic models, intermediate species, or dissociation products are calculated. The imposed burn rate used in the 1D simulation is inferred by measurements of cylinder pressure to simulate the combustion behavior. Some literature [11,35] suggests that the occasion exists that changes in boundary conditions such as compression ratio or IVC timing result in relatively small variations in the combustion heat release profile. And piston profile optimization can help to optimize the heat release rate to overcome the impact, which is out of the scope of this study. Therefore, the user-imposed combustion profile model is a reasonable choice in terms of the scope of this study and the computation resources required by cases in this study. What is more, this method has also been applied in other academic papers [8,10,36]. Based on experimental experience, within the range of boost pressures examined in this paper, the excess air coefficient exceeds 1.5. Usually, the combustion completeness of the investigated turbocharged diesel engine is nearly 100%. So, the combustion completeness is assumed to be 100 percent. It is worth noting that combustion phasing adjustment is achieved by shifting the combustion profile in the x-axis direction during the simulation procedure, as shown in Figure 3.
The boost pressure ratio, air mass flow rate, HP EGR ratio all affect the isentropic efficiency of compressors and turbines in multi-cylinder engines, which makes it difficult to investigate the impact of each parameter on engine efficiency by experiment. There are two kinds of methods to model turbocharger: the performance map-based turbocharger and the simple turbocharger model. By the performance map-based method, there are cross-effects among the turbo-shaft speed, pressure ratio, mass flow rate, and isentropic efficiency, whereas one of the objectives of this study is to understand the effect of each air system parameter on thermal efficiency, which will enlighten us as to the requirements of the air system to achieve high thermal efficiency. To decouple these parameters, a simple turbocharger model is used, which describes the energy balance inside the turbocharger but neglects the realistic operating characteristics of turbochargers. The boost pressure of the model is controlled by adjusting the turbine orifice diameter, compressor efficiency, and turbine efficiency.
The extended Zeldovich mechanism is applied to predict NOx emission. In addition to the NOx emission data of the studied operating condition, more data are collected by adjusting injection timing, injection pressure, and HP EGR ratio, varying from 500 to 3000 ppm, and are used to validate the employed NOx model, as shown in Figure 4.
Figure 5 shows the gross indicated thermal efficiency validation results for the studied operating point with different combustion phasings. It is observed that the gross indicated thermal efficiency trend with different combustion phasing is predicted precisely. This suggests that the heat transfer model and combustion model used in this study can reasonably predict trends in thermal efficiency at different combustion phasings.
The comparison of simulated and experimental cylinder pressure and AHRR of the studied operating condition is shown in Figure 3. There is a pressure discrepancy when the crank angle is between −10° and 10 °CA ATDC. This is because the actual heat release rate is unknown, and the experimental heat release rate is calculated using zero-dimensional models and heat transfer models. Using this heat release rate as the input to the model introduces errors. In addition, the heat transfer model used in the simulation can also lead to errors. Currently, there is still a lack of models that can accurately predict combustion heat transfer in engines. From a research perspective, this difference is acceptable because it is often necessary to use simplified models and assumptions in order to study complex phenomena. While the resulting errors may impact the accuracy of the results, they can still provide valuable insights. The comprehensive engine performance validation results of the studied operating conditions are shown in Table 6. It is seen that the simulation results are in good agreement with the experimental results, and the model can be used for further investigation.

2.4. Description of Indicators

Diesel diffusion combustion inevitably leads to NOx emissions. In order to reduce tailpipe NOx emission, a selective catalytic reduction (SCR) technique has been widely used. It has demonstrated that NOx conversion efficiency can be as high as 100% [37], which indicates that engine combustion would not be limited by NOx emission regulation. In this context, the difference between high and low engine raw NOx emissions is the amount of ammonia consumption. When calculating the conversion efficiency of energy conversion equipment, it is important to consider the consumption of ammonia in IC engines as a potential zero-carbon energy source for the future [38]. Assuming NOx consists of NO and reacts with NH3 in a standard SCR reaction [28], the overall energy efficiency index that considers NH3 consumption can be defined as follows:
η o = 3,600,000 L H V d ( B S F C + B S N O x 17 30 L H V a / L H V d )
where L H V d is the lower heating value of diesel, L H V a is the lower heating value of ammonia, B S F C is the brake-specific fuel consumption, and B S N O x represents the brake-specific N O x emission. Here, the lower heating value of ammonia is taken as 18.6 MJ/kg.
Other indexes, including gross indicated thermal efficiency (ITEg), ITEn, and pumping mean effective pressure (PMEP), are defined as follows:
I T E g = 180 180 p d V Q
I T E n = 360 360 p d V Q
P M E P = 360 360 p d V V s 180 180 p d V V s
where Q is fuel energy entering the cylinder per cycle, p represents the cylinder pressure, V is the volume of the cylinder, V s is the sweep volume of the cylinder.
In this paper, pumping work is mainly represented by PMEP to clarify the effect of parameters on pumping work. However, it is worth noting that PMEP is not entirely determined by pumping work. PMEP is equal to the integrated piston work through the intake and exhaust stroke divided by the cylinder sweep volume, which considers pumping loss and pumping work [14]. The pumping loss is always negative due to the presence of friction loss while pumping work can be either positive or negative.

3. Results and Discussion

The first section will carry out a parametric analysis under PCP-limited conditions, beginning from the baseline condition. When the PCP exceeds the constraint, the combustion phasing is retarded to comply with the PCP constraint. Since ITEn is decided by many factors, the analysis focuses on the effects of each parameter on air mass flow rate, combustion phasing, PMEP, heat losses, etc. Based on parametric analysis, a strategy for thermal efficiency improvement is proposed in the second section. According to the optimization results, the baseline engine configuration is upgraded to justify the thermal efficiency improvement strategy in the final section.

3.1. Parametric Analysis

3.1.1. The Effect of Turbocharging Overall Efficiency on Thermal Efficiency

In this paper, turbocharging overall efficiency is defined as the product of compressor isentropic efficiency and turbine isentropic efficiency, which represents the ratio of the compressed air enthalpy increment relative to reclaimed exhaust gas enthalpy. The maximum turbocharging overall efficiency is about 0.63, according to the turbocharger supplier [33], and the value for the studied operating condition at the baseline specification is 0.51. Figure 6 shows that ITEn significantly increases from 47.59% to 48.86% when the turbocharging overall efficiency increases from 0.51 to 0.63. In order to explain the improvement in ITEn, the effects of turbocharging overall efficiency on air mass flow rate, compressor power, combustion phasing, pre-turbine pressure, and ITEg are shown in Figure 7. It is seen that the air mass flow rate and compressor power are elevated with the increase in turbocharging overall efficiency, while the pre-turbine pressure declines. At the same time, combustion phasing, represented by CA50, is slightly postponed to comply with the PCP constraint. As a result, ITEn is improved for the enhanced combustion air dilution extent and pumping work improvement, changing from a negative value to a positive value. In product engines, turbocharging overall efficiency varies with operating conditions as turbine and compressor isentropic efficiencies change with air mass flow rate and compression ratio. This indicates that the turbocharger should be dedicated to operating efficiently at the target operating point for maximum thermal efficiency improvement. On the other hand, PMEP which represents the pressure difference between pre-turbine and manifold undergoes a transition from negative to positive with turbocharging overall efficiency raised. Therefore, HP EGR is hard to introduce. The role of HP EGR in such a high-efficiency air system is examined in Section 3.1.4. What is more, high turbocharging overall efficiency results in low exhaust temperature, which would cause deterioration in the after-treatment conversion efficiency. In the following section, the turbocharging overall efficiency is set at 0.63 for the best-case assessment.

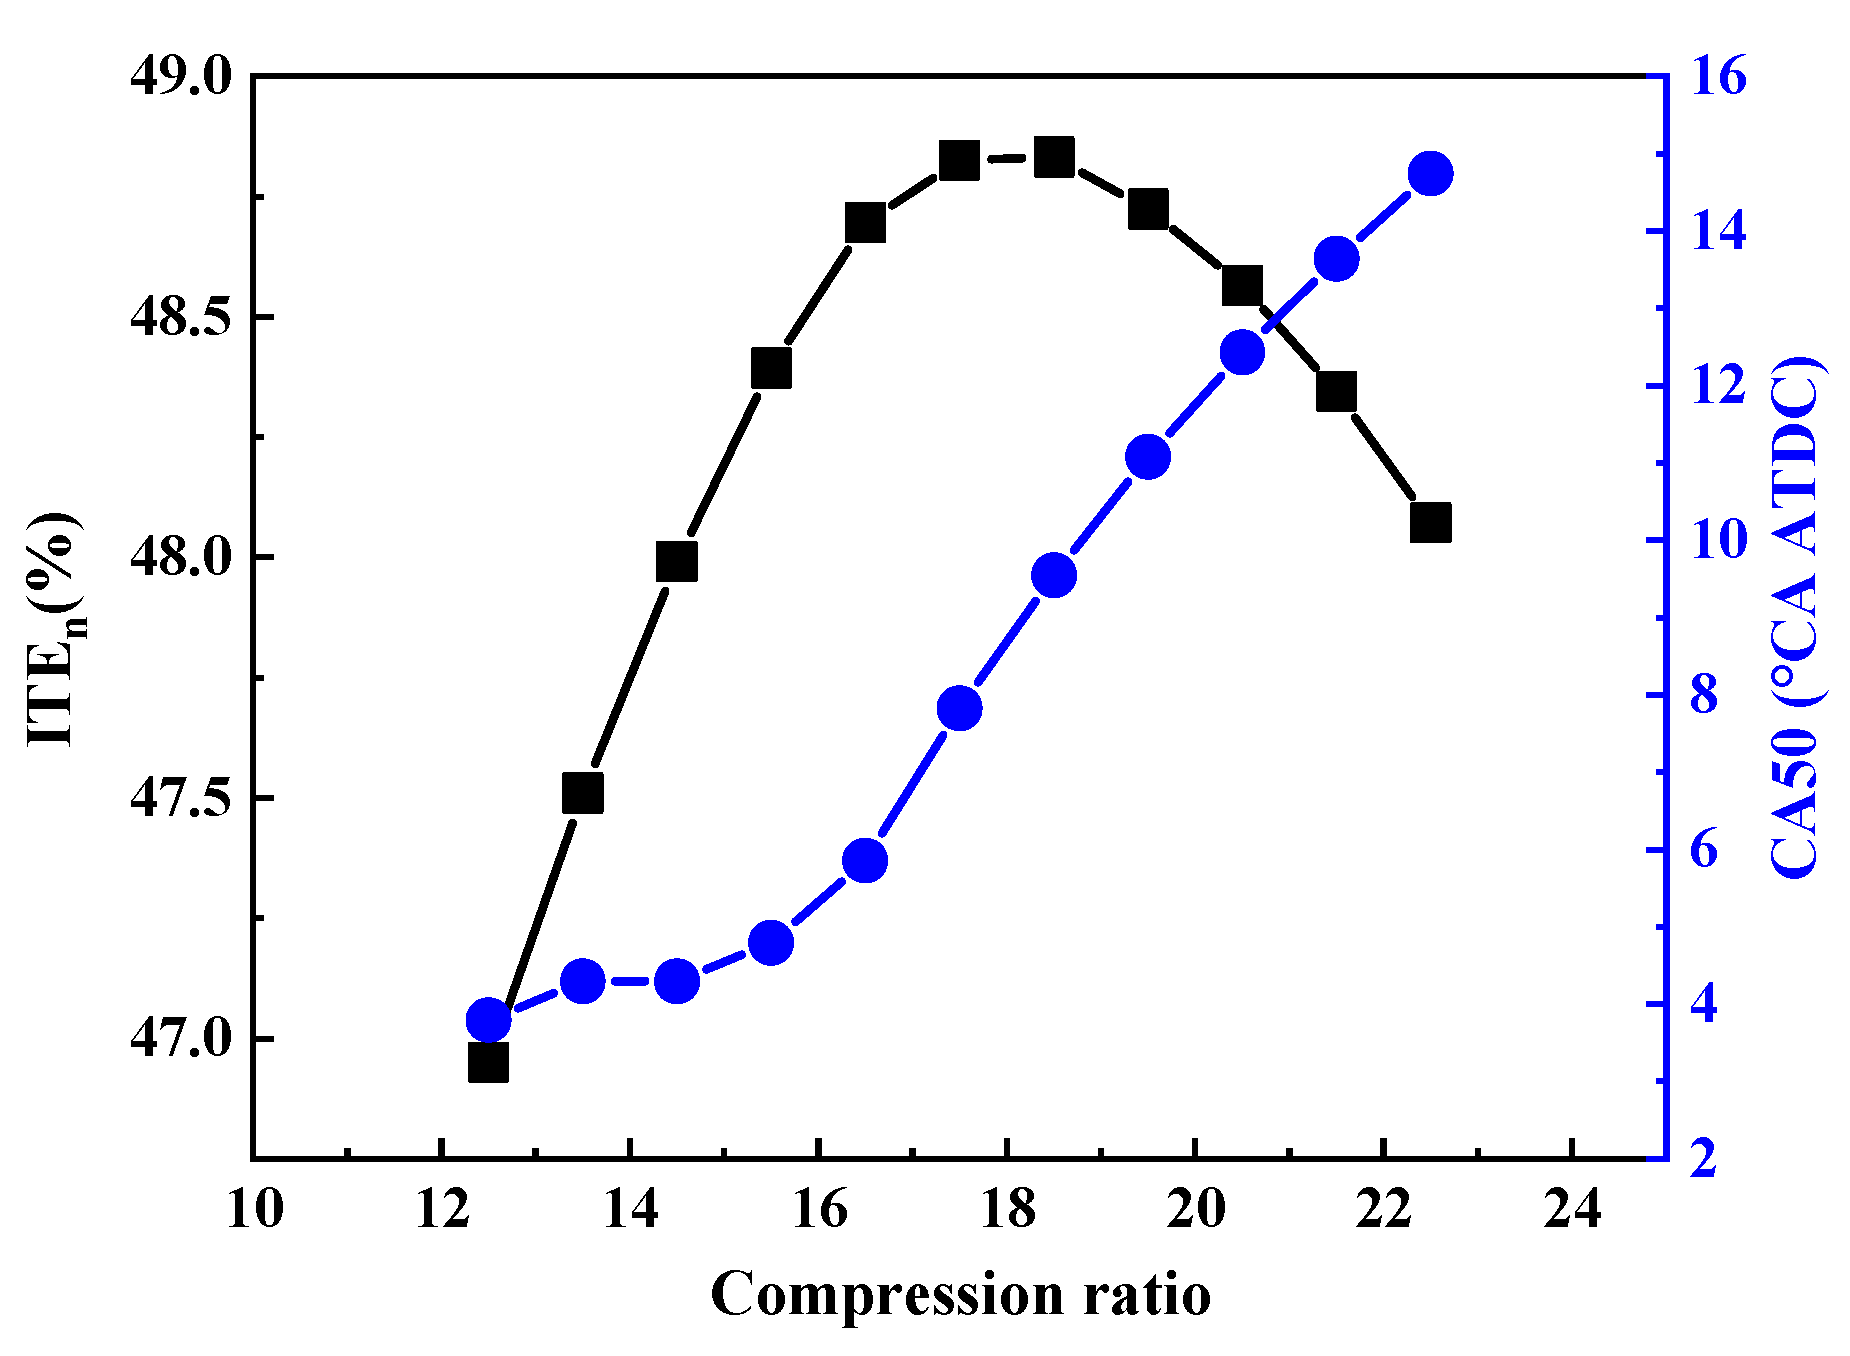
3.1.2. The Effect of CR on Thermal Efficiency

Figure 8 shows the effect of CR on ITEn at different combustion phasings. As the combustion phasing is advanced, the PCP monotonically increases and ITEn first rises and then declines. Peak ITEn increases with elevated CR at the cost of increased PCP. As shown in Figure 9, when PCP is limited to below 20 MPa, the optimum CR is around 17.5. It is attributed to combustion phasing being retarded when CR is elevated. In this case, adjusting the compression ratio cannot improve thermal efficiency.

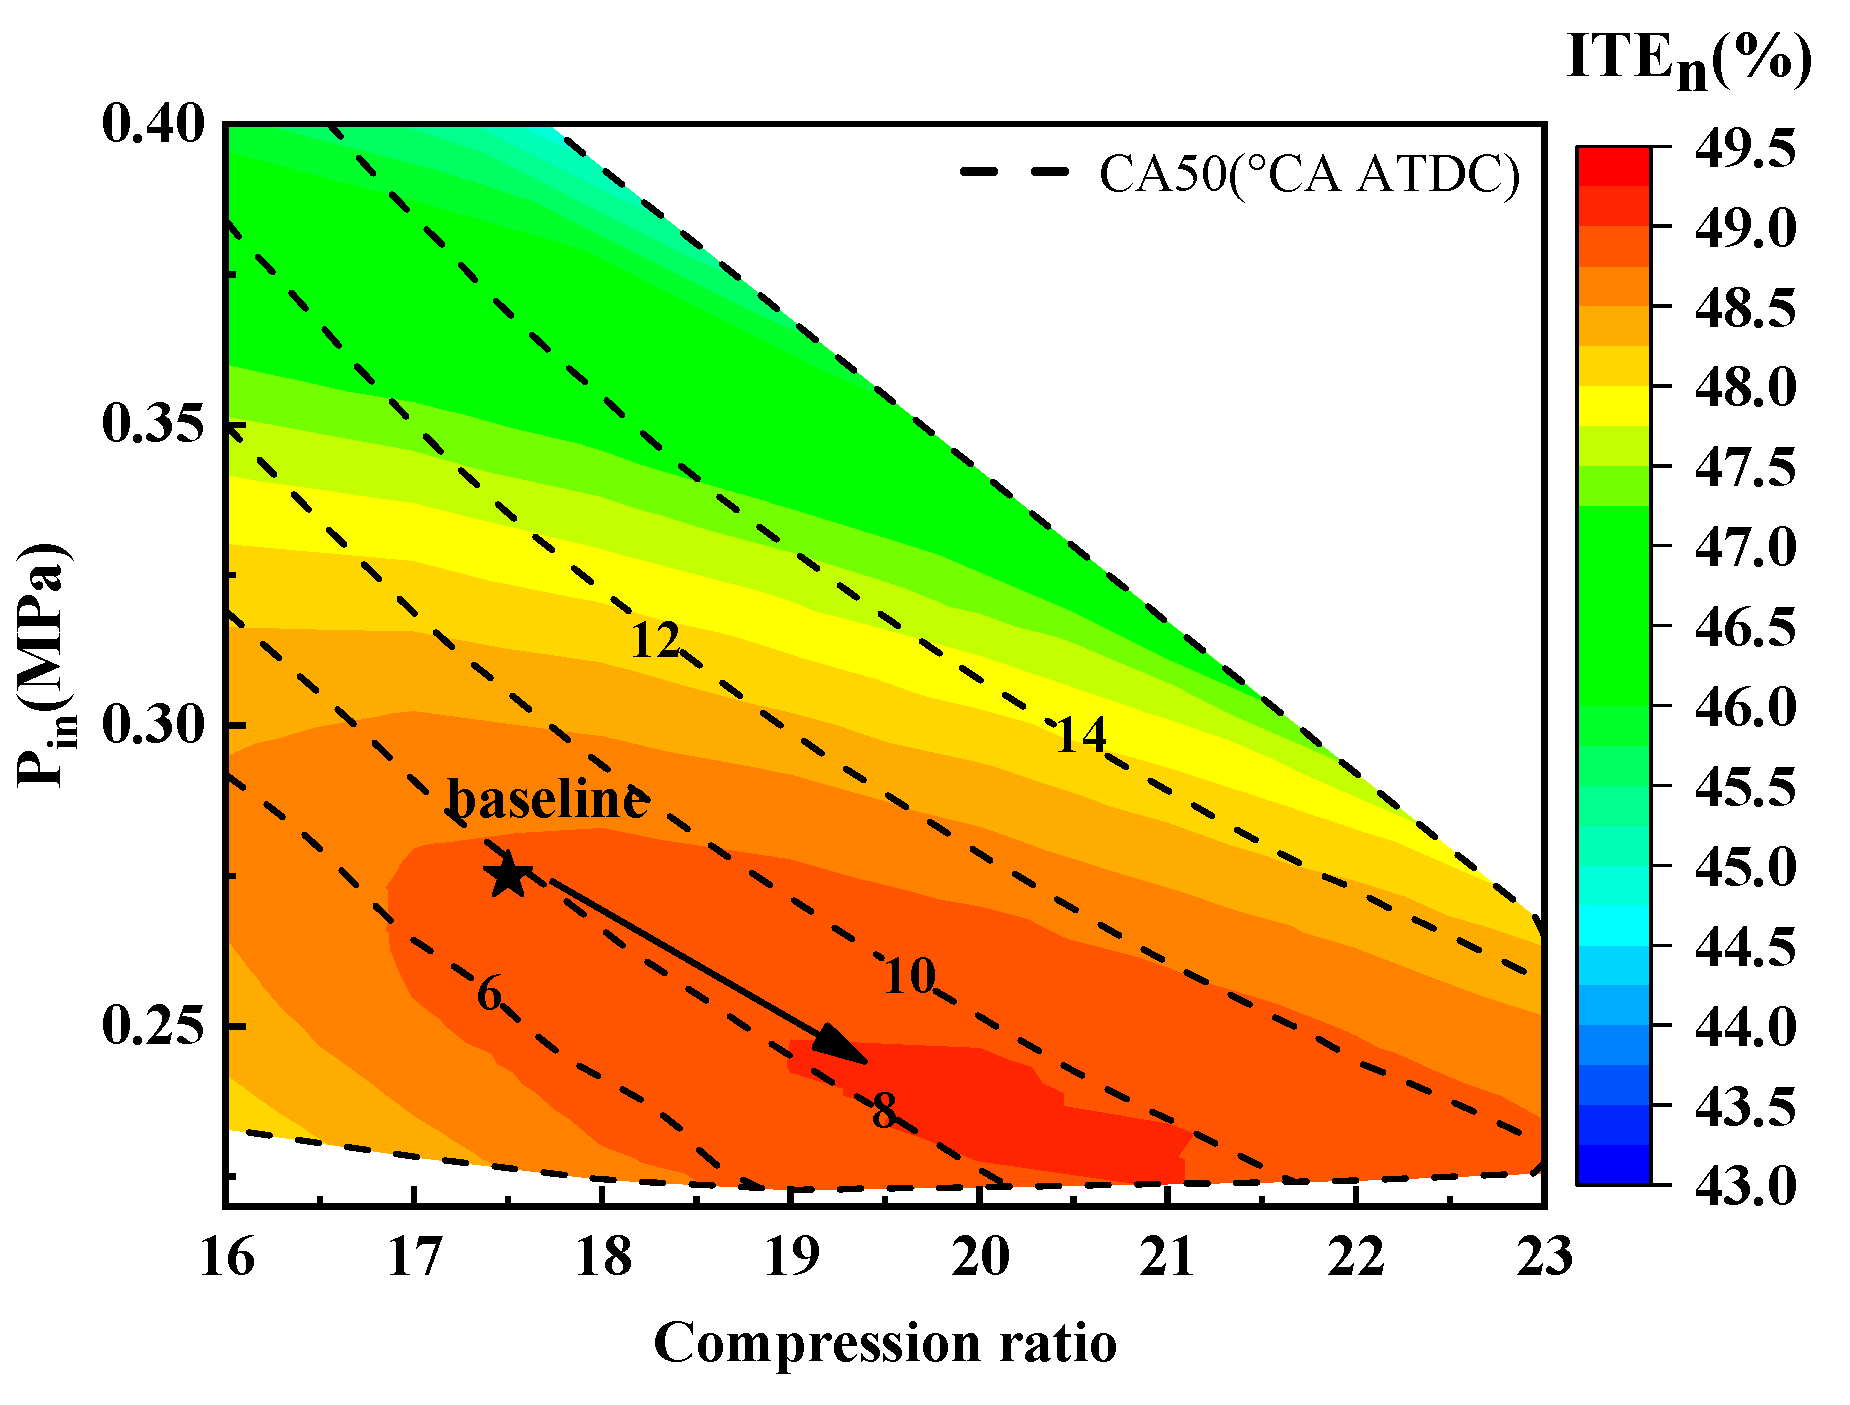
3.1.3. The Combining Effect of Boost Pressure and CR on Thermal Efficiency with PCP Constraint

Figure 10 shows the effects of boost pressure on engine performance when the CR is 17.5 and 19.5. Boost pressure represents the combustion lean extent as the air mass flow rate being proportional to the boost pressure. In Figure 10, CA50 is postponed with the increase in boost pressure in order to comply with PCP constraint. The PMEP value varies from a positive value to a negative value when boost pressure increases, as more work is performed to compress ambient air to high-pressure air. In conclusion, ITEn and ITEg rise and then fall with the increasing air dilution extent when the CR is 17.5 and 19.5. The difference is that peak ITEn of 19.5 CR is achieved with lower boost pressure and is higher compared to a peak ITEn of 17.5 CR. However, the combustion phasing of CR 19.5 is retarded, and the combustion lean extent is reduced, which is unfavorable to improving ITEn. This indicates that a trade-off between CR and boost pressure exists for the ITEn improvement, and it is possible to achieve higher ITEn by the co-optimization of CR and boost pressure. As shown in Figure 11, a more comprehensive ITEn comparison is undertaken with different combinations of boost pressure and CR under a 20 MPa PCP limitation. The peak ITEn increases from 48.86% to 49.01% by increasing CR. However, the CA50 is postponed, and the air dilution extent is reduced compared to the previous benchmark. To further improve ITEn, the 20.3 CR and 0.245 MPa boost pressure are adopted as benchmarks in the following discussion.

3.1.4. The Combining Effect of Boost Pressure and EGR Dilution on Thermal Efficiency with a PCP Constraint

As mentioned in the Introduction, it has been observed that HP EGR can improve pumping work and reduce PCP. There is an interaction among HP EGR, boost pressure, and turbocharging efficiency that makes it difficult to determine the effect of EGR dilution on engine performance. With the convenience of a single turbocharger model, the effect of EGR on engine performance is examined at the condition of constant boost pressure and constant turbocharging overall efficiency. Figure 12 illustrates the impact of EGR dilution on engine efficiency at varying boost pressures. The point at the upper edge of the contour means that the EGR valve is fully opened. The HP EGR ratio is restricted by the pressure difference between the pre-turbine and manifold pressure, which is why the top left section of each figure is blank. From Figure 12, it can be observed that the maximum EGR ratio increases with the increase in boost pressure. When high-pressure EGR is applied, part of the exhaust gas is circulated into the manifold after being cooled rather than going through the turbine for expansion work, which leads to exhaust gas energy loss. The expansion ratio of the turbine would increase to compensate for this loss and to balance the power consumed by the compressor. However, the air mass flow rate is reduced when the EGR ratio increases, as fresh air is replaced by exhaust gas. Therefore, compressor power is reduced when the boost pressure remains unchanged. Consequently, pumping work is subtly improved by increasing the EGR ratio at a constant boost pressure. Although heat losses are expected to decline for EGR diluted combustion as it has a lower combustion temperature, this effect is shown to be negligible for the variation range of the EGR ratio. In addition, exhaust gas leads to a lower in-cylinder charge-specific heat capacity ratio, which reduces conversion efficiency [39]. Hence, ITEg is slightly reduced when the EGR ratio increases. However, this effect is not obvious in the low- and high-boost pressure conditions. Overall, the EGR dilution is found to have a negligible effect on ITEn, while the boost pressure is the critical factor determining ITEn, and peak ITEn is obtained at a 0.245 MPa boost pressure.
In Figure 12, when the boost pressure is at 0.25 MPa, the maximum achievable EGR rate is 1.5%. Consequently, the NOx emission decreases from 27.1 g/kWh to 26 g/kWh. At a higher boost pressure of 0.35 MPa, the maximum EGR rate increases to 6.1%, leading to a reduction in NOx emissions from 11 g/kWh to 8.9 g/kWh. It is likely that the simplicity of the one-dimensional combustion model has resulted in an underestimation of the impact of EGR on NOx emissions. Since both increasing air dilution and EGR dilution extent can effectively reduce NOx emission, it is of interest to determine the optimum combustion lean extent and EGR dilution extent for overall energy efficiency that considers ammonia consumption. Figure 12 also shows the effect of EGR with different boost pressures on overall energy efficiency. It is obvious that peak overall energy efficiency is achieved by the EGR valve being fully open and a 0.29 MPa boost pressure, which is higher than the optimum boost pressure for peak ITEn. Therefore, determining the target boost pressure entails a trade-off between the lowest fuel consumption and the highest overall energy efficiency. As the EGR dilution is effective in reducing NOx emission and has a negligible impact on ITEn, the high-pressure EGR value is set fully open to reduce the overall energy efficiency in the subsequent discussion.

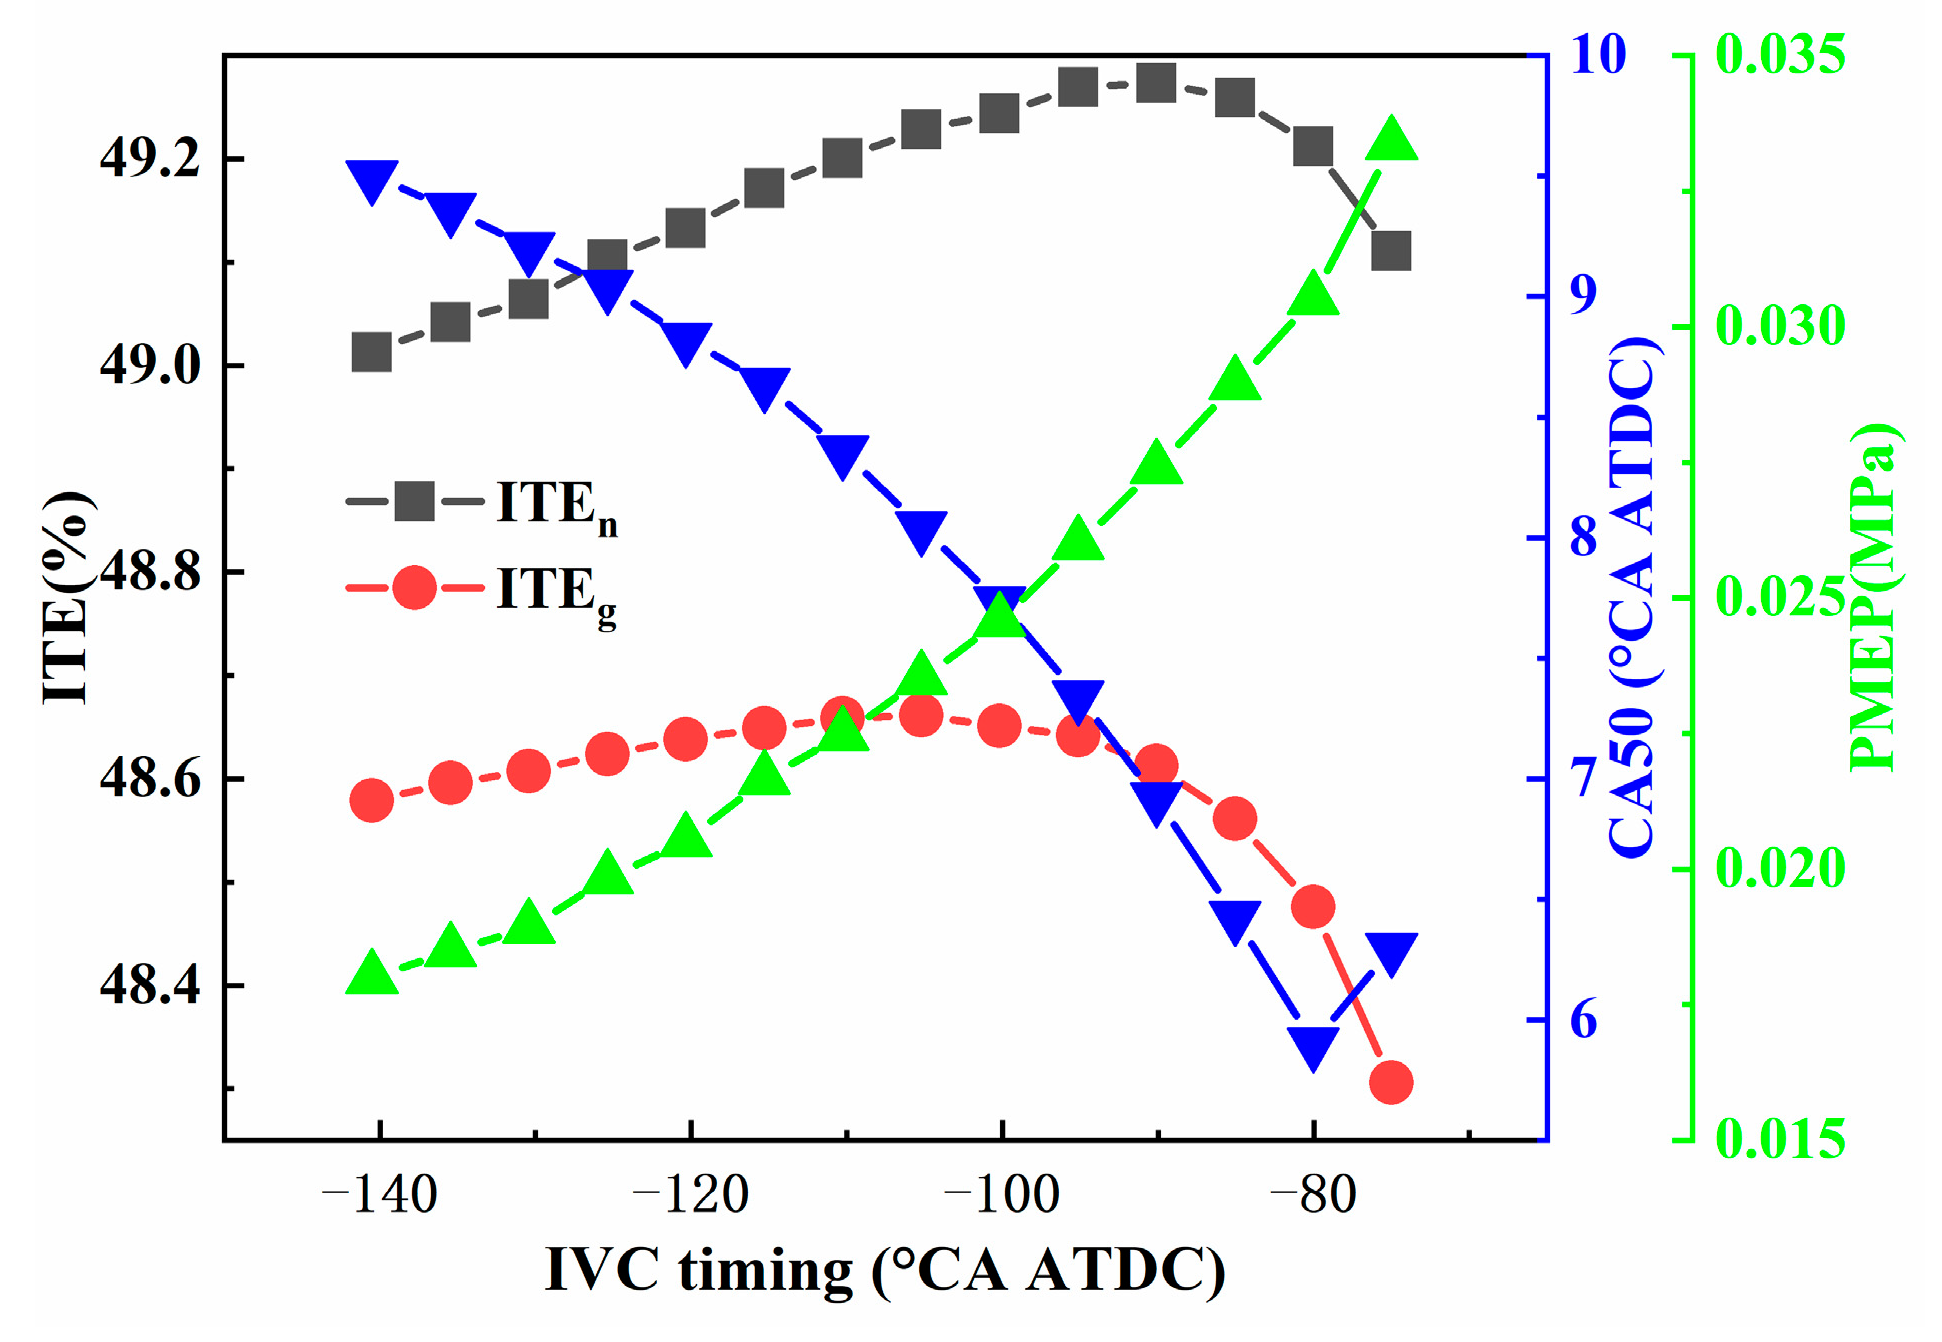
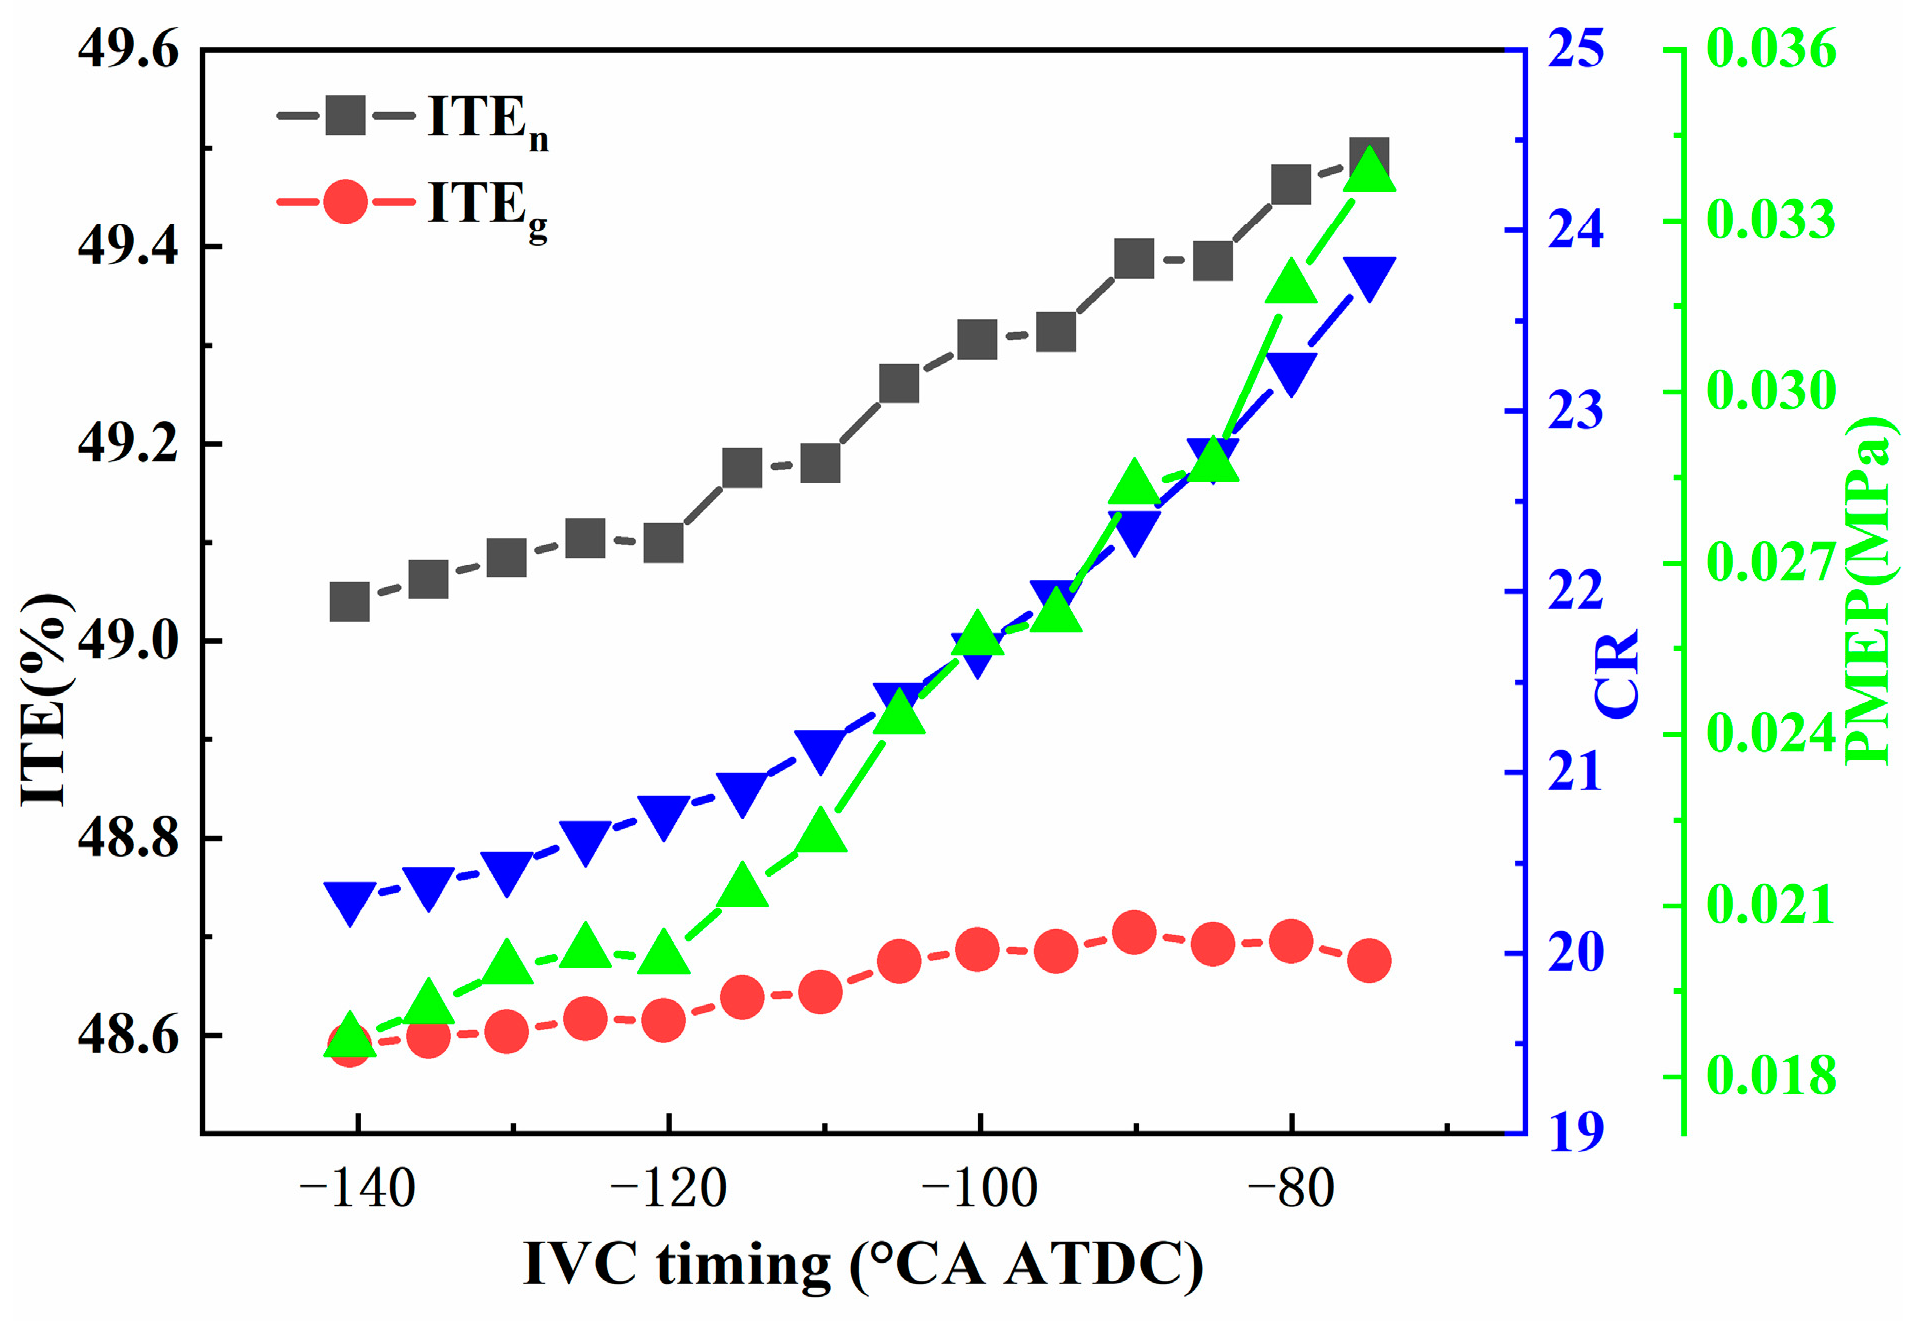
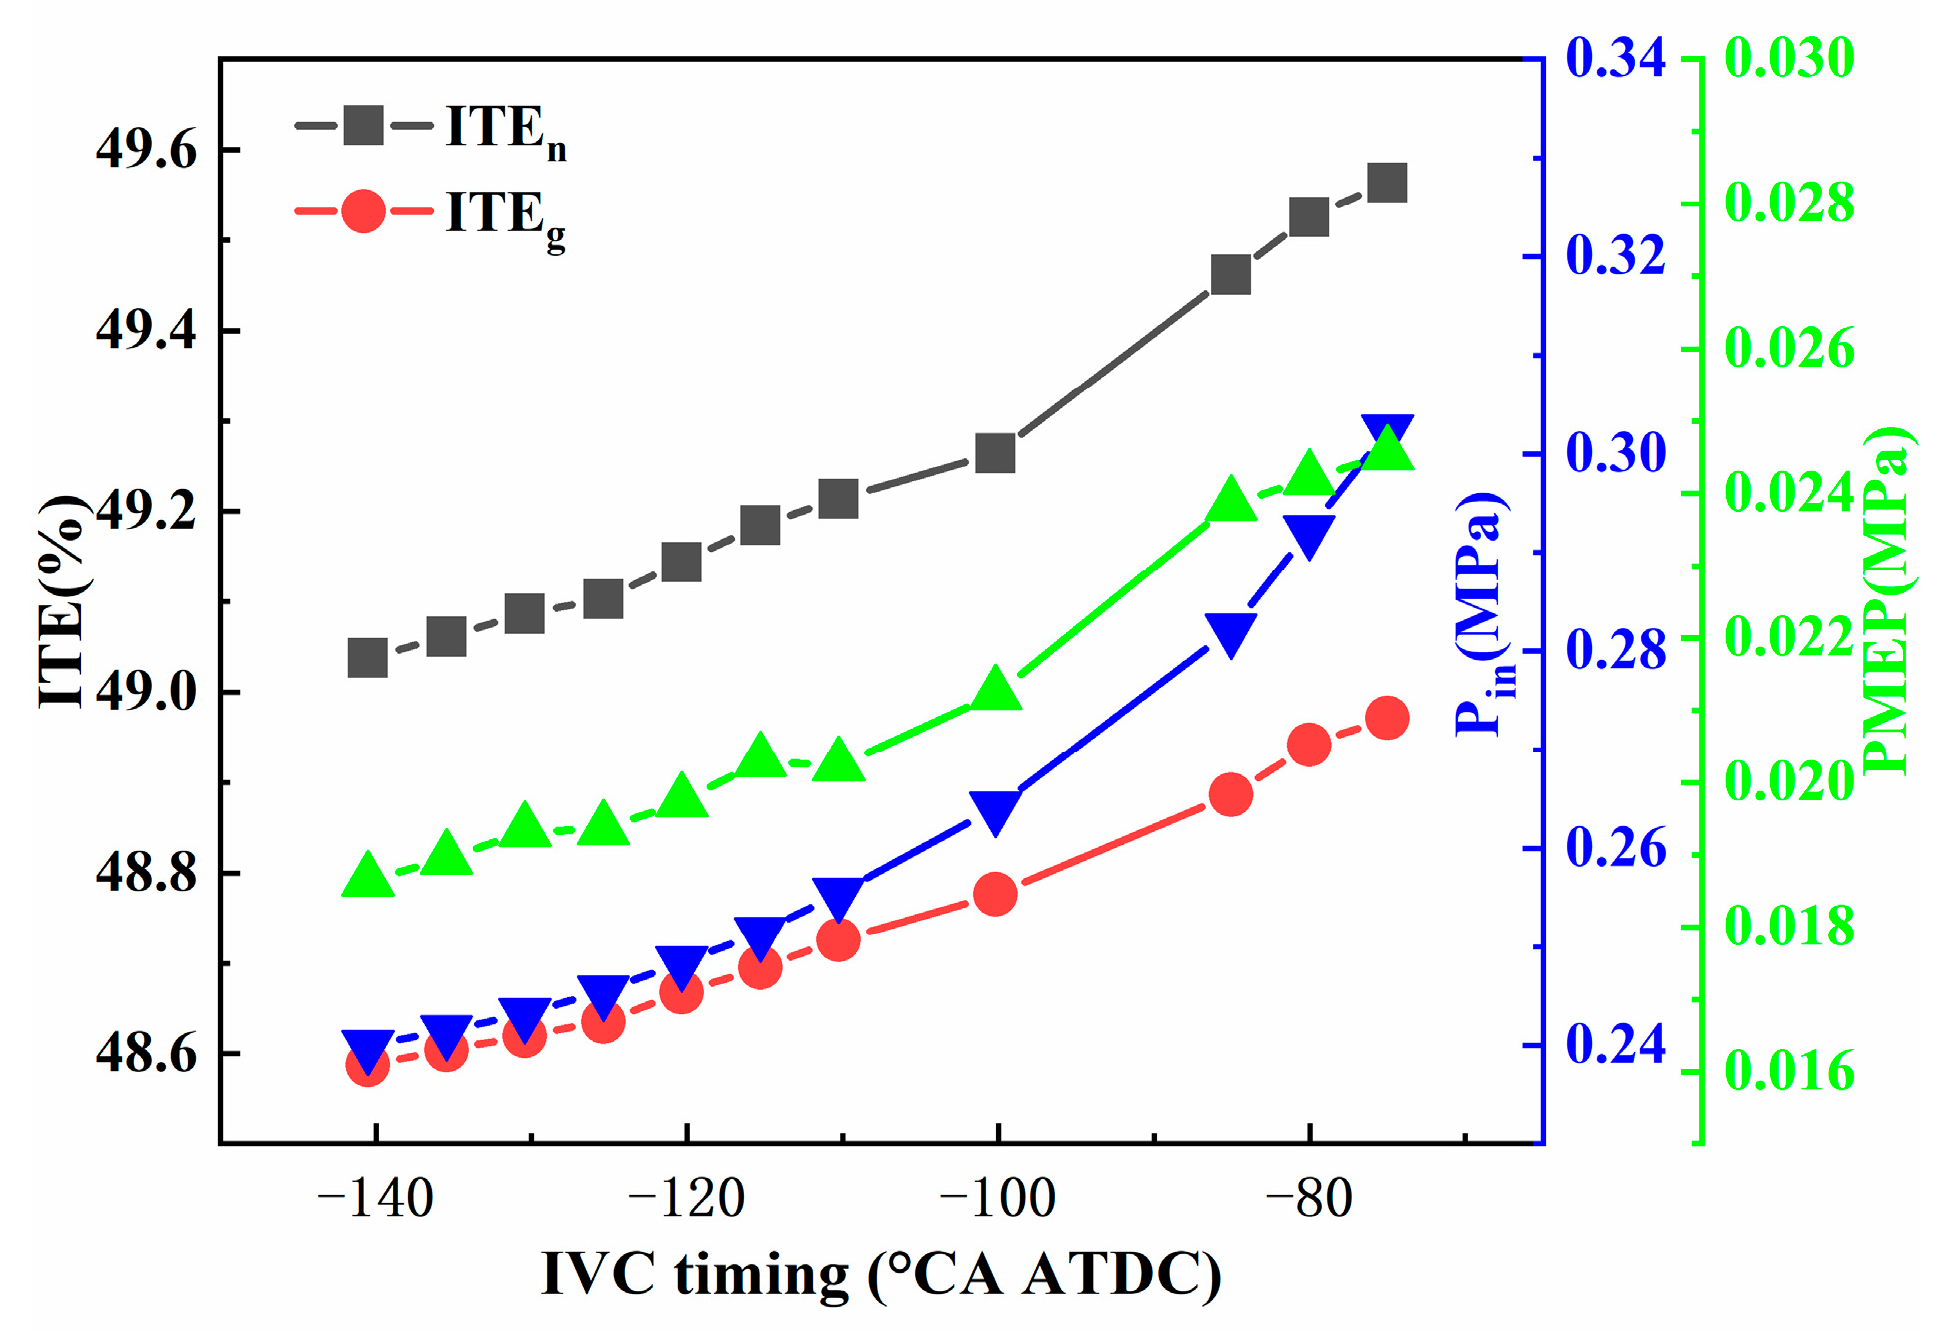
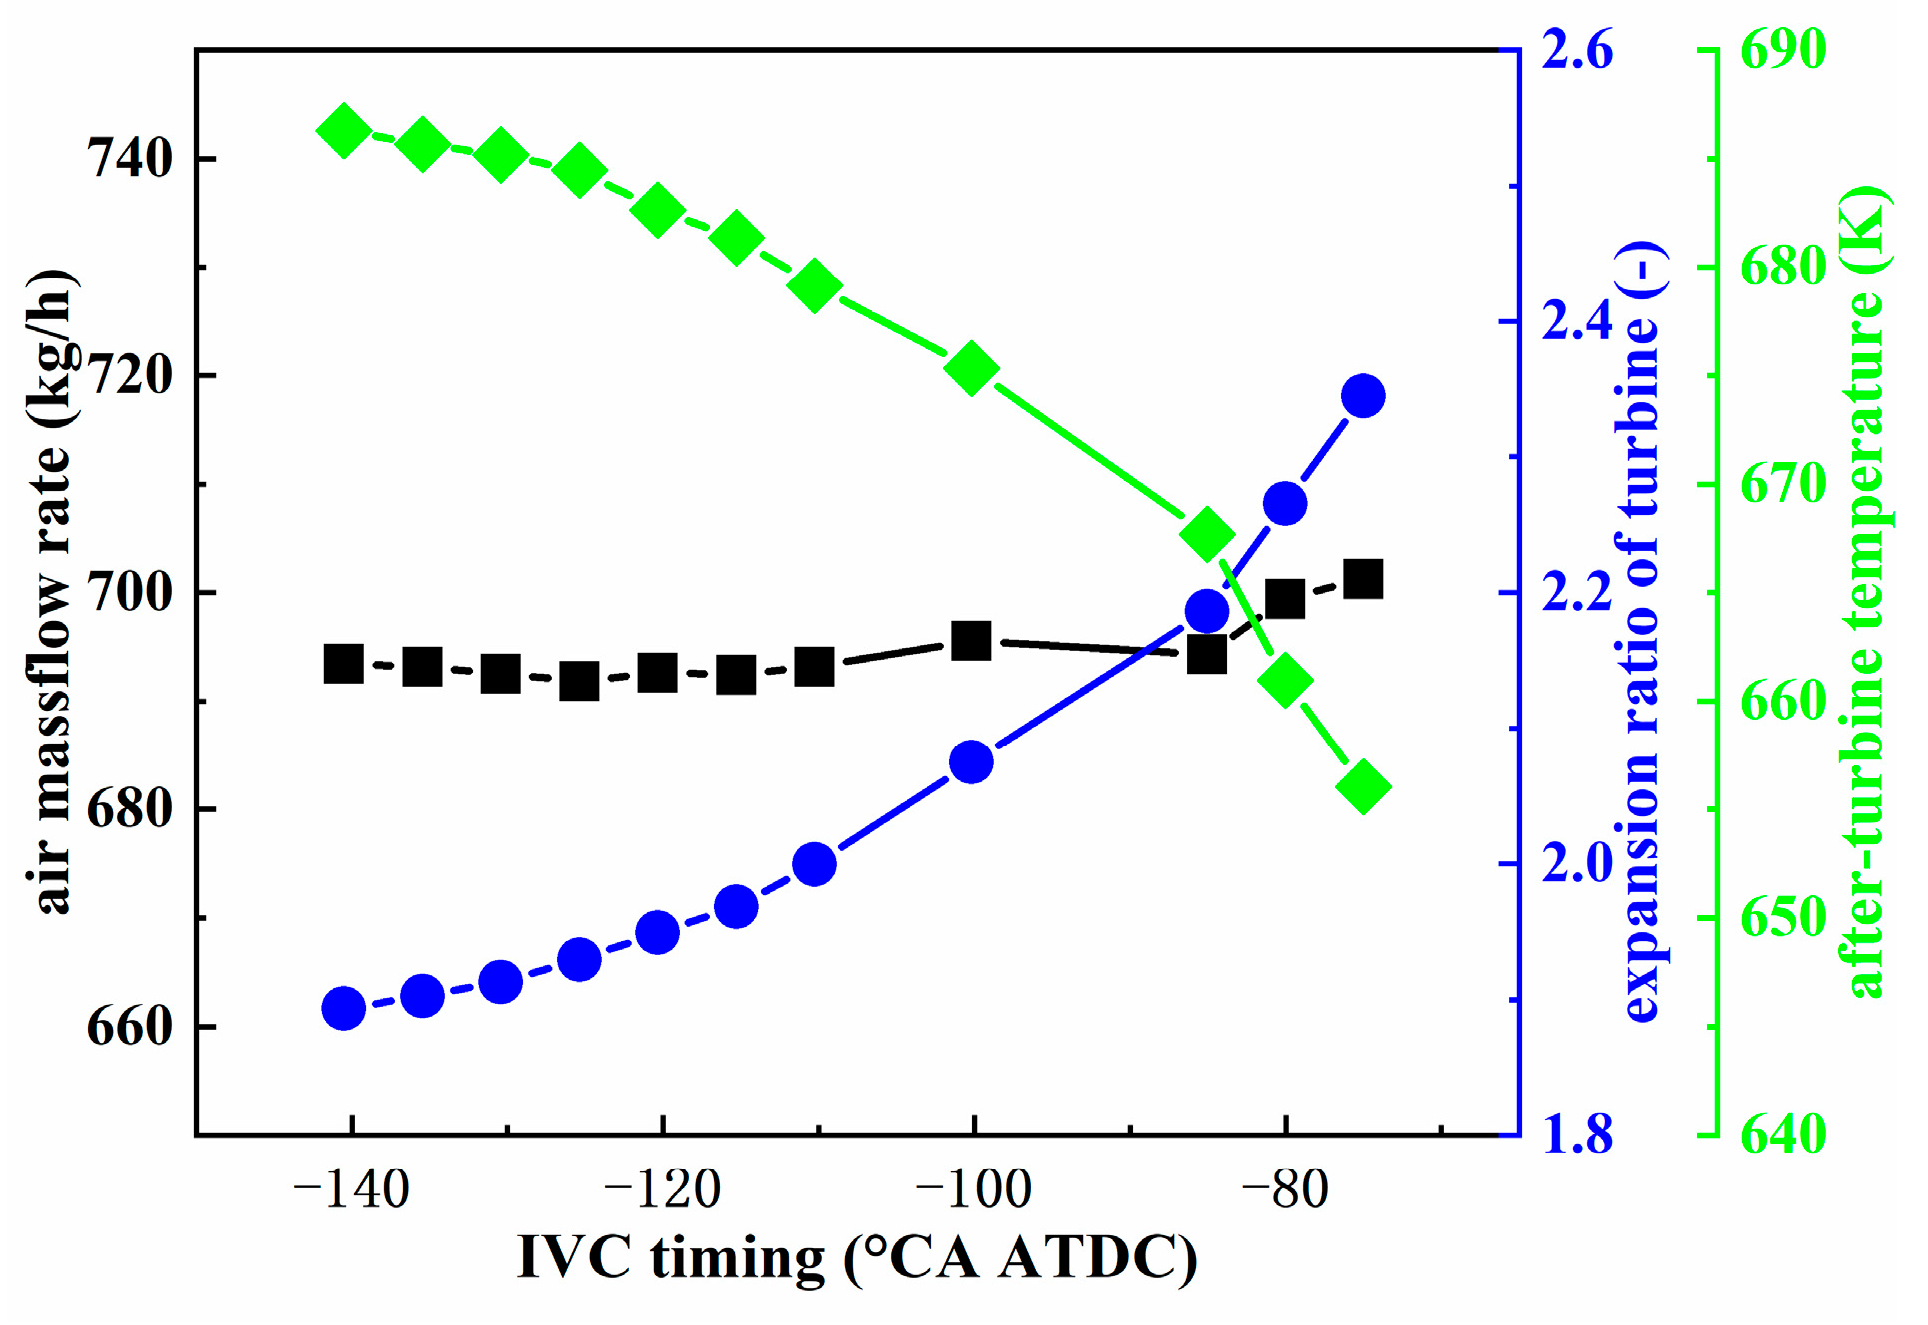
3.1.5. The Combining Effect of Late IVC Timing and CR, Boost Pressure, Combustion Phasing on Thermal Efficiency with PCP Constraint

From the previous discussion, it is concluded that CR, boost pressure, and combustion phasing compete as the PCP are restricted. The competition among them leads to limited ITEn improvement. As previously mentioned in the introduction, delayed IVC timing can reduce the effective compression ratio, and could potentially mitigate the constraint of PCP on CR, boost pressure, and combustion phasing. Like the previous discussion, the PCP limitation is set as 20 MPa. The benchmark CR, boost pressure, and IVC timing are 20.3, 0.245 MPa, and −140.5 °CA ATDC, respectively, which achieved the highest ITEn in the previous discussion. Here, the IVC timing is changed by stretching the intake valve lift profile, while the intake valve opening timing remains unchanged. Figure 13 shows the valve lift profiles for different IVC timing.
Figure 14, Figure 15 and Figure 16 summarize the effects of late IVC timing on CA50, CR, and Pin and the corresponding ITEn trend.
In Figure 14, the CR and the boost pressure are maintained at benchmark values as IVC timing is delayed. CA50 is optimized to achieve the highest ITEn while meeting the PCP constraint simultaneously. As IVC timing is delayed, the effective compression ratio is reduced. As a result, CA50 can be advanced, which contributes to ITEg improvement. In addition, when boost pressure remains constant, the air mass flow rate declines for the decreased volumetric efficiency. This brings changes in two aspects. On the one hand, the reduction in the air mass flow rate leads to advanced combustion phasing and improved pumping working. On the other hand, the combustion lean extent is reduced, which tends to increase heat losses. Consequently, the CA50 moves away from the top death center when the IVC timing is retarded after −80 °CA ATDC. The above phenomenon leads to the results that ITEn obtains a peak value of 49.27% when IVC timing is around −90 °CA ATDC.
In Figure 15, the CA50 and the boost pressure are maintained at benchmark values as IVC timing is delayed. CR is optimized to achieve the highest ITEn while complying with the PCP constraint. Figure 15 shows that ITEg only obtains a 0.1% increment while CR significantly increases. Moreover, ITEg tends to decline after IVC −90 °CA ATDC. This is attributed to an increase in heat loss owing to the reduction in combustion lean extent. In addition, pumping work is obviously improved for the reduction in volumetric efficiency. As a result, ITEn monotonically increases as IVC timing is delayed. The peak ITEn value is 49.49%, achieved by retarding IVC timing within the studied range.
Like Figure 14 and Figure 15, the CA50 and the CR are maintained at benchmark values as IVC timing is delayed in Figure 16. Pin is adjusted to achieve the highest ITEn while fulfilling the PCP constraint. In Figure 16, ITEg and ITEn are monotonically improved with delayed IVC timing and elevated boost pressure. Since the CA50 and expansion ratio in the expansion stroke remain constant, the ITEg increment is attributed to the reduction in compression work in the compression stroke for the reduced effective compression ratio. As seen in Figure 10, pumping work deteriorates considerably due to the high boost pressure, while pumping work is improved with elevated boost pressure in Figure 16. To illustrate the PMEP trend in Figure 16, the air mass flow rate, expansion ratio of the turbine, and after-turbine temperature are given in Figure 17. While boost pressure and air mass flow rate increase simultaneously in the first case, boost pressure increases with a nearly constant air mass flow rate in the latter case. Seen from the turbine expansion ratio and after-turbine temperature trends in Figure 17, it could be concluded that more exhaust enthalpy is recovered to provide the power needed to compress air to a high boost pressure when the air mass flow rate remains nearly constant. Thereby, pumping work is improved in Figure 16. In conclusion, combining late IVC timing and high boost pressure is beneficial to improve ITEn. The peak ITEn value is 49.56%, achieved by retarding IVC timing within the studied range.
To sum up, late IVC timing is shown to be able to mitigate the PCP constraint on CR, boost pressure, and combustion phasing, which leads to higher ITEn. Combining late IVC timing and high boost pressure shows the greatest potential to improve ITEn under the constraint of a 20 MPa PCP. When advancing CA50 or increasing CR with late IVC timing, ITEn improvement is mainly attributed to pumping work improvement, and the air–fuel ratio is reduced. Indeed, the combustion duration would be prolonged when the air–fuel ratio declines [40], leading to an ITEg reduction [36], which could not be captured by the current combustion model. To overcome this disadvantage, the air–fuel ratio is restricted to above the baseline value in the multi-parameter optimization to acquire meaningful results.

3.2. Multiple Parameter Optimization for Efficiency Improvement

Based on above parametric analysis, CR, boost pressure, and IVC timing should be co-optimized to achieve the maximum ITEn under a PCP-limited condition, which is a multi-parameter optimization problem. The normal practice is combining the 1D engine model and a Genetic Algorithm to find the optimum parameter combinations. However, running one case in a full engine model costs eight to ten minutes on one CPU core, which implies that the solution search procedure will be time-consuming and computation-demanding. In order to accelerate the optimization procedure, a hybrid method is used by replacing the full engine model with a mathematical model, as shown in Figure 18.
First, create a design of experiments involving one hundred cases within the variation range of variables by the Latin Hypercube method [41]. Table 7 lists the optimization parameters and corresponding variation ranges. The upper limit of IVC timing is set as −80 °CA ATDC to prevent the occurrence of a cold start issue. Second, run the one hundred cases in the 1D engine model. Third, train the Gaussian Process Regression (GPR) model through [42] with the input and results collected from the 1D engine model simulation. Consider the training set ( X i , Y i ) ; i = 1 , , n , where X i R 4 and Y i R 3 , drawn from an unknown distribution. Here, X is vector (CR, Pin, IVC timing, CA50), Y is vector (ITEn, λ, PCP). Given the training data and input X n e w , the Gaussian Process Regression model addresses the question of predicting the value of a response variable Y n e w . The model description is given below. The training results are shown in Figure 19, which suggests that the model can make accurate predictions.
f ( X ) ~ G P ( 0 , k X i , X j θ ) ;
k X i , X j θ = σ f 2 e x p 1 2 m = 1 4 x i m x j m 2 σ m 2 ;
P Y i f X i , X i N Y i h X i T β + f X i , σ 2
Third, find the optimal solution by an optimization algorithm. In order to avoid the inaccuracy caused by the adopted user-imposed combustion profile model at a low air–fuel ratio condition, a constraint that the air–fuel ratio should be higher than the baseline value is added in the multiple parameter optimization procedure as a higher air–fuel ratio is in favor of shortening combustion duration [12]. By adding this constraint, parameter optimization would provide a lower-bound approximation of the optimal solution to guide highly efficient turbocharged diesel engine design. The optimization problem constraints can be summarized as follows:
  • The PCP of operation cycle should be below certain limits to avoid engine damage;
  • The air–fuel ratio should be above the initial baseline value to guarantee that combustion duration is not affected significantly.
Despite many different types of optimization algorithms having been developed to solve the described problem, the problem suits the application of a Genetic Algorithm (GA) [43] when the variable number is 4. The block diagram of the algorithm procedure is shown in Figure 18. To guarantee the results fulfill the constraints, the optimization problem is transferred to a single-objective optimization problem by including a penalty factor, and the merit function is written as follows:
f x = I T E n , P C P c e r t a i n   l i m i t s a i r   f u e l   r a t i o     b a s e l i n e   v a l u e I T E n 1 , P C P > c e r t a i n   l i m i t s a i r   f u e l   r a t i o < b a s e l i n e   v a l u e
Via the proposed method, parameter optimization in 20 MPa, 22 MPa, and 25 MPa PCP limit conditions is conducted. Table 8 summarizes the optimized parameters and corresponding results at different PCP limits. The optimization results indicate that the ITEn increases by 1.56% (absolute) compared to the baseline at the PCP constraint of 20 MPa. As the PCP limitation increases from 20 MPa to 25 MPa, the ITEn increases from 49.20% to 50.06%. This requires the compression ratio to increase by about 3.35, the IVC timing to be delayed by about 7 °CA, and the boost pressure to only increase by 0.01 MPa. It indicates that improving thermal efficiency by elevating the peak pressure limitation needs collaboration with increased compression ratio and delayed IVC timing, while the boost pressure is slightly increased. The reason why the boost pressure remains nearly unchanged is that the increment in boost pressure leads to a deterioration in pumping work. By the way, the NOx emission rises at the same time, which would partly offset the gain in the ITEn improvement if the ammonia consumption is considered.

3.3. Thermal Efficiency Improvement Strategy Validation

To validate the thermal efficiency improvement strategy, the original engine configurations is upgraded according to the optimization results. Table 9 shows the engine specification comparison. A two-stage turbocharger (2TC) with an intercooler is applied to achieve a high boost pressure. In 2TC system, turbocharging overall efficiency is not appropriate to characterize the air system performance, owing to a part of the air enthalpy being carried away by the coolant inside intercooler. From the perspective of improving thermal efficiency, the air mass flow rate and PMEP can be used to describe the air system performance. Using the 1D engine model, the effect of turbocharging overall efficiency and the 2TC system on the air mass flow rate and PMEP is compared in Figure 20. In the 2TC system, the compressor and the turbine isentropic efficiency are assumed to remain at baseline values, and the compressed air temperature after the intercooler is controlled to 40 °C. In the single turbocharger air system, PMEP is improved and combustion lean extent is raised, when the turbocharging overall efficiency rises. Likewise, the air mass flow rate and PMEP of the 2TC with an intercooler are also improved compared to the baseline single turbocharger system. So, the application of a 2TC with an intercooler has similar effects to increasing turbocharging overall efficiency in practice, even if the isentropic efficiency of turbocharger is not improved. Apart from the air system, the combustion system is also upgraded. The CR and IVC timing are set as 21.5 and −92 °CA ATDC, which do not strictly follow the optimization results but basically comply with the principle of the thermal efficiency improvement strategy. In addition, the high-pressure EGR valve is kept fully open.
The baseline engine and optimized engine performance are compared in Table 10. The CA50 advances more than the prediction in Table 10 because the updated engine is equipped with a lower CR piston compared to optimization results. The ITEn of the optimized engine is 2.57% (absolute value) higher than the ITEn of the baseline engine, while this value is 2.42% in the results of the simulation. The higher air–fuel ratio compared to the baseline engine is attributed to the additional ITEn improvement. The mechanical efficiency declines by 0.42 percent for the PCP increment. While the thermal efficiency is improved, the NOx emissions increase, as predicted. Moreover, the EGR ratio is lower than expected, which means that the air handling system needs to be further improved for a 2~3% EGR ratio at the target boost pressure. Further, the overall energy efficiency is improved due to the considerable increment in ITEn.

4. Conclusions

This study investigated the effect of overall turbocharging efficiency, CR, boost pressure, HP EGR, and IVC timing on thermal efficiency under PCP-limited conditions by using a 1D model. A Genetic Algorithm was utilized to optimize multiple parameters and determine the best engine specifications, trying to achieve maximum thermal efficiency with different PCP limits. In addition, the impact of the thermal efficiency improvement strategy on NOx emission was also analyzed. Based on the optimization results, the engine configuration was updated, and engine tests were performed to verify the thermal efficiency enhancement strategy. The main conclusion can be summarized as follows:
(1)
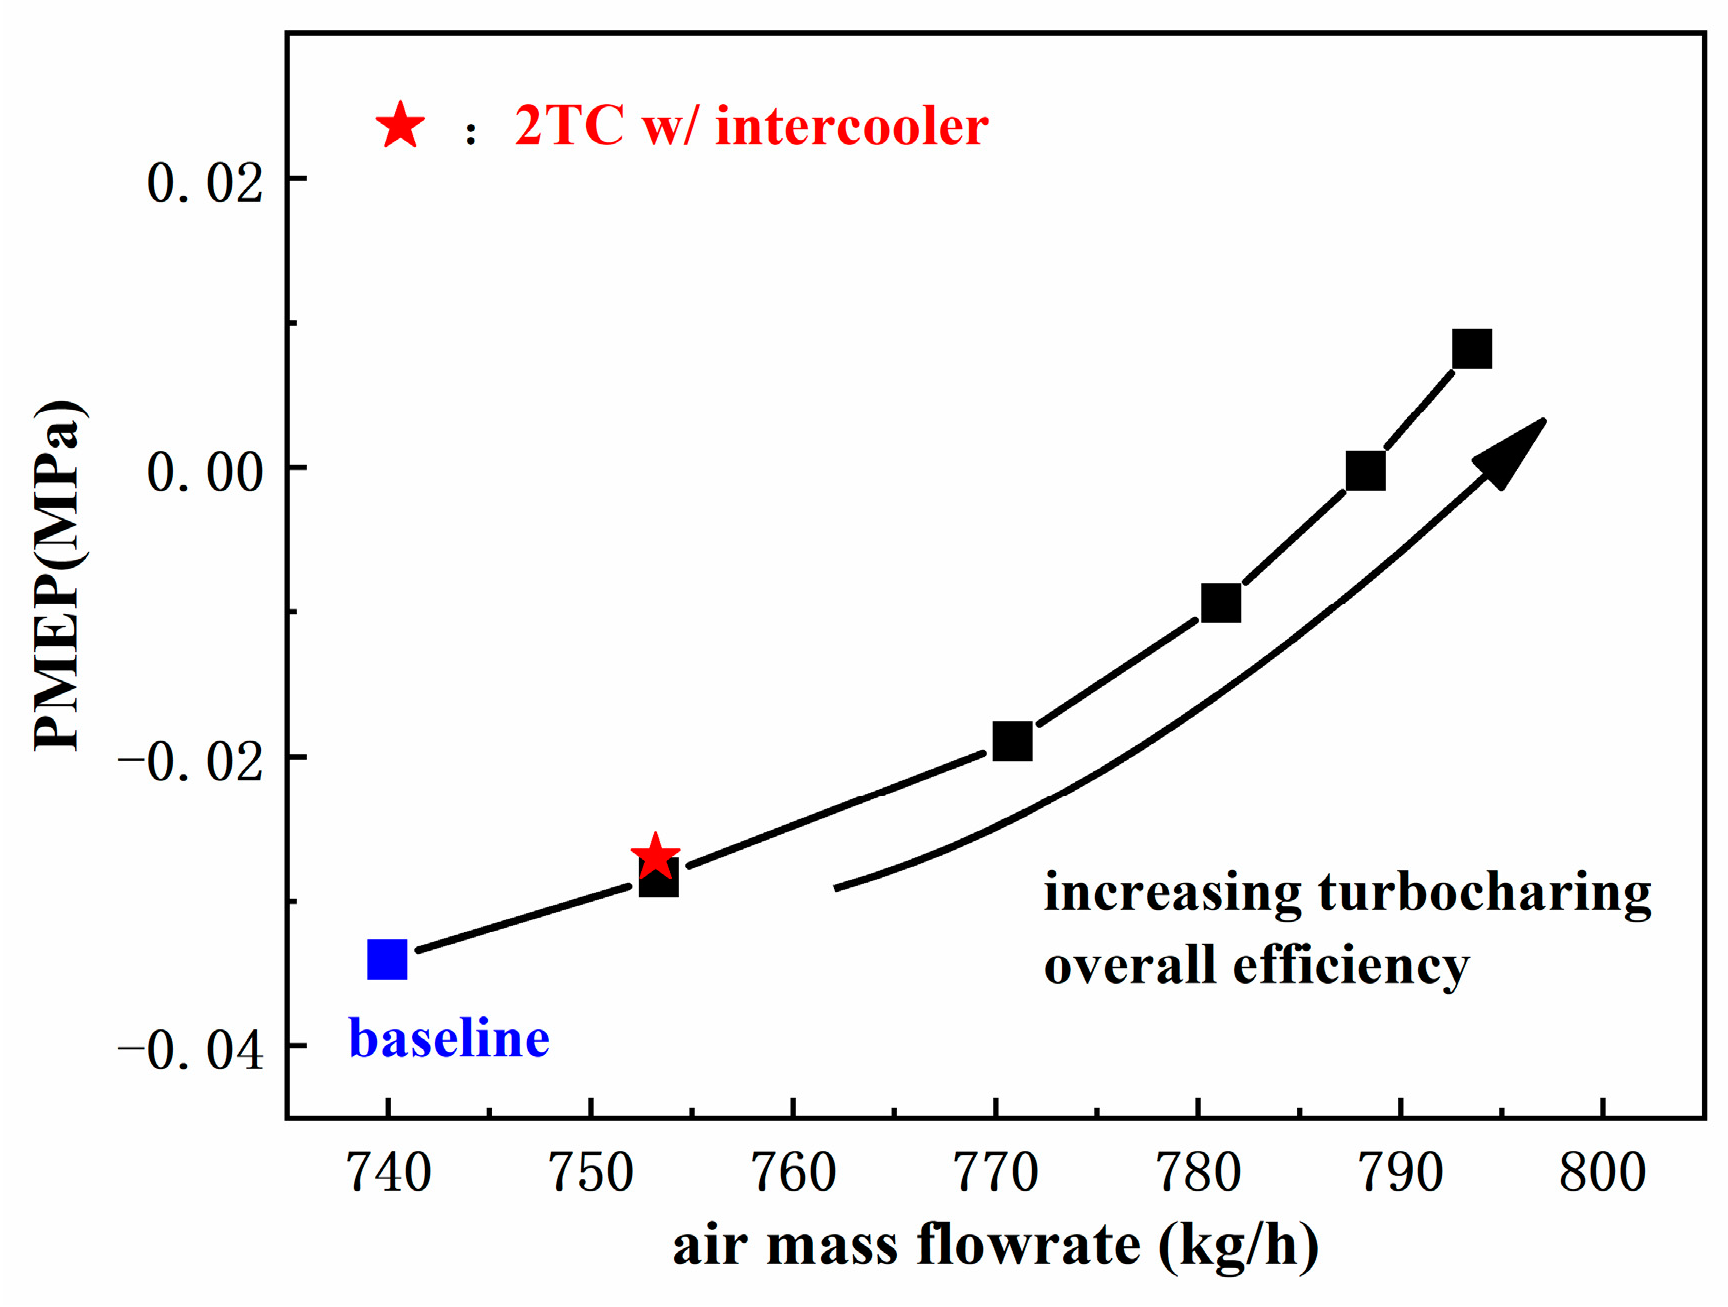
To improve the thermal efficiency at a specific operating point, priority should be put on turbocharger design and matching to ensure high turbocharging overall efficiency at target operating conditions. Alternatively, a 2TC with an intercooler can provide similar effects to increasing the turbocharging overall efficiency. Both the two air systems can increase the air dilution extent and improve pumping work;
(2)
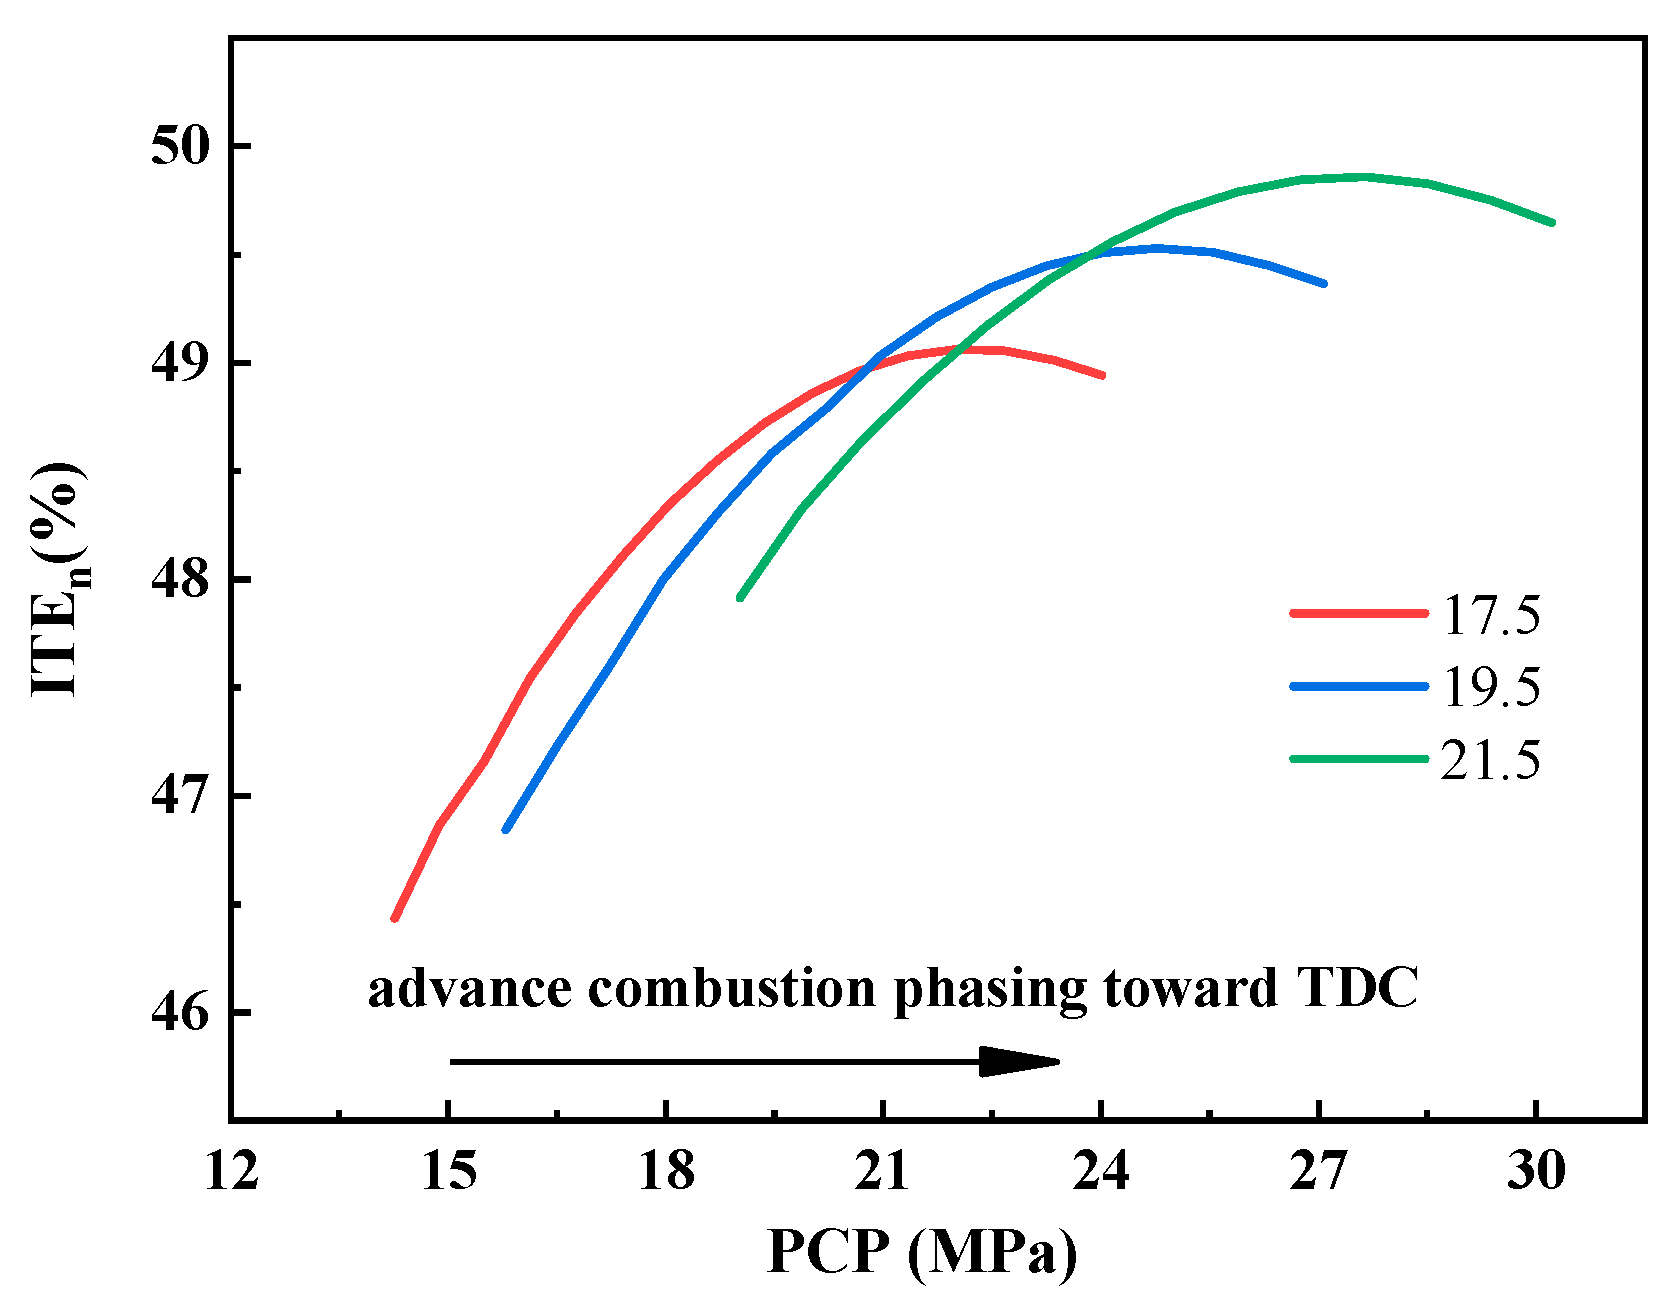
Although increasing boost pressure could raise the combustion lean extent to improve ITEg, a high boost pressure also deteriorates PMEP and delays the combustion phasing. There is an optimum value of boost pressure to balance ITEg and PMEP for the highest ITEn;
(3)
High turbocharging overall efficiency makes it hard to introduce HP EGR, while high boost pressure increases the maximum HP EGR ratio. EGR dilution by the HP EGR method has a marginal impact on ITEn, but HP EGR with a high boost pressure is beneficial to improve the overall energy efficiency. From the perspective of achieving the highest thermal efficiency, the HP EGR system can be eliminated;
(4)
When the PCP is limited, CR, boost pressure, and CA50 compete. By delaying the IVC timing, constraints on CR, boost pressure, and combustion phasing can be mitigated, leading to a higher ITEn. To achieve the highest ITEn under the PCP limits, co-optimization of late IVC timing, high CR, and high boost pressure is needed;
(5)
Through co-optimization of multiple parameters, the ITEn increases by 1.56% (absolute) compared with the baseline under a 20 MPa PCP constraint. When the PCP limits increase from 20 MPa to 25 MPa, achieving the highest ITEn requires that the CR increases by about 3.35, the IVC timing delays by about 7 °CA, and the boost pressure only increases by 0.01 MPa. By adopting the thermal efficiency improvement strategy, ITEn is expected to be elevated by 2.42%;
(6)
The upgraded engine test results validated the proposed thermal efficiency improvement strategy. Compared with the baseline engine, the brake thermal efficiency and overall energy efficiency were improved by 2.2% and 1.98%, respectively.

Author Contributions

Conceptualization, L.L. and Z.Y.; Data curation, L.L.; Formal analysis, L.L.; Funding acquisition, Z.Y.; Investigation, L.L.; Methodology, L.L. and B.M.; Project administration, Z.Y.; Resources, Z.Z.; Software, L.L.; Supervision, Z.Y. and Z.Z.; Validation, L.L. and B.M.; Visualization, L.L.; Writing—original draft, L.L. and B.M.; Writing—review and editing, Z.Z. All authors have read and agreed to the published version of the manuscript.

Funding

The authors would like to acknowledge the financial support from the National Natural Science Foundation of China through Project 52006154 and Project 51921004.

Data Availability Statement

The data presented in this study are available on request from the corresponding author.

Conflicts of Interest

The authors declare no conflict of interest.

Abbreviations

ATDCAfter top death center
BMEPBrake mean effective pressure
CA50Crank angle when 50% of the total heat has been released
CACrank angle
CRCompression ratio
EGRExhaust gas recirculation
FMEPIndicated mean effective pressure
HPHigh pressure
HRRHeat release rate
ITEIndicated thermal efficiency
IMEPIndicated mean effective pressure
ISFCIndicated specific fuel consumption
ISNOxIndicated specific nitrogen oxide emission
IVCIntake valve close
LPLow pressure
LHVLow heat value
OEMOriginal equipment manufacturer
PCPPeak cylinder pressure
Subscripts
aammoniaddiesel
ggrossnnet
ooverallinintake

References

  1. IEA. The Future of Trucks: Implications for Energy and the Environment. 2017. Available online: www.iea.org/workshops/the-future-role-of-trucks-for-energy-and-environment.html (accessed on 22 November 2022).
  2. Mulholland, E.; Teter, J.; Cazzola, P.; McDonald, Z.; Gallachóir, B.P.Ó. The long haul towards decarbonising road freight—A global assessment to 2050. Appl. Energy 2018, 216, 678–693. [Google Scholar] [CrossRef]
  3. IEA. Energy Technology Perspectives. 2020. Available online: https://www.iea.org/reports/energy-technology-perspectives-2020 (accessed on 12 October 2022).
  4. Joshi, A. Review of Vehicle Engine Efficiency and Emissions; SAE Technical Paper 2022-01-0540; SAE International: Warrendale, PA, USA, 2022. [Google Scholar]
  5. IEA. World Energy Outlook 2022; IEA: Paris, France, 2022; Available online: https://www.iea.org/reports/world-energy-outlook-2022 (accessed on 1 August 2023).
  6. Li, X.; Tan, X.; Wu, R.; Xu, H.; Zhong, Z.; Li, Y.; Zheng, C.; Wang, R.; Qiao, Y. Paths for Carbon Peak and Carbon Neutrality in Transport Sector in China. Engineering 2021, 23, 15–21. [Google Scholar] [CrossRef]
  7. IEA. Net Zero by 2050-A Roadmap for the Global Energy Sector. 2021. Available online: https://www.iea.org/reports/net-zero-by-2050 (accessed on 22 November 2022).
  8. Caton, J.A. Maximum efficiencies for internal combustion engines: Thermodynamic limitations. Int. J. Engine Res. 2017, 19, 1005–1023. [Google Scholar] [CrossRef]
  9. Stanton, D.W. Systematic Development of Highly Efficient and Clean Engines to Meet Future Commercial Vehicle Greenhouse Gas Regulations. SAE Int. J. Engines 2013, 6, 1395–1480. [Google Scholar] [CrossRef]
  10. Liu, H.; Ma, J.; Tong, L.; Ma, G.; Zheng, Z.; Yao, M. Investigation on the Potential of High Efficiency for Internal Combustion Engines. Energies 2018, 11, 513. [Google Scholar] [CrossRef]
  11. Enya, K.; Uchida, N. Enhancing Peak Firing Pressure Limit for Achieving Better Brake Thermal Efficiency of a Diesel Engine; SAE Technical Paper 2019-01-2180; SAE International: Warrendale, PA, USA, 2019. [Google Scholar]
  12. Benajes, J.; Molina, S.; García, J.M.; Novella, R. Influence of Boost Pressure and Injection Pressure on Combustion Process and Exhaust Emissions in a HD Diesel Engine; SAE Technical Paper 2004-01-1842; SAE International: Warrendale, PA, USA, 2003. [Google Scholar]
  13. Zhang, Z.; Liu, H.; Yue, Z.; Li, Y.; Liang, H.; Kong, X.; Zhen, Z.; Yao, M. Effects of intake high-pressure compressed air on thermal-work conversion in a stationary diesel engine. Int. J. Green Energy 2022, 173, 338–351. [Google Scholar] [CrossRef]
  14. Mohr, D.; Shipp, T.; Lu, X. The Thermodynamic Design, Analysis and Test of Cummins’ Supertruck 2 50% Brake Thermal Efficiency Engine System; SAE Technical Paper 2019-01-0247; SAE International: Warrendale, PA, USA, 2019. [Google Scholar]
  15. Galindo, J.; Serrano, J.; Climent, H.; Varnier, O. Impact of two-stage turbocharging architectures on pumping losses of automotive engines based on an analytical model. Energy Convers. Manag. 2010, 51, 1958–1969. [Google Scholar] [CrossRef]
  16. Caton, J.A. Combustion phasing for maximum efficiency for conventional and high efficiency engines. Energy Convers. Manag. 2014, 77, 564–576. [Google Scholar] [CrossRef]
  17. Department of Energy. Annual Merit Review Presentation. Available online: https://www.energy.gov/eere/vehicles/annual-merit-review-presentations (accessed on 22 November 2022).
  18. Kocher, L. Enabling Technologies for Heavy-Duty Vehicles–Cummins 55BTE. 2018. Available online: https://www.osti.gov/biblio/1474075/ (accessed on 8 March 2023).
  19. Rakopoulos, C.; Hountalas, D.; Koutroubousis, A.; Zannis, T. Application and Evaluation of a Detailed Friction Model on a DI Diesel Engine with Extremely High Peak Combustion Pressures; SAE Technical Paper 2002-01-0068; SAE International: Warrendale, PA, USA, 2002. [Google Scholar]
  20. Vojtech, R. Advanced Combustion for Improved Thermal Efficiency in an Advanced on-Road Heavy Duty Diesel Engine; SAE Technical Paper 2018-01-0237; SAE International: Warrendale, PA, USA, 2018. [Google Scholar]
  21. Heywood, J. Internal Combustion Engine Fundamentals 2E, 2nd ed.; McGraw-Hill Education: New York, NY, USA, 2019. [Google Scholar]
  22. Garcia, E.; Triantopoulos, V.; Boehman, A.; Taylor, M.; Li, J. Impact of Miller Cycle Strategies on Combustion Characteristics, Emissions and Efficiency in Heavy-Duty Diesel Engines; SAE Technical Paper 2020-01-1127; SAE International: Warrendale, PA, USA, 2020. [Google Scholar]
  23. Yu, X.; Wu, B.; Su, W. Experimental study on the approach for improved brake thermal efficiency on a two-stage turbocharged heavy-duty diesel engine. Fuel 2021, 305, 121523. [Google Scholar] [CrossRef]
  24. Kitabatake, R.; Minato, A.; Inukai, N.; Shimazaki, N. Simultaneous Improvement of Fuel Consumption and Exhaust Emissions on a Multi-Cylinder Camless Engine. SAE Int. J. Engines 2011, 4, 1225–1234. [Google Scholar] [CrossRef]
  25. Xing, K.; Huang, H.; Guo, X.; Wang, Y.; Tu, Z.; Li, J. Thermodynamic analysis of improving fuel consumption of natural gas engine by combining Miller cycle with high geometric compression ratio. Energy Convers. Manag. 2022, 254, 115219. [Google Scholar] [CrossRef]
  26. Zheng, M.; Reader, G.T.; Hawley, J.G. Diesel engine exhaust gas recirculation—A review on advanced and novel concepts. Energy Convers. Manag. 2004, 45, 883–900. [Google Scholar] [CrossRef]
  27. Mao, B.; Yao, M.; Zheng, Z.; Liu, H. Effects of Dual Loop EGR and Variable Geometry Turbocharger on Performance and Emissions of a Diesel Engine; SAE Technical Paper 2016-01-2340; SAE International: Warrendale, PA, USA, 2016. [Google Scholar]
  28. Zamboni, G.; Capobianco, M. Influence of high and low pressure EGR and VGT control on in-cylinder pressure diagrams and rate of heat release in an automotive turbocharged diesel engine. Appl. Therm. Eng. 2013, 51, 586–596. [Google Scholar] [CrossRef]
  29. Zamboni, G.; Capobianco, M. Experimental study on the effects of HP and LP EGR in an automotive turbocharged diesel engine. Appl. Energy 2012, 94, 117–128. [Google Scholar] [CrossRef]
  30. Xing, K.; Guan, W.; Guo, X.; Wang, Y.; Tu, Z.; Huang, H. Potential of high compression ratio combined with knock suppression strategy for improving thermal efficiency of spark ignition stoichiometric natural gas engine. Energy Convers. Manag. 2023, 276, 116544. [Google Scholar] [CrossRef]
  31. Chen, Y.; Zhu, Z.; Chen, Y.; Huang, H.; Zhu, Z.; Lv, D.; Pan, M.; Guo, X. Study of injection pressure couple with EGR on combustion performance and emissions of natural gas-diesel dual-fuel engine. Fuel 2020, 261, 116409. [Google Scholar] [CrossRef]
  32. Huang, H.; Li, Z.; Teng, W.; Huang, R.; Liu, Q.; Wang, Y. Effects of EGR rates on combustion and emission characteristics in a diesel engine with n-butanol/PODE3-4/diesel blends. Appl. Therm. Eng. 2019, 146, 212–222. [Google Scholar] [CrossRef]
  33. Macek, J.; Vitek, O. Determination and Representation of Turbocharger Thermodynamic Efficiencies; SAE Technical Paper 2016-01-1042; SAE International: Warrendale, PA, USA, 2016. [Google Scholar]
  34. Vijayagopal, R.; Rousseau, A.; Vallet, A. Fuel Consumption and Performance Benefits of Electrified Powertrains for Transit Buses; SAE Technical Paper 2018-01-0321; SAE International: Warrendale, PA, USA, 2018. [Google Scholar]
  35. Vos, K.R.; Shaver, G.M.; Lu, X.; Allen, C.M.; McCarthy, J.J.; Farrell, L. Improving diesel engine efficiency at high speeds and loads through improved breathing via delayed intake valve closure timing. Int. J. Engine Res. 2019, 20, 194–202. [Google Scholar] [CrossRef]
  36. Wissink, M.L.; Splitter, D.A.; Dempsey, A.B.; Curran, S.J.; Kaul, B.C.; Szybist, J.P. An assessment of thermodynamic merits for current and potential future engine operating strategies. Int. J. Engine Res. 2017, 18, 155–169. [Google Scholar] [CrossRef]
  37. Selleri, T.; Melas, A.D.; Joshi, A.; Manara, D.; Perujo, A.; Suarez-Bertoa, R. An Overview of Lean Exhaust deNOx Aftertreatment Technologies and NOx Emission Regulations in the European Union. Catalysts 2021, 11, 404. [Google Scholar] [CrossRef]
  38. Valera-Medina, A.; Amer-Hatem, F.; Azad, A.K.; Dedoussi, I.C.; de Joannon, M.; Fernandes, R.X.; Glarborg, P.; Hashemi, H.; He, X.; Mashruk, S.; et al. Review on Ammonia as a Potential Fuel: From Synthesis to Economics. Energy Fuels 2021, 35, 6964–7029. [Google Scholar] [CrossRef]
  39. Caton, J.A. On the importance of specific heats as regards efficiency increases for highly dilute IC engines. Energy Convers. Manag. 2014, 79, 146–160. [Google Scholar] [CrossRef]
  40. Yao, M.; Zhang, Q.; Liu, H.; Zheng, Z.-Q.; Zhang, P.; Lin, Z.; Lin, T.; Shen, J. Diesel Engine Combustion Control: Medium or Heavy EGR? SAE Technical Paper 2010-01-1125; SAE International: Warrendale, PA, USA, 2010. [Google Scholar]
  41. Keedwell, A.D.; Dénes, J. Latin Squares and Their Applications, 2nd ed.; Elsevier: Amsterdam, The Netherland, 2015. [Google Scholar]
  42. Rasmussen, C.E.; Williams, C.K. Gaussian Processes for Machine Learning; The MIT Press: Cambridge, MA, USA, 2005. [Google Scholar]
  43. Booker, L. Perspectives on Adaptation in Natural and Artificial Systems; Oxford University Press: Oxford, UK, 2005. [Google Scholar]
Figure 1. Schematic diagram of test bench.
Energies 16 06478 g001
Figure 2. Diagram of turbocharged diesel engine model.
Energies 16 06478 g002
Figure 3. Simulated and experimental cylinder pressure and AHRR at the baseline operating conditions.
Energies 16 06478 g003
Figure 4. NOx emission model validation results.
Energies 16 06478 g004
Figure 5. Experimental and simulated ITEg at different combustion phasings.
Energies 16 06478 g005
Figure 6. The effect of turbocharging overall efficiency on ITEn under a 20 MPa PCP limitation.
Energies 16 06478 g006
Figure 7. The effect of turbocharging overall efficiency on engine performance under a 20 MPa PCP limitation condition.
Energies 16 06478 g007
Figure 8. The effect of CR on ITEn without PCP limitations.
Energies 16 06478 g008
Figure 9. The effect of CR on ITEn with a PCP constraint of 20 MPa.
Energies 16 06478 g009
Figure 10. The effects of air dilution on engine performance at different CR under a 20 MPa PCP limitation (a) CR = 17.5, (b) CR = 19.5.
Energies 16 06478 g010
Figure 11. Co-optimization of CR and Pin for thermal efficiency improvement under 20 MPa PCP limitation.
Energies 16 06478 g011
Figure 12. The effects of EGR dilution with different boost pressures on engine performance under a 20 MPa PCP limitation.
Energies 16 06478 g012
Figure 13. Late IVC timing diagram.
Energies 16 06478 g013
Figure 14. The effect of late IVC timing on CA50, corresponding ITEn as well as PMEP under a 20 MPa PCP limitation.
Energies 16 06478 g014
Figure 15. The effect of late IVC timing on CR, corresponding ITEn as well as PMEP under a 20 MPa PCP limitation.
Energies 16 06478 g015
Figure 16. The mitigation effect of late IVC timing on Pin, corresponding ITEn as well as PMEP under a 20 MPa PCP limitation.
Energies 16 06478 g016
Figure 17. The effect of IVC timing on the air system under a 20 MPa PCP limitation.
Energies 16 06478 g017
Figure 18. Diagram of the hybrid optimization procedure.
Energies 16 06478 g018
Figure 19. Gaussian process regression model validation.
Energies 16 06478 g019
Figure 20. PMEP and air mass flow rate comparison of the 1TC and 2TC.
Energies 16 06478 g020
Table 1. High-efficiency engine specifications in the super-truck project [17].
OEMEngineCRPCPEngine Only BTE
CumminsISX1521.4≥23.8 MPa [18]50.6%
VolvoD112327 MPa50.4%
NavistarMaxxForce 13-≥24 MPa>51%
Table 2. Baseline engine specification.
Engine TypeInline 6-Cylinder Four Stroke
Displacement7.7 L
Bore110 mm
Stroke135 mm
Air systemWaste gate turbocharger
Piston materialAluminum
Compression ratio17.5
IVC timing−140.5 °CA ATDC
Injection systemCommon rail electronic system
EGR styleHigh pressure EGR
Table 3. Baseline operating condition.
ParametersValue
Speed1200 rpm
Load1.96 MPa BMEP
Injection Pressure100 MPa
Injection timing−9 °CA ATDC
HP EGR ratio0%
PCP20 MPa
Table 4. Specification and measuring accuracy of experimental apparatus.
Measured ParametersApparatusRangeAccuracy
SpeedSiemens CJ 4100–3000 r/min≤±1 r/min
TorqueSiemens CJ 4100–2000 Nm≤±0.1%FS
Fuel consumptionAVL 7330–125 kg/h±0.1%
Cylinder pressureKistler 6125B0–25 MPa≤±0.3%FSO
Air flow rateEndress + Hauser 65F0–2000 kg/h±0.15%FS
Boost pressureJIMO pressure sensor0–1 MPa±0.1%FS
TemperaturePT100−50–200 °C±0.5 °C
NOxHoriba Mexa-one0–5000 ppm±1.0%FS
CO2 (intake)Horiba Mexa-one0–5%±1.0%FS
CO2 (exhaust)Horiba Mexa-one0–20%±1.0%FS
Table 5. Sub-model selection.
Physical ProcessTemplate
CombustionUser-imposed combustion profile
TurbochargerCompressorSimple and TurbineSimple
NOx formationEngCylNOx
Heat transferHohenberg model
Table 6. Model validation results of the baseline operating conditions.
IndicatorsExperimentSimulationRelative Error
Boost pressure275 kPa275 kPa0%
Air mass flow rate733 kg/h739 kg/h0.82%
PCP20.2 MPa20 MPa−0.99%
ITEg48.40%48.41%0.02%
ITEn47.64%47.59%−0.1%
PMEP−0.033 MPa−0.034 MPa3.03%
EGR ratio0%0%0%
NOx2108 ppm2158 ppm1.89%
Table 7. Parameters variation range.
ParametersRange
CR16~24
Pin0.2~0.35 MPa
IVC timing−150~−80 °CA ATDC
CA50−12~0 °CA ATDC
Table 8. The optimized parameters and corresponding results at different PCP limits.
PCP
(MPa)
CRIVC Timing
(°CA ATDC)
Boost Pressure
(kPa)
CA50
(°CA ATDC)
ITEn (%)EGR (%)NOx (ppm)
20 (baseline)17.5−140.52757.847.6402158
2018.57−95.22988.949.201.82161
2219.80−90.23078.249.612.02328
2521.92−88.73087.650.062.322629
Table 9. Engine specification comparison.
ConfigurationOriginOptimizedTested
Air system1TC1TC2TC with intercooler
IVC timing−140.5 °CA ATDC−88.7 °CA ATDC−92 °CA ATDC
Geometry CR17.521.9221.5
Effective CR16.14-13.24
PCP limitation20 MPa25 MPa25 MPa
HP EGR valveCloseFull openFull open
Table 10. Summary of the engine performance.
IndicatorsBaseline Engine
(Experiment)
Optimized Engine
(25 MPa PCP)
Tested Engine
(25 MPa PCP)
Boost pressure275 kPa308 kPa305 kPa
Air mass flow rate733 kg/h762 kg/h796 kg/h
PCP20.2 MPa24.9 MPa24.9 MPa
Combustion efficiency99.91%100%99.94%
CA507.8 °CA ATDC7.6 °CA ATDC7.2 °CA ATDC
EGR0%2.32%0.4%
PMEP−0.033 MPa0.006 MPa−0.003 MPa
ITEg48.40%49.9%50.29%
ITEn47.64%50.06%50.21%
Mechanical efficiency93.95%93.95%93.53%
NOx emission2108 ppm2629 ppm2495 ppm
BTE44.76%47.03%46.96%
Disclaimer/Publisher’s Note: The statements, opinions and data contained in all publications are solely those of the individual author(s) and contributor(s) and not of MDPI and/or the editor(s). MDPI and/or the editor(s) disclaim responsibility for any injury to people or property resulting from any ideas, methods, instructions or products referred to in the content.

