Article

The Effect of Carbon Nanofibers on the Hydrocracking of Vacuum Residue in the Presence of Formic Acid

by
Vladimir V. Chesnokov
* and
Pavel P. Dik
Boreskov Institute of Catalysis, Siberian Branch, Russian Academy of Sciences, 630090 Novosibirsk, Russia
*
Author to whom correspondence should be addressed.
Energies 2023, 16(18), 6477; https://doi.org/10.3390/en16186477
Submission received: 7 August 2023 / Revised: 28 August 2023 / Accepted: 3 September 2023 / Published: 7 September 2023

Abstract

:
This study was devoted to the processing of vacuum residue to produce lighter oil fractions, such as gasoline and diesel fuel. The hydrocracking and catalytic hydrocracking of vacuum residue in the presence of formic acid (FA) were performed in the temperature range of 250–550 °C. Carbon nanofibers (CNFs) were used as catalytic additives. In contrast to conventional hydrocracking, an important stage in the catalytic hydrocracking of vacuum residue is the decomposition of formic acid. Experimental studies on the effect of CNFs on the decomposition of FA demonstrated that CNFs pre-treated in a NaOH solution (CNF (NaOH)s) had the highest activity and selectivity for the production of H2 and CO2. The maximum yield of liquid products in the catalytic hydrocracking process, equal to 34 wt.%, was observed at 300 °C in the presence of CNF (NaOH)s. The characterization of the fractional compositions of the liquid products showed that the ratios of the fractions changed with an increase in the reaction temperature. The maximum concentrations of the light fractions (gasoline and diesel) in the liquid products of the catalytic hydrocracking of vacuum residue were observed at 300–350 °C in the presence of CNF (NaOH)s.

1. Introduction

The use of heavy oils and oil residues requires the development of new physical and catalytic technologies for the efficient deep processing of heavy hydrocarbon fuel. The traditional processing of heavy oil residue into fuel oil rapidly loses its cruciality due to the ubiquitous gasification of energy installations. The utilization of non-traditional heavy oil products, such as vacuum residue and heavy catalytic gasoils, is vitally needed [1,2,3,4].
According to reports published by Exxon Mobil [5], the fractions of diesel fuel and gasoline will continue to increase among all types of transport fuel until 2040. This means that light oil products, such as diesel fuel and gasoline, will play important roles in the power industry as well.
However, the production of light oil fractions from vacuum residue is complicated, first due to its low hydrogen content. The atomic hydrogen/carbon ratio in vacuum residue is about 1:1, which is insufficient for a complete transformation into naphthenic or paraffinic hydrocarbons. There are two technologies available for processing vacuum residue. One is non-catalytic “carbon rejection” via thermal cracking or delayed coking. In these processes, coke is the main product (35% of the total volume of the products), and the yield of light products is low [6].
Alternative technologies include various hydrocracking processes. In the past two decades, the capacity of hydrocracking facilities increased by a factor of four worldwide. The main advantage of hydrocracking is the possibility of processing both distillate and residue feedstocks to produce high-quality products (liquefied gases, high-octane gasoline, and diesel). Most hydrocracking processes are used for treating heavy atmospheric or vacuum gasoils and gasoils produced via cracking and coking.
Molecular hydrogen for hydrocracking processes can be obtained from different sources, using various technologies [7]. However, hydrogen is a flammable and explosive gas that is difficult to store and transport. The active search for alternative hydrogen donors is challenging at present. Different hydrogen–donor compounds have been suggested as alternatives for the hydrogenation of oil vacuum residue. They significantly affect the performance of hydrocracking reactions and suppress the formation of coke on the catalyst’s surface [8,9,10,11].
One compound used as a hydrogen donor during the aquathermolysis of heavy oil is tetrahydronaphthalene [12,13]. Crude oil was mixed with water and tetrahydronaphthalene. Natural minerals were used as catalysts. The experiment was performed at 280–315 °C for 24 h. As a result, the viscosity of the heavy oil could be decreased by 50%, and the fraction of asphaltenes could be decreased.
A series of experiments on upgrading vacuum residue were performed in supercritical water in the presence of formic acid (FA) and hematite iron oxide nanoparticles [14]. Formic acid was used as the hydrogen donor, and the iron oxide nanoparticles were used as the catalyst. The key reaction parameters, including the temperature, amounts of water and FA, catalyst concentration and reaction time were optimized. It was found that the addition of hematite nanoparticles to supercritical water and FA led to higher yields of light reaction products and a lower coke yield.
It was demonstrated that FA could substitute for hydrogen during the hydrocracking of vacuum residue [15]. Formic acid, which has the chemical formula HCOOH and a molar weight of 46.03 g/mol, is a weak organic acid leading the class of saturated monoatomic carbonic acids.
Comparative experiments on the effects of pure hydrogen and FA on the hydrocracking of vacuum residue demonstrated that this process is more effective in the presence of FA [16]. With both catalysts under study, Ni-Mo/Y-Al2O3 and Ni-Mo/Al2O3, a higher conversion of vacuum residue into liquid products was observed in the presence of formic acid than in the presence of hydrogen. In the presence of the Ar-HCOOH mixture, there was substantially less catalyst coking than in the presence of the argon–hydrogen mixture.
There is a wide interest in nonmetal catalysis. Carbocatalysis is a green variant of catalytic transformation in both gas and liquid phases. There have been numerous studies in which carbon was successfully used as an alternative to metal oxide catalysts in gas-phase dehydrogenation and selective oxidation [17,18,19,20,21]. The use of carbocatalysis for liquid-phase reactions, in particular for organic syntheses, is a new research discipline that is progressing rapidly. The use of various nanomaterials in different catalytic reactions was reported recently [17,18]. Carbocatalysts are capable of operating in reactions such as oxidation or hydrogenation [19,20,21], although they do not contain transition or noble metals which that are believed to be essential for such reactions. The catalytic activity of these materials appears to be due to their ability to stabilize free radicals [22], as well as their ability to form acid–base sites [23] on the carbon surface.
The surfaces of carbon materials are usually not energetically homogeneous. Thus, the external surfaces of single graphite crystals must inevitably be composed of energetically unequal areas: the [0001] basal plane with the most closely packed atoms, and the more loosely packed prismatic planes.
In adsorption studies [24], it was shown that the basal plane had a low level of chemical activity and exhibited nonspecific adsorption. Meanwhile, the prismatic planes were unsaturated due to the breakage of bonds at the ends of the basal planes, and they demonstrated high levels of chemical activity and specific adsorption. On the basal plane, π-electrons are delocalized, whereas they are localized on prismatic planes.
According to data obtained from theoretical estimates and an analysis of experimental results based on the study of a clean surface freshly formed via a split in a high vacuum at 20 °C, the value of the Gibbs free surface energy σ is 0.135 J/m2 for the basal plane and 4.8 J/m2 on average for prismatic planes, i.e., they differ by a factor of 35 [25]. These data are a consequence of the anisotropy of graphite. Therefore, carbon nanofibers (CNFs) with prismatic faces extending onto the carbon surface were chosen for this research.
In this manuscript, the effect of carbon nanofibers on the decomposition of FA and the hydrocracking of vacuum residue in the presence of formic acid was investigated.

2. Materials and Methods

2.1. Materials and Reagents Used

The following gases were used in this study: argon (99.998%), hydrogen (99.99%) and helium (99.995%). Formic acid (“Pure for analysis” grade, GOST 5848-73) was used as the hydrogen source.
Beta zeolite (SiO2/Al2O3 = 27), produced by AZKiOS, Russia, and CNFs were used for the decomposition of FA. The characteristics of the Beta zeolite are provided in Table 1.
CNFs were synthesized via the decomposition of a propane–butane mixture over a Ni–Cu–Fe/Al2O3 catalyst at 700 °C [26]. A transmission electron microscopy (TEM) image of a CNF used in this study shows basal plains arranged perpendicularly to the fiber axis (Figure 1).
The characteristics of the synthesized CNFs are provided in Table 2.
It was reported [27,28] that the impregnation of several catalysts with potassium carbonate led to increases in both activity and selectivity in the gas-phase decomposition of formic acid. The turnover frequencies (TOF) at 70 °C were 8–33 times higher over doped catalysts than over non-doped catalysts. So, CNFs doped with an aqueous solution of KOH or NaOH were used in this study.

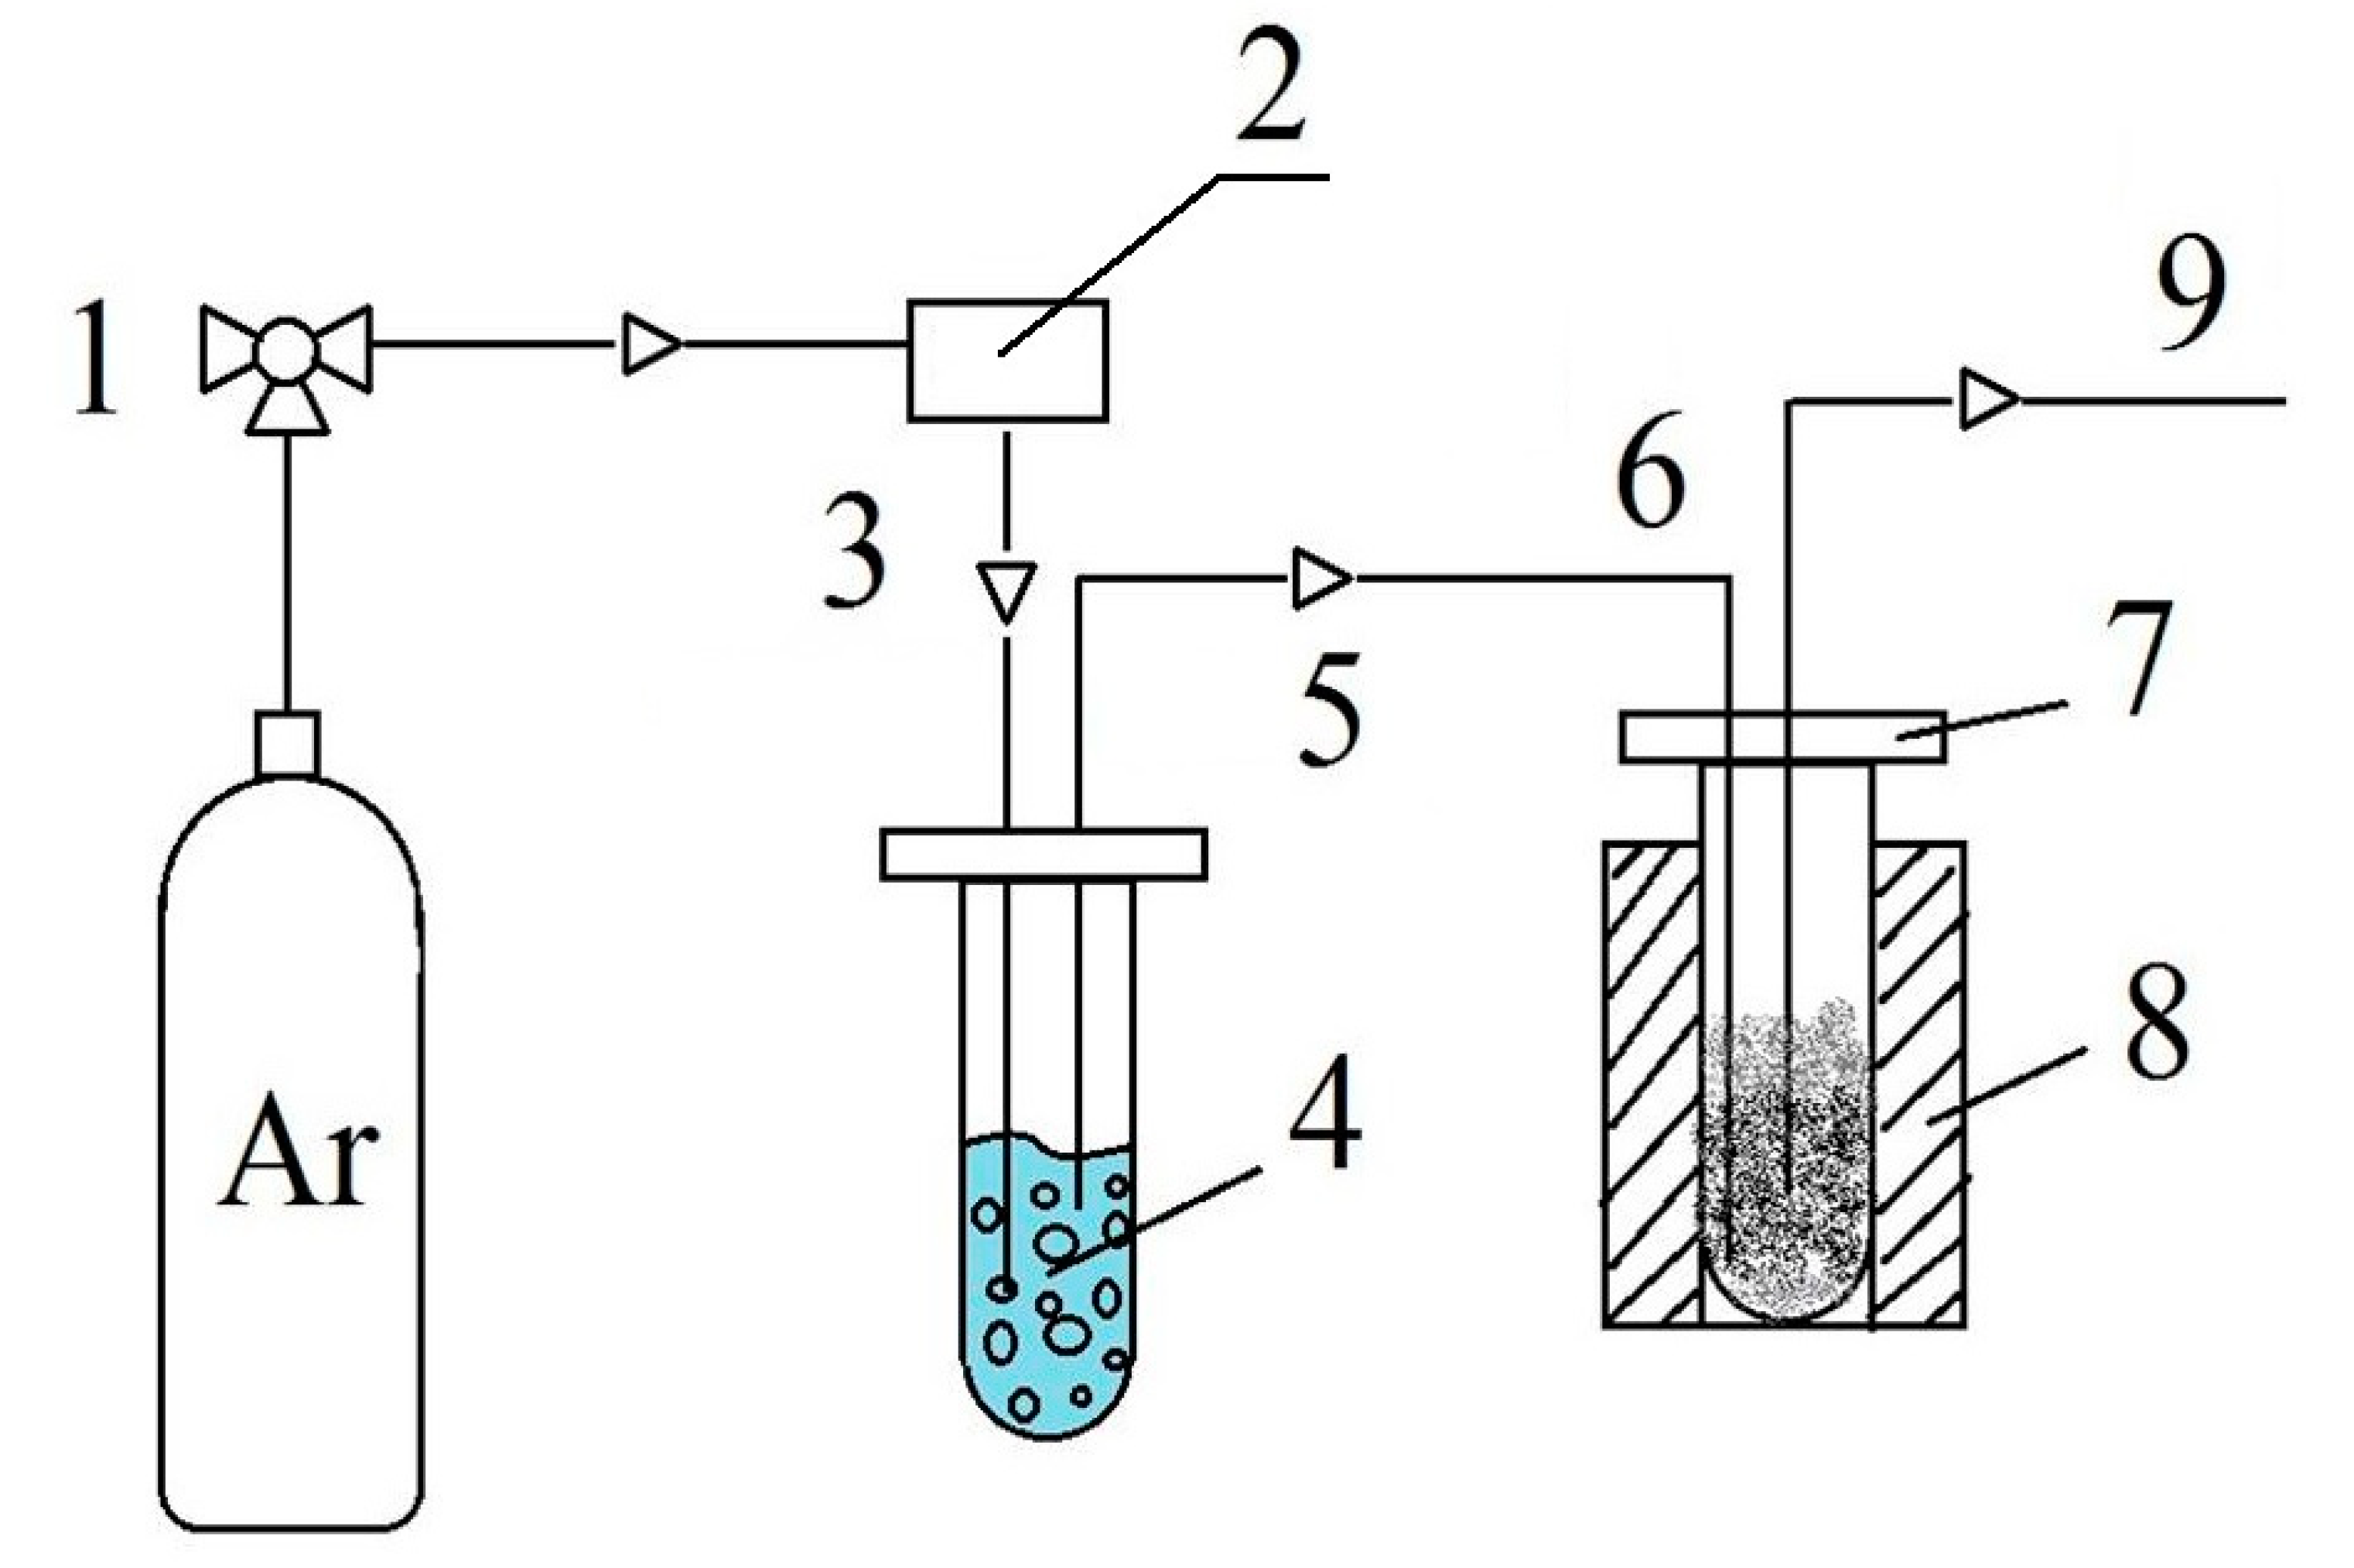
2.2. FA Decomposition Reaction

A laboratory setup (Figure 2) was used for studying the decomposition of FA. Its main components were a reactor mounted in a furnace, a chromatograph for the analysis of the gas mixture at the reactor outlet, a bubbler and a gas flow regulator.
The reactor was heated to the desired temperature in the furnace. Argon was used as a carrier gas and was fed into the bubbler. The gas passing through the bubbler was saturated with FA and was fed to the reactor. Chromatography was used for analyzing the gaseous products collected at the reactor outlet.
The decomposition of formic acid (FA) was experimentally studied using a flow installation with a quartz reactor (with an inner diameter of 10 mm). A total of 100 mg of the catalyst was mixed uniformly with 0.5 cm3 of quartz, and 2 vol.% FA in argon was fed at a flow rate of 5 L/h. The reaction progress was followed by monitoring the release of CO and CO2.
The decomposition of FA in the gas phase can follow two pathways: dehydrogenation to form H2 and CO2 or dehydration to form CO and H2O. The preferable pathway depends on the catalyst used.
The FA conversion (X) was determined as the ratio of the sum of the concentrations of CO and concentrations to the initial concentration of FA (2%).
X = C C O + C C O 2 C F A
The CO2 (H2) selectivity was determined as the ratio of the CO2 concentration to the sum of the CO and CO2 concentrations.
S = C C O 2 C C O + C C O 2
The vacuum residue used in this study was obtained from the Omsk refinery, Russia. Its elemental composition is presented in Figure 3.
The fractional composition of the vacuum residue is shown in Figure 4.
The vacuum residue under study contained a negligible proportion of light fractions (<1 wt.%) but contained more than 90 wt.% of heavy fractions with a boiling point above 500 °C (Figure 4).

2.3. Experimental Setup for the Hydrocracking Process

A reactor operating at 1 MPa and 250–500 °C (Figure 5) was used for studying the thermal cracking and hydrocracking of the vacuum residue. The vacuum residue (15 g) or a mixture of vacuum residue with FA (5 g) was loaded into the reactor, heated to the desired temperature and maintained at this temperature for 2 h. The effect of the carbon nanomaterials on this process was studied similarly by adding CNFs (1 g) to the mixture of vacuum residue and FA.

2.4. Analysis of Vacuum Residue and the Products Formed from It

The sulfur concentrations and the H/C ratios in the initial vacuum residue and the products of its transformation were determined using a VARIO EL CUBE (Elementar Analysen systeme) CHNS-O analyzer (Elementar Analysensysteme GmbH, Langenselbold, Germany). The sulfur contents in the feedstock and liquid reaction products were determined in accordance with the standard ASTM D4294 [30]. The fractional compositions of the vacuum residue and the products formed from it were determined via simulated distillation, using an Agilent 7890B gas chromatograph chromatograph (Santa Clara, CA, USA) according to the ASTM D7169 standard [29].

2.5. Chromatographic Analysis of Gaseous Reaction Products

The compositions of the gaseous products of the decomposition of FA were determined via a chromatographic analysis using a Hromos-GH-100 chromatograph. The gas sample was introduced into the chromatograph. Then, the gas was split into two parts.
(1)
The first part was introduced into a flame ionization detector via an St®-PLOT/Si capillary column (25 m × 0.32 mm × 3 μm) with a SiO2 stationary phase. Ar was used as the carrier gas.
(2)
The second part of the sample was introduced into a thermal conductivity detector via a column filled with P1387 coal. Ar was used as the carrier gas.
Both columns were produced by Sibirskaya Technologia, Russia.

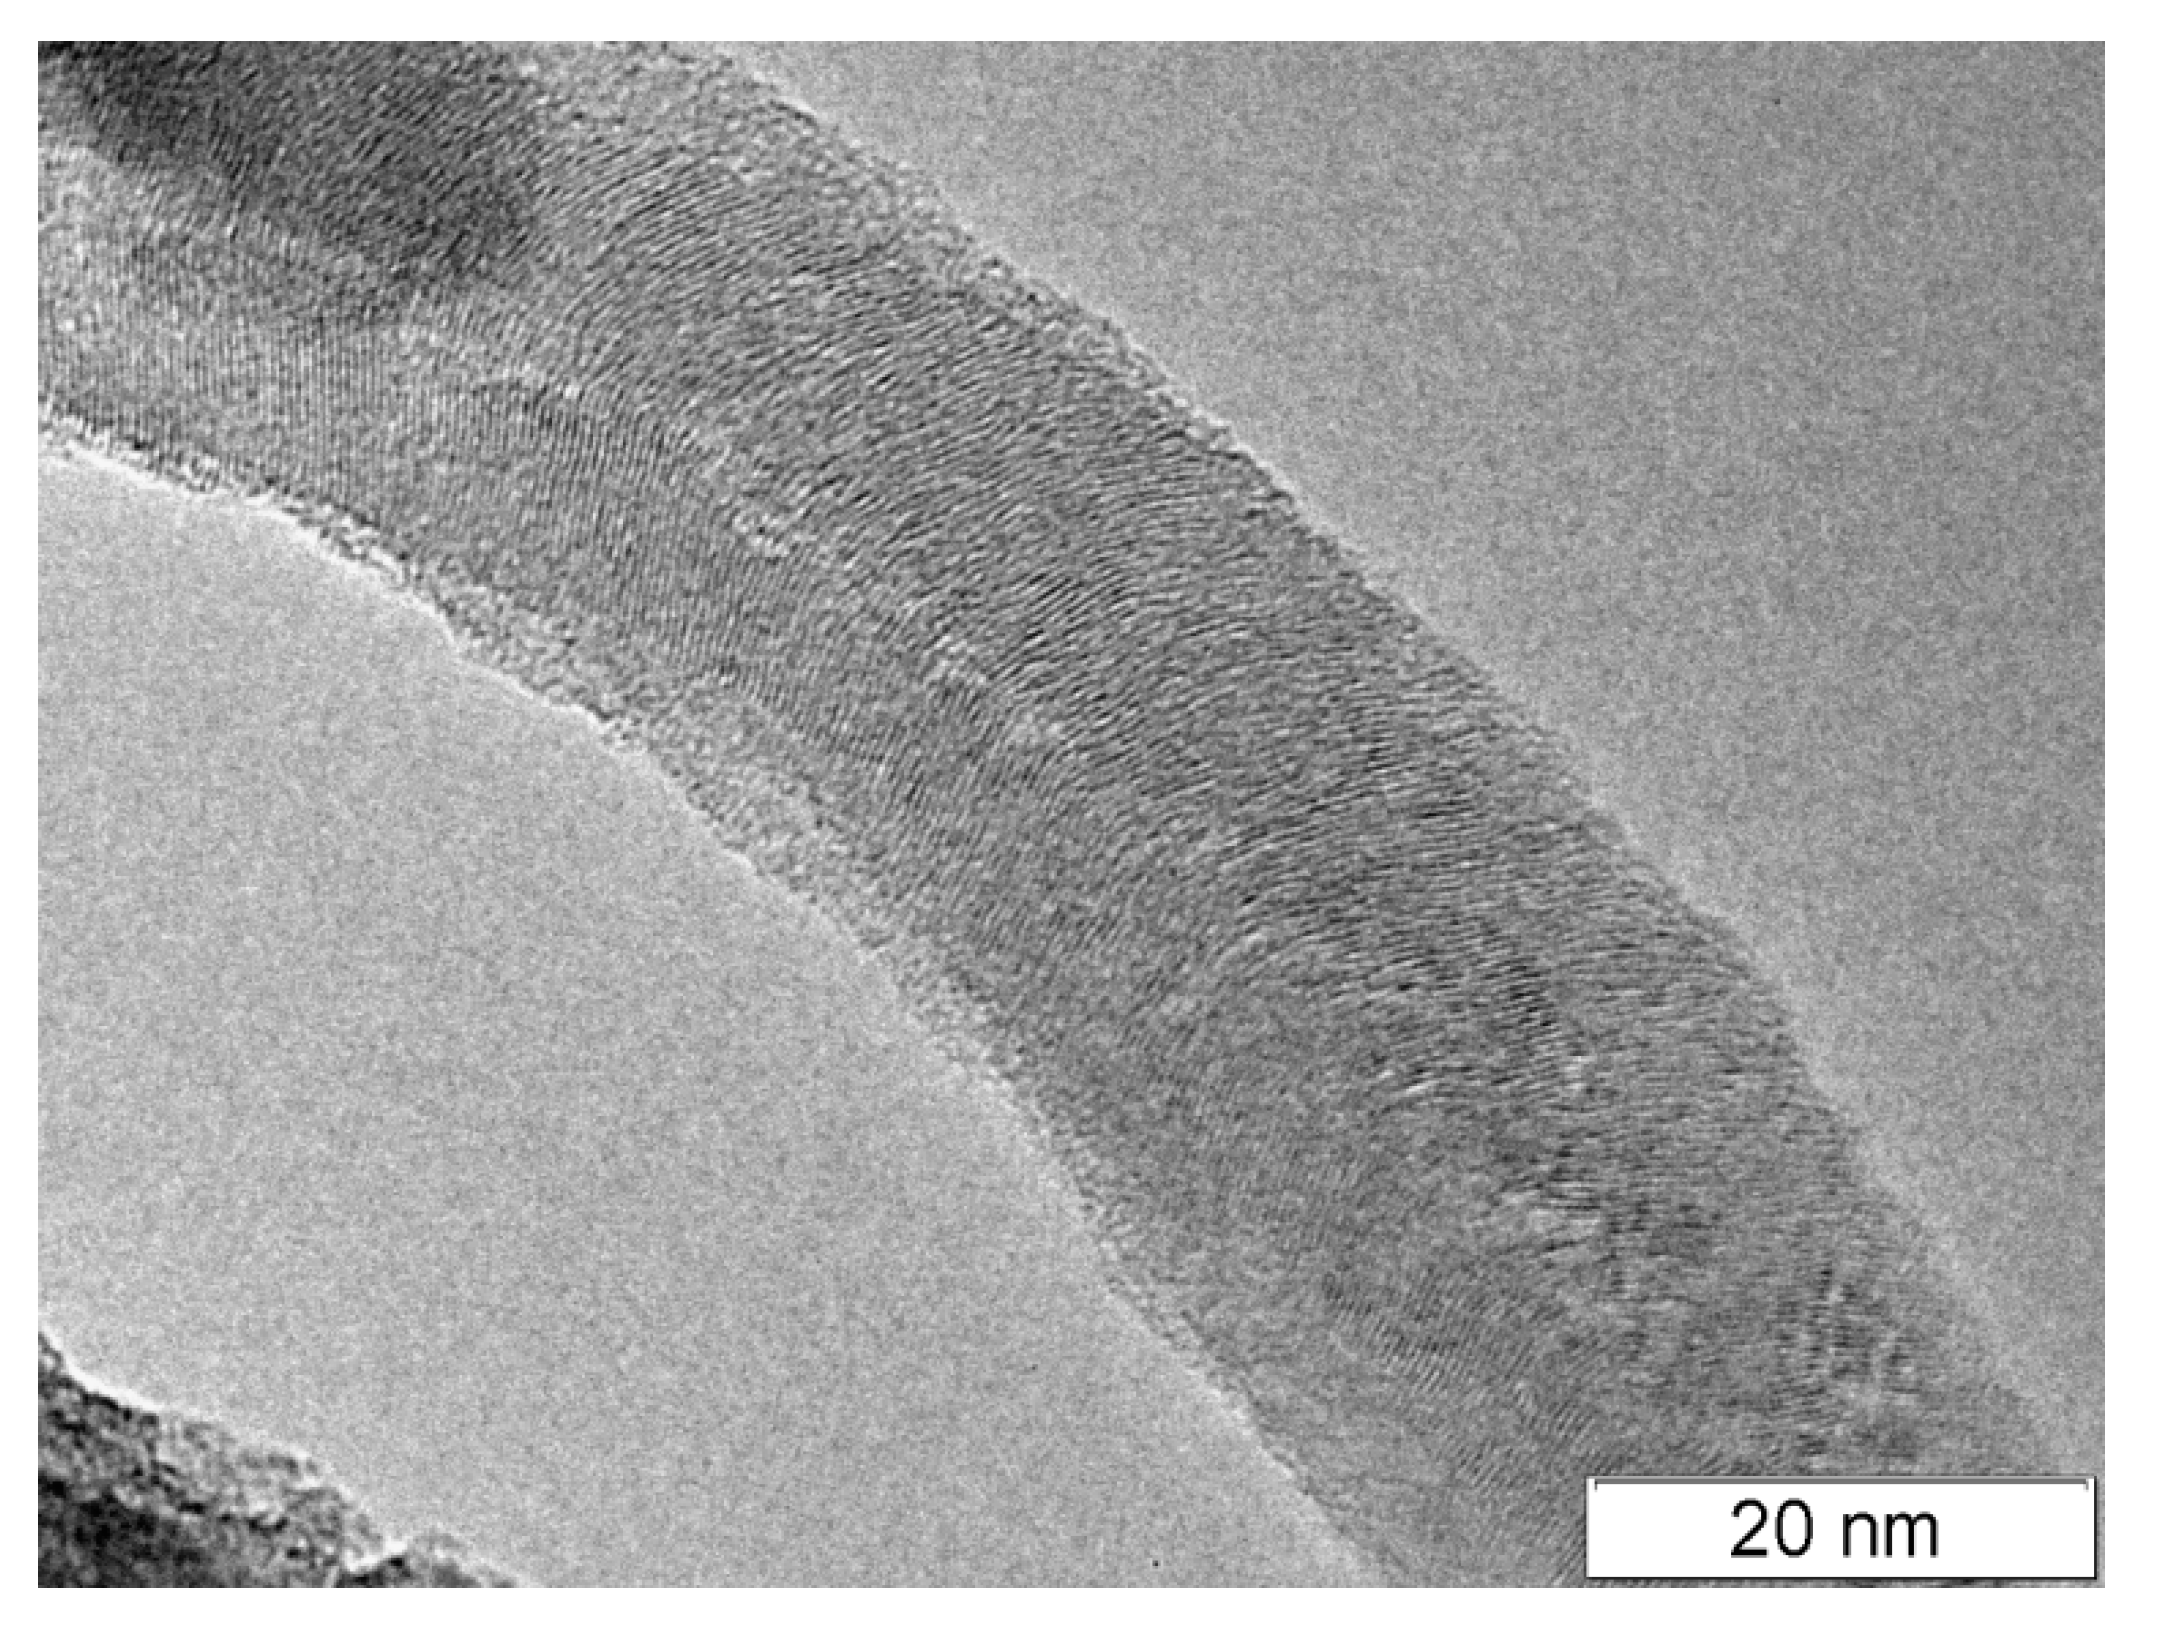
2.6. Electron Microscopy

High-resolution transmission electron microscopy (HRTEM) was conducted with a unique electron microscope, the ThemisZ (Thermo Fisher Scientific, Waltham, MA, USA), with an acceleration voltage of 200 kV and a maximum lattice resolution of 0.07 nm for the investigation of the structure and microstructure of the samples. The images were acquired using a Ceta 16 matrix (Thermo Fisher Scientific, USA).

3. Results and Discussion

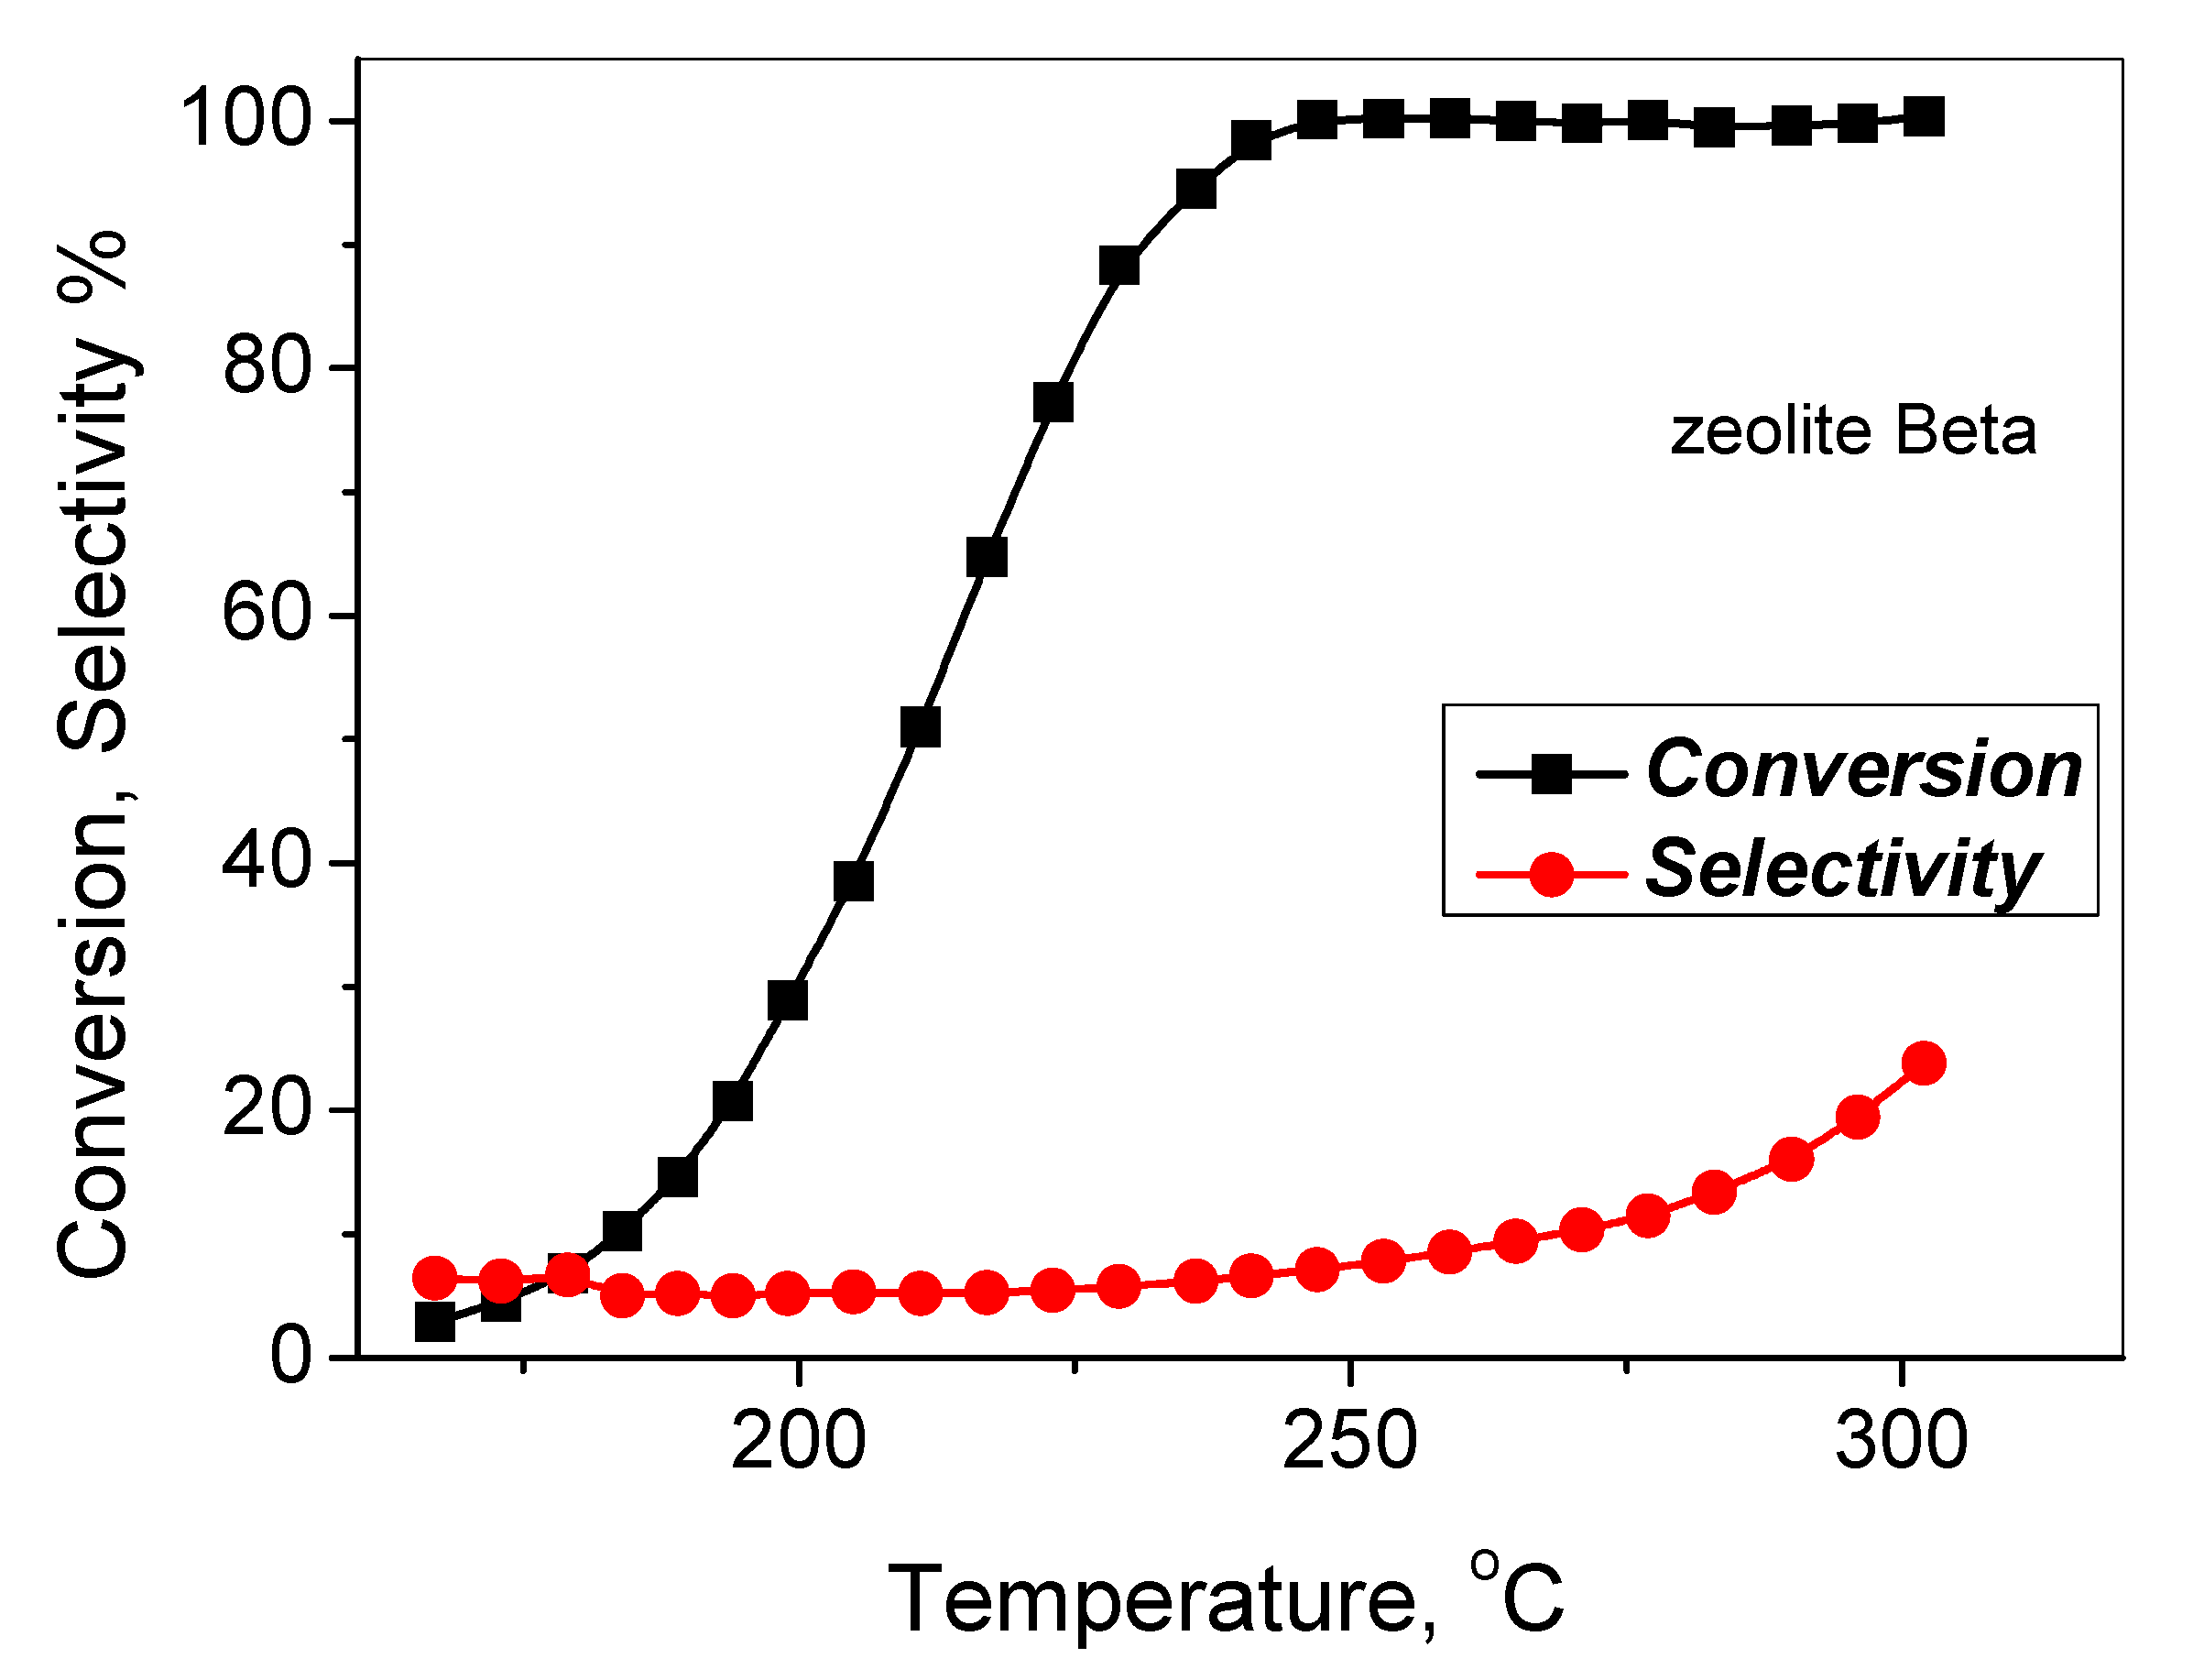
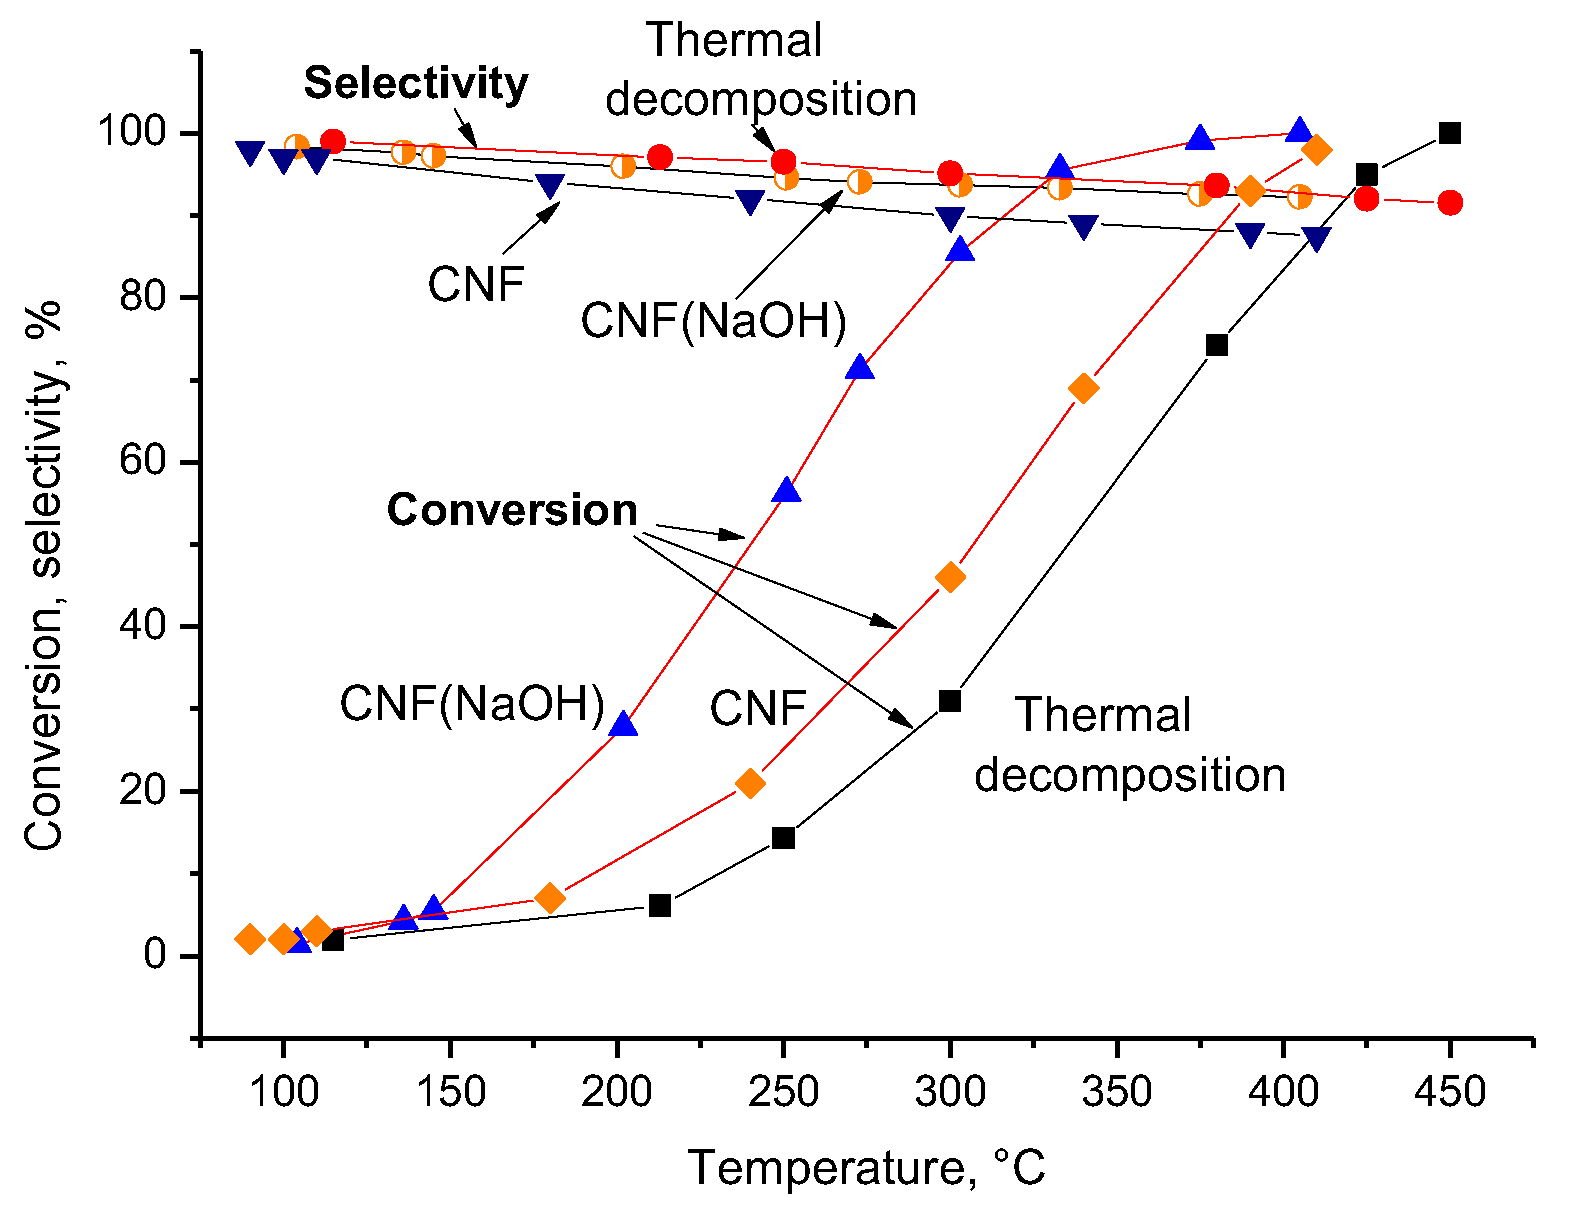
3.1. Formic Acid Decomposition

In contrast to hydrocracking in the presence of hydrogen, an important stage of hydrocracking in the presence of FA is the production of hydrogen from the FA. Therefore, the catalytic decomposition of FA was studied over Beta zeolite and a number of carbon nanomaterials.
The results of the decomposition of FA over Beta zeolite are presented in Figure 6. The experiments on the decomposition of FA over Beta zeolite demonstrated that this zeolite is highly active but has a low level of selectivity to CO2 and H2. The complete decomposition of FA into CO and H2O was observed at temperatures as low as 240 °C. This means that the decomposition of FA over Beta zeolite follows the dehydration pathway.
So, despite the fact that Beta zeolite is a good catalyst for cracking hydrocarbons, it can hardly be used for the hydrocracking of vacuum residue in the presence of FA. It directs the decomposition of FA to the formation of water and carbon monoxide rather than hydrogen and CO2. The situation was changed when carbon nanofibers were used as a catalyst. The results of the experiments on the decomposition of FA over CNFs are shown in Figure 7.
The data regarding selectivity and activity in the thermal decomposition of FA are shown in Figure 7 for comparison. The curve of FA conversion is shifted to lower temperatures over the CNFs in comparison with the FA curve of the thermal reaction. The formic acid decomposed completely into carbon dioxide and hydrogen over CNFs at 410 °C. The dehydrogenation of FA yielding H2 and CO2 predominated at all temperatures. Over the CNFs, hydrogen selectivity decreased from 99% to 88% with an increasing temperature. If the CNFs were treated in NaOH, the catalytic activity in the dehydrogenation of FA significantly increased. The complete decomposition of FA into H2 and CO2 over CNF (NaOH)s occurred at 370 °C. The selectivity to hydrogen and CO2 was higher over CNF (NaOH)s compared to CNFs, ranging from 99% to 93% depending on the conversion.
The data on the selectivity and activity over CNF (NaOH)s and CNF (KOH)s in the decomposition of FA are shown in Figure 8.
One can see that the CNF (KOH)s were much more active than the CNF (NaOH)s to the decomposition of FA. However, the selectivity to hydrogen and CO2 was lower over the CNF (KOH)s than over the CNF (NaOH)s. For this reason, the following experiments were carried out using CNF (NaOH)s as the catalyst.

3.2. Thermal Cracking of Vacuum Residue

The thermal cracking of the vacuum residue was studied at temperatures ranging from 300 °C to 600 °C over 2 h. Data on the yields of gaseous, liquid and solid products in this process are reported in Table 3.
It was found that the thermal cracking of the vacuum residue did not occur at 250 °C. At 300 °C, the conversion of the vacuum residue was very low (Table 3), and the viscous product remaining in the autoclave after the reaction was very similar to the initial vacuum residue. The mass of the remaining vacuum residue and coke decreased substantially when the reaction temperature was increased from 300 to 400 °C. A genuine solid product was formed at above 400 °C. The weight of the formed coke decreased gradually with increasing temperature due to the further cracking of the high-molecular-weight hydrocarbons contained in the coke. The yield of liquid products passed through a maximum (Figure 9, curve 1), with the highest yield of liquid products of about 23 wt.% being observed at 400 °C.
The obtained results can be explained as follows. Vacuum residue consists of large molecules. The chemical structures for some of the large molecules are presented in Figure 10.
Asphaltenes are high-molecular-weight constituents of vacuum residue that are characterized by the presence of heteroatoms and aromatic fragments [31,32] (Figure 10). During thermal cracking, the side chains connected to the cores of polycondensed aromatic structures are cleaved. The conversion of the vacuum residue increases as the reaction temperature grows from 300 to 400 °C. At above 400 °C, the concentration of liquid products decreases due to an increase in the concentration of gaseous products. This result is accounted for by the further cracking of the liquid products into C1–C4 hydrocarbons.
The fractional composition of the liquid products of thermal cracking at 350 °C and 550 °C were analyzed. The results are presented in Figure 11. An elevation of the cracking temperature results in decreases in the concentrations of gasoline and diesel fractions in the liquid products, whereas the concentration of vacuum gasoil increases (Figure 11).

3.3. Hydrocracking of Vacuum Residue in the Presence of FA

The hydrocracking of vacuum residue was performed in a pressurized reactor in the temperature range from 250 °C to 550 °C in the presence of FA. The yields of gaseous, liquid and solid products are reported in Table 4.
The data presented in Table 4 and Figure 9, curve 2, demonstrate an insignificant conversion of vacuum residue at 250 °C. However, increasing the temperature to 300 °C results in a sharp increase in the conversion of the vacuum residue to yield up to 28% liquid products. As is shown in Figure 7, the thermal decomposition of FA into hydrogen and CO2 begins in this temperature range (250–300 °C).
When the reaction temperature increases from 300 to 550 °C, the yield of the liquid products of the hydrocracking of vacuum residue in the presence of FA decreases from 28 wt.% to 11 wt.%. The fractional composition of the liquid products of the hydrocracking of vacuum residue in the presence of FA in the temperature range of 350–500 °C is shown in Figure 12.
The diagram demonstrates that the elevation of the hydrocracking temperature results in a redistribution of the fractional composition of the liquid products. The concentrations of the gasoline and diesel fractions decrease. The total concentration of the gasoline and diesel fractions was 80.1 wt.% at 350 °C but decreased to 70.8 wt.% at 400 °C. Meanwhile, the total concentration of the gasoline and diesel fractions was no more than 49.9 wt.% at 550 °C.

3.4. Effect of CNFs Treated with NaOH on the Hydrocracking of Vacuum Residue in the Presence of FA

The hydrocracking of vacuum residue in the presence of FA was carried out in a pressurized reactor in the temperature range of 250–500 °C. To determine the effect of CNF (NaOH)s on the hydrocracking process, 1 g of this carbon nanomaterial was loaded into the reactor together with the vacuum residue and FA. The yields of the gaseous, liquid and solid products of this reaction are reported in Table 5.
The amount of coke was determined as the carbonated residue formed after the calcination of the remaining vacuum residue and coke in flowing argon at a temperature of 750 °C for 30 min.
The data presented in Table 5 indicate that the conversion of the vacuum residue increases with an increase in the hydrocracking temperature in the presence of FA and CNF (NaOH)s. The amounts of liquid hydrocarbons are higher in the presence of FA and CNF (NaOH)s than in the presence of FA alone (Figure 9, curves 2 and 3). The %15 yield of liquid products is observed even at temperature as low as 250 °C due to the high activity of the CNF (NaOH)s to the decomposition of FA. There is a maximum in the temperature dependence of the liquid hydrocarbon yield. The highest yield of the liquid products, equal to 34 wt.%, was observed at 300 °C.
The cracking of the liquid products took place at temperatures above 400 °C. In the reaction in the presence of FA and CNF (NaOH)s, the cracking rate of the liquid products was higher than of that of the thermal process. In the temperature range of 400–600 °C, curve 3 in Figure 9 shifted to lower temperatures relative to curve 1. This means that the CNF (NaOH)s catalyze the cracking of liquid products to form C1–C4 hydrocarbons.
The fractional composition of the liquid products is shown in Figure 13. The maximum concentration of the light fractions (gasoline and diesel) in the liquid products of the catalytic hydrocracking of vacuum residue, equal to 84.3 wt.%, was observed at 350 °C. When the temperature of the hydrocracking of vacuum residue in the presence of FA and CNF (NaOH) was increased above 350 °C, the total yield of gasoline and diesel decreased, but the yield of vacuum gasoil increased. Therefore, liquid hydrocracking products experience further transformations at 350–450 °C. Some of hydrocarbons forming the gasoline and diesel fractions undergo cracking to form C1–C4 hydrocarbons. Meanwhile, the other portion of them are subjected to cyclization, aromatization and condensation reactions to yield vacuum gasoil.
Changes in the sulfur contents in the liquid reaction products in the system (vacuum residue + FA + CNF (NaOH)s) also were studied. The results are presented in Table 5. The lowest sulfur concentration in the liquid products was observed at 350 °C.
Again, we studied how the addition of formic acid and CNF (NaOH)s to the vacuum residue affected the concentration of sulfur in the liquid products (Table 6).
One can see that the sulfur concentration in the liquid products changed slightly from 1.0% to 0.98% when formic acid was added to the vacuum residue. The use of FA + CNF (NaOH)s led to a significant decrease in the sulfur concentration to 0.82%.

4. Conclusions

Experimental studies of the decomposition of FA over carbon nanofibers revealed that formic acid is a promising source of hydrogen for the hydrocracking of vacuum residue. It was found that the carbon nanofibers were capable of catalyzing FA with the predominant formation of hydrogen and carbon dioxide. The activity in the decomposition of FA increased in the following series: thermal decomposition < catalytic decomposition over CNFs < catalytic decomposition over CNFs treated with NaOH. Both the activity and selectivity to the decomposition of FA into hydrogen and CO2 were higher over CNF (NaOH)s than over CNFs.
The thermal cracking, hydrocracking and catalytic hydrocracking of vacuum residue were studied in the temperature range from 250 to 500 °C. The maximum concentration of the liquid products of the catalytic hydrocracking of vacuum residue in the presence of FA and CNF (NaOH)s, equal to 34 wt.%, was achieved at 300 °C. The maximum concentration of the light fractions (gasoline and diesel), equal to 84.3 wt.%, was observed in the case of carrying out catalytic hydrocracking at 350 °C.

Author Contributions

V.V.C.: conceptualization, methodology, data analysis and writing; P.P.D.: investigation and synthesis. All authors have read and agreed to the published version of the manuscript.

Funding

This study was supported by the Russian Science Foundation, project no. 17–73–30032.

Data Availability Statement

Not applicable.

Conflicts of Interest

The authors declare that they have no known competing financial interests or personal relationships that could have appeared to influence the work reported in this paper.

Nomenclature

CNFcarbon nanofiber
FAformic acid
TEMtransmission electron microscopy
HRTEMHigh-resolution transmission electron microscopy
BETBrunauer–Emmett–Teller
XRDX-ray diffraction
WGSwater–gas shift reaction

References

  1. Hosseinpour, M.; Fatemi, S.; Ahmadi, S.J.; Morimoto, M.; Akizuki, M.; Oshima, Y.; Fumoto, E. The synergistic effect between supercritical water and redox properties of iron oxide nanoparticles during in-situ catalytic upgrading of heavy oil with formic acid. Isotopic study. Appl. Catal. B Environ. 2018, 230, 91–101. [Google Scholar] [CrossRef]
  2. Castañeda, L.C.; Muñoz, J.A.D.; Ancheyta, J. Current situation of emerging technologies for upgrading of heavy oils. Catal. Today 2014, 220–222, 248–273. [Google Scholar] [CrossRef]
  3. Guo, K.; Li, H.; Yu, Z. In-situ heavy and extra-heavy oil recovery: A review. Fuel 2016, 185, 886–902. [Google Scholar] [CrossRef]
  4. Ancheyta, J. Modeling of Processes and Reactors for Upgrading of Heavy Petroleum; CRC Press: Boca Raton, FL, USA, 2013. [Google Scholar]
  5. ExxonMobil: Diesel Will Surpass Gasoline as the Number One Global Transportation Fuel by 2020, Green Car Congress, 2013. Available online: https://www.greencarcongress.com/2013/03/xom-20130309.html (accessed on 13 March 2013).
  6. Yan, T.; Xu, J.; Wang, L.; Liu, Y.; Yang, C.; Fang, T. A review of upgrading heavy oils with supercritical fluids. RSC Adv. 2015, 5, 75129–75140. [Google Scholar] [CrossRef]
  7. Makaryan, I.A.; Sedov, I.V.; Nikitin, A.V.; Arutyunov, V.S. Current trends in the production of hydrogen from hydrocarbon feedstock. Sci. J. Russ. Gas Soc. 2020, 1, 50–68. (In Russian) [Google Scholar]
  8. Hart, A.; Lewis, C.; White, T.; Greaves, M.; Wood, J. Effect of cyclohexane as hydrogen-donor in ultradispersed catalytic upgrading of heavy oil. Fuel Process. Technol. 2015, 138, 724–733. [Google Scholar] [CrossRef]
  9. Zachariah, A.; Wang, L.; Yang, S.; Prasad, V.; de Klerk, A. Suppression of Coke Formation during Bitumen Pyrolysis. Energy Fuels 2013, 27, 3061–3070. [Google Scholar] [CrossRef]
  10. Habib, F.K.; Diner, C.; Stryker, J.M.; Semagina, N.; Gray, M.R. Suppression of Addition Reactions during Thermal Cracking Using Hydrogen and Sulfided Iron Catalyst. Energy Fuels 2013, 27, 6637–6645. [Google Scholar] [CrossRef]
  11. Alshareef, A.H.; Scherer, A.; Tan, X.; Azyat, K.; Stryker, J.M.; Tykwinski, R.R.; Gray, M.R. Formation of Archipelago Structures during Thermal Cracking Implicates a Chemical Mechanism for the Formation of Petroleum Asphaltenes. Energy Fuels 2011, 25, 2130–2136. [Google Scholar] [CrossRef]
  12. Ovalles, C.; Vallejos, C.; Vásquez, T.; Martinis, J.; Perez-Perez, A.; Cotte, E.; Castellanos, L.; Rodríguez, H. Extra-Heavy Crude Oil Downhole Upgrading Process Using Hydrogen Donors under Steam Injection Conditions. In Proceedings of the SPE International Thermal Operations and Heavy Oil Symposium, Porlamar, Venezuela, 12–14 March 2001. Paper Number: SPE-69692-MS. [Google Scholar] [CrossRef]
  13. Wang, B.; Zheng, P.; Fan, H.; Meng, Q.; Duan, A.; Chen, Z.; Xu, C. Insights into the effect of solvent on dibenzothiophene hydrodesulfurization. Fuel 2021, 287, 119459. [Google Scholar] [CrossRef]
  14. Hosseinpour, M.; Soltani, M.; Noofeli, A.; Nathwani, J. An optimization study on heavy oil upgrading in supercritical water through the response surface methodology (RSM). Fuel 2020, 271, 117618. [Google Scholar] [CrossRef]
  15. Chesnokov, V.V.; Dik, P.P.; Chichkan, A.S. Formic Acid as a Hydrogen Donor for Catalytic Transformations of Tar. Energies 2020, 13, 4515. [Google Scholar] [CrossRef]
  16. Chesnokov, V.V.; Dik, P.P.; Nikityonok, A.V.; Chichkan, A.S.; Parmon, V.N. Comparative Analysis of the Effects of Hydrogen and Formic Acid on the Vacuum Residue Hydrocracking. Chem. Eng. J. 2022, 449, 137839. [Google Scholar] [CrossRef]
  17. Dreyer, D.R.; Bielawski, C.W. Carbocatalysis: Heterogeneous carbons finding utility in synthetic chemistry. Chem. Sci. 2011, 2, 1233–1240. [Google Scholar] [CrossRef]
  18. Navalon, S.; Dhakshinamoorthy, A.; Alvaro, M.; Garcia, H. Carbocatalysis by graphene-based materials. Chem. Rev. 2014, 114, 6179–6212. [Google Scholar] [CrossRef]
  19. Ding, Y.; Greiner, M.; Schlögl, R.; Heumann, S. A Metal-Free Electrode: From Biomass-Derived Carbon to Hydrogen. ChemSusChem 2020, 13, 4064–4068. [Google Scholar] [CrossRef]
  20. Gu, Q.; Ding, Y.; Liu, Z.; Lin, Y.; Schlögl, R.; Heumann, S.; Su, D. Probing the intrinsic catalytic activity of carbon nanotubes for the metal-free oxidation of aromatic thiophene compounds in ionic liquids. J. Energy Chem. 2019, 32, 131–137. [Google Scholar] [CrossRef]
  21. Wu, S.; Wen, G.; Schlögl, R.; Su, D.S. Carbon nanotubes oxidized by a green method as efficient metal-free catalysts for nitroarene reduction. Phys. Chem. Chem. Phys. 2015, 17, 1567–1571. [Google Scholar] [CrossRef]
  22. Boehm, H.P. Free radicals and graphite. Carbon 2012, 50, 3154–3157. [Google Scholar] [CrossRef]
  23. Khavryuchenko, O.V.; Frank, B.; Trunschke, A.; Hermann, K.; Schlögl, R. Quantum-Chemical Investigation of Hydrocarbon Oxidative Dehydrogenation over Spin-Active Carbon Catalyst Clusters. J. Phys. Chem. 2013, 117, 6225–6234. [Google Scholar] [CrossRef]
  24. Avgul, N.N.; Kiselev, A.V.; Poshkus, D.P. Adsorption of Gases and Vapors on Homogeneous Surfaces; Chemistry: Moscow, Russia, 1975; p. 384. [Google Scholar]
  25. Abrahamson, J. The Surface Energies of Graphite. Carbon 1973, 11, 337–362. [Google Scholar] [CrossRef]
  26. Chesnokov, V.V.; Chichkan, A.S. Production of Hydrogen by Methane Catalytic Decomposition over Ni–Cu–Fe/Al2O3 Catalyst. Int. J. Hydrogen Energy 2009, 34, 2979–2985. [Google Scholar] [CrossRef]
  27. Jia, L.; Bulushev, D.A.; Ross, J.R.H. Formic acid decomposition over palladium based catalysts doped by potassium carbonate. Catal. Today 2016, 259, 453–459. [Google Scholar] [CrossRef]
  28. Jia, L.; Bulushev, D.A.; Beloshapkin, S.; Ross, J.R.H. Hydrogen production from formic acid vapour over a Pd/C catalyst promoted by potassium salts: Evidence for participation of buffer-like solution in the pores of the catalyst. Appl. Catal. B Environ. 2014, 160–161, 35–43. [Google Scholar] [CrossRef]
  29. ASTM D7169; Standard Test Method for Boiling Point Distribution of Samples with Residues Such as Crude Oils and Atmospheric and Vacuum Residues by High Temperature Gas Chromatography. ASTM International: West Conshohocken, PA, USA, 2023.
  30. ASTM D4294; Standard Test Method for Sulfur in Petroleum and Petroleum Products by Energy Dispersive X-ray Fluorescence Spectrometry. ASTM International: West Conshohocken, PA, USA, 2021.
  31. Speight, J.G. The Chemistry and Technology of Petroleum; Marcel Dekker: New York, NY, USA, 1980. [Google Scholar]
  32. Dickakian, G. Process for Deasphaltenating Cat Cracker Bottoms and for Production of Anisotropic Pitch. U.S. Patent US4427531A, 24 January 1984. [Google Scholar]
Figure 1. Transmission electron microscopy image of a CNF.
Energies 16 06477 g001
Figure 2. Schematic of laboratory setup for studing the decomposition of FA: 1—three-way valve; 2—gas flow regulator (GFR); 3—inlet for the carrier gas to enter the bubbler; 4—bubbler with FA; 5—outlet of argon saturated with FA; 6—inlet into the reactor; 7—reactor; 8—furnace; 9—outlet from the reactor (probe selection for chromatographic analysis).
Energies 16 06477 g002
Figure 3. The elemental composition of the vacuum residue used in the experiments.
Energies 16 06477 g003
Figure 4. The fractional composition of the vacuum residue, determined according to ASTM D7169 [29].
Energies 16 06477 g004
Figure 5. Experimental setup used for the hydrocracking process.
Energies 16 06477 g005
Figure 6. The decomposition of FA over Beta zeolite.
Energies 16 06477 g006
Figure 7. The dependence of conversion and selectivity on temperature during the thermal and catalytic decomposition of FA over CNFs and CNF (NaOH)s.
Energies 16 06477 g007
Figure 8. The dependence of conversion and selectivity on temperature during the catalytic decomposition of FA over CNF (NaOH)s and CNF (KOH)s.
Energies 16 06477 g008
Figure 9. The temperature dependence of the yields of liquid products of the thermal cracking of vacuum residue (1), the hydrocracking of vacuum residue in the presence of FA (2) and the hydrocracking of vacuum residue in the presence of FA and CNF (NaOH) (3).
Energies 16 06477 g009
Figure 10. Structures of the asphaltenes present in Venezuelan oil (left) and Californian oil (right) [31].
Energies 16 06477 g010
Figure 11. Fractional composition of liquid products formed in the thermal cracking of vacuum residue at 350 °C and 550 °C.
Energies 16 06477 g011
Figure 12. The fractional composition of the liquid products of hydrocracking of vacuum residue in the presence of FA at 350 °C, 400 °C and 550 °C.
Energies 16 06477 g012
Figure 13. Fractional composition of liquid products formed via the hydrocracking of vacuum residue in the presence of FA and CNF (NaOH)s in the temperature range of 300–450 °C.
Energies 16 06477 g013
Table 1. Textural characteristics of Beta zeolite.
ZeoliteVmicro, cm3/gVmeso, cm3/gVtotal, cm3/gSBET, m2/gAverage Size of the Crystals, nm
BEA0.220.150.37660160
Table 2. Characteristics of the CNFs.
CharacteristicValue
Average external diameter, nm25–100
Specific surface area, m2/g120
Apparent density, g/cm30.45
Table 3. Products of the thermal cracking of vacuum residue.
Temperature,
°C
Conversion of
the Vacuum Residue
Selectivity, %
Gas *Liquid HydrocarbonsCoke **
30010550
35052202012
40070322315
45087482217
50091532018
55095591719
60097671020
* The mass of gaseous products was determined according to the following formula: Mgas = Minitial vacuum residue – (Mliquid hydrocarbons + Mremaining vacuum residue and coke). ** The amount of coke was determined as the carbonated residue formed after the calcination of the sample (the remaining vacuum residue and coke) in an argon flow at 750 °C for 30 min.
Table 4. Products obtained after vacuum residue hydrocracking in the presence of FA.
Temperature,
°C
Conversion of
the Vacuum Residue
Selectivity, %
Gas *Liquid HydrocarbonsCoke **
25013670
3004512285
35069282714
40085432517
45093542118
50097611719
550100691120
* The mass of gaseous products was determined according to the following formula: Mgas = Minitial vacuum residue − (Mliquid hydrocarbons + Mremaining vacuum residue and coke). ** The amount of coke was determined as the carbonated residue formed after the calcination of the remaining vacuum residue and coke in an argon flow at a temperature of 750 °C for 30 min.
Table 5. Products formed via the hydrocracking of vacuum residue in the presence of FA and CNF (NaOH)s.
Temperature,
°C
Conversion of
the Vacuum Residue
Selectivity, %
Gas *Liquid HydrocarbonsCoke **
Sulfur
Concentration
250238151.050
3005415341.005
3507632290.8215
4008946240.9719
4509657191.3320
5009965131.521
* The mass of gaseous products was determined according to the following formula: Mgas = Minitial vacuum residue − (Mliquid hydrocarbons + Mremaining vacuum residue and coke). ** The mass of the remaining vacuum residue and coke was determined according to the following formula: Mremaining vacuum residue and coke = Msolids − MCNF.
Table 6. Changes in the sulfur concentrations in liquid products upon the addition of formic acid and formic acid + CNF (NaOH)s. Th reaction temperature is 350 °C.
Vacuum ResidueVacuum Residue + FAVacuum Residue + FA + CNF (NaOH)
Sulfur
concentration in liquid products, %
1.00.980.82
Disclaimer/Publisher’s Note: The statements, opinions and data contained in all publications are solely those of the individual author(s) and contributor(s) and not of MDPI and/or the editor(s). MDPI and/or the editor(s) disclaim responsibility for any injury to people or property resulting from any ideas, methods, instructions or products referred to in the content.

