Article

Evaluating the Progress of Renewable Energy Sources in Poland: A Multidimensional Analysis

by
Stanisław Jaworski
1,
Mariola Chrzanowska
1,
Monika Zielińska-Sitkiewicz
1,
Robert Pietrzykowski
1,
Aleksandra Jezierska-Thöle
2,* and
Piotr Zielonka
3
1
Department of Statistics and Econometrics, Institute of Economics and Finance, Warsaw University of Life Sciences, 02-787 Warsaw, Poland
2
Faculty of Geographical Sciences, Kazimierz Wielki University, 85-033 Bydgoszcz, Poland
3
Institute of Biology, Warsaw University of Life Sciences, 02-787 Warsaw, Poland
*
Author to whom correspondence should be addressed.
Energies 2023, 16(18), 6431; https://doi.org/10.3390/en16186431
Submission received: 16 July 2023 / Revised: 30 August 2023 / Accepted: 2 September 2023 / Published: 5 September 2023

Abstract

:
Energy is a key driver of all modern economies. Sustainable development is playing an increasingly important role both at regional and local levels. It is a compromise between social and economic needs and the preservation of nature. In the policy of the European Union, the idea of sustainable development and environmental protection is of decisive importance for the implemented programs and economic activities. Contemporary challenges require the transformation of the energy market towards greater use of renewable sources. According to Directive 2009/28/EC of the European Parliament and European Council on promoting energy from renewable sources, Poland has committed itself to achieving a 23% share of renewable energy in gross final energy consumption by 2030. This goal considers total energy consumption in terms of power, engineering, heating, refrigeration, and transport. The aim of this paper was, firstly, an analysis of the share of renewable energy in the European Union over an 18-year period (2004–2021), with particular emphasis on the position of Poland. The second objective was the analysis of renewable energy at the local level in Poland, i.e., at the local government unit (LAU) level. Changes in the share of renewable energy in Poland compared to other European countries were also examined. The study utilized functional analysis of principal components and cluster analysis based on the data from the Central Statistical Office and EUROSTAT. The study found that while Poland does not differ significantly from other countries in using renewable energy, it does fall below the European average. Principal component analysis suggests that Poland responds adequately to European changes in the share of renewable energy in total energy consumption. This dynamic is stable (over 95% explained by the first component) and applies to most countries surveyed. In addition, the authors sought to answer questions relating to the current status of renewable energy sources in Poland, the barriers and challenges facing the introduction of renewable energy in the country, a comparative analysis of Poland’s progress in renewable energy with other global counterparts, and an exploration of the future prospects and potential for the development of renewable energy in Poland. The study found that the potential for renewable energy is greatest in the northern areas of Poland, with photovoltaics and wind power plants providing the greatest capacity. Poland’s renewable energy potential is very high and will be determined by technological development, political, economic, and social issues.

1. Introduction

The International Energy Agency considers renewable energy sources to be those obtained from constantly renewable natural processes. This energy can come in many forms and is generated directly or indirectly by solar energy or heat from the Earth’s core [1]. The scope of this definition includes energy generated by solar radiation, wind, watercourses, and the movement of sea waves and tides [2]. It also includes biomass, animal products, and biodegradable municipal waste.
The reason for the interest in renewable energy is the depletion of conventional energy sources [3,4,5,6]. Additionally, the use of conventional sources devastates and pollutes the environment. Therefore, at the regional and local level, the trade-off between social and economic needs and the preservation of nature plays an increasingly important role. This trend is noticeable in the policy of the European Union, where the idea of sustainable development and environmental protection is of decisive importance for the implemented programs and economic activities [7].
The energy policy of the European Union has evolved since the early 1970s. One of the stages of its development was the adoption of the energy and climate package by the European Council in 2007. This document focused on three key objectives: reducing greenhouse gas emissions by 20%, increasing the share of energy from renewable sources in total energy consumption in the EU to 20%, and improving energy efficiency by 20% [8,9,10]. In 2014, the European Commission introduced modifications to the climate and energy policy of the European Union until 2030. These changes included: reducing greenhouse gas emissions by 40% compared to the 1990 base year, increasing the share of energy from renewable energy sources (RES) in total gross energy consumption in the EU to 27%, increasing energy efficiency by 27%, and finalising the internal energy market.
The European Union’s plans for renewable energy are subject to numerous modifications. For example, Directive 2018/2001 on promoting energy from renewable sources states that a binding EU target of at least 32% renewable energy should be set. In addition, the COVID pandemic and the military conflict between Russia and Ukraine have accelerated the efforts of EU countries to become independent of fossil fuels. As a result, the clean energy and climate neutrality program to be achieved by 2050 has been strengthened. In 2021, the European Commission proposed to raise the renewable energy target from 32% to 40% by 2030. In March 2023, a provisional agreement was announced with the European Parliament and the Council of Europe on updating the Renewable Energy Directive. The new RES target by 2030 will increase from 32% to 42.5%.
In addition to general recommendations, the EU issues several specific recommendations regarding the share of renewable energy in the energy sector, industry, construction, and transport. As part of the “Fit for 55” climate package in the construction sector, the EU requires a minimum share of renewable energy of 49% in buildings serving municipal purposes, including in heating and air conditioning. In the case of industry, the directive indicates that 42% of the hydrogen consumed in this sector should be produced from RES. In the transport sector, the EU has adopted two proposals: the first assumes a 14.5% reduction in greenhouse gas emissions through the use of renewable energy and the second requires the share of renewable energy to be 29% of the final energy consumption of transport. In addition, the EU assumes an increase in the share of biofuels and renewable fuels to 5.5%.
Therefore, the European Union imposes more and more requirements regarding using renewable energy sources (compare) [11,12]. How are individual Member States dealing with these requirements? How is increasing the share of renewable energy in total energy progressing? Are differences between countries in this respect decreasing or increasing? Does Poland have the potential to keep up with the growing energy requirements imposed by the European Union?
While previous works might have evaluated renewable energy progress within Poland in isolation, this study offers a comparative analysis by benchmarking Poland’s advancements against those of similar countries or regions. Given that the energy landscape is ever evolving, this study benefits from recent data, offering a more accurate reflection of the current state of renewable energy in Poland [13]. Our research covered the share of renewable energy in the European Union over 18 years, i.e., from 2004 to 2021. For this purpose, we used functional principal component analysis. This analysis aimed to determine whether the process of these changes in the share of renewable energy was stable. In particular, we assessed whether Poland’s position changed compared to other countries. This question is important in the context of the credibility of Poland’s efforts to increase its share of renewable energy.
We analysed the development of renewable energy in Poland at the local government unit (LAU) level to empirically check which renewable energy sources have the greatest development potential in Poland. The suggestions developed can be used in regional policy and contribute to the European Commission by confirming progress in developing RES in Poland. Data from the Energy Regulatory Office (ERO), GUS (Statistics Poland), and Eurostat were used for the analyses and calculations.
The authors intended to answer the following questions:
  • What is the current state of renewable energy sources in Poland?
  • What are the barriers and challenges to renewable energy adoption in Poland?
  • How does Poland’s progress in renewable energy compare to other countries or regions in the EU?
  • What are the future prospects and potential for renewable energy in Poland?

2. Literature Review

2.1. Legal Framework for Energy Policy

The use of renewable energy sources in the EU and Poland has been the subject of various studies [11,14,15,16,17]. In [18], it was established that the spillover effect affects the implementation of renewable energy. This effect underlines the importance of trade channels as a catalyst for the diffusion of renewable energy sources. Papers [19,20] show that renewable energy reduces carbon dioxide emissions, while non-renewable energy increases them. Additionally, [21] distinguishes countries that base most of their renewable energy on modern sources such as solar and wind power plants. In addition, countries with the worst energy efficiency were identified [22]. The analysis of the renewable energy sector in EU countries in [23] showed that domestic renewable energy production helps each country to reduce its energy dependency. Additionally, [24] examined the similarity of EU countries in terms of the structure and volume of renewable energy production from various sources. The study included 21 indicators describing the sustainable energy development of these countries in the areas of energy, environment, economy, and social security [25,26]. The results showed that in 2008 and 2018, the best positions in the ranking were occupied by Latvia and Croatia and the worst by Poland and Bulgaria. In [27], the diversity of EU countries in terms of wind energy potential was analysed. It was shown that the older EU member states have primacy because they have focused on the development of wind energy for a long time and have favourable climatic and natural conditions, as well as high social acceptance for programs supporting the use of energy from renewable sources. It was pointed out that new EU members, despite some delays related to the development of green energy, are increasing their energy potential in this area. In work [28], an attempt was made to identify the determinants of the energy policy of EU countries based on the share of RES. Changes in the distribution of RES in 26 EU countries in the period from 1995 to 2014 were studied. The distribution of energy sources in 1995 was a key factor in determining renewable energy development. It was found that renewable energy is developed to the greatest extent by countries without their own fuel sources. It was recognised that the important factors stimulating the development of RES are: GDP per capita, the concentration of energy supply, and the cost of energy obtained from fossil fuels in relation to GDP.
The subjects of the cited papers show how complex the analysis of renewable energy is and how many factors contribute to the overall picture of the use of renewable energy in EU countries. Statistical methods used in the cited works include panel models, cluster analysis, multi-criteria data analysis, and classical principal component analysis. None of the papers used functional principal component analysis.
Among the works cited above, there are references to Poland. In the literature, one can find works concerning only Poland. These include works [29,30,31,32], which analyse the structure of renewable energy in individual Poland’s voivodeships: Kujawsko-Pomorskie, Zachodniopomorskie, Wielkopolskie, Mazowieckie, and Łódzkie. A SWOT analysis showed that solar energy and wind energy have the greatest potential for development. In addition, it was pointed out that the development of the RES sector generates new jobs.
For Poland, the European Commission has set a goal that by 2020, 15% of final energy consumption (including biofuels) should come from renewable sources, also known as “green energy” [33]. The energy policy pursued by the Republic of Poland is consistent with the objectives of the energy policy of the European Union. This is evidenced by the document “Energy Policy of Poland until 2030”, adopted in 2009. The definition of renewable energy sources (RES) in Polish law is shaped by the documents of the Sejm of the Republic of Poland, containing references to RES and directly to the Energy Law (Journal of Laws of 2010, No. 21, item 104).

2.2. Development of Renewable Energy Sources

In the structure of consumed renewable energy, we can see that the largest share was provided by wind farms (37.4%). The next place is occupied by hydropower, whose share amounted to 32.3%. Photovoltaic power plants provided 15.2%, while biomass power plants contributed 7.1%. Other sources accounted for 8.1% of the share. It turns out that the fastest-growing renewable energy technology in the European Union is photovoltaics [34]. In 2008, its share in the RES mix in the EU was only 1%. Photovoltaics increased from 7.4 TWh in 2008 to 163.8 TWh in 2021 [35,36].
Among the EU Member States, Sweden leads the way regarding the share of energy from renewable sources in gross final energy consumption. In 2021, this percentage was 62.6%. Energy production from RES in Sweden is mainly based on biomass, water, wind, heat pumps, and liquid biofuels [37]. Sweden was followed by Finland (43.1%) and Latvia (42.1%), which mainly use biomass and hydropower; Estonia (37.6%), based mainly on biomass and wind energy; Austria (36.4%), with mainly hydropower and biomass; and Denmark (34.7%), using mainly biomass and wind [38]. However, some countries outside the EU had a much higher share of RES. In Iceland, 85% of energy came from clean sources (mainly geothermal energy) and in Norway, 74% (mainly hydropower) [39].
As Figure 1 shows, in 2021, 15 out of 27 EU members had an energy share below the EU average. These were: Belgium, Bulgaria, Czechia, Germany, Ireland, Spain, France, Italy, Cyprus, Luxembourg, Hungary, Malta, the Netherlands, Poland and Slovakia. The lowest share of RES was recorded in Luxembourg (11.7%), Malta (12.2%), the Netherlands (12.3%), Ireland (12.5%) and Belgium (13.0%). Poland was ranked 21st with the share of RES in gross final energy consumption at 15.6%.
The target for using renewable energy sources (RES) for Poland for 2020 was set at 15%. In 2020, Poland achieved a result of 16.1%. The share of energy from renewable sources in the gross final energy consumption in Poland in the years 2010–2021, based on data from the Central Statistical Office, is presented in Figure 2. In 2017/2018, the share of renewable energy sources increased from 11.1% to 14.9%.
According to the annex to Resolution No. 22/2021 of the Council of Ministers of 2 February 2021, on the Polish Energy Policy until 2040 [41], Poland has committed itself to achieving a 23% share of energy from renewable sources (RES) in total gross energy consumption by 2030. This assumption considers Poland’s potential in renewable energy sources, the competitiveness of RES technologies, and their technical capabilities within the National Energy System. In addition, challenges related to the development of RES in the transport and heating sectors were considered.
By 2040, Poland’s share of energy from renewable sources (RES) is expected to be at least 28.5%. However, the European Union’s initial agreements regarding changes in climate policy and energy independence might be approved and implemented with higher limits (42.5% by 2030). In that case, Poland will be forced to revise its national RES implementation programmes significantly.
The production of electricity from RES in Poland is growing year by year. The latest data for 2022 from Polskie Sieci Elektroenergetyczne (PSE), the energy system operator in Poland, indicate that in 2020, production from RES—mainly from wind farms and, increasingly, from photovoltaics—amounted to 19 TWh of energy. In 2021 it was already 21.8 TWh, and in 2022, an avalanche increase in photovoltaic power enabled an achievement of 30.4 TWh of energy, which is over 17% of domestic consumption. The rapidly growing power share is the result of a growing green energy generation park (Table 1) [42]. The installed capacity of wind farms in 2020 was 6.6 GW, and by the beginning of 2023—according to PSE data—it had already increased to 9.18 GW. An even greater and abrupt increase was seen in photovoltaics. In 2020, they accounted for only 1.18 GW; in 2022, the capacity reached 12.19 GW. The majority of photovoltaics (approx. 80%) are prosumer micro-installations. Throughout 2022, 362 159 photovoltaic installations with a total capacity of 4269.8 MW were built [43].
In 2022, there was a notable shift in the legislation pertaining to prosumer installations. The prosumer rebate system came to an end, making way for the introduction of the net-billing system. While this change initially sparked a surge in new installations during the first quarter, there was a marked decline in subsequent months. Factors that could potentially drive future investments in prosumer micro-installations include the heightened co-financing under the “My Electricity 4.0” program, launched in December 2022, and the “tenant prosumer” initiative, announced later that year, which promotes co-financing for solar energy in multi-family residences [44].
Wind energy helps solve problems such as energy poverty, high energy costs, and Poland’s dependence on energy imports. Since 2016, the so-called Distance Act introduced, among other things, the requirement to build new turbines based on local plans and maintain the devices at a minimum distance from residential buildings (at least ten times their total height). This significantly limited the development of onshore wind farms. According to the Polish Wind Energy Association data, almost 99% of the country’s territory was excluded from potential investments, which was a severe obstacle to the development of this industry.
While the regulation aimed to shield residents from the negative impacts of wind turbines, it overlooked the broader interests of the wind energy industry and the overall economy.
On 23 April 2023, an amendment to the Act on investments in wind farms entered into force (Journal of Laws of 2023, item 553). According to the new rules, wind turbines will be allowed to be built only based on a local spatial development plan while maintaining a minimum distance from residential buildings of 700 m.
Liberalising the 10H distance rule will increase the availability of investment areas for wind farms. Such a step will make it possible to achieve a wind capacity of 44 GW [45]. Due to the investments in offshore wind farms, two large projects are planned in the north of Poland: constructing a wind turbine factory in Szczecin and installing a terminal in Świnoujście. International corporations such as Shell and OX2 are seeking permission to build wind farms in the Polish area of the Baltic Sea. Theoretically, offshore wind farms could provide up to 57% of Poland’s total demand for electricity [46].
The biogas market in Poland is developing, albeit at a moderate pace. The European Union sets the development of biomethane as one of the critical elements of the RePowerEU program, and Polish companies are adapting to this direction. Orlen SA (commonly known as Orlen; a Polish multinational oil refiner and petrol retailer headquartered in Płock, Poland) announced plans to create the first ecological biomethane plant in Poland, intended to produce over 7 million cubic meters of biomethane annually. This resource will then be converted into biofuel, i.e., bio-LNG. What is more, biomethane has the potential to be used in the Polish district heating system. The implementation of this investment is planned for the second half of 2024 [47,48,49]. The electricity production from various renewable sources in Poland in 2021 and 2022 is presented in Figure 3.

3. Materials and Methods

This study analysed 29 European countries from 2004 to 2021 at the NUTS-0 level; the analysis for Poland concerned voivodeships (NUTS-2) and poviats (NUTS-3). The paper presents research on renewable energy sources, namely, photovoltaics (PV), wind turbine generators (WTG), and aquatic base flow (ABF, hydropower).
The primary aim of our research was to categorize EU countries based on their renewable energy characteristics over the years. We sought to group nations with analogous renewable energy profiles. To accomplish this, we employed specific cluster analysis methods, selected for their ability to accurately delineate clusters consistent with our research vision. Rather than imposing pre-existing concepts on our study, we initially employed empirical principal component analysis for processes. This methodology represents an innovative approach to evaluating the time-perspective share of renewable energy in the total energy mix, as per the authors’ knowledge. The purpose of this analysis is to isolate several features that are common to a given set of functions. These features characterise the total variability of these functions around the average function determined from them. The extracted features are patterns of variability for the available data examined. The considered functions are time-dependent processes; in the paper, these are the time-varying shares of renewable energy in the total energy produced by individual countries of the European Union.
We assessed both the magnitude and the trajectory of the variable over time, as informed by the estimated weighting functions. This enabled us to pinpoint countries with analogous profiles based on the observed characteristics. Employing principal component analysis refined our approach to cluster analysis, sharpening our insights regarding Poland in the context of other European nations.
Formalising, empirical principal component analysis consists in finding such weighting functions, ξ 1 ,   , ξ M , that, for each   ξ m ,   m 1 , ,   M , the average
1 N i T ξ m t y i t   μ ^ t d t 2
Is maximised at limitation:
T ξ k 2 t d t = 1   and   T ξ m t ξ k t d t = 0   ( k < m ) ,
where y i t ,   i = 1 , , N is the value of the i -th variable at time t T and μ ^ t = 1 N i y i t .
The vector f m = f 1 m , , f N m ,   where   f i m = T ξ m t y i t μ ^ t d t , is called the m -th principal component. It is assumed that M < N .   In most applications M = N 1 .
Then, the share of the variability of the first m components in the overall variability of the observed processes is
V m = i = 1 N l = 1 m f j l 2 i = 1 N l = 1 M f j l 2 .
The overall variability of the processes is defined as follows:
1 N i T y i t   μ ^ t 2 d t .
The interpretation of the principal components is helped by examining the graph of the mean μ ^ t and functions
τ k + = μ ^ + C k ξ k ,   τ k = μ ^ C k ξ k ,     dla   k m ,
where   C k 2 = 1 N i f i k 2 .
In turn, the graph, called the biplot,
f i k 1 , f i k 2 : i = 1 , , N ,
k 1 < k 2 m ,   allows you to visualise the differences between the processes. y i ,   i = 1 , , N .
For example, if the coefficient f i k   has a relatively large positive value, the curve corresponding to the i -th object (country) is close to the τ k + curve. If, on the other hand, it has a strongly negative value, the curve is close to the τ k curve. If the first two components are largely responsible for the variability of all curves (when V m   is   close   to   1 ,   for   m = 2 ) , then to a good approximation each curve is a linear combination of these two components.
Formally, the principal components approximate the studied processes in the sense that for any vector and vector c i R m and vector ν t = ν 1 t , , ν m t , the sum,
i 0 T y i s μ ^ s c i ν s 2 d s
reaches its minimum when c i = f i 1 , , f i m and ν s = ξ 1 s , , ξ m s .
This minimum is i = 1 N l > m f j l 2 . In principal component analysis for processes, as for vectors, the eigenvalues are determined. These are the solutions equations,
T c ^ s , t ξ k t d t = λ k ξ k s ,   k = 1 , ,   M ,
due to λ k , where c ^ s , t = 1 N i y i s μ ^ s ( y i t μ ^ t ) is the empirical covariance function of the processes y i ,   i = 1 , , N . The determined eigen values satisfy:
  • λ k λ k + 1 dla k = 1 , , M 1
  • V m = l = 1 m λ l l = 1 M λ l
  • i T y i s μ ^ s c i ν s 2 d s = l > m λ l
  • C k 2 = λ k dla k = 1 , , M
The technique described in [50] determined the principal components. The component analysis results were supplemented in the work with a hierarchical classification based on two types of distances between processes.
Our secondary goal was to delve into the shifting energy mix across poviats, covering a span of four years. Our aim was to delineate the variance in renewable energy sources based on geographical location. This approach aids us in discerning the future potential and prospects for renewable energy within Poland.

4. Results

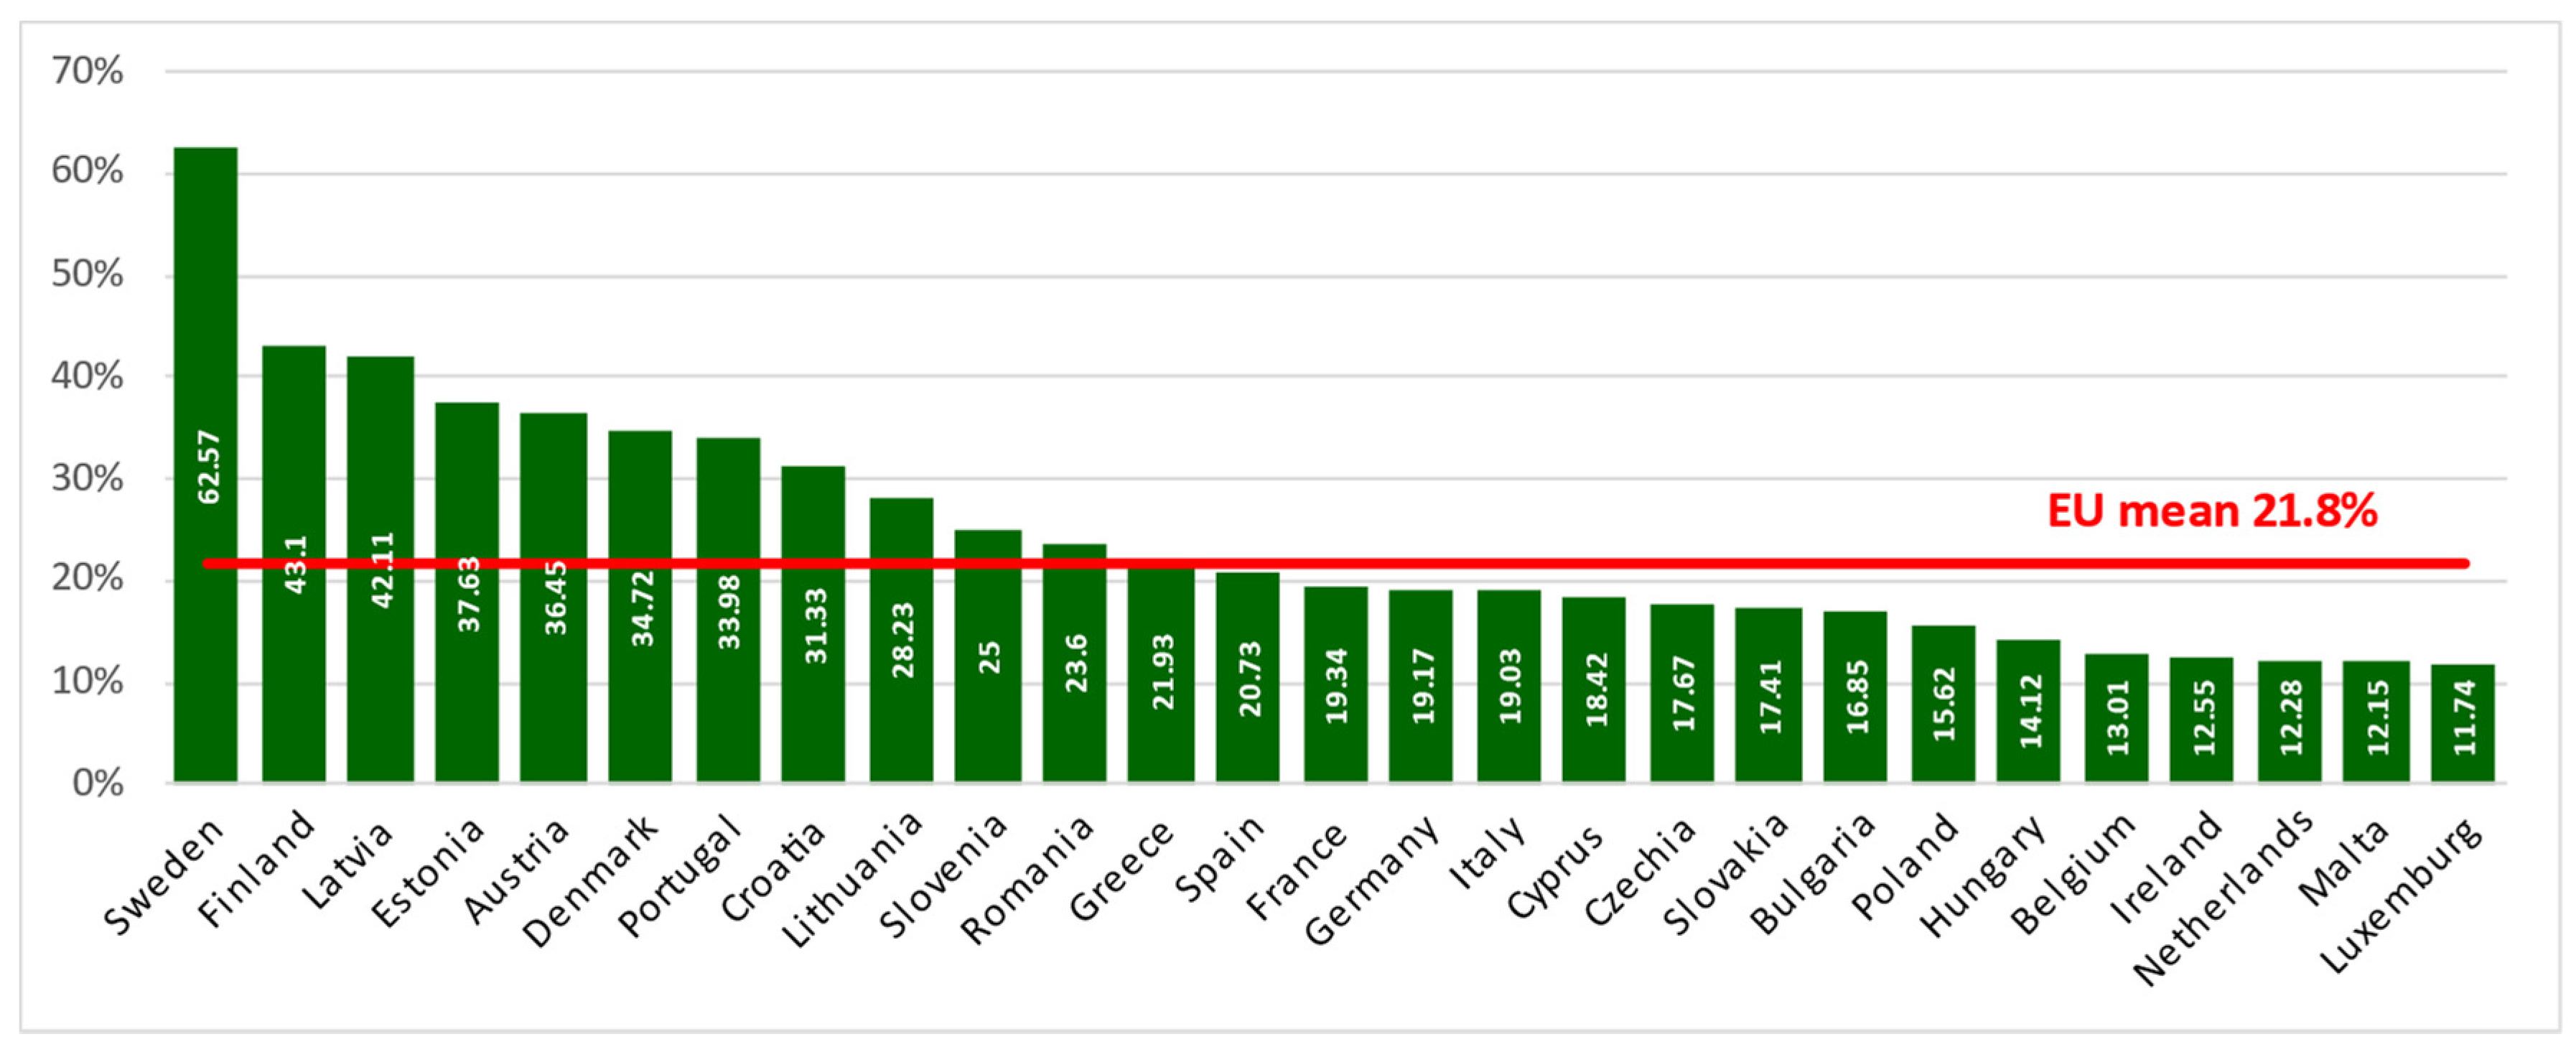
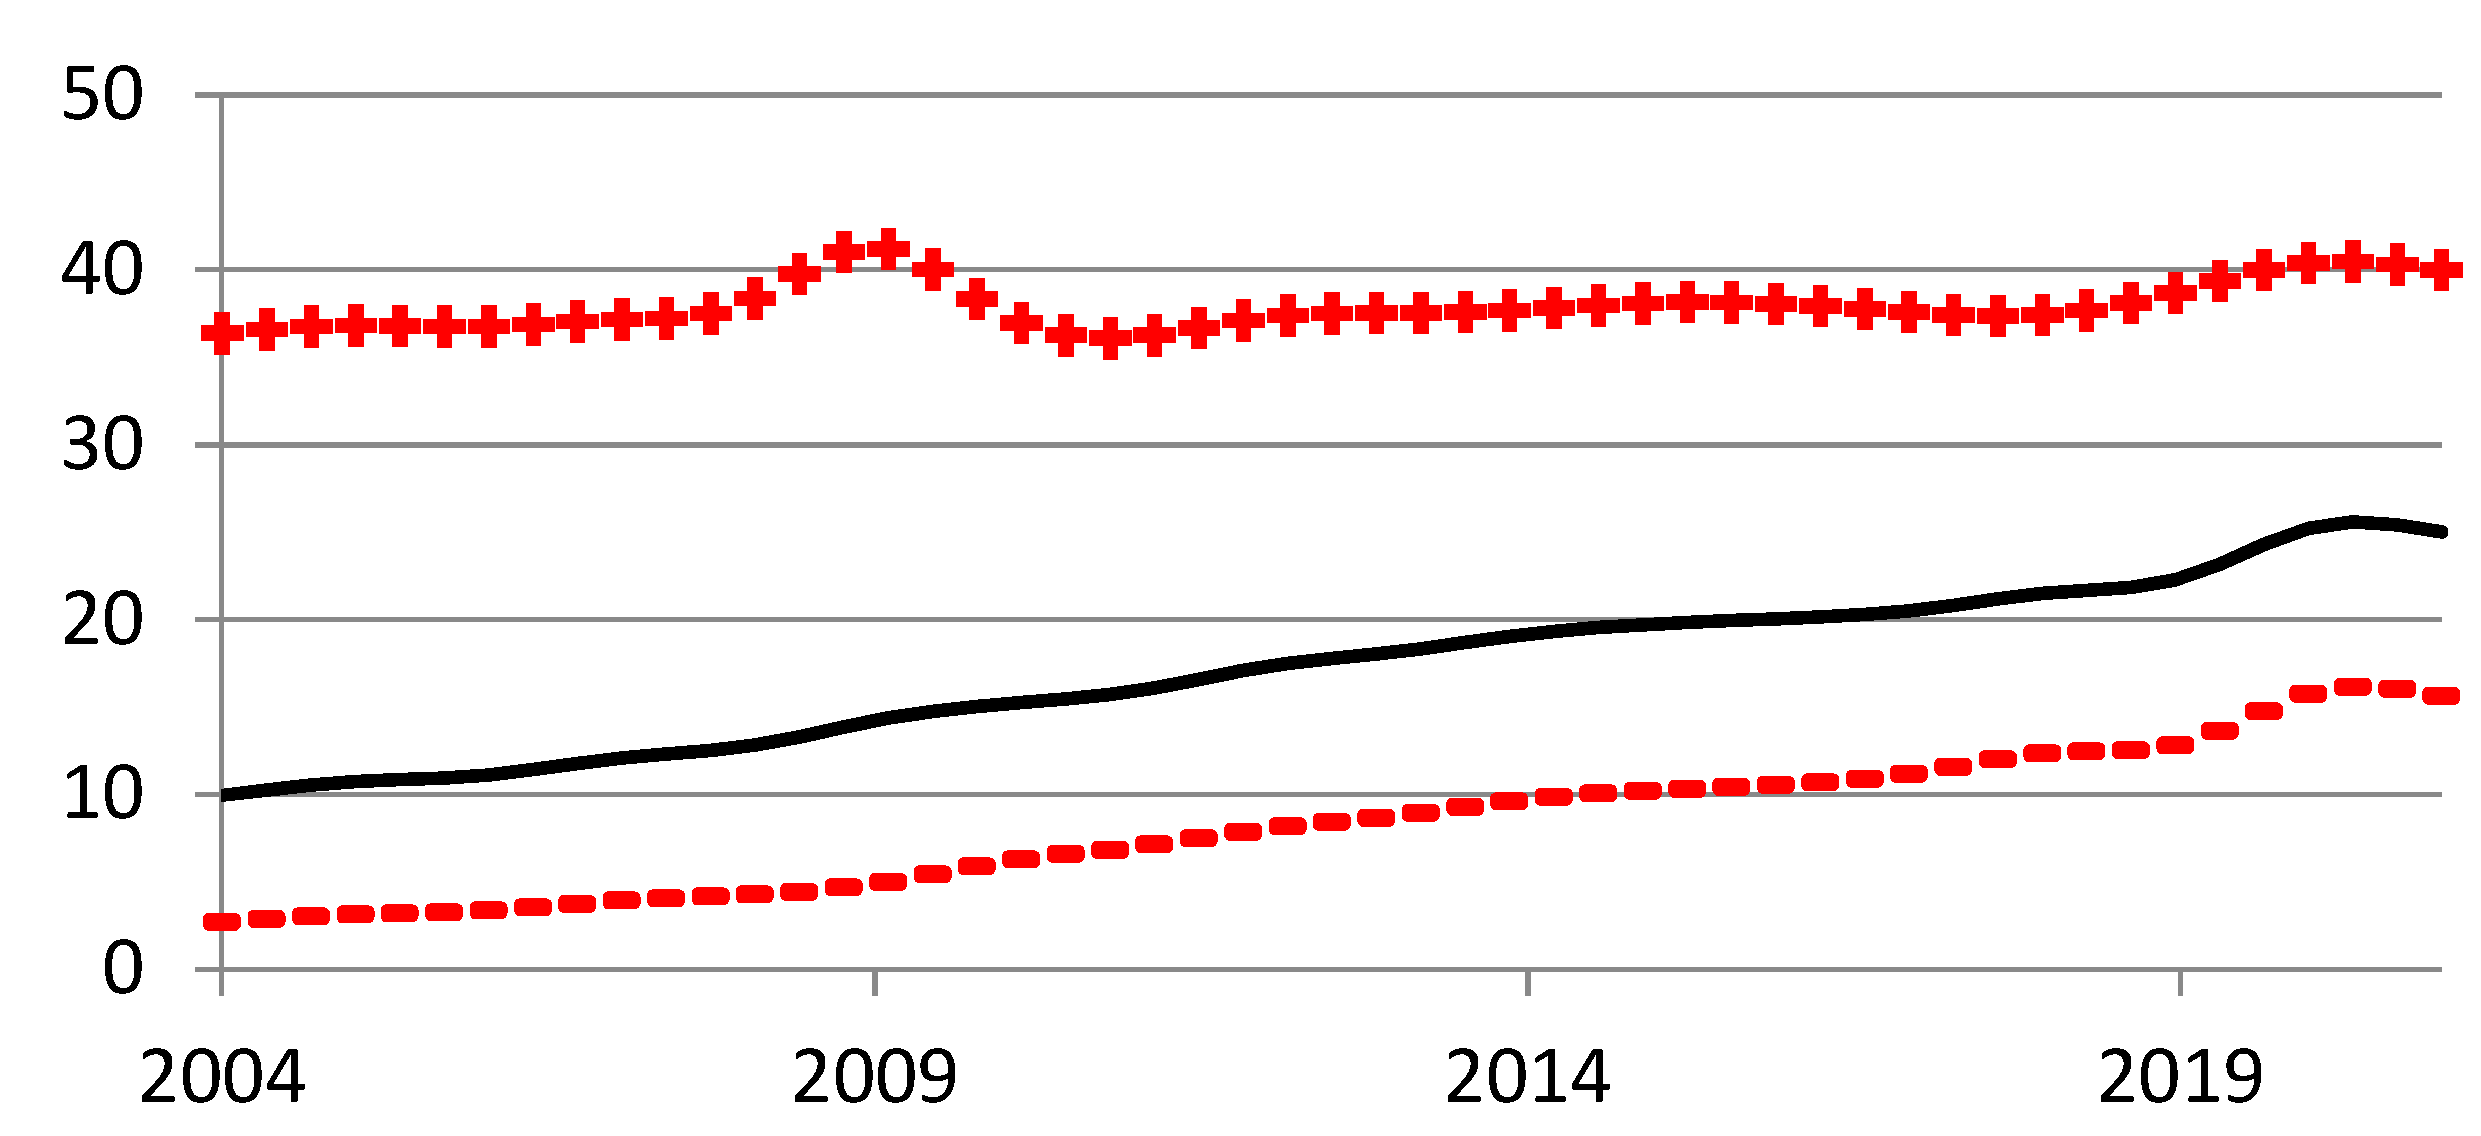
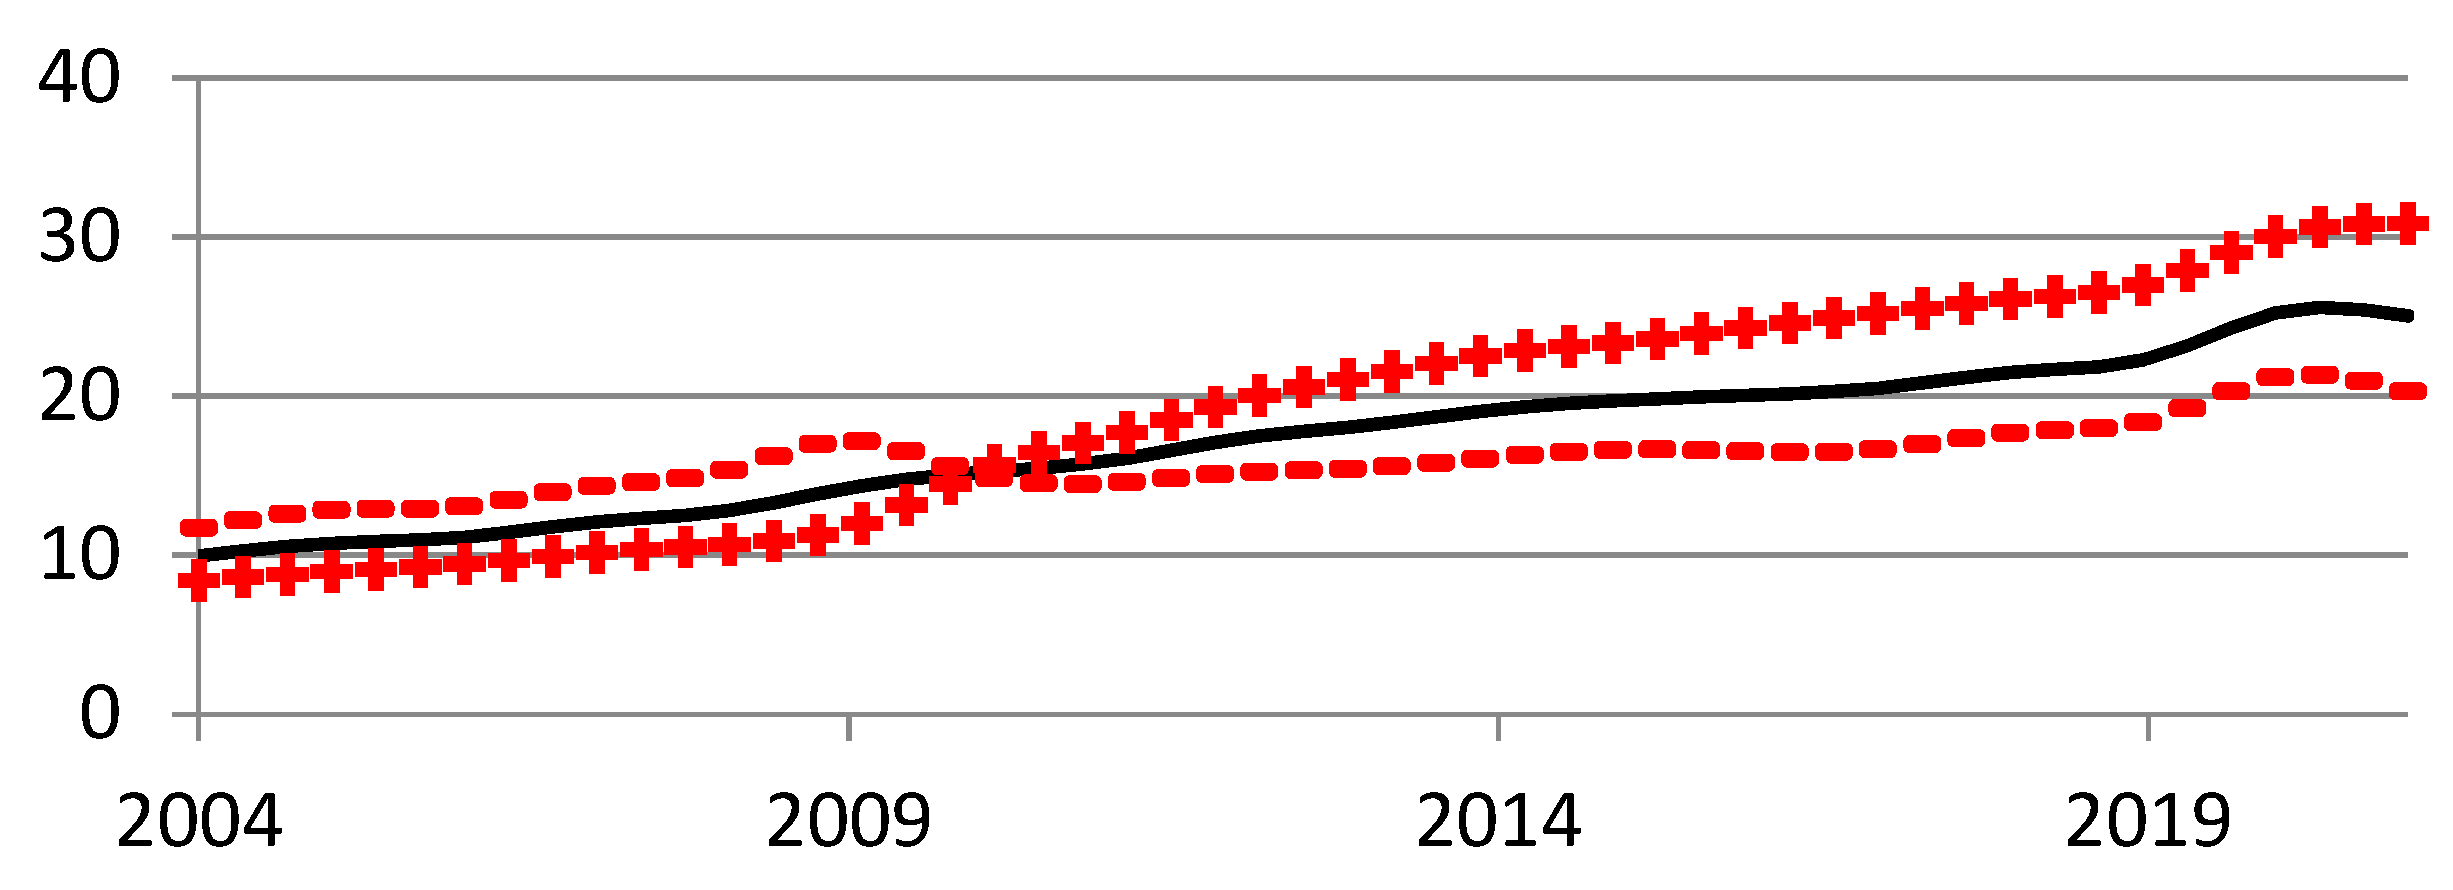
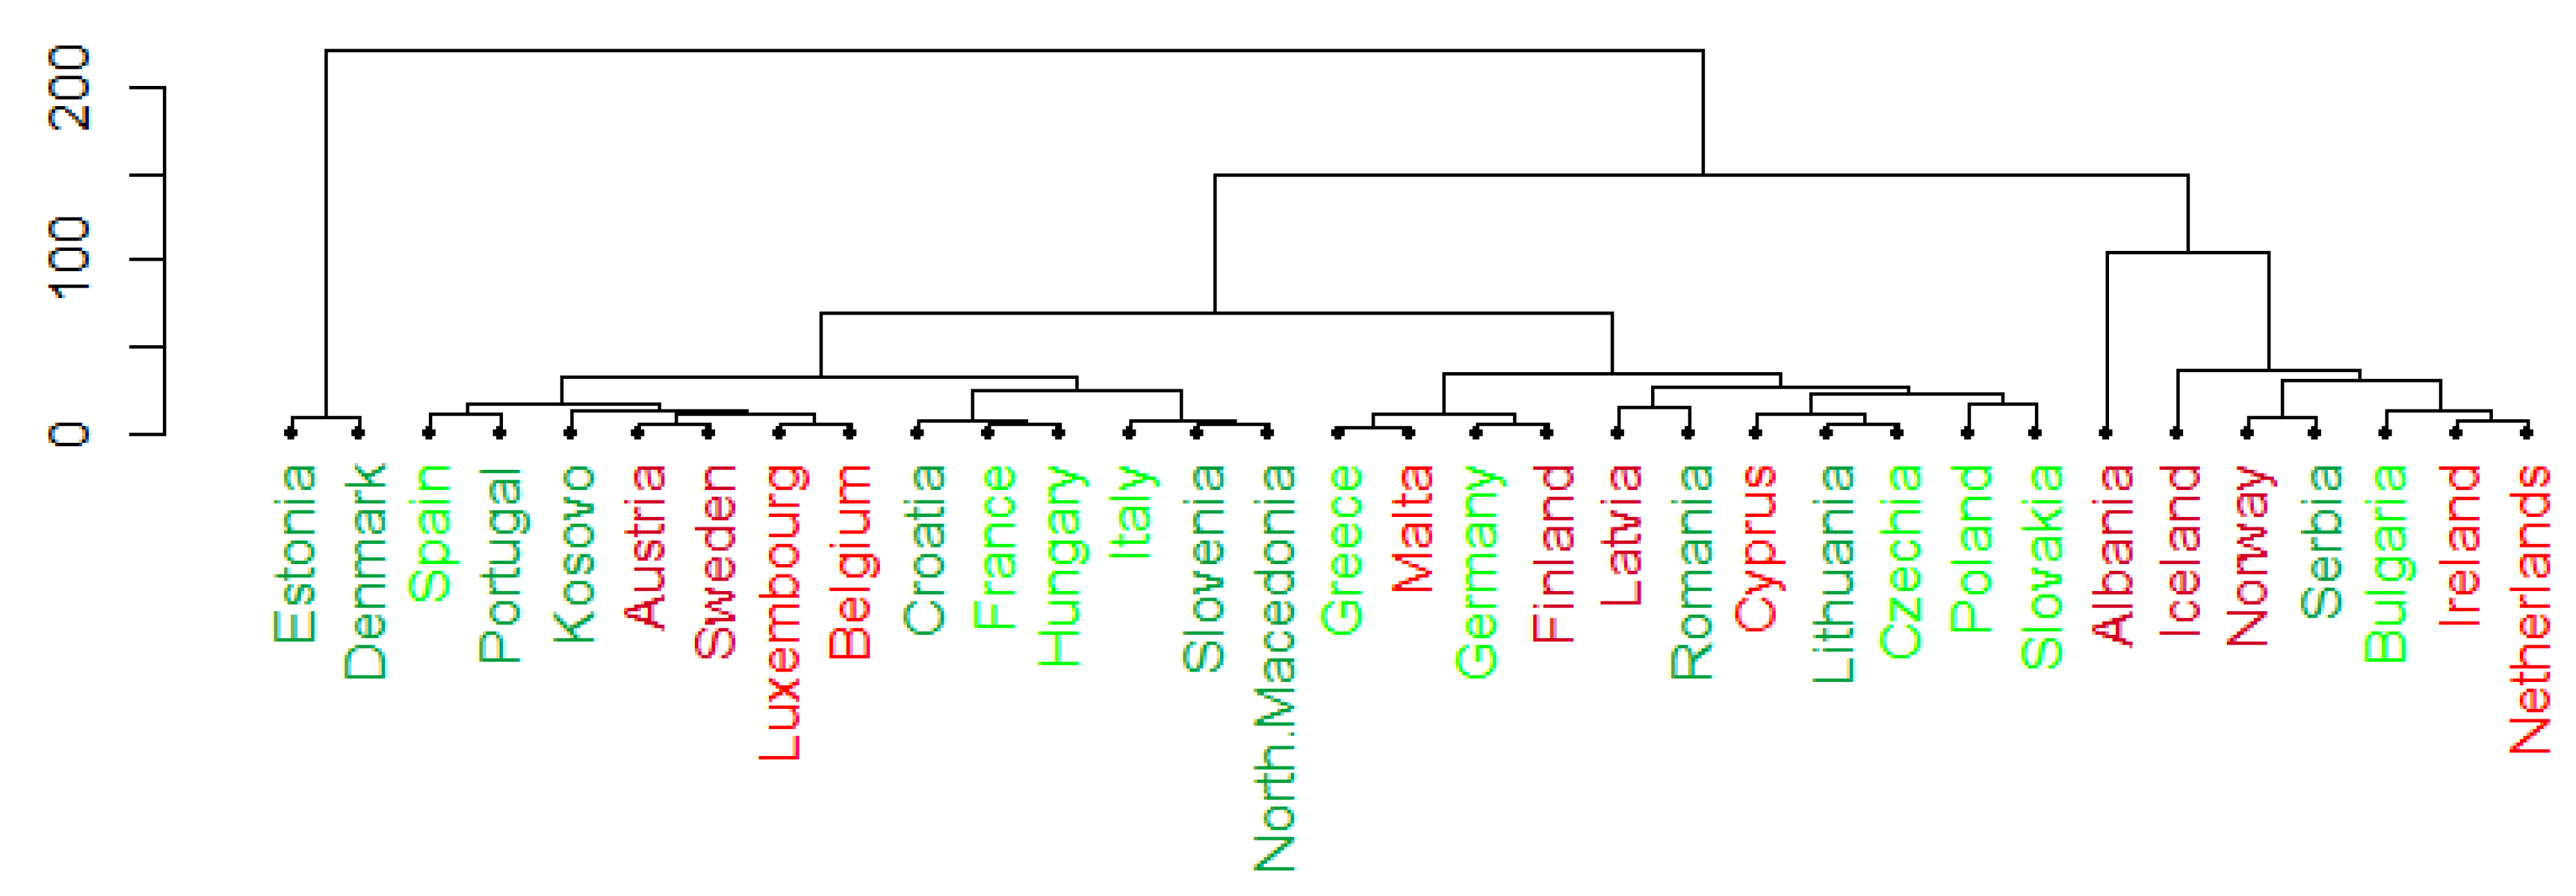
4.1. Share of Renewable Energy in Total Energy in EU Countries

We assume that the share   x i j   of   renewable   energy   in   total   energy   for   i -th country at time t = t j has the form
log x i j = log x i t j + ε i j ,
where ε i j is the random error. The work involved principal component analysis for processes y i t = log x i t ,   i = 1 , , N , based on the data x i j i j where t T = 2021 , 2004   and   N = 29 . Based on the data, the processes y i t ,   i = 1 , , N , were estimated for which a component analysis was performed.
The estimation employed the roughness penalty method, utilizing the B-spline basis. For technical intricacies, refer to [50].
The shares of the first five largest eigenvalues are 0.956, 0.037, 0.004, 0.002, and 0.001. They are shown on the screen plot (Figure 4). We can conclude that one or two principal components are enough to explain the total variability of the analysed processes. The first component explains the percentage of volatility,   V 1 100 = 95.6 , and the second the percentage, V 2 100 = 3.7 .
The principal components analysis shows that two components are sufficient to represent each process, y i t , accurately, i.e.,
y i t μ ^ t + f i 1 ξ 1 t + f i 2 ξ 2 t ,
hence, for the geometric mean G t = i = 1 N x i t N , and for the substitution
ξ 1 t = log ν 1 t ,   ξ 2 t = log ν 2 t ,
we receive
x i t G t v 1 t f i 1 v 2 t f i 2 ,
The two principal component functions, v 1 ,   ν 2   ,   are shown in Figure 5 and in transformed form in Figure 6 and Figure 7. Note that for the years 2004–2021, function   v 1 is greater than 1. This means that in 2004, if the share of renewable energy in a given country’s total energy was higher than in other countries ( V 1 100 = 95.6   % ), it remained the same in the following years, 2005–2021. Moreover, given that it is a decreasing function, the differences between these shares became smaller and smaller. The reason was the faster growth of shares for countries with low renewable energy use, which can be read from Figure 7 (the level of the curve consisting of pluses changes slightly compared to the level of the curve consisting of minuses).
On the other hand, function ν 2 , responsible for the low volatility of the examined shares ( V 2 100 = 3.7   % ), is less than 1 for 2001–2009 and greater than 1 for 2010–2021. This curve’s relatively large increase (from 0.77 to 1.04) occurred in 2009–2010. The level of these changes is small, as shown in Figure 5. The nature of these changes most strongly affects such countries as Malta and the Netherlands. This can be read in Figure 7.
Figure 6 and Figure 7 show the two principal component functions by displaying the average curve G t along +s and −s indicating the consequences of adding and subtracting a small amount of each principal component. The principal component represents variation around the mean, and therefore is naturally plotted as such. We see that the first component, accounting for 95.6% of the variation, represents a relative constant vertical shift in the mean, and that the second shows essentially the influence of the 2007–2009 crisis in the financial and banking markets. The amount of the shift and the influence of the crisis for the i-th country are depicted by coefficients f i 1 , f i 2 in Figure 8 accordingly. Points farther away from point (0,0) in Figure 8 refer to countries whose shares differ significantly from the average. Hence, countries such as Malta, Luxemburg, and the Netherlands show a relatively low share of renewable energy in total energy, while Sweden, Norway, and Iceland have a high share. The difference between the shares of countries such as Malta and the Netherlands is decreasing faster than the corresponding differences for other countries. For Malta and the Netherlands, these shares were, respectively, 0.12% and 2.48% in 2004; 16 years later, they were 12.2% and 12.3%. Points marked in green concern countries whose shares do not differ significantly from the average. Among them are countries with a relatively lower renewable energy share (light green points) and a higher level (dark green). Countries with a lower level include Germany, Greece, Spain, France, Italy, Hungary, Poland, Czechia, Slovakia, and Bulgaria, while those with a higher level include Estonia, Croatia, Lithuania, Portugal, Romania, Slovenia, North Macedonia, Serbia, Kosovo, and Denmark. The countries with the largest share are the northernmost countries, such as Norway, Sweden, Latvia, and Iceland (Figure 8 and Figure 9).
Note that an approximate relationship in the principal component analysis was obtained,
x i t G t v 1 t f i 1 v 2 t f i 2 ,
which shows that the elasticity of the share of renewable energy in total energy with respect to each component is practically constant:
d log x i t d log ν k t f i k ,     k = 1 , 2 . ,
The coefficient tells us how much the f i k will change x i t with a one per cent increase in the function, ν k t . Note (Figure 5) that the second component grew rapidly after 2009, after the end of the global economic crisis in the financial and banking markets. Therefore, it illustrates this crisis’s impact on the share of renewable energy sources in the total energy of individual countries. It had the greatest impact in Malta, Iceland, and the Netherlands. These are the countries with the highest (positive) and lowest (negative) values of the coordinates in Figure 8. Thus, for Malta and Iceland, the 2007–2009 crisis was a positive impulse for the increase in the share of renewable energy and a negative for the Netherlands. Generally, however, it did not have a large impact on the scale of all the countries considered, which can be deduced from the low level of variability explained by the second component (3.7%). Around 2014, the second component stabilised its level, meaning this crisis was no longer significant.
To present the differences between the considered shares of renewable energy in European countries in detail, two measures of distance were used, which are graphically presented using dendrograms. The first measure is the distance between the x i and x j processes and is defined as follows:
x i x j 2 = 1 T T x i t x j t 2 d t 1 / 2 .
This distance assumes small values for processes whose level difference is very similar over the entire time horizon, T .   The second measure is the distance between the rate of change between the processes.
This distance assumes small values if the dynamics of changes of both processes are similar in time, and both processes do not have to be at a similar level (for example, the previous measure may take large values). This distance is defined as follows:
d x i , x j = 1 T T x i t x j t 2 d t 1 / 2 ,
where x i t is the derivative over the argument, t .
The distance-based classification, 2 , coincides with the direction of variability represented by the first component (the colour of the points in Figure 8 coincides with the colour of the dendrogram leaves in Figure 10). Four groups of countries have emerged, which can be separated according to the share of renewable energy in total energy. The first group consists of countries whose share is above or below the average. Both higher and lower countries fall into two groups in turn, as shown by the colours green and red in Figure 8. Within this main division, we can distinguish further ones according to the classification shown in Figure 10.
Figure 11 allows us to classify these countries due to the similarity of changes in the share of renewable energy. For the analysis of principal components, the data were smoothed more than for determining the distance d x i , x j . Hence, it can be assumed that the analysis of principal components concerns long-term changes in the share of renewable energy over 18 years (from 2004 to 2021), and the analysis of the distance, d x i , x j , concerns short-term changes (which also results from the very definition of the derivative of the function). For example, Poland and Slovakia have similar renewable energy shares (Figure 10) and similar short-term dynamics (Figure 11). In turn, despite similar renewable energy shares (Figure 10), France and Germany have different dynamics of short-term changes. Both pairs of countries mentioned are neighbouring countries.
It is possible to distinguish countries that differ in the level of renewable energy shares but show similar dynamics of short-term changes although they are not adjacent. This group includes Greece, Malta, Germany, and Finland.
In the years 2004–2021 in the analysed countries:
  • the share of RES was systematically growing,
  • the differentiation of RES shares was systematically decreasing,
  • the upward trend dominated the negative impact of the 2007–2009 crisis,
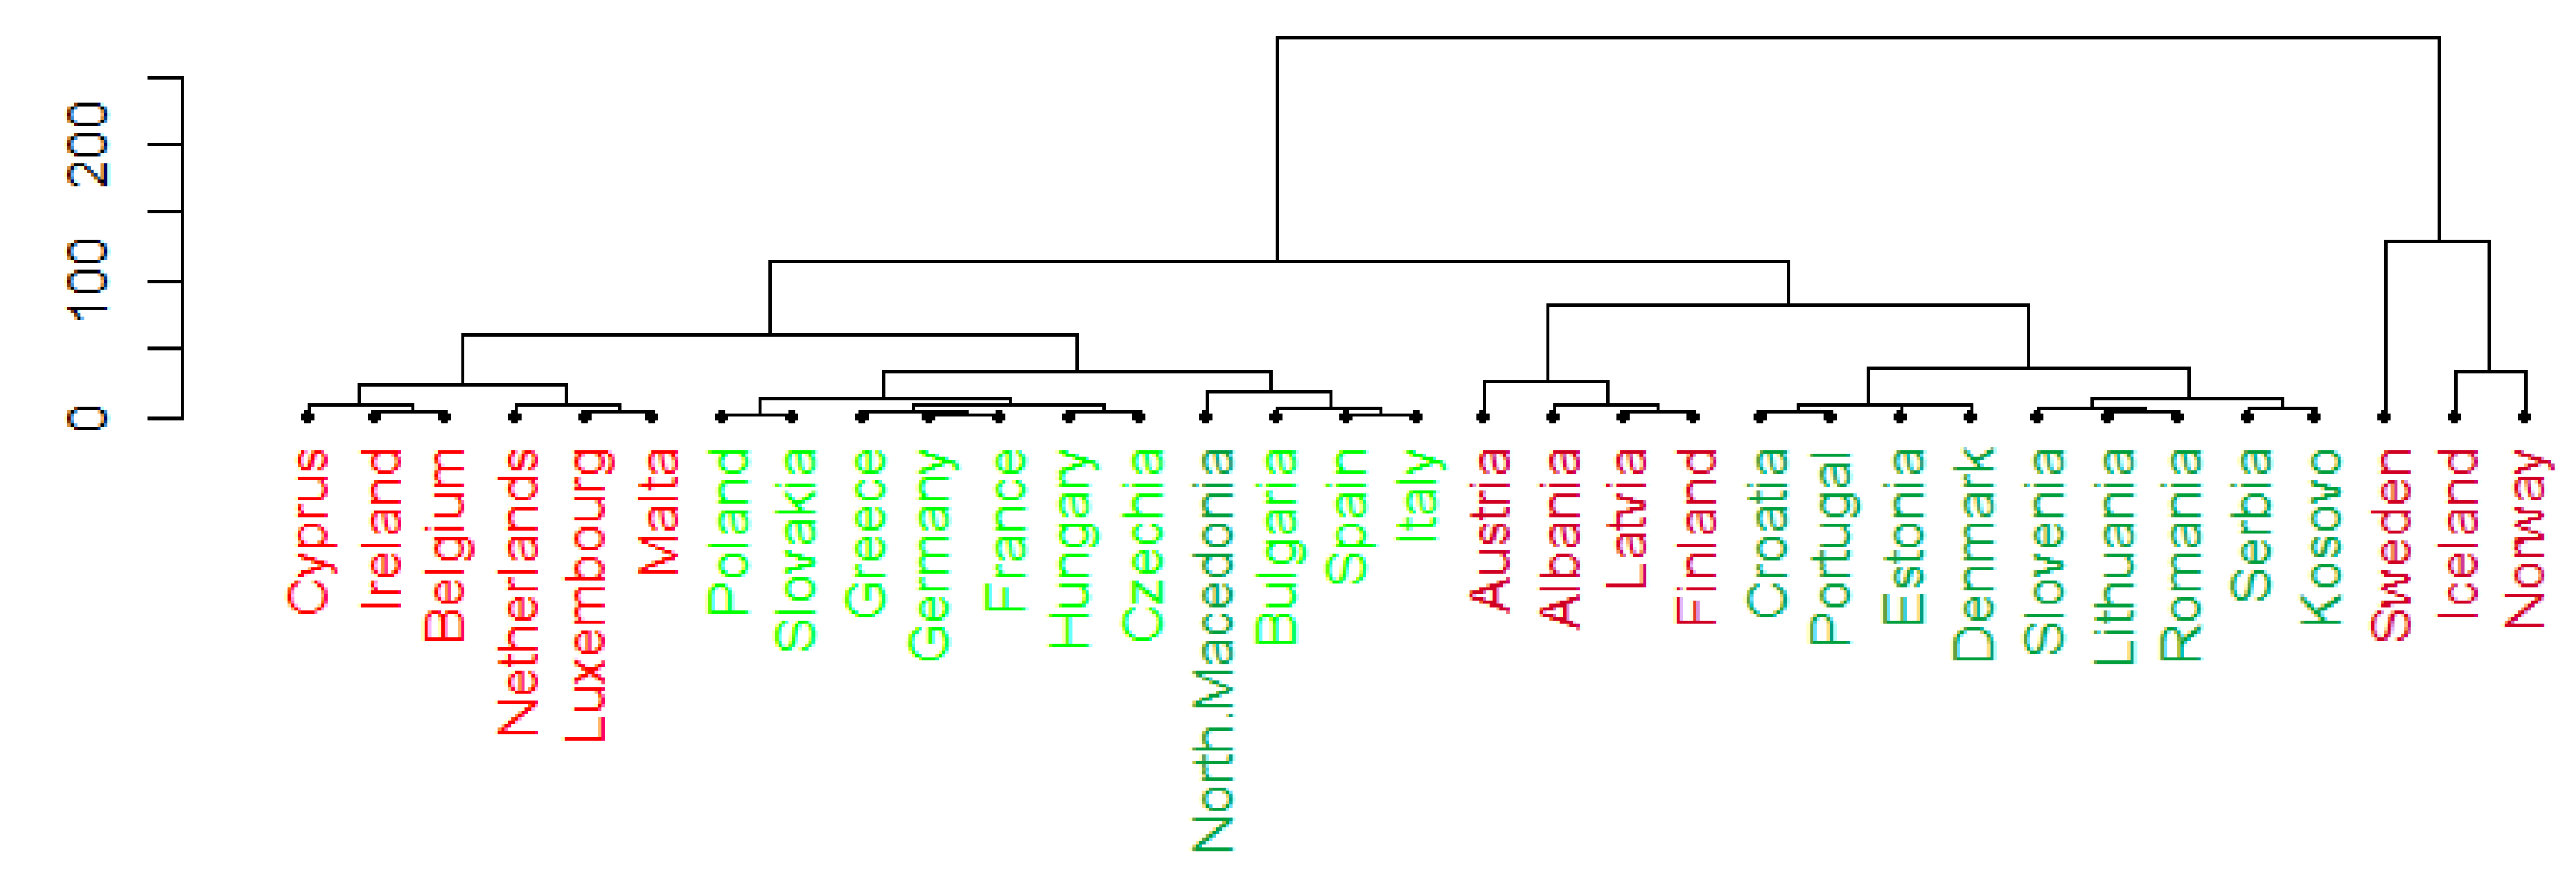
  • the share of RES depended on the geographical location of the country,
  • there was a similarity of short-term changes in RES shares of some neighbouring countries, but it was not a general rule.

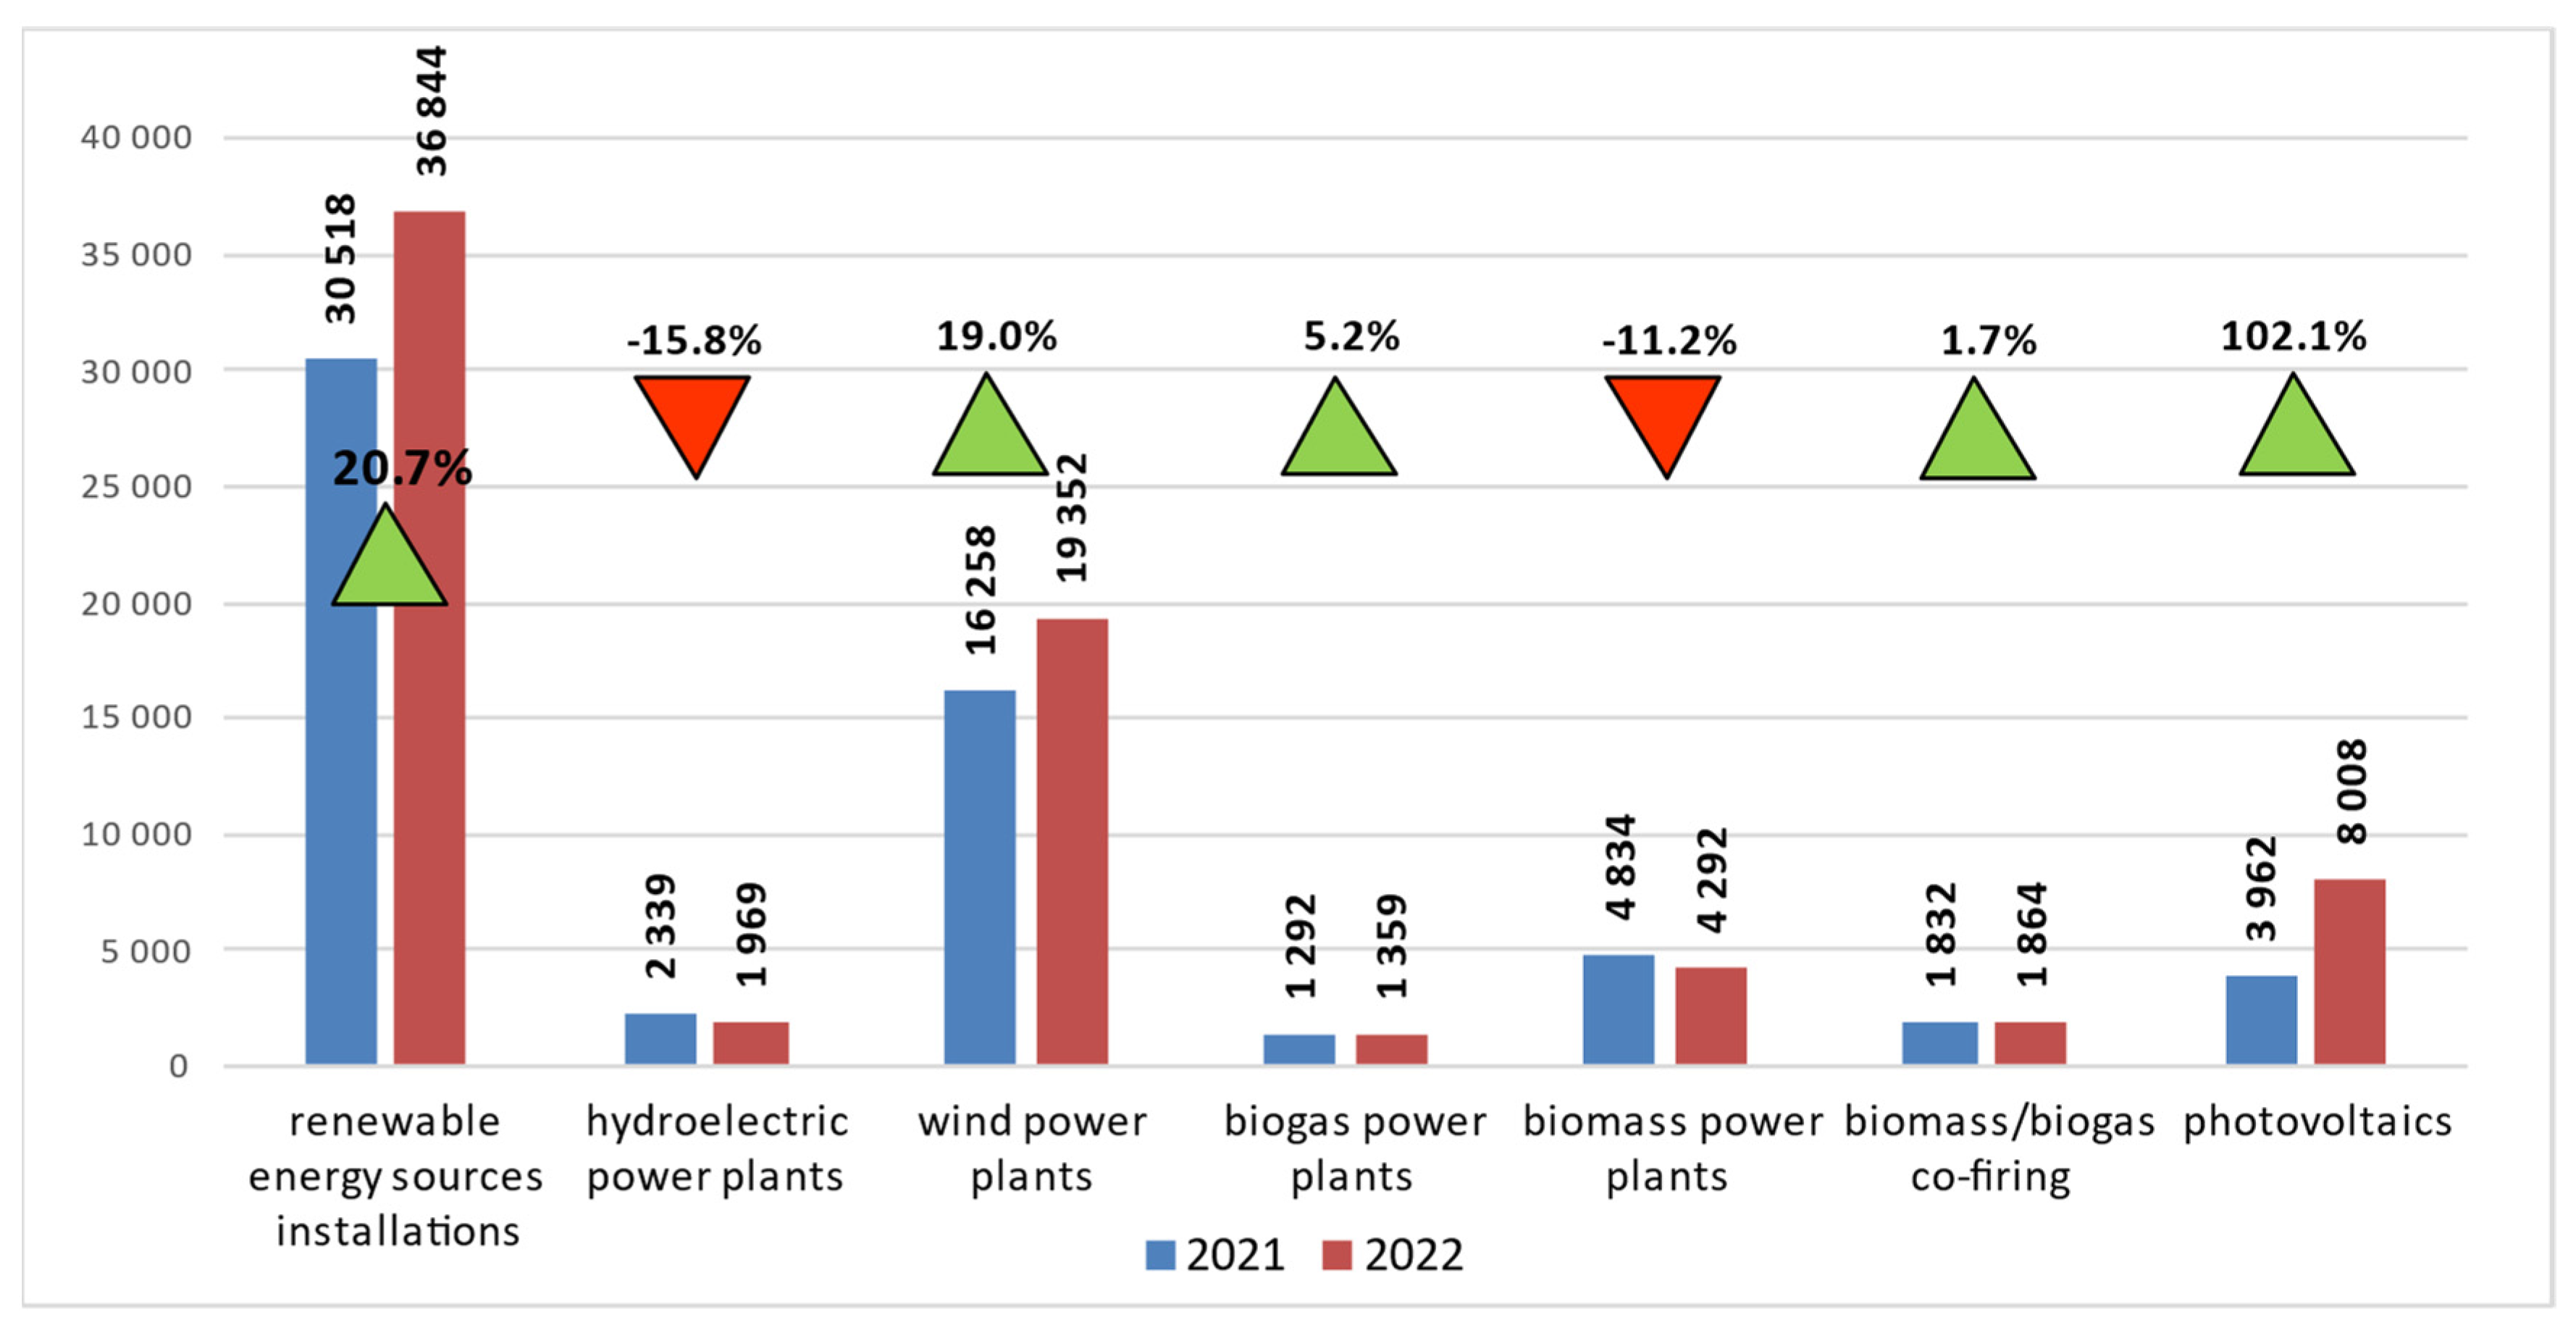
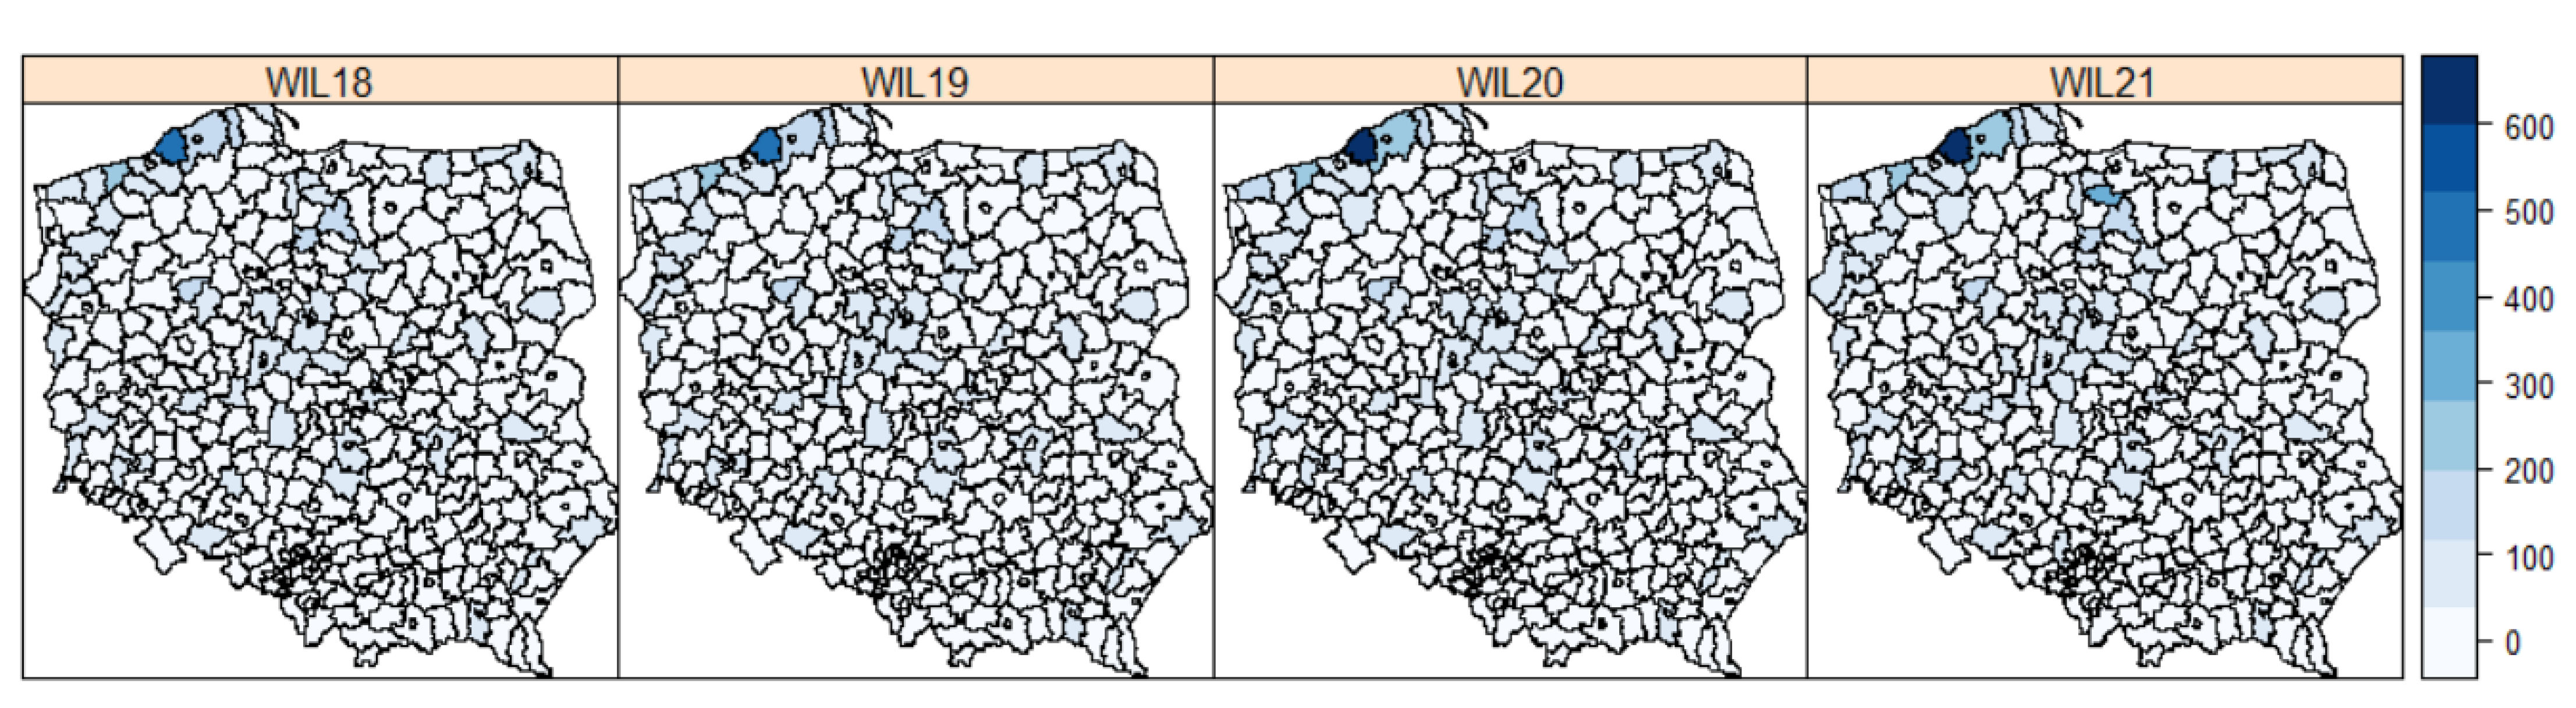
4.2. Changes in RES in Poland

The analysis of renewable energy sources (RES) in Poland at the poviat (LAU) level shows a heterogeneous distribution. This diversity results from geographical location, availability of natural resources, local politics, and the level of investment. In mountainous and coastal areas, the exploitation of RES is more significant than in other regions due to the favourable climate. Wind farms dominate in coastal areas, while hydropower plants are in the mountains.
In areas with high urbanisation, finding convenient locations to construct renewable energy installations is more complicated. Developing such projects requires cooperation between the public and private sectors and creating favourable investor conditions. Photovoltaic installations are distributed throughout Poland, although unevenly. The development of photovoltaic installations in poviats in Poland is in different phases, but in recent years a clear upward trend has been observed. Many private and state investors show interest in the construction of photovoltaic installations, which is the result of the falling costs of production of photovoltaic panels [49,51]. Figure 12 presents changes in the spatial differentiation of RES installation capacity by poviat (LAU) in 2018–2021 (Figure 12).
Figure 12 shows significant changes in the capacity of photovoltaic installations at the poviat level (LAU) in Poland, observed since 2018.
This year, the power of installations in poviats was limited to 12 MW. However, by 2020 this level had doubled. In 2018, the variation was small, with the overall capacity of installations at a very low level in most poviats. In the following years, however, we observe an apparent increase and a large diversity, evident in 2021. In some poviats in Poland, the development of photovoltaic installations is still at an early stage. These are poviats with a lower population density or those attracting little investor interest.
Figure 13 illustrates the RES capacity in the ten poviats with the highest installed capacity. Changes in capacity in the period from 2018–2021 are shown. In 2018, the maximum capacity of the installation was in Olsztyn poviat, amounting to 11.22 MW, and gradually increased to approximately 30 MW in 2021. The ranking for 2019 includes Zgorzelec poviat, which in 2018 did not have a registered RES PV installation, and in 2021 became the leader (68.64 MW). Excluding Zgorzelec poviat, the development of photovoltaic installation is very similar to that in 2018. However, the ranking list for the first ten poviats changed. Olsztyn and Biała poviats, leaders in 2018, maintain their positions. The ranking for 2020 also brought changes in the arrangement of poviats, but the leaders—the poviats of Zgorzelec, Ostrołęka, and Olsztyn—remained in the group of the first five. A similar situation was observed in the ranking for 2021, with one significant change –Turek poviat appeared, which in previous years had a very low RES PV capacity. The last ranking also shows the diversity in the arrangement of poviats—from very low power in 2018–2019 to increased power in 2021.
Developing renewable energy source (RES) installations based on hydropower is not as good as photovoltaic installations. The hydropower potential in Poland is lower than in other countries, such as Norway or Canada. Many Polish rivers are too small to allow the construction of large hydropower plants. In addition, investments in hydropower plants lead to significant changes in the natural environment, including river ecosystems and fauna, which harms local biodiversity. Hydropower installations are more expensive to build and maintain than photovoltaic installations, mainly due to infrastructural investments such as the construction of dams, hydropower plants, and energy distribution systems. The use of hydropower depends on weather conditions, such as the amount of rainfall or snowfall, which affect water availability and the energy potential of rivers. Despite the benefits of hydropower, the limitations mentioned above mean that its development is not as dynamic as in the case of photovoltaic installations, as shown in Figure 14.
Renewable energy source (RES) installations using wind energy are developing dynamically. Considerable wind potential is essential here, especially in the country’s north—mainly along the Baltic coast and in the northwestern part of Poland. Poland is estimated to have a wind energy potential of approximately 40 GW, making the country one of Europe’s largest wind energy markets. Many international energy companies have decided to build new wind farms in Poland. Figure 15 shows changes in the sector of RES installations using wind energy in the analysed period. Renewable energy using wind energy is concentrated mainly in the north of Poland, as illustrated in Figure 15. Based on the same figure, it can be seen that the increase in capacity occurs in the same counties.

5. Discussion and Conclusions

Studies have shown that the desired 20% share of RES in Poland’s energy balance will not be possible until 2030 with a large investment effort in obtaining geothermal, wind, hydro, and solar energy. The energy use of biomass and the development of the use of biofuels only slightly affect the reduction in atmospheric emissions of greenhouse and other gases. On the other hand, the development of energy extraction and use through the combustion of solid and liquid biomass, in addition to the introduction of new techniques for extracting energy from coal, can have a significant impact on improving the energy security of a country poor in natural gas and oil resources.
The increase in the share of renewable energy in the European energy system translates into reduced demand for energy generated from conventional sources. It leads to lower consumption of fossil fuels and limits their exploitation, contributing to environmental protection [23,52,53,54]. In terms of the share of energy from renewable energy sources in the overall energy mix, Iceland and Norway are at the forefront, with 99.6% and 113.6% shares of energy from RES in total electricity consumption. In the European Union, Austria (76.2% share of RES), Sweden (75.7%), and Denmark (62.6%) are in the lead. Portugal, Croatia, and Latvia generated more than half of their energy from renewables in 2021 [16,55,56,57,58]. Renewable energy sources are becoming more and more common due to the high prices of energy from fossil fuels and their limitation due to environmental protection, as well as the need for independence from external energy sources. The European Union authorities also use legal stimulation to force individual countries to increase the share of renewable energy sources in their energy mixes. The share of renewable energy is increasing throughout the European Union, including Poland. Differences between countries in this respect are minor. No country is reducing its share of renewable energy. Many similarities between Poland and its southern neighbours, Slovakia and Czechia, can be noticed. This similarity applies to both long-term and short-term changes. Principal component analysis suggests that Poland responds adequately to the European changes in the share of renewable energy in total energy consumption. In 2022, wind and solar energy accounted for 22% of the electricity production in the EU, ahead of the gas (20%) and coal (16%) sectors. Twenty EU countries have achieved their highest shares of electricity from the sun in their history. The leader was the Netherlands, which generated 14% of their energy from photovoltaic generation [59,60,61]. In 2020, energy production from photovoltaics was 3.5 times higher than in 2019. At the end of 2020, 137.2 GW of photovoltaic capacity was installed in the 27 EU Member States. Within 12 months, capacity increased by almost 19 GW, the best annual result since 2011 (an increase of 11%) [62]. A strong motivator for Polish prosumers, who produce electricity in home photovoltaic micro-installations, was favourable barter settlements with the energy supplier. The new system, called net billing, replaced the previous barter exchange between the prosumer and the power plant, weakening the prosumers’ enthusiasm for investing in PV panels and using government subsidy programs [63].
In 2022, Poland achieved its highest-ever electricity production, surpassing 175 TWh. The notable upsurge in electricity generation from wind and solar power installations (nearly 9 TWh higher in 2022 compared to 2021) effectively offset the decrease in output from gas and coal-fired power plants (down by 7 TWh in 2022 compared to 2021). This resurgence enabled Poland to regain its status as an electricity exporter after a span of several years. During the same year, photovoltaic power plants within Poland doubled their production, yielding almost 5 TWh more than the preceding year. Additionally, wind power plants contributed 4 TWh more to the overall production. Nonetheless, despite substantial investments targeted at environmental preservation, particularly in the domain of photovoltaics, RES constituted only 25% of Poland’s energy composition in 2022. Offshore and onshore wind farms possess the potential for an annual production capacity of 77 TWh, while photovoltaics can contribute up to 21 TWh. However, the advancement of RES, encompassing wind, hydropower, and photovoltaic sources, in Poland faces limitations posed by atmospheric and climatic shifts, geographical positioning, local policies, regulatory frameworks, and a restrained level of commitment towards investment.
An additional problem is the need for appropriate network infrastructure, such as power grids, transformer stations, and power stations, which hinders the distribution of renewable energy to consumers in some regions of Poland [64,65]. Nevertheless, renewables will become more and more popular in the future. A more liberal law on wind farms and more significant economic incentives in the case of photovoltaics will be helpful in the development of RES in Poland. Poland will then meet the requirements of the European Union and perhaps even exceed them. The target of a 20% share of renewable energy sources in Poland’s energy balance will be achievable in 2030. In the future, half of the energy demand in Poland may come from RES.
The shift toward renewable energy can lead to the creation of new industries, such as solar panel manufacturing, wind turbine installation, and bioenergy production. Workers in traditional energy sectors, such as coal, may face job displacement, requiring retraining and support to transition into new roles within the renewable energy sector [5]. Building and maintaining renewable energy infrastructure can stimulate local economies through investment in construction, transportation, and related sectors. Investing in renewable energy aligns with broader sustainability goals, potentially positioning regions for long-term economic growth that considers environmental and social well-being. However, successful transitions require the essential component of public support [66]. The affect heuristic exemplifies the manner in which emotional responses can systematically influence our evaluation of risks and benefits, potentially leading to biased or imbalanced judgments. Individuals who maintain a favourable disposition toward a specific technology are predisposed to assess the associated benefits as considerable and the risks as negligible. Conversely, those who hold an unfavourable attitude toward a specific technology are more apt to perceive the benefits as limited and the risks as pronounced. The affect heuristic could substantially influence how traditional and renewable energy sources are perceived. Specifically, individuals who regard hard coal mining as advantageous are inclined to downplay its adverse environmental effects and associated risks to personal safety. The more noticeable aspects of a technology, such as the low cost of hard coal and the economic value it provides to a community, may disproportionately shape perceptions, overshadowing the less tangible and perhaps more significant disadvantages. Overlooking the influence of cognitive biases such as the affect heuristic may impede transformations in the future and contribute to the ineffectiveness of numerous information campaigns [67].
Future studies may need to explore more than technological development and innovation, focusing on new renewable energy technologies, efficiency improvements, cost reductions, and energy storage solutions. Policy and regulation must also be examined, investigating current incentives, regulatory barriers, and proposing new frameworks if needed. Future research could focus on public perception, cognitive biases, social barriers, community-based projects, and public engagement strategies. Regional and local analyses could examine the renewable energy potential in different Polish regions, considering decentralized energy systems and local energy communities.

Author Contributions

Conceptualization, S.J., M.C., M.Z.-S., R.P., A.J.-T. and P.Z.; methodology, S.J., M.C. and R.P.; software, S.J., M.C., M.Z.-S., R.P., A.J.-T. and P.Z.; validation, S.J., M.C., M.Z.-S., R.P., A.J.-T. and P.Z.; formal analysis, S.J., M.C. and R.P.; investigation, S.J., M.C. and R.P.; resources, S.J., M.C., M.Z.-S., R.P., A.J.-T. and P.Z.; data curation, S.J., M.C., M.Z.-S., R.P., A.J.-T. and P.Z.; writing—original draft preparation, S.J., M.C., M.Z.-S., R.P., A.J.-T. and P.Z.; writing—review and editing, S.J., M.C., M.Z.-S., R.P., A.J.-T. and P.Z.; visualization, S.J., M.C., M.Z.-S. and R.P.; supervision, S.J., M.C., M.Z.-S., R.P. and P.Z.; project administration, S.J., M.C., M.Z.-S. and R.P.; funding acquisition, A.J.-T. All authors have read and agreed to the published version of the manuscript.

Funding

The publication of the paper was also co-financed by the Warsaw University of Life Sciences and Kazimierz Wielki University in Bydgoszcz (Poland).

Data Availability Statement

Not applicable.

Acknowledgments

This research was funded by Project Supporting Maintenance of Research Potential at Warsaw University of Life Sciences and Kazimierz Wielki University in Bydgoszcz (Poland).

Conflicts of Interest

The authors declare no conflict of interest.

Glossary

RES—Abbreviation for renewable energy sources.
National share of RES in gross final energy consumption—In line with the European Union’s Directive 2009/28/EC aimed at promoting the utilization of energy from renewable sources, an EU objective of attaining 27% of the Union’s gross final energy consumption from renewable energy sources by 2030 has been established. Each individual EU nation has committed to achieving their specific RES share targets. Over subsequent years, the EU’s goals for renewable energy have undergone revisions through successive directives. The EU-wide benchmark for the proportion of RES in gross final energy consumption for 2030 has been progressively raised to 32% in 2018, 40% in 2021, and 42.5% in 2023. In the context of this article, the percentages denoting the share of RES consumption in Poland pertain to the national portion of RES in gross final energy consumption, in alignment with the EU’s definition. The comprehensive national share of RES in gross final energy consumption encompasses the proportion of green energy within three key domains: (1) electricity, (2) heating and cooling, (3) transport.
Poviat (LAU)—A unit of local government and a secondary-level administrative division within the governance structure of Poland.

References

  1. Güney, T. Renewable energy, non-renewable energy and sustainable development. Int. J. Sustain. Dev. World Ecol. 2019, 26, 389–397. [Google Scholar] [CrossRef]
  2. Directive 2001/77/EC of European Parliament and of the Council of 27 September 2001 on the Promotion of Electricity Produced from Renewable Energy Sources in the Internal Electricity Market. Official Journal of the European Communities L.283/33. Available online: https://eur-lex.europa.eu/LexUriServ/LexUriServ.do?uri=OJ:L:2001:283:0033:0040:EN:PDF (accessed on 10 April 2023).
  3. Augutis, J.; Krikštolaitis, R.; Martišauskas, L.; Pečiulytė, S.; Žutautaitė, I. Integrated energy security assessment. Energy 2017, 138, 890–901. [Google Scholar] [CrossRef]
  4. Jezierska-Thöle, A.; Rudnicki, R.; Wiśniewski, Ł.; Gwiaździńska-Goraj, M.; Biczkowski, M. The Agri-Environment-Climate Measure as an Element of the Bioeconomy in Poland—A Spatial Study. Agriculture 2021, 11, 110. [Google Scholar] [CrossRef]
  5. Wang, J.; Geng, L.; Ding, L.; Zhu, H.; Yurchenko, D. The state-of-the-art review on energy harvesting from flow-induced vibrations. Appl. Energy 2020, 267, 114902. [Google Scholar] [CrossRef]
  6. European Commission. A New Industrial Strategy for Europe. Communication from the Commission to the European Parliament, the European Council, the Council, the European Economic and Social Committee and the Committee of the Regions; European Commission: Brussels, Belgium, 2020; Volume 102. [Google Scholar]
  7. Directive 2009/28/EC of the European Parliament and of the Council of 23 April 2009 on the Promotion of the Use of Energy from Renewable Sources. Available online: https://eur-lex.europa.eu/legal-content/EN/ALL/?uri=celex%3A32009L0028 (accessed on 4 October 2021).
  8. Komisja Europejska. Ramy polityczne na okres 2020–2030 dotyczące klimatu i energii. In Komunikat Komisji do Parlamentu Europejskiego, Rady, Europejskiego Komitetu Ekonomiczno-Społecznego i Komitetu Regionów; Komisja Europejska: Bruksela, Belgium, 2014. [Google Scholar]
  9. Transforming Our World: The 2030 Agenda for Sustainable Development. Available online: https://www.unfpa.org/resources/transforming-our-world-2030-agenda-sustainable-development (accessed on 4 October 2021).
  10. Pietzcker, R.C.; Osorio, S.; Rodrigues, R. Tightening EU ETS targets in line with the European Green Deal: Impacts on the decarbonization of the EU power sector. Appl. Energy 2021, 293, 116914. [Google Scholar] [CrossRef]
  11. Juściński, J. Perspektywy rozwoju Odnawialnych Źródeł Energii (OZE) w Polsce do 2020 roku. In [W] Odnawialne Źródła Energii w Świetle Globalnego Kryzysu Energetycznego; Wybrane problemy, red. F. Krawiec. Wydawnictwo; Difin: Warszawa, Poland, 2010; Volume 38. [Google Scholar]
  12. Zabed, H.; Sahu, J.N.; Suely, A.; Boyce, A.N.; Faruq, G. Bioethanol production from renewable sources: Current perspectives and technological progress. Renew. Sustain. Energy Rev. 2017, 71, 475–501. [Google Scholar] [CrossRef]
  13. Komisja Europejska. Europejski Zielony Ład. In Aneks do Komunikatu Komisji do Parlamentu Europejskiego, Rady Europejskiej, Rady, Komitetu Ekonomiczno–Społecznego i Komitetu Regionów; Komisja Europejska: Bruksela, Belgium, 2019. [Google Scholar]
  14. Gawlik, L.; Mirowski, T. Strategic directions of development of the Polish power sector in the light of climate and energy policy of the European Union. Humanit. Soc. Sci. 2016, 23, 49–62. [Google Scholar] [CrossRef]
  15. Emodi, N.V.; Chaiechi, T.; Beg, A.R.A. The impact of climate variability and change on the energy system: A systematic scoping review. Sci. Total Environ. 2019, 676, 545–563. [Google Scholar] [CrossRef]
  16. Bednarczyk, J.L.; Brzozowska-Rup, K.; Luściński, S. Determinants of the energy development based on renewable energy sources in Poland. Energies 2021, 14, 6762. [Google Scholar] [CrossRef]
  17. Jezierska-Thöle, A.; Gwiaździńska-Goraj, M.; Dudzińska, M. Environmental, Social, and Economic Aspects of the Green Economy in Polish Rural Areas—A Spatial Analysis. Energies 2022, 15, 3332. [Google Scholar] [CrossRef]
  18. Fadly, D.; Fontes, F. Geographical proximity and renewable energy diffusion: An empirical approach. Energy Policy 2019, 129, 422–435. [Google Scholar] [CrossRef]
  19. Dogan, E.; Seker, F. The influence of real output, renewable and non-renewable energy, trade and financial development on carbon emissions in the top renewable energy countries. Renew. Sustain. Energy Rev. 2016, 60, 1074–1085. [Google Scholar] [CrossRef]
  20. Filimonova, I.V.; Nemov, V.Y.; Komarova, A.V.; Mishenin, M.V.; Kozhevin, V.D. Relationship of renewable energy consumption to economic, environmental and institutional factors in Europe. Energy Rep. 2021, 7 (Suppl. S5), 358–365. [Google Scholar] [CrossRef]
  21. Brozyna, J.; Mentel, G.; Ivanová, E.; Sorokin, G. Classification of Renewable Sources of Electricity in the Context of Sustainable Development of the New EU Member States. Energies 2019, 12, 2271. [Google Scholar] [CrossRef]
  22. Caruso, G.; Colantonio, E.; Gattone, S.A. Relationships between renewable energy consumption, social factors, and health: A panel vector auto regression analysis of a cluster of 12 EU countries. Sustainability 2020, 12, 2915. [Google Scholar] [CrossRef]
  23. Pacesila, M.; Burcea, G.S.; Colesca, S.E. Analysis of renewable energies in European Union. Renew. Sustain. Energy Rev. 2016, 56, 156–170. [Google Scholar] [CrossRef]
  24. Brodny, J.; Tutak, M. Assessing sustainable energy development in the central and eastern European countries and analyzing its diversity. Sci. Total Environ. 2021, 801, 149745. [Google Scholar] [CrossRef] [PubMed]
  25. Global Trends in Sustainable Energy Investment in 2009: Analysis of Trends and Issues in the Financing of Renewable Energy and Energy Efficiency, United Nations Environment Programme and New Energy Finance. 2009. Available online: https://digitallibrary.un.org/record/688855?ln=en (accessed on 10 April 2023).
  26. Van Vuuren, D.P.; Stehfest, E.; Gernaat, D.E.; Doelman, J.C.; van den Berg, M.; Harmsen, M.; De Boer, H.S.; Bouwman, L.F.; Daioglou, V.; Edelenbosch, O.Y.; et al. Energy, land-use and greenhouse gas emissions trajectories under a green growth paradigm. Glob. Environ. Change 2017, 42, 237–250. [Google Scholar] [CrossRef]
  27. Chudy-Laskowska, K.; Pisula, T.; Liana, M.; Vasa, L. Taxonomic Analysis of the Diversity in the Level of Wind Energy Development in European Union Countries. Energies 2020, 13, 4371. [Google Scholar] [CrossRef]
  28. Papież, M.; Śmiech, S.; Frodyma, K. Determinants of renewable energy development in the EU countries. A 20-year perspective. Renew. Sustain. Energy Rev. 2018, 91, 918–934. [Google Scholar] [CrossRef]
  29. Igliński, B.; Buczkowski, R.; Cichosz, M.; Piechota, G.; Kujawski, W.; Plaskacz, M. Renewable Energy production in the Zachodniopomorskie Voivodeship (Poland). Renew. Sustain. Energy Rev. 2013, 27, 768–777. [Google Scholar] [CrossRef]
  30. Igliński, B.; Buczkowski, R.; Iglińska, A.; Cichosz, M.; Plaskacz-Dziuba, M. SWOT analysis of the renewable energy sector in Poland: Case study of Wielkopolskie region. J. Power Technol. 2015, 2, 143–157. [Google Scholar]
  31. Igliński, B.; Skrzatek, M.; Kujawski, W.; Cichosz, M.; Buczkowski, R. SWOT analysis of renewable energy sector in Mazowieckie Voivodeship (Poland): Current progress, prospects and policy implications. Environ. Dev. Sustain. 2022, 24, 77–111. [Google Scholar] [CrossRef]
  32. Jezierska-Thöle, A.; Rudnicki, R.; Kluba, M. Development of energy crops cultivation for biomass production in Poland. Renew. Sustain. Energy Rev. 2016, 62, 534–545. [Google Scholar] [CrossRef]
  33. Polityka Energetyczna Polski do 2030 Roku; Ministerstwo Gospodarki: Warszawa, Poland, 2009.
  34. Lund, H. Renewable energy strategies for sustainable development. Energy 2007, 32, 912–919. [Google Scholar] [CrossRef]
  35. Gaigalis, V.; Katinas, V. Analysis of the renewable energy implementation and prediction prospects in compliance with the EU policy: A case of Lithuania. Renew. Energy 2020, 151, 1016–1027. [Google Scholar] [CrossRef]
  36. Hills, J.M.; Michalena, E. Renewable energy pioneers are threatened by EU policy reform. Renew. Energy 2017, 108, 26–36. [Google Scholar] [CrossRef]
  37. Hansson, L.; Nerhagen, L. Regulatory measurements in policy coordinated practices: The case of promoting renewable energy and cleaner transport in Sweden. Sustainability 2019, 11, 1687. [Google Scholar] [CrossRef]
  38. Wurster, S.; Hagemann, C. Expansion of renewable energy in federal settings: Austria, Belgium, and Germany in comparison. J. Environ. Dev. 2020, 29, 147–168. [Google Scholar] [CrossRef]
  39. Gullberg, A.T.; Ohlhorst, D.; Schreurs, M. Towards a low carbon energy future–Renewable energy cooperation between Germany and Norway. Renew. Energy 2014, 68, 216–222. [Google Scholar] [CrossRef]
  40. ec.europa.eu/Eurostat. Available online: https://ec.europa.eu/eurostat/statistics-explained/index.php?title=Renewable_energy_statistics (accessed on 10 April 2023).
  41. stat.gov.pl. Available online: https://stat.gov.pl/obszary-tematyczne/srodowisko-energia/energia/energia-ze-zrodel-odnawialnych-w-2021-roku,10,5.html (accessed on 30 April 2023).
  42. are.waw.pl (Energy Market Agency SA). Available online: https://www.are.waw.pl/badania-statystyczne/wynikowe-informacje-statystyczne#2022-rok (accessed on 1 February 2023).
  43. ure.gov.pl (Energy Regulatory Office). Available online: https://www.ure.gov.pl/pl/oze/potencjal-krajowy-oze/5753,Moc-zainstalowana-MW.html (accessed on 5 February 2023).
  44. swiatoze.pl. Available online: https://swiatoze.pl/oze-w-polsce-w-2022-roku-podsumowanie-rynku-odnawialnych-zrodel-energii-i-elektromobilnosci/ (accessed on 5 February 2023).
  45. cire.pl. Available online: https://www.cire.pl/artykuly/o-tym-sie-mowi/kiedy-zniesienie-zasady-10-h-rynek-liczy-na-przyspieszenie-prac-legislacyjnych- (accessed on 20 March 2023).
  46. swiatoze.pl. Available online: https://swiatoze.pl/kategoria/oze/energia-wiatrowa/ (accessed on 20 March 2023).
  47. swiatoze.pl. Available online: https://swiatoze.pl/kategoria/oze/biogazownia/ (accessed on 20 March 2023).
  48. Dincer, I. Renewable energy and sustainable development: A crucial review. Renew. Sustain. Energy Rev. 2000, 4, 157–175. [Google Scholar] [CrossRef]
  49. Wicki, L.; Pietrzykowski, R.; Kusz, D. Factors Determining the Development of Prosumer Photovoltaic Installations in Poland. Energies 2022, 15, 5897. [Google Scholar] [CrossRef]
  50. Ramsay, J.O.; Silverman, B.W. Functional Data Analysis; Springer: Berlin/Heidelberg, Germany, 2005. [Google Scholar]
  51. Sahri, Y.; Belkhier, Y.; Tamalouzt, S.; Ullah, N.; Shaw, R.N.; Chowdhury, M.S.; Techato, K. Energy Management System for Hybrid PV/Wind/Battery/Fuel Cell in Microgrid-Based Hydrogen and Economical Hybrid Battery/Super Capacitor Energy Storage. Energies 2021, 14, 5722. [Google Scholar] [CrossRef]
  52. Kapłan, R.; Kopacz, M. Economic Conditions for Developing Hydrogen Production Based on Coal Gasification with Carbon Capture and Storage in Poland. Energ. Electron. J. 2020, 13, 5074. [Google Scholar]
  53. Niekurzak, M. The Potential of Using Renewable Energy Sources in Poland Taking into Account the Economic and Ecological Conditions. Energies 2021, 14, 7525. [Google Scholar] [CrossRef]
  54. Directive 2009/28/EC of the European Parliament and of the Council of 23 April 2009 on the Promotion of the Use of Energy from Renewable Sources and Amending and Subsequently Repealing Directives 2001/77/EC and 2003/30/EC (Text with EEA Relevance). Available online: https://eur-lex.europa.eu/legal-content/PL/TXT/?uri=celex%3A32009L0028 (accessed on 15 May 2022).
  55. Sebi, C.; Vernay, A.L. Community renewable energy in France: The state of development and the way forward. Energy Policy 2020, 147, 111874. [Google Scholar] [CrossRef]
  56. Khan, M.A.H.; Bonifacio, S.; Clowes, J.; Foulds, A.; Holland, R.; Matthews, J.C.; Percival, C.J.; Shallcross, D.E. Investigation of biofuel as a potential renewable energy source. Atmosphere 2021, 12, 1289. [Google Scholar] [CrossRef]
  57. Ministry of State Assets, Polityka Energetyczna Polski do 2040 r.—Strategia Rozwoju Sektora Paliwowo-Energetycznego, Warsaw, Poland. 2019. Available online: https://www.gov.pl/web/aktywa-panstwowe/zaktualizowany-projekt-polityki-energetycznej-polski-do-2040-r (accessed on 13 May 2023).
  58. Shahzad, U. The need for renewable energy sources. Energy 2012, 2, 16–18. [Google Scholar]
  59. European Commission. Green Paper on Greenhouse Gas Emissions Trading within the European Union; COM (2000) 87 final; European Commission: Brussels, Belgium, 2000. [Google Scholar]
  60. Bórawski, P.; Wyszomierski, R.; Bełdycka-Bórawska, A.; Mickiewicz, B.; Kalinowska, B.; Dunn, J.W.; Rokicki, T. Development of Renewable Energy Sources in the European Union in the Context of Sustainable Development Policy. Energies 2022, 15, 1545. [Google Scholar] [CrossRef]
  61. Olkuski, T. Analiza struktury produkcji energii elektrycznej we Francji i w Polsce. Polityka Energetyczna–Energy Policy J. 2013, 16, 143–155. [Google Scholar]
  62. solarpowereurope.org. Available online: https://www.solarpowereurope.org/ (accessed on 5 July 2023).
  63. swiatoze.pl. Available online: https://swiatoze.pl/moj-prad-podsumowanie-wszystkich-edycji/ (accessed on 5 July 2023).
  64. Communication from the Commission to the European Parliament, the Council, the European Economic and Social Commit-tee, and the Committee of Regions, Second Strategic Energy Review: An EU Energy Security and Solidarity Action Plan; COM (2008) 781 final; European Commission: Brussels, Belgium, 2008.
  65. Renewables in Global Energy Supply. An IEA Fact Sheet; International Energy Agency: Paris, France, 2002.
  66. energia.edu.pl. Available online: https://energia.edu.pl/energetyka-oparta-na-oze-wyzwania-i-perspektywy-w-nadchodzacych-latach/ (accessed on 5 July 2023).
  67. Zielonka, P.; Białaszek, W.; Dzik, B.; Wybrańczyk, K. How miners and other professional groups perceive the benefits and risks of hard coal mining: A study on the role of the affect heuristic. Front. Psychol. 2021, 12, 656960. [Google Scholar] [CrossRef] [PubMed]
Figure 1. Share of RES in gross final energy consumption in EU countries in 2021 (%). Source: own elaboration based on [40].
Energies 16 06431 g001
Figure 2. Share of RES in gross final energy consumption in Poland. Source: own elaboration based on [41].
Energies 16 06431 g002
Figure 3. Electricity production from RES in Poland (in GWh). Source: Calculated by the authors according to [41].
Energies 16 06431 g003
Figure 4. Scree plot: ( k , π k ) :   π k = λ k / l = 1 M λ l ,   k = 1 , 2 , 3 , 4 , 5 . Source: calculated by the authors.
Energies 16 06431 g004
Figure 5. Graph of the functions: ν 1 t —blue curve, ν 2 t —orange curve. Source: calculated by the authors.
Energies 16 06431 g005
Figure 6. Graph of function: G t continuous black line, exp ( τ k t ) = G t ν k C k t red minus signs, exp ( τ k + t ) = G t ν k C k t red plus signs, for the first component of the ( k = 1 ). Source: calculated by the authors.
Energies 16 06431 g006
Figure 7. Graph of the function: G t —continuous black line, exp ( τ k t ) = G t ν k C k t —red minus signs, exp ( τ k + t ) = G t ν k C k t —red plus signs, for the second component ( k = 2 ). Source: calculated by the authors.
Energies 16 06431 g007
Figure 8. Principal component diagram f i 1 , f i 2 : i = 1 , , N .). Source: calculated by the authors.
Energies 16 06431 g008
Figure 9. Map of European countries. The arrangement of colours corresponds to those in Figure 8. Source: calculated by the authors.
Energies 16 06431 g009
Figure 10. Hierarchical classification based on the method of complete combination with respect to distance x i x j 2 . Source: calculated by the authors.
Energies 16 06431 g010
Figure 11. Hierarchical classification based on Ward’s method in relation to distance   d x i , x j . Source: calculated by the authors.
Energies 16 06431 g011
Figure 12. Spatial variation in the capacity of RES installations using solar energy in Poland (LAU) from 2018–2021. Source: calculated by the authors.
Energies 16 06431 g012
Figure 13. Spatial variation in the capacity of RES installations using hydropower in Poland (LAU) in 2019–2021. Source: Calculated by the authors.
Energies 16 06431 g013
Figure 14. Spatial diversity of the capacity of RES installations using hydropower in Poland in 2019–2021. Source: Calculated by the authors.
Energies 16 06431 g014
Figure 15. Spatial diversity of capacity of RES installations using wind energy in Poland in 2018–2021. Source: calculated by the authors.
Energies 16 06431 g015
Table 1. Electricity from renewable energy prosumers fed into the distribution system operator’s grid.
Total Prosumers
of Renewable Energy
January–DecemberDynamic
Index (%)
20212022
MWh
2,670,208.7 5,534,767.5207.3
of which:hydro1856.9 1795.6 96.7
wind88.7 137.3 154.9
photovoltaic (PV)2,667,546.9 5,531,458.3 207.4
hybrid 269.1 386.9143.8
biogas339.6 792.3233.3
biomass107.6 197.1183.2
Disclaimer/Publisher’s Note: The statements, opinions and data contained in all publications are solely those of the individual author(s) and contributor(s) and not of MDPI and/or the editor(s). MDPI and/or the editor(s) disclaim responsibility for any injury to people or property resulting from any ideas, methods, instructions or products referred to in the content.

