Article

Optimal Configuration of Power/Thermal Energy Storage for a Park-Integrated Energy System Considering Flexible Load

1
School of Electrical Engineering, Shenyang University of Technology, Shenyang 110870, China
2
Key Laboratory of Wind Power Generation Technology of Liaoning Province, Shenyang University of Technology, Shenyang 110870, China
*
Authors to whom correspondence should be addressed.
Energies 2023, 16(18), 6424; https://doi.org/10.3390/en16186424
Submission received: 7 August 2023 / Revised: 30 August 2023 / Accepted: 1 September 2023 / Published: 5 September 2023
(This article belongs to the Section D: Energy Storage and Application)

Abstract

:
The park-integrated energy system can achieve the optimal allocation, dispatch, and management of energy by integrating various energy resources and intelligent control and monitoring. Flexible load participation in scheduling can reduce peak and valley load, optimize load curves, further improve energy utilization efficiency, and reduce system costs. Based on this, firstly, a flexible power-load model is established considering the translatable load, transferable load, and reducible load; and a thermal flexible load model is established based on the fuzziness of user perception of temperature in this study; then, the mixed integer linear programming method is adopted, and the sum of the carbon transaction cost, operation and maintenance cost, compensation cost, power purchase cost, gas purchase cost, wind and light abandonment penalty cost and investment cost of the system is minimized as the objective function, and the configuration of the integrated energy system is optimized, and the optimal capacity of each equipment and the output of each period are obtained. Finally, taking an industrial park in Liaoning Province of China as an example, the analysis is carried out. The example results show that by scheduling the flexible electrical load and flexibly adjusting the indoor temperature, renewable energy consumption can be promoted, and electricity load and heat-load curves can be optimized to increase the installed capacity of wind turbines, reduce the capacity of gas turbines, batteries, and heat-storage tanks, improve system economy, and improve the penetration rate of renewable energy.

1. Introduction

Considering that renewable energy leads the green and low-carbon transformation of global energy structure [1], the development of an integrated energy system with electric energy as its core plays a positive role in rationally optimizing the energy structure and effectively improving the efficiency of users [2,3]. As an energy interconnection terminal, the park-integrated energy system can not only provide full play to the comprehensive advantages of various energy sources and improve the utilization rate of new energy, but also increase the large-scale utilization of new energy [4]. In the integrated energy system, customers have multiple options to fulfill their energy demand [5,6]. Therefore, the park-integrated energy system has been vigorously developed in countries around the world. In Denmark, the integrated energy-combined heat and power (CHP) system covers about 40% of the demand for space heating [7]. In northern China, the park-integrated energy system based on the combined heat and power storage is distributed in more than 100 cities [8]. Among them, the energy storage system is an indispensable basic cell of the park-integrated energy system, which can realize the rational configuration and efficient and high-quality operation of the park-integrated energy system, and further meet the multi-energy demand of users with reliability, cleanliness and efficiency [9,10].
With in-depth research of the park-integrated energy system, experts and scholars found that flexible load has significant flexibility to mobilize, which has a positive effect on alleviating the contradiction between energy supply and demand and effectively improving the utilization rate of renewable energy [11,12]. In reference [13], the electric boiler is used to decouple the cogeneration unit, and the bi-objective optimization scheduling model is constructed with the minimum power generation cost and the minimum carbon transaction cost on the system side as the objective function. It is proved that the flexible electric load can effectively reduce the abandoned air volume and carbon transaction cost of the system. In reference [14], an optimal scheduling model, including flexible load participation, was established with the minimum comprehensive cost of the system as the optimization objective, and the CPLEX solver was used to optimize it. Reference [15] establishes a demand response strategy model for all transferable flexible load equipment in residential buildings under time-of-use electricity price, and uses a mixed integer nonlinear optimization method to solve the model. In addition, the strategy also considers the user‘s comfort when the load is transferred. Reference [16] builds an equivalent thermal resistance model considering the relationship between human comfort and cooling and heating load power. Reference [17] optimizes the demand response model of intelligent residential load from the aspects of maximum user comfort, user electricity cost and maximum peak reduction. The maximum optimization of user comfort is calculated by the Wind-driven Optimization algorithm, and the optimization of user electricity cost and peak reduction is solved by the Min-max Regret-based Knapsack Problem algorithm. Taking the maximum consumption of renewable energy and the minimum overall economy of the system as the optimization objectives, a multi-objective configuration model including source/network/load/storage collaborative optimization is established in reference [18]. It is proved that the participation of flexible load effectively reduces the number of units of energy storage devices. Reference [19] proposes to adjust the flexible load and the output of the unit by using particle swarm optimization to realize the exchange and interaction between supply and demand of the system. Reference [20] sets the priority of power generation equipment, energy storage equipment and flexible load operation, and constructs a multi-objective optimal operation strategy, including energy storage system and flexible load, with the goal of maximizing the utilization rate of renewable energy, minimizing network loss and maximizing customer satisfaction. References [21,22] carried out a detailed demand response modeling and overall optimal scheduling of heating, ventilation and air conditioning (HVAC), battery energy storage system, electric vehicle and transferable load equipment in a residential building. Reference [23] established a bi-level optimal configuration model with the goal of economical operation and minimum investment cost of the system. Finally, the case analysis proves that the participation of flexible load can not only avoid the redundancy of unit capacity, but also further improve the operation economy and energy utilization efficiency of the system. Based on the forecast error value of flexible load, an optimal dispatching model, considering pollutant emission cost and abandoned wind cost, is established in reference [24], which proves that considering the participation of flexible load can reduce the comprehensive cost of the system and realize the low-carbon operation of comprehensive energy.
Through the research of experts and scholars, it is shown that the participation of flexible load in park-integrated energy system scheduling can effectively improve the environmental and economic benefits of the corresponding scheduling system, but the research focuses on the optimization of system scheduling, ignoring the impact of flexible load on energy storage configuration to some extent.
In view of this, a method for establishing the optimal configuration model of the park-integrated energy system’s electric energy storage equipment is proposed, which takes the minimum sum of system carbon transaction cost, operation and maintenance cost, compensation cost, electricity purchase cost, gas purchase cost, wind and light abandonment penalty cost and investment cost as the objective function. Compared with the existing research work, the innovations and contributions of this study are as follows:
(1)
Considering the coordinated interaction of “source-network-load-storage” and the coordinated linkage of flexible load “leveling-rotation-elimination”, a flexible load model for electric power and a flexible load model for thermal power based on the fuzziness of users’ temperature perception is proposed.
(2)
Using a mixed integer linear programming method, the optimal configuration scheme of the park-integrated energy system’s energy storage under specific constraints is provided, which realizes the consideration of the optimal capacity of equipment and the output benefit in each period to a certain extent.
(3)
The response characteristics of multi-scenario and multi-category electrothermal flexible loads participating in the optimal allocation of the park-integrated energy system’s energy storage are analyzed and compared, and the causes of energy supply/consumption and cost deviation in each scenario are deeply analyzed through an example, which verifies the rationality and effectiveness of the proposed scheme.

2. Framework of Park-Integrated Energy System

The structure of the combined heat and power storage system designed in this study mainly includes four parts: energy supply side, energy conversion system, energy storage system and load side. The energy supply side includes wind power, photovoltaic and other renewable energy power generation and a large power grid; the energy conversion system comprises a heat pump and a gas turbine; the energy storage system includes a power storage device and a heat storage device; and the load side includes electrical load and thermal load. The energy production, conversion, flow direction and consumption in the multi-energy system are shown in Figure 1.
The electrical load in the CHP system is met by the power grid, photovoltaic generators, wind turbines, gas turbines and storage devices. The heat load is satisfied by the gas turbine, heat pump and heat storage device. At the customer level, the heat network is connected to the central heating system of the dwellings via pipelines [25]. The energy storage system is equipped to meet the demand of residents for electric heating load, and at the same time, it can store electric energy and heat energy during the low electricity price period, and release it during the peak period of electricity consumption. In this way, it not only achieves the transformation of electric energy and heat energy in energy form, but also makes it transfer at the time level [26,27].
Since the multi-energy system includes many devices with different technical parameters and inconsistent energy demand and utilization characteristics, it is necessary to analyze the operating characteristics of various devices separately and model them when optimizing the scheduling of the system.

3. Flexible Load Modeling Methods

3.1. Electric Flexible Load Model

3.1.1. Transferable Load

The transferable load can be adjusted flexibly within the transfer time interval, and there is no requirement for continuity. However, it is necessary to ensure that the electricity consumption in a dispatching period remains unchanged. The specific condition to be met is [28]
t = 1 T L t t r a n s P t t r a n s = 0
where L t t r a n s is the transferable load power in the period t before optimization, and P t t r a n s is the transferable load power of the optimized period t.
During the load transfer, the economic compensation expenses to be paid to the residents according to relevant agreements is
C t r a n s = C p r i c e t r a n s t = t tr t tr + P t t r a n s Δ t
where C p r i c e t r a n s is the compensation price per unit of power, and C t r a n s is the total amount of household economic compensation costs after load transfer.
When the transfer occurs, the transfer amount constraint should be satisfied as
  v t P m i n t r a n s P t t r a n s v t P m a x t r a n s
τ = t t = t m i n t r a n s 1 v τ t m i n t r a n s v t v t 1
t = t t r , t t r , t t r + t m i n t r a n s + 1
where P m a x t r a n s , P m i n t r a n s are upper and lower limits of power after load transfer, v t judges whether the load is transferred, which is represented by 0–1, and when it is 1, it means that the load is transferred; and t m i n t r a n s is the minimum continuous running time.

3.1.2. Translational Load

The power consumption time of the translatable load is continuous and the working time is fixed. Assuming that the initial translation time is τ and the translatable period is t s h ,   t s h + , the constraint conditions for its duration should be as follows when the power consumption time is continuous [29]:
t = τ τ + t s 1 y t = t s
where y t is 0 or 1, which is used to judge the translation of load. When y t = 0 , translation does not occur, and when y t = 1 , translation t occurs.
When the load shifts to the period t, the corresponding load power of P t s h i f t is
P t s h i f t = y t L s h i f t
where L s h i f t is the rated power of the translatable load. When the load shifts, the economic compensation fee for users is shown in the following formula:
C s h i f t = C p r i c e s h i f t t = t s h t s h + t s + 1 P t s h i f t Δ t
where C p r i c e s h i f t represents the compensation cost to the user when the load is shifted on the unit power; and C s h i f t is the total amount of household economic compensation expenses when the load is shifted.

3.1.3. Reducible Load

Based on ensuring the basic electricity consumption of users, the load can be partially, or even completely, reduced according to the needs, and the reduced load refers to the reducible load.
The power in the period t before load reduction is represented by L t c u t , and the reducible power in the period t after load reduction is represented by P t c u t , and the formula is as follows [29]:
P t c u t = 1 u t α L t c u t
where L t c u t is the load that can be reduced before optimization, and α is the reduction factor; u t is the sign of load reduction with values of 0 and 1.
The compensation fee is
C c u t = C p r i n t c u t t = 1 T u t α L t c u t Δ t
where C p r i n t c u t represents the compensation cost for users when load reduction is carried out on unit power; C c u t is the total amount of economic compensation cost for users after load scheduling.
The load reduction needs to meet the following constraints:
(1)
The maximum duration constraint is
τ = t t + t m a x c u t ( 1 u τ ) 1
t = 1 , 2 , 3 , , T t m a x c u t
(2)
The minimum duration constraint is
τ = t t + t m i n c u t 1 u τ t m i n c u t u t u t 1
t = 1 , 2 , 3 ,   ,   T t m i n c u t + 1

3.2. Thermal Flexible Load

The thermal flexible load can respond to the demand in coordination with the electric flexible load, and the demand response of the thermal flexible load is regulated within the temperature range that the human body feels comfortable with. Because it has little influence on the user’s thermal experience, it is unnecessary to compensate the user when responding to the demand.
Through the analysis of the temperature change characteristics of the heating system, the specific models of indoor and outdoor temperatures are shown in Formulas (12) and (13) [30]:
T t h = j = 0 J   α j T t j h + j = 0 J   β j T t j g + j = 0 J   γ j T t j w
T t n = j = 0 J   θ j T t j h + j = 0 J   ϕ j T t j g + j = 0 J   ω j T t j w
where T t g and T t h represent the water supply and backwater temperatures; T t n and T t w represent indoor and outdoor temperatures; J represents the model order; α j ,   β j ,   γ j ,   θ j , ϕ j and ω j represent thermal inertia physical parameters.
Indoor temperature is mainly related to the change in heating power and outdoor temperature and the specific relationship is shown in Formula (14):
T t + 1 n = T t n e Δ t r + Z Q t l + T t w 1 e Δ t r
where Z represents the equivalent thermal resistance of the building; Q t l represents the heating power of the heating system; and Δ t represents the scheduling duration.
In order not to affect the thermal comfort of users, the change of indoor temperature should be controlled within the comfortable range of the human body, and the specific constraint conditions is shown in Formula (15):
T m i n n T t n T m a x n
where T m i n n and T m a x n represent the upper and lower limits of the comfortable temperature range of the human body.

3.3. Energy Conversion System Model

3.3.1. Heat Pump

Heat pump is an efficient energy-saving equipment in the integrated energy system. It can convert low-grade heat energy into high-grade heat energy by consuming electric energy. Its mathematical model is as follows [31]:
H t H P = η H P P t H P
where H t H P represents the thermal power output by the heat pump in the time period t; P t H P represents the electric power consumed by the heat pump in the time period t; and η H P represents the heating coefficient.
The constraint condition of heat pump power transmission is as follows:
P m i n E P t E P m a x E
where P m i n E and P m a x E are the lower and upper limits of the output power of device E, respectively.

3.3.2. Gas Turbine

A gas turbine is a common power generation equipment in integrated energy systems. It generates electricity and heat energy simultaneously by burning natural gas. The mathematical model of thermoelectric relationship is [32]
H t G T = P t G T 1 η G T η L η G T
where H t G T represents the residual heat of flue gas of gas turbine in time period t; P t G T represents the power generation of the gas turbine in the time period t; η G T represents the power generation efficiency of the gas turbine; and η L represents the loss rate.
The constraint conditions of gas turbine output power are the same as those of heat pump output power
P m i n E P t E P m a x E
where P m i n E and P m a x E are the lower and upper limits of the output power of the device E, respectively.

3.3.3. Energy Storage Equipment

Energy storage can effectively stabilize the fluctuation of load, reduce wind and light abandonment, and improve the flexibility of the system. The dynamic mathematical model of energy storage is as follows [33]:
S t E = 1 σ E S t 1 E + P E ,   t c η E c P E ,   t r η E r Δ t
where S t E is the stored energy of the energy storage device E in the time period t; σ E is the consumption rate; P E ,   t c and P E ,   t r are the charging and discharging power of the energy storage device E in the time period t, respectively; and η E c and η E r are the charging and discharging efficiencies of the energy storage device E, respectively.
Constraints of energy storage equipment are as follows:
(1)
The energy storage state constraint is
S E m i n   S E t S E m a x  
where S E m i n represents the minimum energy storage state of the energy storage device E; and S E m a x represents the maximum energy storage state.
(2)
The operational characteristics are constrained as follows:
0 P E ,   c t P E ,   c ,   m a x S     ε E ,   c t 0 P E , dis t P E ,   r ,   m a x S E ,   r t ε E ,   r t ε E ,   c t + ε E ,   r t 1
where P E ,   c ,   m a x S , P E ,   r ,   m a x S represents the maximum charging and discharging power of the energy storage device E. ε E ,   c t and ε E ,   r t represent 0–1 variables of the charging and discharging state of the energy storage device E.

4. Optimal Allocation Model of Energy Storage

4.1. Objective Function

In this chapter, the overall economy of the park-integrated energy system is mainly considered in the optimal allocation model of the park-integrated energy system, and its optimization objectives include system investment cost C i n v , equipment maintenance cost C c o m , electricity purchase cost C b u y ,   e , gas purchase cost C b u y ,   g a s , compensation cost C o m , and carbon transaction cost C c o 2 ; Considering the consumption of new energy, the penalty cost C w of abandoning wind and light is added to the optimization objective, and the overall objective function can be expressed as
m i n   C 1 = C i n v + C o m + C b u y ,   e + C b u y ,   g a s + C c o m + C c o 2 + C w
The energy balance constraint of energy cost should be considered in the energy storage optimal allocation model with the goal of overall economic optimization, and a feasible optimization area should be constructed for the optimization solution.
The energy balance constraint conditions of energy cost are as follows:
The power balance constraint is
P b u y ,   e t + P G T t + P W T t + P E E S ,   r t P E E S ,   c t P H P t = P l o a d t
where P G T t is the power generated by the gas turbine in the time period t; P W T t is the power generated by wind power in the time period t; P H P t is the electric power consumed by the heat pump in time period t; and P E E S ,   r t and P E E S ,   c t indicate the discharging/charging power of the battery in time period t.
P l o a d t = P f i x t + P s h i f t t + P t r a n s t + P c u t t
where P l o a d t represents the total electrical load in t time period; P f i x t represents the fixed electrical load in t period, which is not involved in translation, transfer and reduction; P s h i f t t represents the shiftable electrical load; P t r a n s t represents transferable electrical load; and P c u t t represents that the electric load can be reduced.
H t H P + H t G T + P T E S ,   r t P T E S ,   c t = Q l o a d t
Q l o a d t = Q k o n g r e t + Q r e s h u i t
where H t H P represents the thermal power output of the heat pump at time t; H t G T represents the flue gas waste heat of t gas turbine in the time period; P T E S ,   r t represents the heat release power; P T E S ,   c t represents the heating power; Q l o a d t represents the total heat load in t time period; Q r e s h u i t represents the hot water load in t time period; and Q k o n g r e t represents the space heat load.

4.1.1. Electricity Purchase Cost and Gas Purchase Cost

C b u y ,   e = t = 1 T   λ p g t P b u y ,   e t
C b u y ,   g a s = t = 1 T   λ n g t P b u y ,   g a s t
where λ n g t represents the price of natural gas per cubic meter at t; λ p g t represents the electricity price when t; P b u y ,   e t represents the power purchase when t; and P b u y ,   g a s t represents the natural gas purchase amount at t.
The constraint conditions of purchasing power are as follows.
Due to the uncertainty of wind and solar output power, there may be a power shortage during system operation. In order to ensure the stable operation of the system, it is set that the park system can purchase energy from the superior power grid when the wind and solar output power is small and the load power is large. However, in order to prevent the impact of wind and solar power generation on the power grid, the scenario of the park selling energy to the power grid is not considered in this chapter. The specific constraints are as shown in Formula (33):
0 P b u y ,   e t P G r i d m a x
where P G r i d m a x represents the upper limit of the purchase power of the superior power grid.
The purchase of natural gas power constraint is
0 P g a s ,   b t P g a s m a x
where P g a s ,   b t represents the gas purchase power from the natural gas network at time t, and P g a s m a x represents the upper limit of the available gas power of the natural gas network.

4.1.2. Equipment Maintenance Cost

The maintenance cost of equipment mainly includes the expenses generated by the operation of photovoltaic, wind power, gas turbine, electric boiler, and energy storage equipment.
C c o m = t = 1 T   j   c j c o m P j t
where c j c o m represents the unit maintenance cost of equipment j, and P j t represents the output of equipment j at t.
The upper and lower limit constraint of equipment output is
P j ,   m i n   P j t P j ,   m a x  
where P j ,   m a x   and P j ,   m i n   are indicated as the upper/lower limit of the output power of the device j.

4.1.3. Cost of Investment

C v n v = j   C j ,   v n v w j R j
R j = r ( 1 + r ) N j ( 1 + r ) N j 1
where C j ,   i n v represents the installation cost per unit capacity of equipment j ; w j denotes the installed capacity of the device j ; R j denotes the investment recovery coefficient of the equipment j ; r represents the discount rate, taking 6.7%; N j indicates the service life of the equipment j .

4.1.4. Compensation Cost

C o m = C s h i f t + C t r a n s + C c u t
where C o m represents the total cost of compensation;   C s h i f t represents the translational load compensation cost; C t r a n s represents the transferable load compensation cost; C c u t represents that the reducible load compensation cost.

4.1.5. Abandoning Wind and Light Cost

C w = β P W T ,   r t + P p v ,   r t P W T t P p v t
where β is the penalty factor of abandoning wind and light; P W T ,   r t is the predicted output of the fan; P p v ,   r t is the predicted output of photovoltaic, and P W T t is the actual output of the fan; P p v t is the actual output of photovoltaic.
The wind power and photovoltaic constraints are
0 P W T t P W T ,   r t
0 P p v t P p v ,   r t

4.1.6. Carbon Transaction Cost

Carbon trading is a trading mechanism to buy and sell carbon emission rights in the market. Assuming that the government issues a certain amount of carbon emissions to carbon emission sources when the carbon emissions exceed the quota, the excess should be purchased from the trading market; if the quota is surplus, it can also be sold in the market. Under such a market transaction, the carbon emission source will take some measures for its benefit to save energy and reduce greenhouse gas emissions.
Under the carbon trading mechanism, the calculation of carbon trading cost C C O 2 is shown in Formula (22):
C C O 2 = C t E o u t E a l l
where C C O 2 is positive, indicating that carbon emissions are excessive and the quota must be purchased in the market, and C C O 2 is negative, indicating that the quota is surplus and can be sold; C t represents the market price of carbon trading on that day; E o u t stands for carbon emissions; and E a l l stands for the carbon emission quota provided by the government.
There will be carbon emissions in the process of energy production, transportation, and use. This study proposes a two-stage method to measure the carbon emissions when the system is running:
E o u t = i = Ω   c i p r e + c i r u n P i
where Ω represents a collection of energy equipment, including energy storage equipment and energy supply equipment; c i p r e represents the carbon emission coefficient of energy equipment in the production and transportation stage in g/(kWh); c i r u n represents the carbon emission coefficient of energy equipment in the energy use stage, in g/(kWh); and P i represents the use power of energy equipment.

4.2. Solving Method

The optimal configuration model of power/thermal energy storage for the park-integrated energy system considering flexible load is a 0–1 mixed-integer nonlinear programming model. The standard form of the model is
min f x s . t .   z i x = 0   i = 1 , 2 , 3 , , m     y i x 0   j = 1 , 2 , 3 , , n   x m i n x x m a x   x k 0 ,   1
where f x is the objective function; x is the variable to be optimized; z i x = 0 is an equality constraint; y i x 0 is an inequality constraint; and x m a x and x m i n are the upper and lower limits of the variables, respectively. x k is a state variable; m and n are the number of equality constraints and inequality constraints, respectively.
Aiming at the above model, in the Matlab environment, this study uses Yalmip to model and uses the commercial solver Cplex to solve.

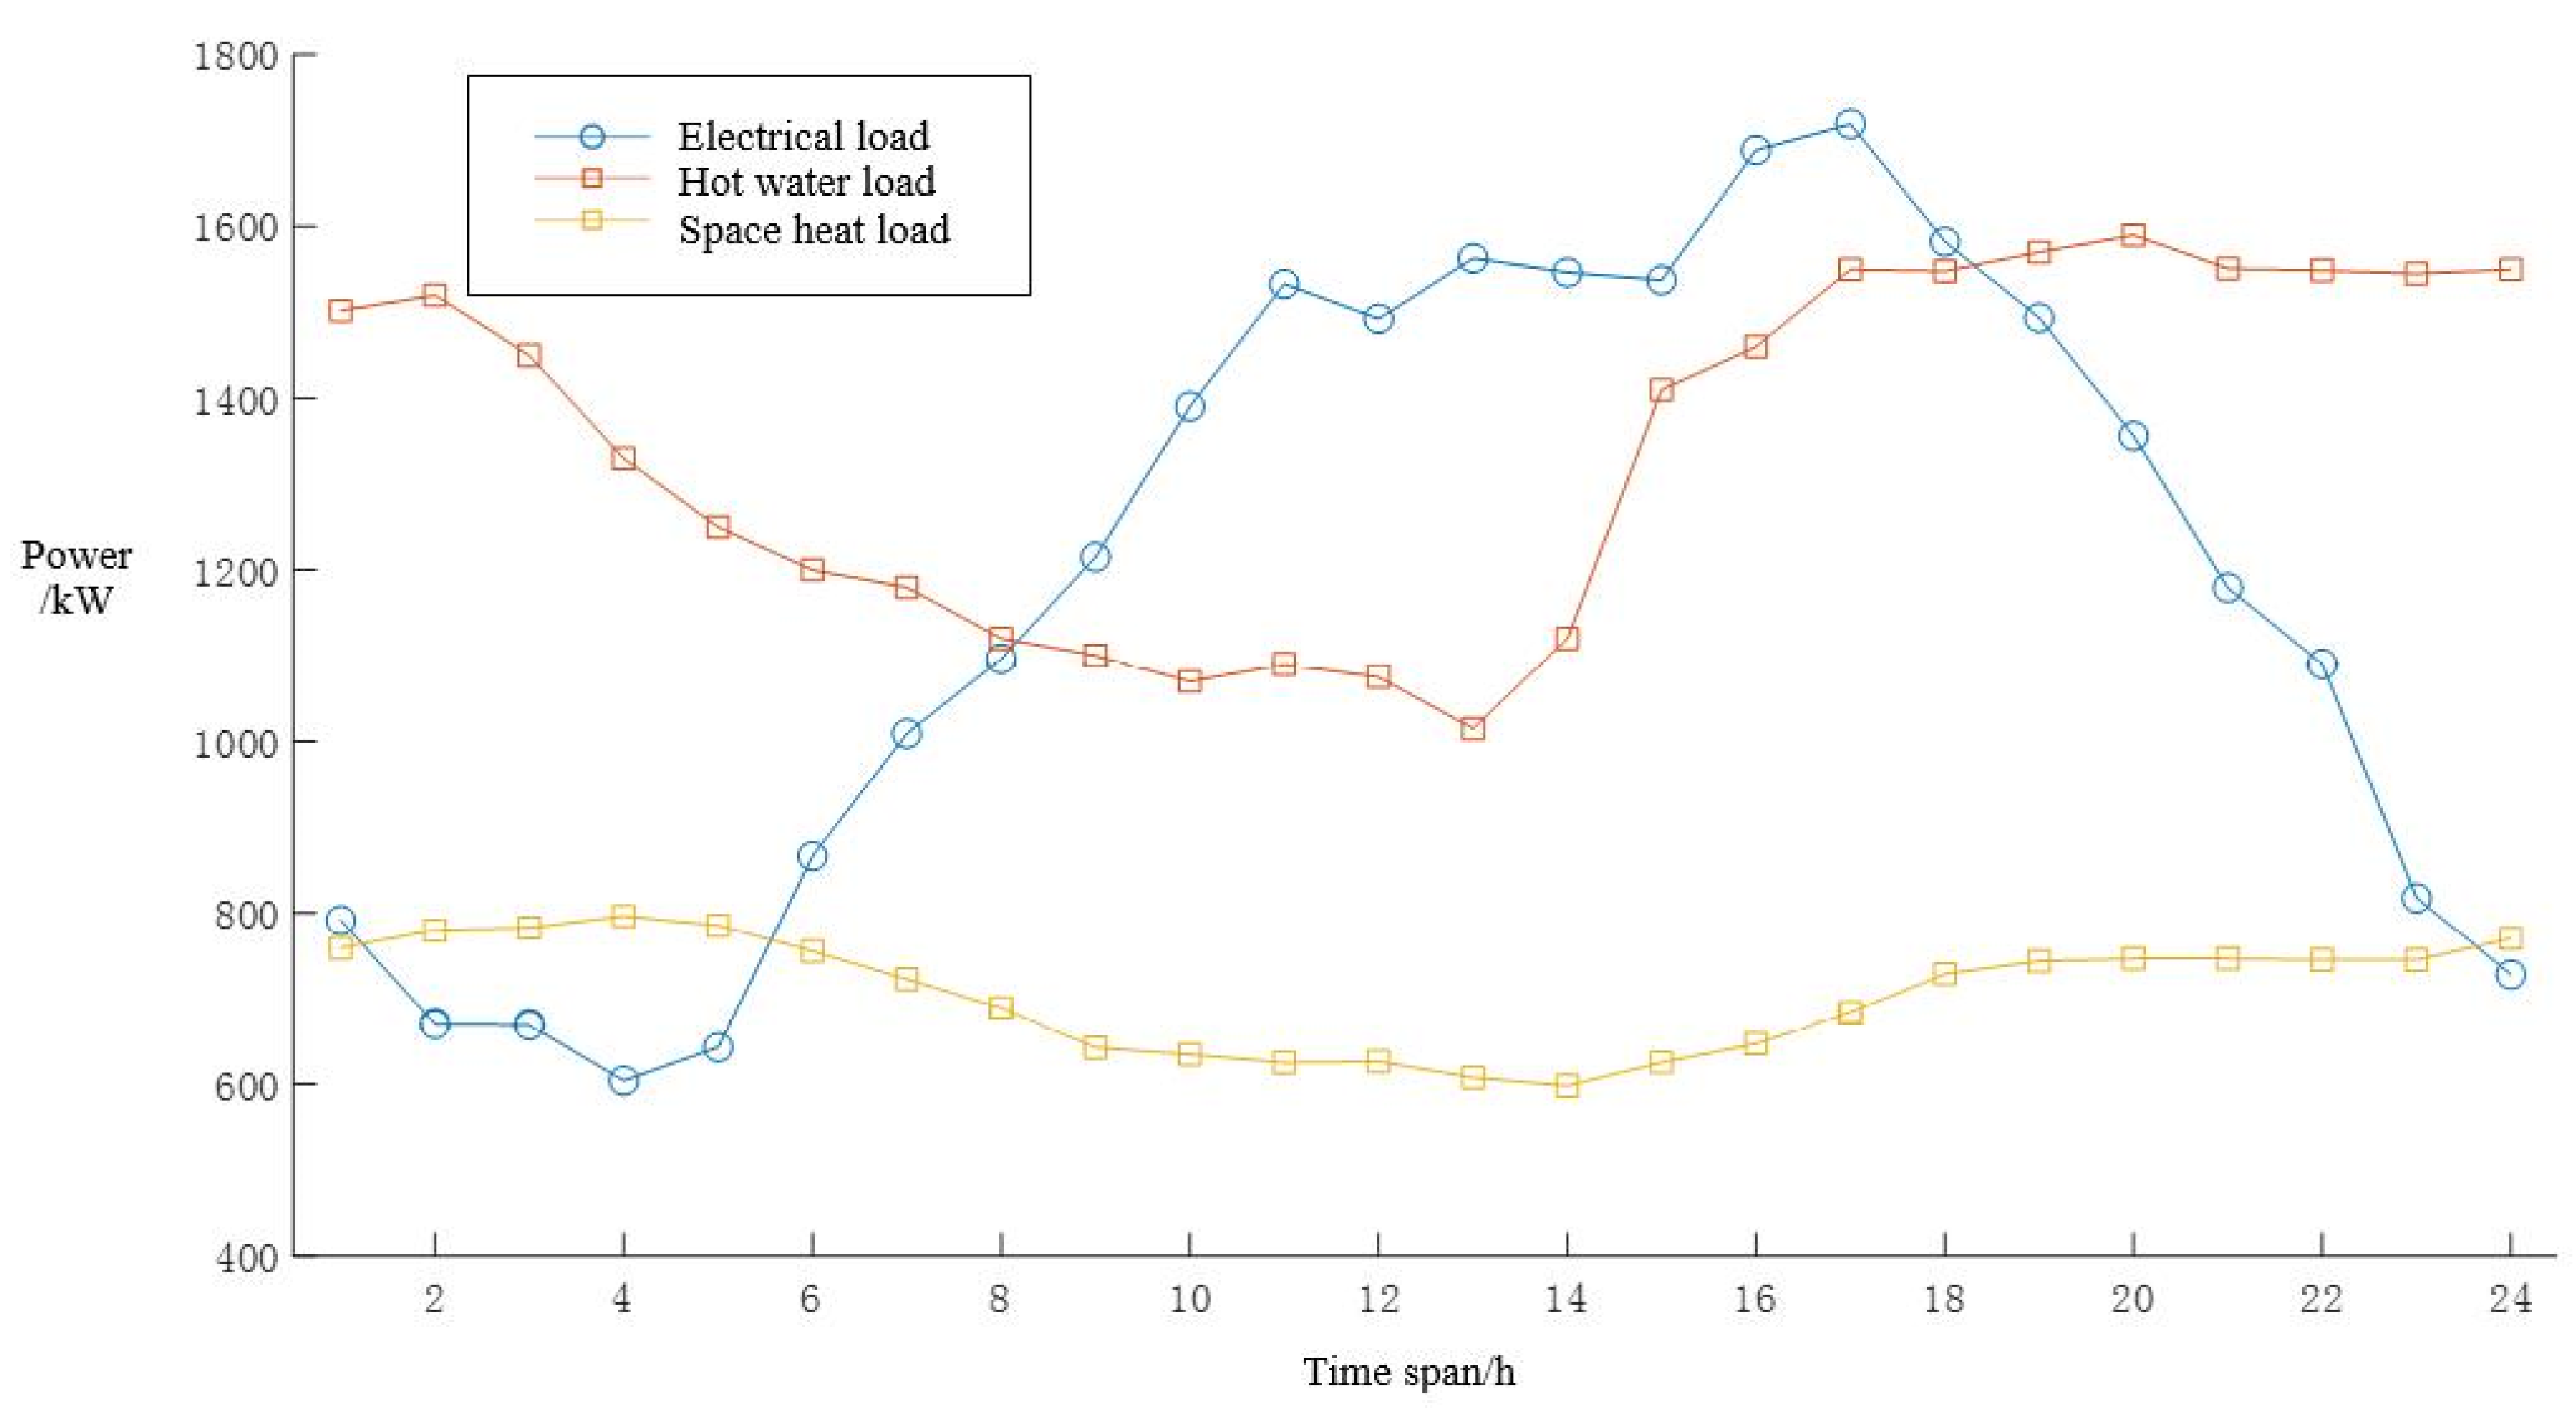
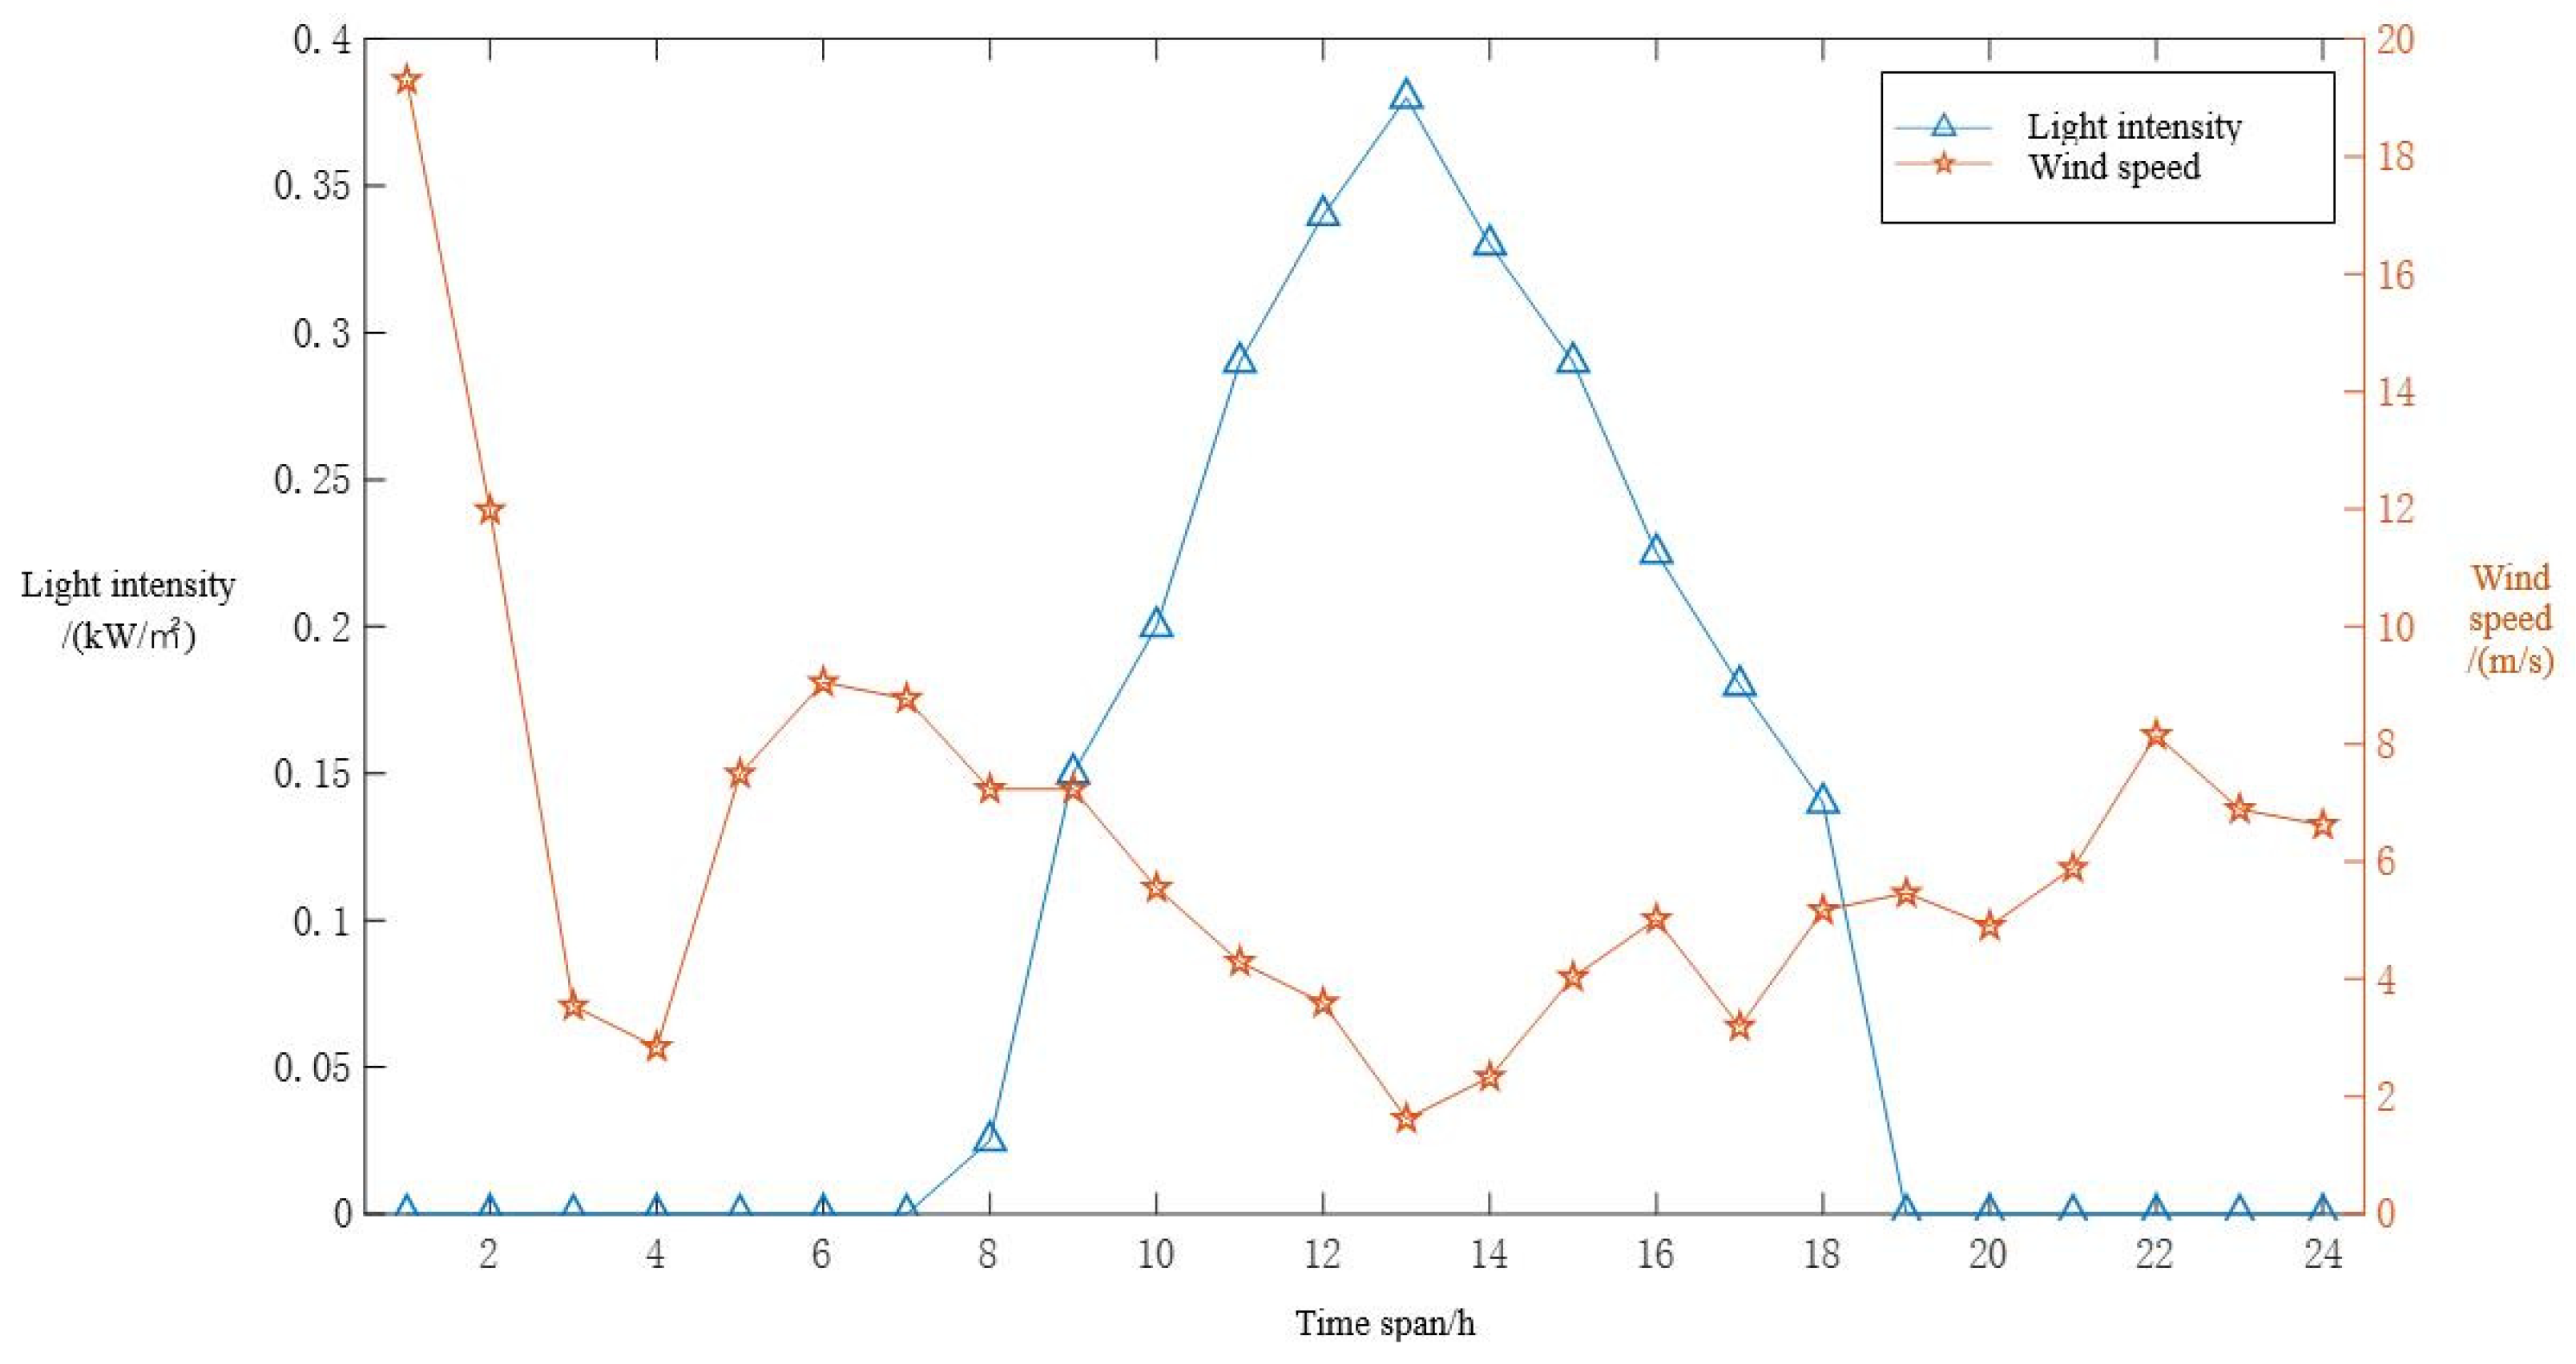
5. Example Analysis Results and Discussion

An industrial park in Liaoning Province of China is chosen as the research object of this study. At present, wind turbines, photovoltaic equipment, gas turbines, and electric boilers have been installed in the industrial park, and the equipment that needs to be newly equipped includes storage batteries and heat-storage devices. Due to the limited space of the study, only the operation of the park in the winter heating season is considered in this study. When taking 24 h as a scheduling cycle and 1 h as a unit, see Table 1 for the operating parameters of the park-integrated energy system. The time-of-use electricity price of the park is shown in Table 2. The predicted output power of electric and thermal loads is shown in Figure 2. The curve prediction of light intensity and wind speed in this area is shown in Figure 3.
To verify the advantages of considering the participation of flexible electric heating loads in response during the capacity optimization configuration stage, four scenarios were set up for comparative analysis. The scene settings are as shown in Table 3.
Scenario 1: Does not include energy storage equipment;
Scenario 2: Including energy storage equipment without considering the participation of electrical and thermal flexible loads;
Scenario 3: Including energy storage equipment, considering the participation of flexible electrical loads;
Scenario 4: Including energy storage equipment, considering the participation of electrical and thermal flexible loads.

5.1. Flexible Load Optimization Results

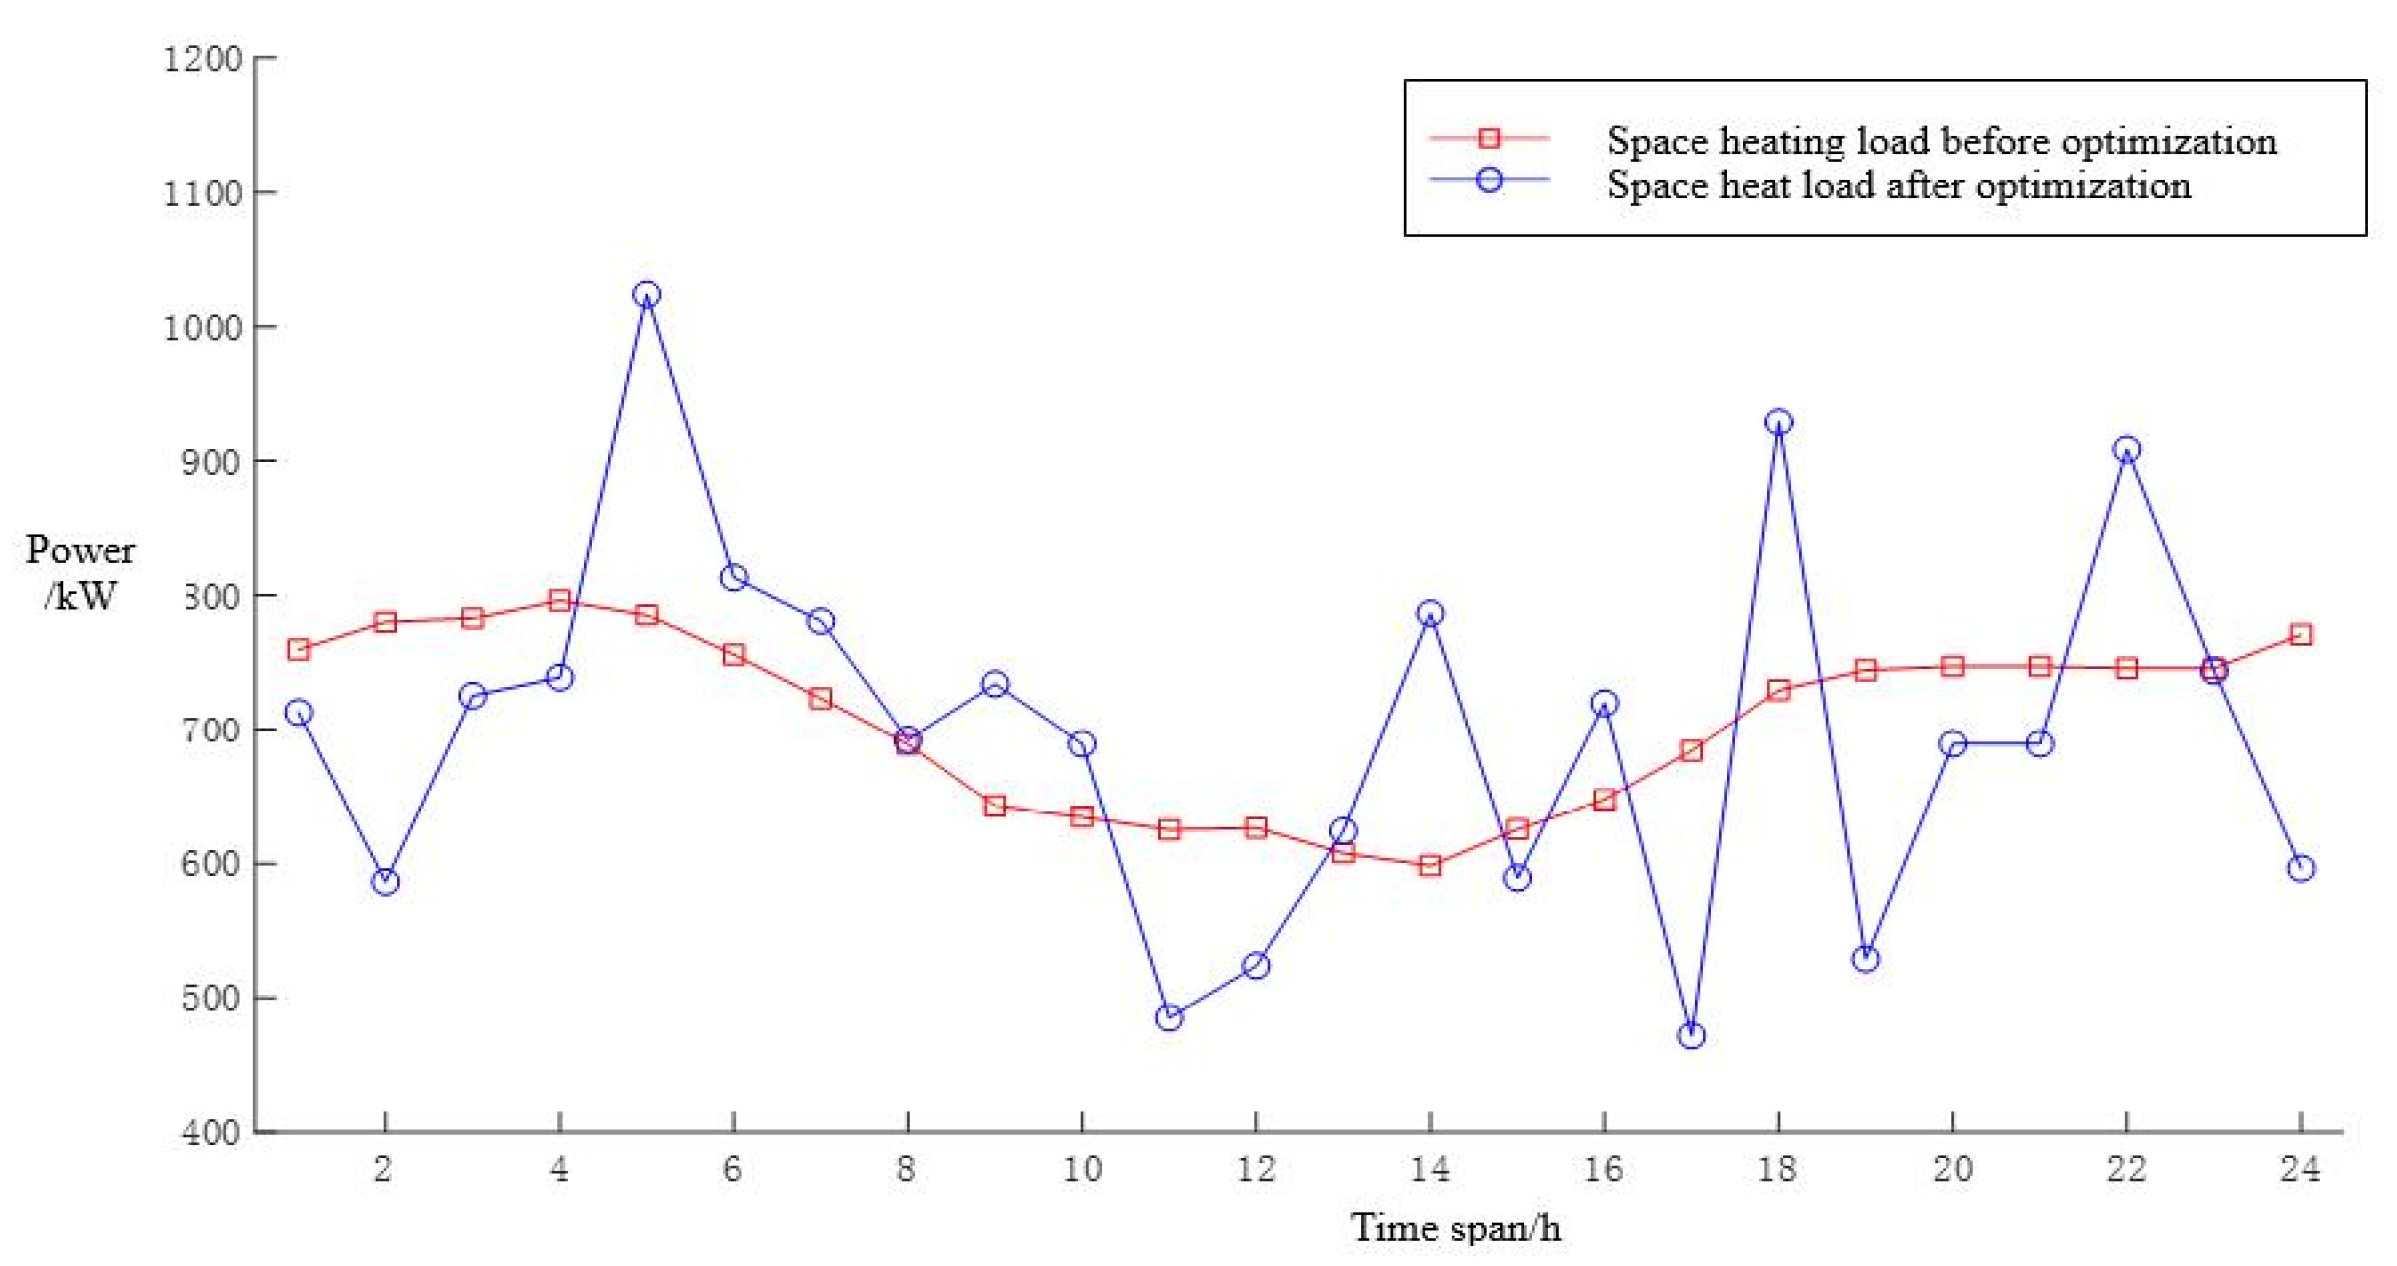
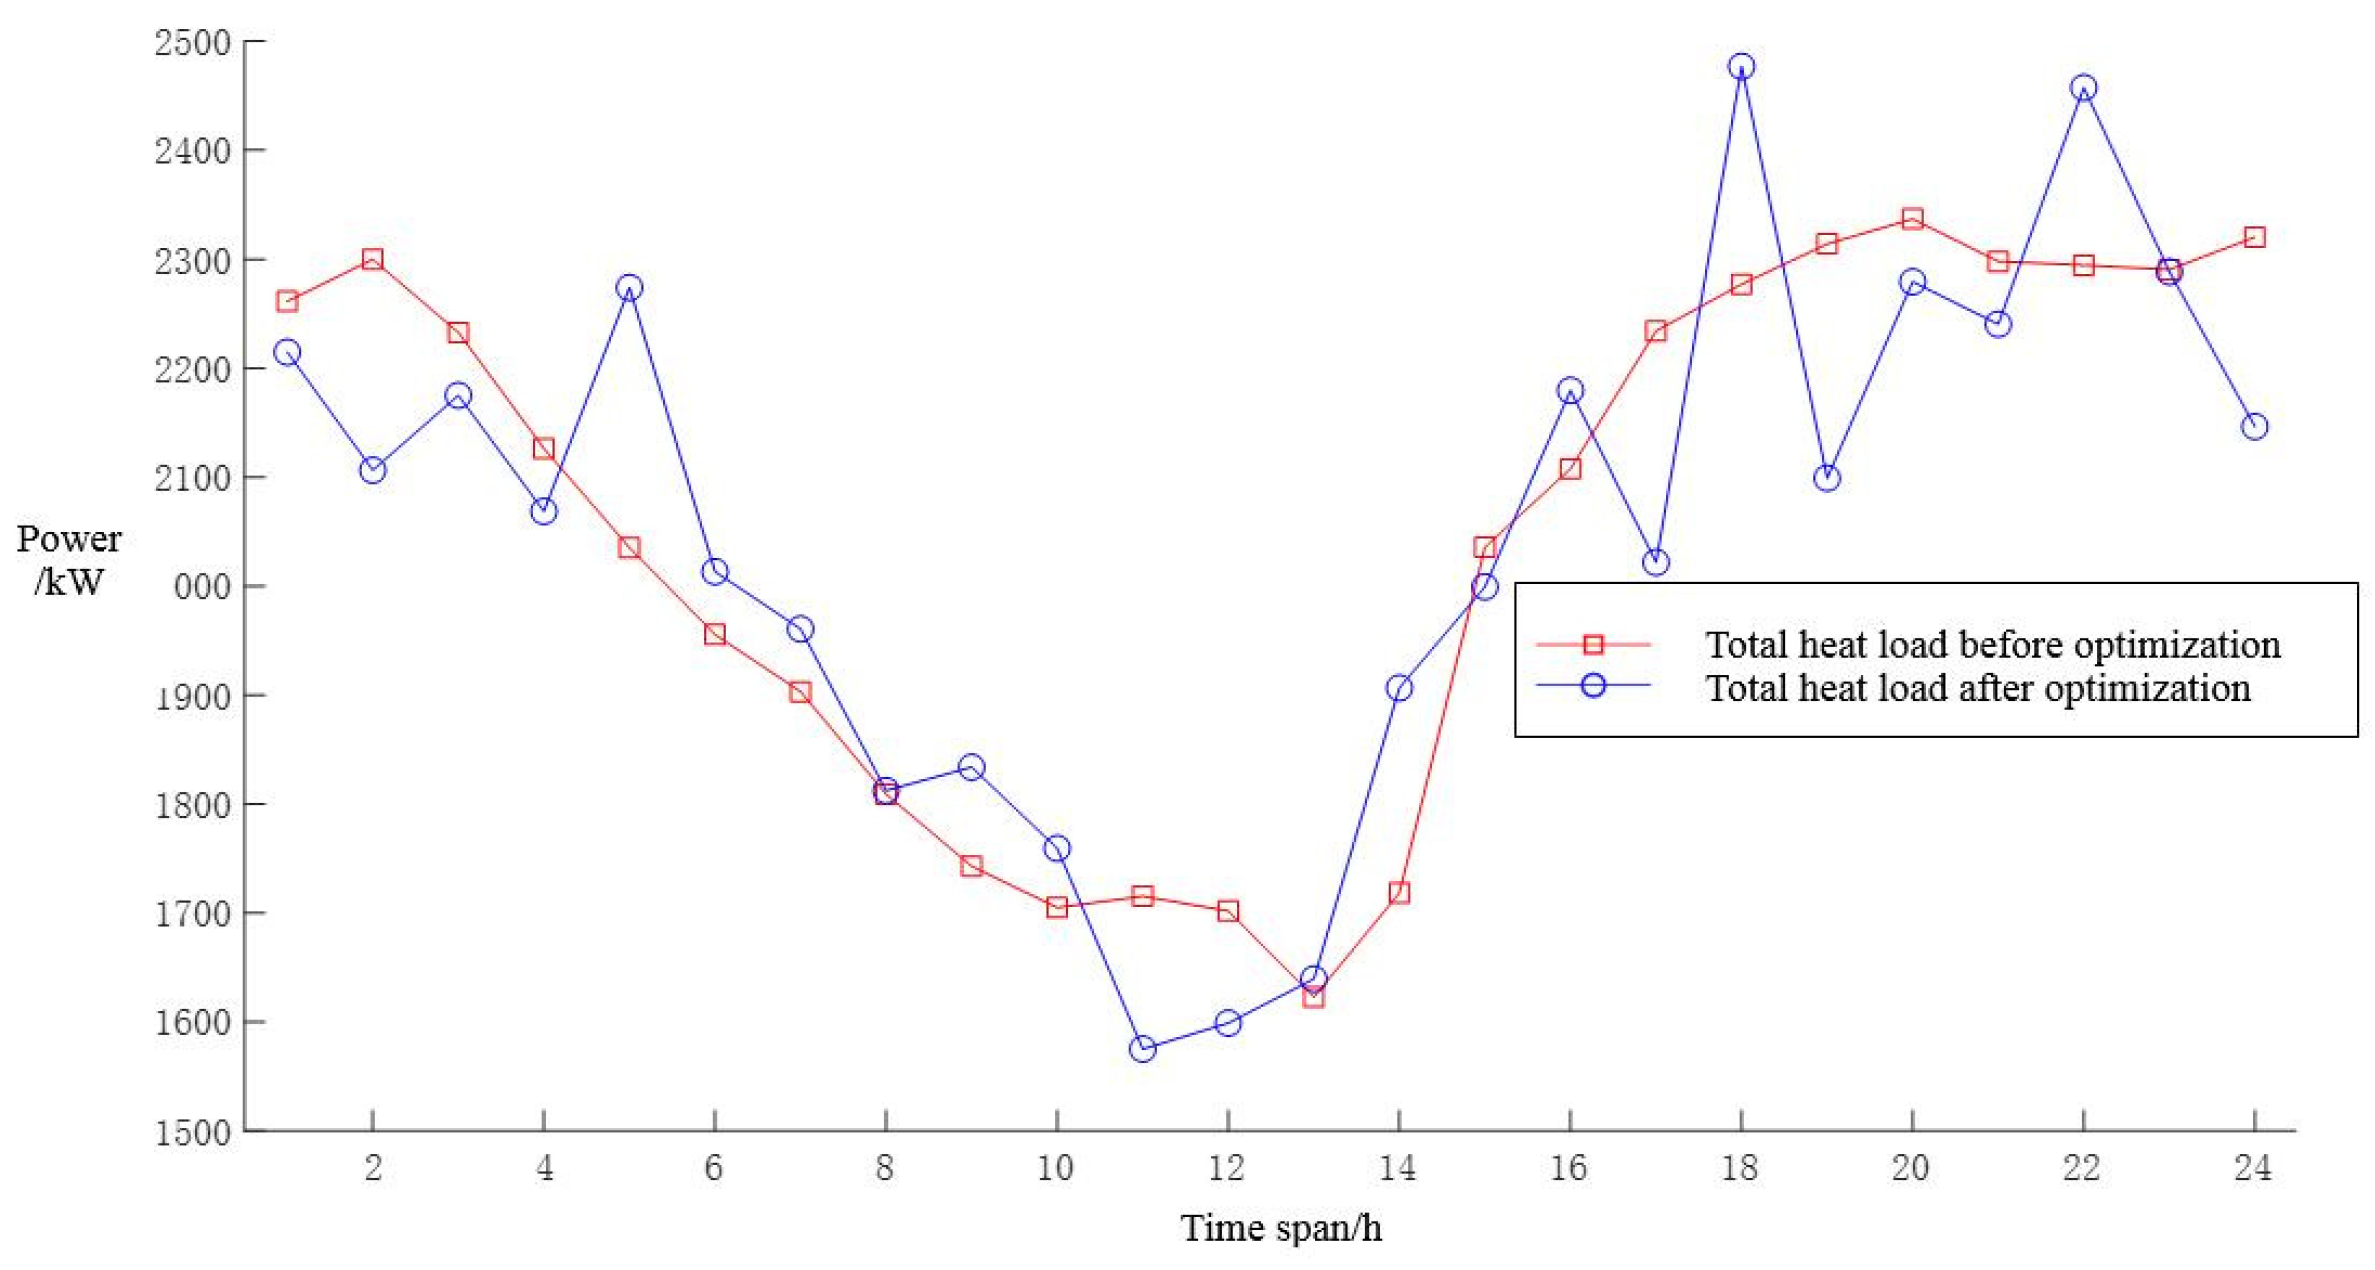
5.1.1. Optimization Results of Thermal Flexible Load

The PMV thermal comfort model is used to quantify the indoor thermal environment index internationally, and the mathematical model is as follows [34]:
λ p w m = 2.43 3.76 T s k T t i n K I c l + 0.1
where T s k represents the average temperature of the outer surface of the human body in a comfortable thermal environment, which can be set at 33.5 °C. T t i n is the room temperature in the t time period; K represents the metabolic rate of the human body, which can be set at 75 W/m2; I c l is the thermal resistance of the wearing clothing, which can be taken as 0.11(m2·°C)/W.
The PMV index adopts a seven-level index. When the PMV index is 0, it corresponds to the best comfort state of the human body. When the λ P W M fluctuates within the interval [−0.5, 0.5], the human body will not feel obvious temperature changes. It is also in a more comfortable temperature range. According to the PMV mathematical model, the room temperature range at this time is calculated to be 21.2–25.4 °C. The change of indoor temperature curve in different scenarios is shown in Figure 4.
Scenarios 1, 2, and 3 do not consider the response effect of thermal flexible loads, and the indoor temperature remains constant at 24 °C. In Scenario 4, during the process of optimizing the system capacity configuration, the flexible thermal load participates in the flexible response, and the indoor temperature changes within the comfortable temperature range of 22–26 °C for the human body [34,35]. Moreover, the periods with higher temperatures are often during periods of low-heat-load demand and abundant wind and solar resources. Increasing indoor temperature during this period can avoid wasting electrical and thermal energy, improve the absorption of wind and solar resources, and achieve peak shaving and valley filling of heat load.
Figure 5 and Figure 6 show the spatial and total heat load curves for different scenarios, respectively. From the figures, it is shown that, in Scenario 4, the heat load curve generally increases during the low-heat usage period, but decreases during the peak heat usage period and the scarcity of wind and solar resources.

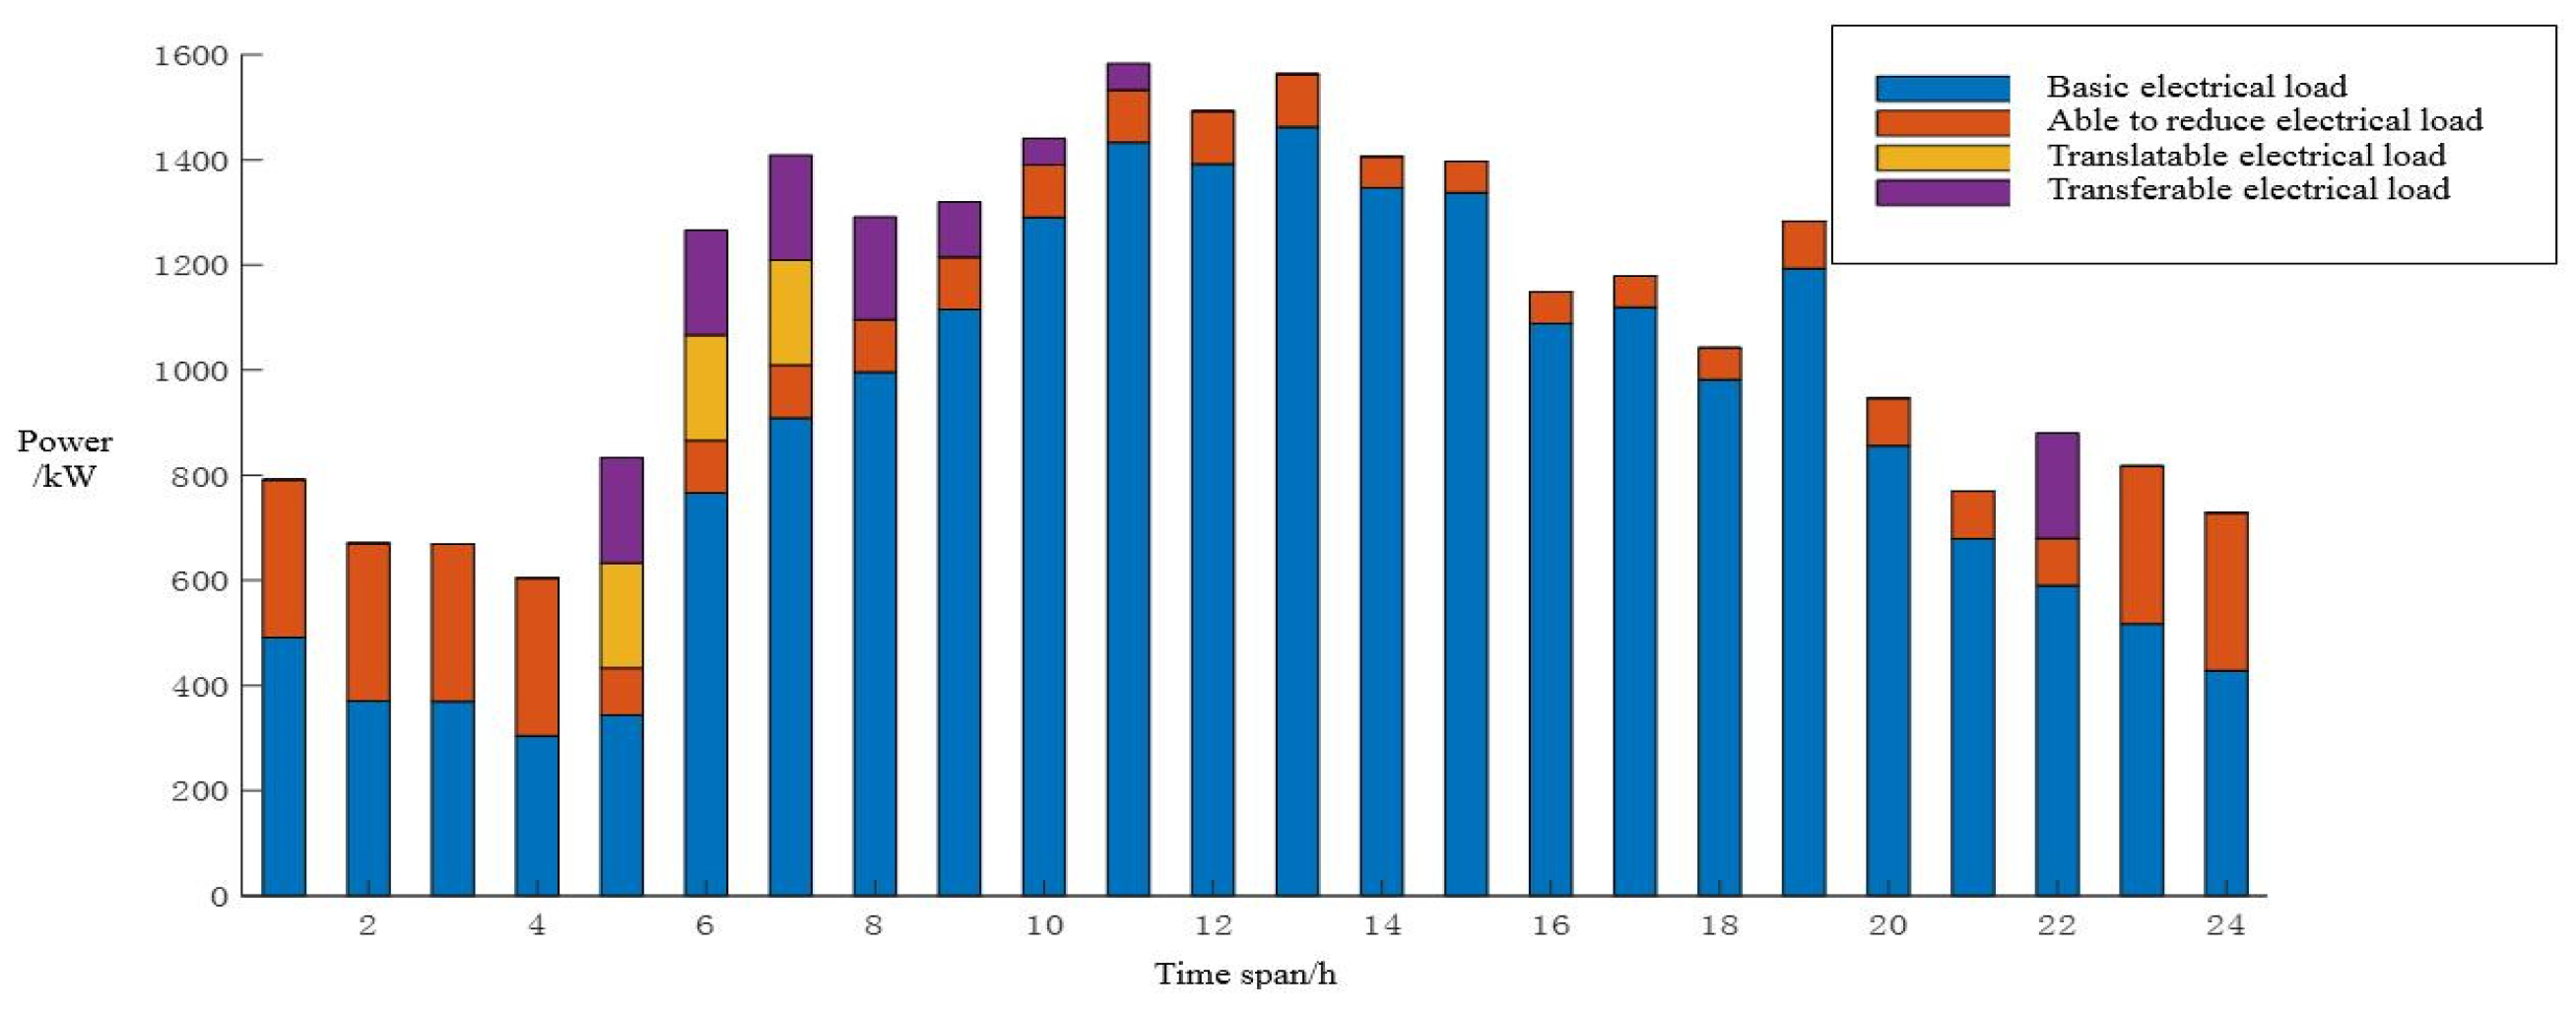
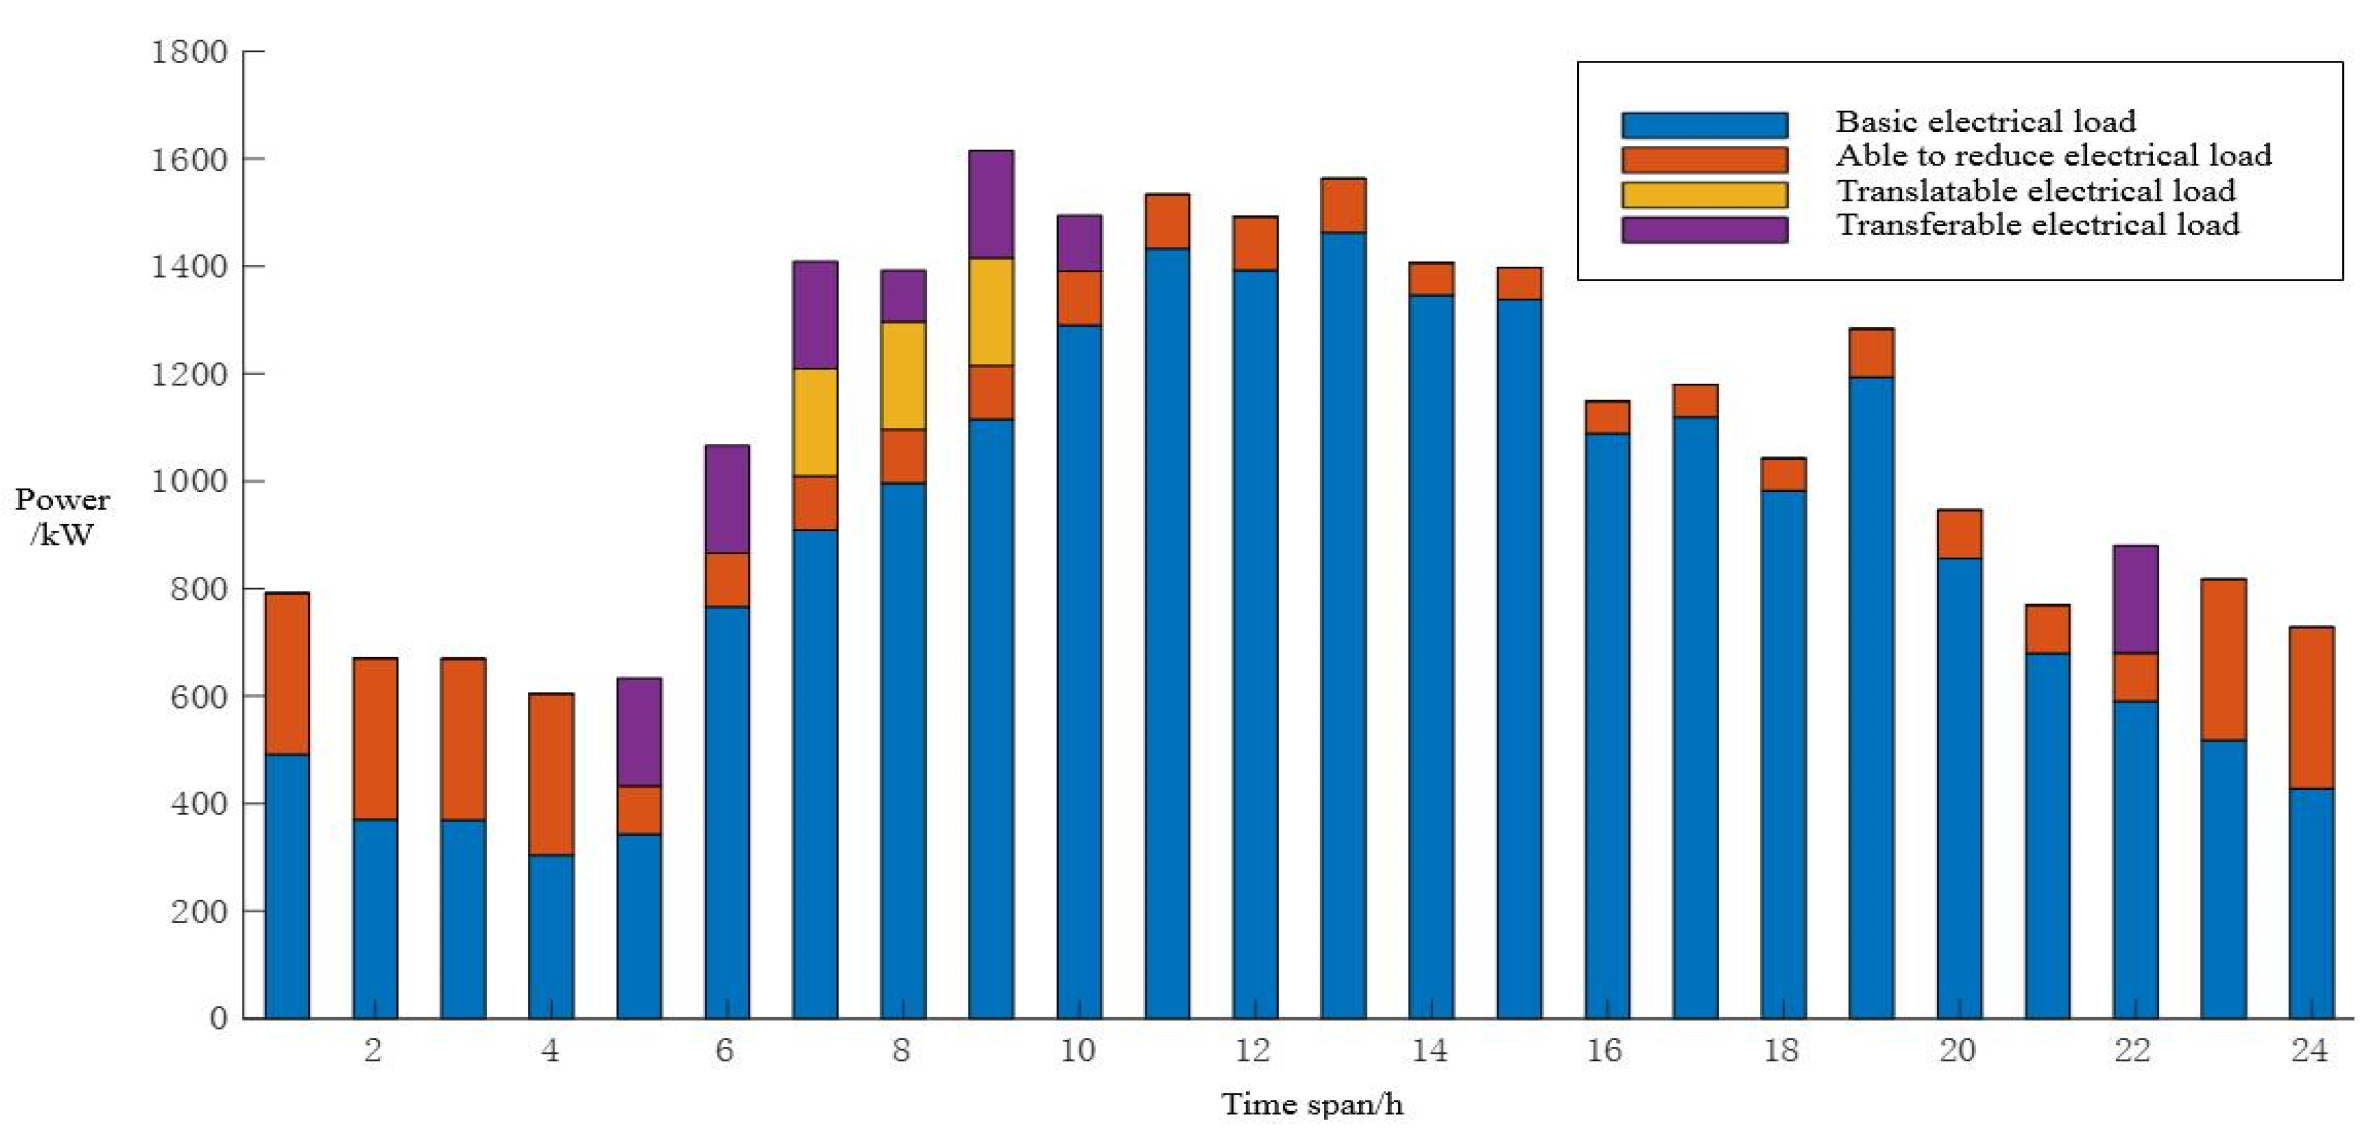
5.1.2. Optimization Results of Electric Flexible Load

Scenario 1 and Scenario 2 do not consider flexible loads, and the load does not shift, transfer, or reduce. The distribution of flexible power loads in different periods is shown in Figure 7; the optimization results of flexible power load in Scenario 3 are shown in Figure 8; and the optimization results of flexible power load in Scenario 4 are shown in Figure 9.
Comparing Figure 7 and Figure 8, it is shown that, after considering the flexible load, the translatable load shifts from 20:00 to 22: 00 electricity price peak and normal period to 5:00 to 7:00 electricity price valley, and at 5:00 to 7:00, the wind resources are abundant and the power load demand is small, so the translation of the translatable load not only smooths the power load curve and improves the economy of the system, but also promotes the utilization rate of new energy. The transferable load is transferred from 16:00 to 18:00 in the original peak hours to the electricity price valley, and from 5:00 to 11:00 and 22:00 in normal times. Wind resources are abundant from 5:00 to 7:00, and photovoltaic power generation starts at 8:00, and reaches the maximum at 13:00. At this time, the transfer of the transferable load can not only effectively promote the consumption of new energy, but also alleviate the power consumption pressure during peak hours. Scenario 4 is similar to Scenario 3 in terms of power flexible load optimization results, but the difference is that, in Scenario 3, the transferable load is transferred from 10 o’clock to 11 o’clock, while in Scenario 4, there is no transfer at this time. The main reason is that the demand response of the heat load leads to the rise of the heat load curve from 10:00 to 11:00, and the electric boiler converts electric energy into heat energy to meet the demand of the heat load, resulting in the power supply from 10:00 to 11:00 being not as sufficient as that in Scenario 3.
In Scenario 3 and Scenario 4, the reducible load is reduced at 5:00, 14:00 to 22:00. From 14:00 to 22:00, the wind speed is low, the output of the fan is very small, and the photovoltaic power generation starts to decrease gradually from 13:00. It is shown that the load reduction mainly changes with the change of wind and light output, and this period is the peak period of electricity consumption, and the reduction of load can reduce the pressure of electricity consumption during the peak period. At 5:00, although it is in the low-power consumption period and the fan output is large, the heat-load demand is large and the gas turbine is insufficient. The reduction of the electric load at this time can convert more electric energy into heat energy through the electric boiler. In other periods, the supply of electric energy and heat energy is sufficient, and the electricity price is mostly in the valley. At this time, the electric power balance can be realized by reducing the load.

5.2. Analysis of Capacity Optimization Configuration Results

Through the solution, the optimal configuration and economic cost results of each piece of equipment in different scenarios are obtained, as shown in Table 4 and Table 5.
Since Scenario 1 and Scenario 2 do not consider the flexible load, the compensation for users is 0. Comparing the cost optimization results of Scenario 1 and Scenario 2, it is found that the investment cost and maintenance cost of Scenario 2 is increased by 72,000 yuan and 5000 yuan compared with Scenario 1. However, the total cost decreased from 5.248 million yuan to 5.193 million yuan, of which the cost of electricity purchase decreased by 56,000 yuan, the cost of gas purchase decreased by 72,000 yuan, and the cost of carbon transaction decreased from 22,000 yuan to 18,000 yuan. From the comparison of the cost optimization results of Scenario 1 and Scenario 2, it can be seen that although the configuration of the storage battery and heat storage tank will increase the maintenance cost and investment cost of the system, it can store electric energy and heat energy during the period of abundant scenery resources and low-electricity price, effectively reducing the cost of purchasing electricity and gas, and reducing the carbon transaction cost of the system and the total cost of system operation.
Comparing Scenario 3 with Scenario 2, it is found that although the compensation cost of 65,000 yuan needs to be paid to the residents to promote the positive response of users, the total cost is about 122,000 yuan lower than that of Scenario 2. Among them, the investment cost decreased by 130,000 yuan compared with Scenario 2, and the cost of gas purchase decreased by about 62,000 yuan compared with Scenario 2. The results show that the optimal allocation model of energy storage considering electric flexible load has greatly improved the economy of the system.
After comprehensively considering the electrothermal flexible load in Scenario 4, the total cost decreased by about 21,000 yuan compared with Scenario 3, mainly due to the changes in investment cost and gas purchase cost. Because the flexible heat load mainly uses the fuzziness of the human body’s temperature perception, it does not influence the human body’s thermal comfort, so there is no need to compensate users economically when optimizing it, so the compensation costs of Scenario 3 and Scenario 4 are the same.

6. Conclusions

In this study, considering the coordinated interaction of the park-integrated energy system “source-network-load-storage” and the coordinated linkage of flexible load “ the translatable load-transferable load-reducible load “, an electric flexible load model and a thermal flexible load model based on the fuzziness of users’ temperature perception are proposed, and the optimal allocation scheme of park-integrated energy system energy storage under specific constraints is given, and the rationality and effectiveness of the scheme are verified by an example. The relevant conclusions are as follows:
(1)
Considering the electric/thermal flexible load, the electric/thermal system complements each other, optimizes the electric- and thermal-load curves, and obviously reduces the energy-storage capacity, thus achieving the balance between the optimal capacity of the equipment and the output benefit in each period to some extent;
(2)
The park-integrated energy system’s energy storage optimization strategy is proposed, in which flexible electric load can be scheduled and indoor temperature can be flexibly adjusted. Compared with the scenarios in which flexible electric load is not considered and only flexible electric load is considered, the capacity of the storage battery is reduced by 45.68% and 7.21%, the capacity of the heat storage tank is reduced by 44.99% and 22%, and the installed capacity of the fan is increased by 3.67% and 1.66%, which is beneficial to promoting the consumption of renewable energy and improving the penetration rate of renewable energy;
(3)
In terms of economic operation, the proposed park-integrated energy system’s energy storage optimization configuration scheme effectively reduces the equipment investment cost, gas purchase cost, and electricity purchase cost of the system, and the total economic cost is reduced by 3.78%, which is conducive to the economic and efficient operation of the park-integrated energy system.
The follow-up work will consider the influence of more factors such as different regions, different seasons and adding more constraints on the optimal allocation of the park-integrated energy system, in order to improve the scheme and strategy proposed in this study. Multi-user supply demand interaction and energy efficiency improvement with active access to a higher proportion of renewable energy will also be the focus of park-integrated energy system research in the future.

Author Contributions

Software, M.W.; Validation, M.W., Z.Z. and S.C.; Formal analysis, Y.L.; Investigation, Z.Z.; Data curation, S.C.; Writing—original draft preparation, Z.Z. and M.W.; Writing—review and editing, Z.Z.; Supervision, Y.L.; Project administration, Z.X.; Funding acquisition, Z.X. All authors have read and agreed to the published version of the manuscript.

Funding

This research was funded by the LiaoNing Revitalization Talents Program, grant number XLYC2008005.

Data Availability Statement

Data is available on request from corresponding authors.

Conflicts of Interest

The authors declare no conflict of interest.

References

  1. Zeng, B.; Zhang, J.; Yang, X.; Wang, J.; Dong, J.; Zhang, Y. Integrated Planning for Transition to Low-carbon Distribution System with Renewable Energy Generation and Demand Response. IEEE Trans. Power Syst. 2014, 29, 1153–1165. [Google Scholar] [CrossRef]
  2. Streckiene, G.; Martinaitis, V.; Andersen, A.N.; Katz, J. Feasibility of CHP-plants with thermal stores in the German spot market. Appl. Energy 2009, 86, 2308–2316. [Google Scholar] [CrossRef]
  3. Ding, T.; Venkatesh, B.; Liu, H.; Muljadi, E.; Du, P.; Freitas, W.; Nassif, A.; Bu, S.; Arani, R.; Anjos, M.F.; et al. Guest editorial: Future distribution grids and integrated energy systems (IES). IET Gener. Transm. Distrib. 2022, 16, 1473–1475. [Google Scholar]
  4. Abdalla, A.; Mohamed, S.; Friedrich, K.; Bucking, S.; Cotton, J.S. The impact of clustering strategies to site integrated community energy and harvesting systems on electrical demand and regional GHG reductions. Energy Convers. Manag. 2023, 288, 117151. [Google Scholar] [CrossRef]
  5. Zhang, X.; Shahidehpour, M.; Alabdulwahab, A.; Abusorrah, A. Optimal expansion planning of energy hub with multiple energy infrastructures. IEEE Trans. Smart Grid 2015, 6, 2302–2311. [Google Scholar] [CrossRef]
  6. Moeini-Aghtaie, M.; Dehghanian, P.; Fotuhi-Firuzabad, M.; Abbaspour, A. Multiagent genetic algorithm: An online probabilistic view on economic dispatch of energy hubs constrained by wind availability. IEEE Trans. Sustain. Energy 2014, 5, 699–708. [Google Scholar] [CrossRef]
  7. Bach, P.F. Towards 50% wind electricity in denmark: Dilemmas and challenges. Eur. Phys. J. Plus. 2016, 131, 161. [Google Scholar] [CrossRef]
  8. Lu, X.; McElroy, M.B.; Peng, W.; Liu, S.; Nielsen, C.P.; Wang, H. Challenges faced by China compared with the US in developing windpower. Nat. Energy 2016, 1, 16061. [Google Scholar] [CrossRef]
  9. Norouzi, F.; Karimi, H.; Jadid, S. Stochastic electrical, thermal, cooling, water, and hydrogen management of integrated energy systems considering energy storage systems and demand response programs. J. Energy Storage 2023, 72, 108310. [Google Scholar] [CrossRef]
  10. Jiang, J.W.; Hong, D.D.; Xiao, L.Q. Cost-based site and capacity optimization of multi-energy storage system in the regional integrated energy networks. Energy 2022, 261, 125240. [Google Scholar]
  11. Feng, P.L.; Wei, W.; Jun, W.; Da, L.; Chuan, L.; Wen, Y.C. Optimal Operation Model of Park Integrated Energy System Considering Uncertainty of Flexible Electrical, Thermal and Gas Load. J. Phys. Conf. Ser. 2021, 1, 2095. [Google Scholar]
  12. Yang, K.X.; Ying, C.; Zi, L.; Lin, Z.L. Low-carbon economic optimal dispatch of integrated energy system considering flexible load. Renew. Energy Resour. 2019, 37, 1206–1213. [Google Scholar]
  13. Zou, C.; Cui, X.; Zhou, B.; Gao, J.; Liu, Y. Optimal dispatch of combined heat and power system considering flexible load and electric boiler under carbon trading environment. Electr. Meas. Instrum. 2019, 56, 34–40+56. [Google Scholar]
  14. Liu, R.; Li, Z.; Yang, X.; Sun, G.P.; Li, L.H. Optimal Dispatch of Community Integrated Energy System Considering User-Side Flexible Load. Acta Energiae Solaris Sin. 2019, 40, 2842–2850. [Google Scholar]
  15. Setlhaolo, D.; Xia, X.; Zhang, J. Optimal scheduling of household appliances for demand response. Electr. Power Syst. Res. 2014, 116, 24–28. [Google Scholar] [CrossRef]
  16. Chun, Y.J.; Yu, C.Z.; Jia, J.X. Integrated energy collaborative optimal dispatch considering human comfort and flexible load. Electr. Power Autom. Equip. 2019, 39, 254–260. [Google Scholar]
  17. Rasheed, M.; Javaid, N.; Ahamd, A.; Khan, Z.A.; Qasim, U.; Alrajeh, N. An efficient power scheduling scheme for residential load management in smart homes. Appl. Sci. 2015, 5, 1134–1163. [Google Scholar] [CrossRef]
  18. Yang, L.; Huang, K.; Kong, X.; Lv, X.; Guo, H. Capacity Optimization Configuration of Grid-Connected Microgrid System Considering Flexible Load. Acta Energiae Solaris Sin. 2021, 42, 309–316. [Google Scholar]
  19. Liu, Y.; Wang, J.; Yang, H.; Li, Y.; Xie, W. Dynamic Optimal Method of Distribution Network in Consideration of Flexible Load Adjustment Capability. High Volt. Eng. 2021, 47, 73–80. [Google Scholar]
  20. Fei, J.; Yuan, X.; Shi, M.; Xu, Q.; Xiao, Y. Multi-Objective Optimal Strategy for the Coordination Control between Distributed Energy Storage System and Flexible Load. In Proceedings of the 2019 IEEE Innovative Smart Grid Technologies—Asia (ISGT Asia), Chengdu, China, 21–24 May 2019; pp. 1711–1715. [Google Scholar]
  21. Shao, S.; Pipattanasomporn, M.; Rahman, S. Development of physical-based demand response-enabled residential load models. IEEE Trans. Power Syst. 2013, 28, 607–614. [Google Scholar] [CrossRef]
  22. Sharma, I.; Dong, J.; Malikopoulos, A.A.; Street, M.; Ostrowski, J.; Kuruganti, T.; Jackson, R. A modeling framework for optimal energy management of a residential building. Energy Build. 2016, 130, 55–63. [Google Scholar] [CrossRef]
  23. Wei, H. Capacity Optimization of Community Integrated Energy System Considering Electric-Thermal Flexible Load; Yanshan University: Qinhuangdao, China, 2022. [Google Scholar]
  24. Qiang, R.J.; Zhao, G.M.; Chao, X.Z. Low Carbon Economic Dispatch Method of Electricity Gas Integrated Energy System Considering Flexible Load. Ind. Heat. 2022, 51, 36–40. [Google Scholar]
  25. Pirouti, M. Modelling and Analysis of a District Heating Network. Ph.D. Thesis, Cardiff University, Cardiff, UK, 2013. [Google Scholar]
  26. Nielsen, M.G.; Morales, J.M.; Zugno, M.; Pedersen, T.E.; Madsen, H. Economic valuation of heat pumps and electric boilers in the Danish energy system. Appl. Energy 2015, 167, 189–200. [Google Scholar] [CrossRef]
  27. Sjodin, J.; Henning, D. Calculating the marginal costs of a district- heating utility. Appl. Energy 2004, 78, 1–18. [Google Scholar] [CrossRef]
  28. Jiang, W.; Yan, Z.; Cao, J.; Xu, X.Y. Multiobjective comprehensive optimal dispatch of energy hub considering flexible load. Electr. Meas. Instrum. 2018, 55, 31–39. [Google Scholar]
  29. Sun, C.; Wang, L.J.; Xu, H.L. An interaction load model and its application in microgrid day-ahead economic scheduling. Power Syst. Technol. 2016, 40, 2009–2016. [Google Scholar]
  30. Lin, F.; Yi, J. Optimal operation of a CHP plant for space heating as a peak load regulating plant. Energy 2000, 25, 283–298. [Google Scholar] [CrossRef]
  31. Guotai, Z.; Hao, L.; Baoguo, Z.; Bangxu, W.; Wei, T. Comprehensive optimization of electrical/thermal energy storage equipments for integrated energy system near user side based on energy supply and demand balance. Power Syst. Prot. Control 2018, 46, 8–18. [Google Scholar]
  32. Xu, Q.S.; Li, L.; Cai, J.L.; Luan, K.N.; Yang, B. Day-ahead optimized economic dispatch of CCHP multi-microgrid system considering power interaction among microgrids. Autom. Electr. Power Syst. 2018, 42, 36–44. [Google Scholar]
  33. Liu, D.C.; Ma, H.R.; Wang, B.W.; Gao, W.; Wang, J.; Yan, B. Operation optimization of regional integrated energy system with CCHP and energy storage system. Autom. Electr. Power Syst. 2018, 42, 113–120. [Google Scholar]
  34. Lin, L.; Gu, J.; Wang, L. Optimal Dispatching of Combined Heat-power System Considering Characteristics of Thermal Network and Thermal Comfort Elasticity for Wind Power Accommodation. Power Syst. Technol. 2019, 43, 3648–3655. [Google Scholar]
  35. GB/T 18049-2000; Moderate Thermal Environments—Determination of the PMV and PPD Indices and Specification of the Conditions for Thermal Comfort. The State Bureau of Quality and Technical Supervision, PRC: Beijing, China, 2000.
Figure 1. Diagram of the power/thermal reserve system structure.
Energies 16 06424 g001
Figure 2. Power curve.
Energies 16 06424 g002
Figure 3. Light intensity and wind speed curve.
Energies 16 06424 g003
Figure 4. Indoor temperature curve changes in different scenarios.
Energies 16 06424 g004
Figure 5. Heat load in different scene spaces.
Energies 16 06424 g005
Figure 6. Total heat load in different scenarios.
Energies 16 06424 g006
Figure 7. Flexible electrical load distribution.
Energies 16 06424 g007
Figure 8. Scenario 3 Flexible Electrical Load Distribution.
Energies 16 06424 g008
Figure 9. Scenario 4 Flexible Electrical Load Distribution.
Energies 16 06424 g009
Table 1. Operating parameters of each equipment.
TypeLower Power Limit /kWhUpper Power Limit /kWhOperating Cost
/(Yuan/kWh)
Large power grid--TOU electricity price
Wind turbine0predicted value0.52
PV0predicted value0.72
Combustion gas turbine02002.5
Table 2. Time-of-use electricity price.
Time IntervalElectricity Price/(Yuan/kWh)
10:00–15:00, 18:00–21:001.2
7:00–10:00, 15:00–18:00, 21:00–23:000.8
23:00–7:000.4
Table 3. Configuration scheme.
Configuration TypeScenario 1Scenario 2Scenario 3Scenario 4
Energy storage equipment
Electric flexible load
Thermal flexible load
Table 4. Device optimization configuration results in different scenarios.
ScenePV
/kW
Wind Turbine
/kW
Gas Turbine/kWElectric Boiler/kWStorage Battery/kWHeat Storage Tank/kW
1778.031798.131170.901504.32
2761.311932.211001.101375.801645.792559.96
3758.571970.26931.851415.12963.511805.70
4751.012003.03920.661350.21894.041408.36
Table 5. Cost optimization results in different scenarios.
Scene1234
Investment/yuan2,983,7023,055,6692,925,6802,920,146
Maintenance/yuan98,903104,030102,011101,500
Electricity purchase/yuan55,54807580
Gas purchase/yuan2,087,7002,015,5001,953,2001,944,000
Compensation/yuan0065,10065,100
Carbon trading/yuan21,85517,83923,81722,317
Total/yuan5,247,7085,193,0385,070,5665,049,463
Disclaimer/Publisher’s Note: The statements, opinions and data contained in all publications are solely those of the individual author(s) and contributor(s) and not of MDPI and/or the editor(s). MDPI and/or the editor(s) disclaim responsibility for any injury to people or property resulting from any ideas, methods, instructions or products referred to in the content.

