1. Introduction
The current energy situation is becoming increasingly complex due to the continuous rise in the cost of fossil fuels and the growing volatility of oil prices. In this context, renewable energies have found a field of expansion by improving energy security, climate change and fossil fuel price volatility. Furthermore, the increment in the use of renewable energies must be accompanied by exhaustive studies in this field, since investors in renewable energies, in addition to assuming the risk of their investment, must also assume the risk of fluctuations in oil prices [
1].
To address the current energy crisis, it is possible to propose two alternatives. The first is to seek alternative energy sources, while the second is to increase the efficiency of energy conversion, and a combination of both is also possible. The large amount of greenhouse gases produced by fossil fuels utilization has led to the implementation of countless projects in recent years seeking to use renewable energy resources. Most renewable energy sources are intermittent, opening spatial and temporal gaps between the availability of the energy and its consumption by end users. To address these issues, it is necessary to develop suitable energy storage systems for the power grid [
2]. Combined heat and power (CHP) systems achieve greater efficiencies than conventional generation systems, since the waste heat used to produce electricity is employed for heating or cooling, avoiding energy losses in transportation [
3,
4]. Cogeneration is defined as the simultaneous production of electric power and useful heat from the burning of a single fuel [
5]. Some authors have worked on the implementation of combustion-based mCHP systems, such as Peacock et al. [
6], where a cogeneration system based on a Stirling engine is proposed. However, for domestic and low-scale applications, micro-CHP systems (mCHP) are a good solution.
Fuel cells are a very attractive technology when designing cogeneration systems since they have a high electrical efficiency and an acceptable thermal efficiency, and are also very reliable due to the fact that they have no moving parts. This technology aims to be the main mCHP technology in the future according with Martinez et al. [
3].
In this context, according to Nielsen et al. [
7], fuel cells are at a level of technical development suitable for implementation in residential applications. However, currently, this alternative is not cost-effective compared to the conventional alternative (centralized power generation and natural gas boilers). Despite this, in the future, the production costs of these systems will be reduced, favored by means of coordinated policies, since the environmental benefits of these systems compared to conventional alternatives are clear. For all these reasons, it is necessary to carry out an analysis to determine the benefits of different fuel cell-based mCHP configurations.
The work developed on the modelling and experimentation of fuel cell-based systems is extensive. In the work of Ferguson et al. [
8], a proton-exchange-membrane fuel cell (PEMFC) component model was developed and integrated into a building simulation program, analyzing the fuel cell size and the operating strategy and their influence on the performance of the FC-mCHP system. Adam et al. [
9] developed a similar study in which two FC-mCHP systems were modelled, one based on PEM type fuel cell and the other on solid oxide type fuel cell (SOFC). In their work, the model includes generation, distribution, and heat-emission systems. Xie et al. [
10] developed a model of an FC-mCHP where the authors analyze the breakdown of energy and exergy losses of the system, and in addition, they studied the influence of hydrogen-utilization efficiency, power generation efficiency and process methane feed on system performance.
In other works, fuel cells are modelled in order to carry out parametric or sensitivity studies. Marcoberardino et al. [
11] analyze in detail the performance of a cogeneration system obtaining a distribution of the electrical and thermal consumptions and losses. Another illustrative example is the one developed by Gandiglio et al. [
12], where taking the case of Japan as a reference, the use of FC-mCHP systems in residential buildings was analyzed.
Although direct experimentation on fuel cells as CHP systems is less widespread, examples such as those carried out by Hwang et al. [
13] can be cited, where experimental research with a PEM fuel cell cogeneration system has been developed to provide electricity and hot water.
On the other hand, many studies work with real data on how the implementation of fuel cell-based systems in buildings affects energy demand, CO
2 emissions and cost. An example of this can be seen in Dorer et al. [
14] where a methodology has been developed to evaluate the performance of two types of domestic fuel cell systems powered by natural gas in terms of primary energy demand and CO
2 emission. A similar work is carried out by Napoli et al. [
15] where the average residential demand data is taken and two systems are modelled, one based on a PEMFC stack and the other based on a SOFC stack, and the dynamic behaviors are simulated.
It is also common to study combinations of different air-conditioning systems with fuel cell-based systems. For example, in the work of Gandiglio et al. [
16], the integration of a PEM fuel cell with an underfloor heating system has been considered. The low operating temperature of the PEMFC fits well with the temperature level of the underfloor heating system, allowing a better energy performance of the FC-mCHP. A study similar to the one presented in this paper can be seen in Sorace et al. [
17], with the cited authors considering the integration of a heat pump-based system. The study considers both PEMFC-based systems and SOFC-based systems, and they analyze energy efficiency and cost. Another proposal is made by Atienza-Márquez et al. [
18] who suggest the use of a fuel cell in combination with a reversible absorption heat pump.
Other studies consider the social situation of a given geographical area and choose a building representative of that area to carry out the study. This is the case of Chen et al. [
19], where taking the basis of the high population density of Hong Kong, they investigate the possibilities of SOFC-based cogeneration/trigeneration systems in order to improve the energy performance of a hotel. This study is focused on improving the payback period by means of increasing efficiency.
Finally, it is also possible to find studies that integrate the economic parameters into their analysis, such as in [
20], where the FC-mCHP future possible cost is estimated. Other works like [
21] point out that PEMFC technology is not competitive nowadays, and mention the need of efficiency improvements to increase competitivity. In addition, and in accordance with Staffell et al. [
22], hydrogen is independent of fuel cells, as they can be used in combination or separately, which complicates economic prediction.
The objective of this work is to carry out a study on the possibilities of fuel cells operating as an mCHP in order to identify opportunities and trends. Five different configurations are considered, each one combining different alternatives of hydrogen production (natural gas reforming/electrolysis), production location (centralized/on site) and heat recovery of hydrogen production. To do so, a simple algebraic model of the fuel cell stationary performance has been used, characterized by its electric and thermal efficiencies. The model is then used to predict the values of primary energy, CO2 emissions and cost, in comparison with a scenario with conventional centralized generation of electric power and production of thermal energy in a natural gas boiler.
The novelty of this work lies in the large number of operating conditions that can be considered for each configuration. This provides a broader picture of the present situation of fuel cell-based residential CHP systems. In this way, trends and opportunities can be predicted.
2. Methodology Description
2.1. General Approach
A methodology has been developed to easily compare the results of several configurations of FC-mCHP aimed to satisfy the electric and thermal demand of a small-size residential application. Although the same approach can be extended to higher values of both fuel cell power production and final consumption, the small-size application of this work limits the absolute values of the demands. In fact, it can be seen that, rather than the absolute values of demands, the ratio between them (the heat-to-power ratio, HPR) is a more relevant parameter.
With this purpose, an algebraic model has been used to easily compute the amount of electric and thermal energy generated as a function of the electrical and thermal demands and the operation time. It is then possible to calculate and compare results like primary energy consumption, CO2 emissions and economic profitability in the different configurations used. The conventional system for electric power and heat is based on using grid electricity (with a mixed origin, representative of the region considered) and an on-site natural gas boiler connected to the natural gas grid. The resulting values of the several configurations of the FC-mCHP system are compared with those of the conventional approach, showing the benefits or drawbacks of each, which in general depend on the operation variables (electric power and number of annual operation hours).
The main characteristics of this study, aimed to evaluate the performance of the FC-mCHP system to supply electrical and thermal energy, are as follows.
The starting point is the demanded annual electric and thermal energies, with a characteristic heat-to-power ratio (HPR, typically 2–6). The study can be extended to other applications by considering appropriate values (for instance, an industrial demand with an HPR higher than 6).
The operation variables of the fuel cell are its electrical power (0–2 kW) and the number of annual operation hours (0–8760 h). Both variables are inputs in the simulations to carry out parametric studies of fuel cell performance.
It is assumed that energy demands (thermal and electric) must be covered. That means that if the FC-mCHP cannot fully supply both demands, the shortfall is supplied by the electric grid or by a natural gas boiler, with the associated needs in terms of energy, emissions, and costs.
The global performance of the FC-mCHP has been considered through its power and thermal efficiencies [
23,
24], as shown in Equation (1). The HPR of the fuel cell can be calculated as the ratio of both efficiencies, as in Equation (2):
This can be named as a simple algebraic model that easily simulates many operating conditions by considering suitable values of the electric and thermal efficiencies. Typical values of
for PEMFC mCHP range between 0.35 and 0.39, while associated values of
are between 0.55 and 0.48, in accordance with [
22]. The values of the electric and thermal efficiencies cannot be chosen independently because they are related by means of the global performance (as given by Equation (1)). Reference values are set to 0.39 and 0.49, respectively, with an associated HPR of production of 1.26.
In this way, it is possible to calculate results like the electric energy and thermal energy produced during the time considered, as well as the energies from conventional systems (electricity and natural gas) which are needed for supply in case the fuel cell would not be able to cover all demands during the operation process. Moreover, the hydrogen energy needed to be supplied to the fuel cell is computed, as well as the electricity and natural gas amounts required to produce hydrogen in the different configurations considered. From those electricity and natural gas quantities, the primary energy involved, and CO2 emissions can be calculated. In addition, a cost estimation was performed considering the operation and the equipment investment.
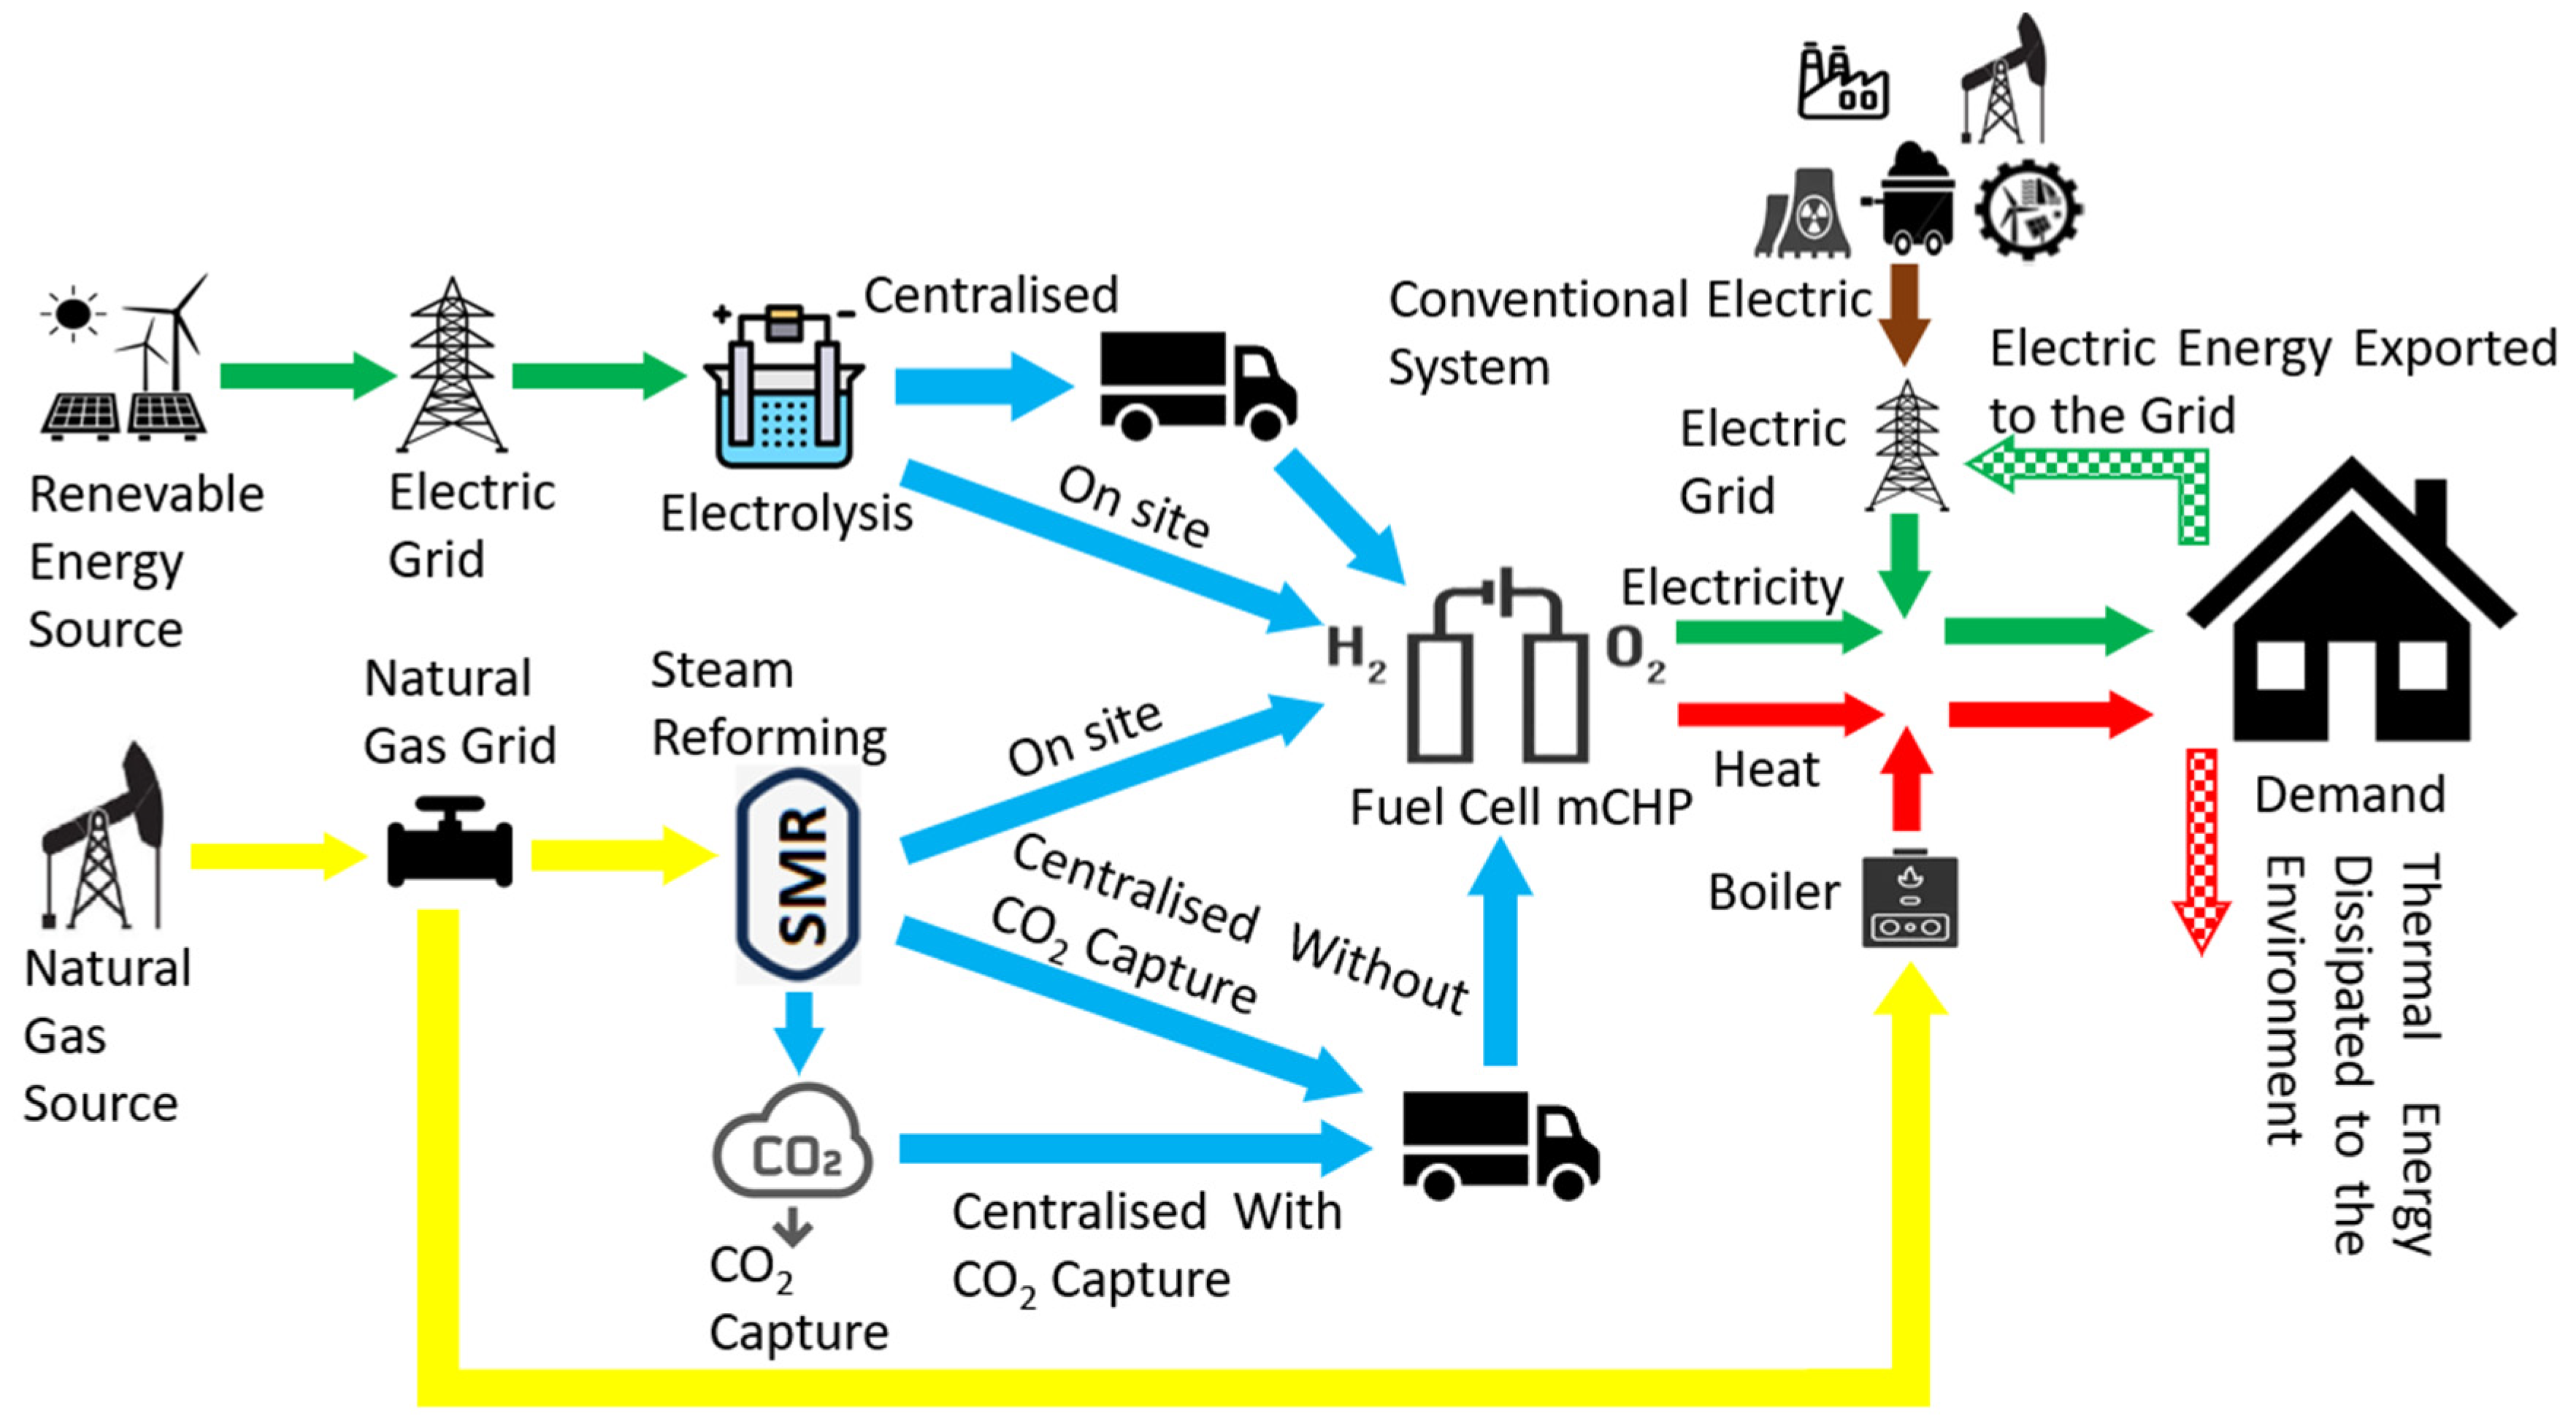
Figure 1 shows a schematic of the FC-mCHP power system operating to satisfy a residential demand. The scheme starts from the three primary energy sources considered, renewable energy for electrolysis hydrogen production (green hydrogen), natural gas for hydrogen steam reforming production (grey hydrogen or blue hydrogen if CO
2 is captured), and the mix of primary energy used by the conventional system. A color code is used to indicate the type of energy and is kept in all figures (blue-hydrogen, yellow-natural gas, green-electricity, red-heat, brown-primary energy).
The model provides results of different types: First, primary energy savings, thermal energy dissipated to the environment, overall efficiency and electrical energy returned to the grid are calculated based on Equation (1) and a series of relationships expressed by means of efficiencies along the entire energy-generation chain. Second, the CO
2 emissions savings and the CO
2 emissions factors have been estimated from the primary energy used and the CO
2 emission factors obtained from [
25]. Finally, the operational cost saving, the total cost saving, the annual benefit, the payback, and the fee of CO
2 emissions that would make the system profitable have been estimated from economic data taken from [
26,
27].
Input values to be introduced are specific conditions of each application, as the demanded electric energy, the demanded thermal energy, the average fuel cell power and the annual number of operating hours.
2.2. Configurations of FC-mCHP
Five configurations for the fuel cell micro-combined heat and power (FC-mCHP) system have been considered by combining the different pathways and possibilities of
Figure 1, plus the conventional, reference generation systems. The novelty of the work lies specifically in the number of cases analyzed for each configuration and the comparison of the results obtained with the different configurations.
- C.0.
Conventional systems for generation of electric power and heat (natural gas boiler).
A reference system is considered (
Figure 2), in order to compare the results obtained for other configurations, as suggested by Arsalis [
28], in terms of primary energy consumptions, CO
2 emissions and costs.
- C.1.
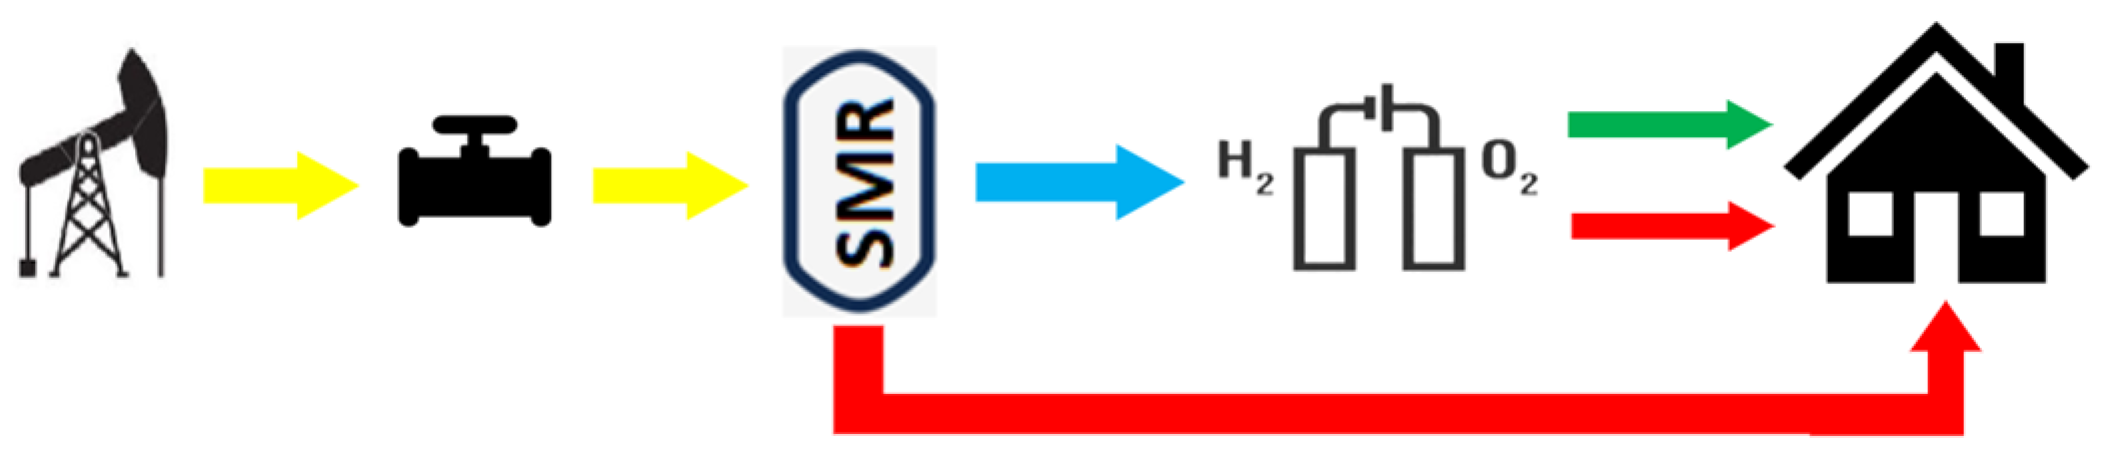
FC-mCHP fed with hydrogen produced by an on-site steam methane reformer (with heat recovery, and without CO2 capture).
In this configuration, the system consists of an FC-mCHP and an on-site steam methane reformer (SMR). The system is fed with natural gas to produce hydrogen to be used later to generate electricity and heat in the fuel cell (
Figure 3).
Despite the use of a non-renewable energy source, this system shows advantages, since it has two subsystems that can be separately operated with the aim of better approximating the production HPR to the house demand HPR, since most of the thermal losses of SMR can be used.
Configuration C1 has been chosen to validate the developed methodology, by exactly reproducing the results of Ammermann et al. [
29] for a house that consumes electric energy (5200 kWhel/year) and thermal energy (21,438 kWhth/year, demand HPR = 4.12). Comparing the centralized configuration C0 and the distributed generation configuration C1, in the conditions set by Ammermann et al., the primary energy consumption is reduced by 24%. Once the authors’ model has been validated, it can be used to simulate other configurations and explore different conditions.
- C.2.
FC-mCHP fed with hydrogen coming from a centralized steam methane reformer (without heat recovery nor CO2 capture).
In this situation, the user has a system composed only by a fuel cell (
Figure 4), with hydrogen supplied at a given cost to the house location, coming from a centralized steam methane reformer, which has a relatively higher efficiency than the small-scale reformer of C1. The heat demand must be satisfied by operating the FC-mCHP at a higher electric power and/or by means of a natural gas boiler.
- C.3.
FC-mCHP fed with hydrogen from a centralized steam methane reformer with CO2 capture.
This configuration is similar to the previous one, with the difference that the centralized steam methane reformer has a CO
2 capture system which reduces drastically the CO
2 emissions (
Figure 5). This capture, however, worsens the efficiency in producing hydrogen.
- C.4.
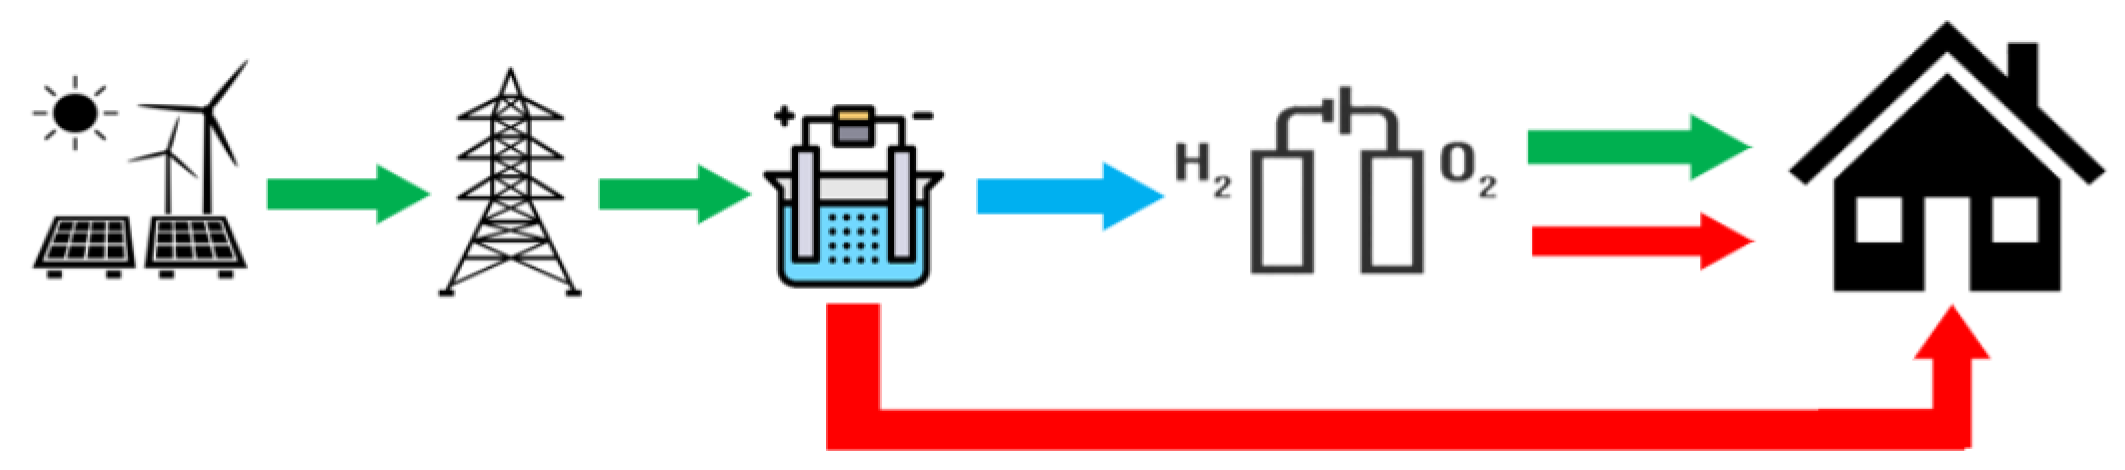
FC-mCHP fed with hydrogen produced by an on-site electrolyser (with heat recovery).
In this case, the configuration is a system based on an on-site electrolyser and an FC-mCHP; so, it is possible to take advantage of the thermal energy loses from the electrolyser to satisfy part of the demand (
Figure 6).
- C.5.
FC-mCHP fed with hydrogen supplied from a centralized electrolyser (without heat recovery).
In this case, the installation is like the previous one, except that the hydrogen is centrally obtained by water electrolysis using electric energy (
Figure 7) and delivered at a given cost.
This configuration could be used to store renewable energy excess, in order to be distributed later as hydrogen. It is worth to highlight the importance of this alternative in the decarbonization of the electricity system, since it can help to transfer the energy generated by an alternative energy source to the time it is needed.
As can be seen in
Table 1, each configuration has a series of characteristics that differentiate it from the rest, making the study of all of the possibilities interesting.
As has been pointed out, it is assumed that in every case the electricity from the conventional electric grid covers the electric demand that is not satisfied by the FC-mCHP. Furthermore, when the mCHP production is higher than the demand, the difference is exported to the electrical grid. This fact contributes to the reduction of primary energy consumption, due to the electricity for other users which is not necessary to generate in the grid. It also represents a source of CO2 saving due to the avoided power generation with the mix of primary energies.
For the thermal demand, the part that is not satisfied by the fuel cell is covered by a natural gas boiler. In case there is an excess in thermal energy production by the fuel cell, this energy is assumed to be lost. It is important to note that the heat-to-power ratio (HPR) of residential application demand is generally higher than one, whereas the HPR of a fuel cell is near the unit.
The values of the input parameters used in the model for each configuration are listed in
Table 2. All figures given are annual average values, with costs representative of the early 2022 situation.
Due to the possible variability of these parameters, a study of the influence of the different parameters on the final results will be carried out in a later stage.
3. FC-mCHP Model Utilization
A procedure has been proposed to analyze the model results obtained by combining diverse values for the electrical and thermal demands and taking into account the number of operating hours for the fuel cell system.
The first step in the analysis of the results is to develop a parametric study of the effect of FC-mCHP configuration parameters: average power and number of annual operating hours, on the model results. A graphical representation of the different results as a function of the operating parameters is considered after the analysis, in order to find trends and optimal operating points.
Initially, this analysis was developed for one value of demand HPR, and after that, it was extended to other demand HPR values, thus obtaining a global view of the modelled process leading to clear and accurate conclusions.
Finally, a study of the different configurations will be carried out by varying the demand conditions and considering the configuration that offers the best results for each demand condition. In this way, it will be possible to analyze which configuration responds better to different demand situations.
The most relevant results are considered in the analysis, including primary energy saving, CO2 emissions saving, thermal energy dissipated to the environment, global CO2 emissions factor, global efficiency, electrical energy restored to net, operative savings, total savings, yearly rentability and payback. For the sake of brevity, the present paper describes only results relative to primary energy, CO2 emissions and costs, always relative to the reference, conventional configuration C0.
The results of FC-mCHP performance are obtained as a function of the number of operation hours and the average fuel cell electrical power, for specified electrical and thermal demands. The fuel cell electrical power takes values of 0, 0.25, 0.5, 0.75, 1, 1.25, 1.5, 1.75, 2, 2.5, 3 and 4 kW, while the number of operating hours takes values of 0, 2920, 4380, 5840, 7300, 8760 h/year.
Results are calculated considering a reference electrical demand of 4380 kWh per year and a thermal demand corresponding to HPR values of 0, 1, 2, 3, 6 and 9. The electric demand would represent an equivalent average electric power demand of 0.5 kWel for 8760 h/year. The average thermal power demands can be calculated by multiplying the electric power by the values of HPR. This allows one to carry out a sensitivity analysis with a large number of configuration parameters.
To illustrate the type of obtained results, configuration C5 is chosen.
Table 3,
Table 4 and
Table 5 present the results relative to primary energy savings, CO
2 emissions savings and operative cost savings results for configuration C5. These results have been generated by combining the FC electric power (columns) and the number of annual operating hours (rows), with the objective of fulfilling the electric demand and the thermal demand associated with a demand HPR of 3. Positive values are written with the font in black and negative values in red. The cell shade color change from green (for favorable results) to red (for disadvantageous results) is there to help to interpret the trends. Therefore, the best operating conditions of each main result can be easily evaluated.
Primary energy consumption, CO
2 emissions and costs must be jointly considered to properly evaluate the goodness of a configuration. However, from the simultaneous observation of
Table 3,
Table 4 and
Table 5, it can be deduced that the three results cannot be simultaneously optimized, and other considerations must be introduced.
In the case of configuration C5, for an HPR demand of 3, no primary energy savings occur for any fuel cell power. In addition, since no cost savings occur, increasing the average electrical power of the fuel cell and the number of operating hours of FC-mCHP worsens the primary energy savings. Moreover, since renewable electric energy is used to produce hydrogen, the higher the FC electric power and the number of operating hours, the higher the CO2 emissions savings. In this situation, there are no operational savings; so, with primary energy savings, increasing the average power of the fuel cell and the number of operating hours increases the operational losses.
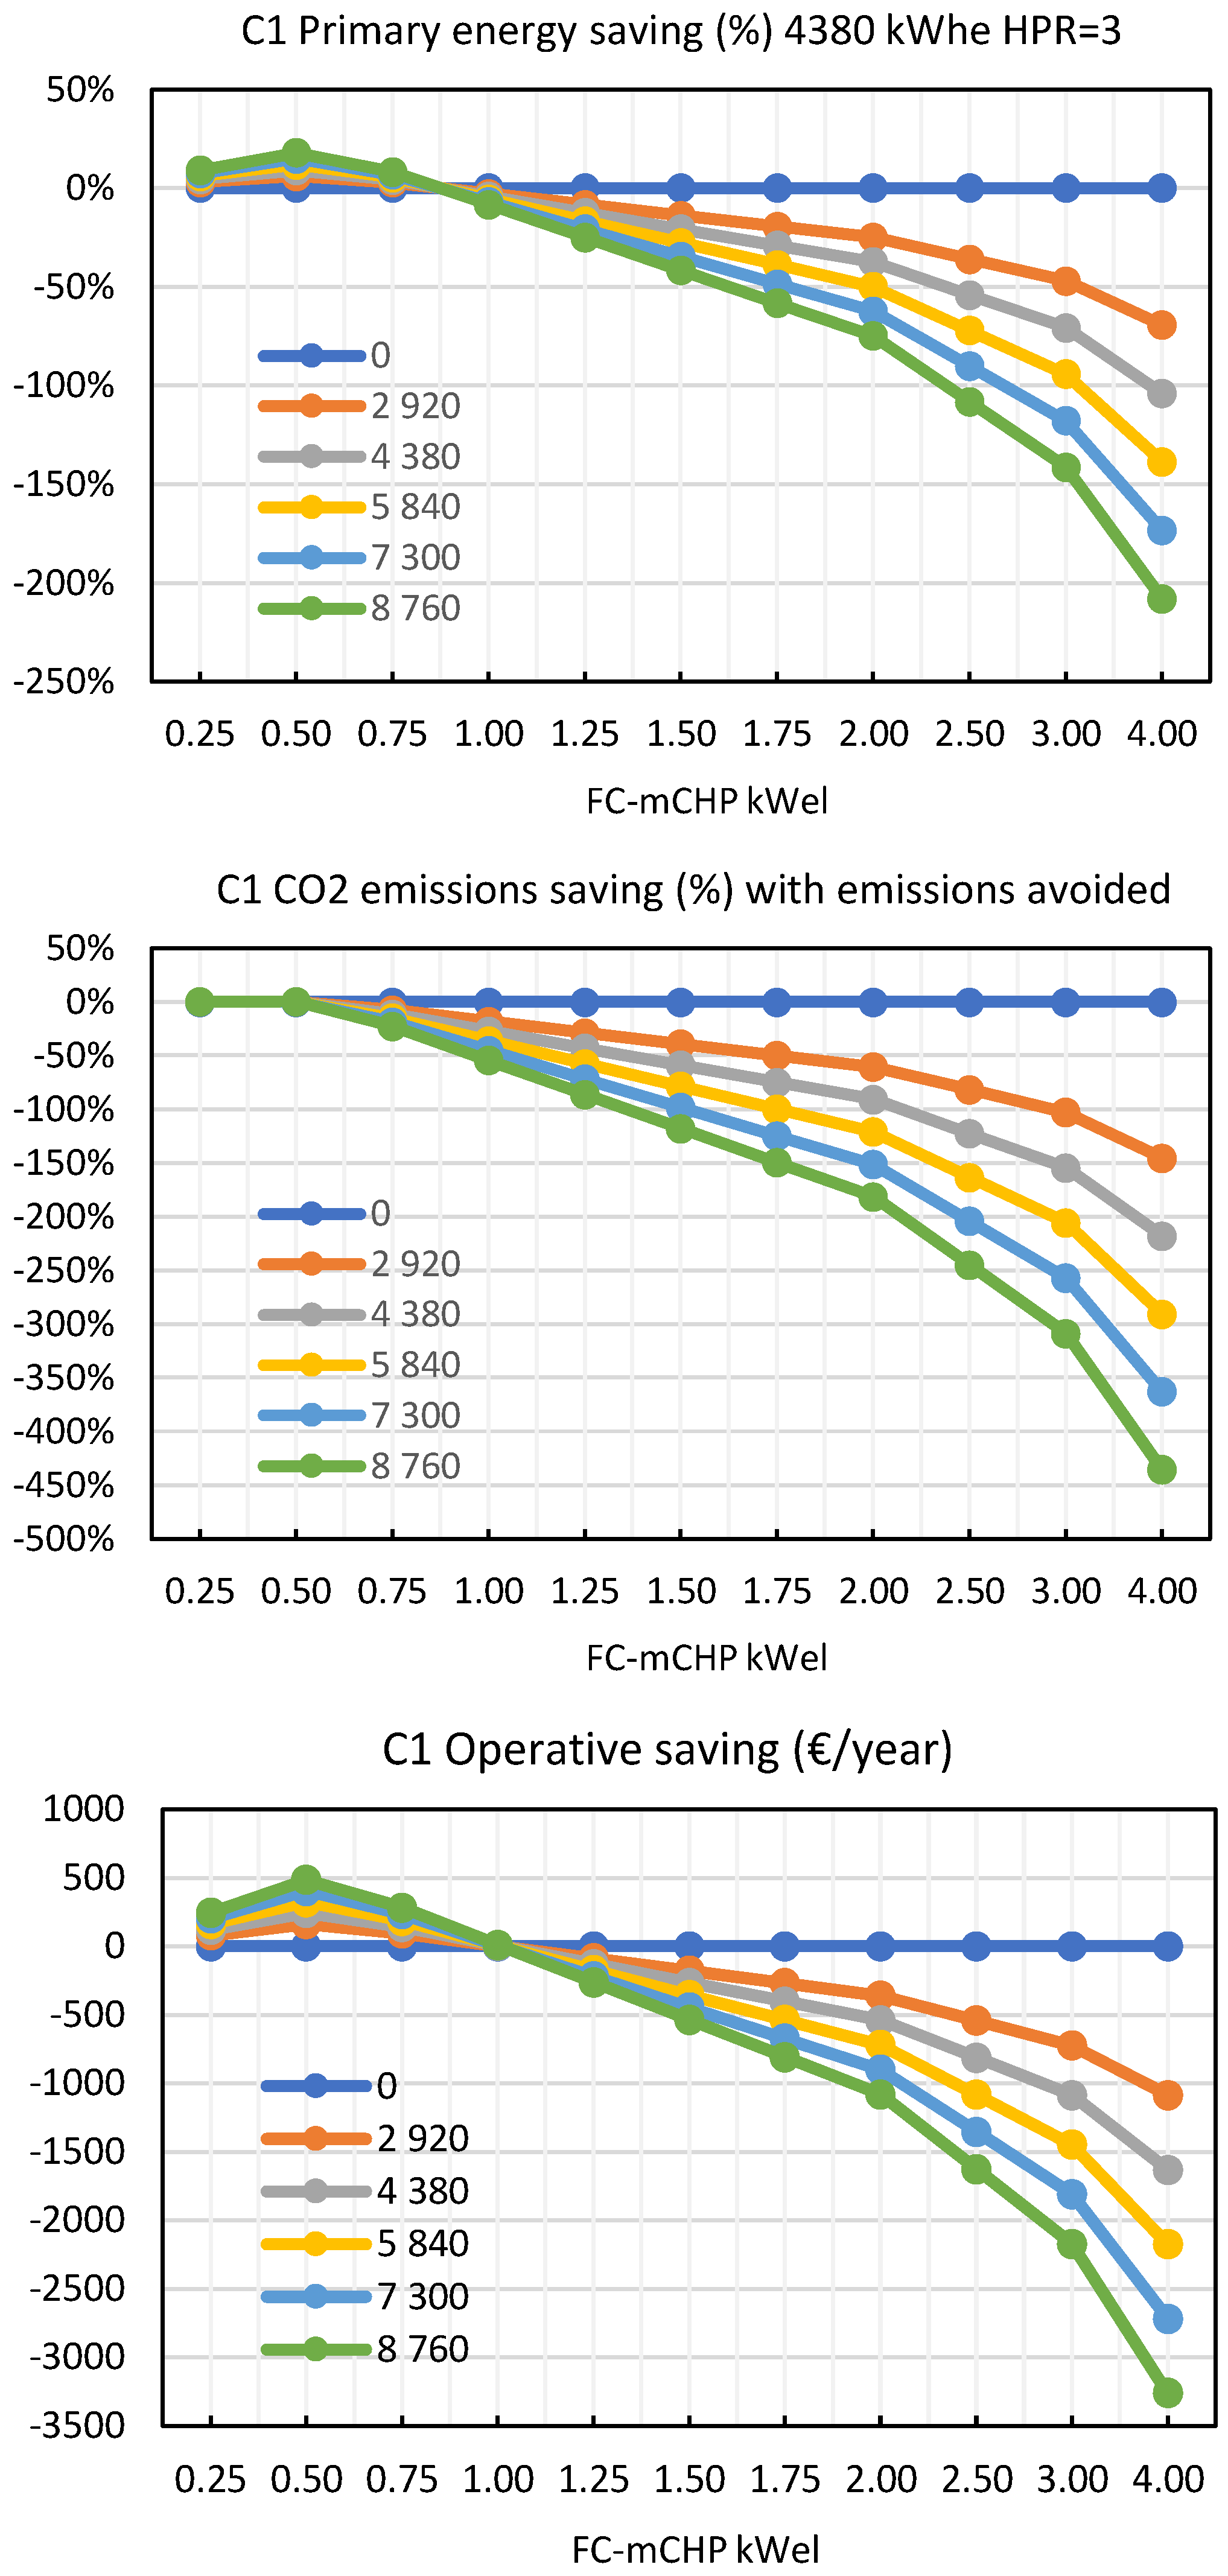
Results can be presented in an alternative way to facilitate their analysis in the form of plots for each relevant result (primary energy, CO
2 emissions, and costs) as a function of FC-mCHP electric power and using the number of annual operation hours as a parameter. Each set of these three plots is for a given demand HPR, as in the example shown in
Figure 8, in this case for configuration C1. Results have been generated by modifying the operating number of hours for the fuel cell, always considering the same annual electrical demand, and modifying the thermal demand, using for that HPR values of 0, 0.5, 1, 1.5, 2, 2.5, 3, 4.5, 6, 9 and 15, with the aim of being able to develop an exhaustive analysis of the HPR influence on the system performance.
A first combined analysis of the three plots in
Figure 8 indicates that in configuration C1, it is possible to have primary energy savings and operative cost savings, if the FC-mCHP electric power is less than 1 kWel, in spite of the fact that no CO
2 emissions savings are achieved. The positive savings are enhanced by increasing the number of annual operating hours. The two positive maxima roughly coincide with the average electric power needed to satisfy the electric demand during all hours of the year (0.5 kW).
In this scenario, the HPR value of the demand is 3 and the FC-mCHP only provides an HPR value of 1.26. This suggests that the FC-mCHP should operate at higher electrical power to produce accordingly higher thermal power. In this case, the excess of electrical power can be exported to the grid, receiving income from its sale and potentially contributing to reduce primary energy and CO2 emissions. However, the results indicate that in C1 operation, electrical power greater than 1 kW provides worse results than the conventional configuration (C0). The results are even worse if the number of annual operating hours increases. This is due to the fact that the thermal energy demand cannot be satisfied by the FC-mCHP when it operates below an electrical power of 1.19 kW (value calculated considering the average thermal power and the HPR of the FC of 1.26); in this case, the thermal energy shortfall must be provided by the natural gas boiler, whose primary energy consumption, CO2 emissions and associated operating cost are included in the model calculations. This gives an idea of the importance of proper sizing of the FC-mCHP through a combined evaluation of their performance.
This preliminary analysis, based on the observation of the best operating condition of a particular configuration once a demand HPR is given, can be generalized by considering the absolute maxima for all values of electric power and demand HPR of each configuration C1–C5, as presented in the following paragraph.
4. Discussion
4.1. Configuration Ranking Based on the Main Results
To evaluate the relative performance of configurations C1–C5 in terms of primary energy savings, CO2 emissions and operative cost, for each configuration, the best operating point has been chosen when varying the demand HPR.
Whereas the previous analysis allowed comparing different results based on generation and operating conditions (electric power and operation hours), this analysis allows comparing results on the demand side.
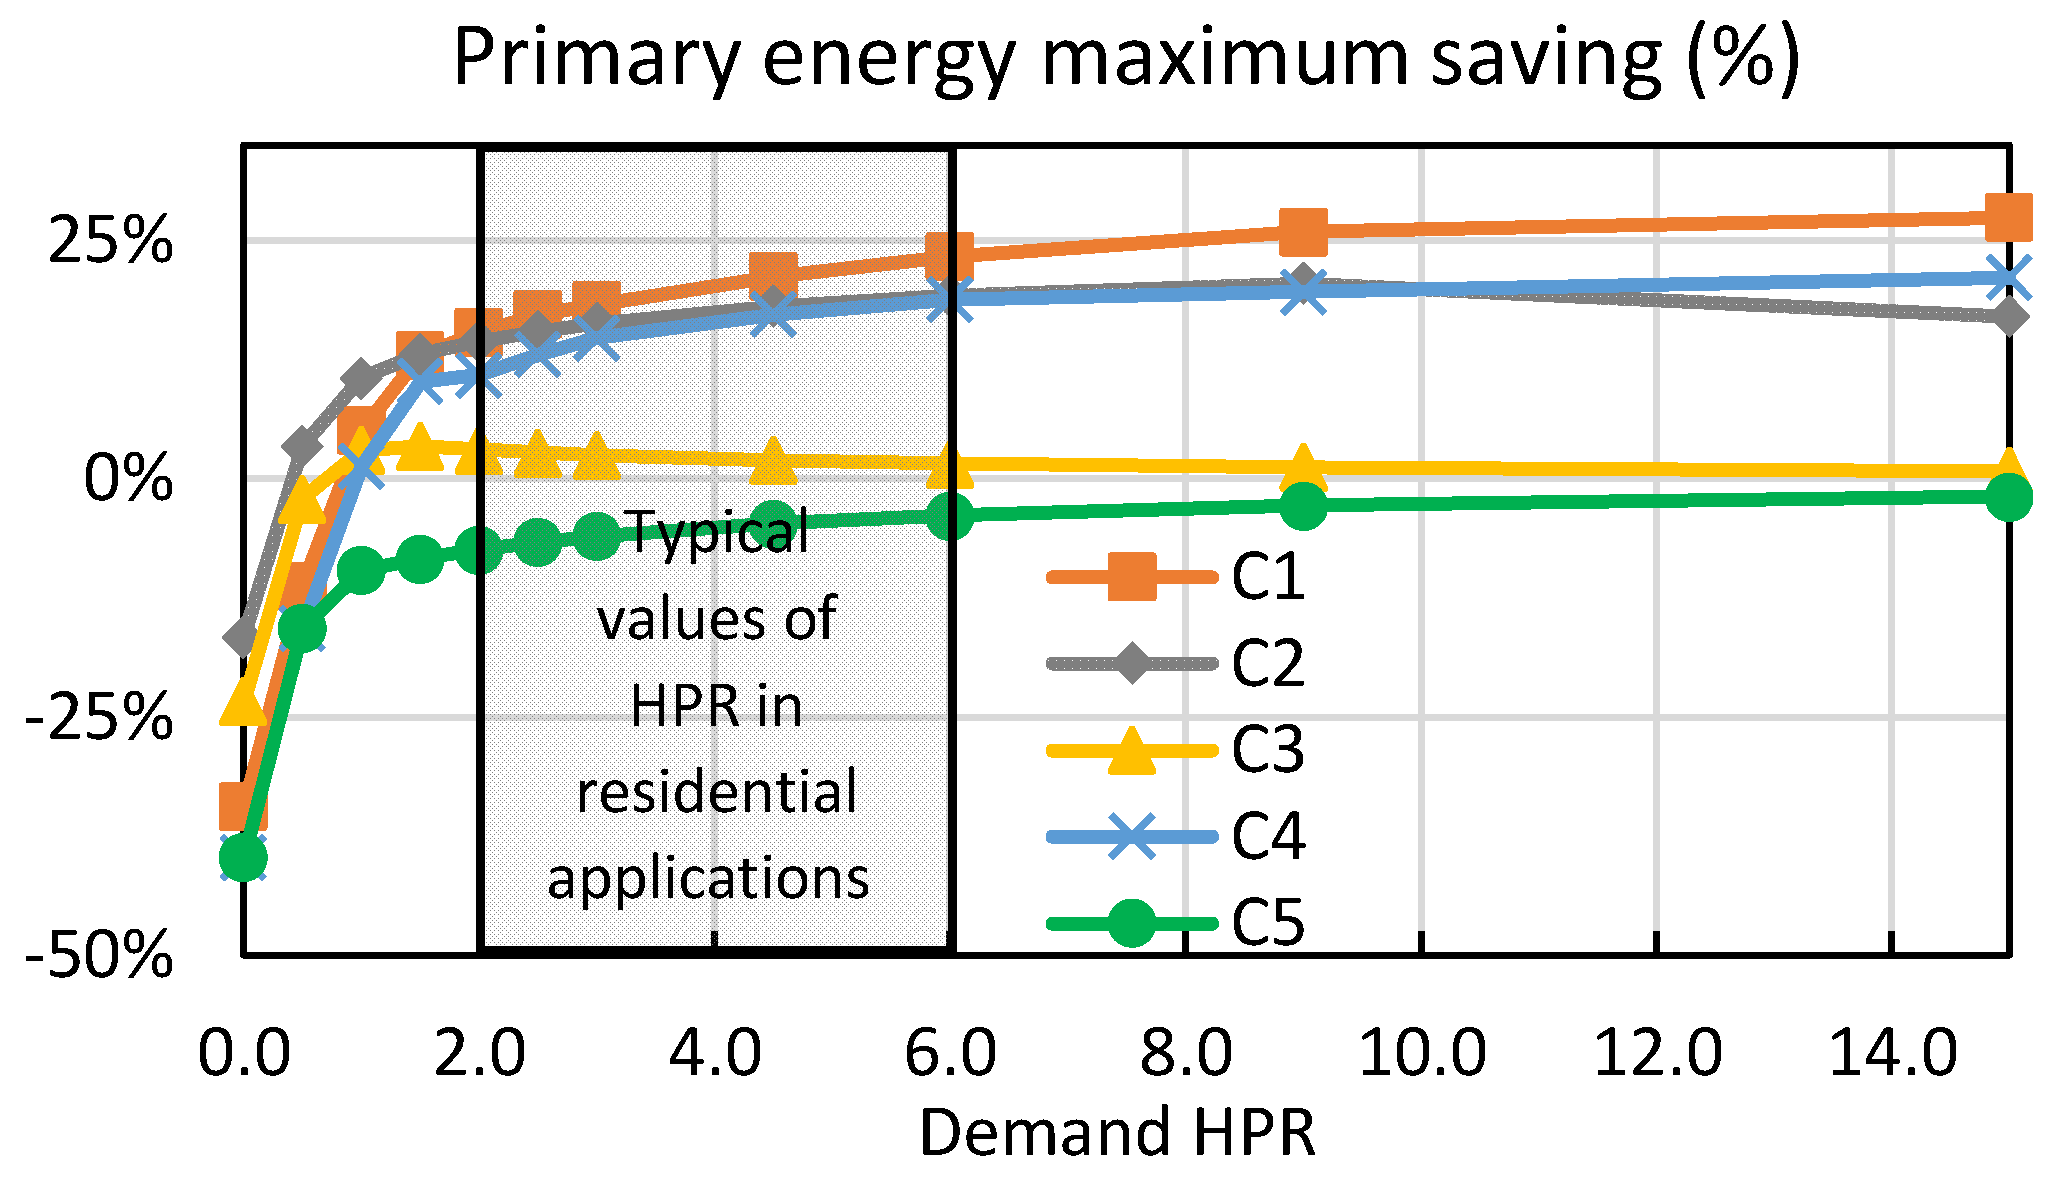
Figure 9 presents the maximum primary energy saved by each configuration C1–C5 for each demand HPR. The number of operating hours of the system has been set at 8760 h per year and the range of fuel cell power has been allowed to move between 0.25 kW and 4 kW to compare the performance of the different configurations.
From this analysis, a detailed configuration ranking can be established for each main result in the range of interest of demand HPR (2 to 6). As can be seen in
Figure 9, the ranking based on primary energy savings is
This ranking can be expressed in words by saying that configurations that have a high hydrogen-production efficiency (by steam methane reforming, C2) or heat recovery in hydrogen production (C4), or a combination of both (C1) have the best primary energy behavior.
This configuration ranking is for HPR demand in domestic applications (2–6), while there are some changes for very low values of HPR. Moreover, when there is no thermal demand (i.e., HPR = 0), no FC-mCHP configuration is able to generate primary energy savings, as the electric overall efficiency of the hydrogen chain (production plus utilization) is lower than the generation efficiency of the conventional electricity system. The configurations that use residual heat from on-site hydrogen generation (C1 and C4) perform best for high values of HPR on demand. The C5 configuration always fails to generate primary energy savings. This strong conclusion has to be qualified by saying that the electric energy used for the hydrogen production by electrolysis is 100% renewable, as opposed to the use of non-renewable energy to generate electricity in the conventional system. In all cases, the thermal energy default must be satisfied by using natural gas in the on-site boiler.
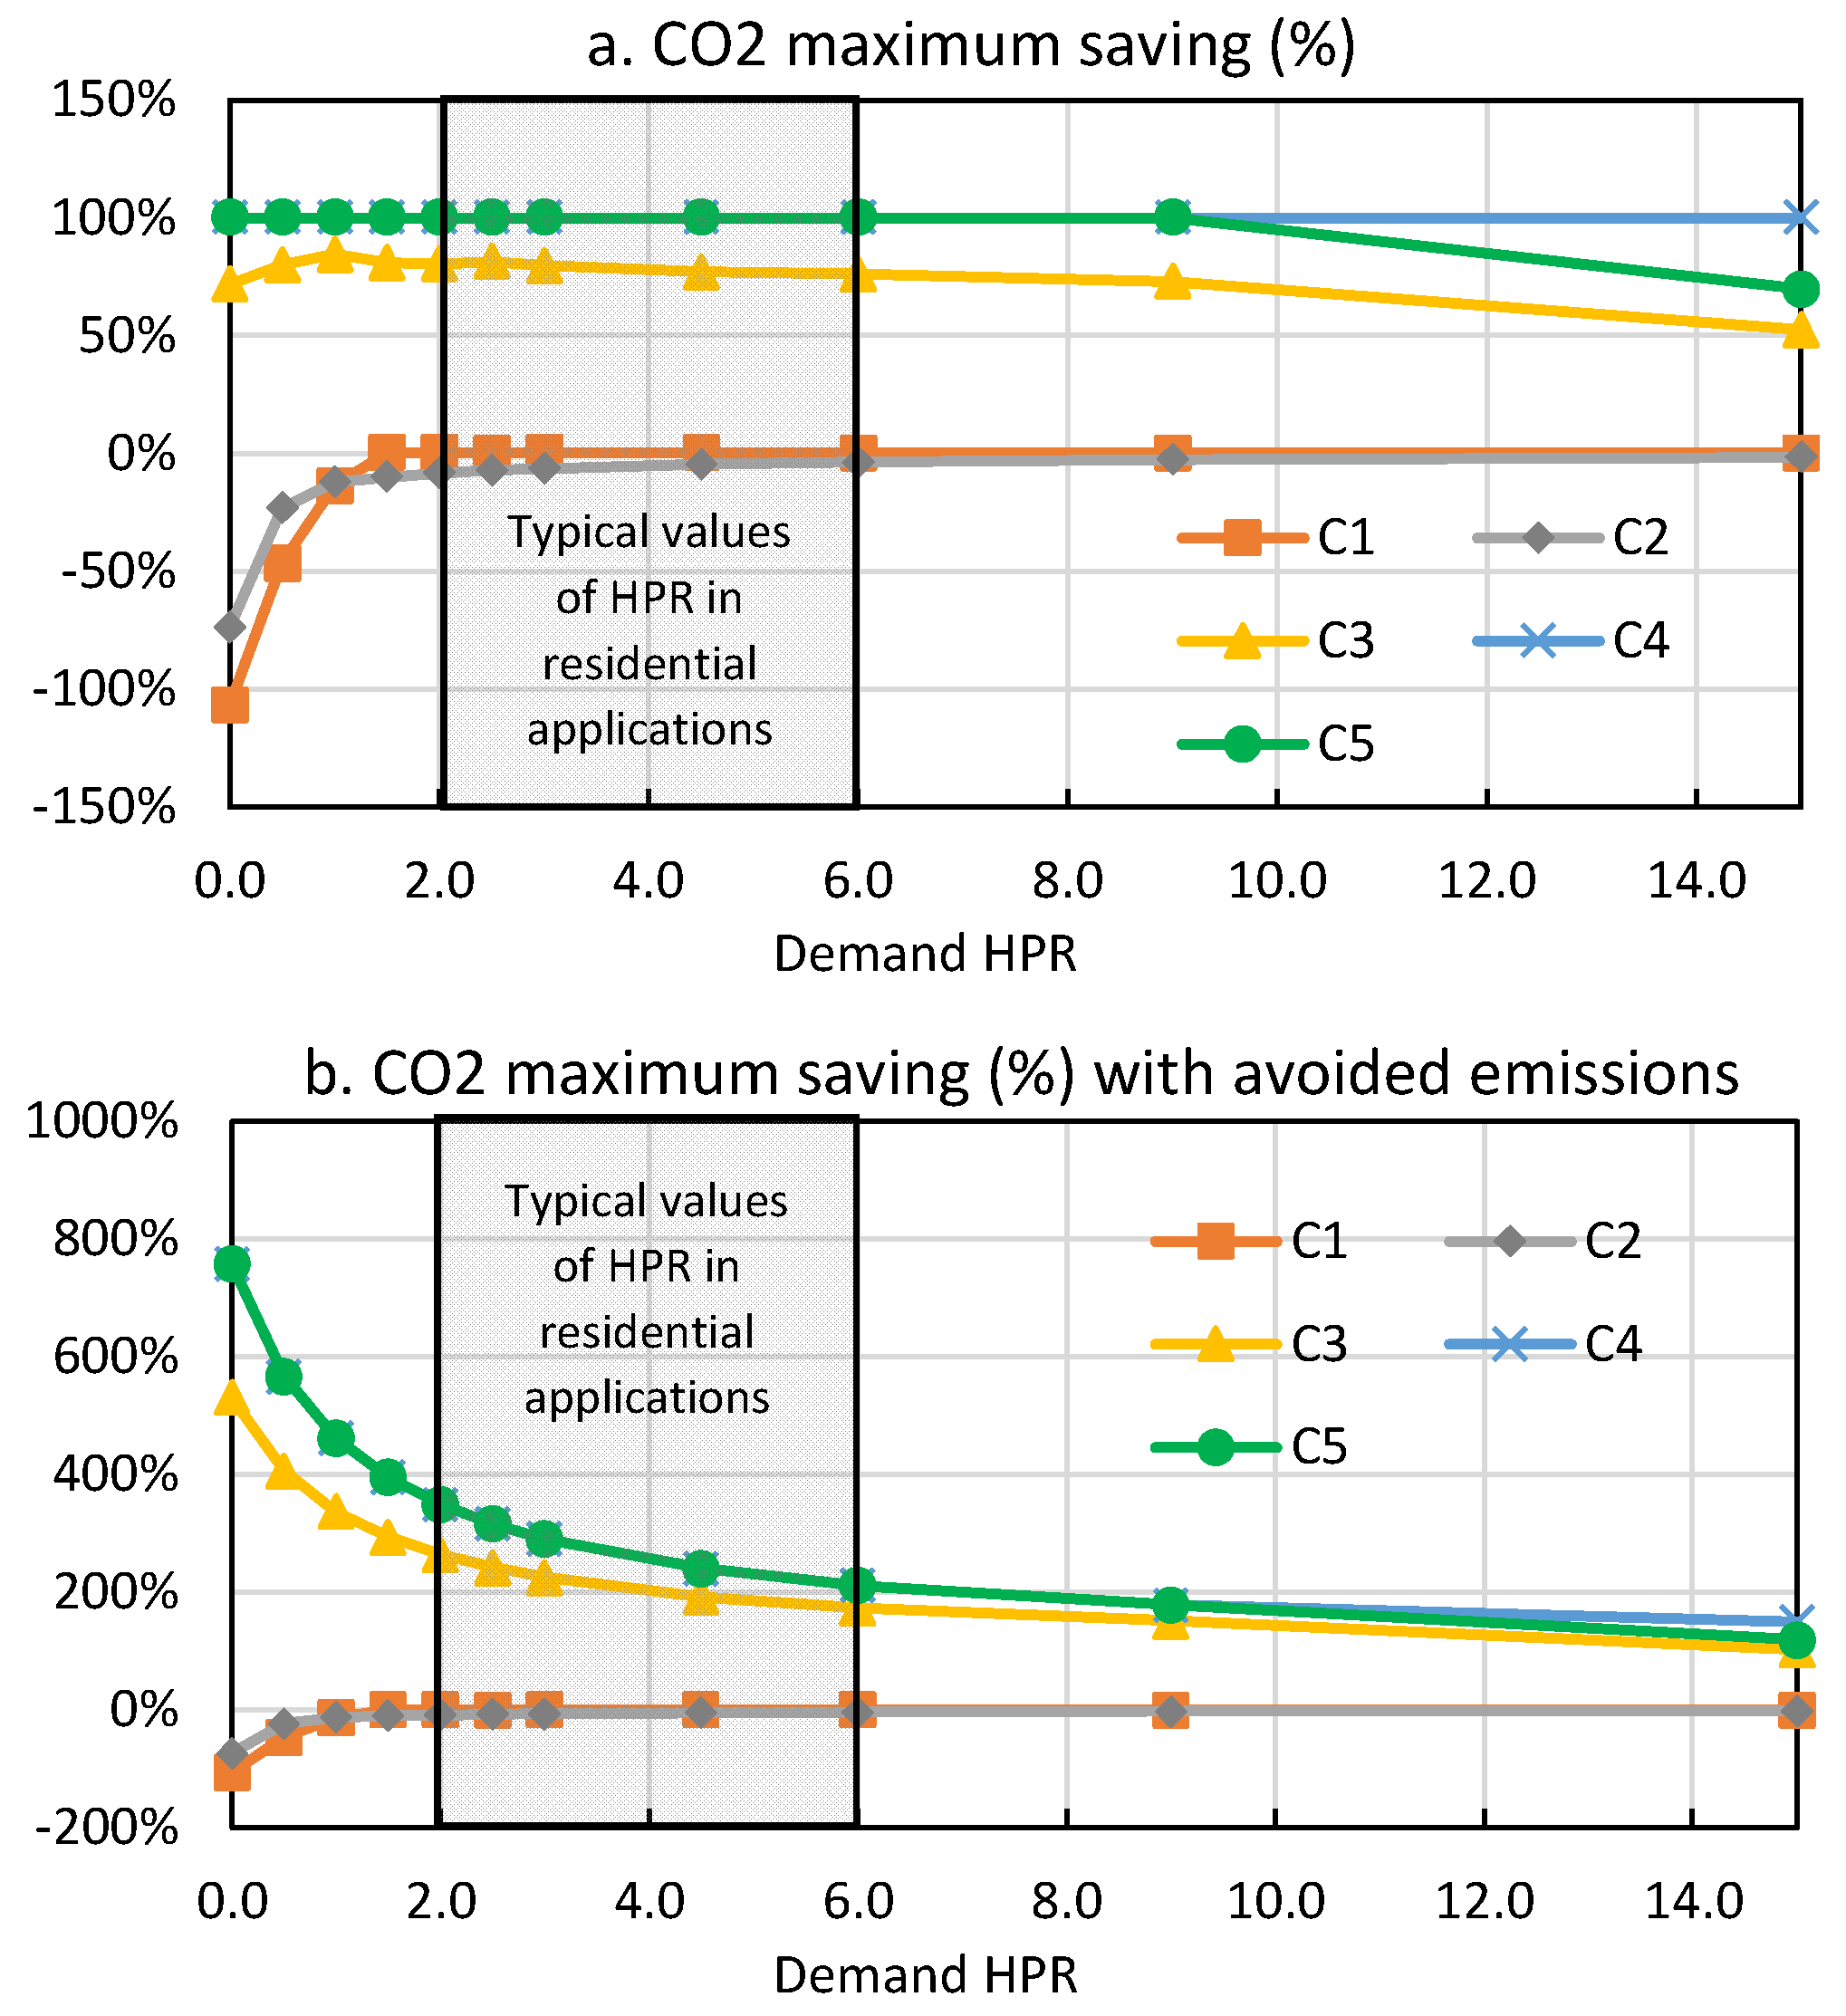
The same analysis can be carried out for CO
2 emissions (
Figure 10), so that the following classification can be clearly drawn:
Configurations based on hydrogen production by electrolysis (C4 and C5) or by a combination of steam methane reforming and CO2 capture (C3) are better in terms of CO2 emissions than conventional systems (C0).
This ranking of configurations holds the same if the CO
2 reduction is computed accounting or not for the avoided emissions due to the electric energy exported to the grid. In the case in which CO
2 emissions due to the electric energy returned to the grid are not taken into account (
Figure 10a), the maximum CO
2 emissions savings is 100% and occurs when the hydrogen comes from renewable energy sources (C4 and C5). The savings for configurations using natural gas for hydrogen generation (C1 and C2) are similar (nearly zero). Configuration C3 presents a lower efficiency in hydrogen production, but includes CO
2 capture and sequestration, which explains the good CO
2 saving behavior, but at a lower level than the C4 and C5 configurations.
When energy is fed into the grid, it is possible to generate very high savings in CO
2 emissions with C4 and C5 (
Figure 10b) because if the hydrogen has been obtained from renewable energy sources, the system becomes a producer of renewable energy for the grid. It can also be observed that an increase in the demand HPR leads to a decrease in CO
2 emissions savings. However, it is also observed that for low-demand HPR values, configurations C1 and C2 have negative CO
2 emission saving, due to the use of natural gas for hydrogen production. For higher values of demand HPR, configurations C1 and C2 are neutral in terms of CO
2 savings. Configuration C3 behaves in an analogous way to configurations C4 and C5, but with lower CO
2 savings as the CO
2 capture is not complete (typically a capture efficiency of 90%).
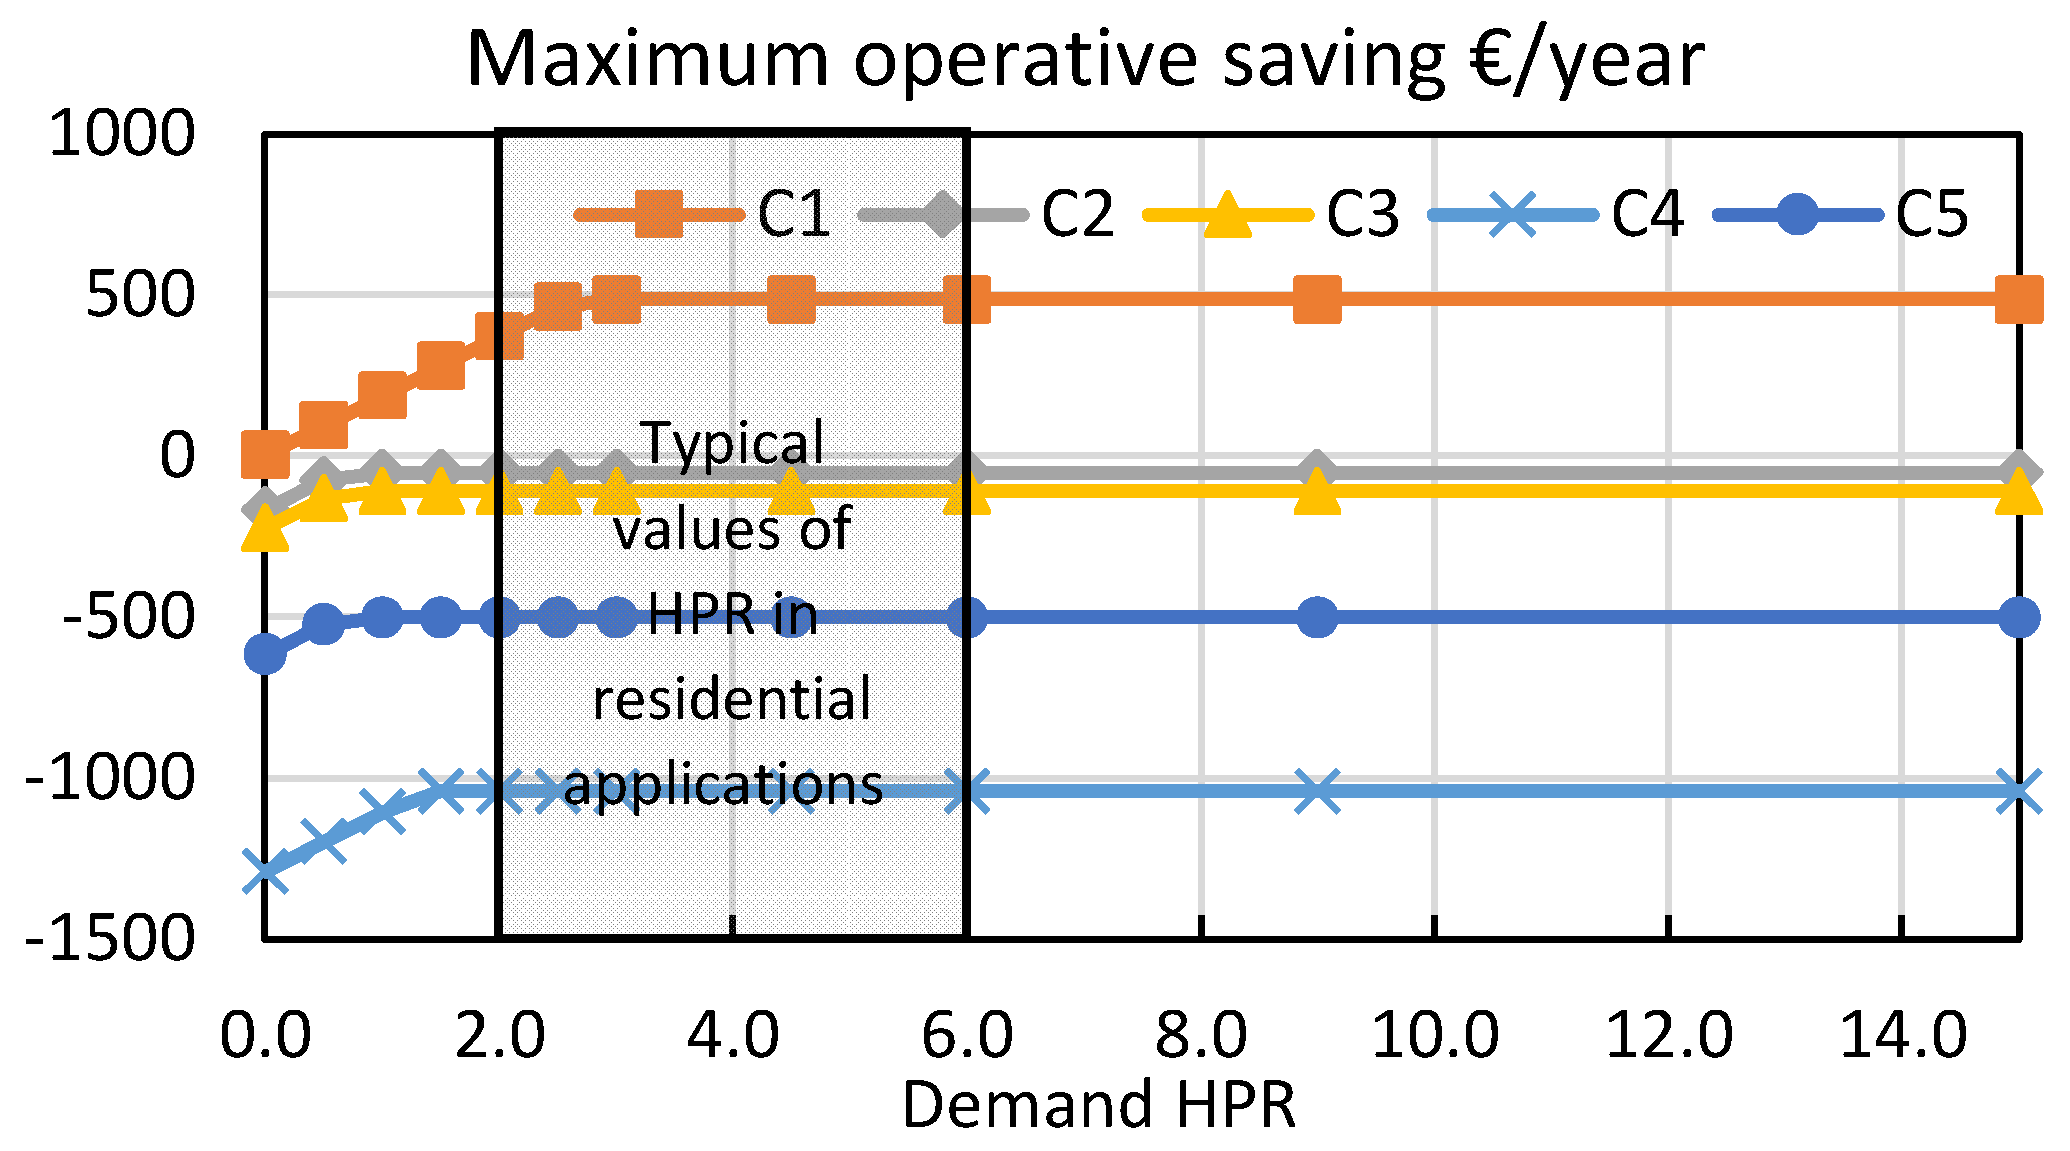
The comparative analysis has been extended to operative cost (
Figure 11), as it is understood that once the technology is operationally cost-effective (OPEX), work can begin on reducing capital expenditure (CAPEX) costs. The result is the following ranking:
This ranking is a consequence of the costs assumed for the inputs for hydrogen production: natural gas (C1, C2, C3) and renewable electricity (C4, C5), and the associated production efficiencies (
Table 2).
In
Figure 11, it can be seen that configuration C4 behaves economically the worst because the purchase cost of renewable electricity turns into a high (internal) hydrogen cost (about 10 EUR /kg H
2). Configuration C5 is a better alternative, although, at the assumed cost of renewable hydrogen (6 EUR /kg H
2), it is not cost-competitive. The cost of hydrogen that makes configuration C5 economically neutral at the operative level is 3 EUR/kg H
2 (with an average electric power of 0.5 kW, operating 8760 h per year). Configurations C2 and C3 are nearly competitive. Finally, configuration C1 results in operative savings for the assumed input values.
4.2. Sensitivity Analysis of the Results
The study developed in the present work demonstrates that the electrical and thermal efficiencies of the fuel cell are key for the performance results. For this reason, it is necessary to develop a study to quantify the sensitivity of the results to those efficiencies and also to other FC-mCHP operating parameters.
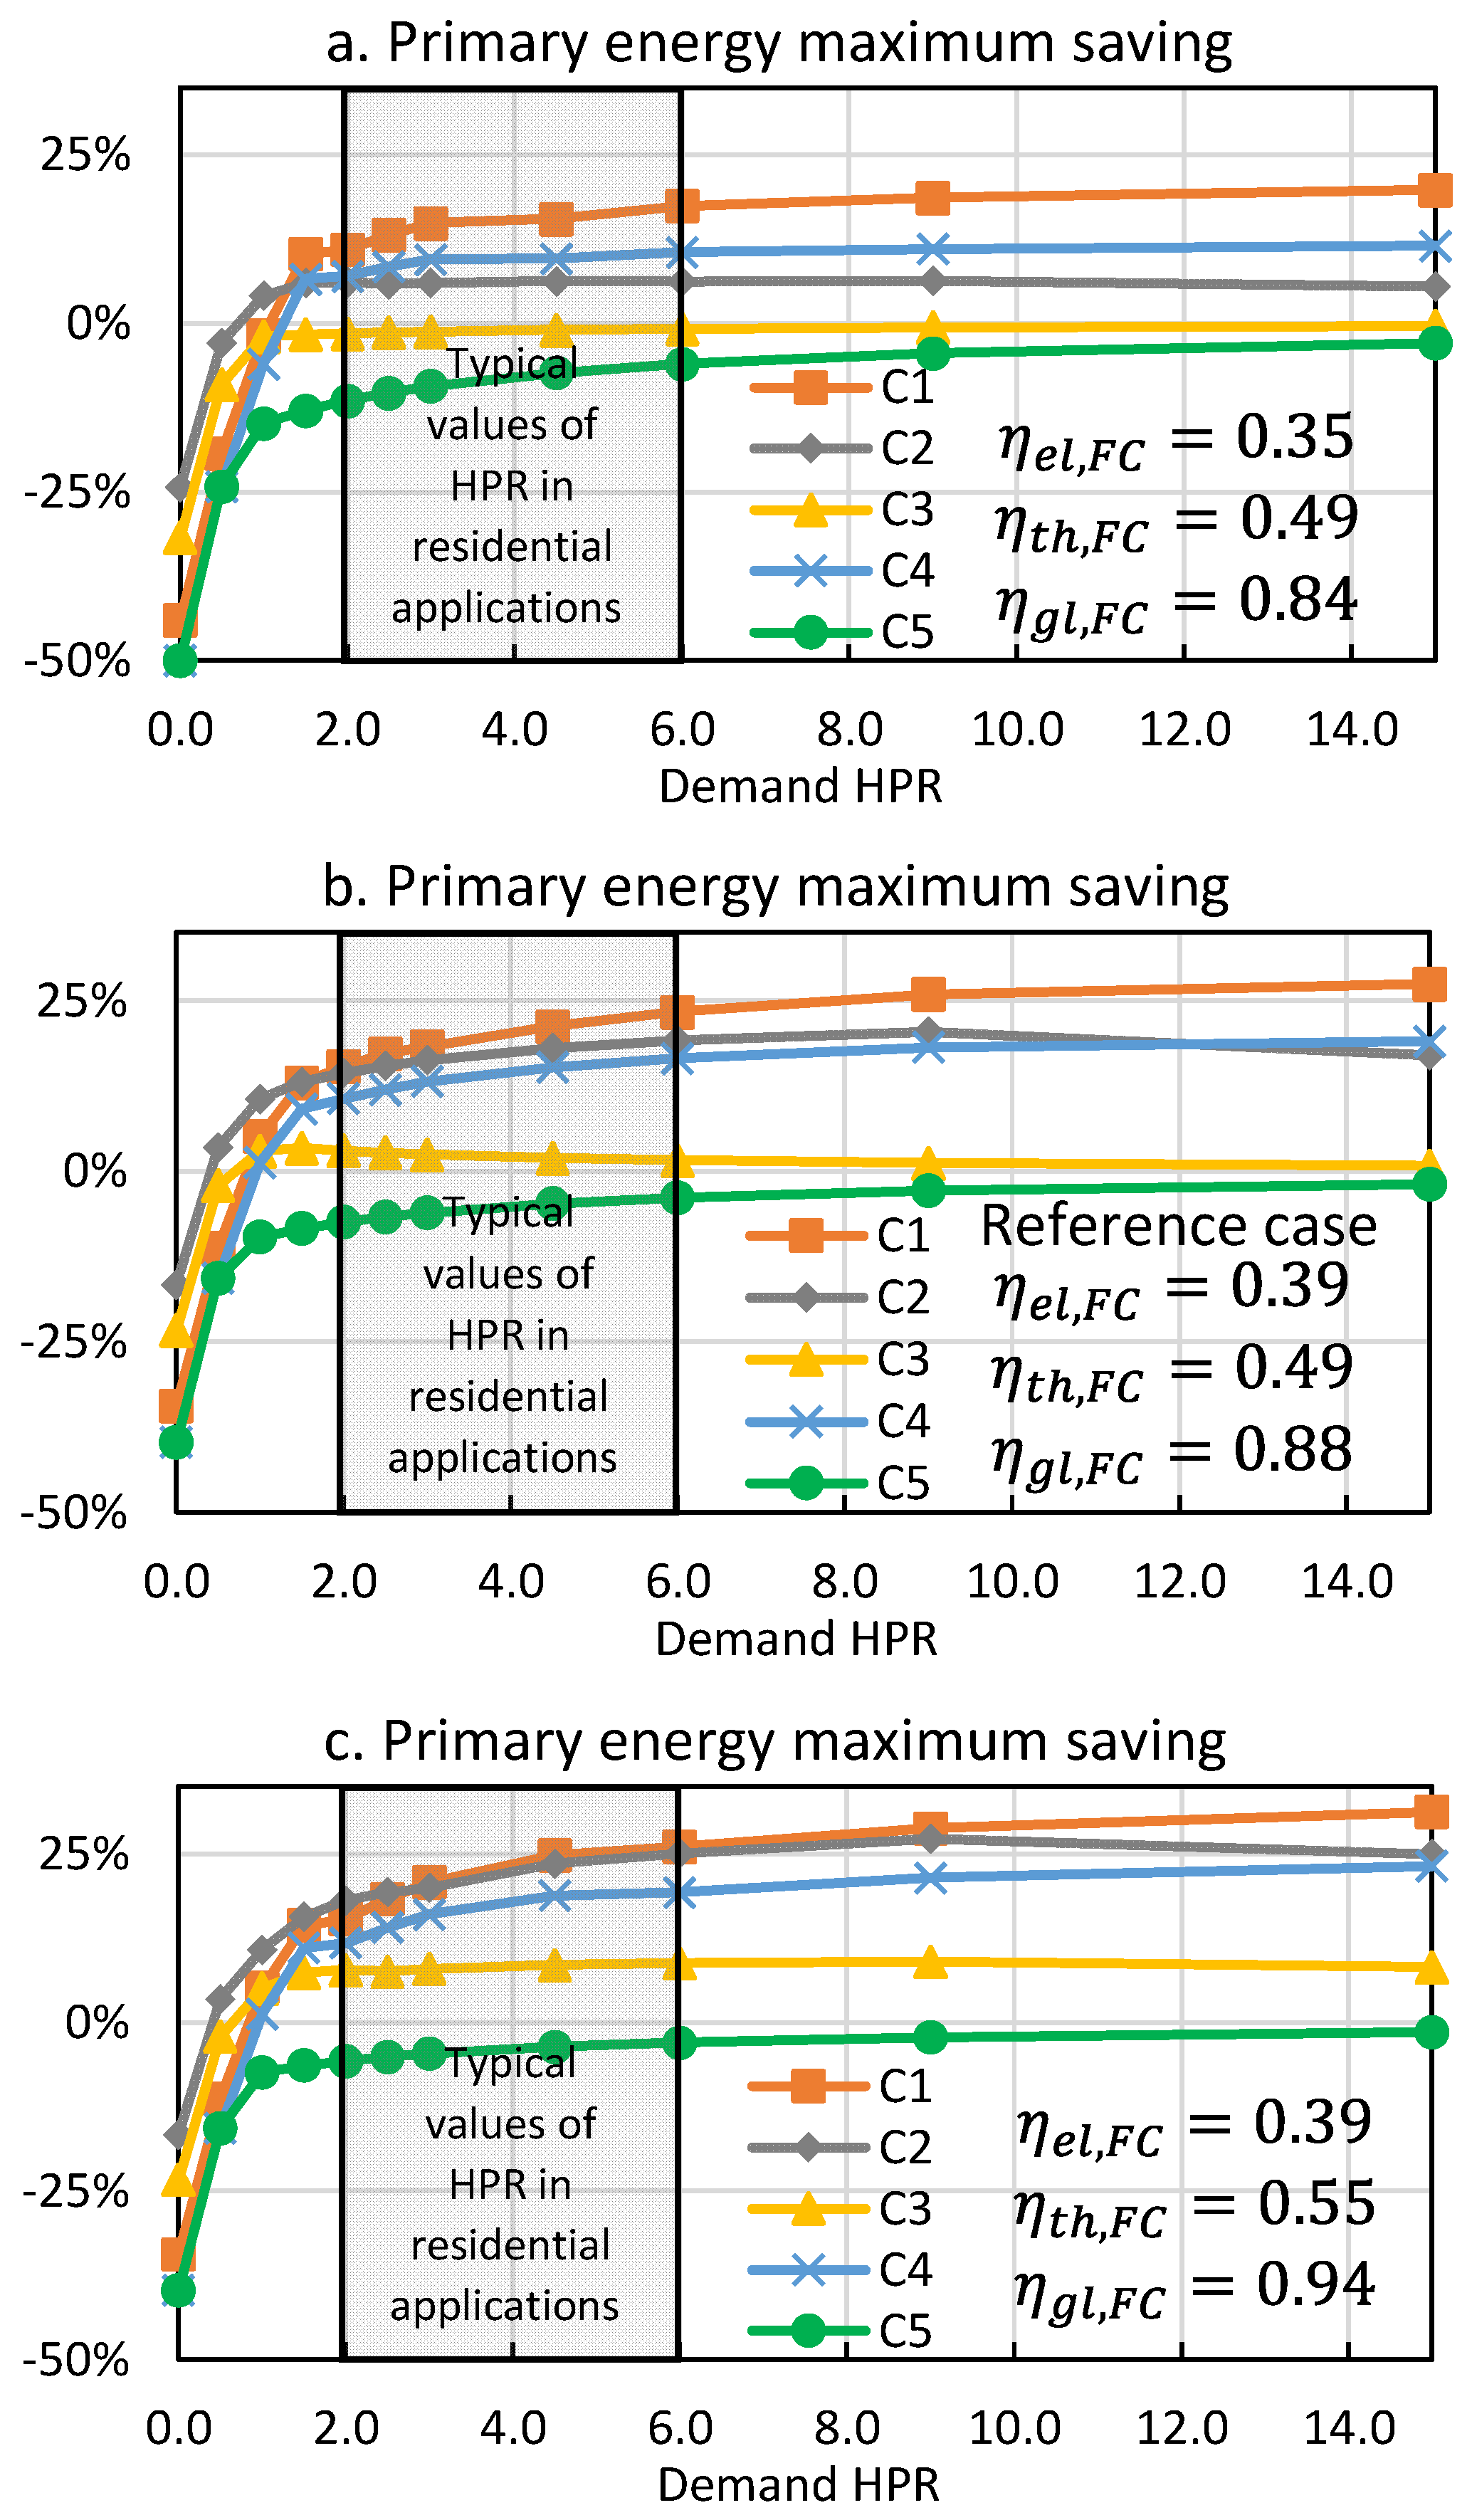
Figure 12 includes three sets of plots:
Figure 12b, middle, with the results calculated for the reference values of efficiencies;
Figure 12a, above, with results calculated with a slight reduction of electrical efficiency, while keeping the thermal efficiency; and
Figure 12c, below, calculated assuming a slight increase in thermal efficiency, while keeping electrical efficiency.
By comparing the plots in
Figure 12a with the corresponding plots in
Figure 12b (reference values), it can be seen that a slight reduction in electrical efficiency (from 0.39 to 0.35, while keeping thermal efficiency at 0.49) leads to relevant changes in maximum primary energy savings. This change mainly affects configurations C1 and C2, and also C4. It must be recalled that these maximum savings are peak values, i.e., the best of all conditions. On the other hand, an improvement of the thermal efficiency (from 0.49 in part 12c to 0.55 in part 12c, keeping electrical efficiency) of the FC-mCHP leads to an improvement in maximum primary energy savings of all configurations, although this has little relevance for C5).
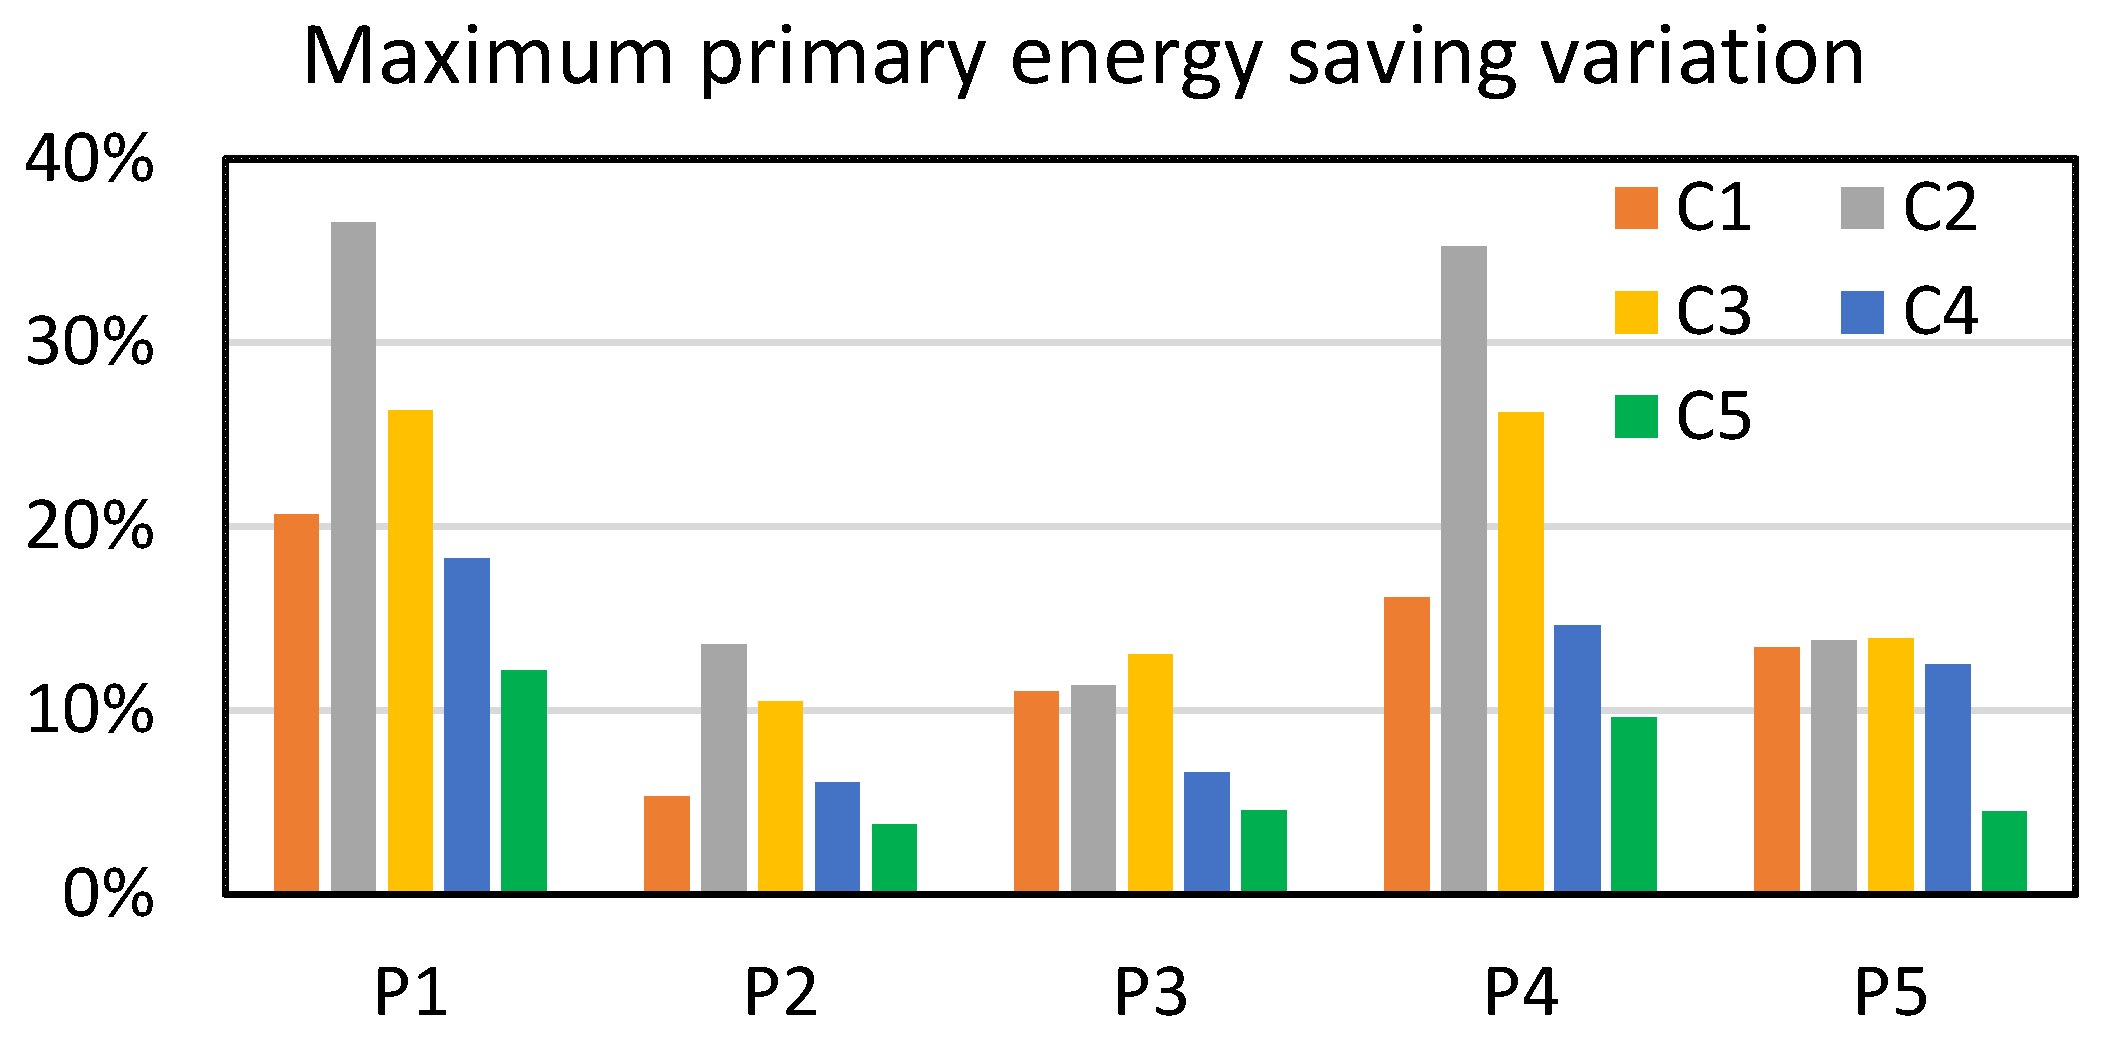
A more complete sensitivity analysis of the influence of the configuration parameters is conducted by modifying the parameter values (
Table 6) in a range of ±20% of the values of
Table 2 and seeing how this modification affects the different final results studied.
Figure 13 shows the variation of the maximum primary energy savings as a function of the variation of configuration parameters P1–P5. The variation of each output result is calculated as its maximum value minus its minimum value, in % points.
It can be seen in
Figure 13 that the highest variation is experienced by configuration C2. Configurations C1 and C3 are the next most affected by parameter variation. Configurations C4 and C5 are the least affected by the variation of the inputs. The most influential parameters on the primary energy savings are the FC-mCHP electrical efficiency (P1) and the conventional system energy production efficiency (P4). Other relevant parameters (not shown) are the hydrogen production efficiencies relevant to each configuration (P6, P8, P9, P10, P12, and P13).
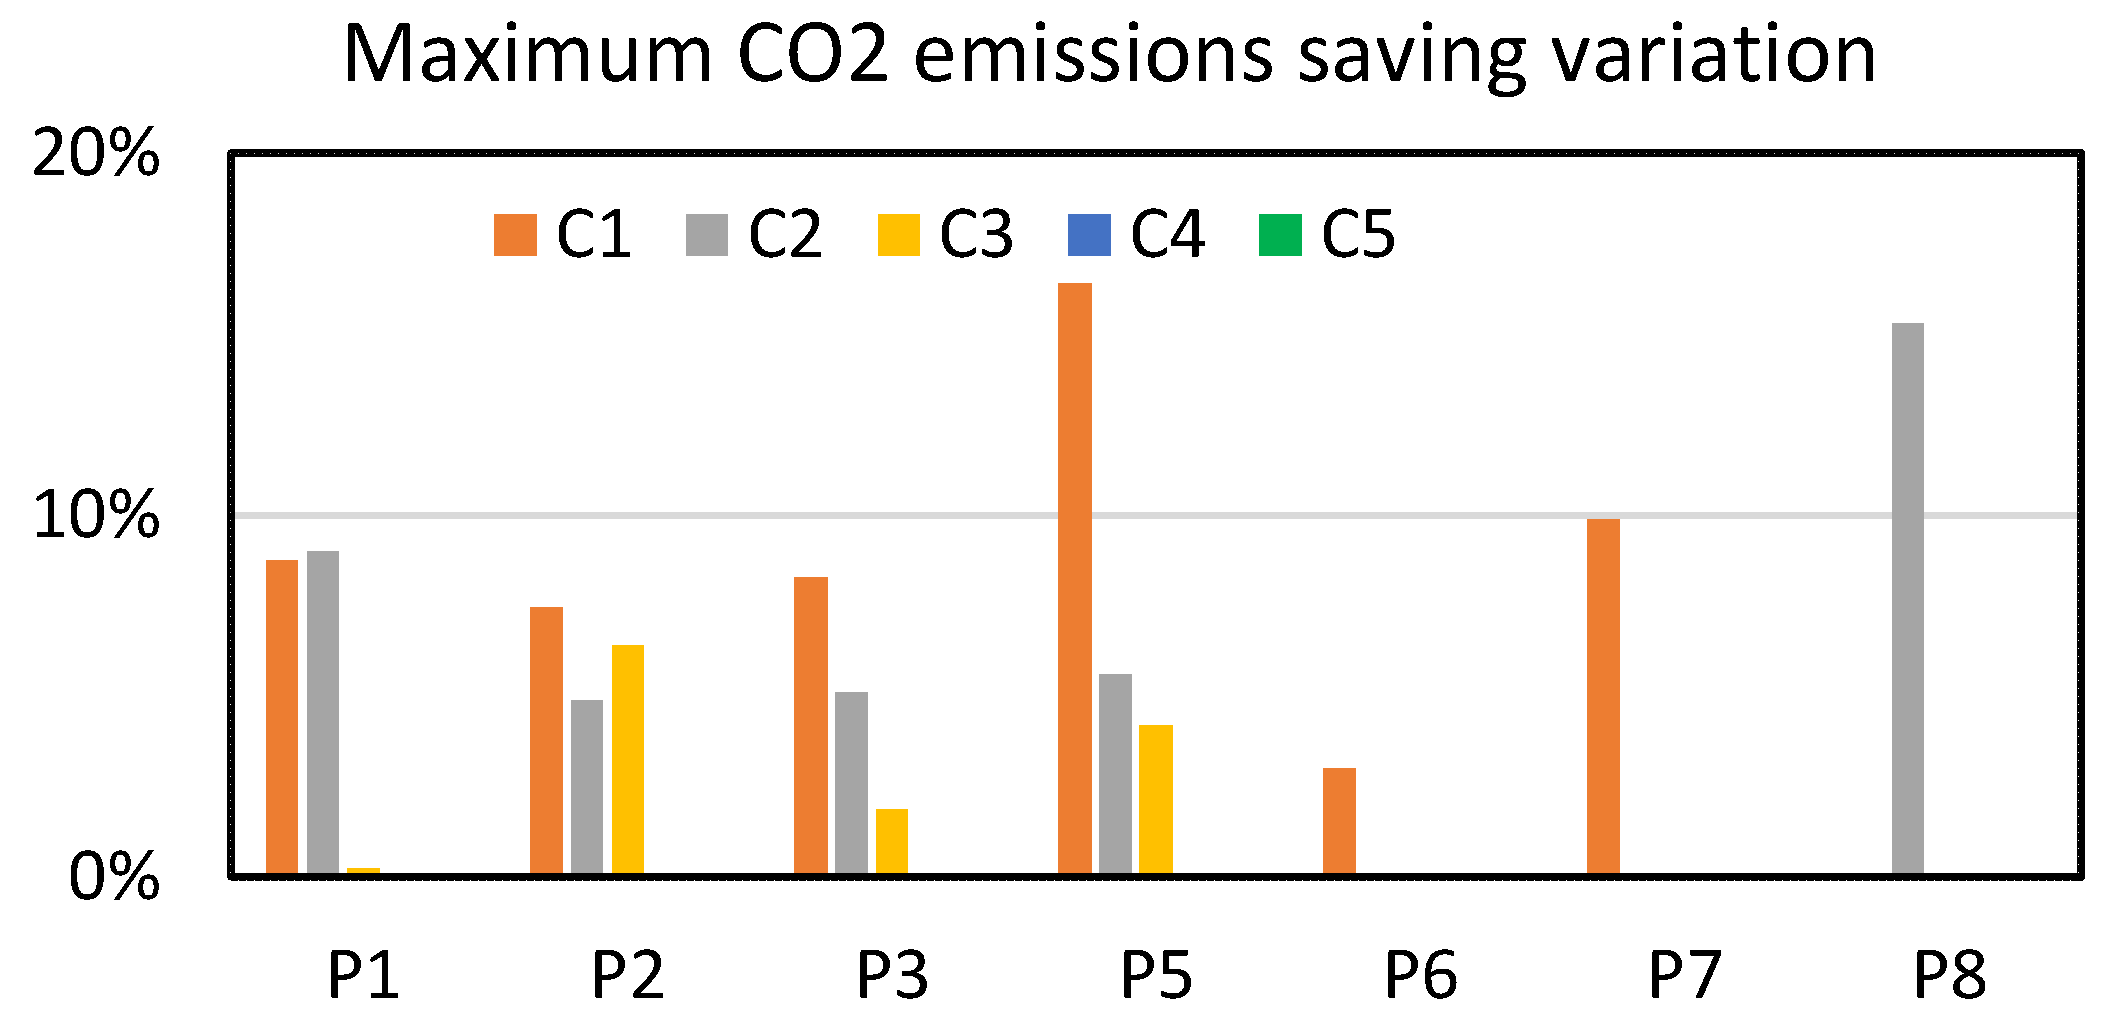
Results of the impact of the configuration parameters on CO
2 emission savings are presented in
Figure 14. Only configurations C1, C2 and C3 show variations due to the variations in the input parameters (P1–P8). For configurations C4 and C5, as long as the demand is met, 100% of the CO
2 emissions are saved, and then the results are not affected by the variation of these parameters.
Since configuration C1 only produces CO2 emission reductions due to primary energy savings, the variation of this result for this configuration is very similar to the variation of the primary energy savings. In this configuration, the thermal energy efficiency of the conventional system (P7) is of particular importance. The same happens for configuration C2 with respect to the efficiency of hydrogen production (P8). For configuration C3, since there is already a high saving of CO2 emissions, the variations of the result are not so high.
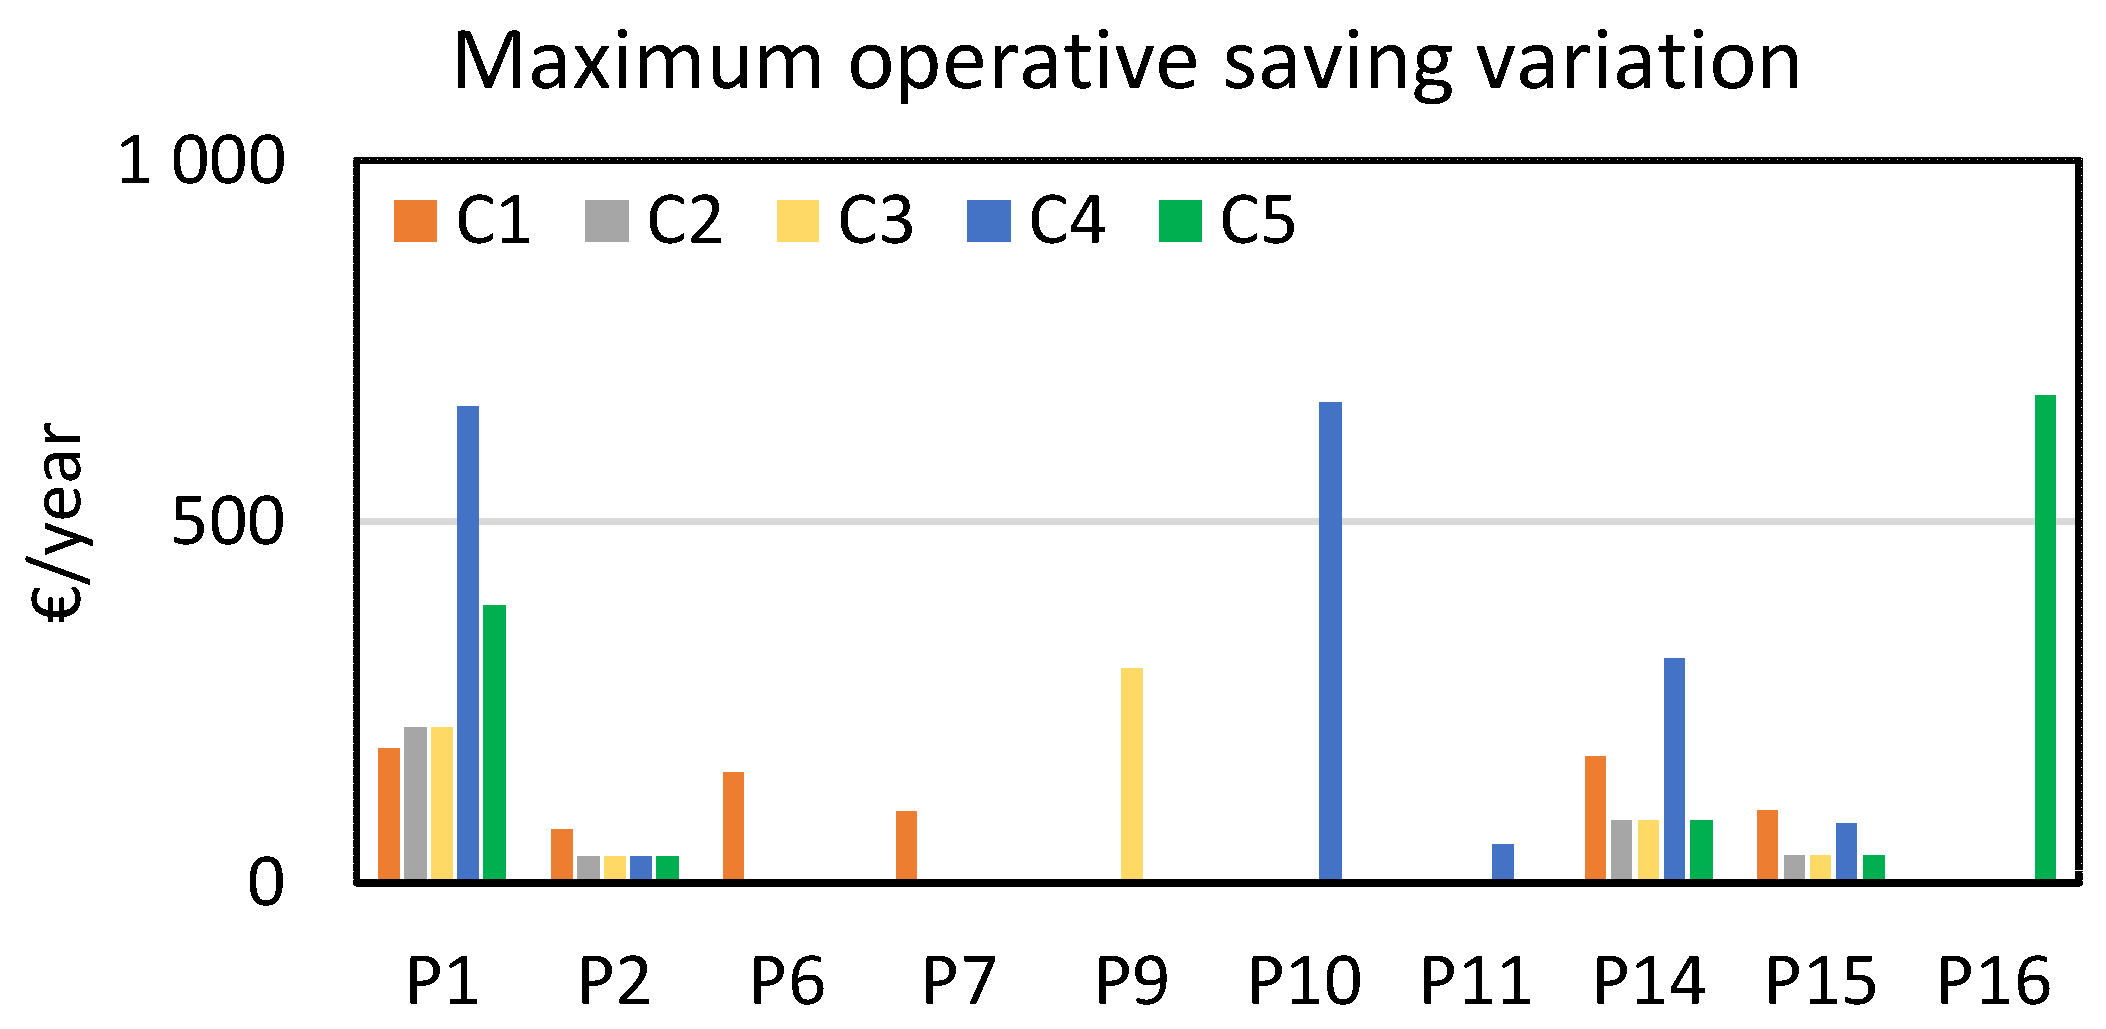
The results of maximum operative savings variation are shown in
Figure 15, limited to the most influential parameters. In general, the variations are higher in configurations C4 and C5, being the most relevant the FC-mCHP electrical efficiency (P1), the hydrogen production efficiency (P10) and green hydrogen purchase cost (P16). Configurations C1, C2 and C3 show much smaller variations of operative costs.
5. Conclusions
Five configurations for a fuel cell micro-combined heat and power (FC-mCHP) system have been analyzed in this work, whose performance has been compared with a reference conventional configuration. Configurations C1, C2 and C3 consider hydrogen obtained by steam methane reforming (C1 on site, C2 centralized, C3 centralized + CCS). Configurations C4 and C5 consider hydrogen production by electrolysis from renewable electricity (C4 on site, C5 centralized). Configurations C1 and C4 (both on site) allow recovering heat from the hydrogen-production process.
An algebraic model that considers values of electric efficiency and thermal energy efficiency is used to evaluate the fuel cell mCHP. The overall efficiency is a constant value lower than the unit, which considers losses due to heat that cannot be utilized in the residential application. The main advantage of this algebraic model is the possibility of considering multiple configurations and performing parametric studies rapidly.
For each configuration, ten results are obtained in dependence of the fuel cell configuration parameters and the operating conditions (mainly heat-to-power ratio and number of hours per year): primary energy, CO2 emissions, thermal energy not used, global CO2 emissions factor, global efficiency, electric energy exported to grid, operative cost, total economic cost, internal rate of return, and payback time. The values of each result of each configuration are compared with those obtained with the reference configuration, defining the possible savings (positive, favorable; negative, disadvantageous).
The conclusions obtained from the model simulations are based on the analysis of three main results: primary energy consumption, CO2 emissions and operative costs. In general terms, the different configurations can be classified according to their performance in each of the main results:
Maximum primary energy savings: C1 >≈ C2 >≈ C4 >> C3 >> C5 (≈0).
CO2 emissions savings: C4 ≈ C5 > C3 >> C1 ≈ C2 (≈0).
Maximum operative saving: C1 > C2 ≈ C3 > C5 >> C4.
This means that, in general, configurations that use hydrogen produced from natural gas (C1, C2, C3) are more effective in primary energy savings than configurations with hydrogen production from electricity (C4, C5).
Configurations C1 and C2, with hydrogen production from steam methane reforming, and C4, with hydrogen production by on-site electrolysis, achieve primary energy savings of the order of 20% in the range of typical HPR for a residential demand. In contrast, configuration C5, with hydrogen production by centralized electrolysis, results in a loss of about 5% primary energy consumption. However, assuming that this hydrogen production electricity is 100% renewable, then there are savings in CO2 emissions of configurations C4 and C5 that can make a counterpart of the worse primary energy consumption.
In each configuration, the ideal operating conditions would be achieved when both the electric and thermal demand of the residential place are fulfilled by the FC-mCHP. However, in general, this never happens due to the difference between the heat-to-power ratios (HPR) of the residential use (usually between 2 and 6) and of FC-mCHP generation (of the order of 1.3). In the configurations in which there is heat recovery from hydrogen production (C1 and C4), the heat-to-power ratio of production increases, but it is still in general smaller than that of a typical residential demand.
In terms of operative costs, configurations which use natural gas for hydrogen production (C1, C2, and C3) save money compared to conventional configuration C0, in the economic scenario of early 2022. Configurations which use hydrogen produced from electricity are less competitive, for the costs of electricity (C4, on site) and hydrogen (C5, centralized) assumed in the reference scenario. However, a cost of electricity that would reduce hydrogen cost down to 3 EUR /kg H2 would make operative costs of configuration C5 similar to that of the conventional system.
The sensitivity analysis shows that the improvement in the electrical efficiency of the fuel cell, the reduction in the cost of hydrogen and the improvement in the hydrogen production efficiency are parameters that have a decisive influence on the global performance of the FC-mCHP in all configurations.
In a future work, hydrogen boilers could be included as another possible configuration since they are a promising technology for decarbonizing home heating. In this case, hydrogen should be obtained with no CO2 emissions, considering that electricity can be obtained from renewable sources or from a conventional origin with carbon capture.


